Embed Size (px)
Citation preview

MINISTRY OF HEALTH/GHANA HEALTH SERVICE
Revised May 2011
In line with Global Immunization Vision and Strategies
IMMUNIZATION PROGRAMME
COMPREHENSIVE MULTI-YEAR
PLAN
(2010-2014)

2
TABLE OF CONTENT
TABLE OF CONTENT ........................................................................................................................... 1
LIST OF TABLES .................................................................................................................................. 3
TABLE OF FIGURES ............................................................................................................................. 4
EXECUTIVE SUMMARY ....................................................................................................................... 5
ACRONYMS & ABBREVIATIONS .......................................................................................................... 7
1 CHAPTER 1 – COUNTRY INFORMATION ........................................................................................ 8
1.1 General Profile and Demography ................................................................................................... 8
1.2 Administrative Profile and Governance ......................................................................................... 9
1.3 Macroeconomics of Ghana .......................................................................................................... 10
1.4 Health Status ................................................................................................................................ 11
1.5 The status of CHPS implementation and the way forward .......................................................... 12
1.6 EPI in Ghana .................................................................................................................................. 14
2 CHAPTER 2 - SITUATION ANALYSIS ............................................................................................. 17
2.1 Baseline Data 2010 – 2015 ........................................................................................................... 17
2.2 Current issues and challenges of EPI ............................................................................................ 17
2.3 Performance analysis of EPI ......................................................................................................... 19
2.4 Polio Eradication Initiatives .......................................................................................................... 20
2.5 Advocacy....................................................................................................................................... 21
2.6 Communication ............................................................................................................................ 21
2.7 Surveillance .................................................................................................................................. 22
2.8 Introduction of new vaccines into EPI .......................................................................................... 22
2.8.1 Reasons for introducing the selected vaccines in routine EPI ..................................................... 23
2.8.2 Meningitis A Conjugate Vaccine for Campaign ............................................................................ 24
2.8.3 Vaccine financing and management ............................................................................................ 25
2.8.4 Post introduction evaluation ........................................................................................................ 26
2.8.5 Surveillance .................................................................................................................................. 26
2.9 Vaccines and Logistics .................................................................................................................. 26
2.10 Cold Chain Requirement............................................................................................................... 27
2.10.1 Cold Chain Capacity at National Level .......................................................................................... 27
2.10.2 Cold Chain Capacity at Regional Level .......................................................................................... 29
2.10.3 Dry storage ................................................................................................................................... 31
2.11 Strengths and Weaknesses of the EPI System ............................................................................. 32
3 CHAPTER 3: GOALS, OBJECTIVES, KEY ACTIVITIES, INDICATORS AND MILESTONES ...................... 37
3.1 Introduction .................................................................................................................................. 37
3.2 Goals, Objectives and strategic components of the cMYP........................................................... 37
3.2.1 Goals of the cMYP ........................................................................................................................ 37
3.2.2 Objectives of the cMYP ................................................................................................................ 38
3.2.3 Strategies of the cMYP ................................................................................................................. 38
3.2.4 Causes of problems in the Immunization Programme ................................................................. 40
3.3 Immunization system in relation to programme objectives, regional and global goals .............. 41
3.4 Strategies, Key Activities and Timeline (By System Components) ............................................... 45

3
4 CHAPTER 4: COSTING, FINANCING AND FINANCING GAPS .......................................................... 54
4.1 Costing .......................................................................................................................................... 54
4.2 Macroeconomic Analysis .............................................................................................................. 54
4.3 Total Immunization Cost .............................................................................................................. 54
4.4 Routine Immunization .................................................................................................................. 55
4.5 Supplemental Immunization ........................................................................................................ 55
Cost by Strategy .......................................................................................................................................... 56
4.6 Financing and Financial Sustainability Strategies ......................................................................... 56
4.7 Resource Requirement & Financing Gaps ....................................... Error! Bookmark not defined.
5 CHAPTER 5 - MONITORING & EVALUATION ................................................................................ 59
5.1 Indicators for monitoring the cMYP ............................................................................................. 59
5.1.1 Macroeconomic Indicators ........................................................................................................... 59
5.2 Financial Indicators ....................................................................................................................... 60
5.3 Programme Indicators .................................................................................................................. 60
5.4 Surveillance System ...................................................................................................................... 60
LIST OF TABLES
Table 1: Health Status Indicators 2002-2010 .............................................................................................. 12
Table 2: New Immunization Schedule in Ghana ......................................................................................... 15
Table 3: Population Baseline Data .............................................................................................................. 17
Table 4: Situation analysis of the EPI system in Ghana, 2001 - 2008 ......................................................... 19
Table 5: Summary of All SNIDS and NIDS Conducted in Ghana .................................................................. 20
Table 6: Baseline Data 2010 – 2015 ............................................................................................................ 26
Table 7: Annual Vaccine Requirement 2010 – 2015 ................................................................................... 26
Table 8: Annual requirement for devices ................................................................................................... 26
Table 9: Cold chain capacity and cost for positive storage ......................................................................... 27
Table 10: Cold chain capacity needs assessment for positive storage ....................................................... 28
Table 11: Cold Chain capacity and cost for negative .................................................................................. 28
Table 12: cold chain capacity need assessment for negative storage ........................................................ 29
Table 13: Cold chain capacity and cost for Positive Storage at Regional level ........................................... 29
Table 14: Cold chain needs assessment for negative storage at Regional level ......................................... 30
Table 15: Additional cold chain equipment required ................................................................................. 30
Table 16: Strengths and weaknesses of EPI by system components, Ghana, 2010 ................................... 32
Table 17: Components of the immunization system in relation to programme objectives, regional and
global goals ................................................................................................................................................. 41
Table 18: Strategies, Key activities and timeline ........................................................................................ 45
Table 19: Micro-economic Indicators ......................................................................................................... 54
Table 20: Total Cost for Immunization ....................................................................................................... 54
Table 21: Routine Recurrent Cost ............................................................................................................... 55

4
Table 22: Cost of Campaign ........................................................................................................................ 55
Table 23 .......................................................................................................... Error! Bookmark not defined.
Table 24 .......................................................................................................... Error! Bookmark not defined.
Table 25: Indicators for financial monitoring ............................................................................................. 60
TABLE OF FIGURES
Figure 1: Map of Ghana ................................................................................................................................ 8
Figure 2: GDP Growth Rate ......................................................................................................................... 11
Figure 3: Institutional Structure of Ghana’s Public Health Division ............................................................ 13
Figure 4: Organization structure of Ghana Health Service ......................................................................... 14
Figure 5: Suspected and reported cases of measles 1994-2009 ................................................................ 18
Figure 6: Cost by Strategy ........................................................................................................................... 56
5
EXECUTIVE SUMMARY
The comprehensive multi-year plan (cMYP) is the medium term plan for the Expanded
Programme on Immunization (EPI) in Ghana. As expected, it provides the strategic direction of
the immunization programme for the period. The cMYP is always prepared in consonance with
the 5-year strategic plan of the health sector. The current cMYP (2007-2011) had to be revised
to 2010 – 2014 to accommodate the plans to introduce two new vaccines – pneumococcal,
rotavirus – and second dose measles into the routine. The current cMYP is also in tandem with
the current Health Sector Medium-Term Development Plan (HSMTDP) which is from 2010-
2013, with an extra year of 2014 to accommodate the plans to introduce the two new vaccines
as earlier mentioned.
During the implementation period, Ghana will introduce two new vaccines, pneumococcal and
rotavirus vaccines together with second dose measles into the routine immunization
programme. This decision was reached at an Inter-agency Coordination Committee (ICC)
meeting chaired by the Deputy Director General of the Ghana Health Service (GHS) on
Wednesday 5 August 2009 at the UNICEF Conference Room in Accra. The country has also
applied for Meningitis Conjugate A Vaccine to conduct a preventive campaign for Northern,
Upper East and Upper West Regions which are within the African Meningitis Belt.
The country will in addition introduce measles-rubella vaccine into the routine immunization
system to replace the measles vaccine. The introduction will be preceded by mass
immunization campaign in 2013 for children 1-14years old
The goal of the new vaccines introduction is to reduce burden of vaccine preventable diseases
with the view of contributing to the overall poverty reduction and health care strengthening in
the country. The 5-year plan is guided by the above goal and also consistent with the five goals
of the global immunization vision and aimed at the achievement of the millennium
development goals (MDGs).
The trend in routine immunization coverage, using Penta 3 as an indicator, has been improving
over the years even though there are still challenges of low Penta 3 coverage of below 80% in
some districts. It is believed that the current planning process in line with the global vision for
immunization will go a long way in addressing some of the gaps at all levels in a cost-effective
manner.
There are enabling and impeding factors that affect effective implementation of all components
of the immunization system in the country. Improved access and quality immunization services
have been major challenges because of difficult terrain in most hard-o-reach areas and human
resource constraints. In spite of these challenges there is Government commitment, dedicated
service staff and effective collaboration from partners like GAVI, WHO, UNICEF etc to support
and provide immunization services.
A lot of work in terms of interaction with different stakeholders and collaborations went into
developing this plan, thus, from the stage of situational analysis, through costing and finally
monitoring and evaluation. The progress of the implementation of the plan will be monitored

6
through time-tested best practice mechanisms like departmental meetings and regular reviews
at all levels. The role of the ICC in ensuring that the plan is on track cannot be over-emphasized.
It is expected that this national plan will serve as a guide and template for regional and district
annual plans during the period. The current plan is presented in five chapters as described
briefly below:
Chapter 1: Country information - This describes the country profile and demographic
information, administration and politics, the macroeconomic environment, the health status of
the country and the Expanded Programme on Immunization (EPI) in Ghana.
Chapter 2: Situation analysis - This chapter provides information on the current issues and
challenges of the immunization programme in Ghana. It further provides detail description of
the strengths and weaknesses of all the components of the immunization system in the
country. It is also in this chapter that the introduction of new vaccines is discussed.
Chapter 3: Goals, Objectives, Key Activities, Indicators and Milestones - In chapter 3 are the
goals and objectives of the cMYP, the strategic components, key activities, indicators and
milestones. First there are key indicators and activities in relation to Goals and Strategic
Objectives. There are also the Programme objectives, targets and milestones by components of
immunization system in relation to regional and global goals. The chapter concludes with
another table on strategic activities directed toward mitigating weaknesses. The activities
advanced will strengthen functions that support the Program and will lead to the successful
attainment of objectives within time lines.
Chapter 4: Costing, Financing and financial gaps - The chapter elaborates plans for financing
and sustainability of the plan.
Chapter 5: Monitoring and evaluation - This is the final chapter that describes the monitoring
and evaluation mechanisms put in place to ensure effective and efficient implementation of the
plan.

7
ACRONYMS & ABBREVIATIONS
AD Auto-Disable
AEFI Adverse Events Following Immunization
AFP Acute Flaccid Paralysis
BCG Bacille Calmette-Guerin vaccine
CHPS Community Health Planning and Services
CHPW Child Health Promotion Week
cMYP Comprehensive Multi Year Plan
DHS Demographic Health Survey
DQS Data Quality Survey
DPT Diphtheria, Pertussis and Tetanus toxoid vaccine
EPI Expanded Programme on Immunization
GAVI Global Alliance of Vaccine and Immunization
GHS Ghana Health Service
GIVS Global Immunization Mission & Strategies
GoG Government of Ghana
GDP Gross Domestic Product
HCW Healthcare workers
HDI Human Development Index
ICC Inter-agency Coordination Committee
IDSR Integrated Disease Surveillance Response
IEC Information, Education and Communication
IMR Information Mortality Rate
ISS Institutional Strength Support
MDG Millennium Development Goal
MNTE Maternal and Neonatal Tetanus Elimination
MoH Ministry of Health
MR Measles-Rubella
MTEF Medium-term Expenditure Framework
NGOs Non-Governmental Organizations
NIDs National Immunization Days
NT Neonatal Tetanus
OPV Oral Polio Vaccine
PHC Primary Health Care
PPME Policy, Planning, Monitoring and Evaluation
RED Reaching Every District
SSA Sub Saharan Africa
SNIDs Sub-national Immunization Days
SOCMOB Social Mobilization
TT Tetanus Toxoid vaccine

8
1 CHAPTER 1 – COUNTRY INFORMATION
1.1 General Profile and Demography
Ghana is a tropical country situated in the west coast of Africa and located between latitudes 4°
and 11º N of the equator. Ghana shares common borders with neighbouring Togo to the East,
Burkina Faso to the North, and Cote d’Ivoire to the West. The South is bounded by the Gulf of
Guinea. At independence in 1957, Ghana's population was about 6 million, and increased to
6,726,815 in 1960 when the first post-independence census was conducted. The 2010 National
Housing and Population Census has showed that Ghana’s estimated population has grown by
28.1 percent from 18,912,079 in 2000 to 24,223,431 in 2010 with the national intercensal
growth rate declining from 2.7 percent in 2000 to 2.4 percent in 2010. The growth rate for
Northern and Upper East Regions have the largest and the least growth rates of 2.9 percent and
1.1 percent respectively. The population of the country is estimated to reach about 26.63
million by the year 2014. Ghana's phenomenal population growth rate is as a result of the
interplay of four main factors. These are the
youthful age structure of the population
which means that a large proportion of the
population is concentrated in the
reproductive or child-bearing ages; the
persistently high fertility rates; the rapidly
falling mortality rates and the volume,
persistence and direction of migration flows in
and out of the country.
The level of fertility in Ghana though declining
has still remained very high. The reported
Total Fertility Rate (TFR) ranged from 6 and 7
between 1960 and 1988. The Ghana
Demographic and Health Survey (GDHS)
reports show that there have been gradual
but slight decline of the TFR from 5.5 (1993)
through 4.6 (1998) to 4.2 (2003) and later to 4.0 in 2008 which is considered very high when
compared with 2.0 for most developed countries. Infant mortality and under 5 mortality have
worsened to 64 and 111 deaths respectively per 1,000 live births compared to 57 deaths and
108 deaths in 1998 respectively. However, the GDHS 2008 report indicates that Infant mortality
has reduced to 50/1000 live birth and Child mortality has also reduced to 80/1000 live birth.
Ghana has a pyramidal age structure due to its large numbers of children below 15 years of age.
Over forty percent of the population is below age 15 while about 5 percent is above 65 years. In
2010 females (51.3%) were estimated to have outnumbered males (48.7%) thereby closing the
sex ratio from 98 males in 2000 to 95 males in 2010 per 100 females. Life expectancy at birth is
estimated at 57.1 years, with 55 years for males and 59.2 years for females.
Figure 1: Map of Ghana

9
The spread of population in Ghana is diverse with Ashanti region (19.5 percent) and Greater
Accra region (16.1 percent) alone sharing 35.6 percent of the total population depicting a one
percentage point increase over 2000 population figure. Also population density varies greatly in
Ghana. Nationally, density is estimated to have increased from 79 per square kilometer (km2) in
2000 to 102 in 2010. Greater Accra still has the highest population density of 1,205 per km2)
compared to 895 in 2000, whiles Northern Region also still has the lowest density 35 per km2 in
2010 compared to 26 in 2000. In effect, the population density in the northern half of the
country, which also is the poorest economically, is very sparse. The density and population data
has considerable implications for the kind of health professionals and providers required in the
different regions and their distribution patterns nationally. Where the population is high and
the density is high, the rule of synergy would require that staff and facilities are appropriately
mixed to deliver more and better services. This is however not the case. There is a growing
trend in rural-urban migration.
1.2 Administrative Profile and Governance
Ghana has multi-party democratic political system with a presidency, a cabinet, a parliament,
an independent judiciary system and a vibrant free press. These constitute national level
structures with day-to-day functions administered through an established bureaucracy—
ministries, departments and agencies (MDAs). The national institutions are responsible for
policy and strategy development. For administrative and political purposes, Ghana is divided
into ten regions: Ashanti, Brong-Ahafo, Central, Eastern, Greater Accra, Northern, Upper East,
Upper West, Volta and Western Regions. Each region is headed by an appointed Regional
Minister who represents the Head of State (the President of the country). The regional minister
is assisted by a deputy regional minister and a Regional Coordinating Council (RCC). Among
other things, they are supposed to co-ordinate and formulate integrated district plans and
programmes within the framework of approved national development policies and priorities
within their regions.
The country was divided into one hundred and thirty eight (138) administrative districts in 2004
and further divided into 170 in 2008. Each district is headed by a District Chief Executive (DCE),
who is nominated by the President and approved by the District Assembly. The DCE chairs the
Executive Committee of the District Assembly whilst an elected Presiding Member presides
over the District’s Assembly meetings. The District Assembly is the highest political and
administrative authority in the district. The districts are also divided into unit areas and are
headed by elected executives who are responsible for their area of jurisdiction. The
government since 1980s has been vigorously pursuing the policy of decentralization to allow
decision on development to be taken at the grassroots rather than the previous phenomenon
where decisions were taken from the central point (top) and allowed to flow down. The division
of the country into regions, districts, unit committees and others has implication for health
management and administration in the country. The health sector uses the same
decentralization nomenclature up to district level as under government’s political
administrative system. The health districts are further demarcated into sub-districts which are
also subdivided into Community Health Planning and Services (CHPS) zones which are presently
10
the lowest level of service delivery. There are discussions to make CHPS zones coterminous
with political unit committee levels for easy administration and coverage.
Traditional administration co-exists with the modern governmental structure. The traditional
areas consist of Kingdoms, Chiefdoms and Traditional Councils that have important roles to play
in all socio-economic and political endeavours especially in rural areas.
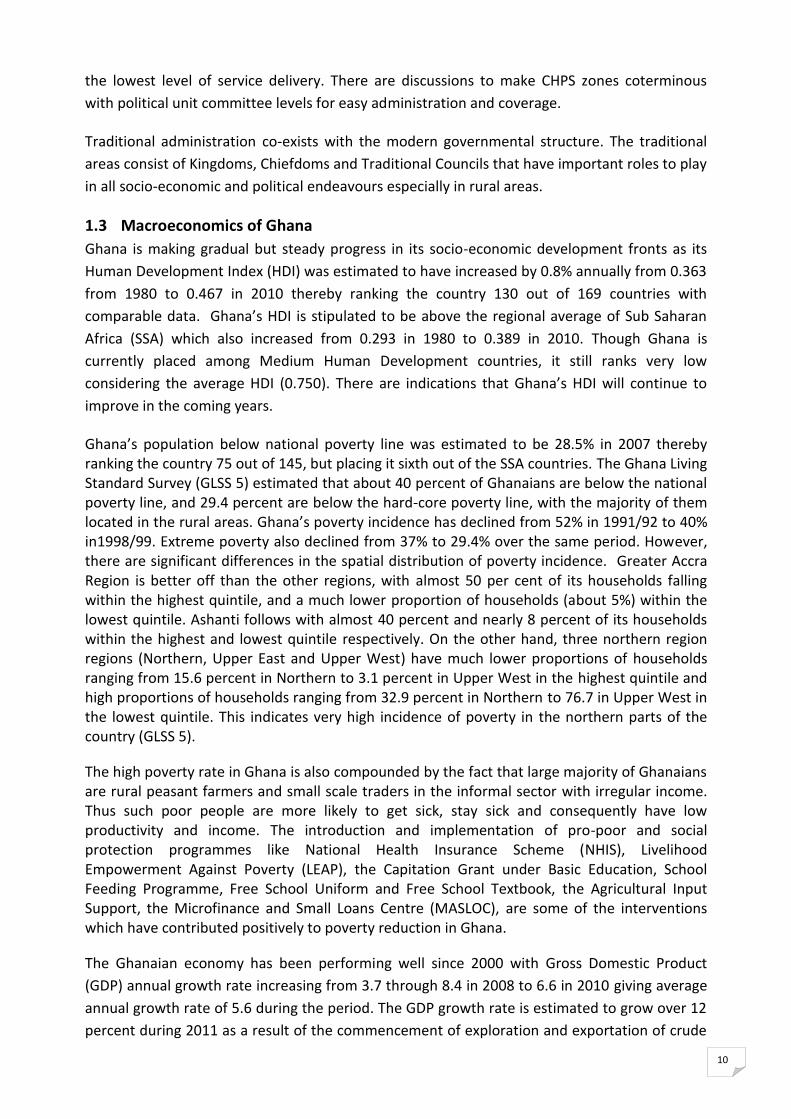
1.3 Macroeconomics of Ghana
Ghana is making gradual but steady progress in its socio-economic development fronts as its
Human Development Index (HDI) was estimated to have increased by 0.8% annually from 0.363
from 1980 to 0.467 in 2010 thereby ranking the country 130 out of 169 countries with
comparable data. Ghana’s HDI is stipulated to be above the regional average of Sub Saharan
Africa (SSA) which also increased from 0.293 in 1980 to 0.389 in 2010. Though Ghana is
currently placed among Medium Human Development countries, it still ranks very low
considering the average HDI (0.750). There are indications that Ghana’s HDI will continue to
improve in the coming years.
Ghana’s population below national poverty line was estimated to be 28.5% in 2007 thereby ranking the country 75 out of 145, but placing it sixth out of the SSA countries. The Ghana Living Standard Survey (GLSS 5) estimated that about 40 percent of Ghanaians are below the national poverty line, and 29.4 percent are below the hard-core poverty line, with the majority of them located in the rural areas. Ghana’s poverty incidence has declined from 52% in 1991/92 to 40% in1998/99. Extreme poverty also declined from 37% to 29.4% over the same period. However, there are significant differences in the spatial distribution of poverty incidence. Greater Accra Region is better off than the other regions, with almost 50 per cent of its households falling within the highest quintile, and a much lower proportion of households (about 5%) within the lowest quintile. Ashanti follows with almost 40 percent and nearly 8 percent of its households within the highest and lowest quintile respectively. On the other hand, three northern region regions (Northern, Upper East and Upper West) have much lower proportions of households ranging from 15.6 percent in Northern to 3.1 percent in Upper West in the highest quintile and high proportions of households ranging from 32.9 percent in Northern to 76.7 in Upper West in the lowest quintile. This indicates very high incidence of poverty in the northern parts of the country (GLSS 5).
The high poverty rate in Ghana is also compounded by the fact that large majority of Ghanaians are rural peasant farmers and small scale traders in the informal sector with irregular income. Thus such poor people are more likely to get sick, stay sick and consequently have low productivity and income. The introduction and implementation of pro-poor and social protection programmes like National Health Insurance Scheme (NHIS), Livelihood Empowerment Against Poverty (LEAP), the Capitation Grant under Basic Education, School Feeding Programme, Free School Uniform and Free School Textbook, the Agricultural Input Support, the Microfinance and Small Loans Centre (MASLOC), are some of the interventions which have contributed positively to poverty reduction in Ghana.
The Ghanaian economy has been performing well since 2000 with Gross Domestic Product
(GDP) annual growth rate increasing from 3.7 through 8.4 in 2008 to 6.6 in 2010 giving average
annual growth rate of 5.6 during the period. The GDP growth rate is estimated to grow over 12
percent during 2011 as a result of the commencement of exploration and exportation of crude
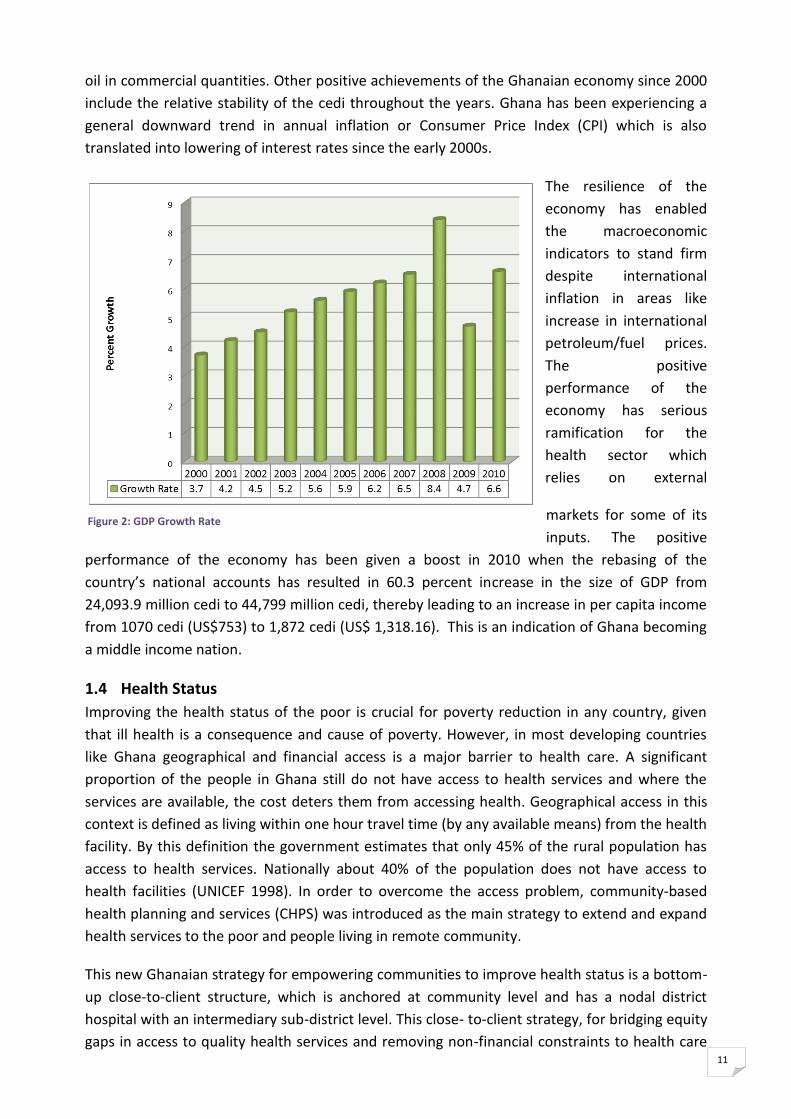
11
oil in commercial quantities. Other positive achievements of the Ghanaian economy since 2000
include the relative stability of the cedi throughout the years. Ghana has been experiencing a
general downward trend in annual inflation or Consumer Price Index (CPI) which is also
translated into lowering of interest rates since the early 2000s.
The resilience of the
economy has enabled
the macroeconomic
indicators to stand firm
despite international
inflation in areas like
increase in international
petroleum/fuel prices.
The positive
performance of the
economy has serious
ramification for the
health sector which
relies on external
markets for some of its
inputs. The positive
performance of the economy has been given a boost in 2010 when the rebasing of the
country’s national accounts has resulted in 60.3 percent increase in the size of GDP from
24,093.9 million cedi to 44,799 million cedi, thereby leading to an increase in per capita income
from 1070 cedi (US$753) to 1,872 cedi (US$ 1,318.16). This is an indication of Ghana becoming
a middle income nation.
1.4 Health Status
Improving the health status of the poor is crucial for poverty reduction in any country, given
that ill health is a consequence and cause of poverty. However, in most developing countries
like Ghana geographical and financial access is a major barrier to health care. A significant
proportion of the people in Ghana still do not have access to health services and where the
services are available, the cost deters them from accessing health. Geographical access in this
context is defined as living within one hour travel time (by any available means) from the health
facility. By this definition the government estimates that only 45% of the rural population has
access to health services. Nationally about 40% of the population does not have access to
health facilities (UNICEF 1998). In order to overcome the access problem, community-based
health planning and services (CHPS) was introduced as the main strategy to extend and expand
health services to the poor and people living in remote community.
This new Ghanaian strategy for empowering communities to improve health status is a bottom-
up close-to-client structure, which is anchored at community level and has a nodal district
hospital with an intermediary sub-district level. This close- to-client strategy, for bridging equity
gaps in access to quality health services and removing non-financial constraints to health care
Figure 2: GDP Growth Rate

12
delivery, entails the definition of the concept of the ‘whole district health systems’. At the heart
of this system is the expansion of the community health planning and services (CHPS) initiative.
This strategy is in line with the Government’s policy of locating community health nurses in
every hamlet’ in Ghana). The three tiers of the new ‘whole district system’, are linked to the
service delivery side through bottom-top referrals and top-down supervision on the
management side, with monitoring and evaluation and accountability running through both
ways.
Table 1: Health Status Indicators 2002-2010
Indicator 2002 2003 2004 2005 2006 2007 2008 2009 2010
Infant mortality rate per 1000 live
births 57 64 64 64 64 64 50 50 50
Under five mortality rate per 1000 live
births 108 111 111 111 111 111 80 80 80
Maternal mortality ratio per 100,000
live births 214 214 214 214 214 214 451 451 451
EPI coverage – Penta 3 (DPTHepB-Hib) 77.9 76 76 85 84 88 87 89 87
EPI coverage – Measles 83.7 79 78 83 85 89 86 89 88
EPI Coverage - BCG 96 92 92 100 100 102 103 104 102
EPI coverage – OPV 3 79 76 76 85 84 88 86 89 87
EPI Coverage - Yellow Fever 71 73 76 82 84 88 86 89 88
EPI Coverage - TT2+ 68 66 62 71 68 71 76 79 76
Non polio AFP rate (%) 2.4 1.44 1.49 1.76 1.65 1.7 2.4 2.5 1.75
*Coverage based on birth cohort instead of surviving infants
The CHPS approach is oriented to deliver a specific basic package of services or essential
interventions that are effective in reaching poor and deprived populations. This is being led by
effective government stewardship that guides the contribution of public, private and voluntary
services. The CHPS as a close-to-client system is designed to comprise of a set of CHPS zones
within a sub-district and supported by Sub-District health facilities (Health Centers) which
provides technical backstopping for the zones and at least a district hospital providing referral
services for the Sub-district structures.
1.5 The status of CHPS implementation and the way forward
The Community-based Health Planning and Services (CHPS) was launched by the MoH with a
view to improving accessibility to primary health care. This was against a background that
despite the existence for over two decades of “health for all” policies, in 1990 more than 70
percent of all Ghanaians still lived more than eight kilometres from the nearest provider, and
rural infant mortality rates were 50 percent higher than corresponding urban rates. Hence
improving access to health-care delivery, therefore, remained a primary goal of health-sector
reform in the 1990s to date. Among the essential elements of the CHPS strategy is the creation
of community health compounds. Community Health Officers (CHOs) carry out clinical and
community outreach services including household visits, antenatal and postnatal care,
provision of family planning services, health education, and child immunization. CHOs normally
refer deliveries to the nearest clinic, but may perform emergency deliveries. The CHPS facilities
serve as a vital referral link between the community and health facilities. The number of

13
functional CHPS zones has grown from19 in 2000 through 190 in 2005 and 345 in 2007 to 868 in
2009. It has further increased by 51% to 1,311 in 2010. In addition over 2000 trained CHO have
been absorbed within GHS structure by 2010, which is a sign of government’s devotion to
improving equity in geographical access to services. To improve the overall progress in scaling
up CHPs the Ministry is improving upon its advocacy at the district and regional levels to
mobilize social groups and traditional institutions to participate more actively in the
implementation of CHPS activities.
The health sector in Ghana has produced its medium term development plan (HSMTDP)
spanning four years (2010-13) in 2010. The HSMTDP which replaces the POW focuses on the
attainment of the MDGs and forms a comprehensive strategy for contributing to the broader
government agenda of reducing poverty. The plan also focused on, prevention, promotion, and
regenerative health with special emphasis on nutrition, healthy lifestyle and environmental
hygiene.
The health care system in Ghana is organized under four main categories of delivery systems
and these are: public, private-for-profit, private-not-for-profit and traditional systems. Though
the former three are mostly associated with healthcare delivery in Ghana, efforts are being
made to integrate traditional medicine into the orthodox mainstream.
The public health service is delivered through six main channels as depicted in figure 3 MoH is
responsible for the direct provision of public health services delivery in the country which
included the promotive, preventive, curative and rehabilitative care, to the Ghanaian public.
Since sector reform in 1996, MoH has ceded some of its functions to the Ghana Health Service
(GHS) and Teaching Hospitals with the enactment of Act 525. The Ministry is, therefore, left
with the responsibility for policy formulation, monitoring and evaluation, resource mobilization
and regulation of the health services delivery. The GHS which is the main service delivery arm
of the MOH is organized administratively at 3 levels: National, Regional, and District levels.
Functionally, GHS operates at five levels: National, Regional, District, Sub-district and
Community levels.
Figure 3: Institutional Structure of Ghana’s Public Health Division

14
Figure 4: Organization structure of Ghana Health Service
Dep. Dir.General
Dep. Dir., Family Health
EPI team
EPI Manager
Head, Disease Control Unit
Director Public Health
EPI team
Public Health Unit
Snr. Med.Off.(Public Hlth)
EPI team
Disttrict Health Mngmt.Team
EPI team
Sub-District leader
District Dir. Hlth. Serv.
Reg.Dir.Health Services Director, Supplies
Director General1.1.1.1.1.1 Fig 2: Organizational
o of the Ghana
Health Service
Minister of Health Figure 4 illustrates the organizational
structure of the Ghana Health Service
with particular emphasis on EPI
coordination and management in the
country. With the Governments’
decentralization and the primary
health care policy implemented in the
country, every district is mandated to
determine its priority health needs and
develop appropriate strategies and
actions to address these needs. These
policies have made district health
teams autonomous in planning and implementing their health programmes with region and
national levels playing advocacy, supervision and monitoring roles. Funds are disbursed from
national through regions to districts. There are EPI managers at all levels responsible for the
planning and coordination of immunization activities in the country.
1.6 EPI in Ghana
The Expanded Programme on Immunization (EPI) which is responsible for immunization in
Ghana is located within the Diseases Control Department (DCD) of the Public Health Division of
the Ghana Health Service. It is headed by a Public Health Specialist and assisted by trained
personnel who are specialists in areas that include logistics management, data management,
cold chain management, injection safety, social mobilization and communication.
The mission of the Immunization Programme in Ghana is to contribute to the overall poverty
reduction goal of the government through the decrease in the magnitude of vaccine-
preventable diseases. This is carried out through the use of cost effective, efficacious and safe
vaccines, new and under used vaccines and technologies to protect more people whilst
contributing to the overall health systems strengthening in an integrated manner. Ghana has
been at the forefront of showcasing immunization as the platform for health systems
strengthening.
Ghana launched the Expanded Programme on Immunization (EPI) in June 1978 with six antigens
– BCG, measles, diphtheria-pertussis-tetanus (DPT) and oral polio for children under one year of
age together with tetanus toxoid (TT) vaccination for pregnant women. The launch was in
response to the national health policy to reduce morbidity and mortality of vaccine preventable
diseases which then contributed significantly to both infant and child mortality in the country. It
was also in consonance with the immunization policy of the government which sought to
ensure that all children receive these vaccines before their first birthday of life.
In 1992, fourteen years after the launch, the government added yellow fever vaccination to the
national immunization programme (NIP). The Polio Eradication Initiative (PEI) introduced in
1996 offered a major boost to the NIP through the resources offered for capacity building at all
levels, funds for operational activities, adequate cold chain logistics, systems strengthening,
partnerships, transportation facilities etc.

15
Table 2: New Immunization Schedule in Ghana
Vaccine/
Antigen Dosage
Doses
Required
Minimum
Interval
Between
Doses
Minimum
Age To Start
Mode Of
Administrati
on
Site Of
Administrati
on
BCG
0.05ml up to
11 months,
0.10ml after
11 months
1dose None At birth (or
first contact) Intra-dermal
Right Upper
Arm
Pentavalent
0.5 ml
3doses
6, 10 and 14
weeks
4 weeks
At 6 weeks (or
first contact
after that age)
Intra-muscular
Outer Upper
Aspect of Left
Thigh
*Pneumo
Outer upper
Aspect of
Right Thigh
Polio 2 drops
4 doses
At birth, 6, 10
and 14 weeks
4 weeks
At birth or
within the first
2 weeks
Oral Mouth
*Rotarix 1.2 ml
2doses
6 and 10
weeks
4 weeks
At 6 weeks (or
first contact
after that age)
oral mouth
Measles
1st dose
0.5 ml
2 doses
9 months
9 months
At 9 months Sub-
cutaneous
Left Upper
Arm
*Measles
2nd dose 18 months At 18 months
Yellow fever 0.5 ml 1 dose None At 9 months
Sub-
cutaneous
Right Upper
Arm
Tetanus
Toxoid 0.5 ml 2 doses
One month
Pregnant
Women
Intra-
muscularly Upper Arm
Vitamin A 100,000 IU
200,000 IU 10 6 months 6 months Oral Mouth
New vaccines
NB: Measles vaccine will be replaced with Measles/rubella vaccine in 2014
In January 2002, the Government of Ghana in partnership with the Global Alliance for Vaccine
and Immunization (GAVI) initiative and supported by other health development partners such
as WHO, UNICEF, World Bank, USAID, JICA, Rotary, DFID, DANIDA, Civil Society Organizations
etc increased the number of antigens with two new vaccines - the Hepatitis B and the
Haemophilus influenza type b (also known as Hib). The two new vaccines were combined with
the DPT into DPT-HepB+Hib (commonly referred to as the Pentavalent vaccine in the country).
The Government of Ghana has been responsible for the total cost of traditional vaccines and
injection supplies since the inception of EPI in 1978. It shares the cost of the Pentavalent and
Yellow Fever proportionately with GAVI as agreed upon in the financial sustainability plan at the
beginning of the introduction of the Pentavalent vaccine in 2002 until 2007 when the country
rolled-on to the co-payment scheme under the bridge financing mechanism. Development

16
Partners (DPs) provide support in various forms including campaigns. Some of the partners
support needy districts with additional resources to improve on their immunization
programmes. Immunization coverage has been on steady increase and as at the end of
December 2007, 106 districts out of the 138 in the country, representing 84% achieved penta3
coverage of more than 80%. Incidence of most of the childhood killer diseases in the country
have declined significantly.
Three strategies are implored for the delivery of the immunization services in the country-
static at health centers, outreach in the communities and campaigns to reach out to most of
the unreached populations. Static and outreach immunization services are delivered mostly at
child welfare clinics (CWC) by Community Health Nurses (CHNs) and Disease Control Officers
(DCOs). At the CWC other services like growth monitoring, vitamin A supplementation, de-
worming etc are all delivered.
17
2 CHAPTER 2 - SITUATION ANALYSIS
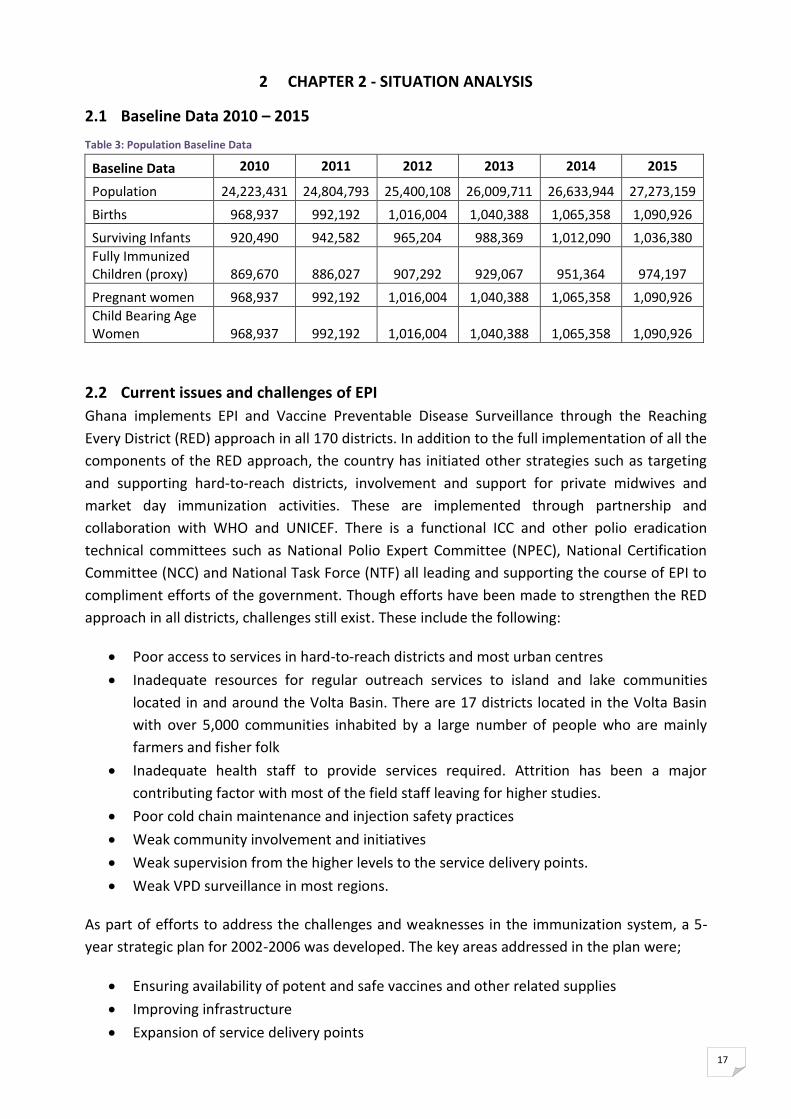
2.1 Baseline Data 2010 – 2015
Table 3: Population Baseline Data
Baseline Data 2010 2011 2012 2013 2014 2015
Population 24,223,431 24,804,793 25,400,108 26,009,711 26,633,944 27,273,159
Births 968,937 992,192 1,016,004 1,040,388 1,065,358 1,090,926
Surviving Infants 920,490 942,582 965,204 988,369 1,012,090 1,036,380
Fully Immunized Children (proxy) 869,670 886,027 907,292 929,067 951,364 974,197
Pregnant women 968,937 992,192 1,016,004 1,040,388 1,065,358 1,090,926
Child Bearing Age Women 968,937 992,192 1,016,004 1,040,388 1,065,358 1,090,926
2.2 Current issues and challenges of EPI
Ghana implements EPI and Vaccine Preventable Disease Surveillance through the Reaching
Every District (RED) approach in all 170 districts. In addition to the full implementation of all the
components of the RED approach, the country has initiated other strategies such as targeting
and supporting hard-to-reach districts, involvement and support for private midwives and
market day immunization activities. These are implemented through partnership and
collaboration with WHO and UNICEF. There is a functional ICC and other polio eradication
technical committees such as National Polio Expert Committee (NPEC), National Certification
Committee (NCC) and National Task Force (NTF) all leading and supporting the course of EPI to
compliment efforts of the government. Though efforts have been made to strengthen the RED
approach in all districts, challenges still exist. These include the following:
Poor access to services in hard-to-reach districts and most urban centres
Inadequate resources for regular outreach services to island and lake communities
located in and around the Volta Basin. There are 17 districts located in the Volta Basin
with over 5,000 communities inhabited by a large number of people who are mainly
farmers and fisher folk
Inadequate health staff to provide services required. Attrition has been a major
contributing factor with most of the field staff leaving for higher studies.
Poor cold chain maintenance and injection safety practices
Weak community involvement and initiatives
Weak supervision from the higher levels to the service delivery points.
Weak VPD surveillance in most regions.
As part of efforts to address the challenges and weaknesses in the immunization system, a 5-
year strategic plan for 2002-2006 was developed. The key areas addressed in the plan were;
Ensuring availability of potent and safe vaccines and other related supplies
Improving infrastructure
Expansion of service delivery points

18
Capacity building at all levels.
Monitoring and evaluation including giving feedback
Strengthening management capacity through MLM training
Regular supportive supervision from national level to health facilities
High level advocacy and social mobilization with a multi-sectoral approach
Disease surveillance and response initiatives
During the implementation of the 5-year strategic plan (2002 – 2006) significant investments
and strategies were put into place for the strengthening of EPI including GAVI support and the
Reaching Every District (RED) approach, among others. A review of EPI performance at all levels
was carried out in May 2004 that assessed the strengths and weaknesses of the programme,
and also lessons learnt over the past five years.
There has been improvement in the immunization coverage indicators over the years. The
trend of national coverage has shown increase of Penta3 from 76% in 2003 to 87% in 2010. The
number of districts achieving Penta3 coverage of 80% or higher has increased from 55 (50%) in
2003 to 133 (78%) in 2010. Government is responsible for full cost of all traditional vaccines and
immunization supplies and contributes about 45% of the cost of DTP- HepB+ Hib (Penta)
vaccines introduced in 2002.
As illustrated in the graph, the morbidity due to measles has reduced drastically over the years
since the catch up campaign in 2002. There has not been any death due to measles since 2003
in the country.
Figure 5: Suspected and reported cases of measles 1994-2009

19
Since the introduction of Hib vaccine in 2002, the number of meningitis cases due to Hib has
declined with zero case since 2005 at Hib surveillance sites.
There was no wild polio virus in the country from September 2003 until September 2008 when
Ghana suffered another setback after 2003 with 8 cases of wild poliovirus reported in the
Northern Region. Series of house-to-house polio outbreak response campaigns have been
conducted to break transmission of the virus in the country. Outcome of the campaigns have
shown positive result.
2.3 Performance analysis of EPI
The situational analyses of the programme as of December 2010 are presented in the table
below:
Table 4: Situation analysis of the EPI system in Ghana, 2001 - 2008
Component Indicators YEAR
2001 2002 2003 2004 2005 2006 2007 2008 2009 2010
Service
Delivery
National Penta3
coverage (%) 76 79 76 76 85 84 88 87 89 87
Proportion of
districts with Penta 3
coverage >80% (%)
52 54 52 52 73 78 83 83 84 78
Timeliness
of reports
Number of district
reporting 110 110 110 110 138 138 138 138 170 170
Number of expected
reports 1320 1320 1320 1320 1656 1656 1656 1656 2040 2040
Number of reports
received on time 1188 1267 1162 1120 1556 1656 1568 1416 1893 1882
Completeness of
district reports to
national (%)
100 100 100 100 100 100 100 100 100 100
Timeliness of district
reports 90 96 88 85 94 100 95 86 93 92
Polio
Eradication
National OPV3
coverage (%) 80 79 76 76 85 84 88 87 89 87
Proportion of
districts with OPV 3
coverage >80% (%)
54 54 52 52 73 78 83 83 84 78
Non-polio AFP rate 3.04 2.42 1.44 1.49 1.76 1.65 1.7 2.4 2.5 1.8
Number of Wild
polio cases
confirmed
0 0 8 0 0 0 0 8 0 0
MNT
Eliminatio
n
Coverage of TT2+ to
pregnant women (%) 61 68 66 62 71 69 71 76 79 76
Measles
National measles
coverage (%) 82 85 80 78 83 85 89 86 89 88
Suspected measles
cases
1343
7
1213
0 2642 1186 976 420 588 1305 686 641
Confirmed IgM+ve
cases 46 60 66 81 6 82 101 36

20
2.4 Polio Eradication Initiatives
Table 5: Summary of All SNIDS and NIDS Conducted in Ghana
Year
NID or
SNID
round
Date / month
conducted
House-to-
house imm.
used (yes/no)
No. of < 5 yr
olds targeted
No. of <5yrs
reached with
OPV
Reported
coverage (%)
1996 NID October 1996 No 3,584,643 3,154,486 88
1996 NID November 1996 No 3,584,643 3,441,257 96
1997 NID October 1997 No 3,612,811 3,540,555 98
1997 NID November 1997 No 3,612,811 3,685,067 102
1998 NID October 1998 No 3,804,129 3,956,294 104
1998 NID November 1998 No 3,804,129 3,994,335 105
1999 NID January 2000* No 3,835,551 4,104,040 107
1999 NID February 2000* No 3,835,551 4,219,106 110
2000 SNID 25th–27th May No 680,880 633,218 93
2000 SNID 6th
– 8th
July No 680,880 735,350 108
2000 NID 20th
– 22nd
Oct Yes 4,250,000 4,335,000 102
2000 NID 24th – 26th Nov. Yes 4,250,000 4,547,500 107
2001 SNID 16th
-18th
April Yes 2,478,000 2,410,997 97
2001 SNID 21st
-23rd
May Yes 2,478,000 2,484,610 100
2001 NID 22nd
-24th
October Yes 4,716,831 4,662,768 99
2001 NID 26th
-28th
Nov. Yes 4,716,831 4,733,220 100
2002 SNID 3th -6th
Oct Yes 2,220,561 2,137,064 96
2002 SNID 8th
– 10th
Nov. Yes 2,220,561 2,143,262 97
2003 SNID 13 – 15th
June Yes 803,743 783,071 97
2003 SNID 18th
– 20th
July Yes 803,743 820,634 102
2003 NID 24th -26th Oct Yes 4,785,451 4,913,656 103
2003 NID 5th - 7th Dec Yes 4,785,451 4,998,538 104
2004 NID 27th - 29th Feb Yes 5,141,538 5,196,362 101
2004 NID 25th - 27th Mar Yes 5,141,538 5,433,676 106
2004 NID 8th -11th Oct Yes 5,219,210 5,418,395 106
2004 NID 18th - 21st Nov Yes 5,219,210 5,504,492 107
2005 NID 25th
-27th
Feb Yes 5,518,566 5,784,379 105
2005 NID 8th
-10th
April Yes 5,518,566 5,760,027 104
2005 NID 11th - 13th Nov Yes 5,518,566 5,725,618 104
2005 NID 9th -11th Dec Yes 5,518,566 5,959,601 108
2006 NID 1st - 5th Nov No 5,964,181 5,045,867 85
2007 NID 28th
– 30th
Nov No 4,582,797 4,599,929 100.4
2008 NID 15th
– 17th
Oct No 4,669,285 4,804,490 102.9
2008 SNIDs 13th
-15th
Nov Yes 944,183 922,386 97.7
2008 SNIDs 11th
-13th
Dec Yes 944,183 933,739 98.9
2009 NID 12th – 14th Feb Yes 4,836,337 4,807,262 99.4
2009 NID 26th -28th March Yes 4,807,262 4,988,591 103.8
2009 NID 28th -30th May Yes 4,884,571 5,087,152 104.1
2010 NID 5th – 7th March Yes 5,095,044 5,258,575 103.2
2010 NID 23rd – 25th April Yes 5,095,044 5,201,937 102.1

21
2.5 Advocacy
There is an Inter-Agency Coordinating Committee (ICC) that meets quarterly and also on
emergency basis to address EPI issues as prescribed by their terms of reference and
responsibilities. The Deputy Director General of the Ghana Health Service (GHS) is the
Chairman. All the major health development partners and private organizations are
represented on the Committee. Most of the activities of the ICC have included the following:
To foster solid partnership by collating all available inputs and resources from inside and
outside the country in order to maximize resources for the good of the child
Support national level to review and support work plans such as NIDs, EPI annual plans,
EPI 5 year plans, surveillance plan etc
Enhance transparency and accountability by reviewing use of funds and other resources
together with the EPI Programme at regular intervals
Support and encourage information sharing and feedback at national and or
implementing levels within the country and interested partners outside the country
Ensure that the Programme Manager receives both technical and political support that
helps to validate his or her authority on issues pertaining to EPI.
Address technical issues as and when they arise such as introduction new antigens,
strengthening immunization services etc
The ICC will continue to play the advocacy role to solicit support for effective introduction of
the intended new vaccines and the implementation of planned activities of the Immunization
programme. It will also provide support for the resource mobilization initiative to harness
resources for the immunization programme.
2.6 Communication
There is a 5-year (2003-2007) communication plan (2003-2007) which was developed at the
time of introducing the pentavalent in 2002 and after and has been adopted every year for
communication and social mobilization activities for all immunization programmes. The existing
plan will be adopted and revised as usual for the introduction of the new vaccines.
In addition, there exist cordial relations between the Immunization programme and the Media
in the country at national and regional levels. The Media has been used extensively for all
immunization programmes for awareness creation and public education. There is always a
press briefing and national launch for most immunization activities which are highly patronized
by most of the Media. Radio and TV programmes are also used at national and regional levels.
Communication in most of the rural districts and communities has some challenges due to high
illiteracy rate and resource constraints. In such difficult areas, gong-gong and town criers are
the main resources used to disseminate information to the public together with community
durbars.
Most of the challenges are being addressed in collaboration with emerging local civil society
organizations in the various districts and communities.

22
2.7 Surveillance
Ghana implements the integrated disease surveillance and response (IDSR) system that
includes surveillance for vaccine preventable diseases (VPD) at all levels. In 2001, Ghana
established two sentinel sites for the surveillance of paediatric bacteria meningitis (PBM) called
Hib as part of requirements for the introduction of the haemophilus influenza type b (Hib) and
hepatitis B into the routine immunization programme in 2002. The two sites in Accra and
Kumasi have been functional since inception until date.
With the plan to introduce two new vaccines (pneumococcal and rotavirus) in 2011, two new
sentinel sites have again been set up in Accra and Kumasi which have begun rotavirus
surveillance. The Accra site was established in 2006 with the Kumasi site set up in 2009. In
addition, the two sites in Accra and Kumasi which are already monitoring the Hib burden are to
be resourced to undertake the pneumococcal surveillance as a starting point as efforts are
made to expand the number of the sites to other parts of the country as an interim measure.
Additionally, Case based surveillance for suspected measles cases was set up in 2003 after the
measles Supplementary Immunization Activities (SIA’s). Suspected cases that come out to be
negative for measles are further tested for rubella IgM antibodies.
Rubella seroprevalence studies have also been on-going since 2003 in selected HIV sentinel
sites in Accra, Tamale and Kumasi. In this study, the first 500 women to attend prenatal clinic in
any of the selected sentinel sites in each month are screened for rubella. Thus, samples of
blood taken for HIV testing are also tested for rubella IgG antibodies.
For a permanent measure, a comprehensive surveillance plan has been drafted to mainstream
the surveillance of all the new vaccines into the national IDSR system under the national
surveillance department and to be implemented at all levels just as with the existing system.
2.8 Introduction of new vaccines into EPI
Ghana’s first major challenge and experience in introducing new vaccines into the routine
immunization programme was at the time of introducing the haemophilus influenza type b
(Hib) and the hepatitis B vaccines in the combination of DPT-HepB+Hib (also referred to as
pentavalent) in 2002 with GAVI support.
At the ICC meeting on Wednesday 5 August 2009, the Government of Ghana took another giant
step with the decision to introduce two new vaccines, pneumococcal and rotavirus vaccines
together with second dose measles into the routine immunization programme. The decision to
introduce these vaccines was informed by presentations made on the burden of these diseases,
estimated infant deaths to be averted and the health and economic benefits to be derived
when these vaccines are provided in the routine immunization programme in the country. The
objective as stated earlier is to reduce morbidity and mortality of these diseases in infants and
under five populations as a step towards achieving MDG4 within the stipulated timeframe by
2015.
23
The introduction which was initially scheduled on January 2011 was revised to May 2012. The
date changed because Ghana’s application received conditional approval and had to submit
further clarifications to GAVI.
Preparatory activities for the introduction were well planned and implemented accordingly. The
country has revised all immunization data collection tools, child health record book and the
immunization schedule. Media briefing and national launching was planned for 26th April, 2012
to ensure smooth and successful introduction of all three vaccines at all the immunization
centers in the country on 2nd May 2012.
With the successful introduction of Pneumococcal conjugate and Rotavirus vaccines in May
2012, Ghana has again taken another bold decision to introduce Measles rubella vaccine to
replace the measles vaccine. The decision taken by the technical committee of the ICC on 20th
August 2012 at the WHO country office was based on the review of surveillance data since 2003
and the report of the sero-prevalence and CRS studies conducted in the country. It also
considered the WHO Africa Region’s recommendation for Ghana to consider introducing the
measles rubella vaccine
2.8.1 Reasons for introducing the selected vaccines in routine EPI
I. Pneumococcal vaccine Pneumococcal disease is one of the most common bacterial causes of hospitalization in all
age groups. Globally, approximately 1 million deaths per year are attributed to
pneumococcal disease in children 5 years of age or younger. Studies by a group of experts
on Haemophilus influenzae type b (Hib) and Streptococcus pneumoniae (Spn) and reviewed
by an Independent Expert Advisory Group have estimated severe illness and deaths due to
Streptococcus pneumoniae in children from one month to less than five years of age in
Ghana as 71933 cases and 4216 deaths as at end of 2008 (IVB/EPI/HibSPGDB - WHO
correspondence date 27 July 2009 to countries).
II. Rotavirus vaccine Rotavirus infection is the leading cause of severe diarrhea among young children. An
estimated 527,000 children aged <5 years die from rotavirus diarrhea each year with >85%
of these deaths occurring in Africa and Asia. Each year it causes about 111 million cases of
disease requiring home care only, 25 million clinic visits, 2 million hospitalizations and more
than 500,000 deaths in children aged five or younger.
In Ghana, a study at Korle-Bu Teaching Hospital, La General Hospital and Princess Marie
Loius Children's Hospital revealed that out of all diarrhea admissions, rotavirus constituted
about 48% among 6-18 months age group and >65% during peak rotavirus seasons. Another
study at Komfo Anokye Teaching Hospital and Agogo Presbyterian Hospital showed that
rotavirus infection among children <5 years of age is 22.5% in both Outpatients and
Inpatients department. 20.1% of all outpatients are infected with rotavirus and 32.2% of all
inpatients shedding rotavirus. The infection is common in 6-18 months age group (>63%)
and uncommon in older children and infants (<10%). 18% of all diarrhoea infections
resulted in hospitalization.

24
III. Second dose Measles (MCV2) The decision to introduce second dose measles (MCV2) into the routine immunization
programme has been informed by the fact that the country has met most of the eligibility
criteria as outlined in the AFRO measles TAG recommendations, and later outlined in the
SAGE recommendations for MCV2 introduction, which include:
More than three years consistently high immunization coverage above 80% since
2000 by the WHO/UNICEF estimate.
Meeting both targets for the two principal WHO AFRO measles surveillance
performance indicators in the years 2007 and 2008.
Ghana’s eligibility has been endorsed by WHO AFRO based on the criteria above. To that
effect a letter dated 30 June 2009 received from AFRO has identified Ghana as one of the
countries in the sub-region which is eligible and encouraging the country to take advantage
of the opportunity to introduce the vaccine as early as possible. Moreover, going by the
SAGE recommendations, Ghana’s intent to introduce MCV2 is in line with WHO recent
policy recommendations.
The introduction of the second dose in the routine programme will not lead to complete
abolition of the periodic measles follow up SIAs, but will help to prolong the interval
between campaigns. Provision of the second measles vaccine dose in routine EPI in the
second year of life will also provide linkage with other priority health interventions such as
the administration of vitamin A which is provided every 6 months from the age of 6 months.
2.8.2 Meningitis A Conjugate Vaccine for Campaign
The three northern regions of Ghana; namely Upper East, Upper West and Northern Regions;
fall within the meningitis belt. A number of outbreaks have been recorded in these regions
causing deaths and disabilities. Epidemics occurred in 1919/21, 1939, 1944/45, 1948/50,
1960/61, 1972/73 and 1984. In 1996/97 Ghana experienced the biggest epidemic which
recorded 18,703 cases and 1,356 deaths. The Kassena Nankana District (KND) recorded 1,396
cases with 69 deaths.
Data from year 2000 indicates that the country has been recording meningitis cases ranging
from 365 cases in 2009 to 2,163 in 2002 with case fatality rate also ranging from 10.9% in 2010
to 24.1% in 2000. In 2010, most of the cases were reported from Upper East and Upper West
Regions. Jirapa District in Upper West Region and Bongo District in Upper East Region were the
most affected districts.
As a result of the annual epidemics and its resultant threat to life and the economy, it has
become very important for Ghana to conduct a preventive campaign with Meningitis A Conj.
Vaccine.
The main objective of introducing meningococcal A conjugate (Men A conjugate) vaccine is to
reduce the incidence of meningitis epidemic that regularly hits the northern sector of Ghana
which lies within Africa’s Meningitis Belt. It is hoped that providing individual protection against

25
the disease will also reduce asymptomatic carriage and even unvaccinated individuals in the
population will be at a reduced risk of the disease as a single dose of Men A Conj. Vaccine in
catch up vaccination campaigns for 1 to 29 year olds will rapidly induce herd immunity.
2.8.3 Measles-Rubella Vaccine
Rubella is an acute, usually mild viral disease traditionally affecting susceptible children and
young adult worldwide. It is a common cause of maculopapular rash illness with fever. The
disease has few complications unless it is contracted by pregnant women, in which case it may
lead to miscarriage, stillbirth, or an infant born with congenital rubella infection
3 rubella studies have been conducted since 2003 in an attempt to determine the rubella prevalence in the country. These are the fever-rash surveillance after measles campaign in 2002, sero-prevalence study and the congenital rubella syndrome surveillance. From 2003-2006, 462 rubella cases were detected from the fever rash surveillance. Cases were seen from all the ten regions of the country with majority of the cases occurring among children 1-9years old. There has also been increasing trend of rubella in the country. In 2011, out of a total of 1,600 measles negatives that were tested for rubella, about 582 (36%) were confirmed positive for rubella. Confirmed rubella cases have been increasing over the years from 135 confirmed cases in 2009 to 160 confirmed cases in 2010. The seroprevalence study came out with rubella immunity of 92.6%. The non immunity is
significantly associated with younger age group of less than 20 years old. Using a model for age
specific birth rate and age specific rubella susceptibility level, it was determined that about
3000 pregnant women would be infected and approximately 700 babies would be born with
CRS. An CRS incidence rate of 0.8/1000 live births was recorded in Kumasi in 1996, indicating
that the condition is endemic in Ghana
Results from studies conducted in the country clearly indicate that rubella is endemic in the
country and that introduction of rubella containing vaccines could help reduce the incidence of
CRS and stillbirths and improve pregnancy wastage.
The Measles Rubella vaccines would be introduced in a campaign mode as a “catch up” in 2013
for children 1-14years and subsequently introduce into the routine vaccination in 2014 to
replace measles vaccination at 9 and 18 months.
2.8.4 Vaccine financing and management
The cost of the vaccines will be supported by GAVI through the co-financing mechanism. The
procurement of vaccines and injection supplies will be done by UNICEF on behalf of the
Government. Vaccine storage, distribution and utilization will follow the existing procedures of
the vaccine and cold chain management in the immunization system. Vaccine estimation and
wastage monitoring will also follow the existing procedures.

26
2.8.5 Post introduction evaluation
Following the experience from the introduction of the DPT-HepB+Hib in 2002, post introduction
evaluation of the new vaccines will be conducted 18 months after introduction in the country
to document lessons, gains and implications for future programmes.
2.8.6 Surveillance
The surveillance of these diseases will be conducted by the sentinel sites established and
through the national integrated disease surveillance system.
2.9 Vaccines and Logistics
The tables below are the population data, vaccines and injection supplies estimated for the five
year period using the WHO Logistics Forecasting tool.
Table 6: Baseline Data 2010 – 2015
Baseline data 2010 2011 2012 2013 2014 2015 Total 5-years
Total Population 24,223,431
24,804,793
25,400,108
26,009,711
26,633,944
27,273,159
130,121,715
Total annual birth cohort: 968,937 992,192 1,016,004
1,040,388
1,065,358
1,090,926
5,204,869
Total annual surviving infants: 920,490 942,582 965,204 988,369 1,012,090
1,036,380
4,944,625
Total annual pregnent women: 968,937 992,192 1,016,004
1,040,388
1,065,358
1,090,926
5,204,869
Table 7: Annual Vaccine Requirement 2010 – 2015
Total annual vaccines doses + buffer 2010 2011 2012 2013 2014 2015 Total 5-years
BCG lyophilized 2,367,000
1,893,000
2,044,000
2,093,000
2,144,000
2,195,000
10,369,000
OPV liquid 4,935,000
5,237,000
5,326,000
5,454,000
5,585,000
5,719,000
27,321,000
DTP-HepB+Hib liquid+lyop. 2,772,000 - 689,000 - - - - - 689,000
DTP-HepB-Hib liquid - 4,525,000
3,729,000
3,818,000
3,910,000
4,004,000
19,986,000
Measles lyophilized 1,154,000
1,190,000
2,729,000
2,493,000 - 620,000 -
5,792,000
YF lyophilized 1,121,000
1,199,000
1,217,000
1,247,000
1,276,000
1,307,000
6,246,000
TT liquid 2,117,000
2,487,000
2,482,000
2,542,000
2,603,000
2,665,000
12,779,000
PCV-10 liquid - - 3,861,000
3,182,000
3,258,000
3,336,000
13,637,000
Rota_liq liquid - - 2,574,000
2,121,000
2,172,000
2,224,000
9,091,000
MR lyophilized - - - - 3,172,000
2,614,000
5,786,000
Table 8: Annual requirement for devices
Total annual safe injection equipment required 2010 2011 2012 2013 2014 2015
Total 5-years
No. of syringes required for ID injections ADS_0.05ml
1,104,000
1,108,000
1,135,000
1,162,000
1,190,000
1,219,000
5,814,000
No. of syringes required for SC injections ADS_0.5ml
1,894,000
1,979,000
3,039,000
3,112,000
3,187,000
3,264,000
14,581,000
No. of syringes required for IM injections ADS_0.5ml
4,568,000
4,915,000
8,136,000
8,331,000
8,531,000
8,736,000
38,649,000

27
Syringes 2ml for dilution BCG/Hib Sdilution_2ml 118,350 94,650 102,200 104,650
107,200 109,750 518,450
Syringes 5ml for dilution Msls/YF Sdilution_5ml 224,200 239,800 243,400 249,400
255,200 261,400
1,249,200
Syringes 5ml for dilution Msls/YF RUPF_Sdilution_5ml 115,400 119,000 272,900 249,300
317,200 261,400
1,219,800
Safety boxes SB_5l 81,000 85,000 130,000 133,000
136,000 139,000 623,000
2.10 Cold Chain Requirement
Adequate cold chain in terms of sufficient storage capacity and effective vaccine distribution at
both facility and stores levels is one of the successes of the EPI Programme. In 2001 when
Ghana planned to introduce the Pentavalent (DPT-HepB+Hib), the cold chain capacity was
expanded by 30% to provide adequate storage space and distribution facilities.
In August 2010 the Government of Ghana with the support of WHO and UNICEF conducted an ‘Effective Vaccine Management Assessment’ in all regions. The objective was to assess the general vaccine management practices and cold chain capacity with the view to using the findings to strengthen the situation in the country. The assessment showed that cold chain capacity at the national level is adequate. The study however showed insufficient cold storage capacity at the regional and district levels. Steps have been taken to address the gaps identified.
Using the WHO logistics planning tool, the existing cold chain capacity and the required capacity for the introduction of the new vaccines have been estimated in the following tables.
2.10.1 Cold Chain Capacity at National Level
The cold chain capacity for both positive and negative storage at the national level is adequate for the entire implementation period of the cMYP (2010 – 2014) and beyond. Below is the cold chain capacity needs assessment for positive storage at the national level.
Table 9: Cold chain capacity and cost for positive storage
Formula 2010 2011 2012 2013 2014 2015
A
Annual positive volume requirement, including new vaccine (specify:__________) (litres)
Sum-product of total vaccine doses
multiplied by packed volume per dose
62,074 litr
45,009 litr
69,916 litr
71,594 litr
70,144 litr
71,821 litr
B Existing net positive cold chain capacity (litres)
# 43,243
litr 43,243
litr 43,243
litr 43,243
litr 43,243
litr 43,243
litr
C
Estimated minimum number of shipments per year required for the actual cold chain capacity
A/B 1.44 1.04 1.62 1.66 1.62 1.66
D Number of consignments / shipments per year
Based on national vaccine shipment
plan 4 4 4 4 4 4
E Gap in litres ((A/D) - B) - 27,725
litr - 31,991
litr - 25,764
litr - 25,344
litr - 25,707
litr - 25,288
litr
F Estimated additional cost of cold chain
US $ $0 $0 $0 $0 $0 $0

28
Table 10: Cold chain capacity needs assessment for positive storage
2010 2011 2012 2013 2014 2015
A Total net cold-chain capacity required for a storage period
Total capacity needed
15,518 litr
11,252 litr
17,479 litr
17,899 litr
17,536 litr
17,955 litr
B Existing net positive cold chain capacity (litres)
Capacity currently available
43,243 litr
43,243 litr
43,243 litr
43,243 litr
43,243 litr
43,243 litr
C Net additional positive capacity installed
Additional capacity 0
litr 0
litr 0
litr 0
litr 0
litr 0
litr
D Total net positive cold-chain capacity available
Total capacity available
43,243 litr
43,243 litr
43,243 litr
43,243 litr
43,243 litr
43,243 litr
With regards to negative cold storage capacity at the national level for polio vaccine the Walk-
in-freezer (WIF) at the national office is capable of providing adequate storage until 2015 where
additional freezing capacity will be required. This is presented in the tables below:
Table 11: Cold Chain capacity and cost for negative
Formula 2010 2011 2012 2013 2014 2015
A
Annual negative volume requirement, including new vaccine (specify:_______) (litres)
Sum-product of total vaccine doses
multiplied by packed volume per dose
12,266 litr
12,928 litr
13,238 litr
13,556 litr
13,882 litr
14,214 litr
B Existing net negative cold chain capacity (litres)
# 6,250
litr 6,250
litr 6,250
litr 6,250
litr 6,250
litr 6,250
litr
C
Estimated minimum number of shipments per year required for the actual cold chain capacity
A/B 1.96 2.07 2.12 2.17 2.22 2.27
D Number of consignments / shipments per year
Based on national vaccine shipment
plan 4 4 4 4 4 4
E Gap in litres ((A/D) - B) - 3,184
litr - 3,018
litr - 2,941
litr - 2,861
litr - 2,780
litr - 2,697
litr
F Estimated additional cost of cold chain
US $ $0 $0 $0 $0 $0 $0

29
Table 12: cold chain capacity need assessment for negative storage
2010 2011 2012 2013 2014 2015
A
Total net cold-chain capacity required for a storage period
Total capacity needed
3,067 litr
3,232 litr
3,310 litr
3,389 litr
3,471 litr
3,554 litr
B
Existing net negative cold chain capacity (litres)
Capacity currently available
6,250 litr
6,250 litr
6,250 litr
6,250 litr
6,250 litr
6,250 litr
C Net additional negative capacity installed
Additional capacity 0
litr 0
litr 0
litr 0
litr 0
litr 0
litr
D Total net negative cold-chain capacity available
Total capacity available
6,250 litr
6,250 litr
6,250 litr
6,250 litr
6,250 litr
6,250 litr
2.10.2 Cold Chain Capacity at Regional Level
The country planned to install walk-in-cold-rooms(WICR) in all ten (10) regions by 2009 using
GAVI Reward for 2007. The reward was however not given to the country and that has delayed
the completion. The Government therefore solicited for support from health partners.
The comprehensive cold chain expansion planned by the Government of Ghana is still ongoing.
Out of the ten (10) regions in Ghana only one (1) region i.e. Greater Accra is not having a walk-
in-cold-room. A site for the construction of the cold has been found and work is about to begin
for them also to have WICR All the nine other regions have had their WICR installed and
functioning. The table below summarizes the cold chain requirement and capacity at the
regional level needed for the introduction for the new vaccines using the WHO Logistics
Forecasting tool with the WICR (Installed and yet to be installed) factored in:
Table 13: Cold chain capacity and cost for Positive Storage at Regional level
AR BAR CR ER GAR NR UER UWR VR WR
Annual positive volume requirement, including new vaccine (specify:__________) (litres)
9,687 litr
4,679 litr
4,321 litr
5,323 litr
8,015 litr
5,062 litr
2,116 litr
1,391 litr
4,305 litr
4,768 litr
Existing net positive cold chain capacity (litres)
10,811 litr
8,108 litr
10,811 litr
8,108 litr
8,108 litr
8,108 litr
8,108 litr
8,108 litr
8,108 litr
8,108 litr

30
Estimated minimum number of shipments per year required for the actual cold chain capacity
0.90 0.58 0.40 0.66 0.99 0.62 0.26 0.17 0.53 0.59
Number of consignments / shipments per year
6 4 4 4 6 6 4 4 4 6
Gap in litres - 9,196
litr - 6,938
litr - 9,731
litr - 6,777
litr - 6,772
litr - 7,264
litr - 7,579
litr - 7,760
litr - 7,032
litr - 7,313
litr
Estimated additional cost of cold chain
$0 $0 $0 $0 $0 $0 $0 $0 $0 $0
Table 14: Cold chain needs assessment for negative storage at Regional level
AR BAR CR ER GAR NR UER UWR VR WR
Annual positive volume requirement, including new vaccine (specify:__________) (litres)
1,914 litr
924 litr
854 litr
1,052 litr
1,584 litr
1,000 litr
418 litr
275 litr
851 litr
942 litr
Existing net positive cold chain capacity (litres)
286 litr
216 litr
391 litr
338 litr
145 litr
6,250 litr
282 litr
282 litr
607 litr
478 litr
Estimated minimum number of shipments per year required for the actual cold chain capacity
6.70 4.28 2.18 3.11 10.92 0.16 1.48 0.97 1.40 1.97
Number of consignments / shipments per year
4 4 4 4 4 4 4 4 4 4
Gap in litres 193
litr 15
litr - 178
litr - 75
litr 251
litr - 6,000
litr - 178
litr - 213
litr - 394
litr - 243
litr
Estimated additional cost of cold chain
$17,153 $8,660 $0 $5,718 $17,153 $0 $0 $0 $0 $0
From table 14, Ashanti, Brong-Ahafo and Greater Accra do not have adequate negative storage
capacity for the introduction. The freezing capacity at Eastern Region will also need to be
improved in order to meet the negative cold chain needs for both routine and campaigns to
ensure successful implementation of the plan. A total of 16 TFW 800 will be required to address
this gap. Greater Accra and Ashanti Regions will required six (6) TFW 800 and two (2) each for
Brong-Ahafo and Eastern Regions.
Cold boxes will be required for transportation of vaccines from the regional level to the service
delivery levels. The procurement of 693 cold boxes was identified as a need at regional, district
and facility levels to facilitate vaccine distribution. The Government through the support of its
partners have procured and distributed 375 cold boxes to the regions within the 1st quarter of
the year. The outstanding gap now stands at 318 as shown in the table below.
Table 15: Additional cold chain equipment required
Regions Cold Boxes Freezers
(TFW 800)

31
Quantity required
as at 2010 Quantity Supplied in
1st Quarter 2011 Gap
Ashanti 139 45 94 6
Brong-Ahafo 65 40 25 2
Central 55 35 20 0
Eastern 69 40 29 2
Greater Accra 120 40 80 6
Northern 67 40 27 0
Upper East 30 30 0 0
Upper West 19 30 - 0
Volta 56 35 21 0
Western 73 40 33
Total 693 375 318 16
2.10.3 Dry storage
There is adequate dry storage capacity at both national and regional levels. With the plan to
install walk-in cold rooms in all the regions, provision is also made to include stores for storing
dry injection materials. This will further improve the dry storage capacity at the regional level.

2.11 Strengths and Weaknesses of the EPI System
Table 16: Strengths and weaknesses of EPI by system components, Ghana, 2010
SYSTEM
COMPONENT STRENGTHS WEAKNESSES
Vaccine supply
and quality
Procurement and distribution
Timely forecast and procurement of vaccines and injection safety
materials through UNICEF
Government of Ghana paying 100% for BCG, OPV, Measles and TT
vaccines, and some injection safety materials
Quarterly distribution plan from national to regions established
Monthly delivery of vaccines and other EPI logistics from regions to
districts and sub-districts
Bundling concept adequately practiced in the country
Stock control system for vaccines and other EPI logistics fully functional
at national level
Vaccine management
Tools for stock control available at all levels
VVM on most vaccines; Multi Dose Vial Policy (MDVP) and Open Vail
Policy (OVP) practiced at all service delivery level.
Vaccine utilization monitoring initiated in sentinel districts in 2004 and
evaluated in June 2007.
National Regulatory Authority (NRA) in place as the Food and Drugs
Board. This is the Body charged with ensuring the registration, lot
release, quality, safety and efficacy of vaccines used in the country. It
also works closely with the National Ethics Committee which oversees
all clinical trials.
- District level data not used for forecasting vaccines and other
logistics.
- Poor documentation on vaccine usage at the district and sub-
district levels
- Constrained transport situation especially at district and service
delivery levels.
- Vaccine potency testing for different levels not being carried
out.
- The Vaccine Utilization Monitoring project stopped after the
evaluation
Logistics Cold Chain
- Increase in logistics base through support from JICA & other partners.
- Irregular cold chain maintenance at all levels.

SYSTEM
COMPONENT STRENGTHS WEAKNESSES
- Existence of cold chain corrective and maintenance teams at national
level with regional equipment managers supporting regions and
districts.
Injection safety and waste management
- Policy, standards and guidelines on injection safety and waste
management available and being implemented
- Committee in place to coordinate injection safety within MOH
- All health facilities (100%) are using AD syringes for immunizations
- Plans are advanced to use AD syringes in all health care service delivery
in the country
- One De Montfort Mark 8a type incinerator in each of the 133 districts.
Construction of new incinerators is in progress in the remaining 37
districts
- Incinerator operators have been trained and provided with protective
gear
- Irregular power and gas supply at district and lower levels
- Inadequate supply of spare parts especially for solar powered
refrigerators.
- Poor use of safety boxes and pits at the health facilities.
- The available incinerators are not sufficient for the service
delivery areas
Service
delivery
- Dropout rate declining but has not reached the acceptable level of less
than 10%. Others also report negative drop outs
- Reduction in morbidity and mortality due to VPDs especially measles,
polio, neonatal tetanus and Hib (Hib meningitis in infants).
- Additional vaccines introduced into EPI without interruption of services.
- Plans to establish burden of pneumonia diseases for the introduction of
pneumococcal vaccine initiated.
- Integration of EPI with other child survival strategies e.g. Vit A
supplementation, deworming, growth monitoring through strategies
such as SOS, SIAs, CHPW and IMCH campaigns etc.
- 22% (36/170) of the districts have DPT3 coverage less than
80% in 2010.
- High attrition rate and inadequate skills among health workers
at service delivery level
- Minimal involvement of the private sector and community in
planning and implementation of services especially
outreaches.
- Poor utilization of data for decision making
Advocacy and
communication
- High community awareness about immunization which has resulted in
increased demand for services
- Inadequate interpersonal communication (IPC) skills among
health workers

SYSTEM
COMPONENT STRENGTHS WEAKNESSES
- High level of political involvement
- Communication strategic plan in place
- Assigned Personnel for communication at national and regional levels
- Involvement of cultural leaders in advocacy
- Community-based volunteers are mobilized for NIDs
- Lack of IEC materials for routine immunization
- Some of the existing IEC materials are not in local languages
- Inadequate audio-visual equipment including film vans
- Most districts do not have EPI communication included in their
district work plans.
- Communication plan not updated since 2005.
Surveillance - Surveillance for AFP, measles, NNT, Paediatric Bacterial Meningitis (PBM),
yellow fever and rotavirus is being implemented within the Integrated
Disease Surveillance and response (IDSR) framework.
- Plan to establish pneumococcal surveillance centers in place
- No wild polio virus has been report in the country since November 2008.
- Case based measles surveillance implemented in all districts
- Functional national polio certification committee (NCC), national polio
expert committee (NPEC) and National Polio Laboratory Containment Task
Force (NTF)
- Case definition guidelines for MOH priority diseases have been developed
- Decline in the non-polio AFP detection rates
- Diphtheria and pertussis not on MOH priority diseases list for
surveillance
- Weak community based surveillance system
- Less than 50% of the districts are carrying out case based NNT
surveillance
Programme
management
Policy, planning and management
- EPI policy updated
- Structures for partner coordination are in place: ICC, NCC, technical
committees with strong collaboration with partners
- Integrated bottom up planning within the districts
- Review meetings held at district and health facilities
- Strong managerial skills at the district level
Supervision
- Integrated supervision plan and checklist at national & district level
- Copies of EPI policy, standards, guidelines and work plans are
not available at all levels
- Adhoc activities disrupt planned activities at national level
- Poor coordination of partners at district level.
- Districts not implementing all planned activities

SYSTEM
COMPONENT STRENGTHS WEAKNESSES
- Feedback provided to all levels on a regular basis
- Technical assistance provided by partners for specific areas.
Operational Research
- Operational research on-going at the national level
- Irregular technical support supervision especially from national
to districts and from regions to health facilities
- Follow up of recommendations from studies not regularly
implemented
Strengthening
human and
institutional
resources
- Human Resource structure/staffing norms available at all levels with
skilled manpower at the implementation level
- Training needs assessment was conducted in 2004 that informed the need
for MLM training at all levels including non EPI staff
- National level trainers for MLM trained
- Regional and district level MLM training done
- EPI content in the pre-service training curriculum reviewed
- Required staff not attained at national, district and health
facility levels
- Staff not trained in logistics
- Planned training not implemented
Sustainable
financing
- Financial Sustainability Plan (FSP) was developed at national level with
involvement of all stakeholders.
- Funds available at district level for implementation of EPI activities
through the Primary Health Care (PHC) conditional grant
GoG consistent with its contribution to the DPT-HepB+Hib vaccine
cost as outlined in the FSP
- Contribution to the programme costs by GoG has been declining
despite the increase in target population and coverage
- Delays in disbursement of funds to the districts.
- Delayed accountability of funds advanced for implementation of
activities at all levels.
Accelerated
Disease
Control
Polio Eradication
- Increasing trends in OPV3 coverage at national level with current
coverage above 80%
- No case of Wild Poliovirus has been detected since November 2008
- Ghana successfully submitted documentation to ARCC in 2007 for polio
free status.
- 22% (36/170) of the districts have OPV3 coverage less than 80%.
- Declining trends of the non-polio AFP rate in some regions.
- National TT2+ coverage among pregnant women still less than
80%.
- Documentation of TT coverage results still a challenge

SYSTEM
COMPONENT STRENGTHS WEAKNESSES
Maternal & Neonatal Tetanus Elimination
- Gradual increase in TT2+ coverage among pregnant women
- Phased implementation TT SIAs targeting women 12 – 49 years in 59 high-
risk districts
Measles Control
- Measles coverage at national level is below 90%.
- Following the under-15 campaigns in 2002, suspected cases of measles
have reduced drastically from about 12130 to 1305 in 2008
- Case based measles surveillance rolled out nationwide.
- Not all districts are reporting suspected measles cases

3 CHAPTER 3: GOALS, OBJECTIVES, KEY ACTIVITIES, INDICATORS AND MILESTONES
3.1 Introduction
The National Immunization Programme is one of the most successful and cost effective
programmes implemented in Ghana. The uniqueness of the NIP has been the innovativeness and
adaptation it has gone through with the support of national and international partners. As a
vertical programme the NIP has successfully transformed itself and integrated within the country’s
decentralized health system. EPI in Ghana aims at protecting every child in Ghana from nine
common childhood diseases; namely, tuberculosis, poliomyelitis, diphtheria, neonatal tetanus,
whooping cough, hepatitis B, haemophilus influenza type b, measles and yellow fever. The
development of immunization in Ghana was very slow in the early 1990s. In the early 2000s, the
delivery was accelerated with the global initiative and support from GAVI. Subsequently with the
introduction of new and underutilized vaccines and sustained NIDs, more children have been
immunized. Greater attention has also been drawn to the importance of the national
immunization programme and its integration with the health systems, gaining overall policy
support.
Immunization continues to be one of the most cost-effective of all child survival health
interventions. Traditionally, immunization has had children and women as the main foci of
attention but recently this is being broadened to include the wider population in line with the
current global immunization vision and strategy (GIVS).
Ghana intends to introduce two new vaccines (Rotavirus and Pneumococcal) and a second dose
for measles.
3.2 Goals, Objectives and strategic components of the cMYP
This comprehensive Multi-Year Plan (cMYP) of Action covers the fiscal years 2010-2014. The
objectives and activities set forth in this Multi-Year Plan provide the framework required to meet
the previously stated goal of reducing infant and child mortality and morbidity associated with
vaccine -preventable diseases (VPD). Further, this Plan addresses new challenges and expands the
previous plan by providing guidelines for the introduction of new vaccines.
3.2.1 Goals of the cMYP
The 2010-2014 cMYP of Ghana aims at achieving five major goals which are within the context of
the goals of GIVS with strategic components as described below:
Goal 1: Reach out and protect more people than being done currently
Goal 2: Rapidly increase immunity to selected VPDs in order to accelerate Reduction of
morbidity and mortality from VPDs
Goal 3: Introduce New & Under-utilized Vaccines
Goal 4: Strengthen surveillance of VPDs
Goal 5: Integrate EPI with other Interventions in the context of Health System Development

38
3.2.2 Objectives of the cMYP
Ghana objectives of the 2010 – 2014 cMYP are linked to the sector objectives (objective 3) and the
efforts for achieving the MDGs. The specific objectives of the National Immunization Programme
are:
Objective 1: Reach everyone targeted for immunization to achieve and sustain by 2014, 94%
coverage in all childhood immunizations and 85% for Tetanus Toxoid for
Pregnant women
Objective 2: Improve communication, advocacy and information dissemination
Objective 3: Strengthen surveillance system
Objective 4: Improve programme management and integration with health systems
3.2.3 Strategies of the cMYP
Ghana will adopt well tested strategies to achieve the stated objectives. These strategies are cross
cutting and will impact on all the objectives.
Strategy 1: Reach every child by strengthening the RED strategy: The Ghana Immunization
Programme has as a primary strategy to ensure that every child in every district
is reached and immunized. This will be achieved through a combination of
routine immunization and NIDs. The routine immunization programme will be
strengthened and supported especially in “hard to reach” areas and regional
capitals. Through advocacy, the CHPS expansion programme will target these
hard to reach areas as a priority and reach them through the establishment of
functional zones.
Strategy 2: Strengthen safe injection practices and waste disposal: The goal is to ensure
that no harm is done to the child, health worker and the community. To achieve
our objectives of quality immunization service delivery, the use of auto-destruct
needles introduced in 1996 will be strengthened and maintained. All districts
will be supported in the use safety boxes and incinerators. As of now, over 133
districts have been provided with incinerators and there are plans to extend this
to the remaining 37 districts and selected large health facilities.
Strategy 3: Achieve vaccine independence through continuous advocacy and mobilization:
Currently, the Government of Ghana (GoG) has increased its contribution to
health to 15% of total government expenditure (2008) and will potentially
increase with the implementation of the NHIS which by law allocates a
percentage of their funds to the MoH. Advantage will be taken of the GAVI
Alliance support through the bridge financing. The comprehensive multi-year
plan by itself is aimed at ensuring sufficient and sustainable immunization

39
programme financing. We will continue to work with health partners and other
stakeholders whilst staff are educated to be more efficient in the use of vaccines
to ensure financial sustainability. Advocacy will continue for effective resource
mobilization to ensure the sustainability of this initiative.
Strategy 4: Ensure Effective Cold Chain and Vaccine Management: To ensure potency of
vaccines from purchase to utilization, adequate cold chain and effective
management are primary. Preventive maintenance will continue to be
promoted. Vaccine storage will also continue to be decentralized with regions
being supported to have cold rooms and human capacity will be improved to
manage the system.
Strategy 5 Ensure quality of service: Capacity will be enhanced through frequent training
on new technologies and refresher training on old ones. These training will be
structured like MLM and on-the-job trainings. Supportive supervision and
monitoring will be strengthened at all levels with feedback provided. Motivation
of staff will be a component to be properly addressed.
Strategy 6: Strengthen Advocacy, Communication and IEC: Strengthen EPI Programme
Communication and advocacy and collaboration with NGOs and other civil
society organizations (CSOs).
Strategy 7: Sustain the benefits of integrated interventions through SIAs: The essence of
campaigns is to reach large proportions of the target population over a very
short period. Immunization campaigns will be carried out as required. Child
Health Promotion Week (CHPW) has now been institutionalized in Ghana as an
annual activity. The week, which is celebrated in the 2nd week of May every year,
will continue to be used to advocate and sensitize the community to demand
child survival services like immunization, Vitamin A supplementation,
deworming and insecticide-treated nets (ITNs) as the minimum package of
services. The last week of April has been also institutionalized as African
Vaccination and will be celebrated every year to create demand for
immunization services.
Strategy 8: Ensure effective and sustainable introduction of new vaccines and
technologies: Ghana successfully introduced the Pentavalent vaccine (DPT-
HepB-Hib) in 2002. A number of new vaccines are now available on the market.
Two new vaccines will be introduced in 2012. These are the pneumococcal and
rotavirus vaccines. In addition, second dose of measles will also be introduced in
2011. Due to the threat of meningitis epidemic which usually affects the
Northern Sector of the country, the Government in collaboration with partners
has decided to introduce a Men A Conjugate vaccine (MenAfriVac) in Northern,

40
Upper East and Upper West Regions starting with a catch-up campaign for age 1
– 29 years to reduce the threat posed by the disease. The vaccine may be
subsequently introduced in the routine schedule for the northern sector of
Ghana.
Strategy 9: Strengthen AEFI surveillance and Integrate EPI surveillance into surveillance of
other diseases (IDSR): Surveillance systems for AFP, measles and MNT will be
strengthened in the context of integrated disease surveillance together with
surveillance for the new vaccines to be introduced. As part of IDSR, surveillance
for VPDs will be strengthened especially at the community level using all
available structures and possible innovations. Institutionalize AEFI surveillance
will also be strengthened.
3.2.4 Causes of problems in the Immunization Programme
Major causes of problems identified include the following
Poor access to services in hard-to-reach districts and most urban centers
Inadequate resources for regular outreach services to island and lake communities located
in and around the Volta Basin. There are 17 districts located in the Volta Basin with over
5,000 communities inhabited by a large number of people who are mainly farmers and
fisher folk
Inadequate health staff to provide services required. Attrition has been a major
contributing factor with most of the field staff leaving for higher studies.
Poor cold chain maintenance and injection safety practices
Weak community involvement and initiatives
Weak supervision from the higher levels to the service delivery points.
Weak VPD surveillance in most regions.
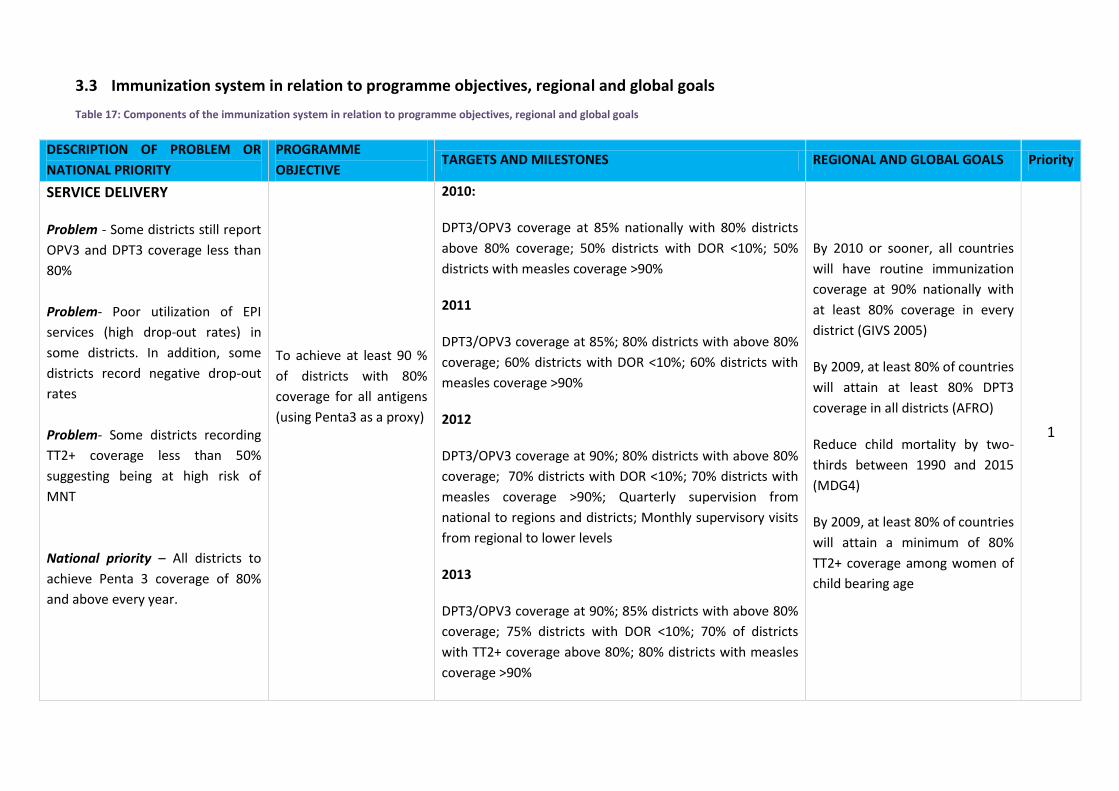
3.3 Immunization system in relation to programme objectives, regional and global goals
Table 17: Components of the immunization system in relation to programme objectives, regional and global goals
DESCRIPTION OF PROBLEM OR
NATIONAL PRIORITY
PROGRAMME
OBJECTIVE TARGETS AND MILESTONES REGIONAL AND GLOBAL GOALS Priority
SERVICE DELIVERY
Problem - Some districts still report
OPV3 and DPT3 coverage less than
80%
Problem- Poor utilization of EPI
services (high drop-out rates) in
some districts. In addition, some
districts record negative drop-out
rates
Problem- Some districts recording
TT2+ coverage less than 50%
suggesting being at high risk of
MNT
National priority – All districts to
achieve Penta 3 coverage of 80%
and above every year.
To achieve at least 90 %
of districts with 80%
coverage for all antigens
(using Penta3 as a proxy)
2010:
DPT3/OPV3 coverage at 85% nationally with 80% districts
above 80% coverage; 50% districts with DOR <10%; 50%
districts with measles coverage >90%
2011
DPT3/OPV3 coverage at 85%; 80% districts with above 80%
coverage; 60% districts with DOR <10%; 60% districts with
measles coverage >90%
2012
DPT3/OPV3 coverage at 90%; 80% districts with above 80%
coverage; 70% districts with DOR <10%; 70% districts with
measles coverage >90%; Quarterly supervision from
national to regions and districts; Monthly supervisory visits
from regional to lower levels
2013
DPT3/OPV3 coverage at 90%; 85% districts with above 80%
coverage; 75% districts with DOR <10%; 70% of districts
with TT2+ coverage above 80%; 80% districts with measles
coverage >90%
By 2010 or sooner, all countries
will have routine immunization
coverage at 90% nationally with
at least 80% coverage in every
district (GIVS 2005)
By 2009, at least 80% of countries
will attain at least 80% DPT3
coverage in all districts (AFRO)
Reduce child mortality by two-
thirds between 1990 and 2015
(MDG4)
By 2009, at least 80% of countries
will attain a minimum of 80%
TT2+ coverage among women of
child bearing age
1
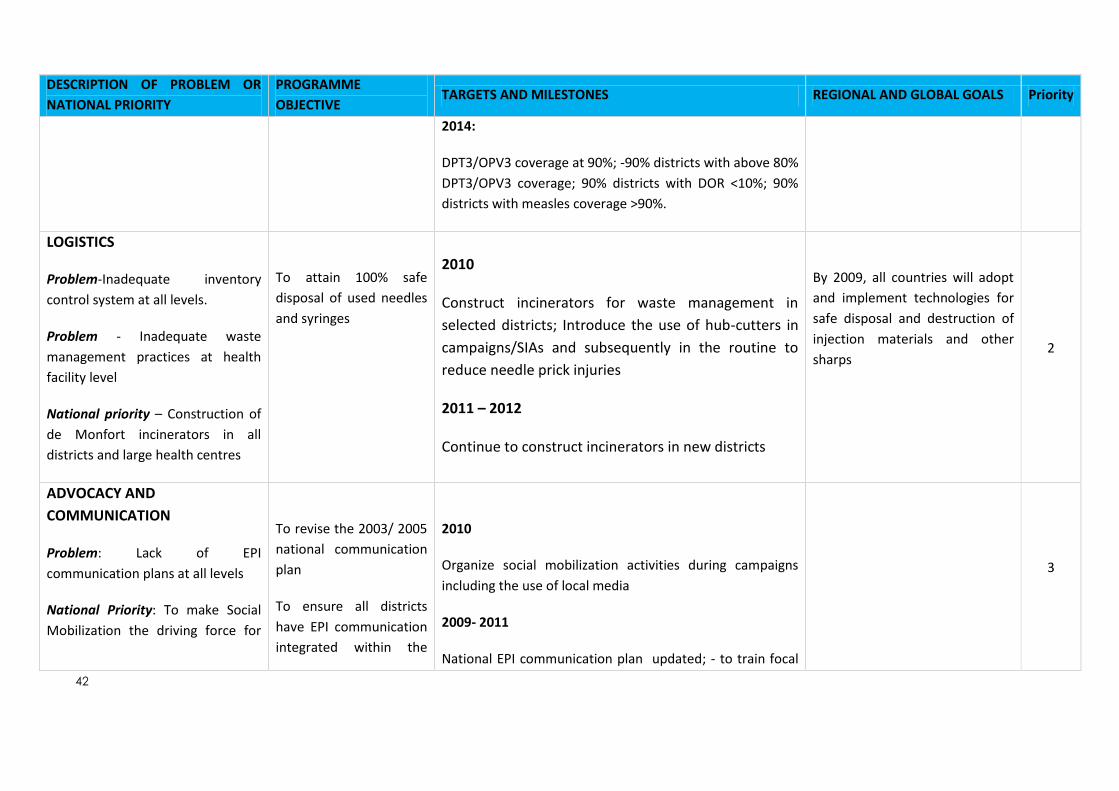
42
DESCRIPTION OF PROBLEM OR
NATIONAL PRIORITY
PROGRAMME
OBJECTIVE TARGETS AND MILESTONES REGIONAL AND GLOBAL GOALS Priority
2014:
DPT3/OPV3 coverage at 90%; -90% districts with above 80%
DPT3/OPV3 coverage; 90% districts with DOR <10%; 90%
districts with measles coverage >90%.
LOGISTICS
Problem-Inadequate inventory
control system at all levels.
Problem - Inadequate waste
management practices at health
facility level
National priority – Construction of
de Monfort incinerators in all
districts and large health centres
To attain 100% safe
disposal of used needles
and syringes
2010
Construct incinerators for waste management in
selected districts; Introduce the use of hub-cutters in
campaigns/SIAs and subsequently in the routine to
reduce needle prick injuries
2011 – 2012
Continue to construct incinerators in new districts
By 2009, all countries will adopt
and implement technologies for
safe disposal and destruction of
injection materials and other
sharps 2
ADVOCACY AND
COMMUNICATION
Problem: Lack of EPI
communication plans at all levels
National Priority: To make Social
Mobilization the driving force for
To revise the 2003/ 2005
national communication
plan
To ensure all districts
have EPI communication
integrated within the
2010
Organize social mobilization activities during campaigns
including the use of local media
2009- 2011
National EPI communication plan updated; - to train focal
3
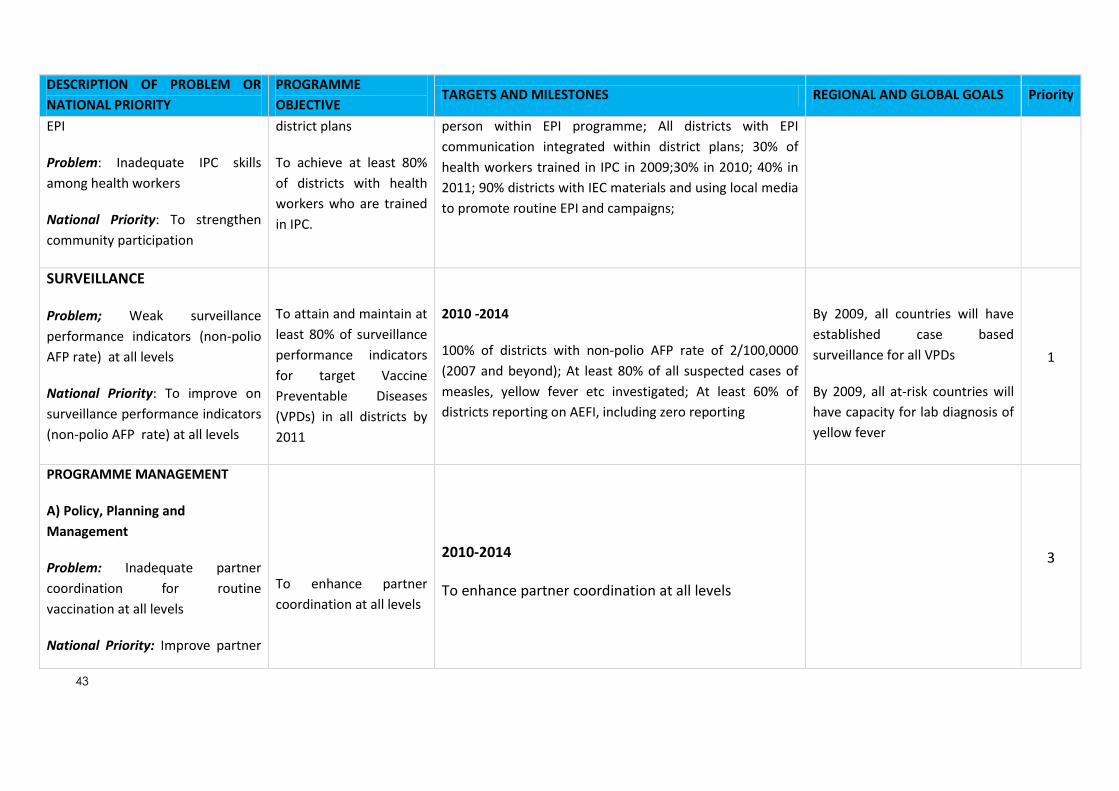
43
DESCRIPTION OF PROBLEM OR
NATIONAL PRIORITY
PROGRAMME
OBJECTIVE TARGETS AND MILESTONES REGIONAL AND GLOBAL GOALS Priority
EPI
Problem: Inadequate IPC skills
among health workers
National Priority: To strengthen
community participation
district plans
To achieve at least 80%
of districts with health
workers who are trained
in IPC.
person within EPI programme; All districts with EPI
communication integrated within district plans; 30% of
health workers trained in IPC in 2009;30% in 2010; 40% in
2011; 90% districts with IEC materials and using local media
to promote routine EPI and campaigns;
SURVEILLANCE
Problem; Weak surveillance
performance indicators (non-polio
AFP rate) at all levels
National Priority: To improve on
surveillance performance indicators
(non-polio AFP rate) at all levels
To attain and maintain at
least 80% of surveillance
performance indicators
for target Vaccine
Preventable Diseases
(VPDs) in all districts by
2011
2010 -2014
100% of districts with non-polio AFP rate of 2/100,0000
(2007 and beyond); At least 80% of all suspected cases of
measles, yellow fever etc investigated; At least 60% of
districts reporting on AEFI, including zero reporting
By 2009, all countries will have
established case based
surveillance for all VPDs
By 2009, all at-risk countries will
have capacity for lab diagnosis of
yellow fever
1
PROGRAMME MANAGEMENT
A) Policy, Planning and
Management
Problem: Inadequate partner
coordination for routine
vaccination at all levels
National Priority: Improve partner
To enhance partner
coordination at all levels
2010-2014
To enhance partner coordination at all levels
3
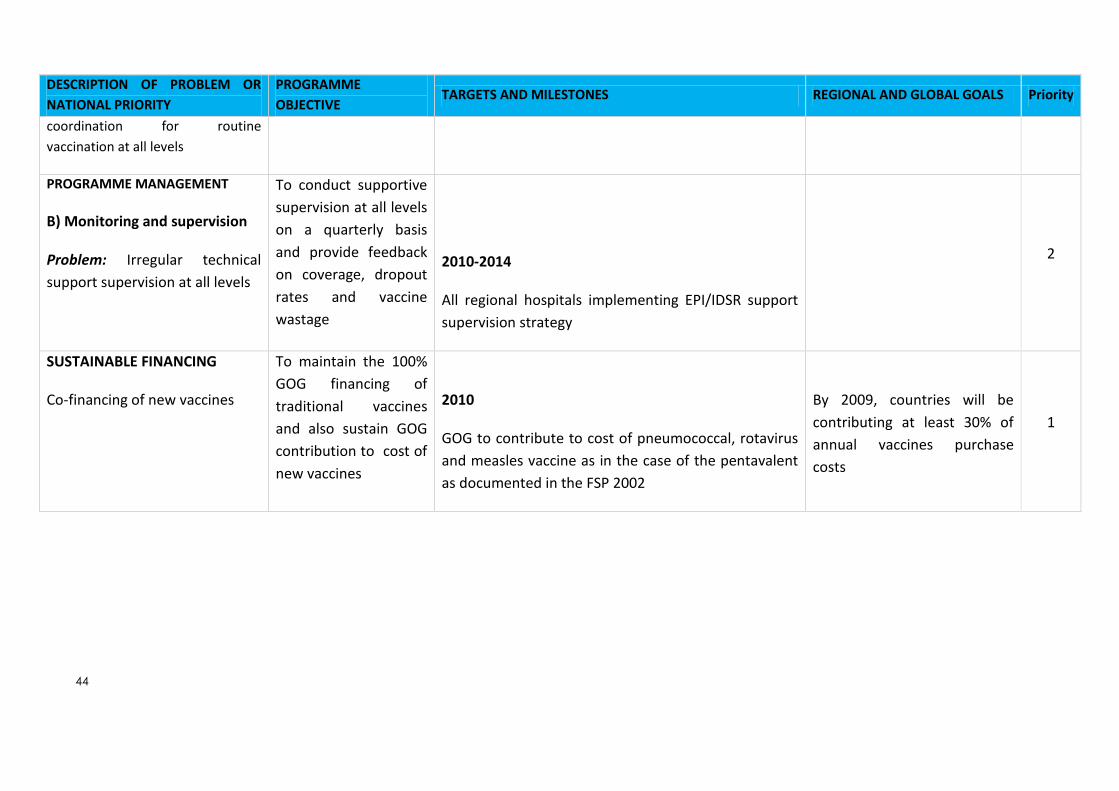
44
DESCRIPTION OF PROBLEM OR
NATIONAL PRIORITY
PROGRAMME
OBJECTIVE TARGETS AND MILESTONES REGIONAL AND GLOBAL GOALS Priority
coordination for routine
vaccination at all levels
PROGRAMME MANAGEMENT
B) Monitoring and supervision
Problem: Irregular technical
support supervision at all levels
To conduct supportive
supervision at all levels
on a quarterly basis
and provide feedback
on coverage, dropout
rates and vaccine
wastage
2010-2014
All regional hospitals implementing EPI/IDSR support
supervision strategy
2
SUSTAINABLE FINANCING
Co-financing of new vaccines
To maintain the 100%
GOG financing of
traditional vaccines
and also sustain GOG
contribution to cost of
new vaccines
2010
GOG to contribute to cost of pneumococcal, rotavirus
and measles vaccine as in the case of the pentavalent
as documented in the FSP 2002
By 2009, countries will be
contributing at least 30% of
annual vaccines purchase
costs
1

45
3.4 Strategies, Key Activities and Timeline (By System Components)
Table 18: Strategies, Key activities and timeline
PROGRAMME OBJECTIVE STRATEGY KEY ACTIVITIES TIME LINE
2010 2011 2012 2013 2014
Service delivery
1. To achieve at least 90 % of
districts with 80% coverage
for all routine childhood
antigens (using DPT3 as a
measure)
2. To achieve at least 90% of
districts with a drop-out
rate of less than 10%.
3. To achieve at least 80% of
districts with 80% TT 2+ for
pregnant women
4. To promote integration of
child survival activities
within the minimum health
care package
Infant vaccination
Build capacity at district
level to implement RED/
REC strategies
Strengthening delivery of
outreaches with emphasis
on integrated outreaches
Drop out monitoring and
introduce strategies for
tracing defaulters
Strengthen integration of
ANC with TT immunization
Nationwide introduction of
school based TT
immunization
- Conduct joint/ integrated micro planning with involvement of the community
- Provide and distribute relevant
documents/charts for RED
implementation.
- Carry out Pulse (mop-up)
immunization in poorly performing
sub counties in every district
- Conduct registration and defaulter
tracing of target children
- Develop guidelines for micro
planning/ mapping to ensure all ANC
services provide TT immunization
- Work with RH to review strategies for
improved ANC attendance
- Set up a coordinating committee with
Ministry of Education & develop an
implementation strategy for school
based TT immunization
X
X
X
X
X
X
X
X
X
X
X
X
X
X
X
X
X
X
X
X
X
X
X

46
PROGRAMME OBJECTIVE STRATEGY KEY ACTIVITIES TIME LINE
2010 2011 2012 2013 2014
Logistics
1. To ensure availability of
logistics data and
information at all levels
2. To strengthen the transport
fleet for delivery of EPI
services
3. To review and develop a
new strategy for
distribution of vaccines and
supplies from national level
to districts and within
districts in view of
decentralization
4. To maintain universal usage
of ADs for routine
immunization
5. To attain 100% safe
disposal of used needles
and syringes
Establish an effective and
efficient logistics
management information
system to maintain full
supply of standard EPI
commodities at all levels.
To expand and maintain an
efficient transport fleet for
EPI operations at national
level
Establish a vaccine and
supplies distribution
system from central level
to districts and within
districts
To maintain the bundling
system strategy
To collaborate with MOH
infrastructure and clinical
divisions, and partners to
ensure adequate injection
safety and waste
management practices at
all levels
- Design and implement the LMIS at all
levels
- Conduct a comprehensive inventory
for all EPI equipment at all levels
- Procure and maintain field vehicles,
trucks, and motorcycles and bicycles in
line with expanding administrative
levels and transport replacement plan
- Implement vaccine and supplies
distribution system from central level
to districts and within districts
- Construct and expand storage space
at the regional and district levels
- Provide adequate safe injection
related materials on a regular basis
- Work with Estate Management Unit of
Ghana Health Service to construct
incinerators and disposal pits
X
X
X
X
X
X
X
X
X
X
X
X
X
X
X
X
X
X
X
X
X
X
X
X
X
X
X
X

47
PROGRAMME OBJECTIVE STRATEGY KEY ACTIVITIES TIME LINE
2010 2011 2012 2013 2014
Vaccine supply and quality
1. To strengthen the existing
national capacity for
vaccine regulation and
quality control
2. To ensure that 100% of
static units have functional
cold chain equipment
(including newly
established static units)
3. To develop and implement
a cost effective cold chain
energy utilization source.
4. To maintain zero tolerance
of stock outs for all vaccines
and related supplies
Collaborate with FDB to
develop standard
guidelines to ensure
vaccine quality
To establish a cold chain
equipment inventory
monitoring system
To establish a cost
effective cold chain energy
source
Build capacity for vaccine
management at all levels
- Work with FDB to build capacity for
vaccine regulation
- Support FDB to conduct regular
vaccine potency testing at the lower
levels
- Conduct physical inventory for all cold
chain equipment countrywide
- Procure cold chain equipment, spare
parts and workshop consumables
- Support regional and district teams to
carry out routine and timely
maintenance and repair of equipment
- Forecast and procure adequate
vaccines in a timely manner
- Timely delivery of EPI vaccines and
other logistics at all levels
- Expand vaccine utilization monitoring
for all antigens at all levels in all
districts.
- Conduct vaccine management
assessment in selected districts
X
X
X
X
X
X
X
X
X
X
X
X
X
X
X
X
X
X
X
X
X
X
X
X
X
X
X
X
X
X
X
X
X
X
X
X

48
PROGRAMME OBJECTIVE STRATEGY KEY ACTIVITIES TIME LINE
2010 2011 2012 2013 2014
Advocacy and communication
1. To ensure all districts have
EPI communication
integrated within the
district plans
2. To achieve at least 80% of
districts with health
workers who are trained in
IPC.
3. To strengthen advocacy for
EPI at all levels
Participate in annual
district planning
Capacity building for
communication for EPI
Institutionalize health
worker - community
dialogue meetings
Communication for
behavior change
Involvement of religious
and cultural leaders and
civil societies in advocating
for EPI
Building partnerships with
the media for EPI activities
Enhance school
involvement in EPI
activities
- Attend annual regional planning
workshops
- Training of health workers in IPC
- Sensitization of parish mobilisers,
Community Development Assistants,
religious, cultural and civil societies in
EPI
- Development of IEC materials and
messages
- Scale up Community Problem Solving
and Strategy development
- Monitoring of communication activities
at all levels and providing feedback
- Feedback meetings
- Orientation/sensitization of
broadcasters, reporters and managers
- Develop guidelines on EPI for essay
competition and drama in schools
X
X
X
X
X
X
X
X
X
X
X
X
X
X
X
X
X
X
X
X
X
X
X
X
X
X
X
X
X
X
X
X
X

49
PROGRAMME OBJECTIVE STRATEGY KEY ACTIVITIES TIME LINE
2010 2011 2012 2013 2014
Surveillance
1. To attain and maintain at
least 80% of surveillance
performance indicators for
VPDs in all districts
Provide focused support to
districts to
achieve/maintain AFP
certification level
indicators.
Documentation of polio-
free certification
Capacity building for
surveillance of EPI target
diseases within the IDSR
framework
Monitor for action using
reliable data
- Support surveillance activities (Field
case search, specimen shipment and
STOP team missions) in districts.
- Support NCC, NPEC and NTF
- Support to the laboratory to maintain
accreditation
- Training and sensitization of pre-
service training tutors lecturers and in-
service health workers in disease
surveillance
- Print and disseminate relevant
documents for surveillance of EPI
target diseases
X
X
X
X
X
X
X
X
X
X
X
X
X
X
X
PROGRAMME MANAGEMENT
A) Policy, planning and
management
To disseminate the EPI
policy
To avail the EPI policy to all
service points
To strengthen partner
coordination at district
- To finalize, print and distribute EPI
policy to all service points
- To develop guidelines for partner
coordination at district level (with
X
X
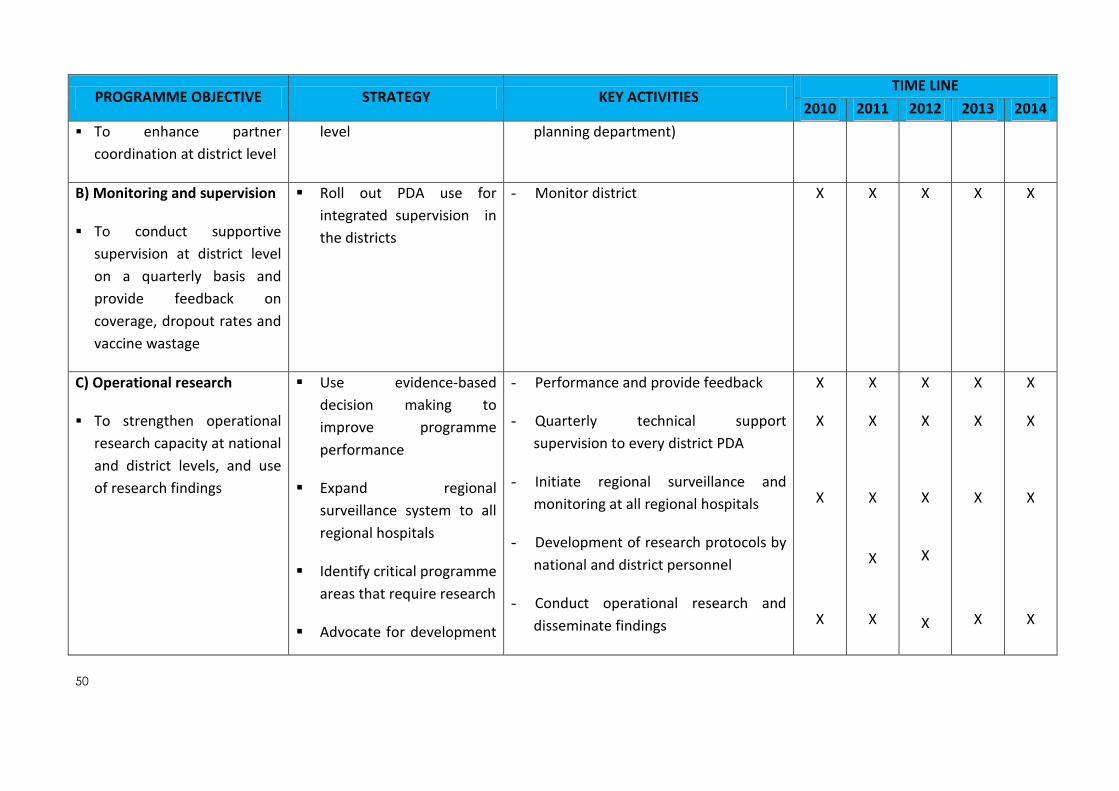
50
PROGRAMME OBJECTIVE STRATEGY KEY ACTIVITIES TIME LINE
2010 2011 2012 2013 2014
To enhance partner
coordination at district level
level planning department)
B) Monitoring and supervision
To conduct supportive
supervision at district level
on a quarterly basis and
provide feedback on
coverage, dropout rates and
vaccine wastage
Roll out PDA use for
integrated supervision in
the districts
- Monitor district
X X X X X
C) Operational research
To strengthen operational
research capacity at national
and district levels, and use
of research findings
Use evidence-based
decision making to
improve programme
performance
Expand regional
surveillance system to all
regional hospitals
Identify critical programme
areas that require research
Advocate for development
- Performance and provide feedback
- Quarterly technical support
supervision to every district PDA
- Initiate regional surveillance and
monitoring at all regional hospitals
- Development of research protocols by
national and district personnel
- Conduct operational research and
disseminate findings
X
X
X
X
X
X
X
X
X
X
X
X
X
X
X
X
X
X
X
X
X
X

51
PROGRAMME OBJECTIVE STRATEGY KEY ACTIVITIES TIME LINE
2010 2011 2012 2013 2014
of research protocols
Resource mobilization for
research
Publication of findings
Strengthening human resource
and institutional capacity
To build capacity for pre and
in-service health workers at
national and district levels
To advocate for
establishment of key EPI
positions at national and
district levels
Equip pre- and in-service
health workers and mid-
level managers with
knowledge, skills and
competencies in EPI
service delivery.
Dialogue with the relevant
key stakeholders at MOH
and Ministry of public
Service
- Review and update the EPI training
manuals and reference materials
- Work with the Ministry of Education
to update the pre-service health-
training curriculum.
- Revise pre-service institution
curriculum to include updates on EPI
- Training health tutors in EPI.
- Conduct EPI MLM training.
- Work with HRD to streamline/
mainstream EPI training with the MOH
training policy
- Determine key unfilled positions at
national and district level, develop
X
X
X
X
X
X
X
X
X
X
X
X
X
X
X
X
X
X
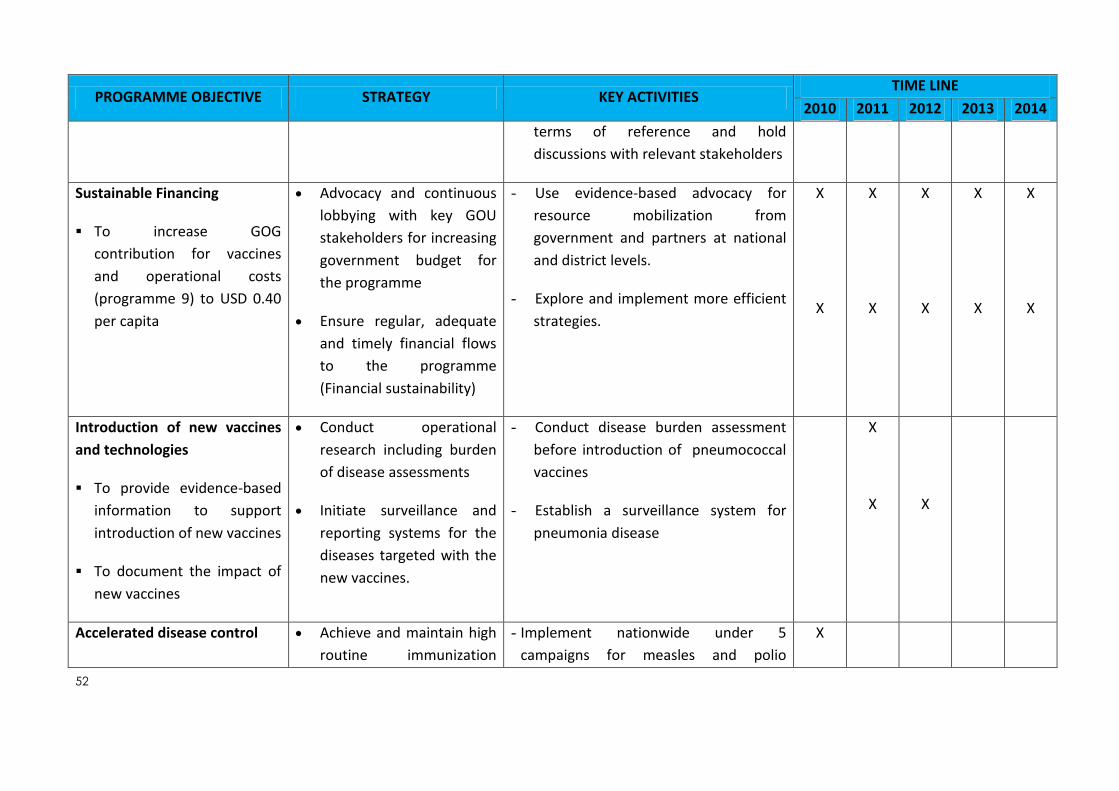
52
PROGRAMME OBJECTIVE STRATEGY KEY ACTIVITIES TIME LINE
2010 2011 2012 2013 2014
terms of reference and hold
discussions with relevant stakeholders
Sustainable Financing
To increase GOG
contribution for vaccines
and operational costs
(programme 9) to USD 0.40
per capita
Advocacy and continuous
lobbying with key GOU
stakeholders for increasing
government budget for
the programme
Ensure regular, adequate
and timely financial flows
to the programme
(Financial sustainability)
- Use evidence-based advocacy for
resource mobilization from
government and partners at national
and district levels.
- Explore and implement more efficient
strategies.
X
X
X
X
X
X
X
X
X
X
Introduction of new vaccines
and technologies
To provide evidence-based
information to support
introduction of new vaccines
To document the impact of
new vaccines
Conduct operational
research including burden
of disease assessments
Initiate surveillance and
reporting systems for the
diseases targeted with the
new vaccines.
- Conduct disease burden assessment
before introduction of pneumococcal
vaccines
- Establish a surveillance system for
pneumonia disease
X
X
X
Accelerated disease control Achieve and maintain high
routine immunization
- Implement nationwide under 5
campaigns for measles and polio
X

53
PROGRAMME OBJECTIVE STRATEGY KEY ACTIVITIES TIME LINE
2010 2011 2012 2013 2014
To achieve standard
performance indicators for
polio eradication
To attain measles
elimination by 2010
To eliminate NNT by 2010
coverage for OPV, measles
and TT vaccines
Conduct supplemental
immunization activities
Strengthen disease
surveillance for AFP,
measles and NNT
integrated with other child survival
interventions.
- Evaluate measles control plan, 2002-
2006
- Develop measles control plan 2011-2015
- Conduct national documentation of
polio free status.
- Conduct NNT risk assessment
- Implement TT campaigns in high risk
districts.
- Introduce TT in lower primary schools to
sustain elimination
- Conduct LQA for MNT elimination
X
X
X
X
X
X
X
X
X
X
X
X
X
X
X
X
X

54
4 CHAPTER 4: COSTING, FINANCING AND FINANCING GAPS
4.1 Costing
This section presents the budget, financing and financing gap analysis for the immunization
programme based on the expected activities to be carried out. The methodology is based on
deriving costs of different programme inputs (such as personnel, vehicles needed, and vaccines
e.t.c) and activities to be carried out (such as review meetings, trainings, e.t.c). These data are
entered in a pre-designed costing, financing and gap analysis tool for cMYP designed by WHO.
4.2 Macroeconomic Analysis
The Ghana Statistical Service estimated the country’s GDP at US$31,548.4 million and population
at 23.233 million thereby making GDP per capita US$1,303 and it is estimated to grow to about
$1,517 in 2014. Similarly total health expenditure per capita is expected to grow from $56 to $79
by 2014. These are presented in the table 19 below:
Table 19: Micro-economic Indicators
Microeconomic Indicators 2010 2011 2012 2013 2014
Per Capita GDP ($) 1,302.39 1,341.08 1,403.21 1,461.69 1,516.65
Total Health Expenditure per Capita ($)
56 61 68 73 79
Population 24,233,431 24,804,793 25,400,108 26,009,711 26,633,944
GDP ($) million 31,548.4 33,265.19 35641.6 38,018.02 40394.44
Total Health Expenditure ($) 1,346,962,957 1,513,775,200 1,715,580,797 1,900,751,174 2,095,360,971
Government Health Expenditure ($)
202,044,446 272,479,536 343,116,159 475,187,794 628,608,291
Source: Budget statement 2010 (MoFEP), National Accounts Rebase 2010 (GSS), Housing and Population Census 2010 (GSS) and Estimation
based on initial sources
4.3 Total Immunization Cost
The total cost of the National Immunization programme for the five years is about $175.7m. The
cost of vaccines and logistics will cost about $140.4m representing 80% of total projected
expenditure for the five years. Supplemental immunization for the five years is $30.3m (17.2%)
whilst health system cost represents 0.07%.
Table 20: Total Cost for Immunization
cMYP Component 2010 2011 2012 2013 2014 2015 Total 2011 -
2015
US$ US$ US$ US$ US$ US$ US$
Vaccine Supply and Logistics $35,504 $12,339,339 $28,890,212 $28,641,877 $33,632,025 $36,949,560 $140,453,012
Service Delivery $143,226 $280,713 $328,464 $384,124 $343,963 $275,056 $1,612,320
Advocacy and Communication $0 $0 $156,060 $159,181 $108,243 $110,408 $533,892
Monitoring and Disease Surveillance $0 $0 $208,080 $212,242 $270,608 $331,224 $1,022,154
Programme Management $0 $0 $364,140 $371,423 $487,094 $386,428 $1,609,086
Supplemental Immunization Activities $1,799,126 $8,017,402 $7,024,567 $12,644,584 $2,677,243 $0 $30,363,796
Shared Health Systems Costs $22,846 $23,303 $23,769 $24,244 $24,729 $25,224 $121,268
GRAND TOTAL $2,000,701 $20,660,756 $36,995,291 $42,437,675 $37,543,905 $38,077,900 $175,715,528

55
4.4 Routine Immunization
Total routine immunization cost for the five years is $278.5m. The cost of vaccines alone is
134.1m. The total cost for traditional and underused vaccines is 63.7m while that of new vaccines
is 70.3m. The cost of injection supplies for the period 2011-2015 is about $5.4m.
Table 21: Routine Recurrent Cost
Cost Category 2010 2011 2012 2013 2014 2015
Total 2011 - 2015
Routine Recurrent Cost US$ US$ US$ US$ US$ US$ US$
Vaccines (routine vaccines only) $0 $11,578,677 $27,720,337 $27,323,957 $32,173,055 $35,377,620 $134,173,645
Traditional $0 $1,816,846 $2,500,137 $2,691,110 $2,063,724 $2,305,426 $11,377,244
Underused $0 $9,761,831 $8,974,489 $10,025,752 $11,200,586 $12,513,979 $52,476,638
New $0 $0 $16,245,711 $14,607,095 $18,908,744 $20,558,214 $70,319,764
Injection supplies $0 $608,267 $1,014,120 $1,132,944 $1,265,700 $1,414,003 $5,435,033
Personnel $74,585 $76,076 $77,598 $79,150 $80,733 $82,347 $395,904
Transportation $68,641 $204,637 $250,866 $304,975 $263,230 $192,709 $1,216,416
Maintenance and overhead $0 $0 $312 $955 $1,624 $1,656 $4,547
Short-term training $0 $0 $208,080 $212,242 $324,730 $220,816 $965,867
IEC/social mobilization $0 $0 $156,060 $159,181 $108,243 $110,408 $533,892
Disease surveillance $0 $0 $208,080 $212,242 $270,608 $331,224 $1,022,154
Programme management $0 $0 $156,060 $159,181 $162,365 $165,612 $643,218
Subtotal $143,226 $24,046,334 $57,511,849 $56,908,784 $66,823,341 $73,274,015 $278,564,323
4.5 Supplemental Immunization
The cost of supplemental immunization activities over the five year period is $31.6m. Polio
campaigns will be conducted throughout the period. Measles campaign will take place in 2010
whilst Measles/Rubella campaign will come off in 2013. Yellow Fever campaign is scheduled to
take place in 2011 and 2012. Meningitis campaign for the three regions in northern sector will be
held in 2012.
Table 22: Cost of Campaign
Campaign Costs 2010 2011 2012 2013 2014 Total
Polio 0 1,920,144 2,145,210 2,396,442 2,677,243 9,139,040
Measles 1,403,348 0 0 0 2,314,727 2,314,727
Yellow Fever 0 5,501,690 1,730,880 0 0 7,232,571
Men A 0 0 2,681,275 0 0 2,681,275
Measles/Rubella
10,248,142
10,248,142
Subtotal 1,403,348 7,421,835 6,557,365 12,644,584 4,991,970
31,615,755

56
Cost by Strategy
Ghana will continue to use routine immunization as the main delivery strategy for immunization.
This will be supplemented by outreach and mobile strategy. Supplemental campaigns will be used
when necessary.
Figure 6: Cost by Strategy
4.6 Financing and Financial Sustainability Strategies
Traditionally the health sector has been financed from three major sources namely;
Government of Ghana (GoG)
Household or Internally Generated Funds (IGF) and
Donor funds (Sector Budget Support and earmarked funding from multilateral, bilateral, UN, and Global Health Initiatives)
Government of Ghana (GoG)
The Government of Ghana through the Ministry of Financing has been the main source of funding
to the public health sector. Government funding comes from tax revenues and covers all the four
areas of public expenditure (personal emoluments, administrative expenses, service expenses and
investment expenses). Almost all public health sector workers are government employees and are
paid from funds allocated to the health sector. Currently salaries and allowances remain the major
cost driver and account for over 80% of total GoG public health expenditure. Just like all other
public sector workers, all NIP staff are paid their s salaries and allowances by government.

57
GoG budget for administration and service expenditures are allocated to decentralized cost
centers to be implemented according to their approved plans. Outreach, supervision, training and
monitoring constitutes some of the major activities of the district plans. Major investment
expenditure and procurement items such as vaccines, cold chain equipment are budgeted and
procured centrally at the national levels. Plans and budgets are developed within the framework
of the Medium Term Expenditure Framework (MTEF).
Internally Generated Funds
All public health facilities in Ghana generate revenue from the sale of services. Though the income
generated is part of government revenue, hundred per cent of it is retained by the health facilities
for their use to improve service delivery. Currently health facilities accredited by the National
Health Insurance Authority (NHIA) are reimbursed for services rendered to their clients whilst non
insurance clients purchase service from out of pocket. These funds are used to support
government budgetary allocations in all the four expenditure areas. The use of IGF by facilities is
guided by guidelines developed by the Ministry of Health. Under the Medium Term Expenditure
Framework (MTEF) facilities are obliged to plans and budget for IGF before it can be used.
Donor Funds
This includes both sector budget support and earmarked funds. Sector budget support funds are
fully planned for under the MTEF and support all the expenditure areas except personnel
emolument. Earmarked funds on the hand may support annual budget but are ring-fenced for
specific activities or may not be aligned to the annual budget. Non aligned earmarked funds are
mostly disbursed outside the plan annual budget.
Financing Strategies:
1. Mobilizing Additional Resources
The Global Fund for HIV/AIDS, TB and Malaria and the Global Alliance for Vaccines and
Immunizations (GAVI) has been supporting health systems strengthening initiatives through
rounds of applications. There are other partners who are working increasingly towards the use of
new vaccines and technologies to improve Vaccine preventable diseases (VPDs). The Ministry of
Health will continue to explore the many opportunities within the international community to
mobilize resources to support all the five health system strengthen components. There will be
strong advocacy with evidence of the successes of the NIP to the Government of Ghana through
the Ministry of Finance to increase funding to the health sector. The sector will also work with the
Local Government structures through the District Health Administrations for support from the
Metropolitan, Municipal and District Assemblies (MMDAs). Specific efforts will be made to support
MMDA in advocacy.

58
2. Increase the Reliability of Funding
The government of Ghana is committed to the immunization programme and has shown its
commitment to its funding over the years. The Government through the Ministry of Finance will
be encouraged to improve on the reliability of timely disbursement of funds to the district levels.
As a policy the Ministry of Health is increasing resources to the sub-national level which has been
identified as the action point.

59
5 CHAPTER 5 - MONITORING & EVALUATION
The cMYP provides a comprehensive overview of the National Immunization Programme and is
the document to provide direction and guidance to national and sub-national levels for
incorporation into their annual plans. It is also the documents that will advise national policies in
setting national targets for all immunization indicators. National performance will therefore be
monitored based on the indicators set in the cMYP. The cMYP contain a set of programme and
financial indicators. These indicators will be monitored and feedback provided to policy and
programme managers. Monitoring of the cMYP will be done within the existing health sector
monitoring and reporting framework.
The MoH, it’s Agencies and Development Partners have agreed to a set of national indicators for
monitoring the sector and it includes indicators for monitoring the health of the population at
both governmental and international levels. Data for measuring these indicators are collected
routinely and supplemented with periodic reviews and surveys. The Ministry’s routine process
reports are collated from sub-national levels through to national level. An annual review process is
conducted culminating in a health summit attended by all main stakeholders in health. During the
health summit the report of an independent review of the sector is presented and discussed.
Surveys such as the Maternal Mortality Surveys (MMS), Demographic and Health Surveys (DHS)
and Multiple Indicator Cluster Surveys (MICS) are conducted periodically to provide information
on the health status of the country. Routine monitoring is carried out periodically from national to
sub-national levels to monitor the implementation of programmes and plans.
The NIP will also be assessed through monthly and quarterly reports from the district levels. With
the development of the cMYP, an annual NIP review will be instituted as a forum for bringing
together all relevant stakeholders within the private and public sector including civil society
organizations and NGOs. This review meeting is intended to allow for greater participation of
district level non state sector organizations in information sharing and consensus building.
In addition, a mid and end term evaluation will be organized specifically for the NIP to evaluate
progress and performance in the implementation of to contribute to the performance analysis of
the sector and more specifically provide direction on future investments in the NIP.
5.1 Indicators for monitoring the cMYP
5.1.1 Macroeconomic Indicators
The NIP has been and continues to be one of the health programmes with high government
commitment. The government of Ghana is committed to ensuring that new and underused
vaccines are available to the population for the prevention of all forms of diseases. Total
government commitment also translates into its budget allocation to the health sector. Key
indicators for measuring government commitments to health and to the NIP will be assessed
through a set of macroeconomic indicators.

60
Table 23: Indicators for financial monitoring
GDP Per capita 2010 2011 2012 2013 2014
Government Health Expenditure (GHE) as % of GDP 0.01 0.01 0.01 0.01 0.02
Total Health Expenditure (THE) per capita 54.00 59.00 65.00 70.00 75.00
Total Health Expenditure (THE) as % of GDP 0.06 0.06 0.06 0.06 0.06
Total NIP Expenditure as % of THE 0.37 1.69 2.33 1.92 2.03
Total NIP Expenditure as % of GHE 2.44 9.38 11.64 7.67 6.78
Total NIP Expenditure as % of GDP 0.02 0.09 0.13 0.11 0.12
5.2 Financial Indicators
The NIP will also pay close attention to monitor financial indicators within the cMYP.
5.3 Programme Indicators
The NIP will continue to monitor and report on the coverage of all antigens through the routine
reporting system. The cMYP provides targets for coverage and wastage rates for routine
immunization.
5.4 Surveillance System
The NIP will work with the Surveillance Department to monitor closely the introduction of two
new vaccines in 2011. This will include post introduction monitoring activities. A set of monitoring
indicator swill be used to monitor post implementation activities.


![Thomas' calculus 11º edición [solucionario]](https://img.pdfslide.us/doc/110x75/58ed82a11a28ab241b8b45e1/thomas-calculus-11o-edicion-solucionario.jpg)