Embed Size (px)
Citation preview

Immigration Reform and Citrus Harvest
Mechanization in a World of Uncertainty
Nobuyuki Iwai
Robert D. Emerson
Fritz M. Roka
International Agricultural Trade and Policy Center
Food and Resource Economics Department
University of Florida

Background
Foreign workers in Florida agriculture
According to NAWS data, over 7/8
of hired farm workers were foreign born
over the 1989-2004 period (Walters).
Over 70% of hired farm workers were
unauthorized in 2002-04, increasing
from under 40% in 1989-92 (Walters).
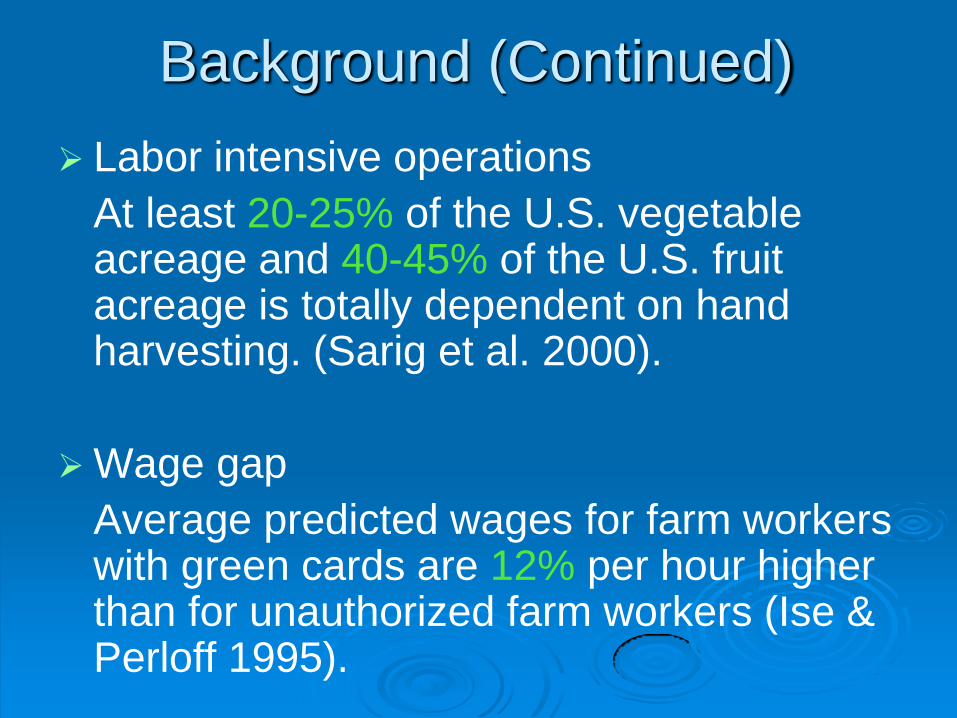
Background (Continued)
Labor intensive operations
At least 20-25% of the U.S. vegetable acreage and 40-45% of the U.S. fruit acreage is totally dependent on hand harvesting. (Sarig et al. 2000).
Wage gap
Average predicted wages for farm workers with green cards are 12% per hour higher than for unauthorized farm workers (Ise & Perloff 1995).

Immigration Policy Reform
Increased border and domestic enforcement, legalization and guest worker programs, E-verify system
Goal: legalize labor force
Concern that the reforms might lead to labor cost increase in US agriculture.
→ Need to study the impact of labor cost increase: Mechanization, Termination (Emerson 2007)

FL Citrus Operations
Concerns about labor availability for harvest.
Other difficulties from recent hurricanes to new
diseases (citrus canker and citrus greening) to
urban encroachment.
Increased international competition for citrus
products: US production of oranges fell by 18%
between the 1980-81 and 2010-11 seasons
while the Brazilian production of oranges
doubled (USDA 1985, 2012).

FL Citrus Operations (Continued)
Florida citrus producers are searching for ways to better compete in the global marketplace. Mechanical harvesting is one of possible ways.
The estimated cost of mechanical harvesting of Florida oranges for juice processing ranges between 10 and 30 cents per 90 pound box less than hand harvesting (Roka).
While an economic advantage appears to be present, the adoption of mechanical harvesting systems remains relatively low at about 7.1% of the Florida orange acreage in 2009-10 (UF).

Objective of Our Study
We measure value of each citrus operation mode
(manual and mechanical harvesting) using the
entity discounted cash flow (DCF) approach
(Copeland 2003, Koller et al. 2005).
First, we generate future sample paths for
unknown yield, price, and costs from which future
FCF will be calculated.
Then, Entity DCF approach discounts the
forecasted free cash flow (FCF) at the opportunity
cost of capital.
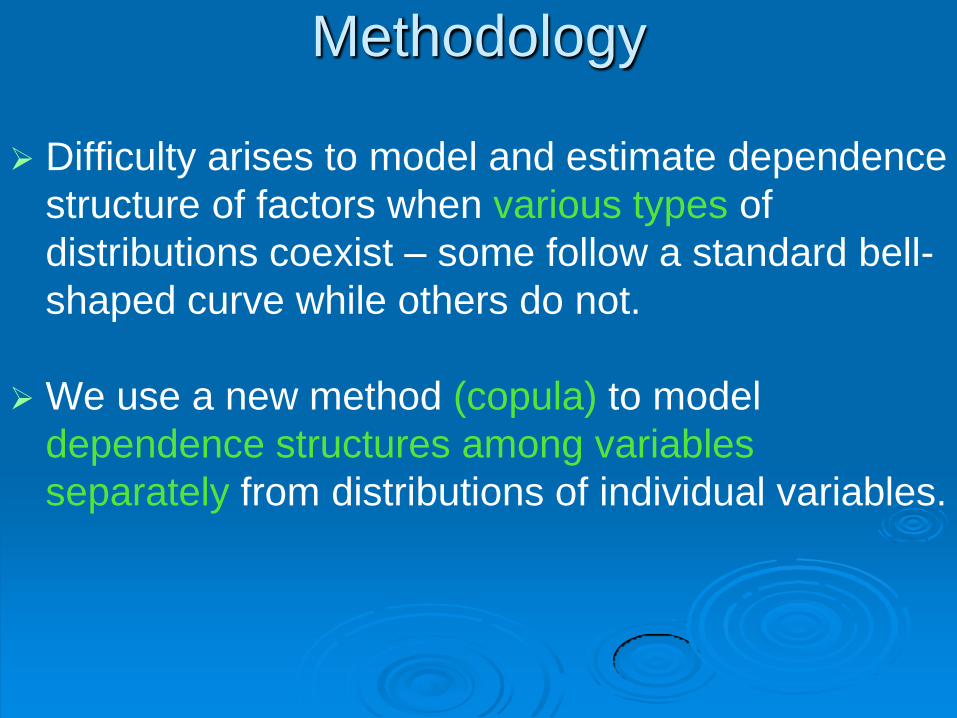
Methodology
Difficulty arises to model and estimate dependence
structure of factors when various types of
distributions coexist – some follow a standard bell-
shaped curve while others do not.
We use a new method (copula) to model
dependence structures among variables
separately from distributions of individual variables.

Data
The primary data source is “Budgeting Costs
and Returns for Southwest Florida Citrus
Production” which is available from 1993-4
season to 2004-5 season (Muraro et al.) and
“Summary of Citrus Budget for the Southwest
Florida Production Region” which is available
from 2003-4 season to 2010-11 season
(Muraro).

Data (Continued)
Extend citrus yield and price series using the
market data. So, we have yield and delivered-in
price from 1979-80 to 2010-11 season, and
production costs and harvesting costs from 1993-4
season to 2010-11 season for Hamlin orange
growers in Southwest FL.
Southwest FL has become a major citrus
production area representing 145,879 acres, over
26.9% of total FL citrus acreage in 2010-11 (USDA
2012). Furthermore, more than 90% of the
mechanically harvested acreage is in southwest FL.

Estimated Historical FCF
Season 2007-8 2008-9 2009-10 2010-11
Revenue 3,545.14 3,265.61 3,135.23 3,297.74
Production costs 1,486.47 1,300.04 1,285.36 1,323.28
Management 48.00 48.00 48.00 48.00
Overhead taxes,
regulatory cost 61.00 61.00 61.00 61.00
Harvesting costs 1,254.36 1,245.30 1,189.43 1,240.26
Depreciation 237.15 237.15 237.15 237.15
FCF 334.96 273.52 229.78 283.70
Estimated historical FCF for growing and harvesting Hamlin
orange for a model farm introduced above ($ per acre)

Forecasting Beyond 2010-11 Season
We estimate the historic time-paths for yield,
price, production costs, and harvest costs.
Appropriate transformations of yield, price,
production and harvest costs are done to
remove time-dependence within each of them
(stationary, random process).
Different distributions of yield, price, production
and harvest costs are identified from past data.

Citrus Data Implications for Modeling
Yield, price, production and harvest costs do
not all follow a bell-shaped curve distribution, so
standard procedures cannot model the
dependence among them.
We also have strong negative correlation
between yield and price and weak positive
correlation between the two cost series.
Leads us to the new (copula) method for
modeling the data.

Monte Carlo Simulation
Using the estimated model, a twelve-year
future sample path is generated for yield, price,
and production and harvest costs.
We repeat it and generate 100,000 sets of the
future paths of yield, price, and production and
harvest costs from which we calculate
100,000 sets of twelve-year future FCF paths
for the current operation. The average of
generated FCF is given next.
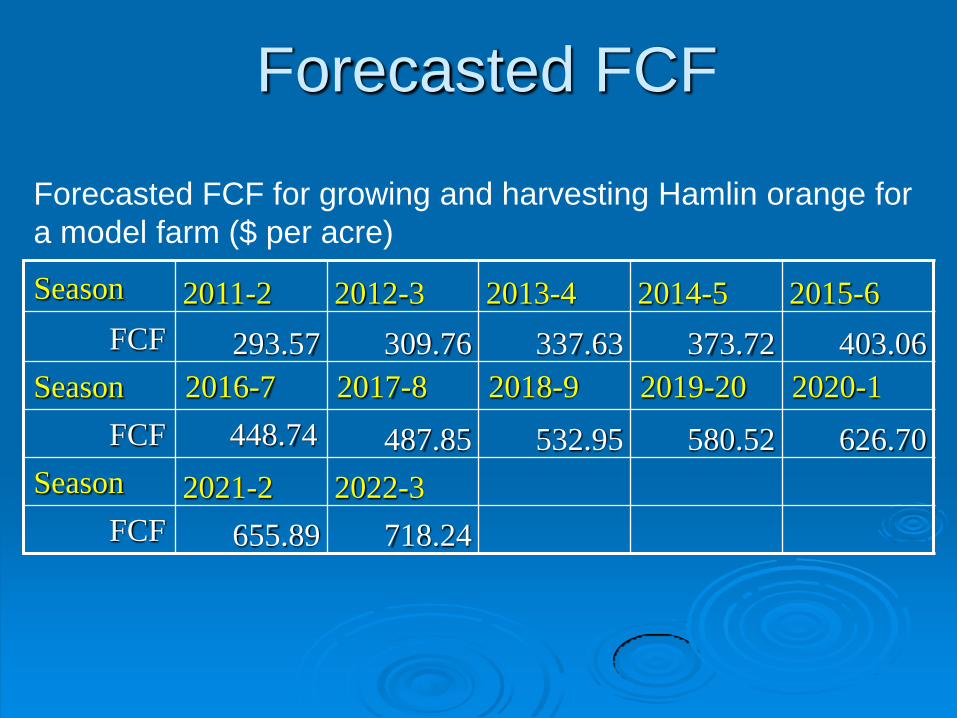
Forecasted FCF
Forecasted FCF for growing and harvesting Hamlin orange for
a model farm ($ per acre)
Season 2011-2 2012-3 2013-4 2014-5 2015-6
FCF 293.57 309.76 337.63 373.72 403.06
Season 2016-7 2017-8 2018-9 2019-20 2020-1
FCF 448.74 487.85 532.95 580.52 626.70
Season 2021-2 2022-3
FCF 655.89 718.24

Weighted Average Cost of Capital
where kd is the pretax cost of debt, T is effective tax rate, D is
the value of interest-bearing debt, and E is the value of equity,
and ke is the market-determined opportunity cost of equity
capital.
From market data we have kd=9.03%, T=26.89%,
D/(D+E)=33.33%, and ke=12.71% from CAPM, so that
WACC=10.67%.
ED
Ek
ED
DTkWACC ed
)1(
Since FCF are available for payment to both creditors and
equity holders, the discount rate must be a weighted
average costs of both sources of capital (Koller et al. 2005).
WACC is given by

PV Calculation
PV for year t for t<2022 is given as
where the second term is continuing value after the
explicit forecast period in which g is the expected
growth rate in FCF in perpetuity.
gWACCWACC
FCFEg
WACC
FCFEPV
tt
tt
2022
20222022
1 )1(
1
)1(

PV Calculation (Continued)
PV from growing and harvesting Hamlin orange for a model farm
($ per acre)
Season 2010-11 2011-2 2012-3 2013-4 2014-5
PV
(std. error) 8,666.84
(74.56)
9,298.29
(81.82 )
9,980.93
(89.05)
10,708.57
(96.37)
11,477.78
(103.60)
Season 2015-6 2016-7 2017-18 2018-19 2019-20
PV
(std. error)
12,299.74
(109.28)
13,163.75
(114.82) 14,080.86
(120.33)
15,050.76
(125.56)
16,076.60
(130.39)
Season 2020-1 2021-2 2022-3
PV
(std. error) 17,165.76
(134.62)
18,341.96
(134.83)
19,581.36
(135.40)
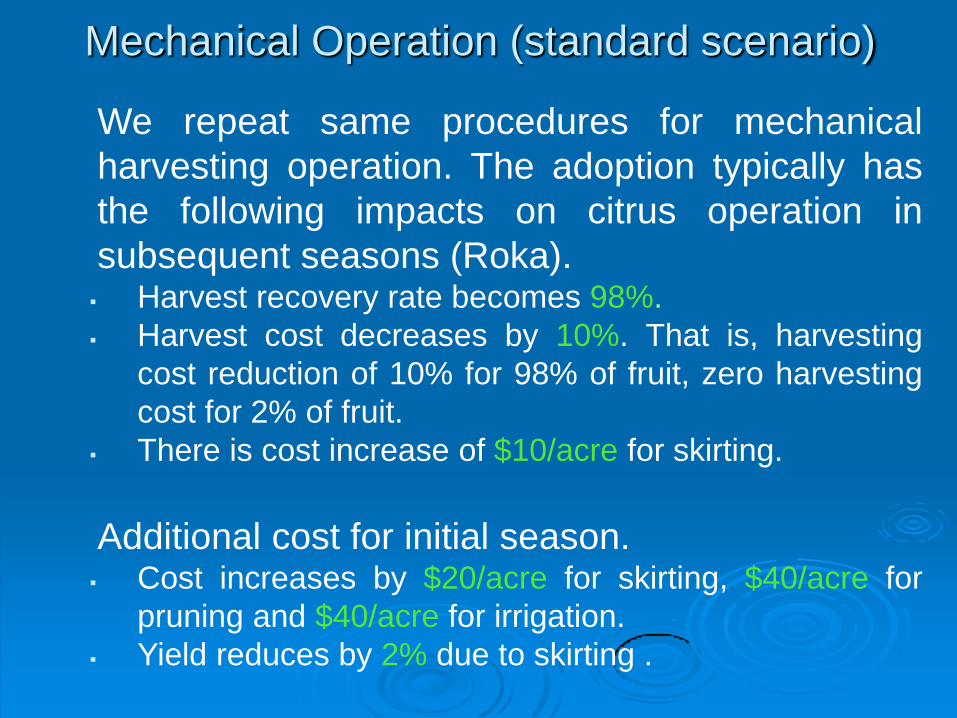
Mechanical Operation (standard scenario)
We repeat same procedures for mechanical
harvesting operation. The adoption typically has
the following impacts on citrus operation in
subsequent seasons (Roka). Harvest recovery rate becomes 98%.
Harvest cost decreases by 10%. That is, harvesting
cost reduction of 10% for 98% of fruit, zero harvesting
cost for 2% of fruit.
There is cost increase of $10/acre for skirting.
Additional cost for initial season. Cost increases by $20/acre for skirting, $40/acre for
pruning and $40/acre for irrigation.
Yield reduces by 2% due to skirting .

FCF and PV for Mechanical Operation
(standard scenario) FCF and PV from growing and harvesting Hamlin orange with
mechanical harvesting ($ per acre)
Season 2010-11 2011-2 2012-3 2013-4 2014-5
FCF 236.53 373.31 404.01 442.65
PV 9,069.48 9,800.94 10,473.68 11,187.53 11,938.92
Season 2015-6 2016-7 2017-8 2018-9 2019-20
FCF 474.54 522.46 564.07 611.56 661.62
PV 12,738.62 13,575.76 14,460.63 15,392.46 16,373.67
Season 2020-1 2021-2 2022-3
FCF 710.31 742.16 806.91
PV 17,410.92 18,527.02 19,697.50
Subtracting hypothetical investment cost of $520, NPV= $8,549.48

Mechanical Operation (lower fruit recovery,
higher cost reduction scenario)
In alternative scenario, adoption of mechanical
harvesting technology has the following impacts
in subsequent seasons (Roka). Harvest recovery rate becomes 90%.
Harvest cost decreases by 20%. That is, harvesting
cost reduction of 20% for 90% of fruit, zero harvesting
cost for 10% of fruit.
There is cost increase of $10/acre for skirting.
Additional cost for initial season. Cost increases by $20/acre for skirting, $40/acre for
pruning and $40/acre for irrigation.
Yield reduces by 2% due to skirting .

FCF and PV for Mechanical Operation (lower fruit
recovery, higher cost reduction scenario)
FCF and PV from growing and harvesting Hamlin orange with
mechanical harvesting ($ per acre)
Season 2010-11 2011-2 2012-3 2013-4 2014-5
FCF 185.17 323.28 352.06 388.36
PV 8,193.38 8,882.69 9,507.46 10,170.13 10,867.23
Season 2015-6 2016-7 2017-8 2018-9 2019-20
FCF 417.85 462.80 502.05 546.73 593.82
PV 11,609.24 12,385.49 13,205.34 14,068.02 14,975.67
Season 2020-21 2021-22 2022-3
FCF 639.57 668.56 729.28
PV 15,934.45 16,966.57 18,048.14
Subtracting hypothetical investment cost of $520, NPV= $7,673.38

Threshold Harvest Cost
We compute through simulation the threshold values of harvest
costs which would equalize NPV of mechanized operations with
PV of the current operation.
Scenario 1 Scenario 2
Harvest costs*
(% increase from
current level)
$1,361.58
(9.78% increase)
$1,672.24
(34.83% increase)
NPVmech = PVmanual $8,183.76 $5,167.05
*We assume the simulated change rate after the current period is same as before.

Conclusions
A new (copula) method was employed to
incorporate the different data patterns for
yield, price, production costs, and harvest
costs.
Using the parameters estimated by the copula
method, sample paths for future FCF are
generated from which PV is calculated for the
current and mechanized operations
respectively.

Conclusions (continued) Entity DCF approach applied for the Hamlin orange
operation in Southwest FL shows that:
hand harvesting operation has the highest PV of
$8,667 followed by the mechanical harvesting with
standard scenario with NPV of $8,549. The
alternative mechanical harvesting (lower recovery,
higher cost reduction) scenario has the lowest NPV
of $7,673.
Threshold values of harvest costs which would
equalize NPV of mechanized operations with PV of
the current operation: 9.78% increase for scenario
1 and 34.83% increase for scenario 2.

Conclusions (continued)
Further consideration is needed about option
value for the investment flexibility (real
options approach) which often suggests
further delay of the investment decision until
a higher cash flow is more likely for the
mechanized operation.

Offer
Seeking growers interested in testing the
software
Please contact us if you would like to
examine the results based on data from
your own operation.
Contacts