Embed Size (px)
Citation preview
IMMIGRATION, PRODUCTIVITY, AND COMPETITIVENESS IN
AMERICAN INDUSTRY
Gordon H. Hanson
UC San Diego and NBER
January 2011
Abstract
In this paper, I examine ongoing research on the economic consequences of immigration
to determine its importance for US competitiveness. By competitiveness, I mean the share of
global demand that is met by US industries. Immigration may affect the market shares of US
firms by making US labor cheaper, by raising the productivity of US factories, or by lowering
the cost of trading with or investing in the rest of the world. Empirical evidence suggests that all
these mechanisms are operative. Immigration (probably) lowers wages for native workers that
compete with immigrants for jobs and also lowers prices of labor-intensive services. At the same
time, it bids up housing prices and increases tax burdens on native income earners. Perhaps the
most underappreciated evidence about immigration is its link to innovation. Immigrants are far
more likely than natives to study science and engineering and more likely to produce innovations
in the form of patents. Expanding the supply of immigration visas for high-skilled workers
increases patenting activity in science and engineering, particularly in US high-tech firms.
Relatively modest changes in US immigration policy could have profound effects on US
competitiveness by redirecting a portion of legal immigration visas toward foreign students with
the potential to be stars in science and engineering. In comparison to other countries, the United
States does well in the global competition for talent. But it could do much better.
1
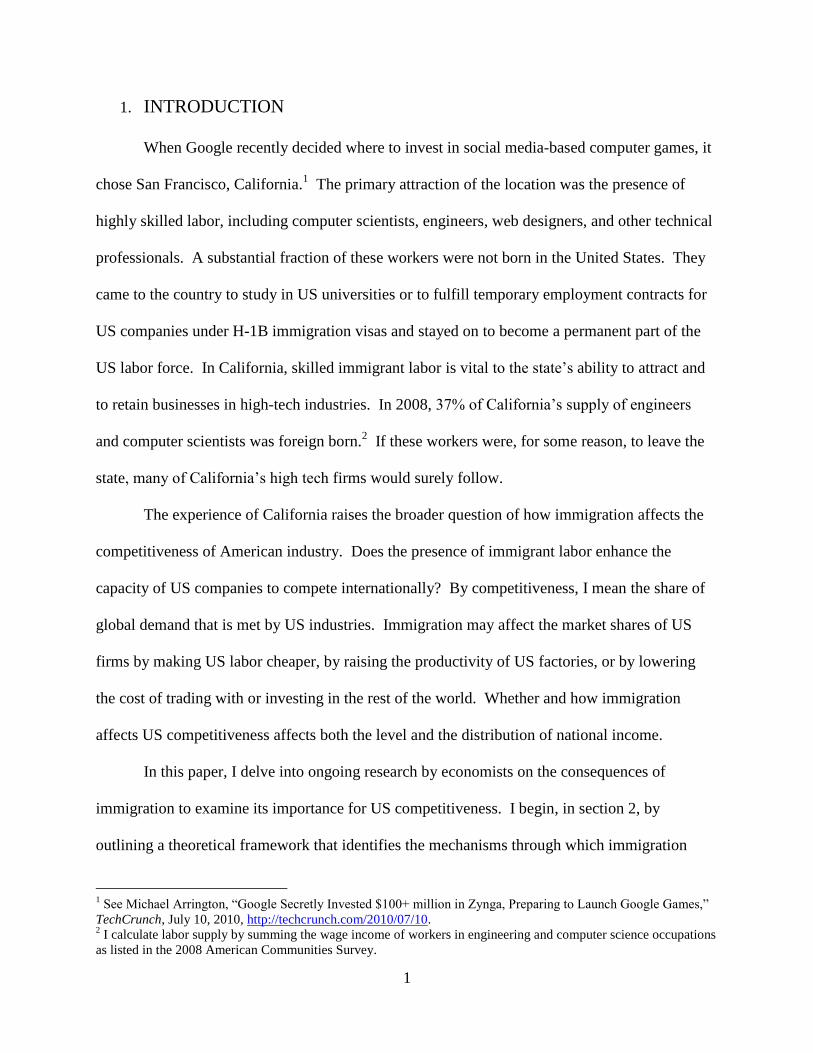
1. INTRODUCTION
When Google recently decided where to invest in social media-based computer games, it
chose San Francisco, California.1 The primary attraction of the location was the presence of
highly skilled labor, including computer scientists, engineers, web designers, and other technical
professionals. A substantial fraction of these workers were not born in the United States. They
came to the country to study in US universities or to fulfill temporary employment contracts for
US companies under H-1B immigration visas and stayed on to become a permanent part of the
US labor force. In California, skilled immigrant labor is vital to the state’s ability to attract and
to retain businesses in high-tech industries. In 2008, 37% of California’s supply of engineers
and computer scientists was foreign born.2 If these workers were, for some reason, to leave the
state, many of California’s high tech firms would surely follow.
The experience of California raises the broader question of how immigration affects the
competitiveness of American industry. Does the presence of immigrant labor enhance the
capacity of US companies to compete internationally? By competitiveness, I mean the share of
global demand that is met by US industries. Immigration may affect the market shares of US
firms by making US labor cheaper, by raising the productivity of US factories, or by lowering
the cost of trading with or investing in the rest of the world. Whether and how immigration
affects US competitiveness affects both the level and the distribution of national income.
In this paper, I delve into ongoing research by economists on the consequences of
immigration to examine its importance for US competitiveness. I begin, in section 2, by
outlining a theoretical framework that identifies the mechanisms through which immigration
1 See Michael Arrington, “Google Secretly Invested $100+ million in Zynga, Preparing to Launch Google Games,”
TechCrunch, July 10, 2010, http://techcrunch.com/2010/07/10. 2 I calculate labor supply by summing the wage income of workers in engineering and computer science occupations
as listed in the 2008 American Communities Survey.
2
affects production costs, productivity, and trade costs. Then, in section 3, I discuss empirical
evidence on the quantitative importance of these mechanisms. I proceed, in section 4, to
describe how US immigration policy shapes the level and composition of immigration and how
future changes in policy may affect US industries.
For economists, competitiveness is a slippery concept. It mixes productivity – how much
one worker is capable of producing in one hour – with production costs – how much that labor
hour costs. Changes in competitiveness do not map cleanly into changes in real earnings for
capital or labor, which are the proximate determinants of the national standard of living.3 In the
end, competitiveness matters only because it affects US living standards, a point sometimes lost
in policy debates. The usefulness of economic theory is that it provides a framework for
characterizing the pathways through which immigration affects the market shares of US
industries and how, in turn, these changes in market shares affect factor earnings.
Consider two alternative types of immigration shocks, each of which raises global market
shares for US industries but which have different effects on the national and international
distribution of income. First, suppose that immigration causes aggregate US total factor
productivity to increase, as a consequence, say, of foreign engineers creating new production
technologies that make US capital and labor more productive. Higher TFP increases US output
in all industries, raising the earnings of all factors of production in the process. The share of
3 To see that competitiveness is not isomorphic to income, consider two alternative shocks to the US commercial
aircraft industry. First, imagine that Boeing develops a new aircraft engine, which allows it to capture market share
from Airbus. The improvement in US competitiveness and the increase in US incomes (from Boeing’s enhanced
profitability) would go hand in hand. Next, suppose that a new US firm enters commercial aircraft production,
expanding US market share in the industry but driving down product prices, thereby reducing firm profitability in
the sector. In this case, US competitiveness (i.e., market share) rises even as US incomes may fall.
A further caveat is that in evaluating changes in competitiveness one wants to hold constant a country’s trade
balance. An increase in global market shares associated with rising net exports (implying the deferral of
consumption from today until the future) is obviously much different from an increase in market shares with no
change in the trade balance (implying no deferral of consumption). The former merely moves exports from the
future to today, whereas the latter implies an increase in the steady state level of exports.
3
global demand met by US producers rises, with the composition of US output remaining
unchanged. Because productivity expands across the board, no one industry grows at the
expense of another. Further, the earnings of capital and labor rise proportionately, owing to the
fact that their productivity increase is commensurate. The gain in TFP makes the United States
wealthier and the rest of the world wealthier, as well. Since the productivity shock causes the
market shares of US industries to rise globally, aggregate US TFP growth satisfies my definition
of an improvement in US competitiveness. But it is one that is good for everybody.
Next, consider an immigration-induced change in competitiveness that isn’t good for
everybody. Suppose that immigration, by increasing the supply of low-skilled labor, causes the
wages of these workers in the United States to fall. US industries intensive in the use of low-
skilled labor, such as perishable fruits and vegetables, see their profitability rise, allowing them
to hire labor, land, and capital away from other sectors, including perhaps capital-intensive crops
such as corn or wheat. As production expands in fruits and vegetables, it necessarily declines in
some other sectors. The share of global demand met by US labor-intensive industries rises but
the share met by some other US industries falls. In this example, the changes in competitiveness
are sector specific, which entail differential changes in income by factor type. The owners of
land suitable for fruit and vegetable production would likely see their real incomes grow,
whereas the owners of land suitable for corn or wheat production may see their real incomes
shrink. Further, native-born low-skilled workers in the United States may be hurt, as a
consequence of the increase in labor supply lowering their wages.
In the first example, immigration is uniformly good for US industries and factors of
production; in the second, it favors some sectors and factors over others. To consider whether
either of these stories has relevance for the US economy, we need a model of how immigration
4
affects productivity, wages, and trade costs. I use the global general equilibrium framework
developed by Eaton and Kortum (2002) to show how changes in immigration map into changes
in outcomes of interest. Their model isn’t about immigration, per se, but it offers an elegant and
intuitive explanation for the determinants of market shares by industry in the global economy,
which makes it appealing for our analysis. One can add on to their framework a model of
innovation and economic growth (Eaton and Kortum, 2009), which suggests how immigration
may affect industry competitiveness dynamically.
There is intense debate among economists about the consequences of immigration.
Today, immigrants account for 15% of the US labor force. Over the last two decades, much of
the research on the subject has focused on the US influx of low-skilled labor, mainly from
Mexico and Central America (Hanson, 2009). Between 1970 and 2009, immigrants as a share of
the US population rose from 5% to 12%, with the newly arriving immigrants concentrated at the
extremes of the skill distribution. Currently, 30% of working-age immigrants have less than a
high school education, compared to only 8% of native-born adults. It is natural to imagine that
large inflows of low-skilled immigrants put downward pressure on the wages of low-skilled
native workers. However, the estimated impact of immigration on wages depends very much on
the econometric approach that one takes (Borjas, 2003; Card, 2001). Immigration may also
affect local prices for housing and non-traded services, which may in turn have indirect
consequences for US competitiveness. I discuss evidence on the wage and price impacts of
immigration and what it means for US industries.
The policy debate about immigration has also focused on low-skilled labor. One concern
is that immigrants with low earnings potential are a net drain on US fiscal accounts, which
increases the tax burden on US individuals and corporations (Hanson, 2005). Complicating the
5
discussion is the fact that a large fraction of low-skilled immigrants are in the United States
illegally (Passel and Cohn, 2010). In 2009, unauthorized immigrants were 29% of the US
foreign-born population and 5% of the US labor force. On the one hand, illegal immigrants lack
access to most federally funded entitlements, mitigating their fiscal impact, at least at the federal
level (Hanson, 2007). On the other hand, many illegal immigrants have children who attend
public schools and, if they were born in the United States, have access to subsidized health care
(Camarota, 2004). The absorption of publicly funded services results in fiscal transfers from
native-headed households to immigrant-headed households. Because much of the funding for
public education comes from states and localities, the fiscal consequences of immigration vary
regionally. Part of immigration’s impact, then, is mediated by tax and spending policies at both
the federal and state level. Industries located in states that tax corporate or individual income,
have large immigrant populations, and provide benefits that are generous to immigrant families,
may face a relatively a large tax burden from immigration.
As the political debate about illegal immigration has intensified, high-skilled immigration
has been lost in the noise. The omission is unfortunate because, arguably, high-skilled
immigration matters much more for US productivity growth than low-skilled immigration. Low-
skilled immigration may shift income from low-skilled workers to employers or from taxpayers
to immigrant-headed households. But these impacts are largely static in nature and have only
indirect effects on growth. For low-skilled immigration to have dynamic effects, it must change
savings and investment decisions by firms and households. Such dynamic effects are plausible
but likely to be small. Because the US tax system is progressive, more low-skilled immigration
could increase tax rates disproportionately for high-income earners, reducing their incentive to
work or to invest in human or physical capital. But the elasticity of labor supply with respect to
6
income appears to be small (Ashenfelter, Doran, and Schaller, 2010), suggesting that such
disincentive effects are not large. Further, any such negative consequences may be offset by the
fact that low-skilled immigration tends to reduce the price of household services that high-
income earners consume (such as child care, house cleaning, and yard care), which enables them
to spend more hours at work (Cortes and Tessada, 2009).
In contrast to low-skilled immigration, high-skilled immigration appears to have direct
effects on economic growth. High-skilled immigrants are disproportionately represented in
technical fields, in which recent US productivity growth has been most rapid. In 2003, foreign-
born students accounted for 51% of PhDs in science and engineering fields awarded by US
universities, up from 27% in 1973 (Bound, Turner, and Walsh, 2009). In theory, expanding the
supply of scientists and engineers increases the US labor force devoted to R&D, which
contributes to higher rates of innovation and has positive effects on economic growth (Jones,
1995).4 Empirically, increases in high-skilled immigration are associated with increases in
patenting. While not all new patents find a productive application, a higher level of patenting
typically means more innovation and faster productivity growth. Thus, high-skilled immigration
affects US competitiveness by raising aggregate TFP and TFP in sectors that are intensive in the
use of science and engineering skills.5
A further manner through which high-skilled immigration affects competitiveness is
through its impact on trade costs (Rauch, 1999). Arriving immigrants bring with them
knowledge about market conditions and investment opportunities in foreign countries. Such
4 For high-skilled immigration to enhance US innovation in this manner, it must be that the gains from innovation
are not spread evenly across the globe but captured disproportionately by the US (as would occur if spillovers from
innovation are localized or if innovating firms earn profits at the expense of global consumers). 5 In linking immigration and competitiveness, I am assuming implicitly that immigration does not worsen the US
trade balance, an assumption that appears reasonable given the absence of obvious reasons for which high-skilled
immigration would induce US households to reduce savings.
7
information flows are likely to lower the cost to US companies of doing business abroad and to
foreign companies of doing business in the United States. By hiring immigrant workers, US
companies may learn about new foreign inputs they can use in production or new foreign market
niches that they can supply. Immigrants that return to their home countries may help US
companies invest abroad, as has occurred in China, India, and Taiwan through the return to these
countries of individuals who had worked in Silicon Valley (Saxenian, 2002). The international
transmission of knowledge engendered by immigration may not help all industries or all regions
equally. To the extent that information flows are limited to the sectors or the locations in which
immigrants are employed, it will enhance US competitiveness in these locations but, through
general equilibrium effects, diminish it in others.
2. IMMIGRATION AND COMPETITIVENESS IN THEORY
I have outlined three mechanisms through which immigration may affect the share of
global demand that US industries satisfy. One is by changing production costs. Immigration
alters the supply of low-skilled and high-skilled labor in the US economy, which may affect the
prices of these factors facing US companies. A second mechanism is by changing productivity.
High-skilled immigration adds to the economy workers used intensively in R&D, which may
raise the rate of innovation in US industries. And a third mechanism is by changing trade costs.
Immigration increases the international transmission of information, which may change the cost
of doing business abroad for US firms, as well as the cost to foreign firms of doing business in
the United States. In this section, I outline a theoretical framework that incorporates each of
these mechanisms into a global general equilibrium setting.
8
2.1 Productivity, Production Costs, and Market Shares
Before contemplating immigration, we need to characterize the factors that determine the
share of global demand in different industries that is satisfied by US firms. The Eaton and
Kortum (2002) framework that I employ has three elements: (i) innovation, through which firm
TFP is determined, (ii) the hiring of labor and intermediate inputs, through which factor prices
are determined, and (iii) international competition, through which firms with the lowest prices
(inclusive of the costs of international trade) win the right to serve particular markets.
One can think of the process of innovation as akin to firms playing a lottery, in which
some will have good draws and develop processes that given them high TFP (or, equivalently,
high product quality), while others will have bad draws, leaving them with low TFP (or low
product quality). Notice that innovation lotteries as described here are about the level of TFP
and not its growth. I take up sources of TFP growth in the next section.
A country’s courts, financial markets, education systems, and other institutions play a
role in innovation lotteries. In the United States, well-developed markets for venture capital,
strong enforcement of intellectual property rights, and high-quality universities make firms in
high-tech industries more likely to have good innovation draws than firms in, say, Vietnam,
whose legal, financial, and educational institutions are less developed. However, Vietnam has an
abundant supply of low-skilled labor and rich tropical farmland, which may give firms in the
country an advantage vis-à-vis rivals in the United States in coming up with cost effective ways
of producing clothing or cultivating rice. Within each US industry, there will be some firms that
succeed in innovating and others than do not, with the share of firms that succeed varying across
industries according to US potential productivity in the sector, where potential productivity
captures the set of factors that the determine the likelihood of successful innovation. One easily
9
recognizes this framework as a souped up version of Ricardian comparative advantage. Potential
productivity is roughly the equivalent of absolute advantage in an introductory textbook model.
To produce output, firms hire labor and other factors and purchase intermediate inputs.
The cost of labor is determined by its supply and demand, such that wages are higher where high
productivity causes labor demand to be strong and lower where population growth, educational
upgrading, or inflows of foreign workers expand labor supply. Strong potential productivity in
one industry pushes up the price of labor for other industries, such that firms in industries with
weak potential productivity will only survive if they have been particularly lucky in the
innovation lottery. The price of intermediate inputs in a country depends on the country’s
industrial capacity in upstream industries and the proximity of the country to upstream suppliers
in other countries. Immigration has direct effects on input prices through its impact on labor
supply. All else equal, US firms will have a cost advantage in industries that rely more heavily
on the types of skills that US workers have in abundance (where the astute observer will detect a
bit of Heckscher-Ohlin reasoning sneaking into the framework). If immigration increases the
supply of these skills, it will enhance existing US cost advantages.
The price that a US firm charges in foreign markets will depend in part on its TFP (higher
TFP means a firm can get away with charging a lower price) and economy-wide wages (where
lower wages are passed through to lower prices) and in part on international trade costs (which
represent an ad valorem markup on the foreign price of US goods). Trade costs are determined
by importing country tariffs and non-tariff barriers, international freight and insurance costs, and
foreign marketing and distribution costs. Let’s imagine that competition in industries is
Bertrand, such that the lowest price firm wins the market for a specific product in a particular
industry. Each industry consists of a large number of individual product varieties. US firms will
10
capture a larger market share – i.e., they will produce a larger share of product varieties – in
industries in which US potential productivity is greater (such that a higher fraction of US firms
have good innovation draws) or US input costs are lower (due either to a low share of low-
skilled labor in production costs or a high share for high-skilled labor in production costs), and in
countries in which trade costs vis-à-vis the United States are lower.
US export supply capacity in an industry is, then, the product of factors related to US
potential productivity, US input costs, and international trade costs. The share of a specific
market – e.g., semiconductors – that US firms will capture in a particular country – e.g., France –
will depend on US export supply capacity for semiconductors in France relative to the export
supply capacity for semiconductors in France of other countries that also serve the French
market. Since I equate competitiveness with market share, US competitiveness rises in
semiconductors when US export supply capacity in semiconductors rises relative to other
countries. Such an outcome obtains when US potential productivity rises (meaning more firms
innovate successfully), US input costs fall (meaning that US cost advantages rise), or trade costs
specific to US firms decline (meaning that US firms gain market access relative to foreign
rivals). Immigration affects export supply capacity by affecting productivity, production costs,
or trade costs, completing the intuition developed in the introduction. I have not yet said
anything about how changes in export supply capacity affect the level or the distribution of
national income in the United States. I will address these outcomes in section 3, in which I
consider how changes in the US economy brought by immigration may have affected US
earnings for low-skilled labor, high-skilled labor, and capital.
2.2 Innovation and Economic Growth
11
The framework I’ve outlined so far is static in nature. Innovation lotteries determine the
level of TFP among firms in an industry. For there to be economic growth, TFP must rise over
time, which requires that potential productivity expand. To understand sources of productivity
change, I follow Eaton and Kortum (2009) and draw on models of endogenous economic growth.
Imagine that instead of drawing their productivity from a lottery, firms invest in
innovation by hiring R&D labor. The more firms invest, the more new ideas they generate and
the more likely they are to generate market winning innovations. The firm with the best
innovation captures the market for a specific product, at least until another firm comes up with
something better. In this way, production in an industry follows a “quality ladder” or
“productivity ladder,” in which new innovations steadily raise quality or TFP relative to the past
state of the art (Grossman and Helpman, 1991). The rate of innovation and therefore the rate of
economic growth depends positively on the supply of R&D labor, the productivity of R&D labor
(which may vary across countries in a manner similar to variation in potential productivity), and
the average magnitude of new innovations (in terms of their impact on raising quality or TFP),
and negatively on the rate at which firms discount future profits.
How does immigration affect growth in such a framework? If immigration expands the
supply of R&D labor in the United States, it raises investment in innovation, which increases the
rate at which successful new innovations occur. To the extent that the global supply of R&D
labor is constrained – as would be the case if there were only a small number of superstar
scientists that were capable of generating significant innovations – the US attracting a star
scientist would necessarily mean that another country loses her. The international competition
for talent, then, may affect which countries generate most new innovations. Country
immigration policies may constrain companies in their global talent search. With global trade,
12
innovations developed in the United States would ultimately diffuse to other countries (and vice-
versa), either through imitation or through foreign direct investment, raising global growth. At
least in theory, high-skilled immigration has the potential to affect US growth rates directly by
raising industry innovation rates and thereby the rate of growth of industry export supply
capacities.
2.3 Immigration and Trade Costs
International trade costs impede trade flows, and thereby diminish US industrial
competitiveness, by acting as a tax on cross-border commerce. The commerce-inhibiting effects
of trade barriers are obvious when one thinks of import tariffs, import quotas, or the costs of
international shipping. However, incomplete information between countries about demand and
supply may also inhibit trade. Information barriers may account for why countries with a
common language, common colonial history, or common religious traditions tend to trade more,
as among these countries cultural barriers to commerce may be small.
International migration creates linkages between a country and the rest of the world,
which may help reduce information barriers and therefore lower international transaction costs.
Casella and Rauch (2002) develop a model in which membership in a group – such as common
ancestry or ethnicity – helps individuals in different countries reduce barriers to international
trade associated with incomplete information. Relative to purely anonymous trade, the presence
of group ties increases the volume of trade and GDP in the trading countries, though individuals
lacking group ties are worse off (because they lose access to their more productive potential
trading partners). Migration is an obvious mechanism through which cross-national group ties
may be established and maintained over time.
13
In empirical analysis of bilateral trade flows using the gravity model, there is a robust
positive correlation between bilateral trade and bilateral migration, indicating that a pair of
countries trades more today when there has been high levels of migration flows between them in
the past. This finding has been interpreted as evidence of a “diaspora externality,” in which
previous waves of migration create cross-national networks that facilitate commercial exchange.
Gould (1994) finds that bilateral trade involving the United States is larger with countries that
have larger US immigrant populations. Head, Reis, and Swenson (1998) find that a 10%
increase in Canada’s immigrant population from a particular country is associated with a 1%
increase in bilateral Canadian exports and a 3% increase in bilateral Canadian imports.
Pushing the analysis a step further, Rauch and Trindade (2002) focus specifically on
networks associated with overseas Chinese populations. Successive waves of emigration from
southeastern China have created communities of ethnic Chinese throughout Southeast Asia, as
well as in South Asia and on the east coast of Africa. Rauch and Trindade find that bilateral
trade is positively correlated with the interaction between the two countries’ Chinese populations
(expressed as shares of the national population), similar to the findings in Gould and Head, Ries,
and Swenson. More interestingly, the correlation between Chinese populations and trade is
stronger for differentiated manufacturing products than it is for homogenous goods. To the
extent differentiated products are more subject to informational problems (Rauch, 1999), these
are the goods one would expect to be most sensitive to the presence of business networks. Rauch
and Trindade focus on Chinese business networks owing to their expanse, which makes
empirically identifying their impact on trade feasible. Presumably, international business
networks are common to many migrant communities. In the United States, large concentrations
of immigrants from Latin America, Asia, and Europe, among other regions, may contribute to
14
deepening US trade relations with these regions.
One issue about the relationship between trade and migration is that it is unclear whether
greater trade is the outcome of increased migration or a reflection of the types of individuals who
select into migration. If more skilled and more able individuals are more likely to migrate
abroad and more likely to exploit business opportunities, then the correlation between trade and
migration may be a byproduct of migrant self-selection. US policies to liberalize immigration
may not necessarily increase trade with sending countries, unless they allowed for the admission
of individuals with a higher propensity to engage in trade. Consistent with this reasoning, Head,
Ries, and Swenson (1998) find that immigrants admitted as refugees or on the basis of family
ties with Canadian residents have a smaller effect on trade than immigrants admitted under a
point system that values labor-market skills.
Other evidence suggests international migration may increase the flow of investment
between countries. In China, India, and Taiwan, the migration of skilled labor to Silicon Valley
– where Indian and Chinese immigrants account for one third of the engineering labor force –
has been followed by increased trade with and investment from the United States (Saxenian,
2002). By virtue of understanding business conditions in their home countries, these immigrants
may be particularly well-positioned to exploit investment opportunities abroad. Immigrants
attracted by the lure of engineering jobs in Silicon Valley, today, may contribute to investment
by Silicon Valley firms in their home countries, tomorrow, which may then lead to expanded
trade flows between the United States and these countries, in the future.
3. EMPIRICAL EVIDENCE ON IMMIGRATION AND COMPETITIVENESS
The theoretical framework developed in the last section identifies the mechanisms
15
through which immigration may impact the market shares of US industries in the global
economy. In this section, I review evidence on how immigration may have affected production
costs and industrial productivity in the United States. In considering these mechanisms, I
emphasize what research has to say about the effects of immigration on factor earnings. In the
end what matters is not just whether immigration causes US global market shares to rise but
whether individuals in the United States are made better off.
3.1 Immigration and Production Costs
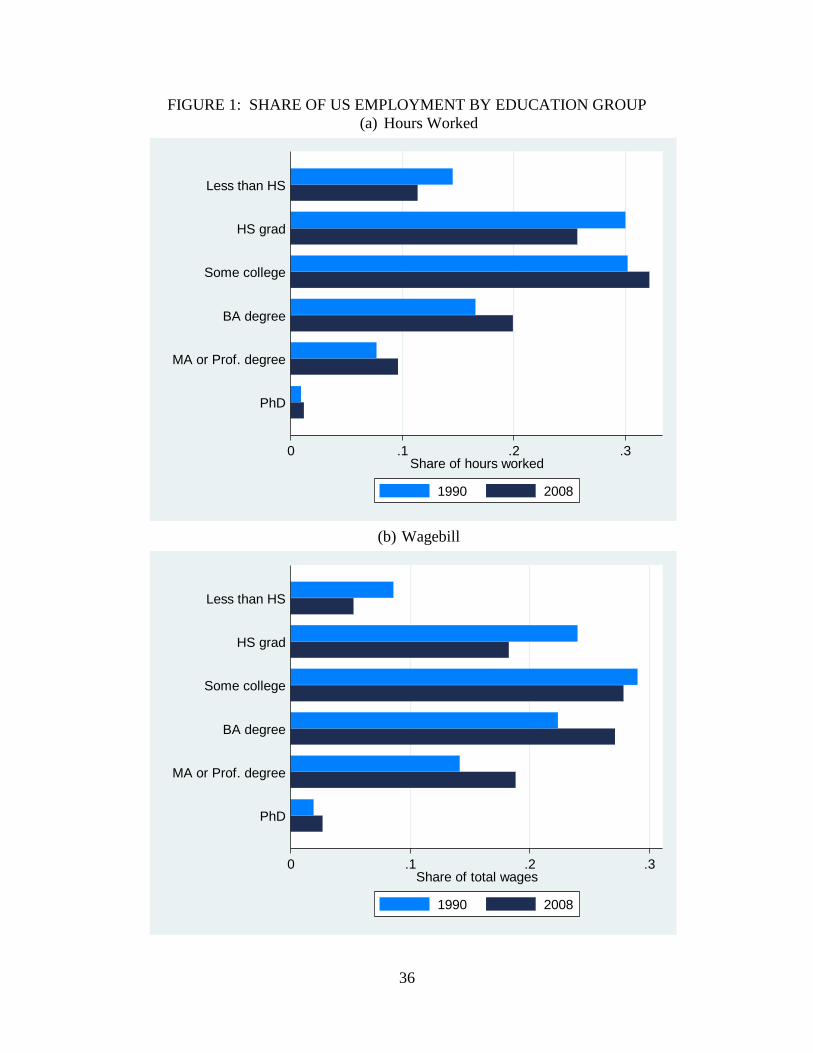
Over the last two decades, the US labor market has shifted in favor of utilizing more-
skilled labor. Using www.Ipums.org data from US population censuses and American
Community Surveys, Figures 1a and 1b show the fraction of hours worked and the total wage
bill accounted for by workers at different education levels. Between 1990 and 2008, the share in
total employment of workers with a high-school education or less fell sharply, whereas the share
with a college education or more (BA degree, master’s or professional degree, or PhD) rose
sharply. Immigration, as we will see next, has attenuated the declining employment share of
low-skilled workers and accelerated the rising employment share of high-skilled workers,
leading the US supply of labor to be more concentrated at the extremes of the skill distribution
than it otherwise would have been.
Figures 2a and 2b examine how the presence of immigrants in the US labor force has
evolved over time. Each graph shows the share of hours worked accounted for by immigrants
among individuals with a given level of education, where I plot these shares by year and labor-
market experience groups (1 = 0-5 years of experience, 2 = 6-10 years of experience, 3 = 11-15
years of experience, 4 = 16-20 years of experience, 5 = 21-25 years of experience, 6 = 26-30
16
years of experience, 7=31-35 years of experience, and 8=36-40 years of experience). In all of
the graphs, the lines rise over time, with immigrant employment shares being higher in 1980 than
1970, higher in 1990 than 1980, and so on. Clearly, immigrants have become a more important
part of the US labor force across all education and experience levels, for both men and women.
However, the size of the increase in the immigrant employment share differs sharply across
education groups. The graphs for workers with less than a high school education show that
between 1970 and 2008 the share of immigrants in hours worked rose from under 10 percent to
over 40 percent for most experience groups and to over 50 percent for groups with 11 to 30 years
of experience. Among college graduates, there has also been a notable increase in the immigrant
share of hours worked, rising from around 5 percent in 1970 to over 15 percent 2008.
The importance of immigrants for changes in labor supply among high-skilled workers is
seen more clearly in Figures 3a and 3b, which breaks the college educated into four schooling
groups. In 2008, among younger workers (with less than 20 years of labor-market experience)
immigrants accounted for around 20 percent of hours worked among men with a professional
degree, 20-30 percent of hours worked among men with a master’s degree, and over 40 percent
of hours worked among men a PhD. Figures for women are similar. Clearly, foreign-born
workers are now a significant part of US labor supply among the very highly educated.
How does rising immigration change the wages of workers at different skill levels?
According to a simple model of labor demand and labor supply, the wages for the most affected
groups – the very low-skilled and the very high-skilled – should have been adversely affected by
immigration. A decline in wages would lower production costs, aiding firms that employ
immigrant labor relatively intensively. However, the labor-market consequences of international
migration have inspired intense debate among scholars and there is not yet a consensus about the
17
wage impacts of immigration in the United States.
Borjas (2003) defines labor markets at the national level according to a worker’s
education and labor-market experience, using the same groups as in Figure 2. Over the period
1960 to 2000, education-experience cells in which immigrant labor supply growth has been
larger – such as for young male high school dropouts – had slower wage growth, even after
controlling for education or experience specific wage shocks (i.e., including education-by-year
and experience-by-year fixed effects in the estimation). Borjas’ evidence is consistent with
immigration having depressed wages for low-skilled US workers. A 10% increase in the
population due to immigration leads to a 3% to 4% reduction in US wages. The concern about
this approach is that it might confound immigration with other labor-market shocks that have
hurt low-skilled workers, such as skill-biased technological change. Absent controls for these
other shocks, one cannot be sure that the attributed wage changes are really due to immigration.
Applying a similar approach to Canada, Aydemir and Borjas (2007) find comparable
evidence of the wage effects of immigration. In Canada, where immigration has been dominated
by workers toward to the top end of the skill distribution – owing to Canada’s use of skill-based
point system to regulate immigration – immigration is negatively correlated with wages across
education-experience cells, with more-educated workers being the ones who have suffered the
largest negative wage effects from foreign labor inflows. Since Canada is presumably subject to
many of the same technology shocks as the United States, it would not appear that unobserved
technology shocks could explain away the wage effects of immigration in both countries.
An older and larger literature has searched for immigration’s impact by correlating the
change in wages for low-skilled US natives with the change in the immigrant presence in local
labor markets, typically at the level of US cities. These area studies tend to find that immigration
18
has little if any impact on US wages. Card (2005) argues that if immigration has affected the US
wage structure one should see larger declines in the wages of native high school dropouts,
relative to native high school graduates, in US cities where the relative supply of high school
dropouts has expanded by more. In fact, the correlation between the relative wage and the
relative supply of US high school dropouts across US cities is close to zero.
The area study approach also has its problems. Immigrants may tend to settle in US
regions in which job growth is stronger, causing one to underestimate the wage impact of
immigration when using city or state-level data. As a correction, many studies instrument for
growth in local immigrant labor supply using lagged immigrant settlement patterns. But this
strategy requires strong identifying assumptions. It would be invalid, for instance, if the labor-
demand shocks that influence immigrant settlement patterns are persistent over time (Borjas,
Freeman, and Katz, 1997).
One explanation for why low-skilled immigration may not have had larger impacts on US
wages is that immigration induces firms to change their investment decisions in a manner that
offsets the wage effects. Lewis (2010) finds that in US states experiencing more immigration
firms invested less heavily in automation machinery. Automation machinery replaces low-
skilled labor, reducing the demand for their services. Thus, immigration may have induced firms
to be less capital intensive in production than they otherwise would have been. Less investment
in physical capital that replaces low-skilled labor may have helped mitigate the negative effect of
immigration on wages. Lewis’ results apply to US manufacturing over the 1998 to 1993 period.
It is unclear how much they matter for other industries or time periods.
Despite the conflicting evidence on wages, there are other results suggesting that
immigration has had significant economic impacts on prices in US cities that have experienced
19
larger influxes of immigrants. Cortes (2008) finds that in the 1980s and 1990s US cities with
larger inflows of low-skilled immigrants saw larger reductions in prices for housekeeping,
gardening, child care, dry cleaning and other labor-intensive services. She finds that a 10%
increase in the local population due to immigration is associated with decreases in prices for
labor-intensive services of 1.3% percent. As prices for these services fall, highly educated
women are likely to increase the number of hours they spend working. Cortes and Tessada
(2009) find that as a consequence of US low-skilled immigration over the period 1980-2000
highly educated women increased their weekly labor supply by approximately 45 minutes, with
women working the longest hours having the largest increases.
A second impact of immigration is on the price of land. As immigrants are attracted to a
location, the demand for housing rises, which may lead to increases in the price of housing,
unless housing supply is relatively elastic. Saiz (2007) examines the correlation between
immigration and housing prices and finds that an increase in immigration equivalent to 1% of the
population of a US city is associated with a 1% increase in local housing values.
A third impact of immigration is on local or national taxes. Immigration may affect
production costs by altering tax rates faced by workers or businesses. Where immigrants pay
more in taxes than they receive in government benefits, as is likely the case with high-skilled
immigrants, immigration reduces the net tax burden on native taxpayers. Where immigrants pay
less in taxes than they receive in government benefits, as is likely the case with low-skilled
immigrants, immigration increases the net tax burden on natives.
In the United States, immigrant households have historically made greater use of
subsidized health care, income support to poor families, food stamps and other types of public
assistance (Borjas and Hinton, 1996). Immigrant households tend to be larger than native
20
households, have more children, and have very low incomes, making them eligible for means-
tested benefits. In the last decade and a half, however, the difference between immigrant and
native use of welfare programs in the US has fallen or even reversed, largely because of welfare
reform in 1996, which restricted non-citizens from having access to many federally funded
benefit programs. While immigrant households still make greater use of public healthcare than
native households (largely through their US born children), they make comparable or less use of
other types of public assistance (Borjas, 2003; Capps et al., 2005).
Because immigrant-headed households tend to have more children of school age than
native-headed households, increasing immigrant presence in a locality is likely to increase
demand for public education. Thus, even if immigrant use of social services does not differ from
that of natives, growth in the immigrant population increases school enrollments, placing a strain
on state or local government finances. In 2004, the fraction of school age children who had
foreign-born mothers was 47% in California, 30% in Nevada, 29% in New York, 27% in
Arizona and Florida, and 26% in New Jersey and Texas.
Calculating the fiscal consequences of immigration precisely is difficult. One needs to
know many details about the income, spending, and employment of immigrants. There are few
comprehensive analyses of the fiscal impact of immigration. In one of the few such studies,
Smith and Edmonston (1996) estimate that in 1996 immigration imposed a short-run fiscal
burden on the average US native household of $200, equivalent to 0.2% of US GDP.6 In the
United States, the fiscal consequences of immigration appear to matter for individual preferences
over immigration policy. Hanson, Scheve, and Slaughter (2007) find that US natives who are
more exposed to immigrant fiscal pressures – those living in states that have large immigrant
6 This estimate is based on short run considerations. Allowing for dynamics could change the results.
21
populations and that provide immigrants access to generous public benefits – are more in favor
of reducing immigration. This public-finance cleavage on immigration policy is strongest
among natives with high earnings potential, who tend to be in high tax brackets. Thus, growth in
the local immigrant population may contribute to political conflict over immigration policy,
working through immigration’s impact on local public accounts.
In sum, there is evidence that in the United States immigration has put downward
pressure on the wages of low-skilled labor, high-skilled labor, and the prices of labor-intensive
services, and upward pressure on housing prices and the net tax burden facing native-headed
households. Such changes help industries intensive in the use of very low-skilled or very high-
skilled labor but hurt industries located in regions in which immigrants have caused state or local
spending on education or social services to increase. Many US regions are seeing both types of
changes occur simultaneously – increases in low-skilled and high-skilled immigrant labor supply
and increasing net fiscal burdens on local taxpayers – implying that which industries gain and
which lose from immigration depend on specific details regarding industry skill intensity in
employment and exposure to tax increases.
3.2 Immigration and Innovation
Clearly, immigration matters for the supply of human capital in the United States.
Absent the arrival of foreign students and highly skilled foreign labor, the country would have
far fewer engineers, scientists, and other technical professionals. The theoretical framework
developed in section 2 suggests that the presence of such labor affects innovation positively. I
turn next to evaluate evidence on whether immigration has altered the scale and composition of
innovative activities in the United States.
22
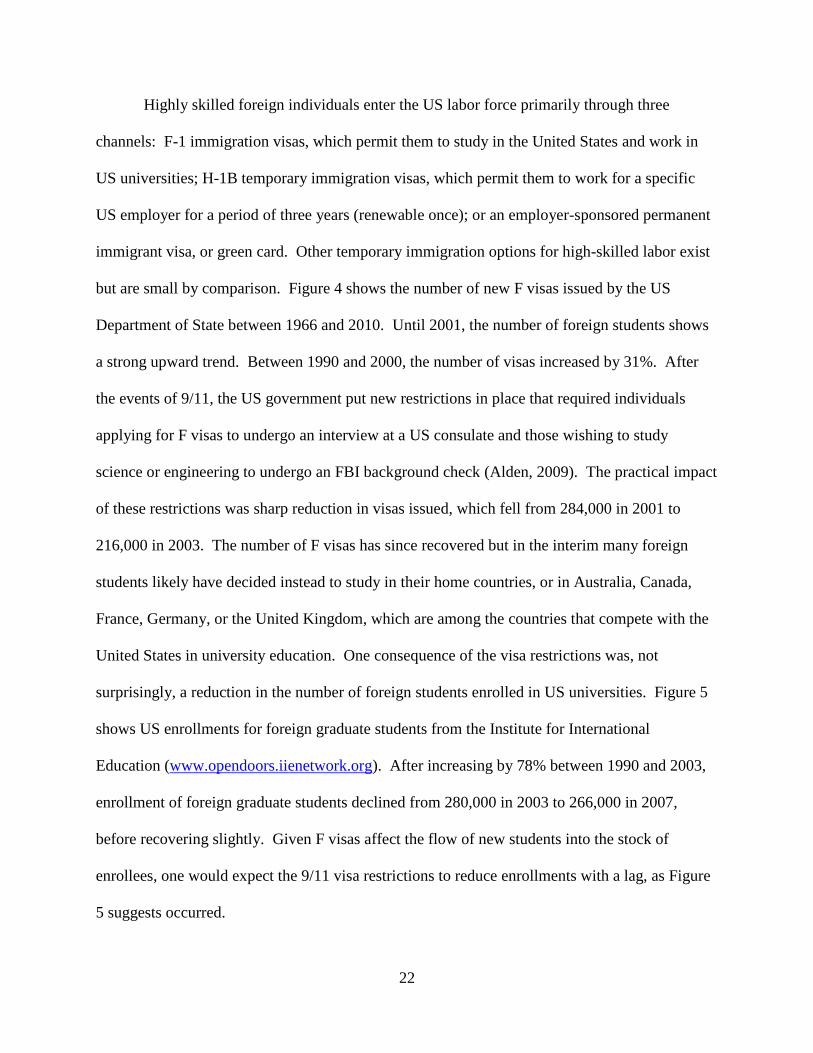
Highly skilled foreign individuals enter the US labor force primarily through three
channels: F-1 immigration visas, which permit them to study in the United States and work in
US universities; H-1B temporary immigration visas, which permit them to work for a specific
US employer for a period of three years (renewable once); or an employer-sponsored permanent
immigrant visa, or green card. Other temporary immigration options for high-skilled labor exist
but are small by comparison. Figure 4 shows the number of new F visas issued by the US
Department of State between 1966 and 2010. Until 2001, the number of foreign students shows
a strong upward trend. Between 1990 and 2000, the number of visas increased by 31%. After
the events of 9/11, the US government put new restrictions in place that required individuals
applying for F visas to undergo an interview at a US consulate and those wishing to study
science or engineering to undergo an FBI background check (Alden, 2009). The practical impact
of these restrictions was sharp reduction in visas issued, which fell from 284,000 in 2001 to
216,000 in 2003. The number of F visas has since recovered but in the interim many foreign
students likely have decided instead to study in their home countries, or in Australia, Canada,
France, Germany, or the United Kingdom, which are among the countries that compete with the
United States in university education. One consequence of the visa restrictions was, not
surprisingly, a reduction in the number of foreign students enrolled in US universities. Figure 5
shows US enrollments for foreign graduate students from the Institute for International
Education (www.opendoors.iienetwork.org). After increasing by 78% between 1990 and 2003,
enrollment of foreign graduate students declined from 280,000 in 2003 to 266,000 in 2007,
before recovering slightly. Given F visas affect the flow of new students into the stock of
enrollees, one would expect the 9/11 visa restrictions to reduce enrollments with a lag, as Figure
5 suggests occurred.
23
The 9/11 shock to F visas contributed to a downward trend in the US share of global
university education. Between 1970 and 2006, the US share of enrollments in worldwide higher
education fell from 29% to 12% (Freeman, 2009). There are many reasons why a decline in US
market share for higher education is occurring. As other countries catch up to the United States
in terms of income, they are likely to expand local university offerings. Perhaps more of a
concern is that the United States is also losing market share in graduate training in science and
engineering, fields which are directly related to the country’s capacity for innovation. Freeman
shows that in 1975 the United States produced over four times as many PhDs in science and
engineering as did China, Japan, India, and Korea combined; by 2006 these countries produced
23% more science and engineering PhDs than the United States.
Do foreign students affect US productivity? Stuen, Mobarak, and Maskus (2010)
examine the changing number of foreign science and engineering graduate students in US
universities over the period 1973 to 1998, focusing on the top 100 US schools. Graduate
students are key inputs into university research, providing both grunt work as research assistants
and substantive contributions as collaborators. Stuen, Mobarak, and Maskus report that in a
recent survey of Science, a premier scientific journal, 87% of papers published had a student or
post-doctoral fellow as a co-author, with 60% of these co-authors being foreign born. In their
analysis, they exploit the fact that shocks in foreign countries, associated with macroeconomic
crises, military conflicts, or changes in political regime, affect the ability of students from these
countries to travel to the United States for graduate study. These shocks provide a source of
exogenous variation in the supply of foreign graduate students in the United States. The authors
find that a 10% reduction in a university’s share of science and engineering graduate students
that are foreign born leads to a 5% to 6% reduction in research output, measured as publications
24
in peer-reviewed journals or citations of published research. One interpretation of their result is
that losing access to foreign students restricts US university access to scientific talent, which
reduces the productivity of US researchers. For this interpretation to hold, it must be true that
the domestic students that replace foreign students lost to turmoil in their home countries are less
able, not as hard working, or less diverse in their intellectual perspectives.
The emphasis on science and engineering is warranted by the fact that occupations
related to these fields are at the heart of US innovation. Hunt and Gauthier-Loiselle (2008) use
the 2003 National Survey of College Graduates to examine patenting activity by native and
foreign-born university degree holders. US immigrants patent at twice the rate that natives do, a
difference that is explained entirely by the much higher propensity of the foreign born to hold
degrees in science and engineering. They find further that for every 1% increase in the
population made up by immigrant university graduates, patents per capita increase by 6%. They
offer suggestive evidence that patenting by immigrants does not crowd out patenting by domestic
workers (as would occur if immigrants simply captured jobs from native-born workers in which
workers are more likely to generate new patents). Instead, there may be positive spillovers from
immigrants to natives in innovation. The link of immigrants to university education in the
United States turns out to be important for innovative outcomes. Immigrants who did not study
in the United States and who arrived in the country at an older age do not exhibit the same
positive patenting differential vis-à-vis natives (Hunt, 2009).
Of course, only a small fraction of foreign students in the United States turn out to be
superstars in their chosen fields. But attracting these superstars appears related to regional
economic performance. Zucker and Darby (2008) follow 5,400 highly cited scientists from the
1980s to the 2000s. Of this group, 62% reside in the United States, the large majority of them
25
having graduated from US universities. Attracting a star scientist to a US region (say, when she
is hired by a local university) is associated with a higher likelihood of firm entry in fields related
to the scientist’s area of study. It is difficult to make causal inferences from this association but
it appears that innovation in universities may be related to innovation in local industries.
After completing university training, foreign students must change their visa status in
order to stay and work in the United States. The H-1B immigration visa is a common channel
through which foreign students with US university degrees enter the US labor market. (Indeed,
Kato and Spulber (2010) suggest that reductions in the supply of H-1B visas lower the academic
quality of foreign applicants to US universities.) Workers abroad recruited by employers with
US operations are another group that utilizes these visas. An H-1B visa gives an individual the
right to work in the United States for three years. Applications for visas are filed by a US
employer. Renewal for a second three-year period is generally automatic for those complying
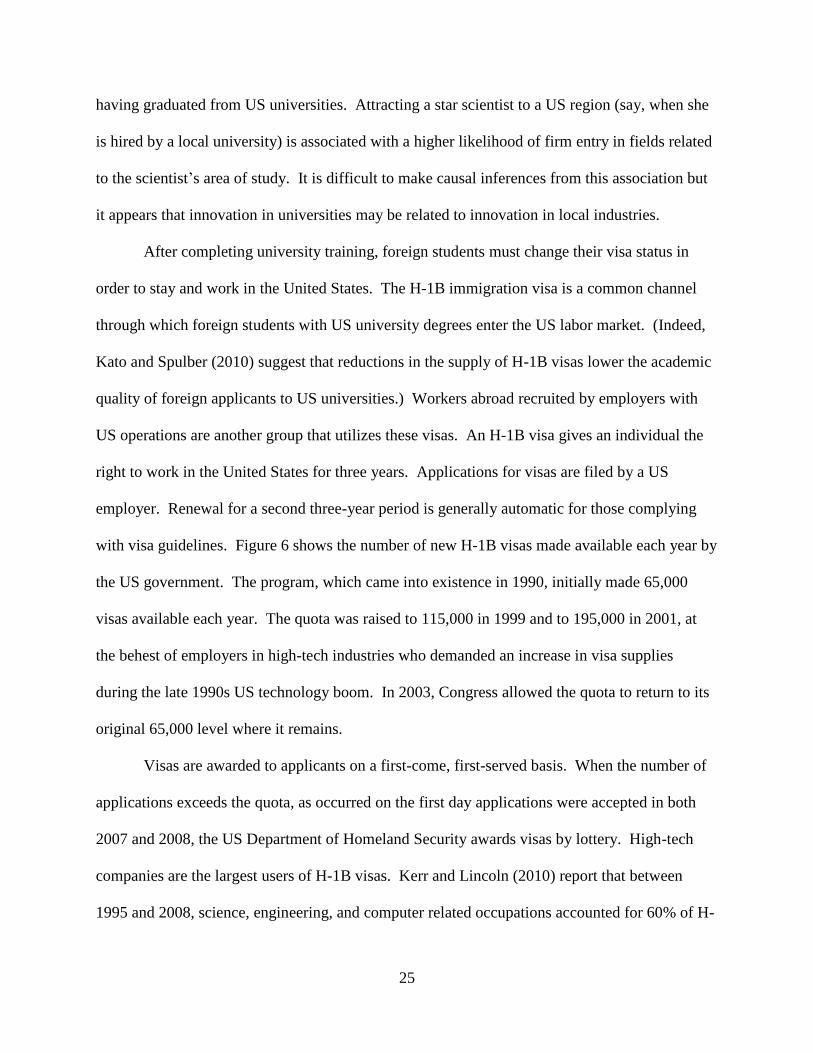
with visa guidelines. Figure 6 shows the number of new H-1B visas made available each year by
the US government. The program, which came into existence in 1990, initially made 65,000
visas available each year. The quota was raised to 115,000 in 1999 and to 195,000 in 2001, at
the behest of employers in high-tech industries who demanded an increase in visa supplies
during the late 1990s US technology boom. In 2003, Congress allowed the quota to return to its
original 65,000 level where it remains.
Visas are awarded to applicants on a first-come, first-served basis. When the number of
applications exceeds the quota, as occurred on the first day applications were accepted in both
2007 and 2008, the US Department of Homeland Security awards visas by lottery. High-tech
companies are the largest users of H-1B visas. Kerr and Lincoln (2010) report that between
1995 and 2008, science, engineering, and computer related occupations accounted for 60% of H-
26
1B visas. To hire a worker on an H-1B visa, an employer must apply for and receive a foreign
labor certification from the US Department of Labor, verifying that the foreign worker will not
displace a US worker. DOL records show the number of foreign labor certifications sought by
US companies. In 2008, Cisco Systems applied for 4,747 certifications (for both new and
renewing H-1B visas), Hewlett-Packard applied for 4,358, IBM applied for 2,601, Microsoft
applied for 3,442, and Sun Microsystems applied for 1,834.7
To examine how H-1B visas affect US innovation, Kerr and Lincoln (2010) exploit the
fact that the supply of visas has varied over time according to Congressional changes in the visa
quota. They examine patenting activity by individuals with identifiably Chinese or Indian names
(given that patent applications do not list an individual’s immigration status). Over the period
2000 to 2005, 50% of H-1B visas went to individuals from India or China. Since the H-1B
program was established in 1990, the share of patents awarded to individuals with Indian names
increased from 3% to 5% and the share going to individuals with Chinese names increased from
4% to 9% (trend growth in these shares was more modest before 1990). The patent shares going
to these two groups are substantially higher in fields related to computers, electronics, chemicals,
or pharmaceuticals. Kerr and Lincoln allocate H-1B visas across US cities according to where
the employers that apply for the visas are located. The cities that attract most H-1B visa holders
are San Francisco, Miami, Washington, DC, Raleigh-Durham, Boston, Austin, and New York.
A 10% increase in the population of H-1B visa holders is associated with a 1% to 4% increase in
city patenting activity (for every standard deviation increase in a city’s share of H-1B visas).
They also allocate H-1B visas across large employers according to their historic use of the visas.
7 Business services companies are the largest users of H-1B visas. These entities in effect subcontract H-1B workers
out to US companies that need their services; they appear to attract relatively low level software programmers. They
include multinationals from India (e.g., Wipro, Infosys Technologies, McPhasiS, and Satyam Computer Systems)
and US-based companies (e.g., Xceltech, Enterprise Business Solutions, Business Intelligence Systems).
27
A 10% increase in population of H-1B visa holders is associated with 4% to 5% increase in
company patenting activity (for every standard deviation increase in a firm’s share of H-1B
visas). It thus appears that expanding the number of H-1B visas may increase patenting in
companies that specialize in high-tech activities and in US cities where high-tech companies are
based.
To remain in the United States after the H-1B visa expires, an individual must obtain a
US green card. This requires being sponsored either by a US family member or US employer (or
seeking one of the small number of green cards made available through lottery). Though US-
educated immigrants who have US work experience under an H-1B visa would seem to be
natural candidates for an employer-sponsored green card, the limited supply of these visas means
that workers often seek other paths to residency. The Immigration Act of 1990 set an overall
annual cap on the number of green cards at 675,000, with specific quotas assigned to immigrants
who are family-sponsored (480,000), employment-based (140,000), or entering under the
diversity program (55,000) (US Department of Homeland Security, 2009). Immediate relatives
of US citizens may obtain visas not subject to a cap. Figure 7 shows the allocation of permanent
resident visas by category over the period 1998-2008. Two-thirds of visas went to family
members of US citizens or legal residents, with 44% going to immediate family members and
21% going to other family members. Only 15% of visas went to individuals sponsored by their
employers. Given the relative ease of obtaining visas through family connections, it is perhaps
not surprising that among individuals obtaining a green card in 2003 who had first entered the
United States on a student visa, 56% obtained the green card through marrying a US citizen,
whereas only 20% were sponsored by a US employer (Rosenzweig, 2006). It thus appears that
obtaining permanent residence in the United States is enhanced not just by being a good student
28
or managing to land a US job but by succeeding in the dating market, as well.
4. US IMMIGRATION POLICY AND AMERICAN COMPETITIVENESS
The lessons from section 2 are that US industries capture larger global market shares
when their export supply capacity expands. Export supply capacity, in turn, depends on US
productivity levels, production costs, and international trade costs. Immigration may lower
wages, and therefore production costs, for employers that use intensively the skills that
immigrants bring with them. It may also accelerate productivity growth, if the arrival of foreign
workers expands the supply of R&D labor that is used intensively in innovation. Further,
immigration may lower the costs of international trade by reducing informational barriers.
Empirical evidence, discussed in sections 2 and 3, suggests that all these mechanisms are
operative. Immigration (probably) lowers wages for native workers than compete with
immigrants for jobs and also lowers prices of labor-intensive services. At the same time,
immigration tends to bid up housing prices and to increase tax burdens on native taxpayers, at
least in regions that have a large population of low-skilled immigrants and that provide relatively
generous services to them. Perhaps the most striking and underappreciated evidence about
immigration is its link to innovation. Immigrants are far more likely than natives to study
science and engineering and as a consequence are more likely to produce innovations in the form
of patents. Expanding the supply of high skilled immigrant workers expands patenting activity
in science and engineering fields, particularly in high-tech firms and in US regions that house
these firms.
There is both a strong theoretical and empirical case to be made that immigration
improves US competitiveness in high-tech industries (in the sense that it would expand the share
29
of global demand for high-tech products met by US firms). To what extend does US policy
incorporate the effects of immigration on competitiveness into decisions about how many visas
to allot to whom to allot them? The short answer is not much.
As we see in Figure 7, the United States places much more weight on family reunification
than it does on employability in allocating permanent residence visas. Figure 8 shows the
allocation of visas by legal status. Fully 30% of US immigrants are unauthorized, with the vast
majority of these individuals being low skilled. The United States thus appears to favor
relatively high levels of low-skilled illegal immigration and immigration of US family members.
Further, levels of high-skilled immigration are only weakly responsive to economic conditions.
It is clear in Figure 6 that Congress did not expand H-1B visas until the 1990s technology boom
was nearly over, then kept visas high during the 2001-2002 recession (when demand for visas
was low), and finally reduced visa supply in 2003 just as the US economy (and visa demand)
was beginning to expand once again, yielding binding visa quotas shortly thereafter.
It thus appears that the United States tries hard to divert opportunities for immigration
away from high-skilled workers. However, things are not as bad as they seem, especially when
compared to other high-income countries. In luring high-skilled immigrants, it is the
attractiveness of the US relative to other countries that matters. Relative attractiveness depends,
in part, on US wages and the malleability of US admission policies. Compared to other
countries, the US does well on both counts. Figure 9 shows immigrants as a share of the
population in the United States, Europe, and Australia, Canada, and New Zealand. Immigration
is on the rise across the board, showing the strongest increases in Ireland and Spain, which are
the European countries that until 2008 had both relatively fast income growth and booming
construction sectors. Despite US policies, the United States compares favorably in the skill
30
profile of the immigrants it attracts. Figure 10 shows the share of the immigrant population with
13 or more years of schooling in high-income countries. The tertiary educated are nearly 60
percent of the foreign-born population in Canada, as a consequence of the country’s point system
which gives preference to more skilled individuals in granting immigration visas. The United
States has the second most educated immigrant population, with 42% of US immigrants having
13 or more years of schooling. In Europe, education levels among immigrants are far lower,
with less than 30 percent of immigrants having tertiary education in all countries.
What accounts for the skill profile of US immigrants relative to other nations? Grogger
and Hanson (2008) examine the factors that affect the skill composition of bilateral migration
flows into OECD economies. They find that countries in which the reward to being a skilled
worker is relatively large attract a disproportionate share of more-educated emigrants. In the
United States and Canada, the difference in earnings between high-skilled and low-skilled
workers is much greater than in continental Europe, with this difference being even larger once
we account for Europe’s more progressive tax system and generous welfare benefits. Compared
to Europe, the United States has relatively high inequality in pre-tax earnings, with Europe’s tax
and welfare policies making the United States appear even more unequal when earnings are
evaluated post-tax. The United States and Canada are home to 51% of the OECD’s immigrants,
but 66% of its immigrants with tertiary schooling. Europe, in contrast, receives 38% of the
OECD’s immigrants, but only 24% of those who are tertiary-educated. Skilled immigrants find
their way into the United States – in spite of the country’s immigration policies – because the
reward to skill in the country is so large. Canada attracts skilled immigrants by making its
policies as favorable toward them as any high-income country. Making US immigration policy
more like Canada’s would further enhance the attractiveness of the US as a destination, given the
31
already large advantage afforded by the US wage structure.
Another dimension in which the United States performs relatively well in its immigration
policy is in addressing changes in the demographic structure of the labor force. Throughout the
rich world, fertility rates have been dropping sharply over the last several decades, such that
Korea, Japan, Singapore and most countries in Europe have population growth rates that are well
below replacement. As a consequence, the size of the native-born labor force is beginning to
decline. One possible role for immigration policy is to ease adjustment to a future with smaller
populations, given a near term in which the population of retired workers will be large the
population of active workers will be small (with corresponding pressures on government budget
deficits to grow to cover public pension liabilities). In the United States, past high levels of
immigration have helped keep birth rates relatively high, allowing the US population to continue
to expand. Figure 11 shows the change in the working age population that will result in
countries between 2005 and 2020 if they allow no further immigration. Japan’s working-age
population will fall by over 10 percent and Italy’s and Germany’s by over five percent. In the
United States, in contrast, the working age population will expand by over five percent, even
with no additional inflows of foreign workers. The United States faces comparatively minor
challenges in adjusting to changes in the age structure of its population.
Comparisons to other countries suggest that whatever the United States getting wrong in
its immigration policy, other countries may be doing much worse. Still, were the country to
expand the objectives of immigration policy to include promoting US competitiveness, the
changes would be profound. Shifting immigration visas toward high-skilled workers would have
the potential to expand the US science and engineering labor force, to increase the rate at which
US companies create new patents, and to increase the rate of productivity growth in the US
32
economy. In the process, the United States would likely shift resources toward production
activities that are intensive in the use of science and engineering talent and away from other
activities. Simply reducing visas to family members of US residents by one quarter (roughly
150,000 visas a year) would allow the number of employer-sponsored green cards to double.
Reducing family-based visas by one half would allow employer-sponsored visas to triple.
Relatively modest changes in immigration policy could then have profound effects on US
competitiveness, if the redirected (or expanded) immigration visas were targeted toward foreign
students with the potential to be stars in science and engineering. The United States does
reasonably well in the global competition for talent but it could do much better.
33
REFERENCES
Acemoglu, Daron. 1998. “Why Do New Technologies Complement Skills? Directed Technical
Change and Wage Inequality.” Quarterly Journal of Economics, 1055-1089.
Alden, Edward. 2009. The Closing of the American Border: Terrorism, Immigration and
Security since 9/11. Washington, DC: Harper Perennial.
Ashenfelter, Orley C., Kirk B. Doran, and Bruce Schaller. 2010. “A Shred of Credible Evidence
on the Long Run Elasticity of Labor Supply.” NBER Working Paper No. 15746.
Autor, David H., and David Dorn. 2009. “The Growth of Low Skill Service Jobs and
Polarization of the U.S. Labor Market.” NBER Working Paper No. 15150.
Aydemir, Abdurrahman and George J. Borjas. 2007. “A Comparative Analysis of the Labor
Market Impact of International Migration: Canada, Mexico, and the US.” Journal of the
European Economic Association.
Borjas, George J. 2003. “The Labor Demand Curve Is Downward Sloping: Reexamining the
Impact of Immigration on the Labor Market,” Quarterly Journal of Economics 118: 1335-
1374.
Borjas, George J. 2004. “Do Foreign Students Crowd out Native Students from Graduate
Programs?” NBER Working Paper No. 10349.
Borjas, George J. “Native Internal Migration and the Labor Market Impact of Immigration,”
Journal of Human Resources 41 (Spring 2006): 221-258.
Borjas, George J., Richard B. Freeman, and Lawrence F. Katz. 1997. "How Much Do
Immigration and Trade Affect Labor Market Outcomes?" Brookings Papers on Economic
Activity 1: 1-90.
Borjas, George J., Jeffrey Grogger, Gordon H. Hanson. 2008. “Imperfect Substitution between
Immigrants and Natives: A Reappraisal.” NBER Working Paper No. 13887.
Borjas, George J., and Lynette Hilton. 1996. “Immigration and the Welfare State: Immigrant
Participation in Means-Tested Entitlement Programs” Quarterly Journal of Economics, 111(2):
575-604.
Bound, John, Sarah Turner, and Patrick Walsh. 2009. “Internationalization of US Doctorate
Education.” NBER Working Paper No. 14792.
Camarota, Steven A. 2004. The High Cost of Cheap Labor: Illegal Immigration and the Federal
Budget. Washington, DC: Center for Immigration Studies.
Capps, Randall, Michael Fix, Everett Henderson, Jane Reardon-Anderson. 2005. “A Profile of
Low-Income Working Immigrant Families.” Urban Institute Working Paper B-67.
Card, David. 2001 “Immigrant Inflows, Native Outflows, and the Local Labor Market Impacts of
Higher Immigration,” Journal of Labor Economics , 19(1): 22-64.
Card, David. 2005. “Is the New Immigration Really so Bad?” Economic Journal, 115(507):
300-323.
Casella. Alessandra, and James E. Rauch. 2002 “Anonymous and Group Ties in International
Trade.” Journal of International Economics, 58: 19-47
34
Cortes, Patricia. 2008. “The Effect of Low-Skilled Immigration on U.S. Prices: Evidence from CPI
Data.” Journal of Political Economy, 116(3): 381-422.
Cortes, Patricia, and Jose Tessada. 2009. “Low-Skilled Immigration and the Labor Supply of
Highly Educated Women.” Mimeo, Boston University.
Eaton, Jonathan, and Samuel Kortum. 2002. "Technology, Geography, and Trade."
Econometrica, 70(5): 1741-1779.
Eaton, Jonathan, and Samuel, Kortum. 2009. “Technology in the Global Economy: A
Framework for Quantitative Analysis.” Mimeo, University of Chicago.
Freeman, Richard B. 2006. "People Flows in Globalization." Journal of Economic Perspectives,
20(2): 145-170.
Freeman, Richard B. 2009. “What Does Global Expansion of Higher Education Mean for the
US?” NBER Working Paper No. 14962.
Grogger, Jeffrey, and Gordon H. Hanson. 2010. "Income Maximization and the Selection and
Sorting of International Migrants," Journal of Development Economics, forthcoming.
Grossman, Gene M., and Elhanan Helpman. 1991. “Quality Ladders in the Theory of Growth.”
Review of Economic Studies, 58: 43-61.
Gould, David M. 1994. “Immigration Links to the Home Country: Empirical Implications for
U.S. bilateral Trade Flows.” Review of Economics and Statistics, 76: 302-316.
Hanson, Gordon H. 2005. Why Does Immigration Divide America? Washington, DC: Institute
for International Economics.
Hanson, Gordon H. 2007. "The Economic Logic of Illegal Immigration," Council Special
Report No. 26, Council on Foreign Relations.
Hanson, Gordon H. 2009. “The Economic Consequences of International Migration,” Annual
Review of Economics, 1: 179-208.
Hanson, Gordon H. 2010. “International Migration and the Developing World,” in Dani Rodrik
and Mark Rosenzweig, eds., Handbook of Development Economics, Vol. 5, Amsterdam:
North Holland, 4363-4414.
Hanson, Gordon H., Kenneth Scheve, and Matthew J. Slaughter. 2007. “Local Public Finance
and Individual Preferences over Globalization Strategies.” Economics and Politics, 19: 1-33.
Head, Keith, John Ries, and Deborah Swenson. 1998. “Immigration and Trade Creation:
Econometric Evidence from Canada.” Canadian Journal of Economics, 31(1): 47-62.
Hsieh, Chang Tai, and Ralph Ossa. 2010. “A Global View of Productivity Growth in China.”
Mimeo, University of Chicago.
Hunt, Jennifer. 2009. “Which Immigrants Are Most Innovative and Entrepreneurial?” Mimeo,
McGill University.
Hunt, Jennifer, and Marjolaine Gauthier-Loiselle. 2008. “How Much Does Immigration Boost
Innovation?” NBER Working Paper No. 14313.
Jones, Charles. 1995. “R&D Based Models of Economic Growth.” Journal of Political
Economy, 103(4): 759-784.
35
Kato, Takao, and Chad Spulber. 2010. “Quotas and Quality: The Effect of H-1B Visa
Restrictions on the Pool of Prospective Undergraduate Students from Abroad.” IZA
Discussion Paper No. 4951.
Kerr, William, and William Lincoln. 2010. “The Supply Side of Innovation: H-1B Visa
Reforms and US Ethnic Invention.” NBER Working Paper No. 15768.
Lewis, Ethan. 2010. “Immigration, Skill Mix, and Capital-Skill Complementarity.” Quarterly
Journal of Economics, forthcoming.
Lucas, Robert. 1988. “The Mechanics of Economic Growth.” Journal of Monetary Economics.
22(1): 3-42.
Passel, Jeffrey, and D’Vera Cohn. 2010. “US Unauthorized Inflows are Down Sharply Since
Mid Decade.” Pew Center for Hispanic Studies.
Rauch, James E., 1999, “Networks versus Markets in International Trade,” Journal of
International Economics, 48(1): 7-35.
Rauch, James E. and Vitor Trindade, 2002, “Ethnic Chinese Networks in International Trade,”
Review of Economics and Statistics, 84(1), February, 116-130.
Rosenzweig, Mark. 2006. “Global Wage Differences and International Student Flows.”
Brookings Trade Forum 2006: 57-86.
Rosenzweig, Mark. 2007. “Education and Migration: A Global Perspective.” Mimeo, Yale
University.
Saiz, Alberto. 2007. “Immigration and Housing Rents in American Cities.” Journal of Urban
Economics, 61(2): 345-371.
Saxenian, AnnaLee. 2002. Local and Global Networks of Immigrant Professionals in Silicon
Valley. Monograph, Public Policy Institute of California.
Smith, James P. and Barry Edmonston, eds. The New Americans: Economic, Demographic, and
Fiscal Effects of Immigration. Washington, DC: National Academy Pres, 1997.
Stuen, Eric T., Ahmed Musfiq Mobarak, and Keith Maskus. 2010. “Skilled Immigration and
Innovation: Evidence from Enrollment Fluctuations in US Universities.” CEPR Discussion
Paper No. 7709.
Zucker, Lynne G. and Michale R. Darby. 2008. “Star Scientists, Innovation, and Regional and
National Immigration.” NBER Working Paper No. 13547.
36
FIGURE 1: SHARE OF US EMPLOYMENT BY EDUCATION GROUP
(a) Hours Worked
(b) Wagebill
0 .1 .2 .3Share of hours worked
PhD
MA or Prof. degree
BA degree
Some college
HS grad
Less than HS
1990 2008
0 .1 .2 .3Share of total wages
PhD
MA or Prof. degree
BA degree
Some college
HS grad
Less than HS
1990 2008
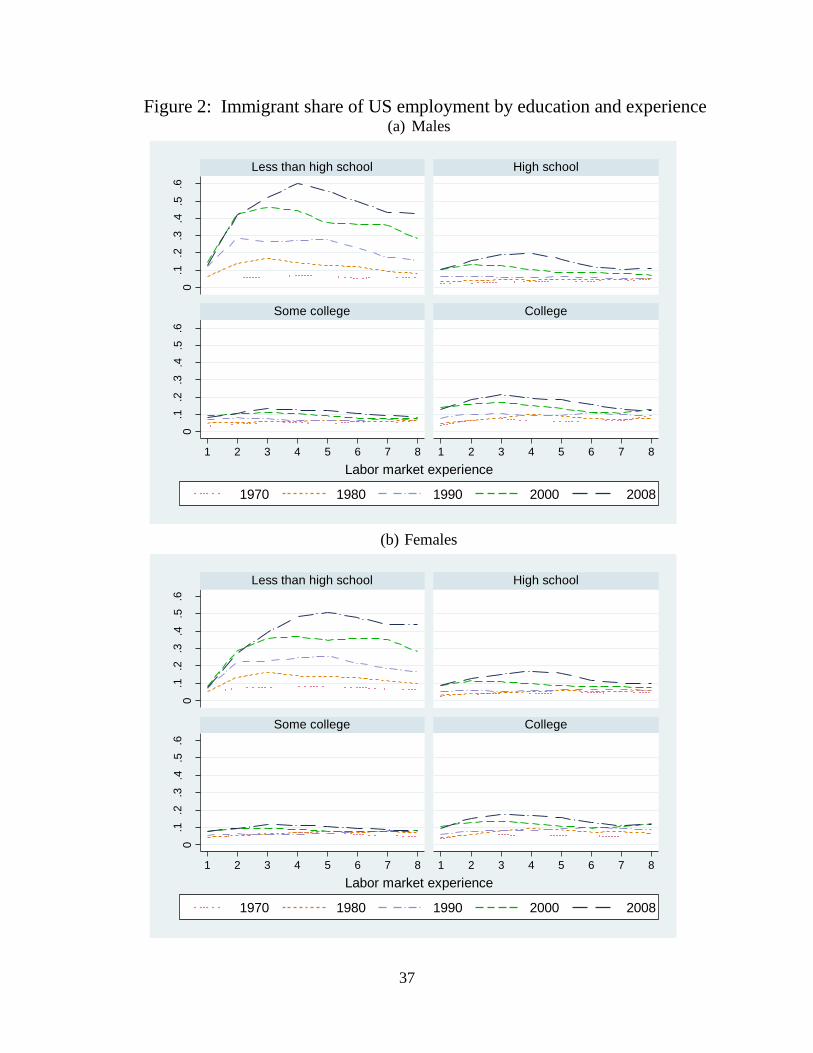
37
Figure 2: Immigrant share of US employment by education and experience (a) Males
(b) Females
0.1
.2.3
.4.5
.60
.1.2
.3.4
.5.6
1 2 3 4 5 6 7 8 1 2 3 4 5 6 7 8
Less than high school High school
Some college College
1970 1980 1990 2000 2008
Imm
igra
nt
share
of
em
plo
ym
ent
Labor market experience
0.1
.2.3
.4.5
.60
.1.2
.3.4
.5.6
1 2 3 4 5 6 7 8 1 2 3 4 5 6 7 8
Less than high school High school
Some college College
1970 1980 1990 2000 2008
Imm
igra
nt
share
of
em
plo
ym
ent
Labor market experience

38
Figure 3: Immigrant share of employment for highly educated workers (a) Males
(b) Females
0.1
.2.3
.40
.1.2
.3.4
1 2 3 4 5 6 7 8 1 2 3 4 5 6 7 8
BA degree MA degree
Prof. degree PhD
1990 2000 2008
Imm
igra
nt
share
of
em
plo
ym
ent
Labor market experience
0.1
.2.3
.40
.1.2
.3.4
1 2 3 4 5 6 7 8 1 2 3 4 5 6 7 8
BA degree MA degree
Prof. degree PhD
1990 2000 2008
Imm
igra
nt
share
of
em
plo
ym
ent
Labor market experience
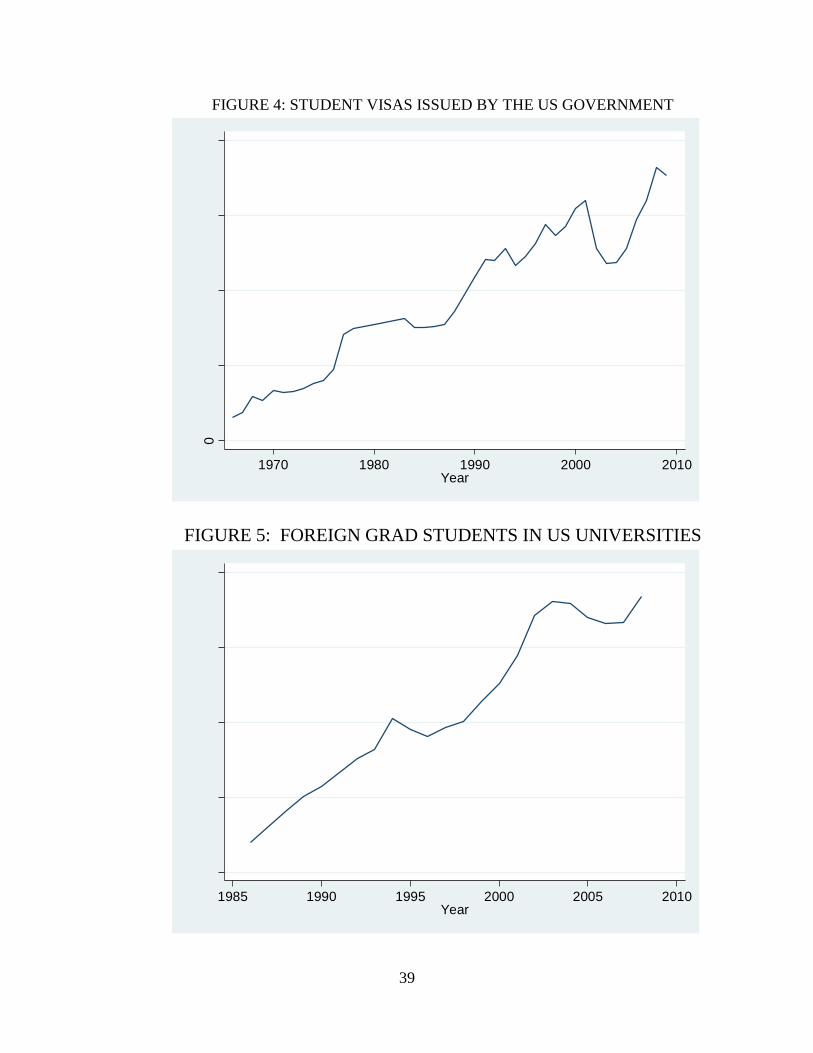
39
FIGURE 4: STUDENT VISAS ISSUED BY THE US GOVERNMENT
FIGURE 5: FOREIGN GRAD STUDENTS IN US UNIVERSITIES
0
100
00
02
00
00
03
00
00
04
00
00
0
F v
isas issu
ed
1970 1980 1990 2000 2010Year
100
00
01
50
00
02
00
00
02
50
00
03
00
00
0
En
rollm
ent o
f fo
reig
n g
rad s
tude
nts
1985 1990 1995 2000 2005 2010Year
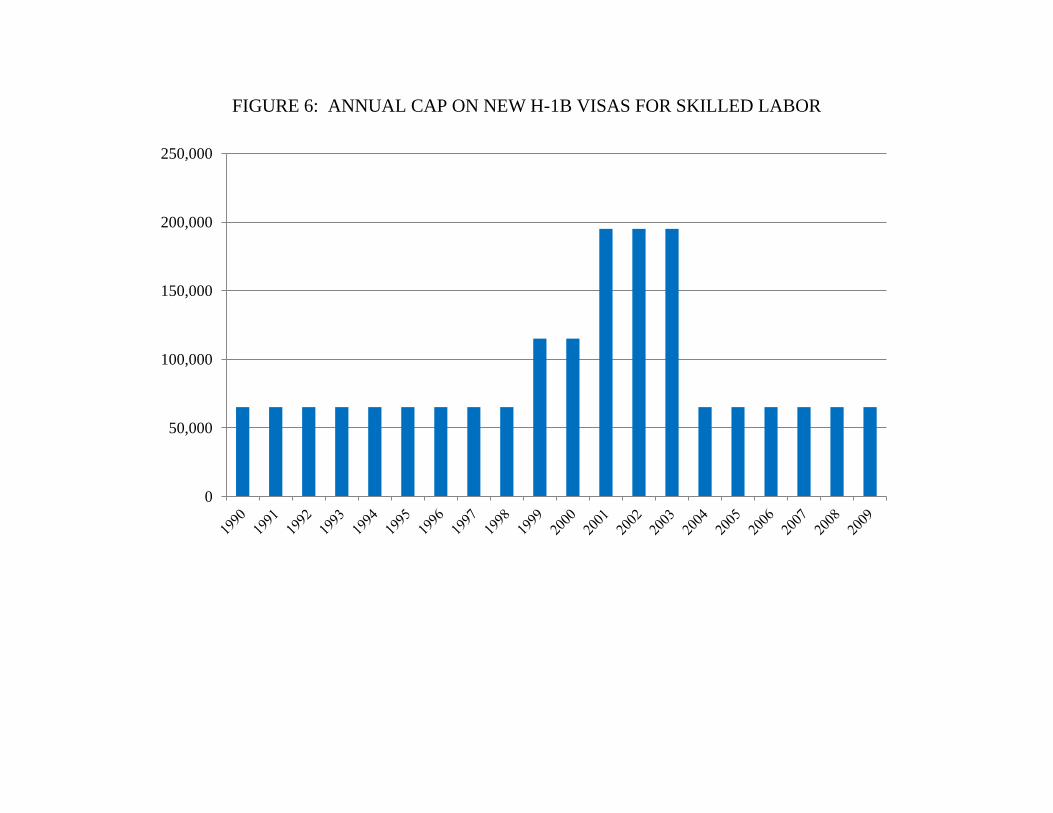
FIGURE 6: ANNUAL CAP ON NEW H-1B VISAS FOR SKILLED LABOR
0
50,000
100,000
150,000
200,000
250,000
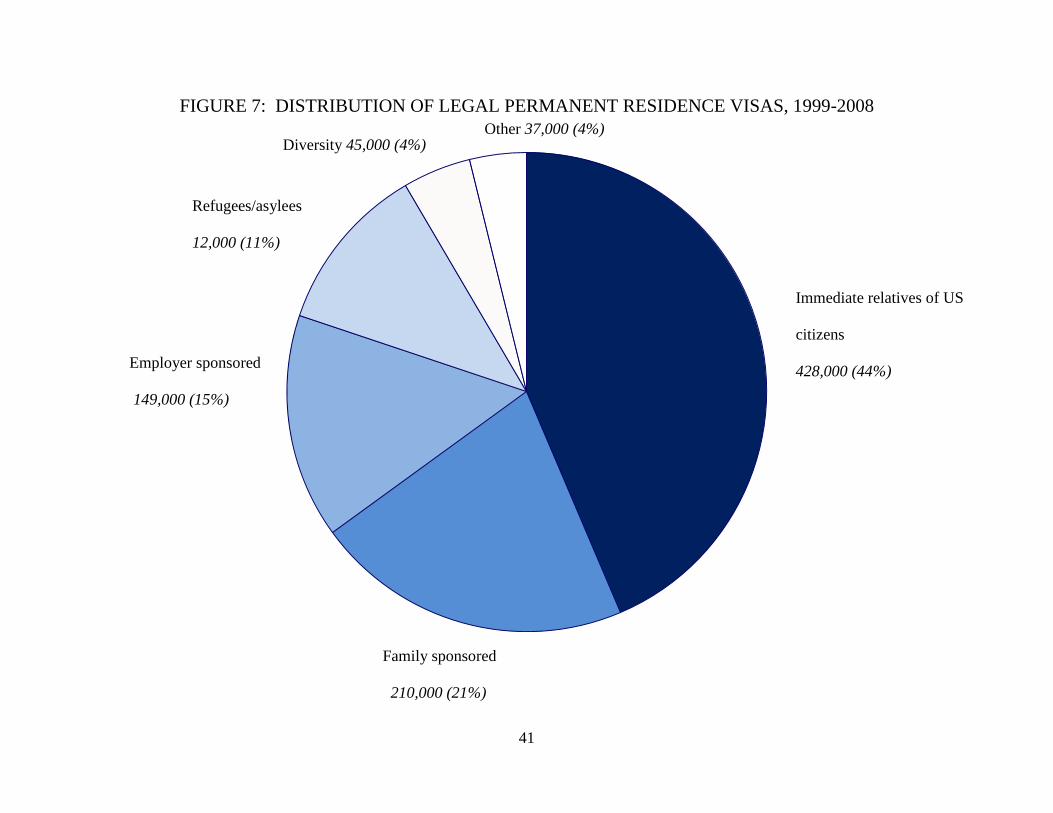
41
FIGURE 7: DISTRIBUTION OF LEGAL PERMANENT RESIDENCE VISAS, 1999-2008
Immediate relatives of US
citizens
428,000 (44%)
Employer sponsored
149,000 (15%)
Family sponsored
210,000 (21%)
Refugees/asylees
12,000 (11%)
Diversity 45,000 (4%) Other 37,000 (4%)
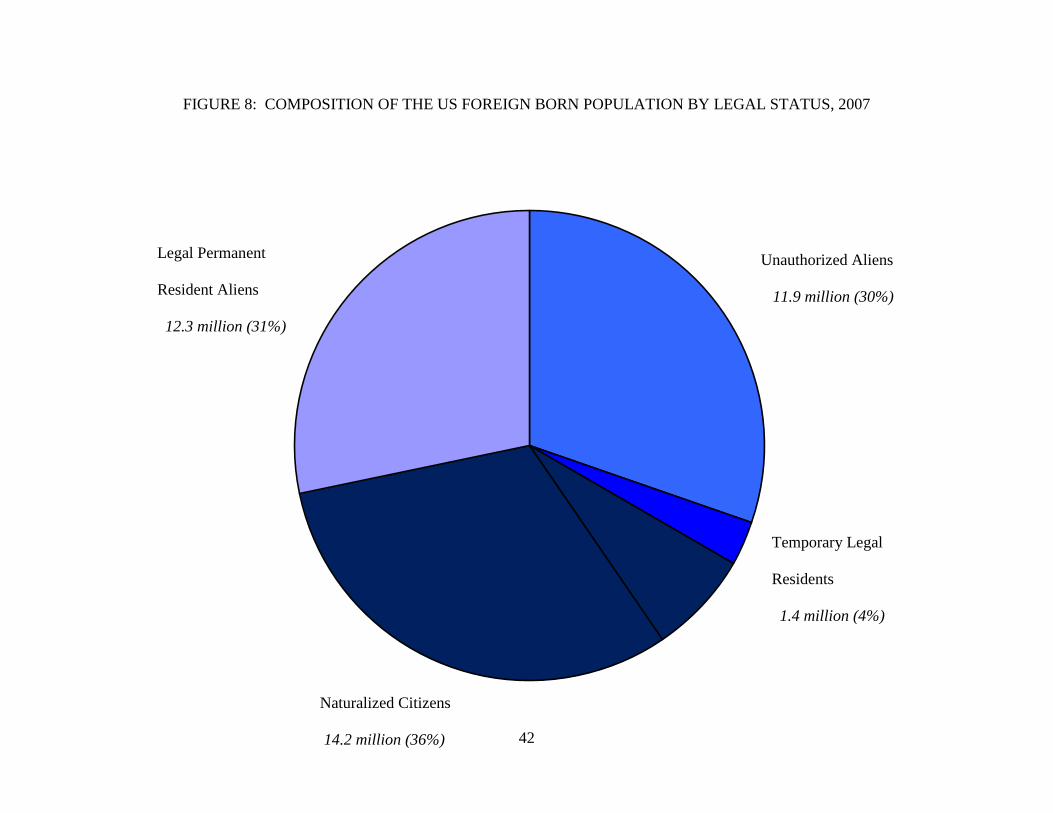
42
FIGURE 8: COMPOSITION OF THE US FOREIGN BORN POPULATION BY LEGAL STATUS, 2007
Naturalized Citizens
14.2 million (36%)
Legal Permanent
Resident Aliens
12.3 million (31%)
Unauthorized Aliens
11.9 million (30%)
Temporary Legal
Residents
1.4 million (4%)
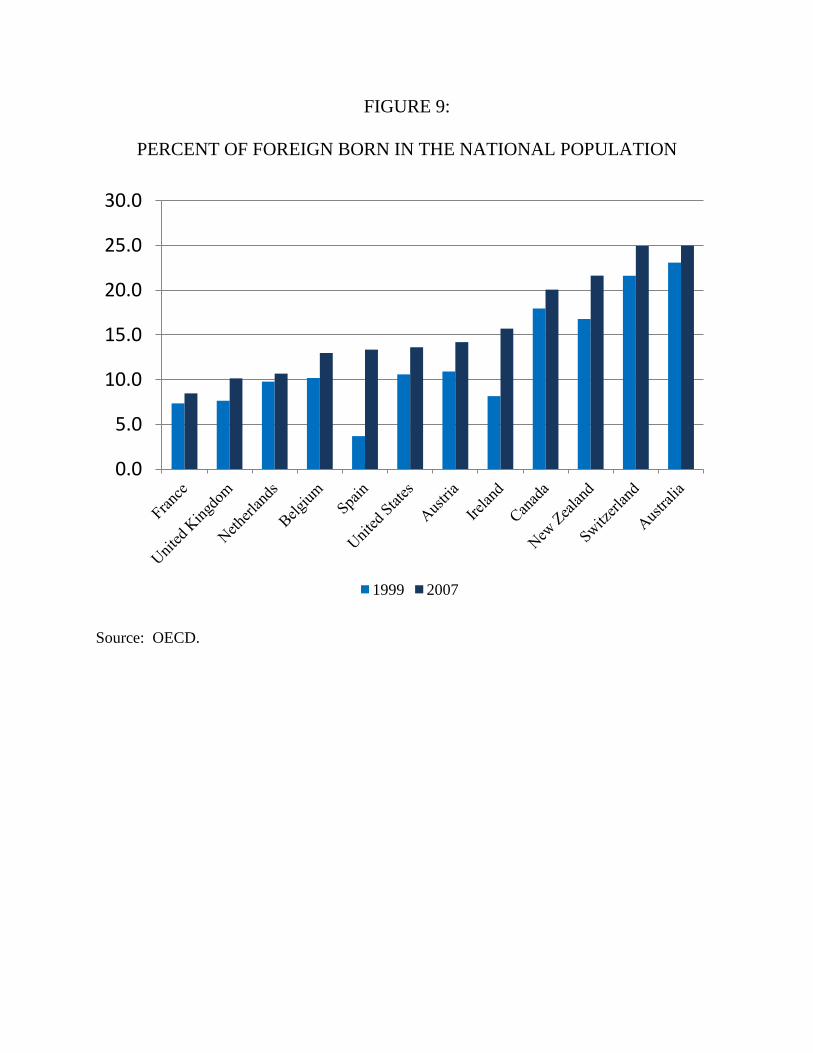
FIGURE 9:
PERCENT OF FOREIGN BORN IN THE NATIONAL POPULATION
Source: OECD.
0.0
5.0
10.0
15.0
20.0
25.0
30.0
1999 2007
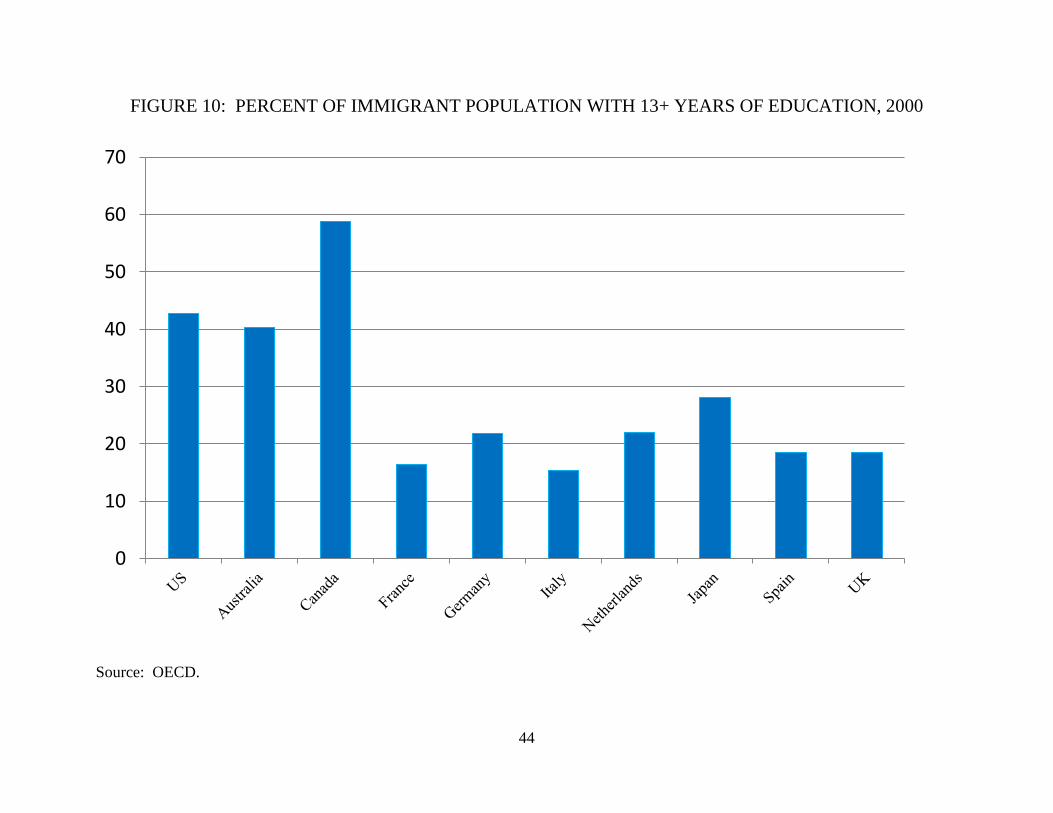
44
FIGURE 10: PERCENT OF IMMIGRANT POPULATION WITH 13+ YEARS OF EDUCATION, 2000
Source: OECD.
0
10
20
30
40
50
60
70
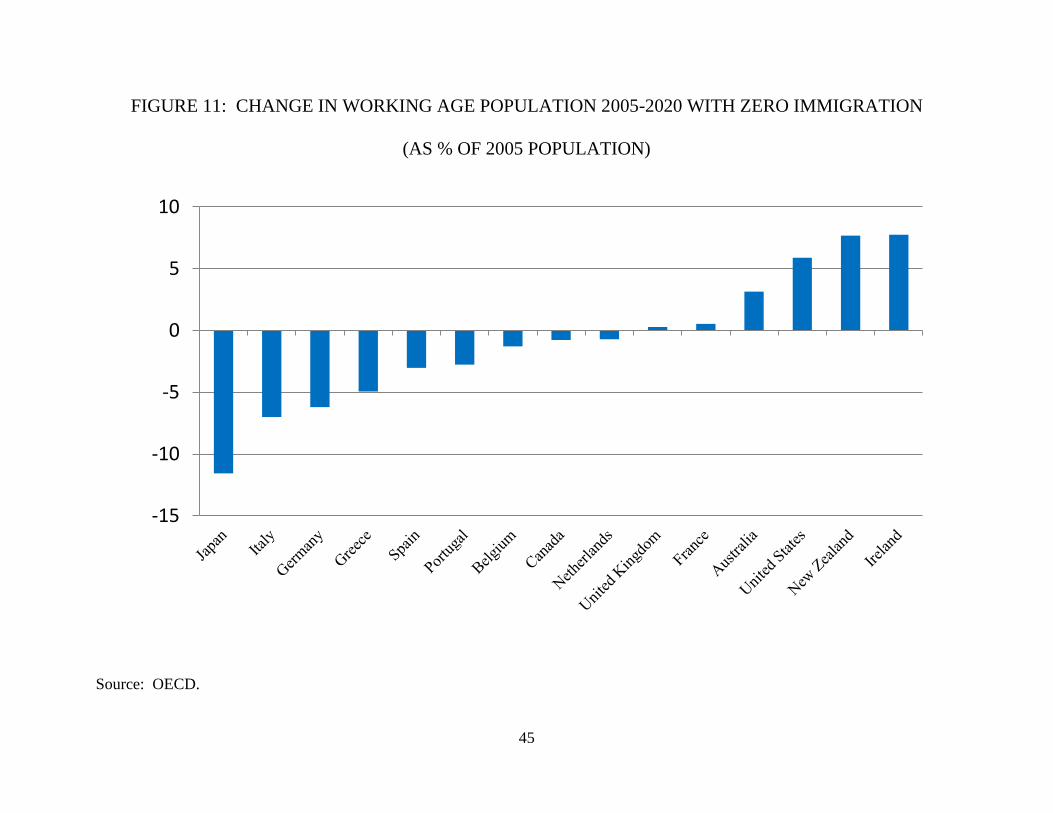
45
FIGURE 11: CHANGE IN WORKING AGE POPULATION 2005-2020 WITH ZERO IMMIGRATION
(AS % OF 2005 POPULATION)
Source: OECD.
-15
-10
-5
0
5
10