Embed Size (px)
Citation preview
What's New in IMG 3.3
1
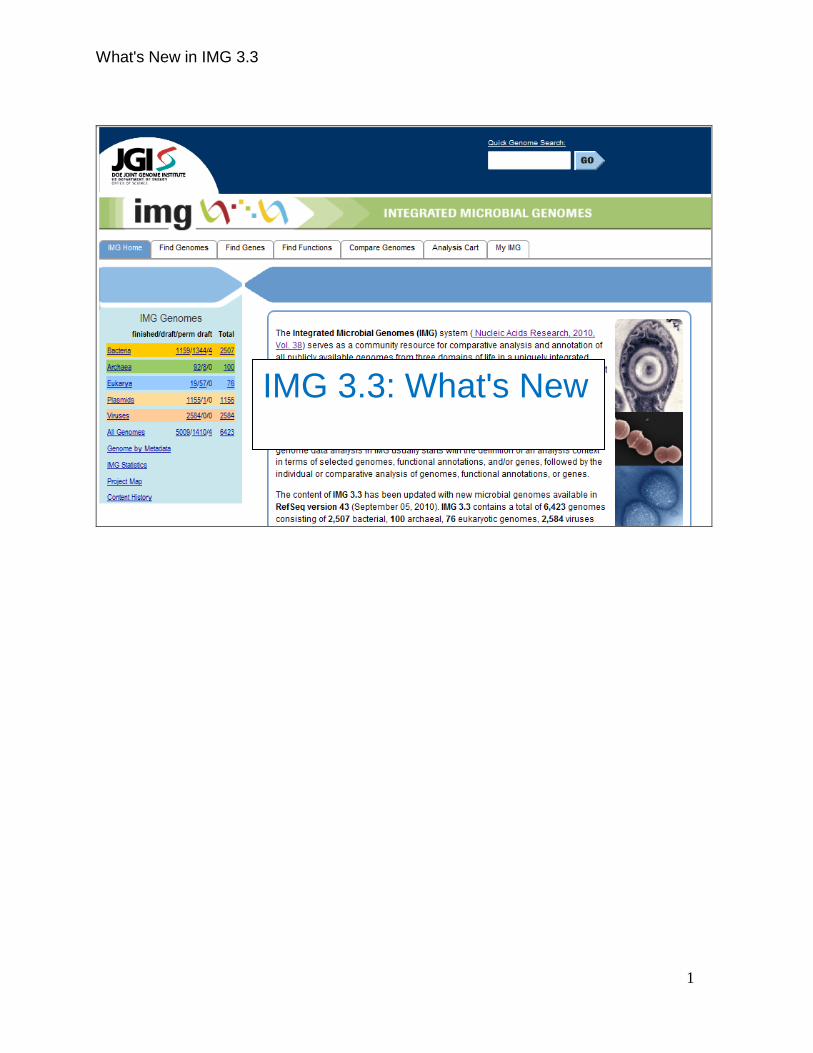
IMG 3.3: What's New
What's New in IMG 3.3
2
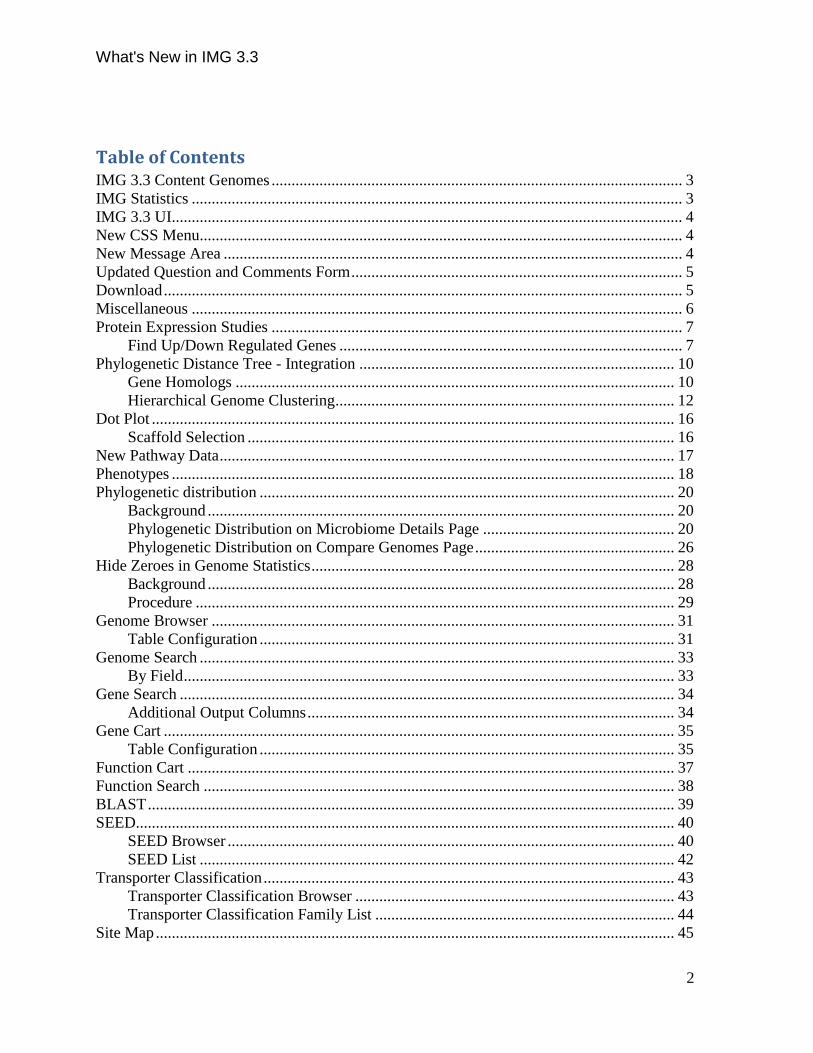
Table of Contents IMG 3.3 Content Genomes ....................................................................................................... 3 IMG Statistics ........................................................................................................................... 3 IMG 3.3 UI................................................................................................................................ 4 New CSS Menu......................................................................................................................... 4 New Message Area ................................................................................................................... 4
Updated Question and Comments Form ................................................................................... 5 Download .................................................................................................................................. 5 Miscellaneous ........................................................................................................................... 6
Protein Expression Studies ....................................................................................................... 7 Find Up/Down Regulated Genes ...................................................................................... 7
Phylogenetic Distance Tree - Integration ............................................................................... 10
Gene Homologs .............................................................................................................. 10 Hierarchical Genome Clustering ..................................................................................... 12
Dot Plot ................................................................................................................................... 16 Scaffold Selection ........................................................................................................... 16
New Pathway Data .................................................................................................................. 17
Phenotypes .............................................................................................................................. 18 Phylogenetic distribution ........................................................................................................ 20
Background ..................................................................................................................... 20 Phylogenetic Distribution on Microbiome Details Page ................................................ 20
Phylogenetic Distribution on Compare Genomes Page .................................................. 26 Hide Zeroes in Genome Statistics ........................................................................................... 28
Background ..................................................................................................................... 28
Procedure ........................................................................................................................ 29 Genome Browser .................................................................................................................... 31
Table Configuration ........................................................................................................ 31 Genome Search ....................................................................................................................... 33
By Field ........................................................................................................................... 33
Gene Search ............................................................................................................................ 34 Additional Output Columns ............................................................................................ 34
Gene Cart ................................................................................................................................ 35 Table Configuration ........................................................................................................ 35
Function Cart .......................................................................................................................... 37 Function Search ...................................................................................................................... 38 BLAST .................................................................................................................................... 39 SEED....................................................................................................................................... 40
SEED Browser ................................................................................................................ 40
SEED List ....................................................................................................................... 42 Transporter Classification ....................................................................................................... 43
Transporter Classification Browser ................................................................................ 43 Transporter Classification Family List ........................................................................... 44
Site Map .................................................................................................................................. 45
What's New in IMG 3.3
3
IMG 3.3 Content Genomes The content of IMG 3.3 has been updated with new microbial genomes available in RefSeq
version 43 (September 05, 2010). IMG 3.3 contains a total of 6,423 genomes consisting of
2,507 bacterial, 100 archaeal, 76 eukaryotic genomes, 2,584 viruses (including bacterial
phages), and 1,156 plasmids that did not come from a specific microbial genome sequencing
project. Among these genomes, 5,009 are finished genomes, and 1,410 are draft genomes,
and 4 are permanent draft (i.e., will never be finished) genomes.
Note that 21 microbial genomes from IMG 3.2 were replaced in IMG 3.3 because (1) a
draft genome has been replaced by its finished version, or (2) the composition of the
genome has changed through the addition of new replicons (plasmids, chromosomes). For
replaced genomes, the gene object identifiers (gene OIDs) for the protein-coding genes
(CDS) were mapped to their new version in IMG. 3.3. See IMG Data Evolution History for
details.
IMG 3.3 also contains proteomic data from Arthrobacter chlorophenolicus1,
Cryptobacterium curtum, and Brachybacterium faecium studies.
IMG Statistics Various statistics are provided via the IMG Statistics link on the home page of IMG, as
shown below, including IMG Total Gene Count which consists of counting all the genes
(protein coding genes, RNA genes) in IMG, except obsolete genes. Compared to IMG 3.2,
IMG 3.3 contains 10,151,522 genes, an increase of 781,122 genes.
What's New in IMG 3.3
4
IMG 3.3 UI
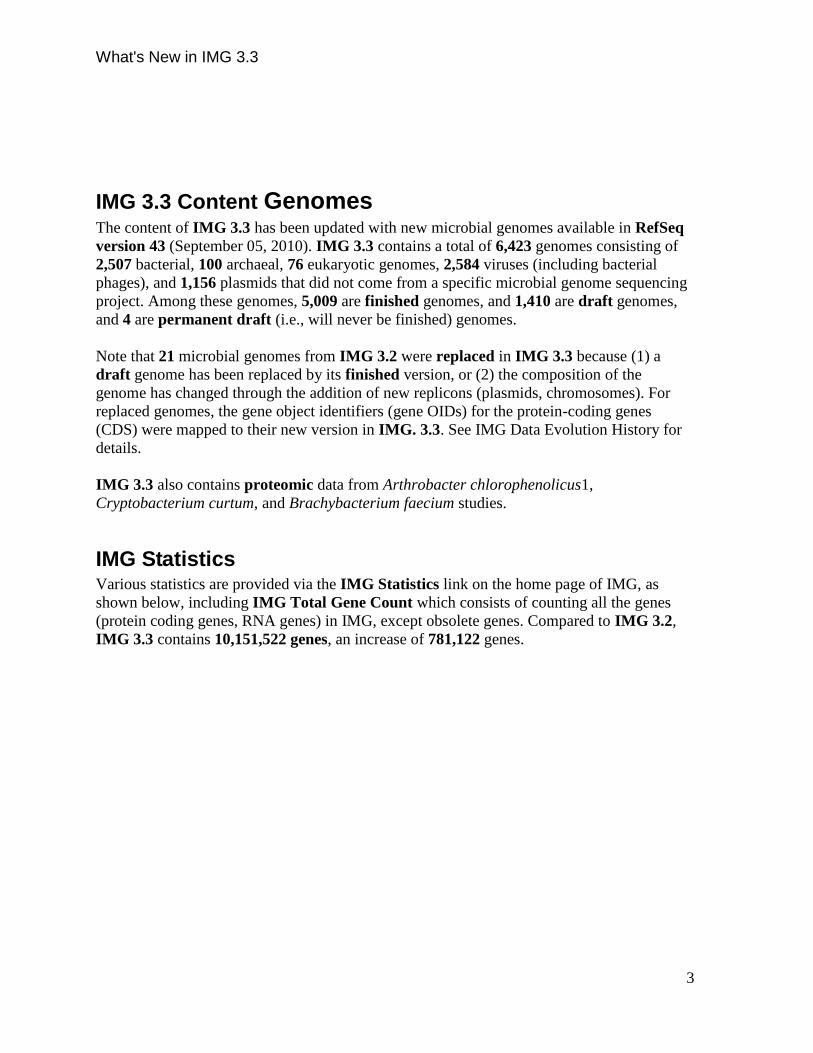
New CSS Menu IMG is now using CSS menu. To display menu you just mouse over text area. See Figure 1
Figure 1 CSS Menu
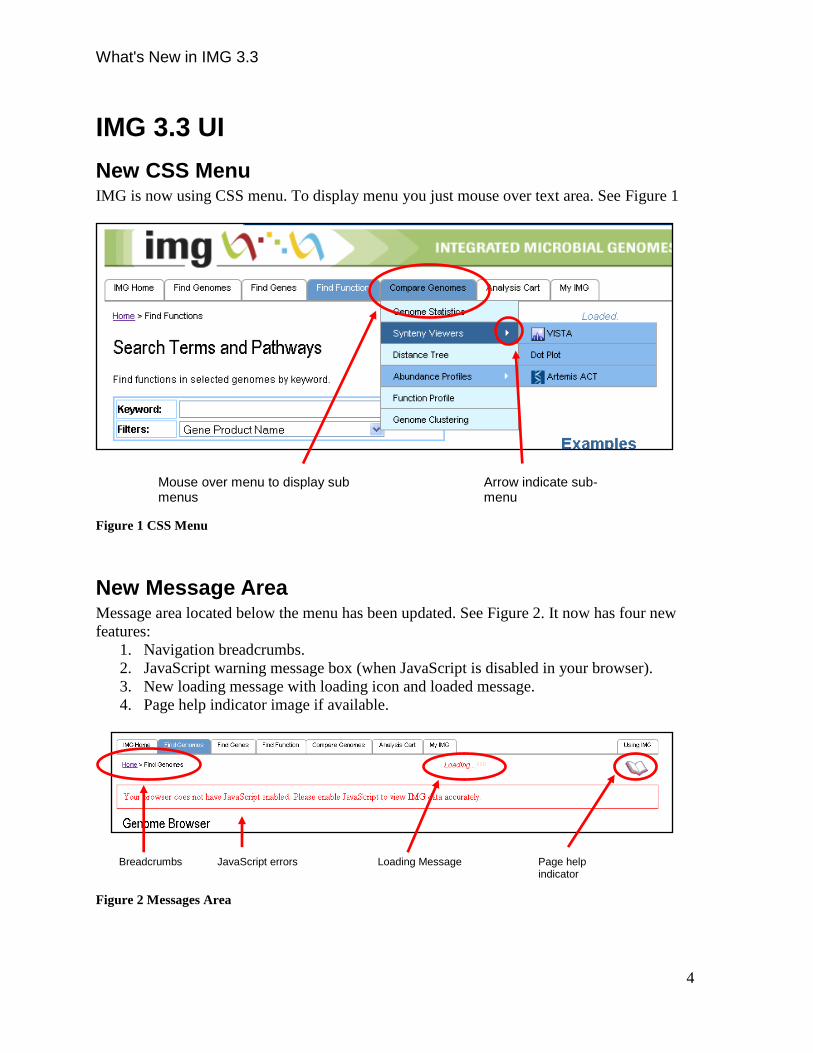
New Message Area Message area located below the menu has been updated. See Figure 2. It now has four new
features:
1. Navigation breadcrumbs.
2. JavaScript warning message box (when JavaScript is disabled in your browser).
3. New loading message with loading icon and loaded message.
4. Page help indicator image if available.
Figure 2 Messages Area
Mouse over menu to display sub menus
Arrow indicate sub-menu
Breadcrumbs JavaScript errors Loading Message Page help indicator
What's New in IMG 3.3
5
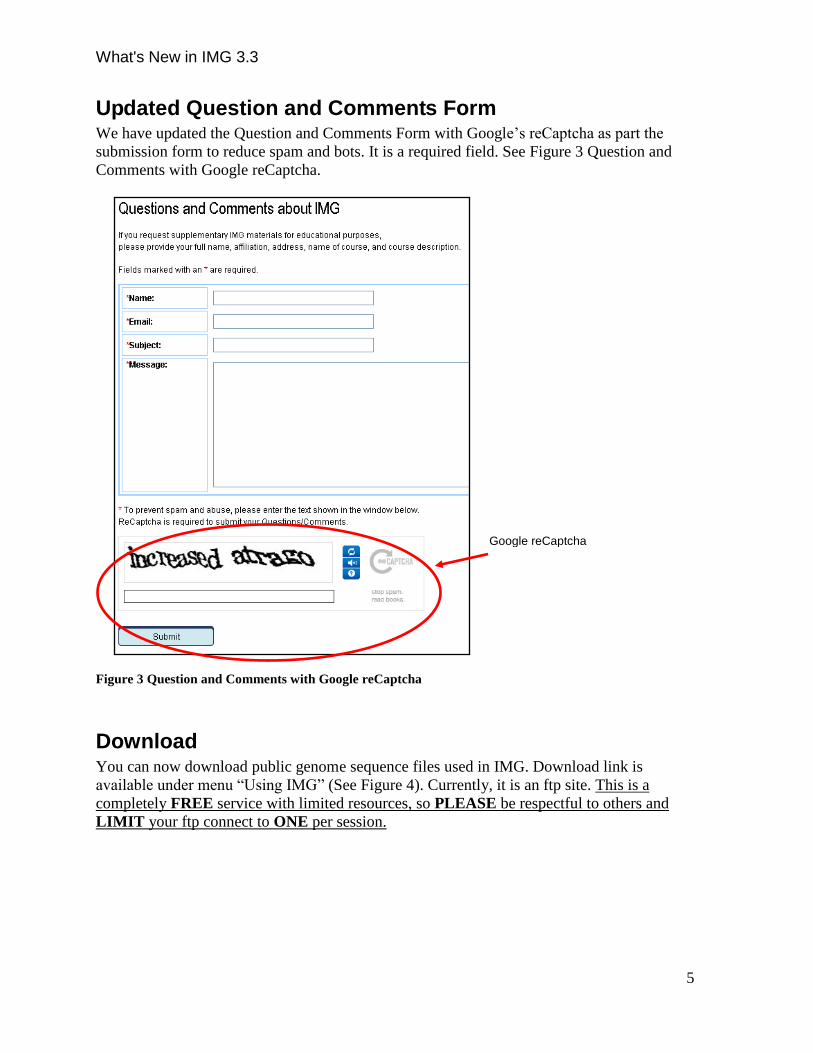
Updated Question and Comments Form We have updated the Question and Comments Form with Google’s reCaptcha as part the
submission form to reduce spam and bots. It is a required field. See Figure 3 Question and
Comments with Google reCaptcha.
Figure 3 Question and Comments with Google reCaptcha
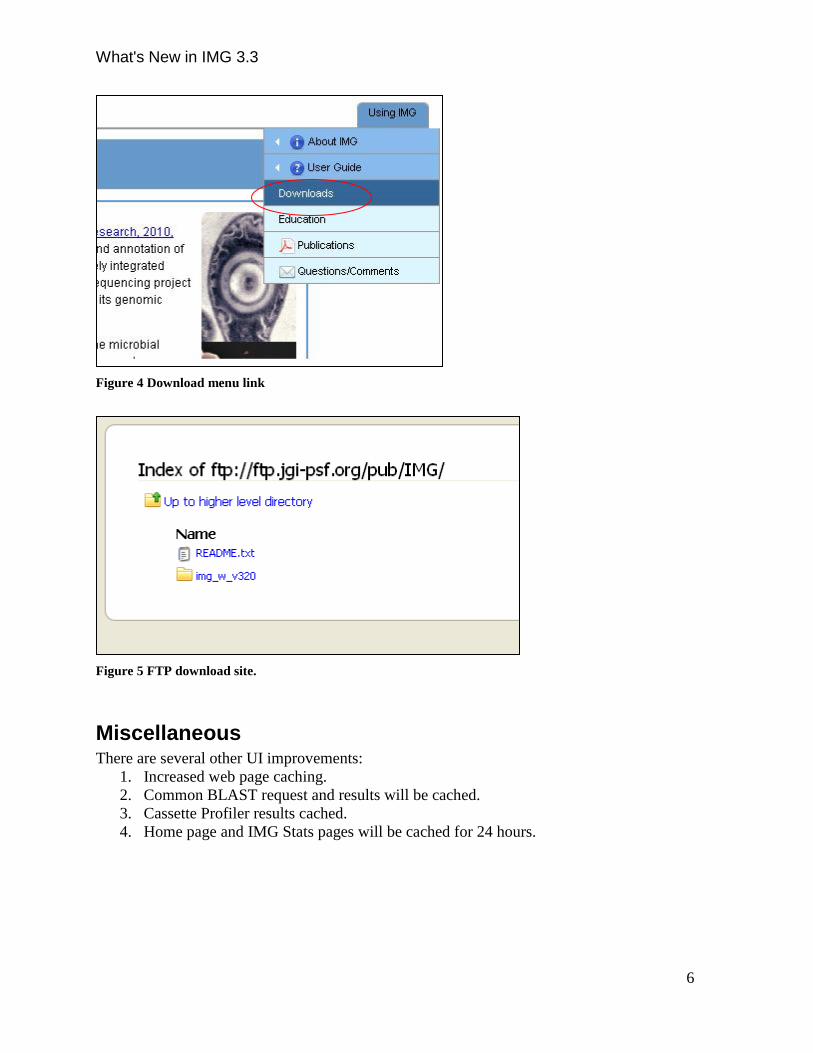
Download You can now download public genome sequence files used in IMG. Download link is
available under menu “Using IMG” (See Figure 4). Currently, it is an ftp site. This is a
completely FREE service with limited resources, so PLEASE be respectful to others and
LIMIT your ftp connect to ONE per session.
Google reCaptcha
What's New in IMG 3.3
6
Figure 4 Download menu link
Figure 5 FTP download site.
Miscellaneous There are several other UI improvements:
1. Increased web page caching.
2. Common BLAST request and results will be cached.
3. Cassette Profiler results cached.
4. Home page and IMG Stats pages will be cached for 24 hours.
What's New in IMG 3.3
7
Protein Expression Studies
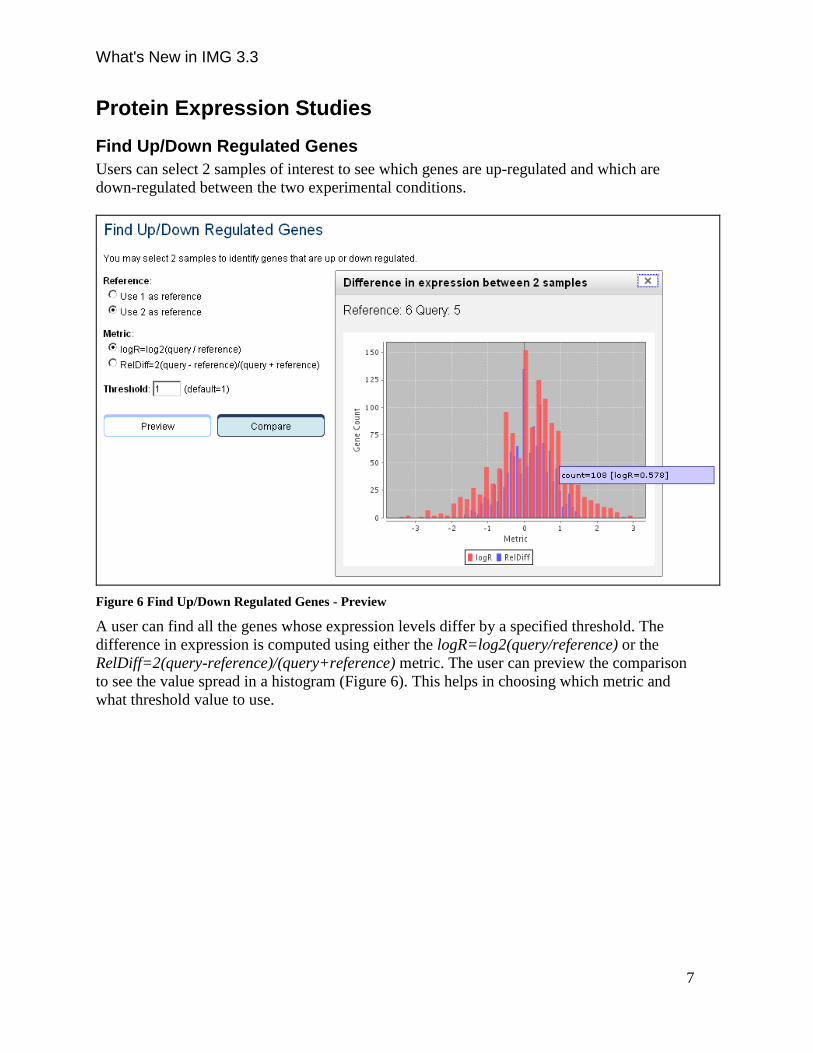
Find Up/Down Regulated Genes
Users can select 2 samples of interest to see which genes are up-regulated and which are
down-regulated between the two experimental conditions.
Figure 6 Find Up/Down Regulated Genes - Preview
A user can find all the genes whose expression levels differ by a specified threshold. The
difference in expression is computed using either the logR=log2(query/reference) or the
RelDiff=2(query-reference)/(query+reference) metric. The user can preview the comparison
to see the value spread in a histogram (Figure 6). This helps in choosing which metric and
what threshold value to use.
What's New in IMG 3.3
8
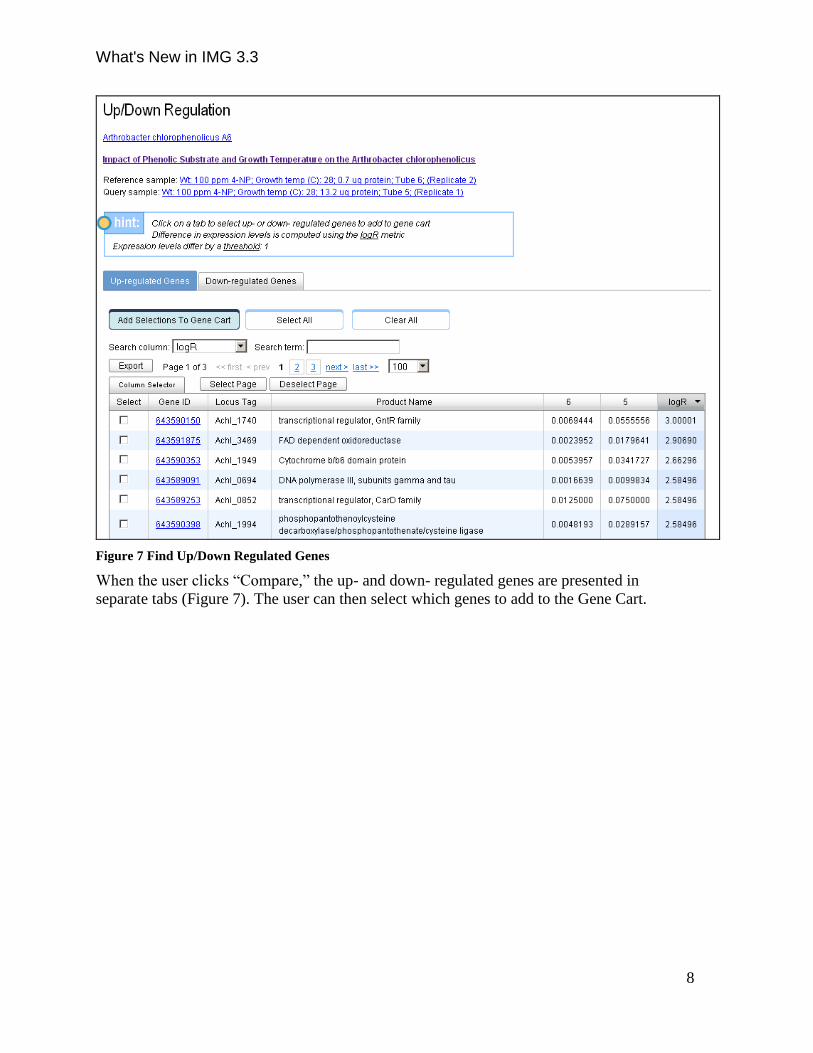
Figure 7 Find Up/Down Regulated Genes
When the user clicks “Compare,” the up- and down- regulated genes are presented in
separate tabs (Figure 7). The user can then select which genes to add to the Gene Cart.
What's New in IMG 3.3
9
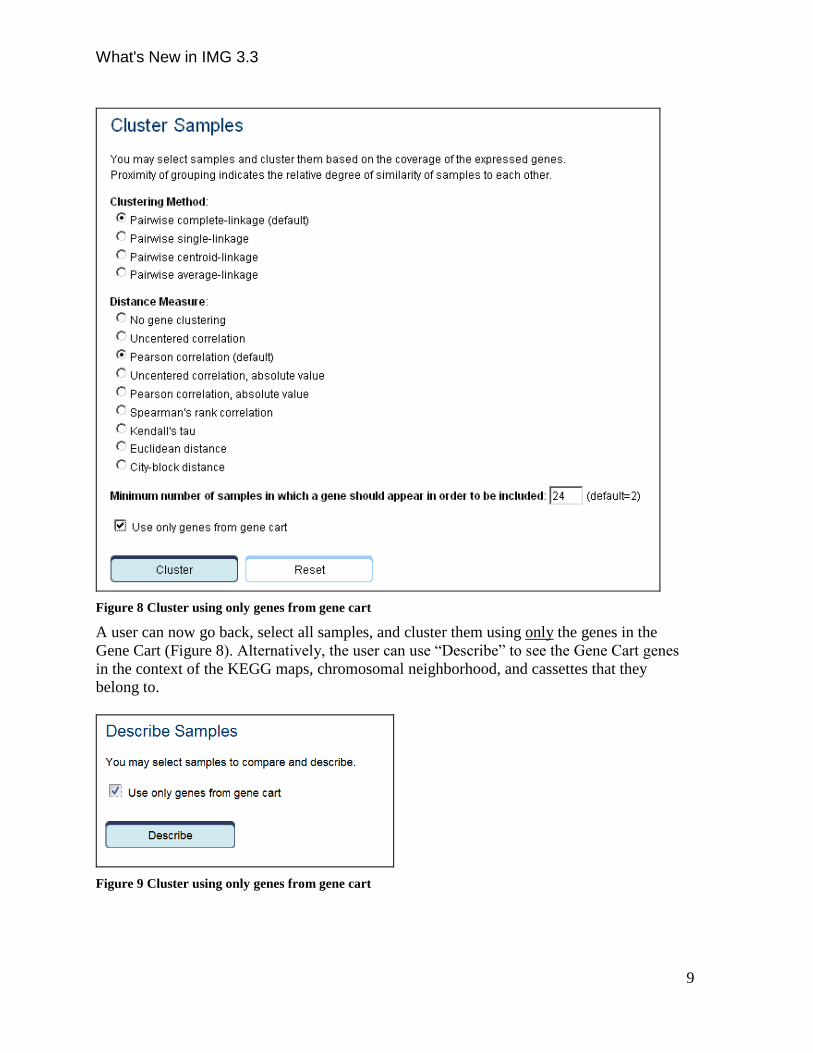
Figure 8 Cluster using only genes from gene cart
A user can now go back, select all samples, and cluster them using only the genes in the
Gene Cart (Figure 8). Alternatively, the user can use “Describe” to see the Gene Cart genes
in the context of the KEGG maps, chromosomal neighborhood, and cassettes that they
belong to.
Figure 9 Cluster using only genes from gene cart
What's New in IMG 3.3
10
Phylogenetic Distance Tree - Integration
Gene Homologs
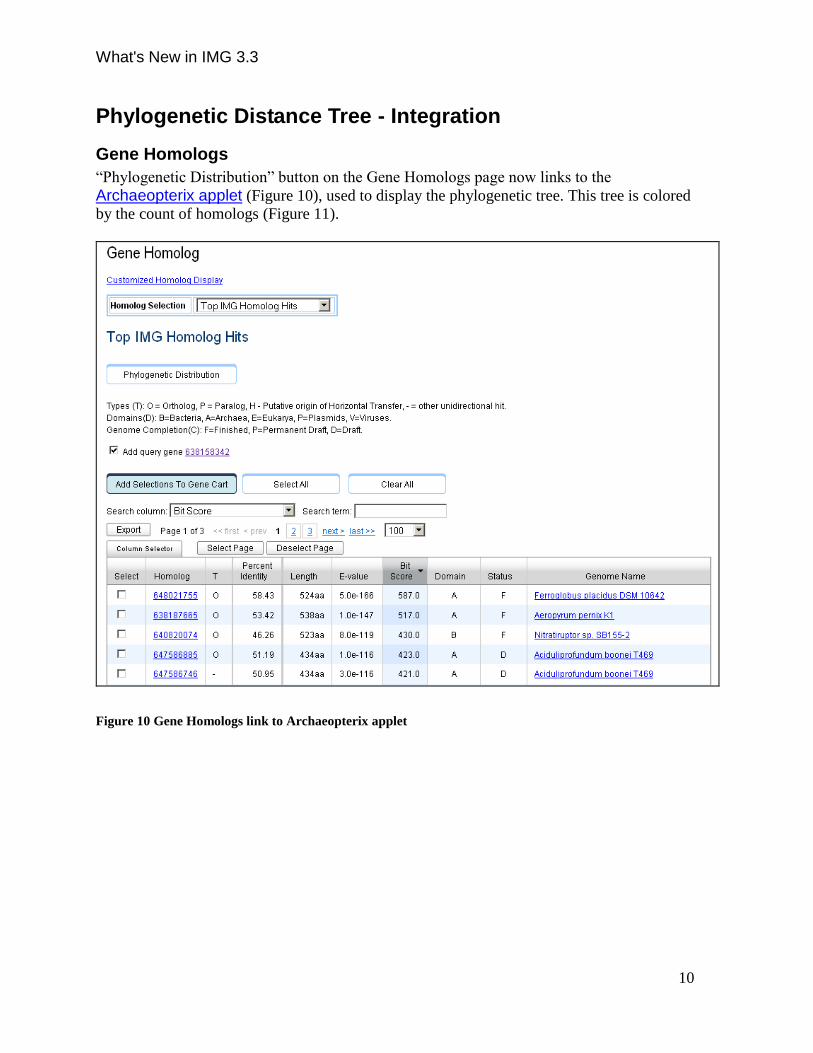
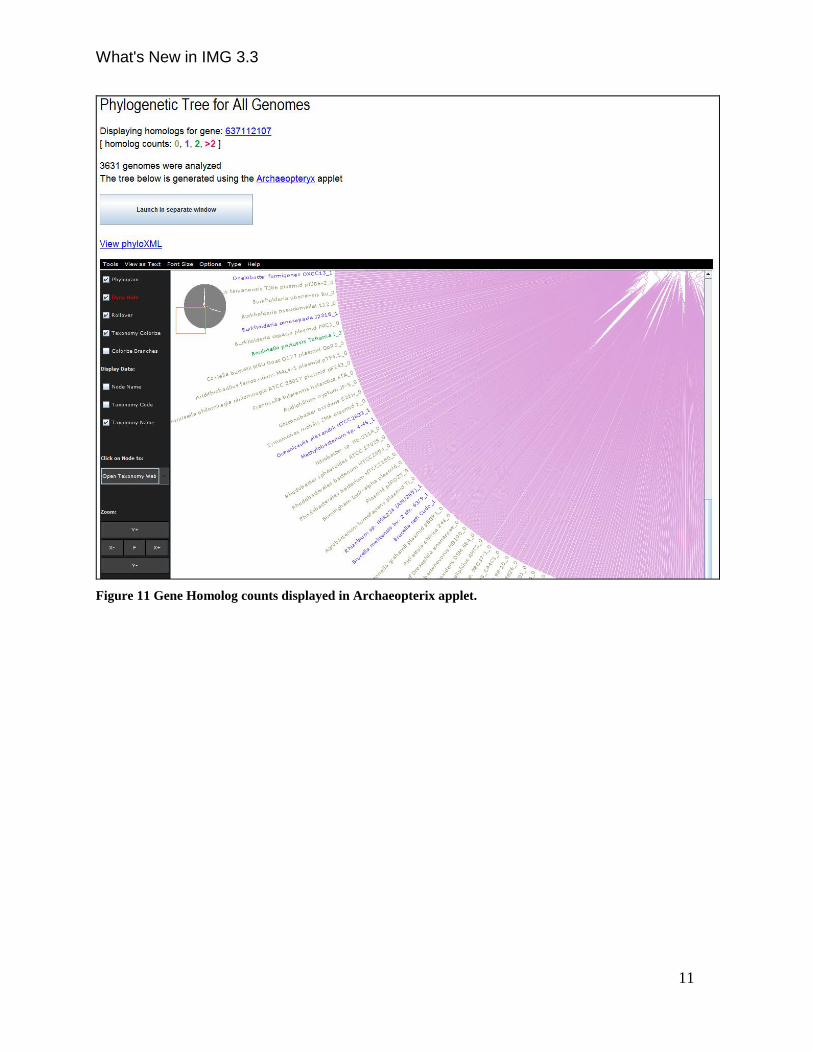
“Phylogenetic Distribution” button on the Gene Homologs page now links to the
Archaeopterix applet (Figure 10), used to display the phylogenetic tree. This tree is colored
by the count of homologs (Figure 11).
Figure 10 Gene Homologs link to Archaeopterix applet
What's New in IMG 3.3
11
Figure 11 Gene Homolog counts displayed in Archaeopterix applet.
What's New in IMG 3.3
12
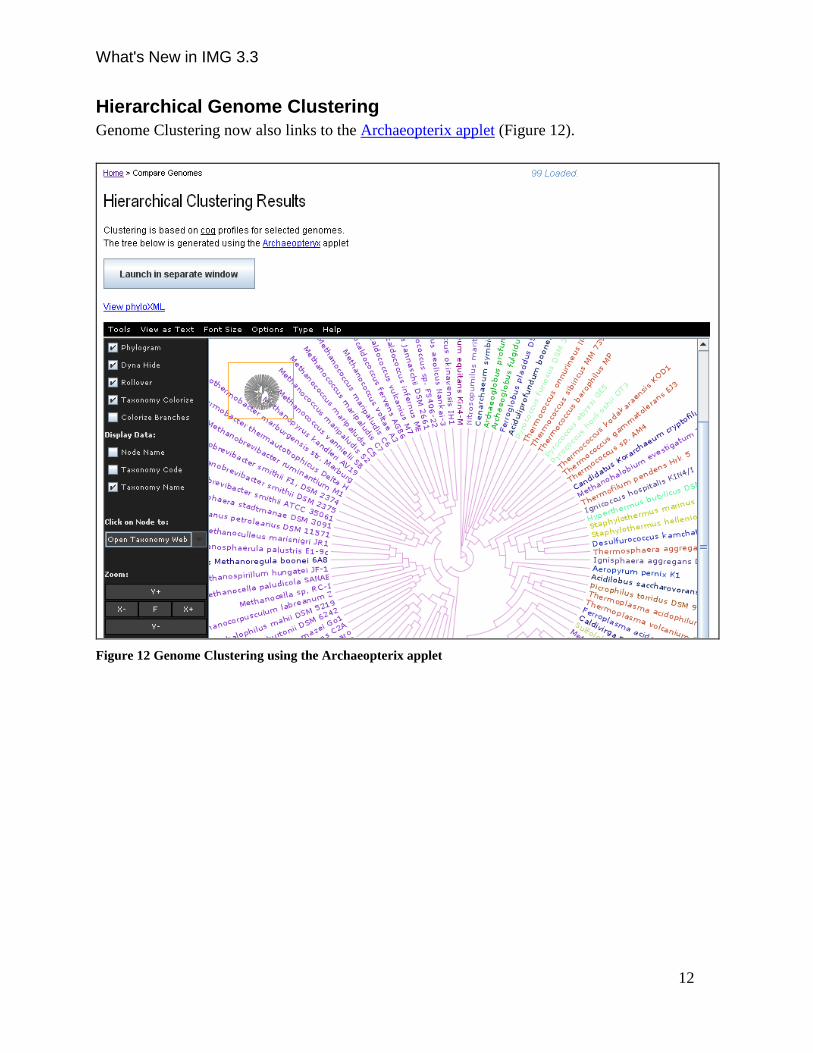
Hierarchical Genome Clustering
Genome Clustering now also links to the Archaeopterix applet (Figure 12).
Figure 12 Genome Clustering using the Archaeopterix applet

What's New in IMG 3.3
13
ClustalW Alignment
From the Gene Cart, a user can choose to do Sequence Alignment on selected genes. This
alignment is displayed using the Jalview applet, which is now embedded (Figure 13).
Clicking on the gene in Jalview will open up a Gene Details page in IMG.
Figure 13 Jalview Color Scheme for amino acid sequence alignment

What's New in IMG 3.3
14
Figure 14 Jalview alignment
What's New in IMG 3.3
15
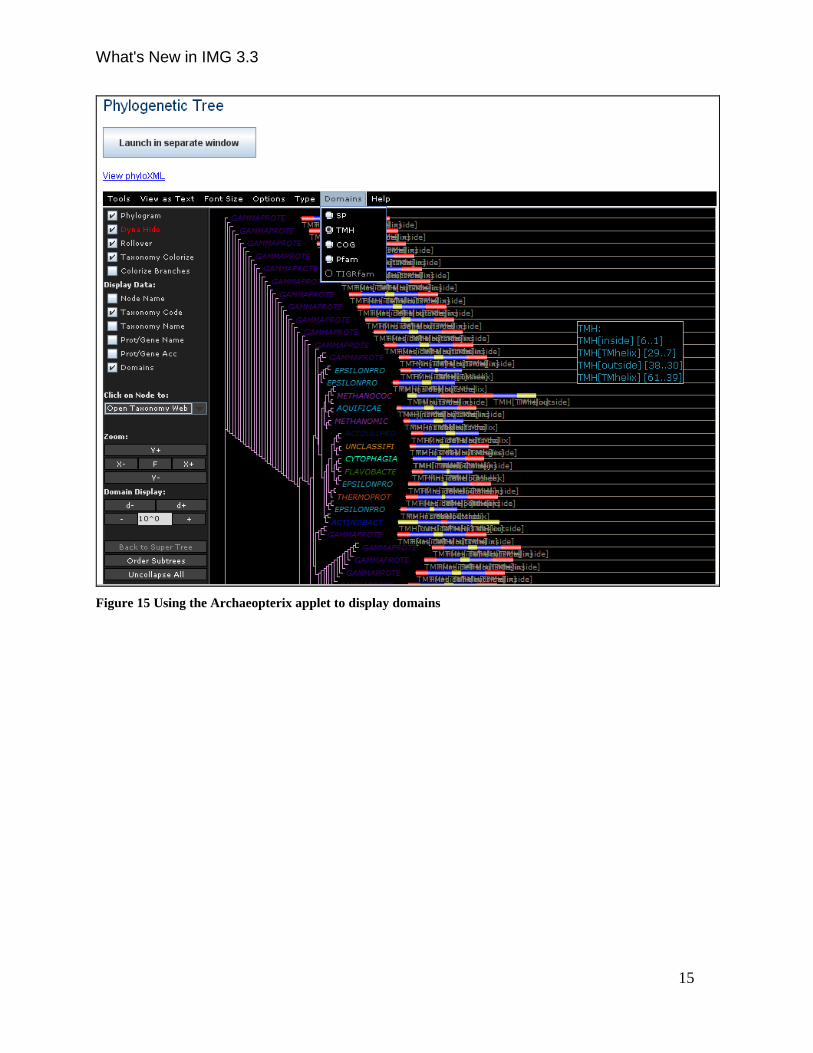
Figure 15 Using the Archaeopterix applet to display domains
What's New in IMG 3.3
16
Dot Plot
Scaffold Selection
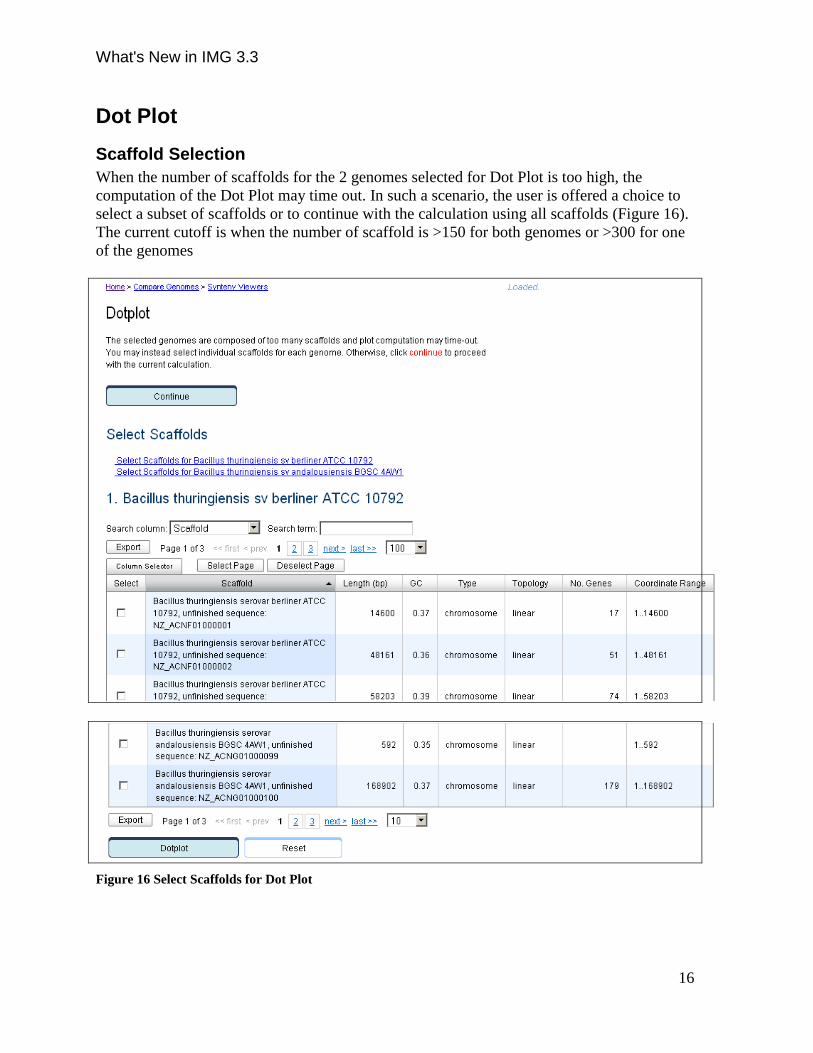
When the number of scaffolds for the 2 genomes selected for Dot Plot is too high, the
computation of the Dot Plot may time out. In such a scenario, the user is offered a choice to
select a subset of scaffolds or to continue with the calculation using all scaffolds (Figure 16).
The current cutoff is when the number of scaffold is >150 for both genomes or >300 for one
of the genomes
Figure 16 Select Scaffolds for Dot Plot

What's New in IMG 3.3
17
New Pathway Data In IMG 3.3, new pathway data such as MPW pathways have been added. We added a new UI
function to allow users searching through multiple pathway data sources using Enzyme EC
numbers and/or free text descriptions. To perform pathway search, select the "All Pathways"
menu item under the "Find Functions" tab. A page will show up for users to select the
pathway type (IMG Pathways, KEGG Pathways, MetaCyc Pathways and MPW Pathways),
EC number, and keyword. Enter search criteria and click the "Search All Pathways" button, a
new "Search Pathway Result" page will show up with all pathways in IMG that satisfy the
search condition. Click on any Pathway OID to view the detail (see Figure 17).
Figure 17 Pathway Data
What's New in IMG 3.3
18
Phenotypes When we study any organism, one of the major goals is to understand its physiology and how
that relates to its adaptation to its environment. When we sequence the organism’s genome,
we gain further insight into its physiology. Numerous predictions can be made, which can
then be tested in the laboratory. For example, many of the pathways for synthesis of
essential metabolites are known, and pathways for utilization of many nutrients have been
determined. Many physiological functions require several gene products, and they can be
grouped into pathways, where genes function in a specific order, or parts lists in which order
is not important. Pathways also can only be understood in the context of other pathways
within the organism, and this is why we have developed IMG Phenotypes. For example, if
an organism degrades cellulose to cellobiose outside the cell, it can only utilize cellulose as a
carbon source if it also has a transport pathway for uptake of cellobiose and, within the cell, a
metabolic pathway to gain energy from cellobiose. If all three steps are present, then the
organism will have the phenotype of cellulose utilization with cellobiose as an intermediate.
In some cases the presence or absence of only one pathway is required for a phenotype.
There are also cases in which there are multiple possibilities and require multiple
combinations of pathways.
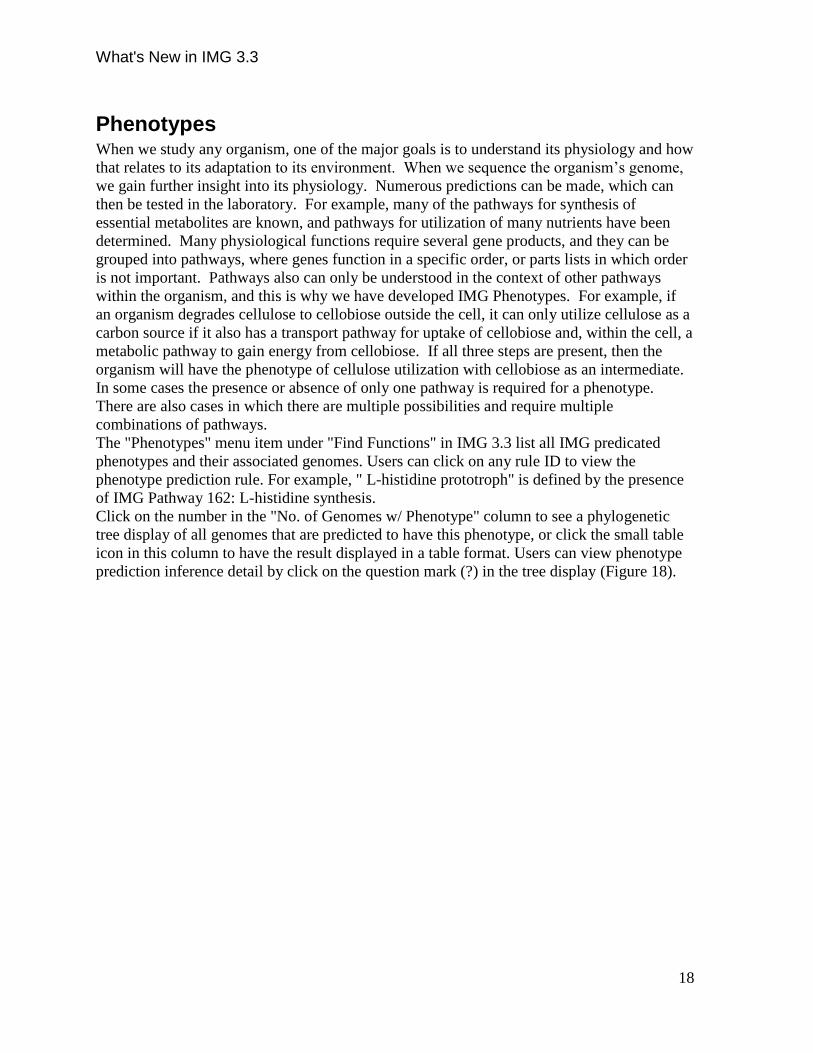
The "Phenotypes" menu item under "Find Functions" in IMG 3.3 list all IMG predicated
phenotypes and their associated genomes. Users can click on any rule ID to view the
phenotype prediction rule. For example, " L-histidine prototroph" is defined by the presence
of IMG Pathway 162: L-histidine synthesis.
Click on the number in the "No. of Genomes w/ Phenotype" column to see a phylogenetic
tree display of all genomes that are predicted to have this phenotype, or click the small table
icon in this column to have the result displayed in a table format. Users can view phenotype
prediction inference detail by click on the question mark (?) in the tree display (Figure 18).
What's New in IMG 3.3
19
Figure 18 Phenotypes

What's New in IMG 3.3
20
Phylogenetic distribution
Background
Historically, IMG has had two implementations of PhyloDistribution tools: one accessible
from Microbiome Details page and the other accessible through Compare Genomes >
Phylogenetic Distribution. In IMG 3.3, the configuration options of both tools have been
unified to a vast degree while maintaining a certain degree of individuality.
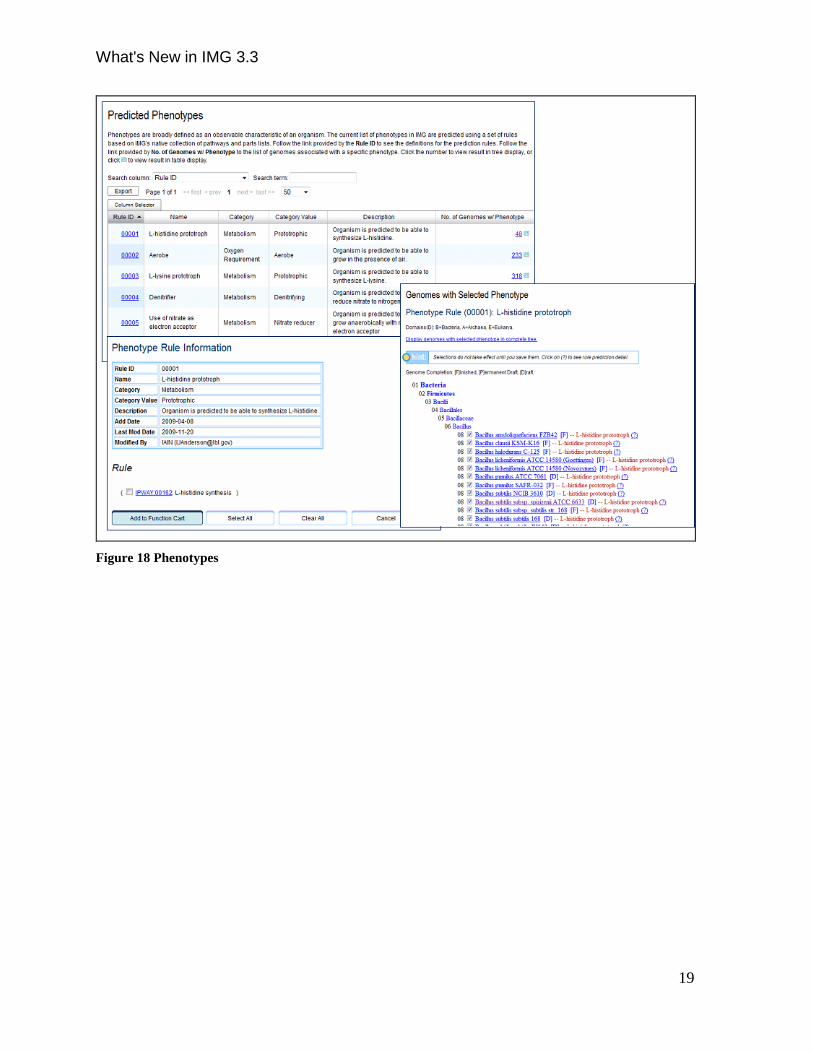
Phylogenetic Distribution on Microbiome Details Page
Please refer to Figure 19 & Figure 20 for the location of this tool.
What's New in IMG 3.3
21
Figure 19: IMG Home > Genome Browser
What's New in IMG 3.3
22
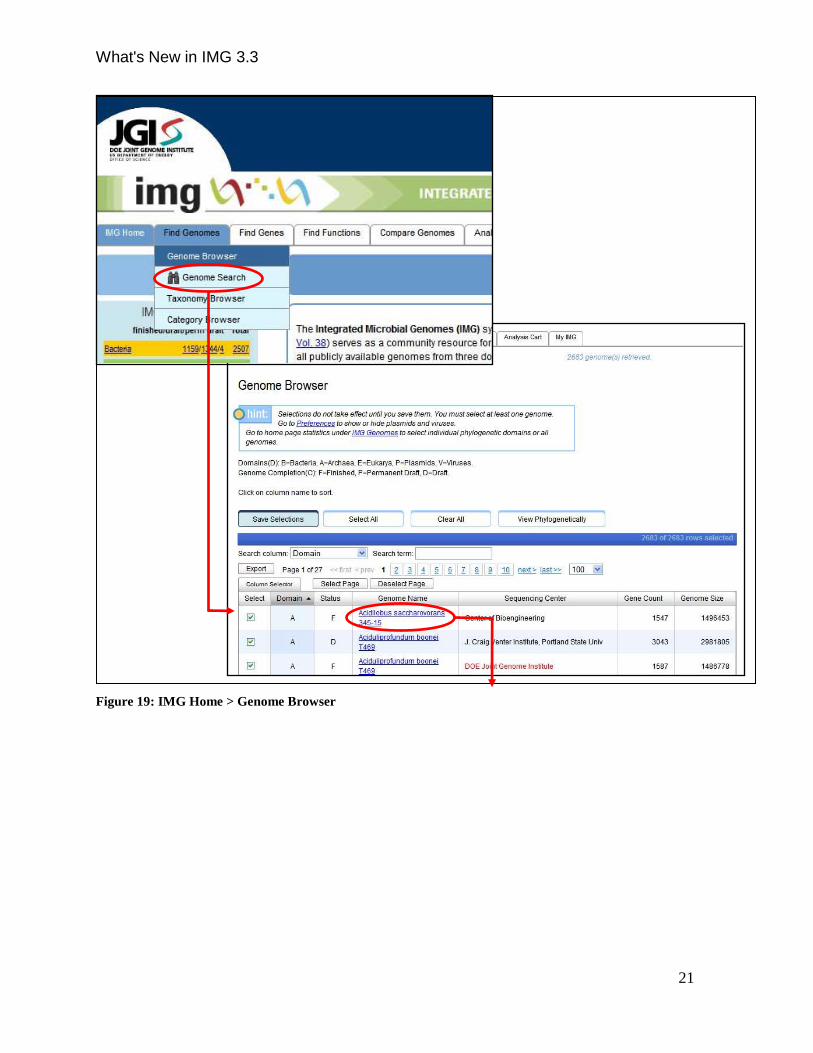
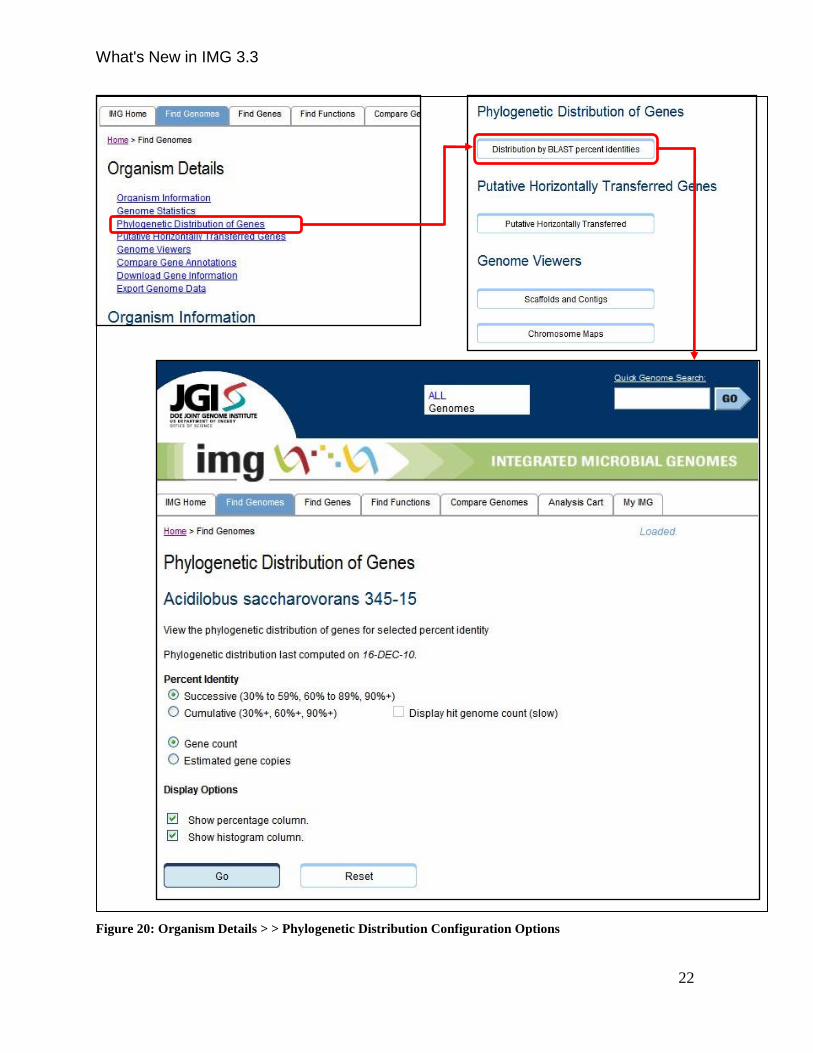
Figure 20: Organism Details > > Phylogenetic Distribution Configuration Options
What's New in IMG 3.3
23
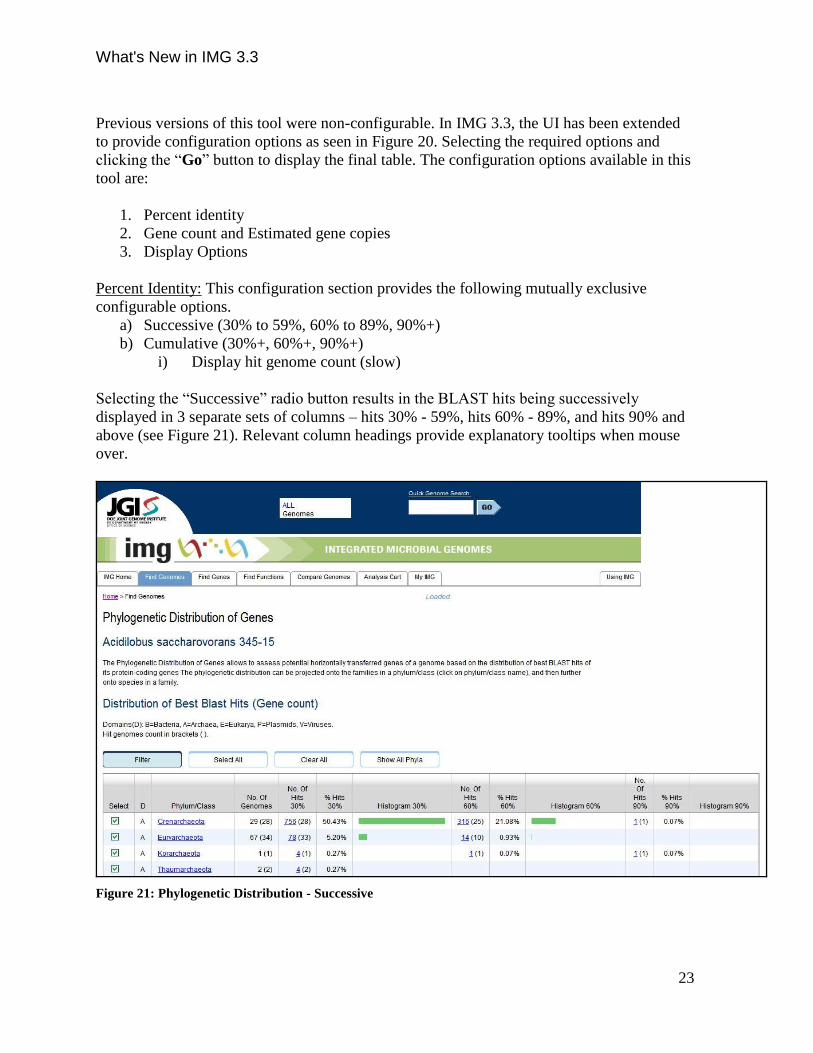
Previous versions of this tool were non-configurable. In IMG 3.3, the UI has been extended
to provide configuration options as seen in Figure 20. Selecting the required options and
clicking the “Go” button to display the final table. The configuration options available in this
tool are:
1. Percent identity
2. Gene count and Estimated gene copies
3. Display Options
Percent Identity: This configuration section provides the following mutually exclusive
configurable options.
a) Successive (30% to 59%, 60% to 89%, 90%+)
b) Cumulative (30%+, 60%+, 90%+)
i) Display hit genome count (slow)
Selecting the “Successive” radio button results in the BLAST hits being successively
displayed in 3 separate sets of columns – hits 30% - 59%, hits 60% - 89%, and hits 90% and
above (see Figure 21). Relevant column headings provide explanatory tooltips when mouse
over.
Figure 21: Phylogenetic Distribution - Successive
What's New in IMG 3.3
24
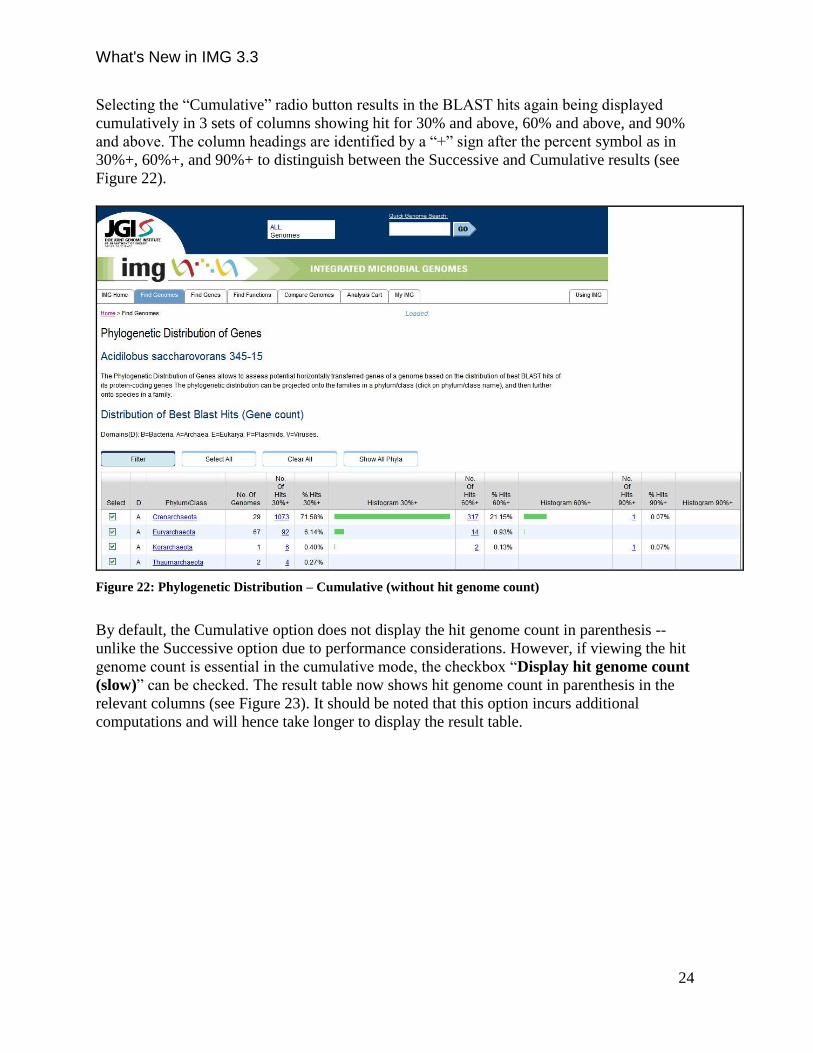
Selecting the “Cumulative” radio button results in the BLAST hits again being displayed
cumulatively in 3 sets of columns showing hit for 30% and above, 60% and above, and 90%
and above. The column headings are identified by a “+” sign after the percent symbol as in
30%+, 60%+, and 90%+ to distinguish between the Successive and Cumulative results (see
Figure 22).
Figure 22: Phylogenetic Distribution – Cumulative (without hit genome count)
By default, the Cumulative option does not display the hit genome count in parenthesis --
unlike the Successive option due to performance considerations. However, if viewing the hit
genome count is essential in the cumulative mode, the checkbox “Display hit genome count
(slow)” can be checked. The result table now shows hit genome count in parenthesis in the
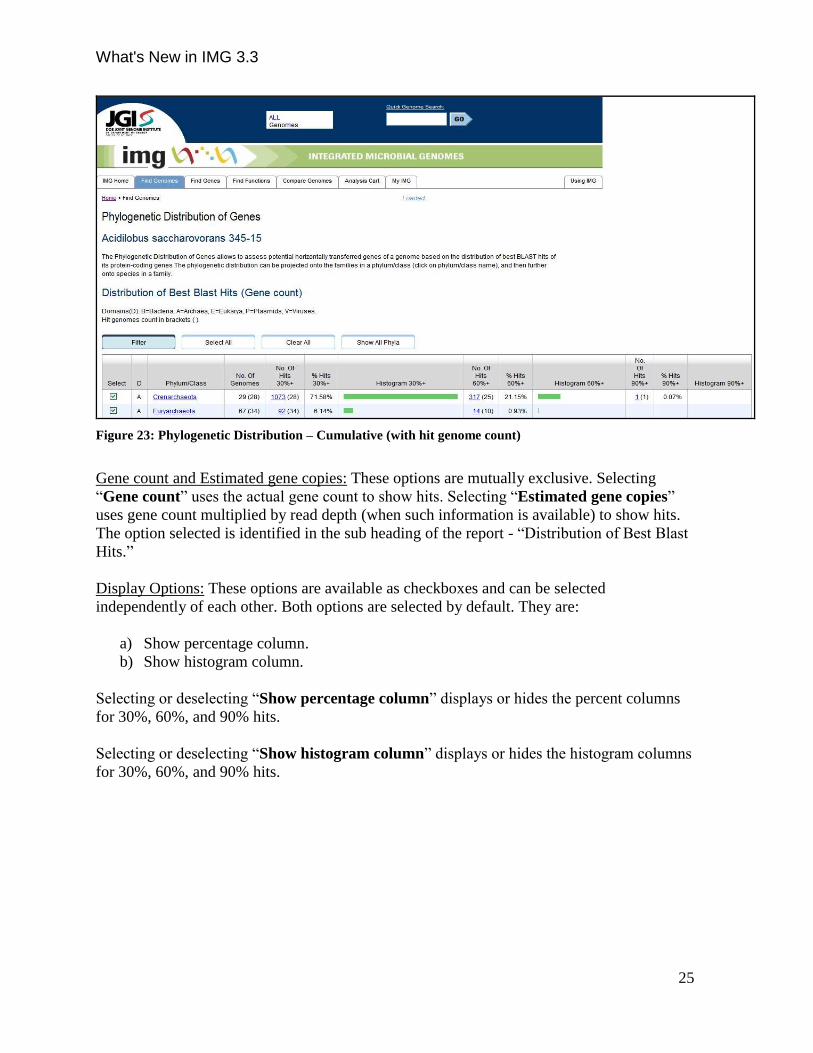
relevant columns (see Figure 23). It should be noted that this option incurs additional
computations and will hence take longer to display the result table.
What's New in IMG 3.3
25
Figure 23: Phylogenetic Distribution – Cumulative (with hit genome count)
Gene count and Estimated gene copies: These options are mutually exclusive. Selecting
“Gene count” uses the actual gene count to show hits. Selecting “Estimated gene copies”
uses gene count multiplied by read depth (when such information is available) to show hits.
The option selected is identified in the sub heading of the report - “Distribution of Best Blast
Hits.”
Display Options: These options are available as checkboxes and can be selected
independently of each other. Both options are selected by default. They are:
a) Show percentage column.
b) Show histogram column.
Selecting or deselecting “Show percentage column” displays or hides the percent columns
for 30%, 60%, and 90% hits.
Selecting or deselecting “Show histogram column” displays or hides the histogram columns
for 30%, 60%, and 90% hits.

What's New in IMG 3.3
26
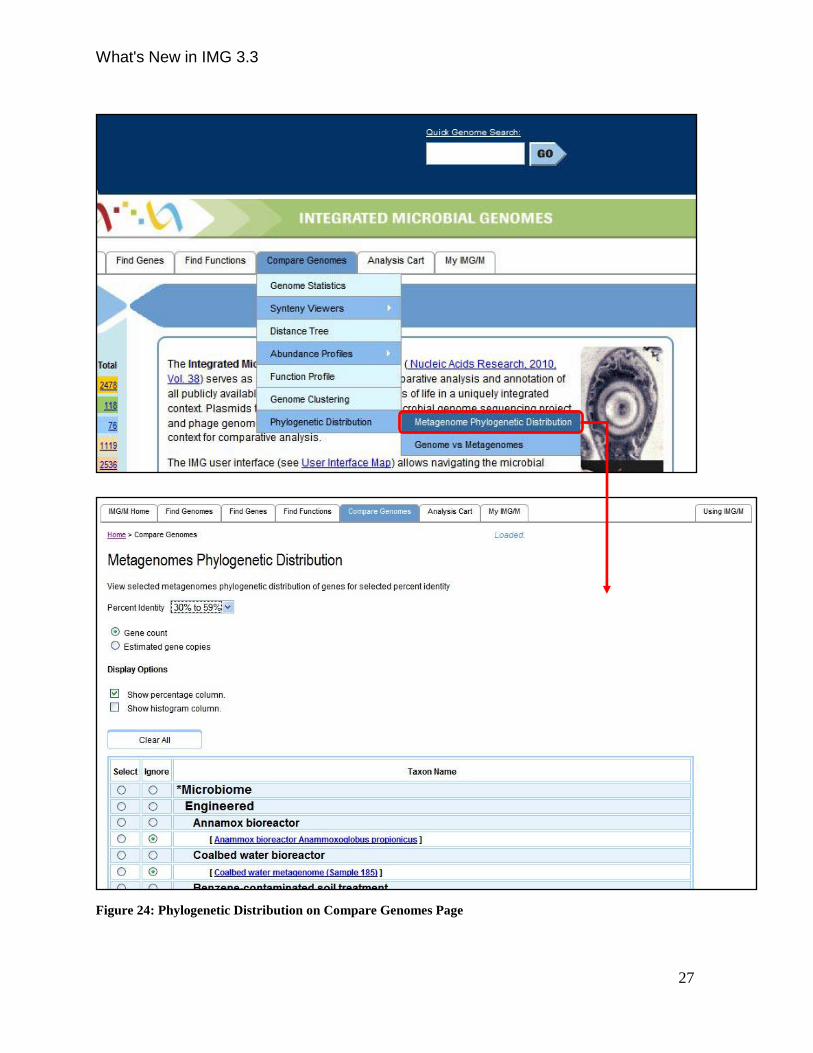
Phylogenetic Distribution on Compare Genomes Page
Please refer to Figure 24 for the location of this tool. The primary difference between
Phylogenetic Distribution on Microbiome Details Page and Phylogenetic Distribution on
Compare Genomes Page is that the latter allows for selecting multiple metagenomes (see
Figure 24).
Configuration options are similar to Phylogenetic Distribution on Microbiome Details Page.
Choosing the desired options, followed by selecting the required metagenomes, and clicking
the “Go” button displays the final table. The configurations options available in this tool are:
1. Percent identity
2. Gene count and Estimated gene copies
3. Display Options
Percent Identity: This configuration provides the following mutually exclusive configurable
options in the form of a drop down menu:
- 30% - 59%
- 60% - 89%
- 90%+
- 30%+
- 60%+
For an explanation of these options, please refer to “Phylogenetic Distribution on
Microbiome Details Page” above.
For an explanation on Gene count and Estimated gene copies as well as Display Options,
please refer to “Phylogenetic Distribution on Microbiome Details Page” above.
What's New in IMG 3.3
27
Figure 24: Phylogenetic Distribution on Compare Genomes Page
What's New in IMG 3.3
28
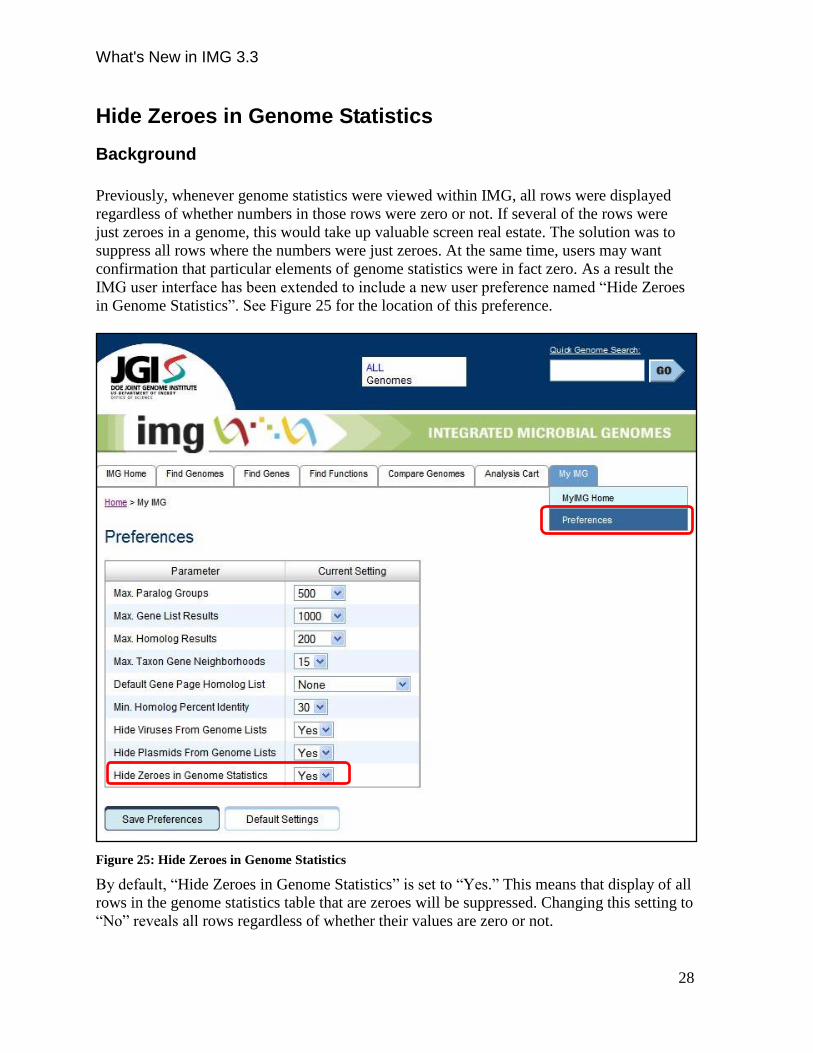
Hide Zeroes in Genome Statistics
Background
Previously, whenever genome statistics were viewed within IMG, all rows were displayed
regardless of whether numbers in those rows were zero or not. If several of the rows were
just zeroes in a genome, this would take up valuable screen real estate. The solution was to
suppress all rows where the numbers were just zeroes. At the same time, users may want
confirmation that particular elements of genome statistics were in fact zero. As a result the
IMG user interface has been extended to include a new user preference named “Hide Zeroes
in Genome Statistics”. See Figure 25 for the location of this preference.
Figure 25: Hide Zeroes in Genome Statistics
By default, “Hide Zeroes in Genome Statistics” is set to “Yes.” This means that display of all
rows in the genome statistics table that are zeroes will be suppressed. Changing this setting to
“No” reveals all rows regardless of whether their values are zero or not.
What's New in IMG 3.3
29
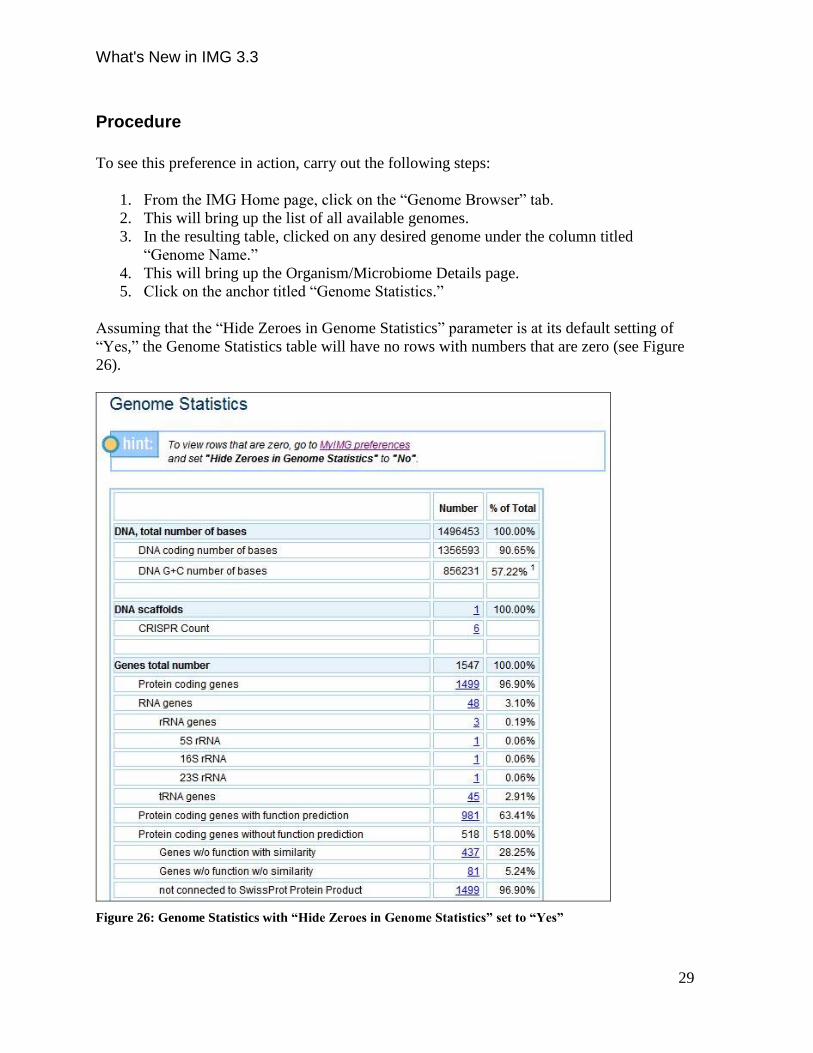
Procedure
To see this preference in action, carry out the following steps:
1. From the IMG Home page, click on the “Genome Browser” tab.
2. This will bring up the list of all available genomes.
3. In the resulting table, clicked on any desired genome under the column titled
“Genome Name.”
4. This will bring up the Organism/Microbiome Details page.
5. Click on the anchor titled “Genome Statistics.”
Assuming that the “Hide Zeroes in Genome Statistics” parameter is at its default setting of
“Yes,” the Genome Statistics table will have no rows with numbers that are zero (see Figure
26).
Figure 26: Genome Statistics with “Hide Zeroes in Genome Statistics” set to “Yes”
What's New in IMG 3.3
30
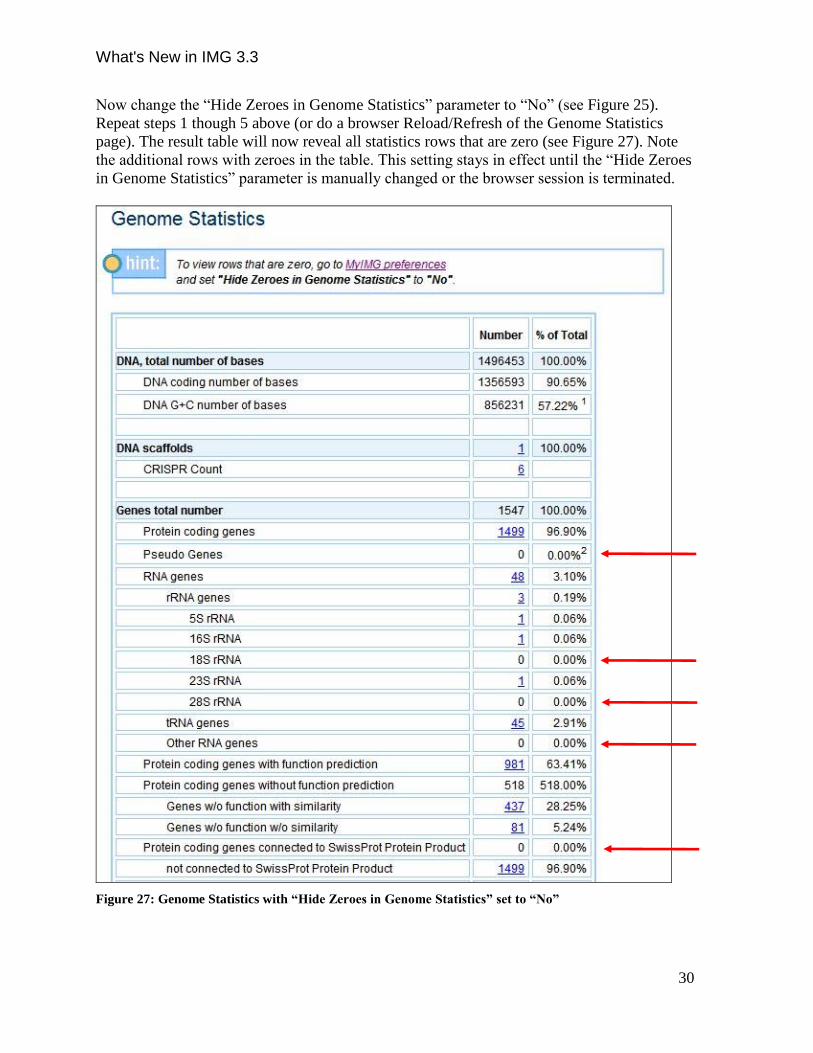
Now change the “Hide Zeroes in Genome Statistics” parameter to “No” (see Figure 25).
Repeat steps 1 though 5 above (or do a browser Reload/Refresh of the Genome Statistics
page). The result table will now reveal all statistics rows that are zero (see Figure 27). Note
the additional rows with zeroes in the table. This setting stays in effect until the “Hide Zeroes
in Genome Statistics” parameter is manually changed or the browser session is terminated.
Figure 27: Genome Statistics with “Hide Zeroes in Genome Statistics” set to “No”
What's New in IMG 3.3
31
Genome Browser
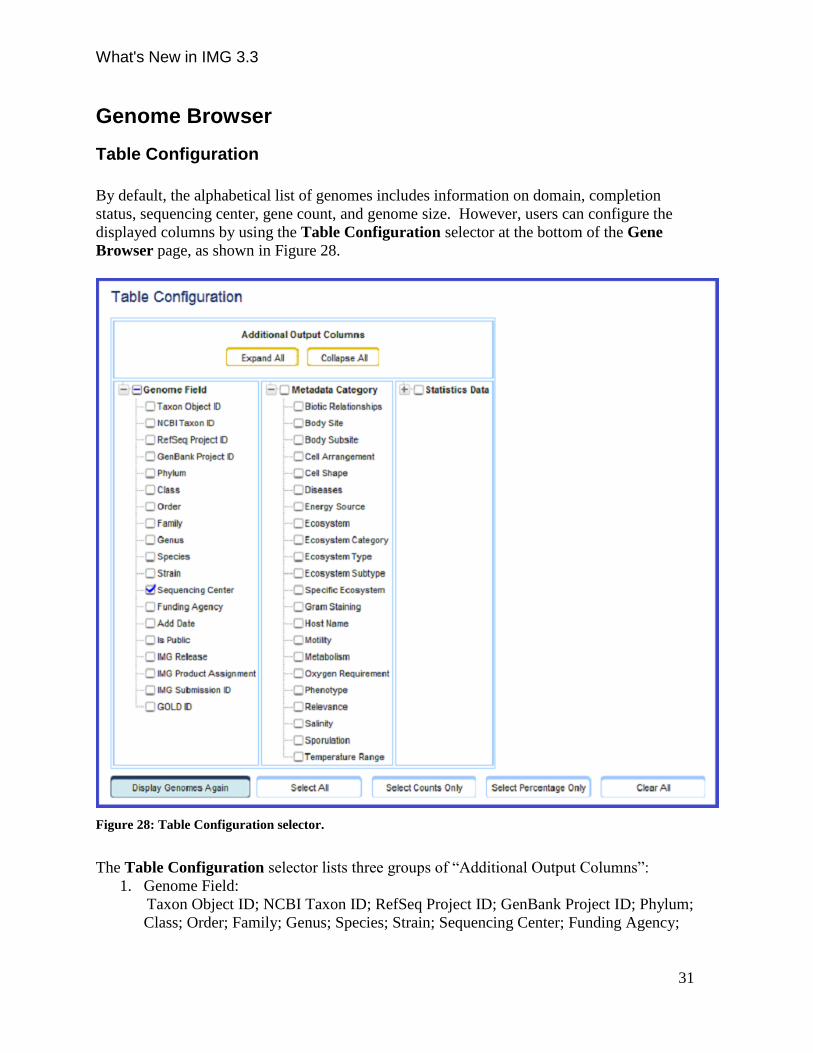
Table Configuration
By default, the alphabetical list of genomes includes information on domain, completion
status, sequencing center, gene count, and genome size. However, users can configure the
displayed columns by using the Table Configuration selector at the bottom of the Gene
Browser page, as shown in Figure 28.
Figure 28: Table Configuration selector.
The Table Configuration selector lists three groups of “Additional Output Columns”:
1. Genome Field:
Taxon Object ID; NCBI Taxon ID; RefSeq Project ID; GenBank Project ID; Phylum;
Class; Order; Family; Genus; Species; Strain; Sequencing Center; Funding Agency;

What's New in IMG 3.3
32
Add Date; Is Public; IMG Release; IMG Product Assignment; IMG Submission ID;
GOLD ID.
2. Metadata Category:
Biotic Relationships; Body Site; Body Subsite; Cell Arrangement; Cell Shape;
Diseases; Energy Source; Ecosystem; Ecosystem Category; Ecosystem Type;
Ecosystem Subtype; Specific Ecosystem; Gram Staining; Host Name; Motility;
Metabolism; Oxygen Requirement; Phenotype; Relevance; Salinity; Sporulation;
Temperature Range.
3. Statistics Data:
Scaffold Count; CRISPR Count; GC Count; GC %; Coding Base Count; Genome
Size; Gene Count; CDS Count; CDS %; RNA Count; rRNA Count; 5S rRNA Count;
16S rRNA Count; 18S rRNA Count; 23S rRNA Count; 28S rRNA Count; tRNA
Count; Other RNA Count; Fused Count; Fused %; Fusion Component Count; Fusion
component %; Pseudo Count; Pseudo %; Unchar Count; Unchar %; Obsolete Count;
Obsolete %; Revised Count; Revised %; w/ Func Pred Count; w/ Func Pred %; w/o
Func Pred Sim Count; w/o Func Pred Sim %; w/o Func Pred No Sim Count; w/o
Func Pred No Sim %; Signal Peptide Count; Signal Peptide %; Transmembrane
Count; Transmembrane %; SwissProt Count; SwissProt %; Not SwissProt Count; Not
SwissProt %; SEED Count; SEED %; Not SEED Count; Not SEED %; COG Count;
COG %; Pfam Count; Pfam %; TIGRfam Count; TIGRfam %; COG Cluster Count;
Pfam Cluster Count; TIGRfam Cluster Count; InterPro Count; InterPro %; Enzyme
Count; Enzyme %; TC Count; TC %; KEGG Count; KEGG %; Not KEGG Count;
Not KEGG %; KO Count; KO %; Not KO Count; Not KO %; MetaCyc Count;
MetaCyc %; Not MetaCyc Count; Not MetaCyc %; IMG Term Count; IMG Term %;
IMG Pathwawy Count; IMG Pathway %; IMG Parts List Count; IMG Parts List %;
Genome Property Count; Genome Property %; Chromosomal Cassette Gene Count;
Chromosomal Cassette Gene %; Chromosomal Cassette Count.
Users can use “Expand All” and “Collapse All” buttons to show or hide the entire columns,
or click on the top “+/-” symbols to display or hide columns in each group.
To select/deselect columns in Table Configuration selector, a user simply needs to
select/deselect the checkbox next to the column name. The user can also click on the
checkbox next to the top group name to select/deselect the whole group. There are also
“Select All”, “Select Counts Only”, “Select Percentage Only”, “Clear All” buttons at the
bottom to facilitate such selections/de-selections.
To add/remove displayed columns in table, a user first selects/deselects the column names in
the Table Configuration selector, and then clicks the “Display Genomes Again” button to
display.
What's New in IMG 3.3
33
Genome Search
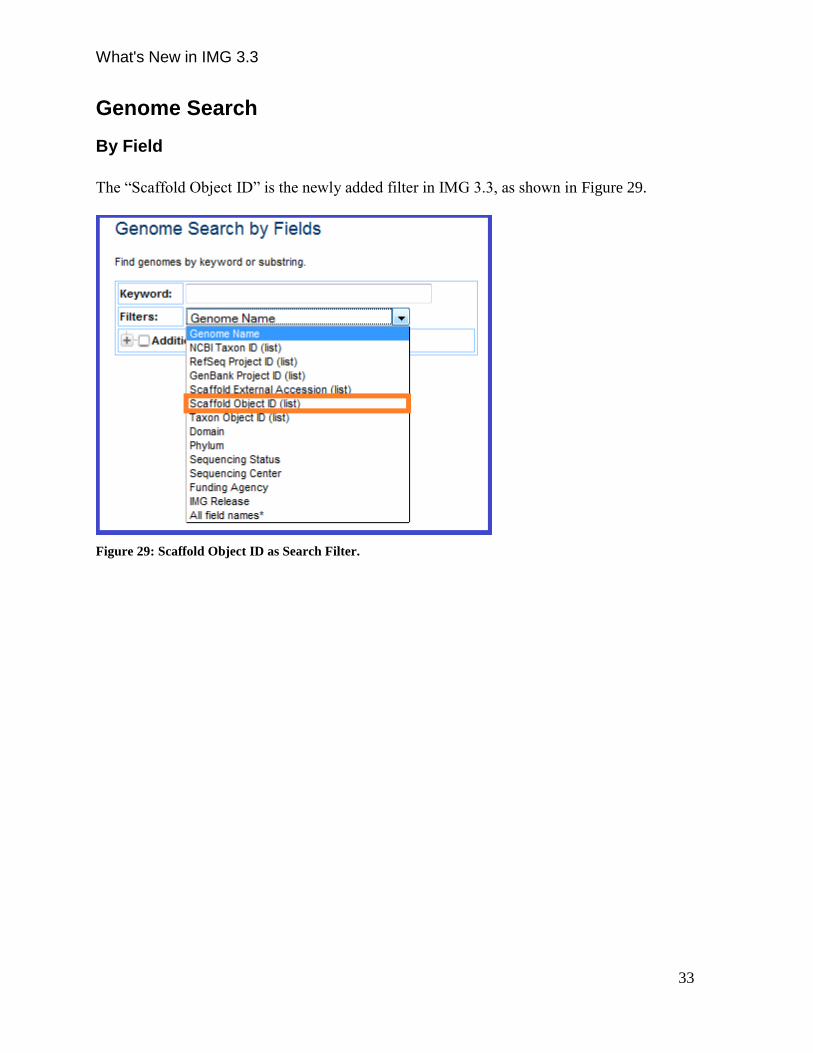
By Field
The “Scaffold Object ID” is the newly added filter in IMG 3.3, as shown in Figure 29.
Figure 29: Scaffold Object ID as Search Filter.
What's New in IMG 3.3
34
Gene Search
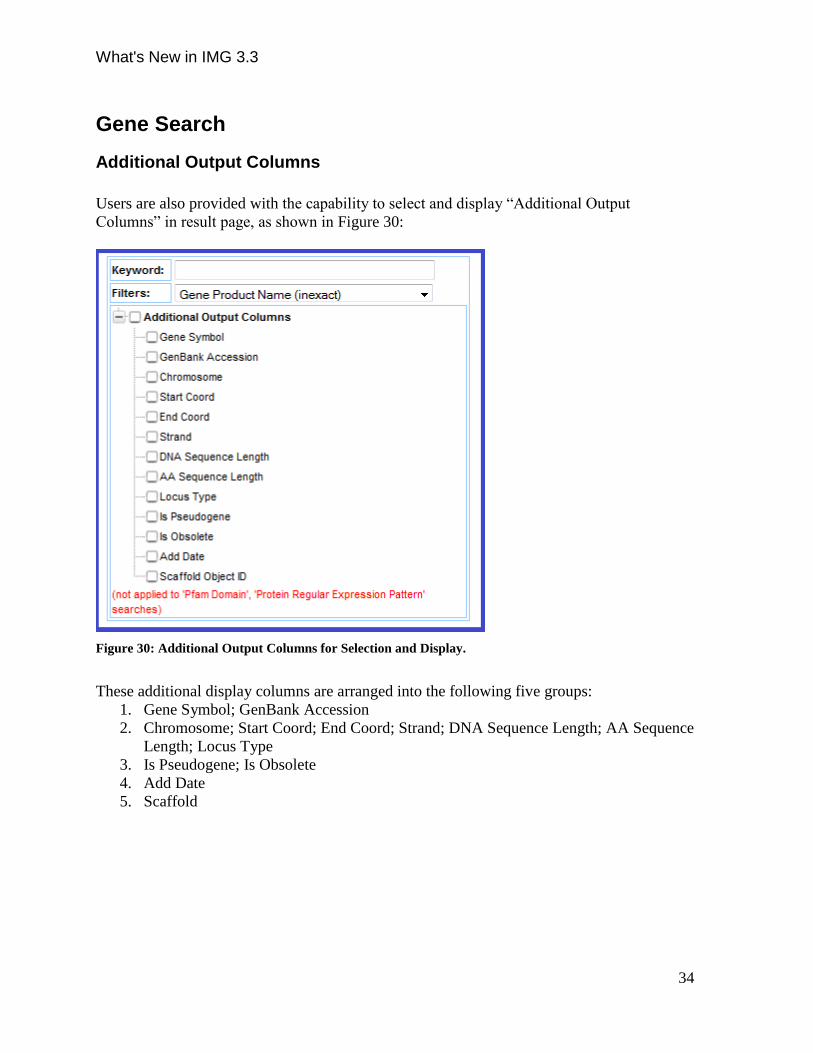
Additional Output Columns
Users are also provided with the capability to select and display “Additional Output
Columns” in result page, as shown in Figure 30:
Figure 30: Additional Output Columns for Selection and Display.
These additional display columns are arranged into the following five groups:
1. Gene Symbol; GenBank Accession
2. Chromosome; Start Coord; End Coord; Strand; DNA Sequence Length; AA Sequence
Length; Locus Type
3. Is Pseudogene; Is Obsolete
4. Add Date
5. Scaffold
What's New in IMG 3.3
35
Gene Cart
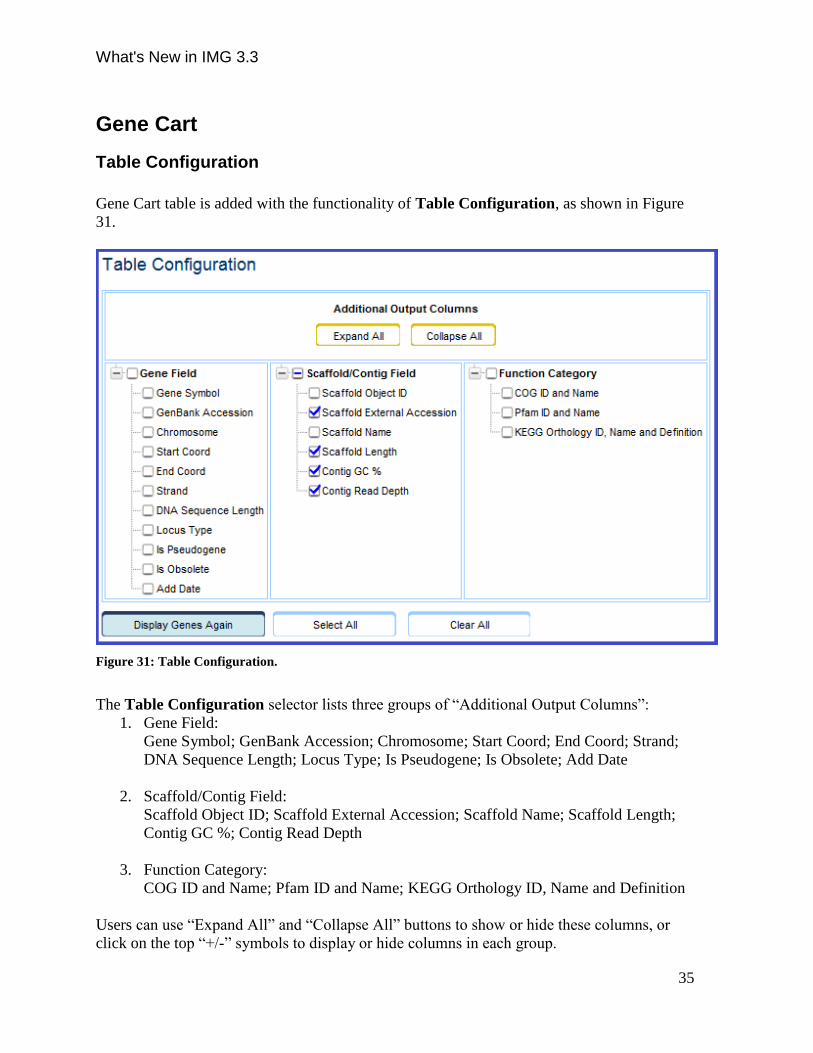
Table Configuration
Gene Cart table is added with the functionality of Table Configuration, as shown in Figure
31.
Figure 31: Table Configuration.
The Table Configuration selector lists three groups of “Additional Output Columns”:
1. Gene Field:
Gene Symbol; GenBank Accession; Chromosome; Start Coord; End Coord; Strand;
DNA Sequence Length; Locus Type; Is Pseudogene; Is Obsolete; Add Date
2. Scaffold/Contig Field:
Scaffold Object ID; Scaffold External Accession; Scaffold Name; Scaffold Length;
Contig GC %; Contig Read Depth
3. Function Category:
COG ID and Name; Pfam ID and Name; KEGG Orthology ID, Name and Definition
Users can use “Expand All” and “Collapse All” buttons to show or hide these columns, or
click on the top “+/-” symbols to display or hide columns in each group.
What's New in IMG 3.3
36
To select/deselect columns in Table Configuration selector, a user simply needs to
select/deselect the checkbox next to the column name. The user can also click on the
checkbox next to the top group name to select/deselect the whole group. The “Select All”
and “Clear All” buttons at the bottom are provided to facilitate such selections/de-selections.
After choosing the desire columns, the user needs to click the “Display Genomes Again”
button to redisplay.
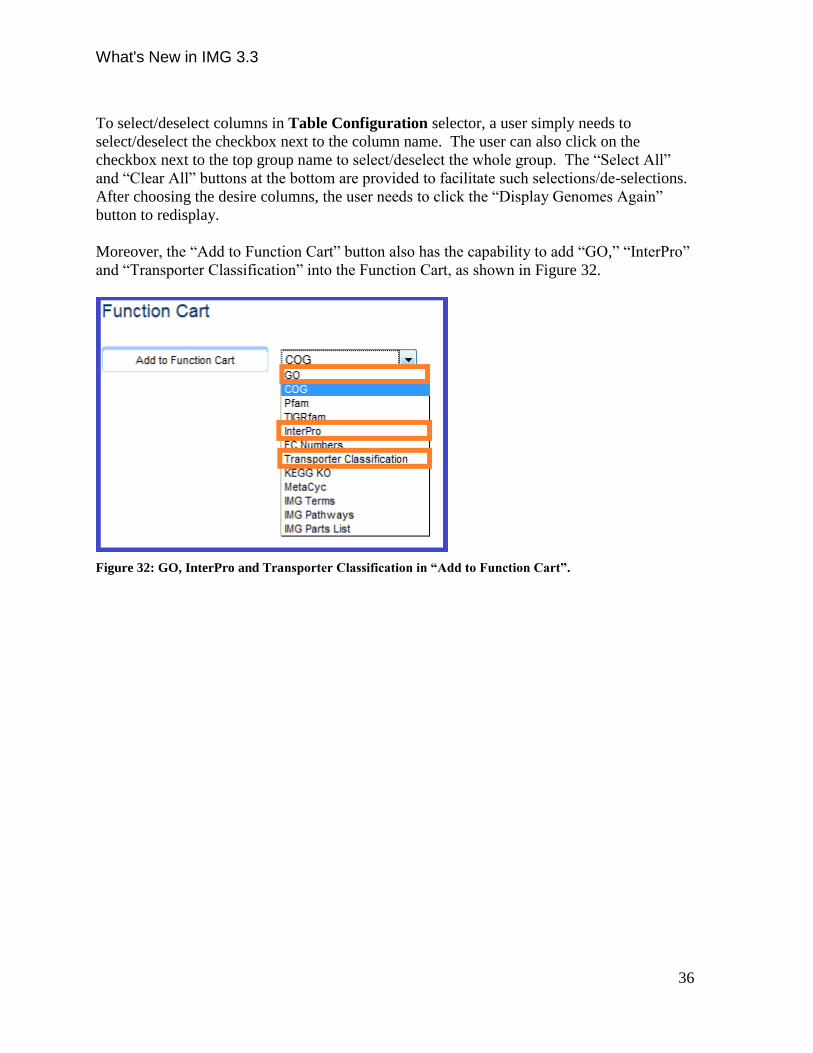
Moreover, the “Add to Function Cart” button also has the capability to add “GO,” “InterPro”
and “Transporter Classification” into the Function Cart, as shown in Figure 32.
Figure 32: GO, InterPro and Transporter Classification in “Add to Function Cart”.

What's New in IMG 3.3
37
Function Cart
The Function Cart table now includes “GO,” “InterPro” and “Transporter Classification” as
shown in Figure 33. Their underneath genes for specific genomes can also be added into
Gene Cart through the “Add to Gene Cart” button.
Figure 33: GO, InterPro and Transporter Classification in Function Cart.
What's New in IMG 3.3
38
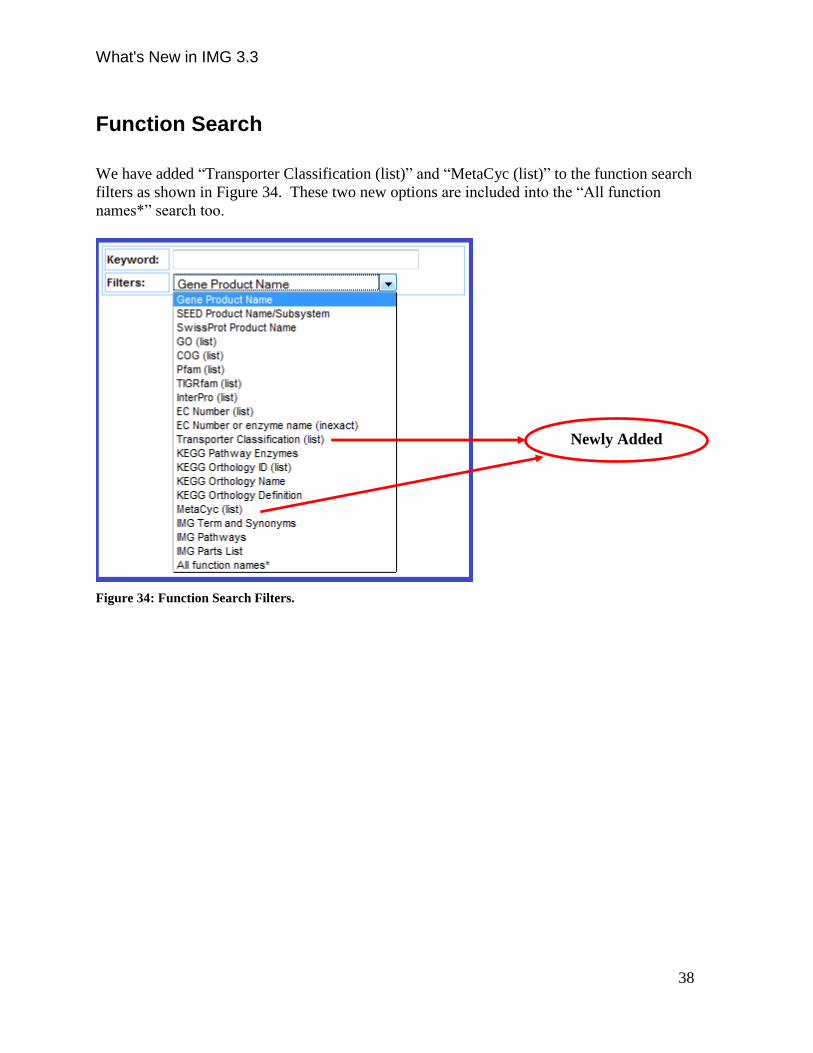
Function Search
We have added “Transporter Classification (list)” and “MetaCyc (list)” to the function search
filters as shown in Figure 34. These two new options are included into the “All function
names*” search too.
Figure 34: Function Search Filters.
Newly Added
What's New in IMG 3.3
39
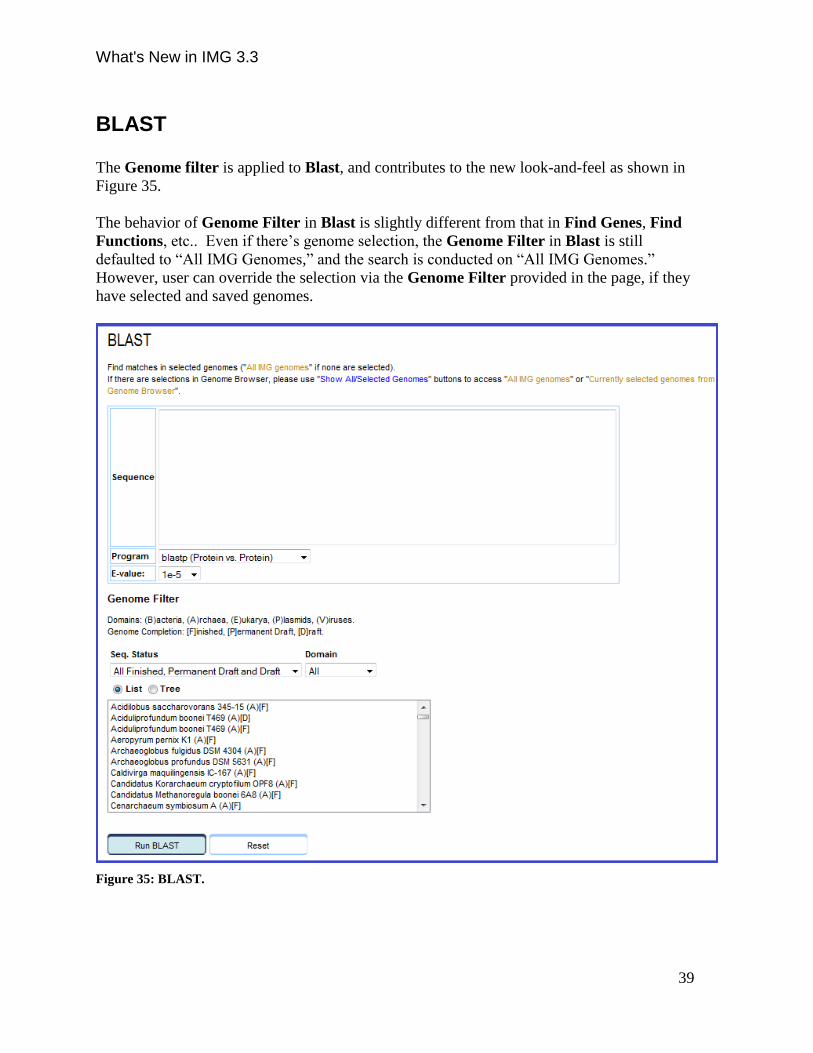
BLAST
The Genome filter is applied to Blast, and contributes to the new look-and-feel as shown in
Figure 35.
The behavior of Genome Filter in Blast is slightly different from that in Find Genes, Find
Functions, etc.. Even if there’s genome selection, the Genome Filter in Blast is still
defaulted to “All IMG Genomes,” and the search is conducted on “All IMG Genomes.”
However, user can override the selection via the Genome Filter provided in the page, if they
have selected and saved genomes.
Figure 35: BLAST.
What's New in IMG 3.3
40
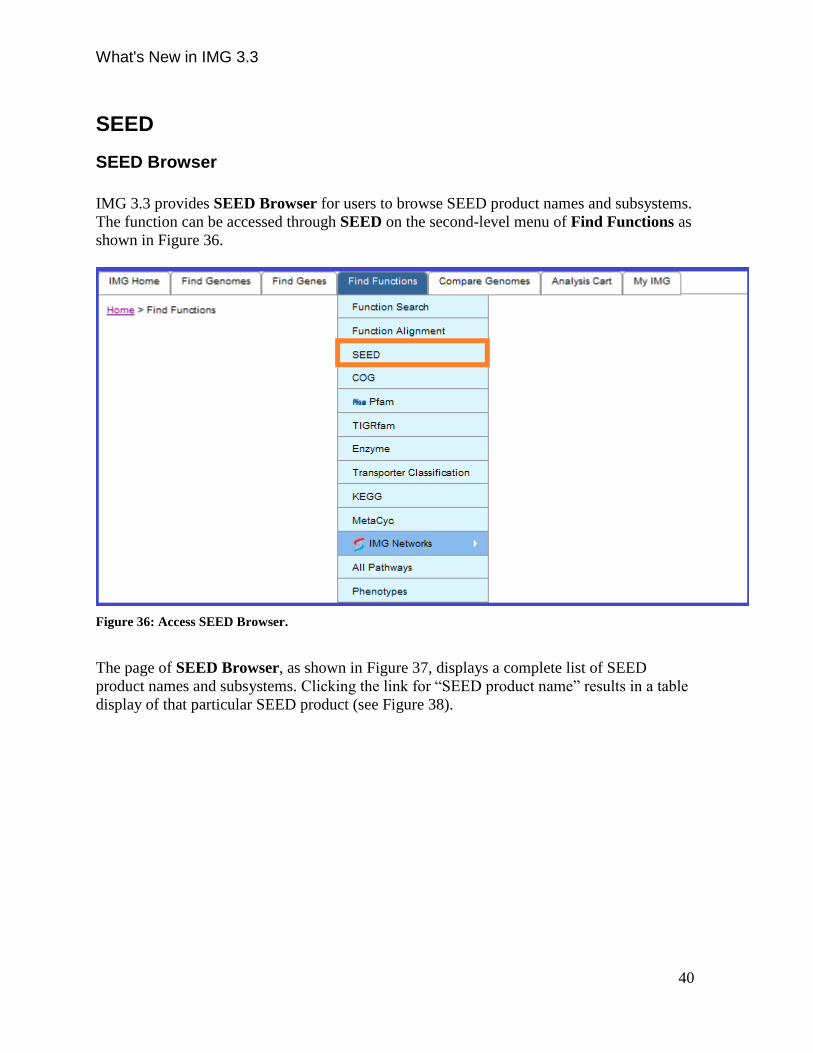
SEED
SEED Browser
IMG 3.3 provides SEED Browser for users to browse SEED product names and subsystems.
The function can be accessed through SEED on the second-level menu of Find Functions as
shown in Figure 36.
Figure 36: Access SEED Browser.
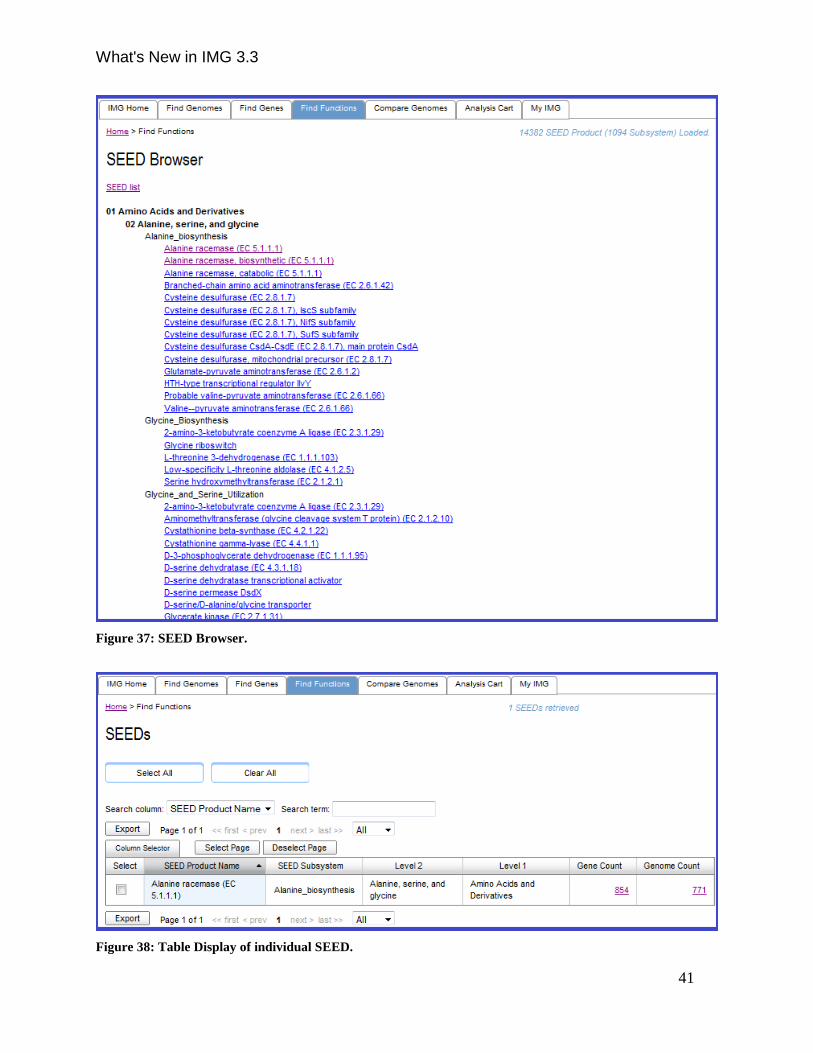
The page of SEED Browser, as shown in Figure 37, displays a complete list of SEED
product names and subsystems. Clicking the link for “SEED product name” results in a table
display of that particular SEED product (see Figure 38).
What's New in IMG 3.3
41
Figure 37: SEED Browser.
Figure 38: Table Display of individual SEED.
What's New in IMG 3.3
42
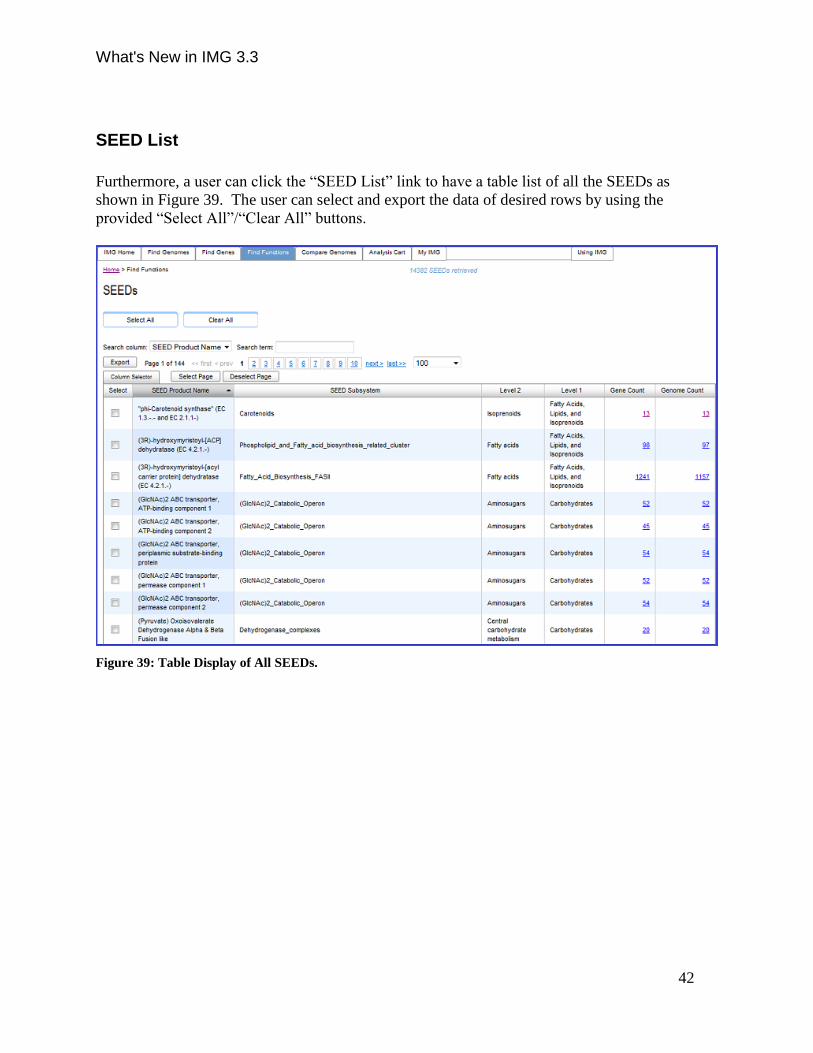
SEED List
Furthermore, a user can click the “SEED List” link to have a table list of all the SEEDs as
shown in Figure 39. The user can select and export the data of desired rows by using the
provided “Select All”/“Clear All” buttons.
Figure 39: Table Display of All SEEDs.
What's New in IMG 3.3
43
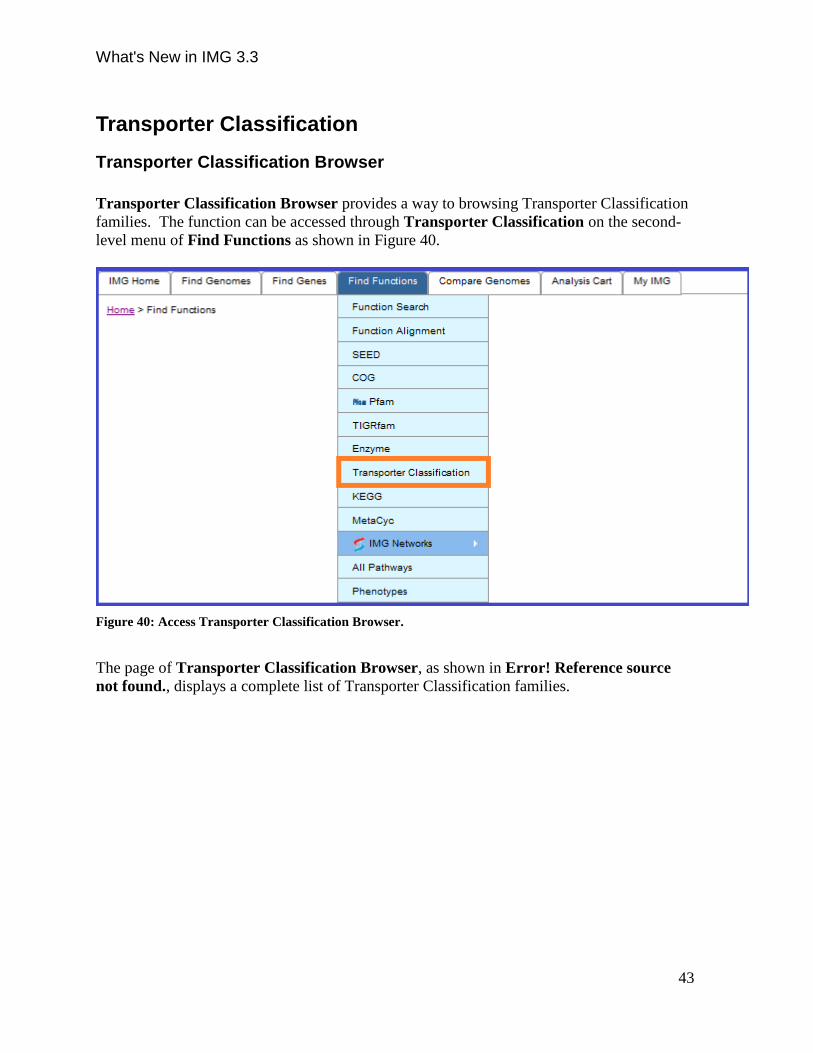
Transporter Classification
Transporter Classification Browser
Transporter Classification Browser provides a way to browsing Transporter Classification
families. The function can be accessed through Transporter Classification on the second-
level menu of Find Functions as shown in Figure 40.
Figure 40: Access Transporter Classification Browser.
The page of Transporter Classification Browser, as shown in Error! Reference source
not found., displays a complete list of Transporter Classification families.
What's New in IMG 3.3
44
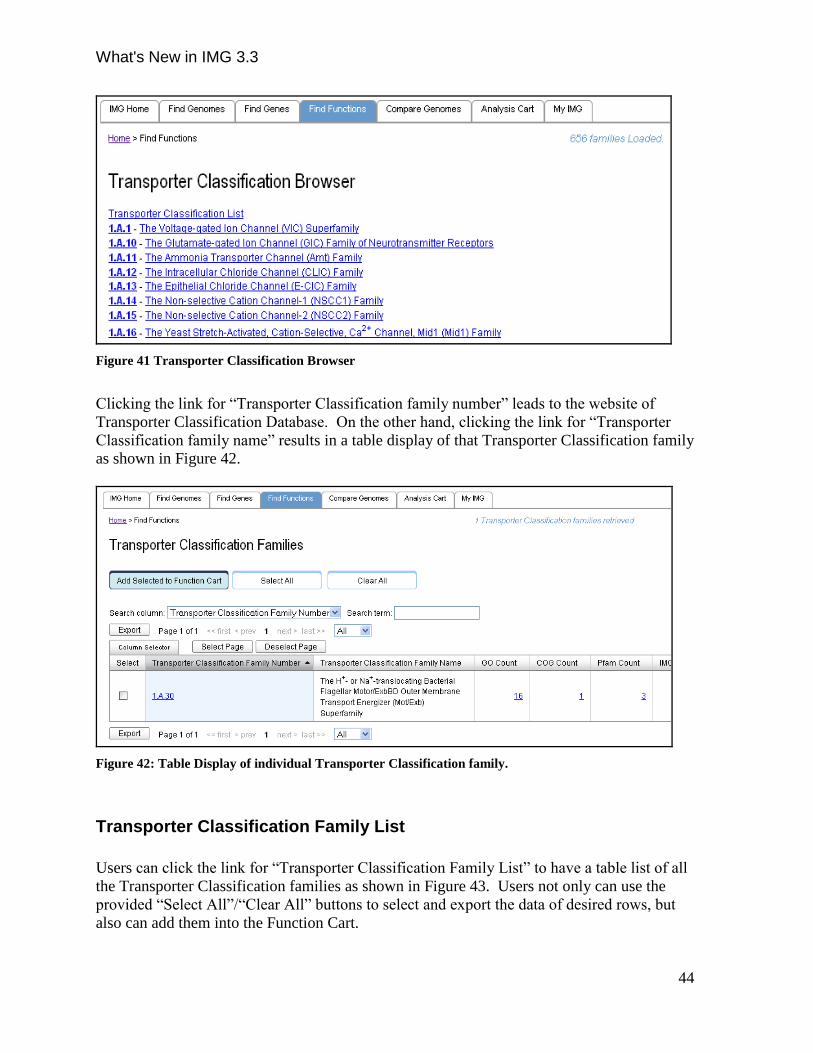
Figure 41 Transporter Classification Browser
Clicking the link for “Transporter Classification family number” leads to the website of
Transporter Classification Database. On the other hand, clicking the link for “Transporter
Classification family name” results in a table display of that Transporter Classification family
as shown in Figure 42.
Figure 42: Table Display of individual Transporter Classification family.
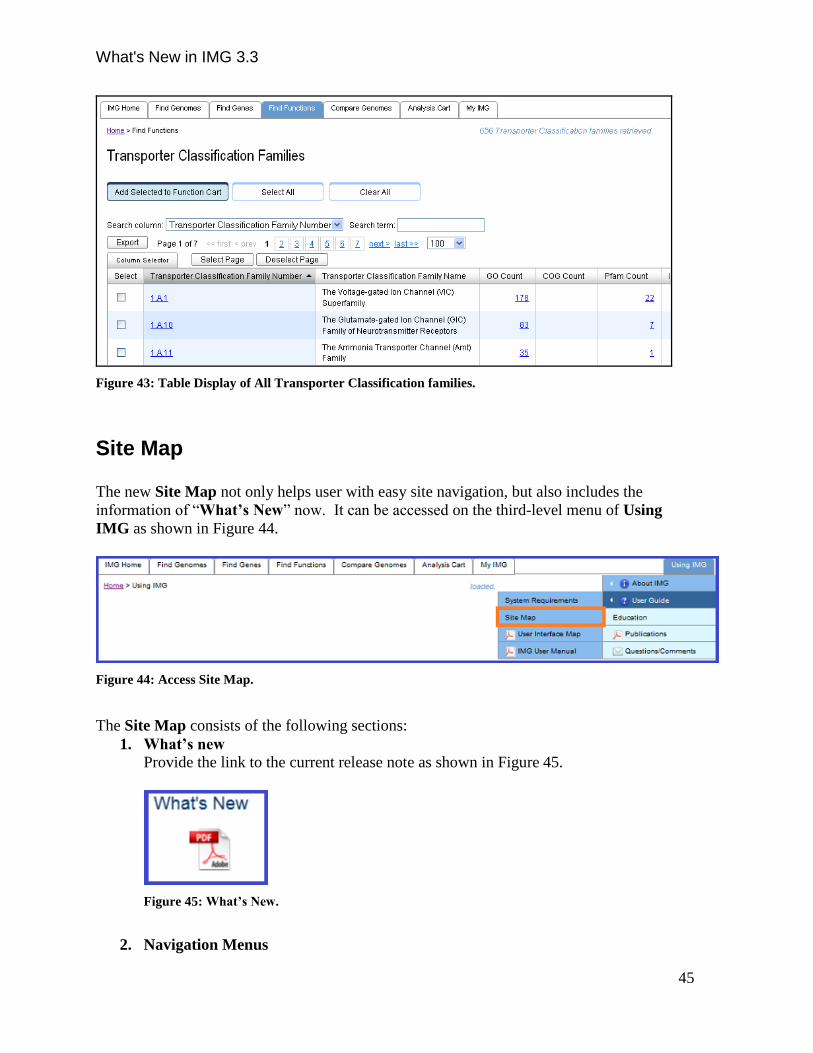
Transporter Classification Family List
Users can click the link for “Transporter Classification Family List” to have a table list of all
the Transporter Classification families as shown in Figure 43. Users not only can use the
provided “Select All”/“Clear All” buttons to select and export the data of desired rows, but
also can add them into the Function Cart.
What's New in IMG 3.3
45
Figure 43: Table Display of All Transporter Classification families.
Site Map
The new Site Map not only helps user with easy site navigation, but also includes the
information of “What’s New” now. It can be accessed on the third-level menu of Using
IMG as shown in Figure 44.
Figure 44: Access Site Map.
The Site Map consists of the following sections:
1. What’s new
Provide the link to the current release note as shown in Figure 45.
Figure 45: What’s New.
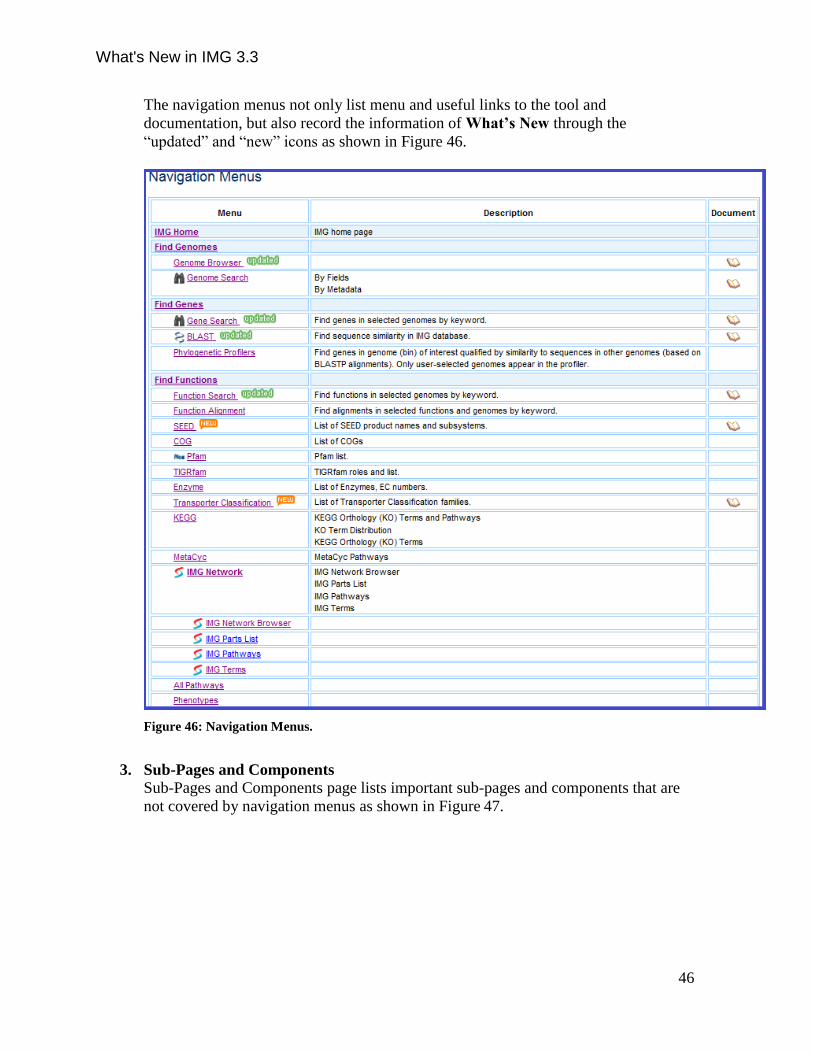
2. Navigation Menus
What's New in IMG 3.3
46
The navigation menus not only list menu and useful links to the tool and
documentation, but also record the information of What’s New through the
“updated” and “new” icons as shown in Figure 46.
Figure 46: Navigation Menus.
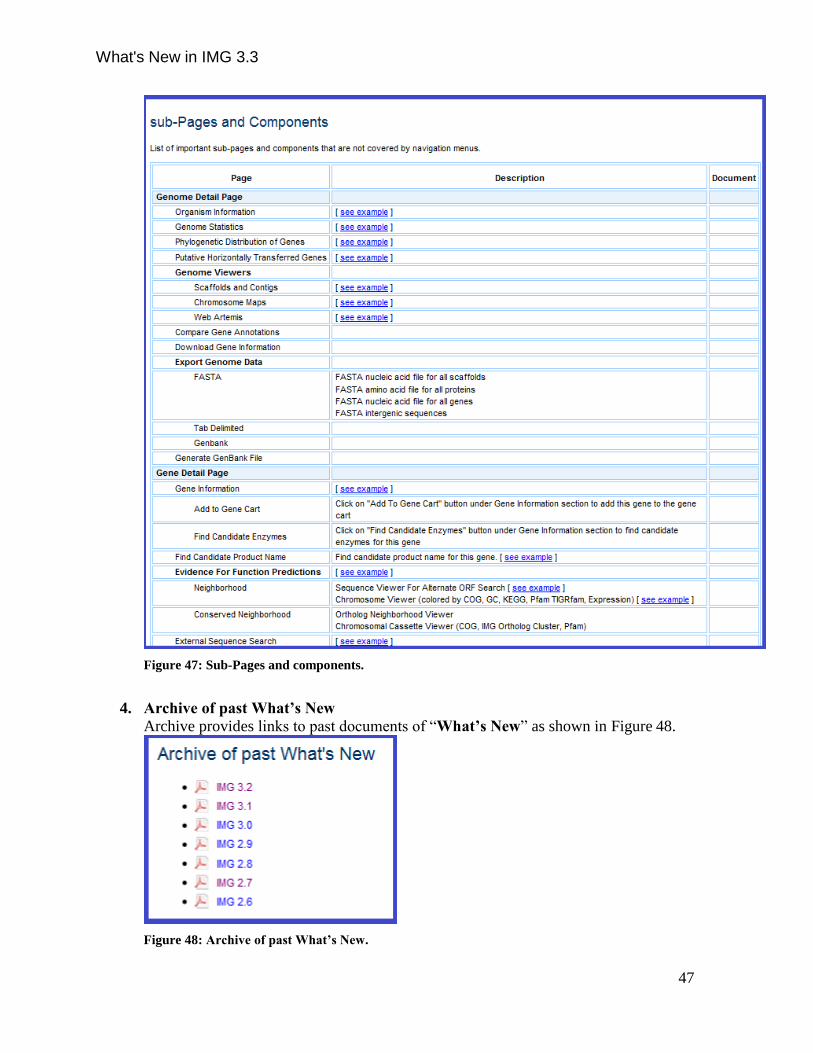
3. Sub-Pages and Components
Sub-Pages and Components page lists important sub-pages and components that are
not covered by navigation menus as shown in Figure 47.
What's New in IMG 3.3
47
Figure 47: Sub-Pages and components.
4. Archive of past What’s New
Archive provides links to past documents of “What’s New” as shown in Figure 48.
Figure 48: Archive of past What’s New.