Embed Size (px)
Citation preview

IMF Forecasts: Process, Quality, and Country Perspectives
February 12, 2014
This report was prepared by an IEO team led by Hans Genberg. The IEO team included Carlos de Resende, Francesco Luna, Franz Loyola, and Andrew Martinez. The evaluation was informed by background studies prepared by Charles Freedman, Michael Salemi and members of the evaluation team. The evaluation benefited from discussions with participants at workshops held in January 2013 and October 2014, and from comments by James Boughton, Jack Boorman, Patrick Conway, Neil Ericsson, John Hicklin, and IEO staff. It also benefited from comments by IMF staff on an earlier version of this report. However, the final judgments are the responsibility of the IEO alone. Arun Bhatnagar, Annette Canizares, and Mari Lantin provided administrative assistance. Rachel Weaving provided editorial assistance. The report was approved by Moises Schwartz.


iii
Contents Page
Abbreviations .............................................................................................................................v
Executive Summary ................................................................................................................ vii
I. Introduction, Motivation, and Main Findings 1 A. Goals and Evaluation Questions ...............................................................................2 B. Outline of Report .......................................................................................................2 C. Summary of Findings ................................................................................................3
II. Evaluation Framework ..........................................................................................................5A. Scope .........................................................................................................................5 B. Methods and Sources ................................................................................................6
III. The WEO Forecasting Process .............................................................................................6A. The WEO Forecasting Process: A Combination of Bottom-up and Top-down
Approaches ...........................................................................................................7 B. Duration of a Typical WEO Forecast Round ..........................................................10 C. The Role of IMF Management and the Executive Board .......................................10 D. User Perspectives on the IMF Forecasting Process ................................................12 E. How Country Desks Produce Their Forecasts .........................................................14 F. Assessment ..............................................................................................................17
IV. The Quality of IMF Forecasts ............................................................................................18A. Are Forecasts Biased? .............................................................................................19 B. Are Forecasts Efficient? ..........................................................................................23 C. Are Forecasts Accurate? ..........................................................................................24 D. User Perspectives on the Quality of IMF Forecasts ................................................26 E. How Does the IMF Learn from Past Forecasting Performance and Experience? ...26 F. Assessment ..............................................................................................................31
V. Medium-term Forecasts ......................................................................................................32 A. User and Staff Perspectives on Medium-term Forecasts ........................................32 B. The Importance of Medium-term Forecasts in IMF Surveillance Products ............33 C. Measures of Potential Output and the Output Gap .................................................35 D. Estimation Methods and Process ............................................................................37 E. The Quality of IMF Medium-Term Forecasts .........................................................38 F. Assessment ..............................................................................................................40
VI. Forecasts in the Context of IMF-Supported Programs ......................................................41A. Forecasts in the Context of Program Negotiations .................................................42 B. Statistical Biases in Short-Term Forecasts ..............................................................42 C. Self-Assessment by the IMF of Program Forecasts ................................................44 D. Assessment ..............................................................................................................46

iv
VII. Recommendations ............................................................................................................47A. Learning ..................................................................................................................47 B. Best Practice ............................................................................................................48 C. Communication/Transparency ................................................................................49
Boxes 1. Bottom-up vs. top-down approaches to multi-country forecasting .......................................82. Multi-country forecasting at other organizations .................................................................113. Comparing the Article IV, program, and WEO processes for producing country forecasts 164. The relationship between staff experience and forecast accuracy .......................................285. Methods to estimate potential output ...................................................................................36
Figures 1. Establishing initial conditions ................................................................................................82. Production of forecasts by country desk economists .............................................................93. Survey question: “Please rate your agreement with each of the following statements
about the process through which IMF forecasts are produced.” .....................................12 4. Survey question: “Please rate your agreement with each of the following statements
about the construction and use of Article IV forecasts for your country.” .....................13 5. Survey question: “Please check the box that best describes the importance of each of
the following METHODS to the production of your country desk’s forecasts.” ...........14 6. Survey question: “Please check the box that best describes the importance of the
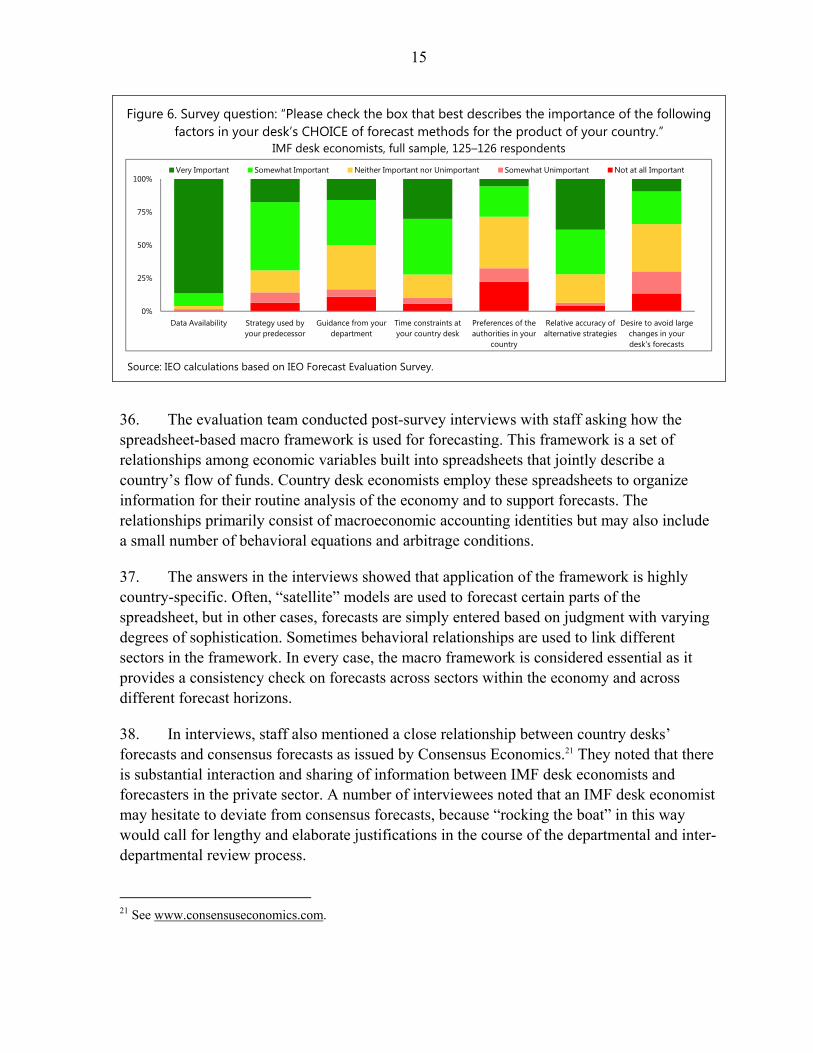
following factors in your desk’s CHOICE of forecast methods for the product of your country.” ............................................................................................................15
7. Forecast Errors of GDP Growth ..........................................................................................208. Interdependence in the data and in forecasts .......................................................................249. Preserving historical memory ..............................................................................................2910. Fan charts around biased and unbiased GDP forecasts .....................................................3511. Growth rate of potential GDP in the United States across different WEO vintages ..........3712. Forecast errors in IMF programs: initial and first-review forecasts ..................................4413. Consensus and IMF forecast errors for selected program cases ........................................45
Tables 1. Median forecast errors in GDP growth, 1991–2011 ............................................................222. Average difference in publication dates with WEO, 2000–10 .............................................25
Annexes 1. Forecast Errors of GDP Growth ..........................................................................................532. The Quality of Growth and Inflation Forecasts for G20 countries ......................................543. Medium-Term Analysis Through Risk Assessments and Scenarios ...................................62
References ................................................................................................................................50

v
ABBREVIATIONS
BRIICS Brazil, Russian Federation, India, Indonesia, China, South Africa CPI consumer price index DMX Data Management for Excel EC European Commission EIU Economist Intelligence Unit EU European Union FDMD First Deputy Managing Director FRB Federal Reserve Board GDP Gross domestic product GPM Global Projection Model G20 Group of Twenty ICD Institute for Capacity Development IDFC Interdepartmental Forecast Committee IEO Independent Evaluation Office IMF International Monetary Fund IMFC International Monetary and Financial Committee MONA Monitoring of Fund Arrangements MSI Meeting on Surveillance Issues OECD Organization for Economic Co-operation and Development SPR Strategy & Policy Review Department WEO World Economic Outlook

vii
Executive Summary
Macroeconomic forecasts are important inputs into IMF bilateral and multilateral surveillance. They form the basis of the analysis and advice contained in Article IV consultations and of the Fund’s view of the outlook for the world economy, as presented in the flagship publications: the World Economic Outlook (WEO), the Global Financial Stability Report (GFSR), and the Fiscal Monitor. The IMF also uses macroeconomic forecasts extensively in other contexts, such as debt sustainability analysis, spillover reports, pilot external balance assessments, and negotiations of IMF-supported adjustment programs, and as the baseline for constructing scenarios and risk assessments for the global economy.
For member country officials to have confidence in the IMF’s analysis and advice, the underlying forecasts must be viewed as sound, evenhanded, and of high quality.
This evaluation assesses these aspects of IMF forecasts. Though the forecasting process at the IMF has evolved significantly in the past five years the assessment deals with current practice. It finds that:
The processes and methods used to generate short-term forecasts for Article IV consultations and the WEO are well structured and, in general, appropriately tailored to country-specific characteristics. By and large, country officials have confidence in their integrity. Some officials believe the forecasting process lacks transparency, however—which is consistent with the evaluation team having to spend considerable time and effort to determine exactly how it is structured.
Averaged over all member countries and over the period 1990–2011, WEO short-term and medium-term forecasts overpredicted GDP growth and underpredicted inflation. Measured biases in IMF forecasts are highly dependent on the chosen sample period, however. In particular, significant overpredictions of GDP growth tended to occur during regional or global recessions, as well as during crises in individual countries. Except for these episodes, the forecasts did not show substantial positive or negative biases.
The accuracy of IMF short-term forecasts was comparable to that of private sector forecasts. This was the case for normal periods as well as for recessions and crises, and for advanced as well as emerging economies.
Short-term forecasts of GDP growth and inflation made in the context of IMF-supported programs were unbiased in the majority of cases. However, they tended to be optimistic in high-profile cases characterized by exceptional access to IMF resources; these cases represented over eighty percent of the dollar amount of IMF resources disbursed. At the first program review (normally about three months into the program), forecast biases were typically reduced or reversed.

viii
The IMF has procedures in place to learn from past forecast performance, but these procedures are not always utilized to their full potential.
Changes in the world economy call for continuous adaptation of the forecasting process and learning by individual forecasters. The evaluation identifies areas where action can be taken to enhance the credibility of the forecasting process and to ensure that high quality is maintained. The recommendations of the evaluation fall into three broad categories. The IMF should:
Promote a culture of learning from past forecast performance by introducing a more structured process for implementing and disseminating the recommendations of commissioned studies of forecast performance, and by ensuring that the accumulated knowledge and experience in the institution is effectively incorporated into the forecasting process.
Ensure that best practice is followed by providing appropriate guidance to desk economists in forecasting for both the short- and medium term. Attention should focus on how forecast methods should be adapted to economies with different structural features and data availability. The IMF should monitor the consistency of medium-term forecasts across the institution as it does now for the short-term outlook.
Enhance transparency by describing the forecasting process in an accessible form, and by making historical forecasts more easily accessible.

I. INTRODUCTION, MOTIVATION, AND MAIN FINDINGS
A forecast is any statement about the future. Such statements may be well founded, or lack any sound basis; they may be accurate or inaccurate on any given occasion, or on average; precise or imprecise; and model-based or informal.
Clements and Hendry (2002, p.2)
1. This evaluation of IMF forecasts is motivated by the importance of these forecasts for member countries and for IMF operations and credibility. The forecasts the Fund produces for member economies are crucial for both multilateral and bilateral surveillance. At the multilateral level, they underpin the analysis presented in the IMF flagship World Economic Outlook (WEO) of potential threats to stability in the global economy as well as the policies that staff propose for mitigating these threats.1 They incorporate the views of IMF staff about policy developments in member countries and also about the linkages that transmit shocks between economies and regions though trade and financial channels. At the bilateral level, forecasts form an integral part of IMF discussions with authorities in individual countries about policy choices in the context of Article IV consultations, and they condition the advice given by IMF staff during such discussions. Forecasts are also central to the design of country programs supported by the use of IMF resources.
2. Officials in member countries generally view IMF forecasts as a valuable input into their own economic policy making.2 Analyses of scenarios and assessments of risk—themselves based on forecasts with different conditioning assumptions than the baseline—are likewise highly valued.3 At the same time, however, some country officials have expressed concerns about the accuracy of the forecasts and the transparency of the forecasting process. The concerns tend to be expressed most forcefully when forecasts of their countries’ growth are revised substantially, especially when the revisions are downward. Doubts about the validity of such revisions can call into question the methodology and accuracy of IMF
1 Twice a year the WEO presents the IMF’s assessment of the prospects for the world economy. It does so based in part on forecasts of GDP growth rates, inflation, current account balances, and other macroeconomic quantities in the main economies and regions of the world. The WEO currently publishes numerical forecasts for 186 member countries. For a subset of countries, forecasts are prepared two more times a year and published in the World Economic Outlook Update. The recently launched spillover report series as well as staff input to the deliberations of the Group of Twenty (G20) countries are other examples where IMF forecasts are used in multilateral contexts.
2 Among the forecasts presented in the WEO, according to the survey carried out for this evaluation it is typically those for the “rest of the world”—regional economies and advanced economies in particular—that are most valued. Officials also noted that point forecasts for their own economy are somewhat less valued, except in low-income countries where the IMF’s forecasts are sometimes the only ones available.
3 See Genberg and Martinez (2014a). Similarly, Boughton (2001) argues that the WEO analysis of potential threats to medium-term stability has “become even more important than the short-term forecasts” (p. 227).

2
forecasts more generally, potentially damaging the credibility of the IMF’s policy analysis and advice.4
A. Goals and Evaluation Questions
3. The aim of the evaluation is fourfold: (i) to assess whether the processes and methods used to generate forecasts within the IMF are transparent and follow best practice given their objectives; (ii) to take stock of what is known about the quality of IMF forecasts and the sources of any weaknesses that may exist; (iii) to assess whether the IMF makes systematic attempts to learn from past forecast performance and other relevant sources; and (iv) to determine how users of the forecasts within the IMF, among member country officials, and in the private sector perceive the quality and usefulness of the forecasts being published.
4. The evaluation addresses the following questions:
(i) Is the process of making forecasts in the IMF well suited for the purpose it is intended to serve—namely, to produce mutually consistent forecasts for a large number of countries that can form the basis for policy analysis, assessments of risk, and advice? Do member country authorities perceive the process as sound, evenhanded, and transparent?
(ii) Are IMF forecasts accurate and efficient? Specifically, are there systematic and persistent biases in forecasts; do forecasts take sufficient account of interdependencies among economies; in terms of accuracy, how do the forecasts by the IMF compare with those of other institutions providing multi-country forecasts; does the accuracy of forecasts in the context of IMF-supported programs differ from that of regular Article IV forecasts? Do forecasts take account of all relevant information? Does the forecast horizon matter for the answers to these questions?
(iii) Is there a well-functioning process whereby the IMF and its individual desk economists learn from past forecast performance?
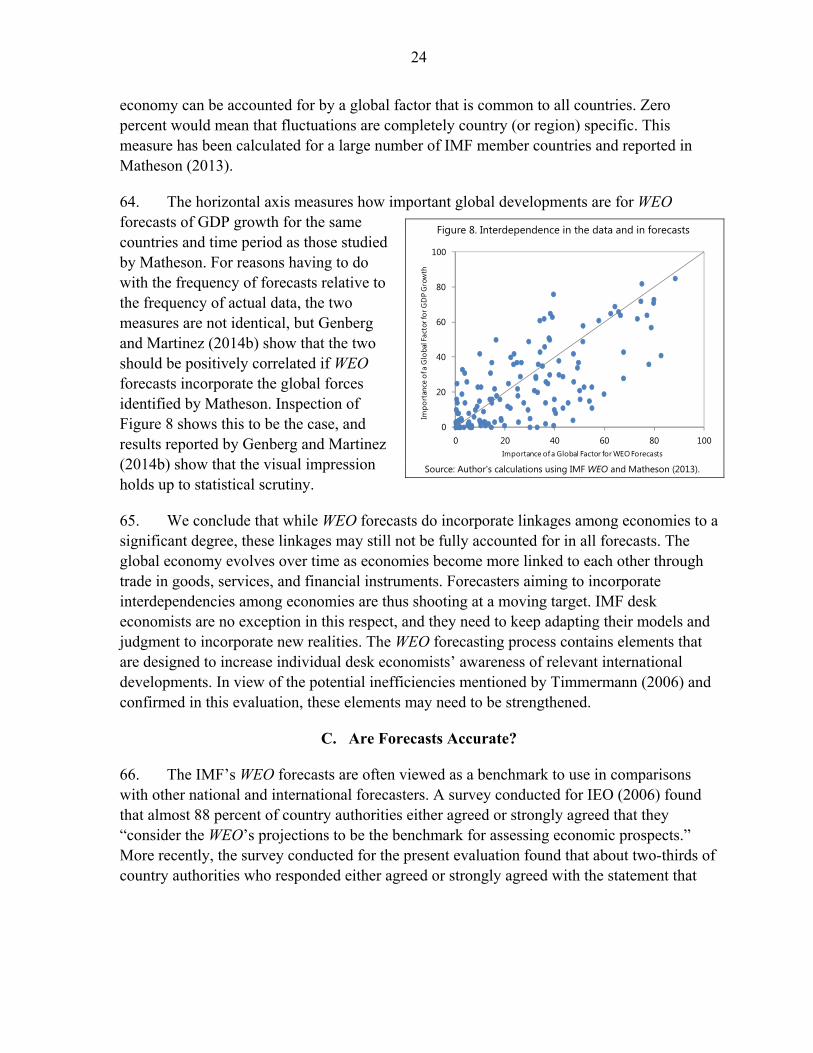
B. Outline of Report
5. The report draws on more detailed material presented in separate background papers and documents.5 It is organized as follows. Chapter II outlines the scope of the evaluation and
4 See for example the intervention by the Indian Minister of Finance at the Plenary of the International Monetary and Financial Committee during the October 2013 Annual Meetings of the IMF: “… India’s growth rate, which was projected at 5.6 percent (at market prices) in the WEO July Update, has now been revised significantly downwards to 3.8 percent. I would like to ask, respectfully, what is the information that IMF has gathered between July and September, that we do not have, that has impelled the Fund to drastically change the estimate? We do not share this pessimistic outlook. We also believe there is a need for review of the methodology for growth projections as in the past, IMF projections have often been at divergence with final growth numbers.” http://www.indianembassy.org/press_detail.php?nid=1978.

3
the methodology used. Chapter III describes and assesses the process the IMF has developed for generating the forecasts that appear in the WEO, in Article IV consultation reports, and in documents related to IMF-supported programs. This chapter also describes how the IMF’s response to the challenges of multi-country forecasting compares with the approaches used by other public and private institutions that engage in similar tasks.
6. Chapter IV assesses the quality of the IMF’s forecasts, by reviewing the conclusions from the existing literature, by presenting original analysis of the accuracy and efficiency of WEO forecasts, and by reporting the perceptions of country authorities and the private sector obtained from a survey undertaken for this evaluation.
7. Chapters V and VI analyze, respectively, the Fund’s medium-term forecasts of GDP growth and its forecasts made in the context of program countries. These sets of forecasts are singled out for separate study because they present particular analytical challenges (in the case of medium-term forecasts) and are associated with a commitment to provide IMF resources and are subject to periodic review (in the case of programs).
8. On the basis of the assessments, Chapter VII proposes recommendations aimed to strengthen the forecasting process inside the IMF and to enhance member countries’ understanding of this process.
C. Summary of Findings
9. About the forecasting process:
(i) The processes and methods used to generate short-term forecasts for Article IV consultations and the WEO are well structured and in general appropriately tailored to country-specific characteristics. Country officials have confidence in the integrity of the forecasts and are generally satisfied with their interactions with IMF staff during their preparation. At the same time, however, a number of officials feel that more could be done to render the forecasting process more transparent—a conclusion also reached by the evaluation team, which had to spend considerable time and effort to determine exactly how it is structured.
(ii) Country officials place high value on the analyses of scenarios and potential risks for the world economy and welcome their more frequent discussion in IMF flagship publications. These analyses generally use medium-term forecasts as baselines for comparison.
5 De Resende (2014), Freedman (2014), Genberg and Martinez (2014a, b), Genberg, Martinez, and Salemi (2014), and Luna (2014a, b).

4
(iii) The forecast method that is appropriate in a given context depends importantly on data availability and structural characteristics of the economy. Desk economists report that it would be useful to receive more guidance on the type of approach that is best suited to particular circumstances.
(iv) Medium-term (three to five years ahead) forecasts present special analytical challenges. They are prepared in parallel with short-term forecasts in an integrated framework, and play important roles in a number of IMF surveillance products such as debt sustainability analysis and external balance assessments. Institution-wide processes to guide the development of medium-term forecasts are less developed than those for short-term forecasts.
10. About forecast quality:
(i) Averaged over all member countries and over the period 1990–2011, WEO forecasts overpredicted GDP growth and underpredicted inflation. Measured biases in IMF forecasts are highly dependent on the chosen sample period, however. Particularly significant overpredictions of GDP growth tended to occur during regional or global recessions, as well as during crises in individual countries. Except for these episodes, the forecasts did not show substantial positive or negative biases. These findings apply to short-term as well as medium-term forecasts.
(ii) The accuracy of IMF short-term forecasts was comparable to that of private forecasts. This was the case for normal periods as well as for recessions and crises, and for advanced as well as emerging economies.
(iii) WEO short-term forecasts reflected international linkages to a considerable degree, but there are some indications that more attention to such linkages could improve forecast efficiency further. This is particularly the case for medium-term forecasts.
(iv) Short-term forecasts of GDP growth and inflation made in the context of IMF-supported programs were unbiased in the majority of cases. However, they tended to be optimistic in high-profile cases characterized by exceptional access to IMF resources; these cases represented over eighty percent of the dollar amount of IMF resources disbursed.
11. About learning:
(i) The experience with regular externally commissioned studies of the accuracy of IMF forecasts has been positive, but the process for disseminating and implementing their recommendations is not fully developed. Greater experience of country desk economists is associated with more accurate forecasts. The IMF has procedures in place to learn from past forecast performance, but these procedures are not always utilized to their full potential.

5
(ii) The optimistic biases found in high-profile IMF-supported programs are typically reduced or reversed at the first program review (normally about three months into the program).
II. EVALUATION FRAMEWORK
A. Scope
12. The evaluation covers macroeconomic forecasts produced by IMF staff in the contextof Article IV consultations, WEO forecast rounds, and IMF-supported programs. It describes and assesses how these forecasts are generated by country desk economists and aggregated and checked for consistency at the IMF-wide level. It reports results of an opinion survey about the perceived value of IMF forecasts to users among country officials and in the private sector, and assesses the quality of the forecasts. The assessment of quality focuses mainly on forecasts of GDP growth, as this is the most important variable according to a survey of country authorities and subsequent follow-up interviews.6 Concentrating on GDP, as a key variable underlying the forecasts of both fiscal and current account balances, also helps the report effectively achieve a broad coverage without becoming excessively taxonomic and lengthy.
13. Because the evaluation seeks to draw lessons for the forecasting process and forecastquality that are relevant for the institution as a whole, it covers all countries for which forecasts are prepared. Findings are reported also for regional groupings of countries as well as for groupings based on stage of economic development. The evaluation covers forecasts for program- as well as non-program countries. As detailed in Chapter VI, it is important to recognize that the Fund’s forecasts for these two groups of countries are based on different assumptions, and ex post evaluations of their relative accuracy must take this into account.
14. IMF forecasts serve as inputs into a variety of analytical frameworks such as those fordebt sustainability analyses, external balance assessments, analyses of policy spillovers, and risk assessments. While recognizing the importance of these uses of forecasts and their value to member country authorities, the evaluation does not assess the nature and quality of the analytical frameworks themselves. It does, however discuss briefly the consequences of biases and uncertainty of forecasts for the conclusions emerging from the use of these frameworks.
15. The forecasting process at the IMF has evolved significantly in the past five years.The assessment in this evaluation deals with current practice.
6 See Genberg and Martinez (2014a) for details on the survey. In Chapter VI below, the analysis of forecasts in the context of IMF-supported programs covers inflation and fiscal and current account balances, in addition to GDP growth.

6
B. Methods and Sources
16. The evaluation relies on a broad range of evidence. The evaluation team interviewedstaff involved with different aspects of forecasting, from junior country-desk economists to senior staff members in functional departments and all area departments; individuals responsible for forecasting in other public international organizations; member-country officials; and representatives in the private sector financial industry. The team also undertook a comprehensive review of past studies of the IMF’s forecasting process and performance written by authors both inside and outside the IMF. Statistical analysis of forecasts was conducted to complement and extend the findings reported in the literature.
17. The evaluation team also conducted surveys of the users of IMF forecasts among IMFstaff, country authorities, and the private financial sector. Representing the producers of the forecasts, IMF staff members responsible for each country forecast were contacted. Representing the users of the forecasts among country authorities, individuals from both the central bank and the finance ministry in each of 187 member countries were approached.7
Responses representing more than two-thirds of the membership were received. In addition, the evaluation team contacted analysts in global private sector financial institutions covering a broad range of countries. Further information about the survey, including the questions asked and detailed response rates, can be found in Genberg and Martinez (2014a).
III. THE WEO FORECASTING PROCESS8
When the data is very noisy [the only way to assess the skill of a forecaster] is to focus more on process than on results.
Silver (2012), p. 327.
18. Forecasting macroeconomic activity for practically the whole IMF membershippresents more difficult challenges than forecasting for a single economy. Idiosyncratic differences among countries, due to structural, geographical, and geopolitical factors, call for specially tailored forecasting approaches and substantial country knowledge. But the forecasts also need to reflect trade and financial linkages with many other countries—requiring a coordination mechanism that entails some degree of centralized guidance.
19. IMF desk economists continuously monitor the economies they cover, assessing hownew domestic and external developments may impact the economic outlook. At specific times of the year they produce formal forecasts of main macroeconomic variables. For each
7 For technical reasons one of the IMF’s 188 members, Somalia, was not included in the sample. The evaluation team also polled three regional central banks and seven territorial entities that are not states as understood by international law but for which IMF generates forecasts.
8 This chapter draws on a detailed treatment in Genberg, Martinez, and Salemi (2014).

7
economy these formal forecasts are made at regular intervals in the context of Article IV consultation missions and during the various WEO forecast rounds. Formal forecasts are also presented in documents related to IMF-supported programs.
20. This chapter evaluates the process by which the formal forecasts are made, concentrating on the WEO forecast rounds because these illustrate the unique multi-country aspects of IMF forecasts. The assessment focuses on the transparency, integrity, and timeliness of the process. Skepticism, suspicion of political interference, and questions about evenhandedness can easily arise given the inherent uncertainty of the environment, and the time lag required to ascertain the accuracy of the forecasts.9 Thus it is essential that users of the forecasts understand and trust the integrity of the forecasting process. This chapter starts by describing the forecasting process and assessing whether it is well designed to deal with the challenges inherent in producing forecasts for a large number of heterogeneous economies (Sections A-D). Section E of the chapter reports survey evidence on how country authorities perceive the forecasting process, and Section F provides an overall assessment.
A. The WEO Forecasting Process: A Combination of Bottom-up and Top-down Approaches
21. Coordinated by the IMF Research Department, the WEO forecasting process combines “top-down” and “bottom-up” approaches (Box 1). At the beginning of the WEO forecasting cycle, representatives from area departments and key functional departments meet as the Interdepartmental Forecast Committee (IDFC) to exchange views about developments in the global economy and in major countries and regions.10 The discussions benefit from the inputs from area departments and are informed by the outlook for commodity prices, conditions in world financial markets, fiscal policy developments, and a set of forecasts from a global econometric model—the Global Projection Model (GPM) maintained at the Research Department (see the dashed arrows in Figure 1).11 The result of
9 Indeed, such suspicions and questions have been raised in the academic literature (see Genberg and Martinez, 2014b and Luna, 2014b for reviews), in interviews with country officials, and in the press.
10 Although the IDFC is relatively new it already plays an important role in the initial WEO coordination process. The Committee is co-chaired by a representative from the area departments and the Deputy Director of the Research Department responsible for the WEO. Participating in the meetings of the IDFC are representatives from all five area departments, as well as the Fiscal Affairs, Monetary and Capital Markets, Research, and Strategy, Policy, & Review Departments. The discussions in the committee center on the near-term outlook, and they do not appear to lead to explicit guidance about longer-term developments in member countries related to the structural determinants of economic growth.
11 This model currently covers six countries/regions of the world: Asia, excluding Japan, Japan, the Euro Area, the U.S., the Western Hemisphere, and the rest of the world. It is important to note that the forecasts from the GPM are themselves informed by inputs from area and functional departments and incorporate substantial elements of judgment. In December 2013, an IMF working paper describes that China has been added as a separate block in the GPM. See Blagrave and others (2013).

8
the discussions is a set of initial global conditions that is transmitted by the WEO coordination team to each country desk economist (see the solid arrows in Figure 1).
Box 1. Bottom-up vs. top-down approaches to multi-country forecasting
An advantage of a pure bottom-up approach is that it places the task of forecasting in the hands of country experts who follow country-specific economic developments on a daily basis and are in close contact with government officials and private sector experts. Such an approach also allows desk economists to use whatever model seems best suited to capture the essential features of each particular economy. Limitations of the pure bottom-up approach are that different country desks may make different assumptions about worldwide economic conditions, and that no checks and balances ensure regional and global consistency among the forecasts.
A pure top-down approach uses one model or a set of linked models to generate forecasts for all countries and regions. This approach guarantees that forecasts are conditioned on common initial assumptions, and that aggregation restrictions on regional and global forecasts are satisfied. But the complexity of this sort of modeling quickly becomes intractable for even just a moderate number of countries unless most characteristics and information specific to each economy are sacrificed.
Thus, some combination of the two approaches is desirable.
Figure 1. Establishing initial conditions
22. Country desk economists combine the set of global conditions received from theWEO team with other inputs they regularly obtain from country authorities and from other forecasters, as well as with economic intelligence gathered sometimes on a daily basis (Figure 2). Using methods and approaches that can vary substantially across countries, the desk economists update their forecasts and transmit them to the WEO team.12 Before the
12 Section E below describes the forecasting process at the level of the country desk.
Developments in major countries and regions
Exchange of views IDFC
Global conditions WEO
Country desk economist
Commodity prices Financial developments
Fiscal developments
Global model

9
forecasts are sent to the WEO team, they have typically been reviewed within the relevant area department to ensure consistency among the country forecasts made within the region as well as consistency with the global and regional outlook established in the initial phase of the forecasting process.13
Figure 2. Production of forecasts by country desk economists
23. The WEO team carries out further consistency checks in coordination with country desks/departments. For example, the aggregated current account balance for the world, as implied by country desk forecasts, must not be too different from zero.14 Once the iterative process is finished, the country desk economists submit their final forecasts into the data management system maintained by the WEO team. After two meetings to communicate the
13 The type of coordination varies across the area departments. For example, in the European department it is carried out using a GPM-type model developed for the largest economies in the region. In other departments structured informative interactions take place without reliance on a formal econometric model, while in yet others the coordination can be perfunctory.
14 A number of other checks are also carried out to ensure that accounting identities are respected and that standard theoretical presumptions are not violated. Other checks are intended to detect possible reporting errors, and yet others will flag anomalous changes in the forecast relative to the most recent forecast or unusually large changes in the data. Forecasts for selected large economies also undergo special scrutiny by staff of the Research Department, mindful of their importance for the world economic outlook generally. Interviews with staff revealed that the checks, although often somewhat mechanical, are generally considered useful. A number of interviewees felt that it would be valuable if greater economic content could be included in the feedback given by the Research Department.
Other forecasters
Initial country forecast
Consistency checks
Final country forecast
Global conditions WEO
Country desk economist
Country Authorities

10
findings to the Board of Executive Directors, these are the forecasts published in the WEO.
B. Duration of a Typical WEO Forecast Round
24. The overall duration of the full WEO forecast round is significantly longer than the comparable processes at other institutions (Box 2), in part because the coordination built into the Fund’s process is time-consuming, and in part because it includes the preparation of the descriptive and analytical chapters that accompany the forecasts in the WEO publication.15 The Fund’s top-down phase typically takes about four weeks to complete, while the entire process requires between three and four months.
C. The Role of IMF Management and the Executive Board
25. IMF Management gives its formal approval to the publication of the WEO document as a whole. Management also has an indirect impact on the forecasts themselves. The First Deputy Managing Director (FDMD) participates in a weekly Meeting on Surveillance Issues16 that assesses global economic conditions along with the most recent forecasts produced by the Global Projection Model. Comments by the FDMD at this weekly meeting filter down to desk economists through department representatives at the meeting and through the Interdepartmental Forecast Committee.
26. WEO forecasts are presented twice to the Executive Board, once one to two months before the final publication and once about two weeks before it. After Board members’ comments are received in the first of these meetings, the staff have the opportunity to revise the forecasts if there are reasons to do so. The second meeting is mainly to brief the Board before the WEO is published.
27. Board members also interact with staff during the preparation of country forecasts, whether by relaying information from the country authorities they represent or by providing their own perspectives. But the Board does not formally endorse the forecasts, which remain the views of staff.
15 Survey responses and interviews confirmed the high value that country officials and private-sector economists attach to these descriptive and analytical chapters. The timeliness of the actual point forecasts is thus not considered as important an issue for IMF forecasts as for private sector forecasts.
16 The Meeting brings together the FDMD, the Economic Counselor, the Financial Counselor, and two representatives from each department.

11
Box 2. Multi-country forecasting at other organizations
One way to gain perspective on the IMF forecasting process is to consider how global forecasting is done in other international agencies and in the private sector. This box summarizes aspects of the forecasting process at the U.S. Federal Reserve Board (FRB), the Organization for Economic Co-operation and Development (OECD), the Asian Development Bank (ADB), the European Commission (EC), and three global investment banks.
Institutions combine top-down and bottom-up approaches to different degrees. The OECD arguably applies the most top-down process. It produces forecasts twice a year for the 35 OECD countries and for the BRIICS group (Brazil, Russia, India, Indonesia, China, and South Africa). Like the IMF, the OECD also produces two updates to these forecasts annually. Each of the major forecast rounds takes 40 working days. The top-down approach is implemented by means of strong guidelines that OECD directors issue for country desks.
Among public institutions the FRB arguably lies closest to the bottom-up spectrum of possible approaches. FRB economists produce forecasts for 25 foreign economies that together account for more than 90 percent of U.S. trade. The FRB forecasting process occurs eight times a year, each time lasting two weeks. FRB forecasters are typically not constrained by top-down guidance in the construction of forecasts, nor are they generally required to satisfy any adding up constraints, although occasionally they may be asked to reconsider when the implied aggregate current account balance for the U.S. seems out of line.
Of the other official institutions, the EC is more like the IMF in that country desk economists are given common background conditions, including forecasts for relevant non-EU economies as well as for commodity prices. They are also given broad EU and Euro Area forecasts as guidelines, but are not strictly constrained by these when they prepare their own forecasts. The ADB also follows a mixed approach, giving country desk economists substantial autonomy.
Private sector institutions generally have the most bottom-up processes. Global investment banks typically produce forecasts bi-weekly. While there may be some centralized guidance, coordination between country desks and the chief economist unit typically takes place by means of a conference call in which peers scrutinize and comment on each country forecast.
What may explain these institutional differences? First, producing frequent forecasts may preclude an elaborate process for reconciling views from the center and from country specialists. This means that a largely bottom-up approach is almost inevitable for global investment banks that produce forecasts every other week.1 If timeliness is not the most valued feature of the forecast, a more inclusive iterative process can be considered in which country, regional, and global perspectives are brought to bear.
When most of the economies of interest are affected by common factors, it is justified to use a more centralized approach with a top-down view, as in the OECD, and not let country desk economists deviate extensively from that view. For the IMF, by contrast, which must produce forecasts for countries with vastly different economic structures, an approach in which idiosyncratic factors are allowed to play a more significant role is more suitable. ——————— 1 For reasons explained in Box 1 we exclude the option of adopting a single centralized model for all economies. Such a model could in principle produce forecasts at a high frequency but their reliability would be doubtful.

12
D. User Perspectives on the IMF Forecasting Process
28. The perspectives of users of IMF forecasts on various aspects of the forecastingprocess—its general soundness, the extent to which it is well documented, and whether it is based on an appropriate degree of interaction with national authorities—were gathered by means of a survey of member country officials from central banks and finance ministries. The responses generally reveal a positive attitude towards the forecasting process, although there are cases when some concern is warranted.
29. A large majority of the respondents agreed that WEO and Article IV forecasts are freeof political influence (Figure 3). In addition, respondents generally felt that IMF forecasts provide an accurate picture of their country’s economy in both the WEO and Article IV contexts. These findings suggest that country authorities place substantial confidence in the integrity of the IMF forecasting process. They hold across country groupings based on geographical location, degree of economic development, and on whether or not the country has recently negotiated a program with the IMF.
Figure 3. Survey question: “Please rate your agreement with each of the following statements about the process through which IMF forecasts are produced.”
Country authorities, full sample, 179 respondents
Source: IEO calculations based on IEO Forecast Evaluation Survey.
30. Country authorities generally have a favorable opinion about the transparency of theforecasting process (Figure 3). This perception is squarely at odds with opinions expressed in interviews with the evaluation team by several Executive Directors and country authorities who saw the forecasting process at the IMF as a “black box”—a view echoed by some staff in post-survey interviews. It is also at variance with the experience of the evaluation team. For lack of comprehensive documentation of the forecasting process, it took the team considerable effort to combine information from various sources to determine the exact nature of the process at the level of the country desk economist and at the level of the coordination of forecasts within departments and at the IMF as a whole. Likewise, obtaining complete historical data series on forecasts would have been challenging if the team had not had access to the internal website of the IMF.
0%
25%
50%
75%
100%
WEO forecasts for my country
are free of political
influence.
WEO provides an accurate picture of my country's
economy.
IMF adequately documents the WEO forecast
process.
Article IV forecasts for my country are free
of political influence.
Article IV forecasts provide
an accurate picture of my
country's economy
The IMF adequately
documents the Article IV
forecast process.
IMF forecasts are unbiased
The IMF forecasting
process treats every country
fairly
Historical time series of IMF forecasts are
easily accessible
N/A or Don't Know Strongly Agree Agree Neither Agree Nor Disagree Disagree Strongly Disagree

13
31. Post-survey interviews with senior country officials provided further perspectives. Interviewees generally did not have a firm knowledge about the forecasting process at the IMF, but their views differed on whether this mattered.17 Some “did not care” about the details of the forecasting process as long as the results were of high quality, while for others, not knowing the details about the forecasting process was not a concern because they trusted the integrity of IMF staff. Still other country officials thought that providing more information about the forecasting process would add credibility to the forecasts and reduce risks of misunderstanding.
32. Country authorities are generally satisfied with the interaction with staff that takes place during the preparation of Article IV forecasts (Figure 4). Large majorities indicated that IMF forecasts take into account specific characteristics of their country’s economy, and that the IMF actively seeks their country’s input in preparing the forecasts. Fewer than a quarter of the respondents believe that they are unable to influence the IMF forecasts in appropriate ways. This said, an alternative way to describe the responses to this question would be that fewer than 50 percent of country authorities “agree” or “strongly agree” that they are able to influence IMF forecasts in appropriate ways.18,19
Figure 4. Survey question: “Please rate your agreement with each of the following statements about the construction and use of Article IV forecasts for your country.”
Country authorities, full sample, 179 respondents
Source: IEO calculations based on IEO Forecast Evaluation Survey.
17 Officials at the level of Department Director from the Central Bank or the Finance Ministry/Treasury in seventeen countries were interviewed. Of these no one claimed to have a firm knowledge of the forecasting process at the IMF.
18 This is one instance where it is possible to view the responses either as “the glass being half empty” or “half full” depending on the chosen point of reference.
19 A potential difficulty in interpreting the responses about lack of political influence on forecasts is that what one country considers “appropriate influence” another may consider less benign.
0%
25%
50%
75%
100%
My country is able to influence its IMF
forecasts in appropriate ways
IMF forecasts for my country ignore information my
country provides
IMF forecasts for my country contribute importantly to IMF
consultations with my country
IMF consultations with my country are unaffected by IMF forecasts for my
country
IMF forecasts for my country take into
account the specific characteristics of my country's economy
IMF forecasts for my couuntry are
essentially the same as IMF forecasts for
my region
The IMF actively seeks my country's input in preparing forecasts
for my country
N/A or Don't Know Strongly Agree Agree Neither Agree Nor Disagree Disagree Strongly Disagree

14
E. How Country Desks Produce Their Forecasts
33. Based on a survey of country desk economists and follow-up interviews, this section discusses the methods used to produce individual country forecasts and the basis on which these methods are chosen. The methods vary substantially depending on country characteristics, but they do not differ significantly according to the proposed uses of the forecasts, whether for Article IV consultations, a WEO round, or a program negotiation (Box 3).
34. The Fund’s spreadsheet-based macro framework,20 judgment, and forecasts produced by country authorities are used much more widely than are methods based on structural econometric models, vector-auto-regression (VAR) or reduced-form equations (Figure 5). This finding holds regardless of whether countries are grouped by region, level of income, or degree of commodity export concentration. Statistical models of the structural, VAR, or reduced-form type are much less important in forecasting for low-income countries than for advanced countries, principally because of the differences in data availability between these types of economies.
Figure 5. Survey question: “Please check the box that best describes the importance of each of the following METHODS to the production of your country desk’s forecasts.”
IMF desk economists, full sample, 122–126 respondents
Source: IEO calculations based on IEO Forecast Evaluation Survey.
35. Data availability is the single most important factor in the choice of forecasting method (Figure 6). Time constraints and the strategy used by the desk economist’s predecessor are also important considerations.
20 Formerly termed the “financial programming framework,” and described later in this section.
0%
25%
50%
75%
100%
Structural multi-equation econometric
model
VAR model of important country
variables
Reduced form equations for sectors
of the economy
Spread-sheet-based framework
Use of judgment Forecasts produced by country authorities
Forecasts produced by other forecasters
Very important Somewhat important Neither important nor unimportant Somewhat unimportant Not at all important
15
Figure 6. Survey question: “Please check the box that best describes the importance of the following factors in your desk’s CHOICE of forecast methods for the product of your country.”
IMF desk economists, full sample, 125–126 respondents
Source: IEO calculations based on IEO Forecast Evaluation Survey.
36. The evaluation team conducted post-survey interviews with staff asking how the spreadsheet-based macro framework is used for forecasting. This framework is a set of relationships among economic variables built into spreadsheets that jointly describe a country’s flow of funds. Country desk economists employ these spreadsheets to organize information for their routine analysis of the economy and to support forecasts. The relationships primarily consist of macroeconomic accounting identities but may also include a small number of behavioral equations and arbitrage conditions.
37. The answers in the interviews showed that application of the framework is highly country-specific. Often, “satellite” models are used to forecast certain parts of the spreadsheet, but in other cases, forecasts are simply entered based on judgment with varying degrees of sophistication. Sometimes behavioral relationships are used to link different sectors in the framework. In every case, the macro framework is considered essential as it provides a consistency check on forecasts across sectors within the economy and across different forecast horizons.
38. In interviews, staff also mentioned a close relationship between country desks’ forecasts and consensus forecasts as issued by Consensus Economics.21 They noted that there is substantial interaction and sharing of information between IMF desk economists and forecasters in the private sector. A number of interviewees noted that an IMF desk economist may hesitate to deviate from consensus forecasts, because “rocking the boat” in this way would call for lengthy and elaborate justifications in the course of the departmental and inter-departmental review process.
21 See www.consensuseconomics.com.
0%
25%
50%
75%
100%
Data Availability Strategy used by your predecessor
Guidance from your department
Time constraints at your country desk
Preferences of the authorities in your
country
Relative accuracy of alternative strategies
Desire to avoid large changes in your desk's forecasts
Very Important Somewhat Important Neither Important nor Unimportant Somewhat Unimportant Not at all Important

16
Box 3. Comparing the Article IV, program, and WEO processes for producing country forecasts
Starting from a macro framework, IMF staff produce forecasts for Article IV surveillance consultations1 and for country program discussions, as well as for the WEO. For any particular economy, the methodology and techniques used to obtain these three types of forecasts are substantially the same, but differ in a few ways, explained here.
Article IV consultations and program discussions and reviews can occur at any point in a calendar year and forecasts are produced whenever such events occur. When an Article IV consultation coincides with a WEO round, then the Article IV forecasts for the country in question are identical to the forecasts submitted to the WEO. Indeed, Article IV consultations with G7 countries are now scheduled to coincide with WEO rounds so that the Article IV and WEO forecasts for the G7 are identical.2
When an Article IV consultation or program discussion does not coincide with a WEO round, the country desk economist uses the most recent WEO forecasts as a starting point and updates them based on discussions with, and data from, country authorities before and during the Article IV or program mission. If the desk economist judges that conditions have not changed, then the forecasts will be the same as the most recent WEO forecasts. In creating the Article IV and program forecasts, the desk economists do not automatically have the benefit of a new memo on initial global conditions, but they do have access to the most recent forecasts from the Global Projection Model. Program and Article IV forecasts are also not subject to aggregation checks since other country desks are not necessarily producing forecast updates at the same time. However, the area department still reviews the individual forecasts.
In the context of program countries, forecasts of variables used in the program’s “quantitative targets” have special features: future disbursements by the Fund and the perceived success of the program are conditional on meeting those targets, and the authorities can play a determining role in whether the targets are met.
In summary, Article IV, program, and WEO forecasts can be thought of as snapshots of a continuous forecasting process used by country desk economists. The first two involve greater interaction with country authorities and less top-down direction, whereas the last entails significant formal top-down elements to ensure global consistency.
There is one other way in which the Article IV and program forecasting processes differ from the WEO forecasting process. In the WEO process, the IMF Executive Board is briefed on the WEO before the report is published, but does not officially approve the report, which is considered a staff document. In the Article IV bilateral surveillance process, and even more so in the context of a program discussion, the IMF Executive Board is asked to broadly endorse the staff appraisal contained in the Article IV report or program document prepared by staff. The staff appraisal is based in part on the forecasts produced for the economy.
—————— 1The Integrated Surveillance Decision (ISD), adopted in 2012, made Article IV consultations a vehicle of both bilateral and multilateral surveillance. Prior to the ISD, Article IV consultations were a vehicle of bilateral surveillance only. 2 A comparison of Article IV and WEO forecasts for G7 countries for the period 2009–13 shows that they are the same for all practical purposes.

17
F. Assessment
39. Is the IMF’s forecasting process well suited for the purpose it is intended to serve? Is it perceived as sound, evenhanded, and transparent by member country authorities? The findings reported in this chapter imply a broadly affirmative answer to the first question, but indicate that there is some room for improvement with respect to the issues raised in the second.
40. The combination of centralized guidance and desk economists’ expertise that characterize the forecasting process is appropriate, as judged both by the challenges of producing mutually consistent forecasts for a large number of countries that differ from each other in important ways and by a comparison with the processes used in other institutions producing multi-country forecasts. For some member countries, the IMF forecasts are the only ones available—highlighting their characteristic as public goods.
41. Though the WEO forecast rounds typically take more time than the corresponding rounds in other institutions, especially those in the private sector, the frequency of the forecasts is not as important as in the private sector. The value of the WEO forecasts lies as much in the analysis that accompanies them, including risk scenarios and assessments, as in the point forecasts themselves.
42. The methods that country economists use to produce forecasts differ across countries in ways that appear appropriate given differences in country data availability and stage of economic development. Likewise, the evidence that judgment is an important element in the forecasting process is consistent with best practice.
43. Can methods and practices be improved? A number of staff indicated in interviews that a good forecasting record is not a sufficiently appreciated element in staff performance appraisals, and that this reduces staff incentives to allocate time to forecasting. Interviews also revealed that the passing of the baton from one desk officer to another sometimes leads to a loss of information about the economy, both in terms of existing modeling work and in terms of “soft” knowledge that informs judgment.
44. The evaluation team found that it took considerable effort and time to obtain a clear picture of the forecasting process both at the level of the institution as a whole and at the level of country desks, substantiating the view of some officials who felt that the process was opaque.
45. Country authorities have confidence in the integrity of IMF forecasts. A majority of them believe that IMF forecasts are unbiased, treat every country fairly, and provide an accurate picture of their economies. But some thought otherwise (Figure 3). The next chapter assesses whether the forecasting process has led to forecasts of adequate quality.

18
IV. THE QUALITY OF IMF FORECASTS22
Prediction is very difficult, especially about the future. Attributed to Niels Bohr,
Danish physicist and philosopher 46. This chapter assesses the quality of IMF forecasts during 1990 to 2011, a period that included episodes of relatively sustained global economic growth as well as global, regional, and country-specific crises or recessions. Like virtually all studies that have evaluated IMF forecasts, it focuses on short-term forecasts, i.e., those made for the current year and one year ahead.23 The analysis covers the IMF membership as a whole, in order to investigate whether the forecast quality varied systematically by region or level of economic development. For reasons already explained, the focus is primarily on forecasts of GDP growth.
47. The quantitative analysis is restricted to WEO forecasts rather than forecasts published in Article IV consultation reports. First, WEO forecasts are more frequent and are issued at regular intervals (twice a year, at roughly the same dates for virtually the whole membership)—which facilitates their comparison with those of other agencies that release forecasts on a regular basis and for many economies. Second, WEO forecasts have been analyzed in commissioned studies of IMF forecasting performance since the 1980s (see Section E below), allowing comparisons to be made with those studies and an assessment of how the IMF learns from its past forecasting performance. Third, the WEO data are more readily available, being organized in a comprehensive dataset, than data on Article IV forecasts.24 Finally, as explained in Chapter III, except for reasons related to timing there should be no substantial differences between WEO and Article IV forecasts, since their preparation follows the same general process.
48. The analysis concentrates on point forecasts. Clearly, informed views about the future require more than just point forecasts: risk scenarios and the analysis of driving forces behind the path of the variables forecast are also important; they are highly valued by country officials according to the survey conducted for this evaluation, and are been increasingly incorporated in IMF flagship documents and Article IV consultation reports in response to
22 This chapter draws on a more detailed treatment in Genberg and Martinez (2014b).
23 Medium-term forecasts are discussed in Chapter V.
24 To our knowledge, there is no unified dataset that contains data on Article IV forecasts. Recent WEO forecasts are easily accessible through the IMF website. Each individual release of the WEO’s forecasts is available for more than a decade dating back through 1998, either in the statistical appendixes of the relevant WEO publication or in its corresponding database. It is much harder to access historical forecasts from the WEO. Despite the fact that the WEO has produced forecasts since 1971, and has published them since 1980, the IMF website provides no information on the forecasts prior to the late 1990s. For additional detail, see Genberg and Martinez (2014b, Annex 1).

19
the recommendations from the commissioned external evaluation of IMF forecasts by Timmerman (2006). But point forecasts can nonetheless be viewed as the basis, or starting point, for such broader sets of considerations about future economic developments.
49. With these considerations in mind, the assessment of the quality of IMF forecasts is based on three separate metrics—informational efficiency (Sections A and B), accuracy (Section C), and perceptions by country authorities and the private sector (Section D). Section E considers the importance of learning from past forecast performance for the quality of forecasts, and the IMF’s current practices in this respect, and section F provides an overall assessment.
A. Are Forecasts Biased?
50. An issue frequently raised about IMF forecasts in the academic literature and in interviews with country authorities is whether they are systematically biased. The most recently published study of the quality of IMF forecasts commissioned by the IMF (Timmermann, 2006), covering the period 1990 to 2003, concluded that “forecasts of real GDP growth display a tendency for systematic overprediction” (p.6). While several other studies concur with Timmerman’s assessment (for example Artis, 1988 and Faust, 2013), a number of authors draw the opposite conclusion or find no evidence of bias.25
51. Among the reasons for the different conclusions are differences in the choice of sample period, the countries included in the analysis, and whether or not program countries are included in the sample. Some examples of the implications of these choices follow.
52. Figure 7 illustrates how conclusions can vary depending on the choice of sample period. It shows the errors in GDP growth forecasts for each of 144 member countries as well as the cross-country averages and medians, calculated year by year. The figure makes clear that studies based on cross-country averages and samples that are heavily weighted by the 1990s and early 2000s will tend to find negative cross-country average forecast errors, i.e., an optimistic bias.26 Extending the analysis into the 2000s will include underestimations of GDP growth observed in the middle of the decade—so much so that the overall bias for the whole period since the early 1990s becomes quite small.
53. As shown in Annex 1, for advanced, emerging, and low-income economies the general message is the same: average forecast errors vary over time, tend to be negative (optimistic) in the 1990s, and larger than zero (pessimistic) for a number of years in the mid-
25 See Genberg and Martinez (2014b), Section II.B (i) for detailed references.
26 See Genberg and Martinez (2014b) for details about the sample and the calculations. Forecast errors are calculated as the actual outcome minus the forecast. A negative forecast error for economic growth can thus be labeled an optimistic forecast.

20
2000s. For low-income economies the average forecast errors also vary over time, but they are more consistently negative (optimistic) than for the other two types of economies (see also Table 1 below).
54. Figure 7 also illustrates other features of the forecast errors that should be kept in mind when inferences are drawn about the nature of IMF forecasts. In particular, even though a majority of the errors cluster around zero in a range of plus-minus 2 percentage points to 3 percentage points, there are significant numbers of errors of a much larger magnitude. As will be discussed in more detail below, these are often associated with economic crises or recoveries therefrom. As a consequence, the cross-country mean can be heavily influenced by outliers. The cross-country median (the blue circles in the figure) is less affected by outliers and is therefore typically significantly closer to zero than the mean.27
Figure 7. Forecast Errors of GDP Growth (In percentage points)
Source: IEO calculations using Spring WEO current year forecasts.
55. For individual G20 economies, as for the membership as a whole, overpredictions of GDP growth are the most frequent outcome (Figure A.2.1 and Table A.2.1 in Annex 2),
27 A feature of the data not visible in the figure but which can be verified by statistical analysis is that sequences of individual country forecast errors are typically not serially correlated even though the cross-country averages appear to be. (See de Resende, 2014; and Genberg and Martinez, 2014a.)
-5
-4
-3
-2
-1
0
1
2
3
4
5
1990
1991
1992
1993
1994
1995
1996
1997
1998
1999
2000
2001
2002
2003
2004
2005
2006
2007
2008
2009
2010
2011
2012
Forecast Errors Median Mean

21
although there are considerable variations over time and across countries also in this group.28
Underestimations of inflation are much less frequent among G20 economies than in the membership as a whole. Among these economies, especially emerging-market economies, inflation tends to be mostly overpredicted.
56. A recurring feature of forecast errors is the particularly large negative values during regional and global recessions such as the crisis in the European Union in 1992, the Asian Crisis in 1997–98, the end of the dot-com bubble in March 2000, and the financial crisis of 2007–09.29 Table 1 shows how recessions decisively affect the measure of biases in short-term GDP forecasts. For instance, consider the spring vintage of next-year forecasts, which shows the largest optimistic biases. The bias, measured by the median forecast error, ranges from about -0.3 percentage points to -0.5 percentage points, depending on countries’ level of development and their IMF program participation status.30 However, when the highly optimistic biases observed for recession years (ranging from -4 percentage points to -7 percentage points) are excluded from the sample, optimistic biases are eliminated, reversed, or substantially reduced.31
57. Juhn and Loungani (2002) showed that the onsets of recessions are difficult to forecast, as judged by the spectacular failure of private sector forecasters to do so. The IEO evaluation team carried out calculations using these authors’ methodology, focusing on the forecast record of the IMF. The results are equally telling: neither the IMF nor the private sector has been able to forecast the onset of recessions very well.
58. Is it possible to identify institutional factors that explain why large forecast errors tend to be particularly clustered around regional or global recessions? While it is clear that some events may be unpredictable, Juhn and Loungani (2002) argue that private sector forecasters’ inability to predict recessions could arise from a lack of incentives to do so. Within the IMF, whose internal forecasting process may discourage forecasts that “rock the boat,” as noted in Chapter III, there is little incentive to forecast a recession when neither the private sector nor previous forecast rounds have done so. As part of the Fund’s review process, staff forecasts are checked against those of other forecasters and need to be justified
28 Statistically significant average underpredictions are only observed for China and a few isolated cases in other emerging-market economies.
29 The large average errors in the 1992, 1998, and 2001 forecasts are visible in Figure 7 for the entire membership. Figure A.2.1 in Annex 2 shows that significant forecast errors were made in the 2007–09 crisis for a number of G20 countries.
30 As already noted, overpredictions are particularly prevalent in low-income countries.
31 Similar results are obtained if outliers (either positive or negative) are eliminated from the sample, a practice that has been suggested in the literature on forecast evaluation. See Genberg and Martinez (2103b), Section II.C(iii), for details.

22
if they are different. Although asking for such justification is perfectly legitimate, desk economists can minimize the amount of scrutiny their forecasts will receive by not differing significantly from the consensus forecast.32 While this scrutiny operates symmetrically, the cost of forecasting a recession that does not materialize may be perceived as higher than the cost of having wrongly predicted a boom.33 And efforts to convince colleagues and supervisors may not seem to promise a large enough pay-off, even if the forecast is ultimately proven right. It should also be noted that forecasting a recession may entail high costs if doing so would in fact precipitate a recession.
Table 1. Median forecast errors in GDP growth, 1991–2011 (In percentage points)
Year-ahead Forecasts Current year Forecasts Spring Fall Spring Fall
Full sample -0.29 -0.20 0.00 0.00 For all recessions -6.27 -5.73 -3.69 -1.52 For non-recessions 0.00 0.00 0.09 0.07
Advanced countries -0.30 -0.19 0.07 0.10 For all recessions -4.14 -3.64 -0.90 -0.16 For non-recessions 0.00 0.12 0.15 0.11
Emerging & developing countries -0.04 0.00 0.06 0.10 For all recessions -6.50 -5.92 -3.38 -1.44 For non-recessions 0.30 0.30 0.30 0.23
Low-income countries -0.50 -0.42 -0.20 0.00 For all recessions -7.03 -6.89 -5.00 -3.59 For non-recessions -0.11 -0.08 0.00 0.00
IMF program countries -0.43 -0.30 -0.05 0.00 For all recessions -7.03 -6.93 -4.94 -1.94 For non-recessions -0.07 0.00 0.00 0.06
Source: IEO calculations using IMF WEO.
59. Optimistic biases are reduced as more information becomes available (Fall vintages) and are typically smaller for shorter forecast horizons (current year) (Table 1). An implication of these findings is that revisions of forecasts, for example from the Spring WEO to the Fall WEO, typically reduce biases. Timmermann (2006) and Faust (2013) found
32 Similar arguments were made in the evaluation of IMF Performance in the Run-up to the Financial and Economic Crisis (IEO, 2011): “The evaluation found that incentives were not well aligned to foster the candid exchange of ideas that is needed for good surveillance” (para 55), “…expressing strong contrarian views could ‘ruin one’s career’” (para. 56).
33 As noted in de Resende (2014), a complementary explanation would rely on the empirical observation that recessions tend to occur more abruptly and be associated with temporary shocks, while booms are more gradual and frequently related to permanent shocks.

23
similar results with respect to forecast accuracy: revisions made in WEO forecasts as more information became available regularly led to a reduction in the size of forecast errors.34
60. The fact that biases are critically affected by recessions and vary both over time and across regions makes it difficult to argue that there is a consistent institutional bias in IMF forecasts, either optimistic or pessimistic. In addition, as argued by Faust (2013), statistical tests of unbiasedness, accuracy, and overall efficiency may be a poor assessment of the quality of forecasts when there are relatively frequent structural changes in the economies for which forecasts are produced.
61. Finding that biases in WEO forecasts of GDP growth are not systemic at the institutional level should not be a reason for complacency, however. Lack of bias only means that positive and negative forecast errors tend to cancel each other out over time. It does not mean that forecast errors are small35 or that there are no possibilities for improvement in individual countries.
B. Are Forecasts Efficient?
62. Efficiency of forecasts is a wider concept than bias and refers to whether or not the forecasts take into account “all available information.” In the context of multi-country forecasts a particularly interesting question relating to efficiency is whether the forecasters in each individual country take proper account of interdependencies between member countries. Timmermann (2006) showed that forecast errors in the WEO are in part explainable by the forecasts of US and German GDP growth that were available when the forecasts for other countries were made. This result indicates that some interdependencies may not be fully incorporated in all WEO forecasts. Timmermann’s (2006) results still hold true for WEO forecasts when the sample period is extended to 2011. In addition, information in forecasts for China’s GDP growth also does not appear to have been adequately incorporated in forecasts for some other countries in this extended sample.36 See Genberg and Martinez (2014b).
63. These results should not be taken to mean that WEO forecasts systematically ignore interlinkages between countries. Indeed, the evaluation finds strong evidence that interlinkages are taken into account, albeit perhaps not fully. Consider Figure 8. On the vertical axis it shows a measure of how important global developments are for GDP growth in an economy. One hundred percent would indicate that all of the fluctuations in the
34 De Resende (2014) contains similar findings with respect to medium-term forecasts: the shorter the forecast horizon the greater the accuracy.
35 Faust (2013) reports that median and mean year-ahead Fall forecast errors of GDP growth in 2009 in advanced countries were more than four percentage points, roughly the same as in our sample (3.6 percentage points).
36 Chapter IV below shows that this type of informational inefficiency is also present in medium-term forecasts.
24
economy can be accounted for by a global factor that is common to all countries. Zero percent would mean that fluctuations are completely country (or region) specific. This measure has been calculated for a large number of IMF member countries and reported in Matheson (2013).
64. The horizontal axis measures how important global developments are for WEO forecasts of GDP growth for the same countries and time period as those studied by Matheson. For reasons having to do with the frequency of forecasts relative to the frequency of actual data, the two measures are not identical, but Genberg and Martinez (2014b) show that the two should be positively correlated if WEO forecasts incorporate the global forces identified by Matheson. Inspection of Figure 8 shows this to be the case, and results reported by Genberg and Martinez (2014b) show that the visual impression holds up to statistical scrutiny.
65. We conclude that while WEO forecasts do incorporate linkages among economies to a significant degree, these linkages may still not be fully accounted for in all forecasts. The global economy evolves over time as economies become more linked to each other through trade in goods, services, and financial instruments. Forecasters aiming to incorporate interdependencies among economies are thus shooting at a moving target. IMF desk economists are no exception in this respect, and they need to keep adapting their models and judgment to incorporate new realities. The WEO forecasting process contains elements that are designed to increase individual desk economists’ awareness of relevant international developments. In view of the potential inefficiencies mentioned by Timmermann (2006) and confirmed in this evaluation, these elements may need to be strengthened.
C. Are Forecasts Accurate?
66. The IMF’s WEO forecasts are often viewed as a benchmark to use in comparisons with other national and international forecasters. A survey conducted for IEO (2006) found that almost 88 percent of country authorities either agreed or strongly agreed that they “consider the WEO’s projections to be the benchmark for assessing economic prospects.” More recently, the survey conducted for the present evaluation found that about two-thirds of country authorities who responded either agreed or strongly agreed with the statement that
Figure 8. Interdependence in the data and in forecasts
Source: Author's calculations using IMF WEO and Matheson (2013).
0
20
40
60
80
100
0 20 40 60 80 100
Impo
rtan
ce o
f a G
loba
l Fac
tor f
or G
DP
Gro
wth
Importance of a Global Factor for WEO Forecasts

25
they “use WEO forecasts to check the accuracy of [their] own forecasts” (Genberg and Martinez, 2014a).37
67. Differences in release dates between forecasters can influence the determination of relative forecast performance, especially when a later forecast can incorporate an earlier forecast’s information.38 As shown in Table 2, relative to its main forecast comparators the WEO is released relatively early in each forecasting cycle. This means that the IMF’s Fall forecast may be published up to three months before the OECD’s forecast—which would give the OECD and other forecasters time to incorporate the IMF’s forecast as well any new information that may emerge in the interim. While these timing differences could markedly affect relative forecast performance, only a few past studies of IMF forecasts make more than a passing note of differences in production dates.
68. There is less of a publication timing issue when comparing WEO forecasts with private forecasts such as those issued by Consensus Economics. This is largely because private forecasters produce their forecasts monthly and thus the publication date can be selected so as to minimize the timing differences.
69. For this evaluation Genberg and Martinez (2014b) compared the accuracy of WEO and Consensus Economics forecasts of GDP growth using the most recent data available. Looking across all countries in the comparisons for each category of forecasts, the results show that there is little to differentiate between WEO and Consensus in the Spring forecasts, whether these are for the current year or the year ahead. For the Fall forecasts the results are very sensitive to the vintage chosen for Consensus forecasts. If the September forecast is used the WEO has a slight edge, whereas if the Consensus October forecast is used, the opposite is true.
70. Focusing more narrowly on G20 countries, IMF forecasts of GDP growth are very similar to Consensus forecasts (Figure A.2.4 in Annex 2).39 For almost all G20 economies,
37 The survey as well as follow-up interviews with country officials also revealed that IMF forecasts are typically judged to be more accurate than forecasts made by other international organizations. For the domestic economy, country authorities typically view their own forecasts as being more accurate than those of the IMF.
38 A further complication results from potential differences between the date on which the final forecast was established and the ultimate release/publication date.
39 This raises the question whether IMF forecasts are so close to Consensus forecasts that they do not contain any independent information. Timmermann (2006) investigates this possibility and concludes that it is not the case;
(continued)
Table 2. Average difference in publication dates with WEO, 2000–101
(in number of days) OECD Consensus2 EC World Bank EIU2
Spring/Summer 62 -1 2 57 11 Fall / Winter 87 -2 42 75 24
Source: Authors’ calculations. 1 A positive number indicates that the WEO forecasts are published first. 2 Publication dates for these institutions were chosen to minimize difference from WEO publications given that their forecasts are released on a more frequent basis.

26
forecast errors for any given year have the same overall pattern and size, and display the same turning points in both cases. This goes against the notion of an organizational bias in IMF forecasts.40
D. User Perspectives on the Quality of IMF Forecasts
71. When asked about IMF forecasts in general, a majority of country authorities responded that they believed they were unbiased. Only a small minority expressed the opposite view. To a more specific question about the accuracy of WEO growth forecasts for their own country, three-quarters of country officials responded that they believed these forecasts were “about right.” Six percent believed they were “consistently too high” and 18 percent said they were “consistently too low.” Respondents working in global financial institutions had less sanguine views about the accuracy of WEO forecasts: 50 percent believed that they were “about right,” 27 percent “consistently too high,” and 23 percent “consistently too low.”
72. These survey results are interesting because they suggest that country authorities by and large do not question the quality of IMF forecasts. Of course one can argue that when 24 percent of officials feel that WEO growth forecasts are consistently either too high or too low, something is amiss. It is also noteworthy that, regarding GDP growth, three-quarters of the officials who feel that IMF forecasts are biased think that growth forecasts are too pessimistic rather than too optimistic.
E. How Does the IMF Learn from Past Forecasting Performance and Experience?
73. Learning from experience takes place at many levels, individually and institutionally, formally and informally, through introspection and in response to external review, routinely, and in response to significant failures. This section assesses initiatives taken at the institutional level and at the level of individual desk economists to learn from past forecasting performance.
Commissioned studies: objectives and impact41
74. Since the 1980s the IMF Research Department has commissioned four studies by outside experts to evaluate the quality of WEO forecasts: Artis (1988, 1996),
both forecasts carry useful information about future growth of GDP and inflation. Luna (2014b) presents results with a similar interpretation for program cases. Hence, the correspondence between IMF and Consensus forecasts is likely to be the result of both using similar (but not exactly the same) information and forecasting methods.
40 It does not hide the occurrence of occasionally large forecast errors for most individual G20 economies, many of which are associated with recessions or crises and the subsequent recovery.
41 This section draws extensively on Freedman (2014).
27
Timmermann (2006), and Faust (2013).42 Barrionuevo (1993) has been treated, in all the subsequent studies, as part of this series of assessments even though this study was produced inside the IMF. The first study (Artis, 1988) responded to concerns by Executive Directors about bias in IMF forecasts. Each of the subsequent studies was intended as an update of the preceding ones using the most recent data available and, particularly for the last two studies, to provide recommendations for improving the forecasts.
75. The Fund did not put in place a formal process defining what is expected from each successive study; how the results of the study are to be communicated to staff, Management, and the Board; how staff and Management should respond to the recommendations in the study; or how the follow-up should be implemented and documented.
76. The lack of such a process makes it difficult to judge whether practices at the IMF have changed as a result of these external reviews. Freedman (2014) concludes that though some specific changes could be attributed directly to one of them (Timmermann, 2006), it was difficult to pinpoint more generally the effects of the various evaluations on the behavior of forecasters and the way they go about their business.
77. In response to questions by Freedman, senior IMF officials who had been involved in the WEO process at the time of the various commissioned studies suggested that the studies had helped build an internal consensus about the need to update the Fund’s forecasts more often. They quoted the introduction of mini- or mid-term WEOs and the increased use of alternative scenarios as examples of how the WEO process had become more responsive to changes in global economic conditions.
78. Freedman (2014) identifies several issues related to commissioned studies that have not received sufficient attention. He points to the absence of a structured process to facilitate learning from these commissioned studies and monitor the implementation of their recommendation at the institutional level or at the level of individual desk economists. He also asks whether the forecasting process achieves the right balance between top-down and bottom-up elements.
Experience of desk economists
79. Country forecasts by the IMF are ultimately the product of country desk economists. From interviews and a survey of IMF country desk staff, it is clear that one common aspect of how forecasts are produced is the reliance on the judgment of the desk economist.
80. Judgment relevant for forecasting can be sharpened by on-the-job learning; by assimilating the knowledge of a predecessor; by investigating and learning from past forecast 42 The Faust (2013) study has not yet been published. All references to that study in this evaluation refer to a draft dated February 5, 2013.

28
errors; and by attending specialized formal training. The evaluation team gathered information on each of these elements to assess the nature and effectiveness of forecast-related learning by country desk economists.
The relationship between experience of desk economists and forecast accuracy
81. The experience of desk economists has a significant effect on forecast accuracy. Numerous studies of security analysts in the private sector have found such a relationship, and this evaluation finds similar results for IMF staff: both country-specific and general experience is associated with improved forecasts (see Genberg and Martinez (2014b) for details and Box 4 for a summary). Survey results and interviews with desk economists corroborated the statistical findings. As one desk economist said: “[a]t the beginning [it is] very useful to rely on what is there, while you learn [about] the economy, only [over time] can you think about improving [the forecasts].”
Box 4. The relationship between staff experience and forecast accuracy1
A unique internal IMF dataset was used to compare WEO short-term GDP forecast errors for a large set of countries over the period 2007–11 against the experience levels of the desk economists who produced those forecasts. The analysis distinguished among different types and levels of experience (previous country desk assignments, tenure at the IMF, and the attendance of IMF training courses related to forecasting), different groups of countries, and different forecast horizons.
The regression results indicate that greater staff experience is associated with lower absolute forecast errors. They suggest that both country-specific and general experience help improve the forecasts.
However, the results are not uniform across all types of countries. While country-specific experience is associated with an improvement in forecast performance for low-income countries, it appears to have little relation with forecast performance in advanced and emerging economies. A possible explanation is that the use of judgment is much more prevalent in IMF forecasts of low-income countries, which tend to have a limited amount of data available and few (if any) other external forecasters.
The results also suggest that increases in a desk economist’s general work experience and training are related to improvements in forecast accuracy. Mission-chief tenure does not appear to have a significant effect on forecasting performance. __________ 1 See Genberg and Martinez (2014b), Section III.B.
Transfer of knowledge from incumbent to successor
82. Given how dependent desk economists are on the methods used by their predecessor when they first join a country desk (see Chapter III, Section E), it is important that the transition between desk economists function smoothly.
83. This is not always the case. In interviews, most staff indicated that transitions between country desks were ad hoc and varied substantially from person to person (Figure 9, top panel). While some thought the process worked satisfactorily, and several thought that

29
the standardization of spreadsheets through DMX (Data Management for Excel)43 had led to improvements, many expressed frustration with how much variation there was. Several desk economists expressed the view that the only thing facilitating transitions between country desks was “good will” on the part of the incumbent desk economist.
Figure 9. Preserving historical memoryWhat mechanisms exist for transmitting accumulated knowledge of the country between the
old and the new desk economist?
Does the way in which data and models are passed from the incumbent to a new desk economist help or hinder the process of generating forecasts?
Sources: Author’s calculations based on structured interviews with 50 IMF staff members.
84. Around 40 percent of the staff interviewed thought that the ad hoc nature of the transfer of information from outgoing to new staff on country desks hindered the forecasting process (Figure 9, Panel 2).44 Some argued that the lack of a standard transition mechanism helped perpetuate the status quo and led to inertia in making changes. Others said that “a tremendous 43 DMX is an extension of Excel that provides tools and services to help with macroeconomic data management where data are stored in the form of time series, formulas, and tables.
44 Figure 9 may in fact underrepresent the concerns expressed by staff. Several staff said that the way information was transferred between desks was helpful to the production of forecasts only when the process functioned well—which is not always guaranteed.
0%10%20%30%40%50%60%70%80%90%
100%
Total AFR APD EUR MCD WHD
None Changes from Person to Person Standard Practice
0%10%20%30%40%50%60%70%80%90%
100%
Total AFR APD EUR MCD WHD
Hinders Neither Helps
30
amount of information gets lost” because there is no standard way to convey this information. A common theme, however, was that the efficiency of the process of passing information is highly dependent on personalities, and that some more formal system would be desirable.45
Learning from past performance
85. Learning about how an economy functions and evolves can also be achieved through a careful examination of past forecast performance, which can be informative about the appropriateness of a chosen forecast method.46 Because a large majority of desk economists indicated that forecast accuracy is an important consideration in their choice of a forecast method, it might be expected that assessments of past performance would be conducted regularly. But only 50 percent of the desk economists responding to the survey said that such an analysis had been conducted during their tenure on the desk. About a quarter indicated that they analyzed forecast errors once a year or after each forecast round, 15 percent had analyzed forecast errors at least once, and 10 percent responded that they did not know whether a forecast performance assessment had been carried out.
Learning from formal training47
86. A final aspect of learning relates to participation in formal training courses on forecast methodology. The IMF appears to be the only international organization to provide training on forecasting to its staff. The Fund’s Institute for Capacity Development (ICD) provides in-house courses on topics that range from the basic needs of IMF staff to specialized topics presented by renowned external experts.
87. Has the formal training affected forecast performance? The evaluation survey asked desk economists about their own perception of the usefulness of forecast-related courses. Of those who had attended such courses, about 20 percent felt that the training had not influenced their ability to produce better forecasts. An equal percentage responded that it had led to a great improvement, while the remainder perceived the courses as having led to some improvement.
88. In follow-up interviews it emerged that staff saw the value of attending specialized courses on forecasting as limited because (i) the courses are “too academic” and not
45 This has been a recurrent issue in IEO evaluations. See IEO (2009, 2011, and 2013). In 2013 the SPR issued an internal checklist/guidance note for country assignment handover within the department, to ameliorate the handover process (www-intranet.imf.org/departments/SPR/OGR/Pages/default.aspx). It is too early to tell whether this will have the hoped-for effects, and whether it will be implemented also in area departments.
46 Faust (2013) stresses the particular importance of examining and learning from forecast errors in periods of significant structural change possibly brought about by events such as the recession of 2007–09.
47 This section is based on Luna (2014a).

31
immediately relevant for the desk work; and (ii) desk economists are too busy with operational work to attend such courses (in particular the longer ones), especially because the institution does not give the right incentives to participate in such events.
89. A number of interviewees suggested that specific tools should be developed to tackle the forecasting needs of desks exposed to different situations dictated by data quality and availability. Training events should then be organized to teach the use of such tools.
F. Assessment
90. Are IMF forecasts accurate and efficient? Is the IMF learning from past forecast performance? The evaluation finds that:
Though optimistic biases in forecasts occur in all country groupings—and tend to be larger in low-income countries and in certain program countries—these biases are highly sample-sensitive and do not seem to be systemic or associated with the way the institution conducts its forecasts. In particular, an entrenched inability to predict recessions, which is not particular to the IMF but also plagues competitor forecasters, is critical in explaining the source of measured optimistic biases.
IMF forecasts take account of interdependencies among economies, but not fully. Forecasts of GDP growth in China, Germany, and the U.S., for example, have explanatory power for forecast errors.
The accuracy of IMF short-term forecasts compares well with that of other institutions providing multi-country forecasts. As for perceptions, the majority of country officials and private sector analysts surveyed for this evaluation seem to trust the integrity of forecasts and generally do not feel that IMF forecasts are biased.
Learning is the area where the evaluation found more room for improvement. First, while the experience with regular commissioned studies has been positive, the process for disseminating and implementing their recommendations is not fully developed. Second, IMF economists do not frequently and systematically check the past forecast performance for their countries, though this could be a valuable source of learning. Third, experience matters for better forecasts, especially when these are heavily based on judgment, but the relevant experience is not always transmitted effectively between successive country desk economists. Finally, staff comments in the survey and interviews suggest that in-house training is not sufficiently practical to be directly applicable in the economists’ daily work.

32
V. MEDIUM-TERM FORECASTS48
You've got to be very careful if you don't know where you're going, because you might not get there.
Attributed to Yogi Berra, American baseball player and amateur philosopher
91. The importance of medium-term forecasts for critical IMF products, and their significant methodological differences relative to short-term forecasts, motivate a separate assessment of medium-term forecasts—i.e., those for three, four, and five years ahead. Like the previous chapter, the analysis concentrates on GDP growth forecasts reported in the WEO. Forecasts of medium-term growth rates are important to several policy-relevant items in the IMF’s surveillance and lending activities. Increasingly, many IMF products—including not only the WEO, GFSR, and Fiscal Monitor, but also spillover reports, pilot external sector reports, and early-warning and vulnerability exercises—deal with medium-term issues. These products contain analysis, risk assessments, and scenarios that extend to longer horizons and rely on medium-term IMF forecasts as inputs.49 The quality of medium-term forecasts significantly affects the conclusions drawn in these products, including assessments of the sustainability of fiscal policy frameworks, estimates of equilibrium real exchange rates, measures of sustainable (and desirable) current account positions, and risks to financial and macroeconomic stability, all of which influence the IMF’s policy advice.
92. This chapter first documents the views on medium-term forecasts gathered from a survey of country authorities, the private sector, and IMF staff, and the importance of these forecasts for key products and activities of the Fund. Section C discusses methodological difficulties of estimating a country’s potential output, which help explain why, despite their importance, medium-term growth forecasts are inherently uncertain. Section D describes the medium-term forecasting methods and process in use in the IMF, and section E reviews the quality of the forecasts, applying the methodology used in Timmermann (2006). Like that in Chapter IV, the analysis is based on point or central forecasts. Section F provides an overall assessment.
A. User and Staff Perspectives on Medium-Term Forecasts
93. The survey conducted by the evaluation team found that more than half the respondents from the private sector think that for policy discussions IMF medium-term forecasts are more important than short-term forecasts. The corresponding percentage among country authorities is about one third. Very few respondents in either group said that they ignored medium-term forecasts. 48 This chapter draws on a detailed treatment in de Resende (2014).
49 See Annex 3 for more details.

33
94. In interviews, country officials, especially those from less developed economies, stressed the importance of paying attention to medium-term forecasts. Some noted explicitly the potentially damaging effect that misleading medium-term forecasts may have on the IMF’s analysis for both surveillance and lending purposes.50
95. Yet IMF country desk economists who responded to the survey feel that medium-term forecasts entail too much uncertainty to constitute a reliable guide for policy discussions. In addition, during post-survey interviews with IMF staff a large number of interviewees gave the impression that medium-term forecasts—although integrated with short-term forecasts in the Fund’s macro framework—are less carefully made and certainly use fewer resources than short-term forecasts.
96. These findings should not be taken to imply that the IMF as an institution disregards longer-term analysis more broadly defined. As noted, medium-term scenarios and risk analyses are increasingly important in the IMF’s flagship and bilateral surveillance reports. But if the point forecasts for medium-term GDP growth that ultimately drive the risk scenarios are not given appropriate attention, the risk assessments themselves may be compromised.
B. The Importance of Medium-Term Forecasts in IMF Surveillance Products
97. This section describes the importance of having unbiased central forecasts for three important IMF products: debt sustainability analysis, pilot external balance assessments, and risk assessments based on fan charts. While these products deal with issues and involve techniques that are different from those of medium-term forecasting, they generally use medium-term forecasts as inputs or as base-lines. For this reason the quality of the medium-term forecasts will have an impact on the quality of these other products.
Debt sustainability analysis
98. Projecting the evolution of a country’s government debt, relative to its underlying ability to generate income—often summarized in the debt-to-GDP ratio—is a key element in debt sustainability analysis, an activity in which medium-term forecasts of GDP growth are obviously important. Erroneous forecasts may produce a distorted view of the future debt level and lead to misguided policy advice today. Variations as small as one percentage point, which are not uncommon, in forecasts of medium-term real growth and inflation can make a difference between a sustainable and an explosive path for the debt-to-GDP ratio. Both de
50 For example, a senior official from a major emerging-market economy argued that medium-term forecasts are not sufficiently based on countries’ structural and demographic characteristics, and that exchange-rate assessments and current account projections, including those carried out in the context of external balance assessments, are therefore likely to be inaccurate.

34
Resende (2014) and IMF staff research (see IMF, 2004) suggest that poorly made projections for longer horizons may greatly undermine assessments of debt sustainability.51
External balance assessment
99. The pilot external balance assessment (EBA) is another important IMF product that uses medium-term, specifically five-year-ahead, forecasts of GDP growth. The analysis in the EBA of appropriate levels of real exchange rates and current account balances is partly based on an empirical estimate of the relationship linking five-year-ahead growth differentials (between the country being examined and a GDP-weighted “world counterpart”) and the observed real exchange rate and current account balance. This relationship is used, together with projections about future growth differentials and normative considerations about current policies, to assess whether the current level of the real exchange rate and the current account balance are appropriate.52
Risk assessments based on fan charts
100. Assessments of risks to the global economy, to specific regions, and to individual economies are highly valued aspects of IMF analysis. Fan charts have become a popular device in this context, showing the range of possible future values a variable may take given the uncertainty associated with the point forecast.53 Such fan charts have become regular features of the WEO and certain REOs, and have been used occasionally also in Article IV country reports. Central banks routinely use them to illustrate the uncertainty around their forecasts.
101. A bias in the central forecast can have important consequences for the assessment of risks. This is illustrated in Figure 10 for two G20 countries; Italy, which Timmermann (2006) identifies as a country for which the IMF has regularly produced optimistic forecasts, and China, for which IMF forecasts have tended to be pessimistic on average (Annex 2, Table A.2.1). The importance of using a correct central forecast is clear in both cases. For Italy the 90 percent confidence interval using the unbiased forecasts shows that there is a non-negligible possibility that output would decline during the forecast period (see the lower blue line in Figure 10), whereas the risk analysis carried out with the biased forecast would
51 The Fund’s recently revised framework for debt sustainability analysis in market access countries (IMF, 2013) recognizes explicitly the various sources of uncertainty that can impact debt projections.
52 De Resende (2014) shows how biases in the growth forecast for a country or for its trading partners can change the assessment of the norm for the real effective exchange rate, potentially leading to situations in which the rate can be judged under- or overvalued relative to the norm, when it is actually in equilibrium.
53 The mid-point of a fan chart is usually determined by the central (or point) forecast, and the uncertainty associated with the central forecasts determines the width of the fan. This statement is strictly true only if the distribution of the possible outcomes is symmetric.

35
put a very low probability on such an outcome (see the red lines in Figure 10). Similarly, for China the upper limit of the fan constructed using the biased (red) forecast would barely exceed the mid-point of the fan using the unbiased forecast. In both cases the consequences of using inaccurate central forecasts for risk assessments are significant.
Figure 10. Fan charts around biased and unbiased GDP forecasts
Source: IEO calculations.
Note: The blue lines in the figures illustrate 90 percent confidence intervals around the unbiased forecasts of the level of real GDP five years into the future, and the red lines show the 90 percent confidence intervals around the biased forecasts. Since the true probability distributions, from the model used in the forecasts, are unknown to the evaluation team, the confidence intervals are based on the standard deviation of forecast errors across different WEO vintages (Spring) for the different horizons, assuming a normal distribution. For further details on the construction of the fan charts, see de Resende (2014).
C. Measures of Potential Output and the Output Gap
102. A key difference between short- and longer-term forecasts is the relative reliance they place on cyclical versus structural determinants. The longer the forecasting horizon, the greater the importance attached to structural factors. Longer-term forecasts of GDP growth, in particular, try to identify a trend that is often associated with the long-run aggregate supply curve, usually interpreted as the level of potential output, to which the economy reverts when the effects of temporary shocks that cause cyclical fluctuations dissipate. Since medium-term forecasts are more likely than short-term forecasts to abstract from these cyclical factors, forecasting GDP growth over the medium term requires an idea of the level to which the economy will converge and of the speed of convergence to this level. Because of the importance of the notion of potential output for medium-term forecasts, Box 5 contains a brief description of the methods available to estimate it.
103. During interviews that the evaluation team conducted with staff, it became clear that having an estimate of the level of potential output is a critical step in the process of obtaining medium-term forecasts of GDP growth and other variables. The estimate of potential output is also needed for the calculation of the output gap—the difference between actual and
0.8
1.0
1.2
1.4
0 1 2 3 4 5
GD
P le
vel (
year
-1
= 1
)
Italy
0.80
1.20
1.60
2.00
0 1 2 3 4 5
China
Unbiased Biased Unbiased CI(5%-95%) Biased CI(5%-95%)

36
potential GDP—which is a key indicator of the degree of slack in the economy and is typically used in short-term forecasts of inflation and the measurement of cyclically adjusted fiscal and current account balances, factors that are critical in the IMF’s policy advice to member countries.
Box 5. Methods to estimate potential output1
Methods for estimating potential output fall into three broad classes. At one end of the spectrum are purely statistical univariate approaches that only use the information contained in the GDP series itself to generate estimates of potential output.2 Their simplicity and more limited data requirements allow these approaches to be applied to a wide range of economies, but their lack of economic content introduces difficulties in identifying the trend and cycle components of the GDP series, which are interpreted as potential output and the output gap, respectively.
At the other extreme, structural methods rely on a fairly detailed model representation of the economy and typically use data from several variables in the estimation process. These methods are more theoretically coherent, but are also substantially more data-intensive and difficult to implement.
In between these two polar cases are bivariate and multivariate approaches that represent a compromise between the greater theoretical coherence and data intensity of structural methods and the simplicity and lack of economic content of univariate methods.
All methods have shortcomings and there can be no “one-size-fits-all” approach. The proper method to use depends on data availability and on the structure of the economy being analyzed, which may be changing, and should be complemented by the forecaster’s overall knowledge of the country and judgment. ——————————— 1 For details, including references to research carried out by IMF staff, see de Resende (2014), Section III. 2 An example of this approach is the popular Hodrick-Prescott filter.
104. A problem associated with virtually all of the methods of estimating potential output is that the results are sensitive to updating the sample on which they are based.54 Estimates of past potential growth rates will in general change when new data become available, implying considerable uncertainty in the original estimates. This is illustrated in Figure 11, which plots the growth rate of potential GDP in the U.S. as recorded in different WEO vintages. Relative to the growth rates of potential GDP published in the Spring 2012 WEO (red line), the estimates for almost all years in the sample change substantially across different WEO vintages. For example, the Spring 2012 WEO estimates the growth rate of potential GDP in 1998 to have been 3.5 percent, but the estimates for the same year have been as low as 2.3 percent (Spring 1998) and as high as 4.3 percent (Spring 2010), a difference of 2 percentage points. Such wide variation in estimates of past growth rates of potential GDP growth is also seen in other economies and may be interpreted as a measure of how uncertain
54 This is the case particularly at the end of a sample period when such estimates are the most important for forecasts and policy analysis.

37
these estimates are.55 The inherent difficulties in estimating potential output translate into substantial uncertainty and revisions also in measures of the output gap and may therefore, distort the policy advice in real time that is based on it.
Figure 11. Growth rate of potential GDP in the United States across different WEO vintages (In percent)
Source: de Resende (2014).
D. Estimation Methods and Process
105. The process of generating medium-term forecasts by country desk economists is similar to that for short-term forecasts in that both types of forecasts are integrated into the macro framework used in the day-to-day work of desk economists.
106. However, while for short-term growth forecasts the IMF has a process in place to promote global consistency, it does not appear to have a comparable process to construct a view of the growth potential of major regions and economies based on fundamental structural determinants. In particular, no interdepartmental committee is in charge of maintaining analytical consistency among medium-term forecasts at the country, regional, and global levels.
107. The evaluation survey and post-survey follow-up interviews with IMF staff, as well as analysis of Fund documents, indicate that in making medium-term forecasts of GDP growth IMF economists use (or have used) all classes of methods described in Box 5 for estimating potential output, appropriately complemented by a widespread use of judgment. The heterogeneity of methods partly reflects the heterogeneity of the IMF membership in
55 The narrower difference between minimal and maximal estimates of the U.S. potential growth rate at the end of the sample in Figure 11 should not be taken to imply more precise estimates. It is rather due to the smaller number of WEO vintages used to compute the mean, minimal, and maximal potential growth rates for more recent years.
0
1
2
3
4
5
1990
1991
1992
1993
1994
1995
1996
1997
1998
1999
2000
2001
2002
2003
2004
2005
2006
2007
2008
2009
Max WEO Spring 2012 Min

38
data availability, structural change, development stage, etc., but may also be explained by the lack of top-down guidance of the type provided for short-term forecasts.
108. IMF economists stressed that their choice of method for medium-term forecasting depends on data availability and on the structure of the economy they cover. Systematic assessments of past forecast performance do not appear to influence the choice of methods. More generally, desk economists often indicated that they have little incentive to search for better methods since medium-term forecasts are not viewed as particularly important.
109. Free choice of methods is not a problem if economists are well informed about the methods and the best way to use them in different countries or situations, and if the right incentives to seek information about these methods are in place. Interviews with staff indicated, however, that these conditions are not always met, and that having some guidance on the methods would be desirable.56
E. The Quality of IMF Medium-Term Forecasts
110. Overall, the evaluation finds that IMF medium-term forecasts for GDP growth in the WEO meet the basic forecasting efficiency standards in most countries, with little evidence of a built-in organizational bias.57
111. However, problems exist in the medium-term forecasts for a notable number of member countries, many of them the same as those Timmerman (2006) identified in the context of current- and next-year forecasts. WEO medium-term forecasts have a tendency to overpredict GDP growth. In a universe of 180 countries over the sample period 1990–2011, between two-thirds and three-fourths show predicted growth rates on average higher than actual growth rates. In 20 percent to 30 percent of the countries this bias is statistically significant. Measured on an annual basis, the average bias ranges between 0.14 percentage points and 0.76 percentage points, depending on the forecast horizon, the measure used (median or mean), and the method (descriptive or regression-based statistics from either country or panel regressions). As in short-term forecasts, the existence of bias in medium-term forecasts of GDP growth seems to be largely a reflection of the inability to predict crises and large recessions.
56 Other organizations such as the OECD and the EC have processes in place to coordinate medium-term forecasts and to provide a consistent view on potential output developments. Both these organizations have a smaller, less heterogeneous membership than does the IMF, so a narrower choice of forecasting methods may be appropriate. In the case of the EC, member countries indeed require homogeneity of forecasting methods because of the preeminent role of cyclically adjusted fiscal balances in the institutional quantitative assessments for these countries. A central unit within the EC coordinates the efforts of the teams producing medium-term forecasts for individual economies, with a view to assuring not only accounting, technical, and statistical consistency, but also analytical and economic consistency.
57 See de Resende (2014), which contains an analysis of the quality of WEO medium-term growth forecasts following the methodology in Timmermann (2006).

39
112. The tendency to overpredict medium-term GDP growth is present in economies across all IMF area departments—except for the Middle East and Central Asia Department, where underprediction is the norm—across different levels of development, and regardless of IMF program participation status. Statistically significant biases are more frequent among economies in the African department and in emerging-market and low-income economies. The magnitude of the optimistic biases is however greater in advanced economies, reflecting the fact that large biases are concentrated in a few G7 economies.58 Medium-term program forecasts of GDP growth for countries with a history of IMF-supported programs over the sample period (1990–2011) are more optimistic than for non-program countries by a sizeable and statistically significant margin.59 Program-related optimistic biases tend to be concentrated in the year the program starts and to be corrected within one year.
113. Though the tendency towards overoptimism in IMF medium-term forecasts of GDP growth exists in the statistical sense, the qualifications with respect to the reliability of statistical tests of accuracy and efficiency emphasized in Faust (2013) and already noted in the discussion of short-term forecasts should be kept in mind.
114. In the IMF’s medium-term forecasts serial correlation is less frequent than bias—which limits the scope for using past errors to help improve forecasts. However, for a notable share of countries, the evaluation finds that forecasts of GDP growth in the United States, Germany, or China, as well as of oil prices, can help explain medium-term forecast errors and thus could in principle be used to improve forecasts. This result mirrors the findings for short-term forecasts reported in Chapter IV. This type of inefficiency is more frequent in medium-term than in short-term forecasts—possibly because efforts to account for international spillovers and interrelationships between countries in WEO forecasts, as previously recommended by Timmerman (2006), seem to have been implemented more in short-term than in medium-term forecasting,60 and possibly because less effort is made to coordinate medium- than short-term forecasts.
115. Finally, while IMF medium-term forecasts of GDP growth are clearly more accurate than naïve (no-change) and mechanical (e.g., HP filter) forecasts, they are somewhat less accurate than private sector forecasts as published by Consensus Economics.
58 The average optimistic bias for G7 economies as a group is always substantially larger than that for the full sample.
59 Using a different dataset, Luna (2014b) investigates biases in the context of programs and reaches similar conclusions, which are discussed in the next chapter.
60 Another possibility is that forecasts made subsequent to Timmermann’s study are not well reflected in the sample used to assess medium-term forecasts, because the corresponding actual values are not yet known.

40
F. Assessment
116. To assess the quality of IMF medium-term forecasts, this chapter has relied on two metrics—the appropriateness of the methods and procedures used and the quality of IMF medium-term forecasts of GDP growth in terms of informational efficiency and accuracy.
117. The chapter concludes that:
The methods used in medium-term forecasts of GDP growth for individual economies are broadly appropriate, but sufficient coordination for better analytical consistency at the regional and global levels is lacking.
The overall quality of IMF medium-term forecasts for GDP growth is acceptable, although there is more room for improvement relative to short-term forecasts.
o Forecasts are unbiased for most countries. Optimistic biases are found in a non-negligible share of the membership, including many G20 countries, in all but one IMF area department, in countries at all stages of development, and regardless of IMF program participation status. As with short-term forecasts, however, these biases do not seem systemic and are critically influenced by an entrenched inability to predict recessions, which is not particular to the IMF.
o IMF medium-term forecasts outperform forecasts made using mechanical and naïve methods (suggesting that staff judgment adds quality to forecasts), but they are somewhat less accurate than private sector forecasts.
o Serial correlation is not frequent in IMF medium-term forecasts, but there are substantially more signs of informational inefficiency—related to insufficient consideration of spillovers and interdependencies in the global economy—than in short-term forecasts.
Central or point forecasts are appropriately complemented by a broader set of discussions about medium-term issues—including risk assessments described with fan charts and alternative scenarios to the baseline projections based on the central forecasts. These discussions are increasingly important in IMF flagship documents, notably the WEO, and are also included in other multilateral products such as spillover reports and pilot external sector reports. Country authorities highly value analyses using risk assessments and scenarios as well as the point forecasts on which they are based.

41
VI. FORECASTS IN THE CONTEXT OF IMF-SUPPORTED PROGRAMS61
… IMF lending programs … are predicated on certain assumptions about output, inflation, and other economic variables. Too often, those numbers are a result of a process of negotiation, rather than a more dispassionate economic forecast.
Stiglitz (2011), p. 12
118. This chapter focuses on forecasts in the context of IMF-supported programs. Several considerations motivate this focus. First, more than in other cases, program forecasts have direct implications for policy decisions. Second, since the forecast embodied in a program is the result of a negotiation62 between staff and country authorities, it does not necessarily reflect a purely detached view about the prospects for the economy. Third, these forecasts differ from forecasts associated with regular surveillance exercises since their accuracy is conditional on the successful implementation of the policy measures specified in the program.63 Finally, there is considerable controversy related to the accuracy of such forecasts.
119. Inaccurate forecasts can have negative repercussions for the country in question.64 Biased forecasts may lead to misguided policies and may create unwarranted expectations on the part of other economic agents. As several interviewees pointed out, an overly sanguine projection may translate into a false sense of security preventing timely action or, worse, excessive fiscal expenditures especially in the case of resource-rich countries. As a result, the adjustment program may go off-track and lead to the interruption of support from the IMF and other lenders. Conversely, overly pessimistic forecasts may have negative repercussions if they translate into too strong an adjustment, reducing the fiscal space required for a speedier recovery.
120. With a focus on the evaluation questions set out in Chapter I, this chapter first discusses why the cooperative nature of the program engagement between country authorities
61 This chapter is based on Luna (2014b).
62 It should be stressed that the word “negotiation” is standard IMF language and summarizes the process of discussion and subsequent review leading to the formalization of the country authorities’ adjustment program supported by IMF financing. There is no connotation of quid pro quo in the term employed in this context.
63 For non-program countries it is typically assumed that established policies will be maintained during the forecast period and that only legislated policy changes will be taken into account in the forecast. For program countries, especially in the case of quantitative targets, the country authorities have a strong vested interest in making those forecasts “come true,” and they are in a position and have the means to influence the out-turn.
64 There could also be reputational consequences for the IMF. A segment of the academic literature has sought to find a link between biases in program forecasts and political pressures on the institution, suggesting that lack of evenhandedness may be present in the allocation of IMF resources. Documenting carefully the facts related to the accuracy of program forecasts is a prerequisite for assessing this possibility.

42
and the IMF can affect the nature of the projections included in the agreement. Section B presents new empirical results about the quality of IMF forecasts in program cases. Section C reviews IMF self-assessments of forecasts in a subset of programs, and Section D presents an overall assessment. Except where otherwise noted, the focus is on short-term point forecasts.
A. Forecasts in the Context of Program Negotiations
121. There exists a quite general and persistent perception that IMF program forecasts have an optimistic bias. A review of existing empirical findings shows, however, that the reality is much more nuanced and is highly sensitive to the chosen sample of countries and time period (Luna, 2014b).65
122. Responses from the evaluation survey and, especially, from follow-up interviews conducted with staff and country officials, help explain these seemingly contradictory findings. In general, because a program is the result of a cooperative process, the direction in which projections will deviate from the unconditional forecast will depend on the particular circumstances facing the authorities and IMF staff. Projections are sometimes aimed at influencing program outcomes. An upbeat forecast could signal to other international creditors that the economy has entered a period of sustained growth, inducing them to provide credits supplementary to those of the IMF. In other cases, it has been argued, a pessimistic forecast may have some advantages.66
B. Statistical Biases in Short-Term Forecasts
123. This section investigates whether the accuracy of short-term forecasts made in program contexts depends on the size of the program and whether the forecast contained in the first review of the program is more or less accurate than the initial forecast. It also compares the accuracy of IMF forecasts with those of the private sector. The analysis is carried out for 103 Fund-supported programs for which the IMF made forecasts in the period 2002–11. Data are drawn from the Monitoring of Fund Arrangements (MONA) database.67
65 The nuance is also observed in the case of medium-term WEO forecasts for program countries. See de Resende (2014).
66 See, for example, the IMF’s ex post assessment for Argentina (IMF, 2006a).
67 This database is a valuable source of information about IMF-supported programs. While much of it is available to the public, for programs undertaken since 2002 complete information about forecasts of macroeconomic variables contained in each successive program review can, however, be obtained only upon request to the SPR staff who maintain the database. See Luna (2014b, Annex 2) for additional detail.

43
124. Although the findings vary according to the variable and the nature of the program being considered,68 some generalizations are possible:
(i) Forecasts of CPI inflation tend to be optimistic (i.e., lower than out-turns).
(ii) Some statistically significant optimistic biases exist for short-term GDP growth forecasts but only for exceptional access programs.69 For other types of programs the biases tend to be either pessimistic or statistically not significant.
(iii) Similarly, for exceptional access programs, forecasts for the fiscal balance tend to be pessimistic.70
(iv) Results for large-disbursement programs—defined as those with more than two billion SDRs in disbursement—differ very little from those for exceptional access programs.
125. These findings are consistent with information collected in interviews with IMF staff and staff in Executive Directors’ offices. In particular, the fact that the fiscal deficit is a target under a program, whereas GDP growth is not, could explain the apparent contradiction between an optimistic GDP forecast and a pessimistic forecast for the fiscal balance. First, pessimistic forecasts for the fiscal balance give country authorities some room for maneuver in the revenue and expenditure side so as to meet the budget target even if revenues fall short of projections or unexpected expenditures arise. Second, where a waiver is needed, lower than expected GDP growth offers a very good explanation (outside of the authorities’ responsibility) of why fiscal targets could not be met.
68 Results presented in de Resende (2014) reinforce this conclusion. Specifically, evidence of optimistic biases in medium-term forecasts made in the context of programs, over the 1990–2012 period, depends on: (i) the forecast horizon: strong evidence is only found in three-year-ahead forecasts; (ii) the history of countries regarding their engagement in IMF programs: countries with a history of IMF programs have more optimistic forecasts than countries that have not engaged in IMF programs over the sample period; and (iii) the different stages of a program: large optimistic biases pre-date programs (perhaps reflecting the inability to predict the “crisis” that led to the program), resurface in the year that programs start (perhaps reflecting political economy considerations associated with program inception and/or the inability to predict the typical post-program deceleration in growth), and fade out quickly one year after the start of the program.
69 The IMF can lend amounts above normal limits on a case-by-case basis under its Exceptional Access policy, which entails enhanced scrutiny by the Fund’s Executive Board. Exceptional access arrangements comprise access beyond (i) an annual limit of 200 percent of the country’s quota; and (ii) a cumulative limit of 600 percent of quota, net of scheduled repurchases. For details, see IMF Decision No. 14064-(08/18), available at www.imf.org/external/pubs/ft/sd/index.asp?decision=14064-(08/18). Although exceptional access programs made up less than 15 percent of the total sample considered here, they accounted for more than 85 percent of the total amount disbursed.
70 A “pessimistic” forecast for the fiscal balance is defined as a forecast that implies a larger fiscal deficit (or a smaller surplus) than the eventual out-turn.

44
126. A notable finding is that optimistic biases characterizing the forecasts at the inception of a program are frequently reduced or even reversed at the time of the first review of the program, which normally occurs about three months into the program (Figure 12).71
Figure 12. Forecast errors in IMF programs: initial and first-review forecasts
Current-year forecast One-year-ahead forecast
RGDP = Real GDP growth, PCPI=CPI Inflation, GGB=General Government Balance, BCA=Balance on Current Account
Source: Luna (2014b).
127. Two findings emerge when IMF forecasts are compared with forecasts by the private sector, as published by Consensus Economics (Figure 13).72 First, concerning the initial program forecasts, the results are mixed depending on which country and which forecast horizon is considered; in some cases the private sector forecasts are more accurate and in others the reverse. Second, the first program review tends to correct the initial bias, whereas the forecasts of the private sector tend to be “sticky.”
C. Self-Assessment by the IMF of Program Forecasts
128. In studies and guidance notes issued by the IMF Policy Review Department (more recently the SPR), the IMF has seen value in assessing the quality of projections in the context of IMF-supported programs. At present, the guidance is restricted to longer-term program engagements and exceptional access arrangements. According to the most recent
71 See Luna (2014b) for additional results substantiating this statement.
72 The comparisons were made for forecasts of GDP growth. Note that the number of cases where a direct comparison could be made was relatively limited. The issues related to the dating of the forecasts, discussed in Chapter IV, should also be kept in mind when interpreting comparisons of forecast accuracy.
-1
-0.5
0
0.5
1
1.5
2
RGDP PCPI GGB BCA-1
-0.5
0
0.5
1
1.5
2
2.5
3
3.5
4
RGDP PCPI GGB BCA
Initial First review

45
guidance note, the assessments shall address the accuracy of program projections of key assumptions and objectives, and determine whether risks were correctly identified.73
Figure 13. Consensus and IMF forecast errors for selected program cases
current-year
One-Year-Ahead
Source: Luna (2014b).
129. This section reviews 42 ex post assessments (EPAs) and ex post evaluations of exceptional access arrangements (EPEs) that were completed between 2006 and 2013 in order to assess whether the guidelines have been followed.
130. In the assessments of forecast accuracy made by the 42 ex post evaluations and assessments the number of variables considered varies considerably, from 2 to 40, with an average of about 13. The main variables covered in these assessments are GDP growth, 73 See the guidance notes for Ex Post Assessments of Members with a Longer-Term Program Engagement (IMF, 2006b; 2010a) and the similar ones for Ex Post Evaluations of Exceptional Access Arrangements (IMF, 2005; 2010b).
-13
-8
-3
2
7
2003
Arg
entin
a
2002
Bra
zil
2005
Uru
guay
2009
Ser
bia
2009
Bel
arus
2009
Arm
enia
2009
Cos
ta R
ica
2010
Gre
ece
2010
Ukr
aine
-13
-8
-3
2
7
2003
Arg
entin
a
2002
Bra
zil
2005
Uru
guay
2009
Ser
bia
2009
Bel
arus
2009
Arm
enia
2009
Cos
ta R
ica
2010
Gre
ece
2010
Ukr
aine
-7
-2
3
2003
Arg
entin
a
2002
Bra
zil
2005
Uru
guay
2009
Ser
bia
2009
Bel
arus
2009
Arm
enia
2009
Cos
ta R
ica
2010
Gre
ece
2010
Ukr
aine
-7
-2
320
03 A
rgen
tina
2002
Bra
zil
2005
Uru
guay
2009
Ser
bia
2009
Bel
arus
2009
Arm
enia
2009
Cos
ta R
ica
2010
Gre
ece
2010
Ukr
aine
Consensus at Inception IMF, Inception Consensus at First Review IMF, First Review

46
inflation, fiscal balance, external current account balance, public debt, and external debt. The accuracy of GDP growth projections is examined in almost all the 42 documents; inflation and fiscal balance in about 80 percent, and external debt in about 50 percent. Statistical tests are employed in only one case, however. In other cases the methods are considerably less rigorous and informative, frequently being reduced to the presentation of a list of unexpected shocks that justify the deviation from the original projection. Since the studies do not attempt to identify any possible role of systematic errors on the part of the forecaster, they have little to offer as learning tools.
131. According to the EPE and EPA guidelines, the final document must include an annex containing the authorities’ comments on the analysis contained in the EPE or EPA. Out of the 42 documents, 32 include such an annex. Only 7 of these annexes touch upon program forecasts and 6 out of the 7 are quite critical of the interpretation contained in the document. In four cases, the authorities complain that the projections for GDP growth and/or fiscal revenues were overly optimistic (which they ascribe to a poor understanding of the economy) and, worse, that excessively strict fiscal targets slowed down the recovery by depriving the government of needed fiscal space. Significantly, the other two cases complain of the opposite: that forecasts were overly pessimistic and that recovery was much faster than projected.
132. Overall, the evaluation judges the analysis of forecasts contained in EPEs and EPAs to be somewhat pro forma. More rigorous analysis would help the institution learn from past experience.
D. Assessment
133. This chapter finds that:
The authorities in program countries who responded to the IEO survey revealed a positive perception of the transparency, evenhandedness, and accuracy of IMF forecasts (both WEO and Article IV).
Statistically significant optimistic biases exist for short-term GDP growth forecasts but only for exceptional access programs. For other types of programs the biases tend to be either pessimistic or statistically not significant.
The accuracy of IMF forecasts at program inception is similar to that of forecasts in the private sector. At the first review of programs, the IMF is more ready than the private sector to correct for initial errors.
The EPE and EPA documents are potentially a valuable source for institutional learning. They are, however, not well exploited; their analysis of forecast errors is often perfunctory.
Transparency is reduced by certain limitations on access to the Monitoring of Fund Arrangements database.

47
VII. RECOMMENDATIONS
134. Detailed answers to the evaluation questions have already been given at the end of each of the preceding four chapters. Here we assemble the principal findings that call for some corrective action and the corresponding recommendations and relate them to the broader issues of learning, best practice, and communication/transparency.
A. Learning
135. Learning is the area where the evaluation found the most room for improvement. First, while the impact of commissioned studies has been positive, it can be enhanced with the introduction of a more structured process for implementing and disseminating their recommendations. Second, although past forecast performance can be a valuable source of learning about structural changes in the economy, IMF economists do not exploit this opportunity as frequently and systematically as they should. Third, experience matters for better forecasts, especially when these are heavily based on judgment, but is not always shared effectively between successive desk economists. Finally, in-house training related to forecasting would be more valuable if it were more directly related to the economists’ daily work.
Recommendation 1: The IMF should maintain its practice of commissioning external evaluations of IMF forecasts by recognized experts in order to help ensure that forecasts are of high quality and that the process follows best practices.
In commissioning studies the following elements should be considered:
(i) Commissioned studies should be undertaken on a regular schedule.
(ii) Recommendations in the studies should be clearly spelled out.
(iii) The IMF should respond formally to the recommendations. These responses should be made public.
(iv) The findings of the studies should be presented formally to the Executive Board.
(v) An assessment of whether accepted recommendations have been implemented should be included in the subsequent commissioned study.
(vi) Future studies should include an assessment of the forecasting process itself.

48
B. Best Practice
136. The appropriate choice of forecast method will depend at least partly on data availability and the structural characteristics of the economy in question, but sufficient guidance for desk economists on the choice of methods is lacking.
137. While for short-term WEO-round forecasts the IMF has a well-functioning process to promote global consistency, such guidance for medium-term forecasts is less developed.
Recommendation 3: The IMF should extend guidance to desk economists about how best to incorporate advances in forecasting methodologies for both short- and medium term forecasts.
In doing so:
(i) Attention should focus on how forecasting methods should be adapted to economies with different structural features and data availability.
(ii) As a complement to what it has done for short-term forecasts, the IMF should consider developing a process to ensure the consistency of the medium-term growth projections of major regions and economies based on fundamental structural drivers identified in the literature on the determinants of economic growth. This view should be disseminated to desk economists as a guide to their own country-specific analysis.
(iii) The IMF should monitor the consistency of medium-term forecasts across the institution as it does for the short-term outlook.
Recommendation 2: The IMF should enhance processes and incentives for learning from past forecast performance.
In doing so, the following elements should be kept in mind:
(i) The IMF should consider approaches to develop a more systematic review of forecast errors in the forecasting process. Guidance to staff should make clear that forecasting is an important activity to be taken seriously by mission chiefs as well as desk economists.
(ii) Processes should be implemented to ensure that crucial country information is preserved when staff members move to new country assignments.
(iii) The IMF Institute for Capacity Development should review its course offerings in the area of forecasting to ensure that they include courses relevant for the day-to-day needs of country desk economists.

49
C. Communication/Transparency
138. The IMF-wide forecasting process and the methods used by country desk economists to produce forecasts have been criticized by some country officials as lacking transparency, and this has led to questions about the accuracy and analytical basis of IMF forecasts. For lack of comprehensive documentation of the forecasting process, the evaluation team had to spend considerable effort combining information from various sources to determine the exact nature of the process both at the level of the country desk economist and at the level of the coordination of forecasts within departments and at the IMF as a whole.
139. The databases that contain WEO forecasts are not as user-friendly as they could be, and it is difficult for individuals outside the IMF to access vintages of forecasts other than the most recent. Likewise, certain elements of the MONA data base containing information about IMF-supported programs are difficult to access.
Recommendation 5: Data related to forecasts and outturns that already exist internally should be made available to the public.
In particular:
(i) The part of the WEO data base that is open to the public should include current and all past forecasts as well as the corresponding realized outcomes.
(ii) The MONA database available externally should include all past forecasts linked to each program review.
Recommendation 4: The IMF should prepare a general description of the WEO forecasting process intended for authorities in member countries and other users of these forecasts. The description should be posted on the publicly accessible part of the IMF website, and it should be reviewed and revised as needed.
In preparing the description the IMF should consider:
(i) Providing a broad understanding of how the top-down and bottom-up components of the forecasts are gathered and combined, and how coordination is achieved within and across area departments.
(ii) Offering information about the assumptions and types of methods used by the IMF to produce country forecasts; while the description should remain general and not country specific, it should provide enough information for readers to understand the IMF’s approach to forecasting.

50
REFERENCES
Artis, M. J., 1988, "How Accurate Is the World Economic Outlook? A Post Mortem on Short-Term Forecasting at the International Monetary Fund," Staff Studies for the World Economic Outlook, World Economic and Financial Surveys, pp. 1-49 (Washington: International Monetary Fund).
—————, 1996, How Accurate are the IMF"s Short-Term Forecasts? Another Examination of the World Economic Outlook. IMF Working Paper No. WP/96/89 (Washington: International Monetary Fund).
Barrionuevo, J. M., 1993, "How Accurate Are the World Economic Outlook Projections?" Staff Studies for the World Economic Outlook , World Economic and Financial Surveys, pp. 28-46 (Washington: International Monetary Fund).
Blagrave, P., and others, 2013, Adding China to the Global Projection Model, IMF Working Paper No. WP/13/256 (Washington: International Monetary Fund).
Boughton, J. M., 2001, "Silent Revolution: The International Monetary Fund 1979-1989 (Washington: International Monetary Fund).
Clements, M.P., and D.F. Hendry, 2002, "An Overview of Economic Forecasting," in A Companion to Economic Forecasting, ed. by M.P. Clements and D.F. Hendry (Oxford: Blackwells).
Chidambaram, P., 2013, "Intervention of Mr. P.Chidambaram, Union Finance Minister, Government of India at the IMFC Plenary." Available at www.indianembassy.org/press_detail.php?nid=1978.
De Resende, C., 2014, "An Assessment of IMF Medium-Term Forecasts of GDP Growth," IEO Background Paper No. BP/14/01 (Washington: Independent Evaluation Office of the IMF).
Faust, J., 2013, "A Report of the Predictive Accuracy of the IMF's WEO Forecast," Version as of February 5.
Freedman, C., 2014, "An Evaluation of Commissioned Studies Assessing the Accuracy of IMF Forecasts," IEO Background Paper No. BP/14/02 (Washington: Independent Evaluation Office of the IMF).
Genberg, H., and A. Martinez, 2014a, "User Perspectives on IMF Forecasts: Survey Methodology and Results," IEO Background Document No. BD/14/01 (Washington: Independent Evaluation Office of the IMF).

51
—————, 2014b, "On the Accuracy and Efficiency of IMF Forecasts: A Survey and Some Extensions," IEO Background Paper No. BP/14/04 (Washington: Independent Evaluation Office of the IMF).
Genberg, H., A. Martinez, and M. Salemi, 2014, "The IMF/WEO Forecast Process," IEO Background Paper No. BP/14/03 (Washington: Independent Evaluation Office of the IMF).
Independent Evaluation Office of the International Monetary Fund, 2006, An Evaluation of the IMF's Multilateral Surveillance--Background Documents (Washington: International Monetary Fund).
—————, 2009, IMF Interactions with Member Countries (Washington: International Monetary Fund).
—————, 2011, Research at the IMF: Relevance and Utilization (Washington: International Monetary Fund).
—————, 2011, IMF Performance in the Run-Up to the Financial Crisis (Washington: International Monetary Fund).
—————, 2013, The Role of the IMF as Trusted Advisor (Washington: International Monetary Fund).
International Monetary Fund, "World Economic Outlook Reports."Available at www.imf.org/external/ns/cs.aspx?id=29.
—————, 2004, "Policy Formulation, Analytical Frameworks, and Program Design," SM/04/405 (Washington: International Monetary Fund).
—————, 2005, "Ex Post Evaluation of Exceptional Access Arrangements-Guidance Note" SM/05/303 (Washington: International Monetary Fund).
—————, 2006a, "Argentina-Ex Post Assessment of Longer-term Engagement and Ex Post Evaluation of Exceptinal Access" SM/06/247 (Washington: International Monetary Fund).
—————, 2006b, "Ex Post Assessments of Members with a Longer-Term Program Engagement-Revised Operational Guidance Note" SM/06/395 (Washington: International Monetary Fund).
—————, 2010a, "Ex Post Assessments of Members with a Longer-Term Program Engagement-Revised Guidance Note" SM/10/45 (Washington: International Monetary Fund).

52
—————, 2010b, "Ex Post Evaluation of Exceptional Access Arrangements-Revised Guidance Note" SM/10/44 (Washington: International Monetary Fund).
—————, 2011, "Access Policy and Limits in the Credit Tranches and Under the Extended Fund Facility and on Overall Access to the Fund's General Resources, and Exceptional Access Policy-Review and Modification," Selected decisions and Selected Documents of the IMF, Thirty-Sixth Issue. Available at www.imf.org/external/pubs/ft/sd/index.asp?decision=14064-(08/18).
—————, 2013, "Staff Guidance Note for Public Debt Sustainability Analysis in Market-Access Countries," SM/13/86 (Washington: International Monetary Fund).
Juhn, G., and P. Loungani, 2002), "Further Cross-Country Evidence on the Accuracy of the Private Sector's Output Forecasts," IMF Staff Papers, Vol. 49, pp. 49-64.
Luna, F., 2014a, " IMF Training on Forecasting and Forecasting Method, " IEO Background Document No. BD/14/02 (Washington: Independent Evaluation Office of the IMF).
—————, 2014b, "Forecasts in the Context of Program Countries," IEO Background Paper No. BP/14/05 (Washington: Independent Evaluation Office of the IMF).
Matheson, T., 2013, "The Global Financial Crisis: An Anatomy of Global Growth," IMF Working Paper No. 13/76 (Washington: International Monetary Fund).
Silver, N., 2012, "The Signal and the Noise: Why So Many Predictions Fail- But Some Don't" (New York: Penguin Press).
Stiglitz, J., 2011, “TSR External Commentary-A Short Note on Surveillance and How Reforms in Surveillance Can Help the IMF to Promote Global Financial Stability,” Available at www.imf.org/external/pp/longres.aspx?id=4600.
Timmermann, A., 2006, "An Evaluation of the World Economic Outlook Forecasts," IMF Working Paper No. 06/59 (Washington: International Monetary Fund).

53
ANNEX 1. FORECAST ERRORS OF GDP GROWTH
Source: IEO calculations using Spring WEO current-year forecasts.
-15
-10
-5
0
5
10
15
1990
1991
1992
1993
1994
1995
1996
1997
1998
1999
2000
2001
2002
2003
2004
2005
2006
2007
2008
2009
2010
2011
2012
Advanced Economies Forecast Errors Median (ADV) Mean (ADV)
-15
-10
-5
0
5
10
15
1990
1991
1992
1993
1994
1995
1996
1997
1998
1999
2000
2001
2002
2003
2004
2005
2006
2007
2008
2009
2010
2011
2012
Emerging Market Economies
Forecast Errors Median (EME) Mean (EME)
-15
-10
-5
0
5
10
15
1990
1991
1992
1993
1994
1995
1996
1997
1998
1999
2000
2001
2002
2003
2004
2005
2006
2007
2008
2009
2010
2011
2012
Low-Income Countries
Forecast Errors Median (LIC) Mean (LIC)

54
ANNEX 2. THE QUALITY OF GROWTH AND INFLATION FORECASTS FOR G20 COUNTRIES
The bulk of the quantitative analysis of the quality of IMF forecasts in the main text focuses on the entire IMF membership, treating all member countries irrespective of size. This annex concentrates on the economies in the G20.
Table A.2.1 and Figure A.2.1 detail the findings on forecast quality for the G20 countries. First, overpredictions of GDP growth, indicating an overall optimistic bias, are the most frequent outcome. Considering all G20 countries and forecast horizons, 75 percent of the numbers reported in Table A.2.1 indicate optimistic biases, and about 45 percent of the biases are statistically significant at the 10 percent level. Figure A.2.1 shows the predominance of overpredictions in GDP growth one-year-ahead forecasts, represented by negative mean forecast errors (red line) in 15 out of the 20 countries.
Second, underestimations of inflation are much less frequent among G20 economies than in the membership as a whole. Inflation tends to be mostly overpredicted, especially for emerging-market economies but also for Germany and the Euro Area (Table A.2.2).
Statistically significant optimistic biases in GDP growth forecasts are found for most G7 economies, notably in Europe and Japan, while underpredictions of GDP growth only occur in a few cases associated with emerging market economies1—Argentina, Korea,2 Saudi Arabia (in all cases only current-year forecasts), India (for five-year-ahead forecasts only), and notably China (Table A.2.1). One-year-ahead forecast errors in France, Germany, Italy, the Euro Area, and Japan are below the zero line most of the time, while for China the opposite is true (Figure A.2.1).
The higher frequency of underpredictions for emerging market economies may explain why, as a group, these economies do not show the average optimistic bias observed for both low-income and developed economies, as discussed in the main text. Among G20 economies, these underpredictions cancel out the statistically significant overpredictions in Brazil, Korea, Mexico, and South Africa. Overpredictions in Indonesia and Russia are highly influenced by outliers and tend not to be statistically significant.
One aspect of economic forecasts in general, and of GDP growth forecasts in particular, is the underlying uncertainty stemming from the volatility of shocks that hit a particular economy. Presumably, economies frequently hit by more volatile shocks should be more difficult to predict. Indeed, for G20 economies, forecast inaccuracy, measured by the root-mean-square forecast errors, increases for economies with more volatile output (Figure A.2.2).
1 Korea is included among emerging market economies since it was included in that category of countries for most of the sample period covered by the analysis. The IMF changed its designation of Korea from an emerging market economy to an advanced economy in 2009.
2 The somewhat anomalous result for the current-year forecast for Korea is mostly due to the underprediction of growth in the recovery from the Asian crisis and the recession of 2007–09.

55
Finally, as in the case of the aggregate results for the entire IMF membership, IMF forecasts of GDP growth are about as accurate as forecasts from Consensus Economics. In almost all G20 economies, not only are the mean and root mean square forecast errors in IMF and Consensus forecasts very similar, but forecasts have the same overall pattern and display the same turning points in both cases (Figure A.2.4). While the striking similarity in forecast errors in IMF and private sector forecasts does not support the notion of an organizational bias in IMF forecasts, it also does not hide the occasional occurrence of large forecast errors for most G20 economies.
Table A2.1. GDP growth forecast errors, Spring WEO 1990–2011
Current-year Year-ahead 2 Year-Ahead 3 Year-Ahead 4 Year-Ahead 5 Year-Ahead
United States 0.07 -0.05 -0.31 -0.21 -0.03 -0.05 (0.511) (0.845) (0.562) (0.7266) (0.9647) (0.9326)
United Kingdom -0.17 -0.82 -0.95 -0.86 -0.78 -0.83 (0.11) (0.007) (0.0276) (0.0903) (0.1276) (0.117)
France -0.13 -0.90 -1.25 -1.29 -1.11 -1.13 (0.0059) (0.00) (0.00) (0.000131) (0.000394) (0.001766)
Germany 0.17 -0.79 -1.19 -1.28 -1.06 -1.08 (0.323) (0.0072) (0.00) (0.0011) (0.0072) (0.0087)
Italy -0.40 -1.26 -1.55 -1.62 -1.57 -1.62 (0.00) (0.00) (0.00) (0.0002) (0.0015) (0.002)
Canada -0.18 -0.85 -0.79 -0.62 -0.49 -0.51 (0.146) (0.0132) (0.0073) (0.1451) (0.2679) (0.2612)
Japan -0.03 -1.20 -2.02 -2.27 -2.17 -2.05 (0.814) (0.0027) (0.0007) (0.001) (0.001) (0.0019)
Euro Area -0.16 -1.02 -1.44 -1.47 -1.34 -1.48 (0.479) (0.0511) (0.0155) (0.021) (0.0698) (0.0971)
Turkey 0.46 -0.42 -0.69 -0.65 -0.72 -0.22 (0.207) (0.32) (0.0632) (0.504) (0.5257) (0.849)
Australia 0.10 -0.33 -0.24 -0.21 -0.16 -0.26 (0.561) (0.111) (0.336) (0.5317) (0.6834) (0.5207)
South Africa -0.60 -0.98 -1.06 -0.85 -0.77 -0.75 (0.101) (0.0074) (0.002) (0.093) (0.0951) (0.0895)
Argentina 1.01 0.33 0.35 0.34 0.23 0.04 (0.0988) (0.784) (0.785) (0.8459) (0.9005) (0.9837)
Brazil 0.17 -0.52 -1.14 -1.10 -1.27 -1.50 (0.433) (0.131) (0.0229) (0.0659) (0.051) (0.0354)
Mexico -0.28 -1.52 -2.28 -2.52 -2.48 -2.60 (0.0877) (0.0005) (0.0000239) (0.0078) (0.0078) (0.0062)
Saudi Arabia 1.15 0.87 0.07 -0.19 -0.18 0.26 (0.0352) (0.165) (0.84) (0.7796) (0.8127) (0.7421)
India 0.26 0.29 0.46 0.55 0.74 0.92 (0.324) (0.472) (0.203) (0.196) (0.1044) (0.0693)
Indonesia 0.10 -0.83 -1.36 -1.78 -2.06 -2.22 (0.688) (0.178) (0.0737) (0.1968) (0.146) (0.1194)
Korea 0.50 -0.56 -1.25 -1.36 -1.45 -1.77 (0.0159) (0.0177) (0.0000323) (0.0243) (0.024) (0.0069)
Russia 0.55 -1.15 -1.60 -1.61 -1.26 -1.11 (0.191) (0.331) (0.181) (0.3224) (0.3739) (0.38)
China 1.16 1.77 1.87 1.77 1.67 1.58 (0.0005) (0.009) (0.0299) (0.0741) (0.0615) (0.0529)
Note: robust standard-error p-values in parentheses; numbers in red (blue) represents statistically significant—at the 10 percent level—overpredictions (underpredictions).
Source: IEO calculations using WEO.

56
Figure A.2.1. Errors in one-year-ahead GDP growth forecasts for G20 economies
(The red line indicates the average error for the entire sample period)
-6
-5
-4
-3
-2
-1
0
1
2
3
4
19
91
19
92
19
93
19
94
19
95
19
96
19
97
19
98
19
99
20
00
20
01
20
02
20
03
20
04
20
05
20
06
20
07
20
08
20
09
20
10
20
11
United States
-6
-5
-4
-3
-2
-1
0
1
2
3
4
19
91
19
92
19
93
19
94
19
95
19
96
19
97
19
98
19
99
20
00
20
01
20
02
20
03
20
04
20
05
20
06
20
07
20
08
20
09
20
10
20
11
United Kingdom
-6
-5
-4
-3
-2
-1
0
1
2
3
4
19
91
19
92
19
93
19
94
19
95
19
96
19
97
19
98
19
99
20
00
20
01
20
02
20
03
20
04
20
05
20
06
20
07
20
08
20
09
20
10
20
11
France
-6
-5
-4
-3
-2
-1
0
1
2
3
4
19
91
19
92
19
93
19
94
19
95
19
96
19
97
19
98
19
99
20
00
20
01
20
02
20
03
20
04
20
05
20
06
20
07
20
08
20
09
20
10
20
11
Germany
-6
-5
-4
-3
-2
-1
0
1
2
3
4
19
91
19
92
19
93
19
94
19
95
19
96
19
97
19
98
19
99
20
00
20
01
20
02
20
03
20
04
20
05
20
06
20
07
20
08
20
09
20
10
20
11
Italy
-6
-5
-4
-3
-2
-1
0
1
2
3
4
19
91
19
92
19
93
19
94
19
95
19
96
19
97
19
98
19
99
20
00
20
01
20
02
20
03
20
04
20
05
20
06
20
07
20
08
20
09
20
10
20
11
Canada
-6
-5
-4
-3
-2
-1
0
1
2
3
4
19
91
19
92
19
93
19
94
19
95
19
96
19
97
19
98
19
99
20
00
20
01
20
02
20
03
20
04
20
05
20
06
20
07
20
08
20
09
20
10
20
11
Japan
-6
-5
-4
-3
-2
-1
0
1
2
3
4
2001 2002 2003 2004 2005 2006 2007 2008 2009 2010 2011
Euro Area
-6
-5
-4
-3
-2
-1
0
1
2
3
4
19
91
19
92
19
93
19
94
19
95
19
96
19
97
19
98
19
99
20
00
20
01
20
02
20
03
20
04
20
05
20
06
20
07
20
08
20
09
20
10
20
11
Australia
-6
-5
-4
-3
-2
-1
0
1
2
3
4
19
91
19
92
19
93
19
94
19
95
19
96
19
97
19
98
19
99
20
00
20
01
20
02
20
03
20
04
20
05
20
06
20
07
20
08
20
09
20
10
20
11
South Africa

57
Figure A.2.1. Errors in one-year-ahead GDP growth forecasts for G20 economies (The red line indicates the average error for the entire sample period) (concluded)
Source: Author’s calculations using Spring WEO forecasts.
-15
-10
-5
0
5
101
99
1
19
92
19
93
19
94
19
95
19
96
19
97
19
98
19
99
20
00
20
01
20
02
20
03
20
04
20
05
20
06
20
07
20
08
20
09
20
10
20
11
Turkey
-15
-10
-5
0
5
10
19
91
19
92
19
93
19
94
19
95
19
96
19
97
19
98
19
99
20
00
20
01
20
02
20
03
20
04
20
05
20
06
20
07
20
08
20
09
20
10
20
11
Argentina
-15
-10
-5
0
5
10
19
91
19
92
19
93
19
94
19
95
19
96
19
97
19
98
19
99
20
00
20
01
20
02
20
03
20
04
20
05
20
06
20
07
20
08
20
09
20
10
20
11
Brazil
-15
-10
-5
0
5
10
19
91
19
92
19
93
19
94
19
95
19
96
19
97
19
98
19
99
20
00
20
01
20
02
20
03
20
04
20
05
20
06
20
07
20
08
20
09
20
10
20
11
Mexico
-15
-10
-5
0
5
10
19
91
19
92
19
93
19
94
19
95
19
96
19
97
19
98
19
99
20
00
20
01
20
02
20
03
20
04
20
05
20
06
20
07
20
08
20
09
20
10
20
11
Saudi Arabia
-15
-10
-5
0
5
10
19
91
19
92
19
93
19
94
19
95
19
96
19
97
19
98
19
99
20
00
20
01
20
02
20
03
20
04
20
05
20
06
20
07
20
08
20
09
20
10
20
11
India
-15
-10
-5
0
5
10
19
91
19
92
19
93
19
94
19
95
19
96
19
97
19
98
19
99
20
00
20
01
20
02
20
03
20
04
20
05
20
06
20
07
20
08
20
09
20
10
20
11
Indonesia
-15
-10
-5
0
5
10
19
91
19
92
19
93
19
94
19
95
19
96
19
97
19
98
19
99
20
00
20
01
20
02
20
03
20
04
20
05
20
06
20
07
20
08
20
09
20
10
20
11
Korea
-15
-10
-5
0
5
10
19
91
19
92
19
93
19
94
19
95
19
96
19
97
19
98
19
99
20
00
20
01
20
02
20
03
20
04
20
05
20
06
20
07
20
08
20
09
20
10
20
11
Russia
-15
-10
-5
0
5
10
19
91
19
92
19
93
19
94
19
95
19
96
19
97
19
98
19
99
20
00
20
01
20
02
20
03
20
04
20
05
20
06
20
07
20
08
20
09
20
10
20
11
China

58
Table A2.2. Inflation Forecast Errors, Spring WEO 1990–2011
Current-year Year-ahead 2 Year-Ahead
United States -0.14 0.04 0.37 (0.227) (0.845) (0.0755)
United Kingdom -0.09 0.05 0.11 (0.421) (0.86) (0.569)
France -0.10 -0.001 0.12 (0.182) (0.994) (0.557)
Germany -0.16 -0.32 -0.25 (0.0021) (0.0044) (0.0951)
Italy -0.13 -0.30 -0.22 (0.191) (0.092) (0.374)
Canada -0.11 0.11 0.28 (0.329) (0.541) (0.239)
Japan -0.01 0.44 1.01 (0.948) (0.00) (0.00)
Euro Area -0.29 -0.46 -0.30 (0.0012) (0.0339) (0.278)
Turkey -3.86 -9.63 -9.28 (0.105) (0.0567) (0.153)
Australia 0.26 0.26 0.23 (0.419) (0.587) (0.614)
South Africa 0.72 -0.91 0.02 (0.275) (0.135) (0.975)
Argentina -103.50 -4.97 0.33 (0.28) (0.392) (0.871)
Brazil -192.50 -278.00 -291.20 (0.192) (0.189) (0.21)
Mexico -1.62 -4.36 -5.38 (0.0645) (0.0483) (0.0465)
Saudi Arabia 0.34 0.23 0.09 (0.316) (0.735) (0.919)
India -1.19 -1.90 -1.84 (0.0055) (0.0431) (0.0555)
Indonesia -1.07 -3.83 -5.65 (0.011) (0.0037) (0.0016)
Korea 0.07 -0.43 -0.55 (0.703) (0.0926) (0.0169)
Russia -6.65 -27.16 -23.79 (0.244) (0.127) (0.0871)
China 0.23 -0.18 -0.44 (0.557) (0.806) (0.695)
Note: robust standard-error p-values in parentheses; numbers in red (blue) represents statistically significant—at the 10 percent level —overpredictions (underpredictions).
Source: IEO calculations using WEO.

59
Figure A.2.2. Volatility of GDP growth vs. forecast error in GDP growth, one-year-ahead, Spring WEO 1990–2011
Source: Author’s calculations using WEO.
RUSARG
TURIDN
MEX
KOR
SAU
BRA
JPN
UKZAF
IND
DEU
CAN
EUR
CHN
US
ITA
AUS
FRA
0
1
2
3
4
5
6
0 2 4 6 8
RM
S F
orec
ast
Err
or
Stan. Dev. Of GDP Growth

60
Figure A.2.3. Errors in one-year-ahead GDP growth forecasts for G20 economies IMF vs. Consensus forecasts
-6
-5
-4
-3
-2
-1
0
1
2
3
4
19
91
19
92
19
93
19
94
19
95
19
96
19
97
19
98
19
99
20
00
20
01
20
02
20
03
20
04
20
05
20
06
20
07
20
08
20
09
20
10
20
11
United StatesRMSEIMF: 1.61Consensus: 1.70
-6
-5
-4
-3
-2
-1
0
1
2
3
4
19
91
19
92
19
93
19
94
19
95
19
96
19
97
19
98
19
99
20
00
20
01
20
02
20
03
20
04
20
05
20
06
20
07
20
08
20
09
20
10
20
11
United KingdomRMSEIMF: 2.01Consensus: 2.00
-6
-5
-4
-3
-2
-1
0
1
2
3
4
19
91
19
92
19
93
19
94
19
95
19
96
19
97
19
98
19
99
20
00
20
01
20
02
20
03
20
04
20
05
20
06
20
07
20
08
20
09
20
10
20
11
FranceRMSEIMF: 1.49Consensus: 1.52
-6
-5
-4
-3
-2
-1
0
1
2
3
4
19
91
19
92
19
93
19
94
19
95
19
96
19
97
19
98
19
99
20
00
20
01
20
02
20
03
20
04
20
05
20
06
20
07
20
08
20
09
20
10
20
11
GermanyRMSEIMF: 2.30Consensus: 2.22
-7
-6
-5
-4
-3
-2
-1
0
1
2
3
4
19
91
19
92
19
93
19
94
19
95
19
96
19
97
19
98
19
99
20
00
20
01
20
02
20
03
20
04
20
05
20
06
20
07
20
08
20
09
20
10
20
11
ItalyRMSEIMF: 1.98Consensus: 2.03
-6
-5
-4
-3
-2
-1
0
1
2
3
41
99
1
19
92
19
93
19
94
19
95
19
96
19
97
19
98
19
99
20
00
20
01
20
02
20
03
20
04
20
05
20
06
20
07
20
08
20
09
20
10
20
11
CanadaRMSEIMF: 2.00Consensus: 1.84
-6
-5
-4
-3
-2
-1
0
1
2
3
4
19
91
19
92
19
93
19
94
19
95
19
96
19
97
19
98
19
99
20
00
20
01
20
02
20
03
20
04
20
05
20
06
20
07
20
08
20
09
20
10
20
11
JapanRMSEIMF: 2.72Consensus: 2.62
-6
-5
-4
-3
-2
-1
0
1
2
3
4
20
04
20
05
20
06
20
07
20
08
20
09
20
10
20
11
Euro AreaRMSEIMF: 2.14Consensus: 2.21
-6
-5
-4
-3
-2
-1
0
1
2
3
4
19
92
19
93
19
94
19
95
19
96
19
97
19
98
19
99
20
00
20
01
20
02
20
03
20
04
20
05
20
06
20
07
20
08
20
09
20
10
20
11
AustraliaRMSEIMF: 1.49Consensus: 0.94
Consensus IMF WEO

61
Figure A.2.3. Errors in one-year-ahead GDP growth forecasts for G20 economies IMF vs. Consensus forecasts (concluded)
Source: Author’s calculations using the Spring WEO and April Consensus forecasts.
-15
-10
-5
0
5
10
19
99
20
00
20
01
20
02
20
03
20
04
20
05
20
06
20
07
20
08
20
09
20
10
20
11
TurkeyRMSEIMF: 4.93Consensus: 5.87
-15
-10
-5
0
5
10
19
95
19
96
19
97
19
98
19
99
20
00
20
01
20
02
20
03
20
04
20
05
20
06
20
07
20
08
20
09
20
10
20
11
ArgentinaRMSEIMF: 5.86Consensus: 6.27
-15
-10
-5
0
5
10
19
95
19
96
19
97
19
98
19
99
20
00
20
01
20
02
20
03
20
04
20
05
20
06
20
07
20
08
20
09
20
10
20
11
BrazilRMSEIMF: 2.91Consensus: 2.58
-15
-10
-5
0
5
10
19
95
19
96
19
97
19
98
19
99
20
00
20
01
20
02
20
03
20
04
20
05
20
06
20
07
20
08
20
09
20
10
20
11
MexicoRMSEIMF: 4.01Consensus: 4.28
-15
-10
-5
0
5
10
19
96
19
97
19
98
19
99
20
00
20
01
20
02
20
03
20
04
20
05
20
06
20
07
20
08
20
09
20
10
20
11
IndiaRMSEIMF: 1.84Consensus: 1.76
-15
-10
-5
0
5
10
19
96
19
97
19
98
19
99
20
00
20
01
20
02
20
03
20
04
20
05
20
06
20
07
20
08
20
09
20
10
20
11
IndonesiaRMSEIMF: 4.79Consensus: 5.59
-15
-10
-5
0
5
10
19
96
19
97
19
98
19
99
20
00
20
01
20
02
20
03
20
04
20
05
20
06
20
07
20
08
20
09
20
10
20
11
KoreaRMSEIMF: 3.70Consensus: 4.38
-15
-10
-5
0
5
10
19
99
20
00
20
01
20
02
20
03
20
04
20
05
20
06
20
07
20
08
20
09
20
10
20
11
RussiaRMSEIMF: 5.70Consensus: 4.99
-15
-10
-5
0
5
10
19
96
19
97
19
98
19
99
20
00
20
01
20
02
20
03
20
04
20
05
20
06
20
07
20
08
20
09
20
10
20
11
ChinaRMSEIMF: 2.99Consensus: 1.62
Consensus IMF WEO

62
ANNEX 3. MEDIUM-TERM ANALYSIS THROUGH RISK ASSESSMENTS AND SCENARIOS
Several IMF products potentially contain discussions about future developments over horizons longer than a year. This annex briefly describes how medium-term issues are treated in the flagship publications WEO, GFSR, and Fiscal Monitor, as well as in spillover reports, pilot external sector reports, early warning exercises, and vulnerability exercises.
The World Economic Outlook (WEO) “presents IMF staff economists' analyses of global economic developments during the near and medium term” [emphasis added].1 The medium-term issues referred to, which occasionally are treated in special chapters, include the effects of the evolution of commodity prices and structural reforms; fiscal projections; and sustainable rates of economic growth.
The Global Financial Stability Report (GFSR) provides a quarterly assessment of global financial markets, with a view towards emerging market financing in a global context. The GFSR focuses on current conditions and contemporary issues, but discusses financial imbalances and structural deficiencies that could pose risks to financial stability and market access by emerging market borrowers that extends to the medium term. In particular, the Report draws out the financial implications of economic imbalances highlighted in the WEO, including on medium-term projections, to assess current risks. The GFSR often also contains articles and analytical chapters on structural or systemic issues that are of longer-term nature.
The Fiscal Monitor (FM) focuses on the multilateral surveillance of fiscal developments, analyzing the latest public finance developments, information on fiscal implications of the crisis and medium-term fiscal projections, and assessing policies to put public finances on a sustainable footing. The FM’s projections—including the medium-term fiscal projections that incorporate policy measures judged by the IMF staff as likely to be implemented, IMF program projections, and estimates of cyclically adjusted primary balances—are based on the same database used for the WEO and GFSR.
Table A.3.1 quantifies the frequency of discussions about medium-term developments in flagship publications—as measured by the number of separate sections that explicitly deal with medium-term issues—and the use of scenarios and fan charts to describe such medium-term developments.
1 See http://www.imf.org/external/ns/cs.aspx?id=29.

63
Table A.3.1. Medium-term analysis in IMF products
IMF product No. of reports
Reports with fan
charts
Fan charts per report (average)
Reports with figures or tables of medium-
term scenarios
Figures or tables of scenarios per report (average)
Reports with sections about
medium-term issues1
Sections about medium-term
issues per report (average)
2000–2013
World Economic Outlook 28 57% 0.71 93% 2.82 64% 1.32
Fiscal Monitor2 10 20% 0.30 60% 1.00 60% 1.40 Global Financial Stability Report 26 8% 0.08 19% 0.19 19% 0.27 Article IV Consultation Reports3 56 4% 0.04 96% 4.55 84% 1.29
2006–2013
World Economic Outlook 16 100% 1.25 94% 2.69 50% 0.94
Fiscal Monitor2 10 20% 0.30 60% 1.00 60% 1.40 Global Financial Stability Report 16 13% 0.13 31% 0.31 13% 0.13
1 Based on search for selected key phrases on section titles. 2 The Fiscal Monitor first appeared in 2009. 3 Latest reports for 56 randomly selected countries.
Among the 28 editions of the WEO published since the year 2000, almost two-thirds have sections or chapters with titles containing key phrases that suggest medium/long-term subjects;2 57 percent use fan charts to describe the uncertainty around medium-term central forecasts, and 93 percent contain figures, charts, or tables to describe medium-term scenarios.
Compared to the WEO, the discussion of medium-term issues is slightly more frequent in the Fiscal Monitor (60 percent vs. 50 percent during the 2006–2013 period)—where it is mostly restricted to fiscal issues, and the use of fan charts and tables/figures for medium-term scenarios is substantially less frequent than in the WEO.
Among the flagship products, the GFSR seems to be the least concerned with medium-term issues and scenarios.
Even if medium-term issues are not the central part in the FM and GFSR they often feature in the overall analysis. For instance, simple inspection (page counting) of recent editions of the
2 The key phrases searched, which by no means exhaust all possibilities, are “medium term, long term, potential output, output gap, sustainable growth, structural reform, structural change, debt sustainability, demographic change.”

64
FM and GFSR reveals that between 60 percent and 70 percent of these documents deal, at least partly, with structural issues and medium- to long-term trends, prospects, or risks.
Spillover reports examine the external effects of domestic policies in five systemic economies (S5): China, the Euro Area, Japan, the United Kingdom, and the United States. The reports aim to complement Article IV discussions with these economies and serve as an input into the Fund’s multilateral surveillance, by analyzing the transmission channels of monetary, exchange rate, fiscal, financial, and structural policies between the S5 economies and the global economy with a view to anticipating the cross-border impact of policies. The identification and assessment of policy spillovers with the greatest potential impact—based on staff macro models, inputs from a multi-departmental team, and individual discussions with authorities—also complements the debate on the risks to global economic and financial stability in the WEO and GFSR, and points to possible areas for policy coordination.
Also discussed in spillover reports are medium-term issues such as the potential impact of financial sector and structural reforms affecting potential growth, long-term fiscal measures, and monetary/exchange rate policies or frameworks. Table A.3.2 lists all specific examples of discussions involving medium-term projections in the three issues of the spillover report, which often include fan charts to provide a sense of risks around the expected path (central forecast) of relevant variables or figures and tables with alternative scenarios. Note that the number of explicit quantitative analyses of developments over the medium term in the reports has increased every year.
The Early Warning Exercise (EWE)—which the IMF conducts jointly with the Financial Stability Board (FSB)—emerged from the need to improve the ability of multilateral surveillance to flag risks and vulnerabilities that could lead to systemic shocks, such as those leading to the recent financial crisis. The EWE focuses on low-probability but high-impact risks to the global economy and on policies to mitigate these risks, integrating macroeconomic and financial analyses and using a number of quantitative tools and broad-based consultations. No report is made available to the public; findings are confidentially presented to senior officials during the IMF Spring and Annual Meetings. The EWE typically contains less medium-term analysis than spillover reports, although the initial EWE rounds focused primarily on potential mutations of the 2007–09 financial crises, asking what new shocks could materialize and assessing the consequences of policy inaction over an unspecified horizon that may include the medium term. It is expected that, once the global economy returns to more stable conditions, the EWE will become more forward-looking as initially planned.

65
Table A.3.2. Medium-term analysis in spillover reports
Vintage Analysis 2011 The cumulative effects of planned fiscal adjustments in major economies (Euro
Area, Japan, U.S.) on the output of other S5 economies over next five years.
The medium-term impact of an appreciation of the Chinese exchange rate on the GDP of other economies.
2012 The impact of the Euro Crisis on the fiscal space and reserve coverage needed to reach a desired target for the debt-to-GDP ratio in low-income countries.
The effect of a credible medium-term fiscal adjustment in the US on the erosion in public confidence.
The cumulative response of oil prices to shocks to global liquidity over next 20 quarters.
The effect of rebalancing the investment and consumption ratios in China on the GDP of other economies and on commodity prices.
Effects of an increase in Japanese bond yields on global yields and economic growth.
2013 The long-run effect on the GDP of policies in S5 economies leading to a reduction in the risk of adverse spillovers to global economy.
Scenarios about the cumulative effect of QE announcements on GDP.
Structural reforms to increase potential output in the EU Area and Japan, to reduce risks during the transition to a higher consumption-to-GDP ratio in China, and structural fiscal reform in the US and Japan.
Positive net growth spillover effects from new monetary policy stance (“Abenomics) over the long run.
Cumulative impact over 3 years of a smooth normalization of monetary policy in the U.S. on GDP.
The effect of “rebalancing policies”—needed to reduce the imbalances of global current accounts and in domestic policies in S5 economies—on global GDP over 10 years.
Source: IMF Spillover Reports.
The pilot External Sector Report (ESR) provides a snapshot of multilaterally consistent analysis of the external positions of 28 large economies and the Euro Area. It combines insights from IMF staff on individual economies with multilateral analysis about exchange rates, current accounts, balance sheet positions, reserves adequacy, and capital flows. One premise is that current account imbalances and deviations of exchange rates from a desired “norm” may be useful for the assessment of member countries’ overall economic and financial policies, to the extent that those gaps reflect the joint effects of policies targeted both at the domestic economy and the external sector as well as of structural factors.

66
Like that in other IMF products, the analysis in the ESR mostly concentrates on the short-term assessment of policies rather than on projections of future outcomes. Nevertheless, assumptions about a country’s long-run sustainable output level and growth rate, sometimes embedded in point forecasts of GDP growth for the medium term, are required by the new pilot External Balance Assessment (EBA) approach, which is combined with judgment to help assess external imbalances.
Medium-term or structural issues have been discussed in the two issues of the ESR, in 2012 and 2013, despite their focus on short term. All specific topics analyzed are listed in Table A.3.3.
Table A.3.3. Medium-term analysis in pilot external sector reports
Vintage Analysis 2012 Moving current accounts toward fundamentals likely implies ambitious medium-
term policies and significant real exchange rate realignments.
Adjustments to structural factors are needed to reduce vulnerabilities to external imbalances (e.g., changes in social protection frameworks that affect precautionary savings).
Expected medium-term policy changes (as announced and discussed in the most recent WEO before publication of the 2012 ESR) are likely to produce only modest effects on the current account divergences over the next five years.
Differences in cyclically adjusted current account balances and current account balances consistent with fundamentals and desired policies are used as a measure of undesirable external imbalances. The estimation of cyclically adjusted variables requires estimates of the long-run sustainable output level (potential output).
2013 Medium-term policies to close structural policy gaps and reduce undesired current account imbalances include fiscal consolidation over the medium term and structural reforms in deficit countries.
Discussion of risks of prolonged use of extraordinarily low interest rates and quantitative easing in the US.
“Looking ahead” section analyses past data on the determinants of capital inflows, distinguishing between structural and temporary factors. Although the horizon is not specified the forward-looking analysis presumably involves longer horizons.
Source: IMF Pilot External Sector Reports.