Embed Size (px)
Citation preview

© 2016 International Monetary Fund
IMF Country Report No. 16/346
ARGENTINA 2016 ARTICLE IV CONSULTATION—PRESS RELEASE; STAFF REPORT; AND STATEMENT BY THE EXECUTIVE DIRECTOR FOR ARGENTINA
Under Article IV of the IMF’s Articles of Agreement, the IMF holds bilateral discussions with
members, usually every year. In the context of the 2016 Article IV consultation with Argentina,
the following documents have been released and are included in this package:
A Press Release summarizing the views of the Executive Board as expressed during its
November 9, 2016 consideration of the staff report that concluded the Article IV
consultation with Argentina.
The Staff Report prepared by a staff team of the IMF for the Executive Board’s
consideration on November 9, 2016, following discussions that ended on
September 30, 2016, with the officials of Argentina on economic developments and
policies. Based on information available at the time of these discussions, the staff report
was completed on October 19, 2016.
An Informational Annex prepared by the IMF staff.
A Debt Sustainability Analysis prepared by the staff of the IMF.
A Staff Statement updating information on recent developments.
A Statement by the Executive Director for Argentina
The documents listed below have been or will be separately released:
Selected Issues
The IMF’s transparency policy allows for the deletion of market-sensitive information and
premature disclosure of the authorities’ policy intentions in published staff reports and other
documents.
Copies of this report are available to the public from
International Monetary Fund Publication Services
PO Box 92780 Washington, D.C. 20090
Telephone: (202) 623-7430 Fax: (202) 623-7201
E-mail: [email protected] Web: http://www.imf.org
Price: $18.00 per printed copy
International Monetary Fund
Washington, D.C.
November 2016

Press Release No. 16/500
FOR IMMEDIATE RELEASE
November 10, 2016
IMF Executive Board Concludes Article IV Consultation with Argentina
On November 9, 2016, the Executive Board of the International Monetary Fund (IMF)
concluded the Article IV Consultation with Argentina.1
Upon taking office in December last year, Argentina’s new government faced pervasive
macroeconomic imbalances, microeconomic distortions, and a weakened institutional
framework. Confronted with this difficult situation, the authorities began an ambitious and
much needed transition toward a better economic policy. Important progress has been made
already in 2016. The peso is now market determined and exchange controls have been
essentially eliminated. The increase in utility tariffs has brought prices more in line with
underlying costs. The settlement with creditors has allowed a return to international capital
markets by both the private and public sector. Medium-term fiscal and inflation targets have
been announced in conjunction with a transition toward a modern system of inflation
targeting. Finally, the national statistics agency is being rebuilt, allowing for the publication
of improved and credible statistics.
The reversal of the serious imbalances and distortions inherited from the previous
administration, while necessary to lay the foundation for robust future growth, unavoidably
had an adverse near-term impact on the Argentine economy. However, the current recession
had begun even before the new administration took office and the alternative of continuing
with the unsustainable policy framework of the past administration was simply not tenable,
as it would have eventually led to a repeat of Argentina’s history of crisis, contraction, and
social distress. The economy is expected to rebound from a -1.8 percent recession in 2016 to
a 2.7 percent growth in 2017, and to grow at a close to 3 percent pace over the medium term.
A modest headwind from the planned fiscal rebalancing should be offset by a pickup in
private consumption (as inflation continues to fall), an improving external environment, and
1 Under Article IV of the IMF's Articles of Agreement, the IMF holds bilateral discussions with members,
usually every year. A staff team visits the country, collects economic and financial information, and discusses
with officials the country's economic developments and policies. On return to headquarters, the staff prepares a
report, which forms the basis for discussion by the Executive Board. The last Article IV Consultation with
Argentina took place about 10 years ago, in July 2006.
International Monetary Fund
Washington, D.C. 20431 USA

2
a rebound of private investment. With strong policy action and dramatic changes underway
in the Argentine economy, the outlook is subject to greater than normal uncertainty.
Against this background, the central focus of the Article IV Consultation was on the best way
to restore sustained and equitable growth, boost job creation, and protect the poor from the
costs of restoring macroeconomic stability
The government has been clear in its commitment to bring inflation to single digit levels by
2019, and has maintained real interest rates broadly constant in positive territory while
lowering the policy rate since Spring this year as forward looking indicators of inflation
began to fall. A tight control of spending growth in the first few months of the year is
expected to allow the federal government to meet the primary fiscal deficit objective for 2016
(4.8 percent of GDP), despite injecting some fiscal stimulus in the second half of the year.
The 2017 Budget envisages a modest reduction of the primary federal fiscal deficit for next
year, to 4.2 percent of GDP, mainly on account of further cuts of energy subsidies. Over the
last few months, progress on structural reforms has occurred in the areas of governance,
anti-corruption, competition policies, and financial market infrastructure, but supply-side
bottlenecks remain that might impede a faster rebound of private investment and
productivity.
Executive Board Assessment
Executive Directors strongly welcomed Argentina’s resumption of the Article IV
consultation and underscored the importance of close engagement between the authorities
and staff going forward.
Directors commended the ambitious reforms taken by the new administration to ensure a
more stable and sustainable economic policy framework. They cautioned that reversing the
legacy of severe macroeconomic imbalances, pervasive microeconomic distortions, and a
weakened institutional framework will take time, but noted that important progress has been
achieved by the authorities. While the measures taken have had a negative short-term impact
on economic activity, the Argentinian economy is expected to rebound in 2017. Directors
encouraged the authorities to remain steadfast in their reform efforts and reach out to
stakeholders to secure broad support.
Directors stressed that continuing to lower the fiscal deficit is an important part of the
adjustment. They noted that the pace and composition of rebalancing should be sensitive to
its impact on growth, jobs, and the most vulnerable segments of the population, while
maintaining clear medium-term objectives. In this context, Directors broadly saw the gradual
reduction of the fiscal deficit envisaged by the authorities to be appropriate. At the same
time, some Directors considered that the pace of deficit reduction could be accelerated if
economic activity was stronger than expected, including to facilitate the reduction of
inflation.

3
Directors emphasized the importance of institutional reforms to improve the efficiency and
credibility of the fiscal framework. These reforms include introducing a simple and
transparent medium-term fiscal policy plan; rationalizing government spending, including the
wage bill; removing poorly targeted and distortionary energy subsidies; and restoring
financial sustainability to the pension system. Directors also noted the need to make the tax
system more progressive over time to reduce the tax burden and make the system more
efficient. They also highlighted the importance of addressing issues related to fiscal
federalism.
Directors commended the authorities’ efforts to bring down inflation to single digits. They
broadly agreed that the pace at which inflation is reduced should remain attuned to its
economic costs and distributional impact. Directors emphasized that building credibility in
the monetary framework—in particular, establishing a clear price stability mandate for the
central bank and securing its operational independence, and eliminating monetary financing
of the deficit—will lessen the economic and social costs of disinflation.
Directors called for an ambitious agenda of supply-side reforms to improve the business
climate and achieve strong, sustained and equitable growth. They noted that priorities include
promoting competition, putting in place a better regulatory framework for energy and
utilities, fully realigning utility tariffs toward cost recovery, and instituting a transfer scheme
to protect the poor. Measures to gradually improve the quality of infrastructure, lower trade
barriers, and develop local capital markets would also help. Directors welcomed recent
progress to fight corruption, scale back government involvement in private industries, and
create a better governance framework.

4
Argentina: Selected Economic and Financial Indicators
Average
2009–14 2015 2016 2017 2018 2019 2020 2021
National income, prices, and labor markets
GDP at constant prices 1.5 2.5 -1.8 2.7 2.8 2.9 3.1 3.3
Domestic demand 2.6 3.7 -2.2 3.4 3.6 3.6 3.5 3.6
Consumption 2.8 4.1 -1.8 2.3 2.7 2.7 2.9 3.0
Private 2.6 3.6 -1.7 2.5 2.8 2.8 3.0 3.1
Public 4.5 6.6 -2.5 1.6 2.1 2.4 2.5 2.5
Investment 1.6 4.2 -3.6 8.2 7.2 7.2 5.9 5.8
Exports -1.0 -0.6 4.5 4.4 4.8 3.8 5.5 4.8
Imports 4.4 5.6 1.3 6.8 7.6 6.3 6.3 5.6
Change in inventories and stat. disc. (contribution to growth) 0.1 -0.3 -0.1 0.0 0.0 0.0 0.0 0.0
Nominal GDP (billions of Argentine pesos) 2,609 5,843 8,043 10,173 12,466 14,801 17,016 19,259
CPI inflation (eop, y/y percent change) … … 39.4 20.5 17.5 13.0 10.3 9.4
Unemployment rate (percent) 7.5 … 9.2 8.5 8.3 7.5 6.9 6.8
External sector
Exports f.o.b. (goods, billions of U.S. dollars) 71.9 56.8 55.3 57.2 59.5 62.0 65.6 68.9
Imports f.o.b. (goods, billions of U.S. dollars) -60.1 -57.2 -51.6 -56.4 -61.1 -65.5 -70.2 -74.5
Trade balance (goods, billions of U.S. dollars) 11.7 -0.4 3.8 0.8 -1.5 -3.5 -4.5 -5.6
Trade balance (goods) 2.6 -0.1 0.7 0.1 -0.2 -0.5 -0.6 -0.7
Terms of trade (percent change) 1.6 -4.0 2.3 -2.9 -1.6 -0.4 -0.4 -0.2
Total external debt 31.4 25.2 31.7 32.5 33.8 34.5 34.6 34.6
Savings-Investment balance
Gross domestic investment 16.3 15.9 15.8 16.5 17.1 17.6 17.9 18.2
Gross national savings 15.9 13.4 13.5 13.3 13.5 13.7 13.9 14.0
Current account balance -0.4 -2.5 -2.3 -3.2 -3.6 -3.9 -4.0 -4.2
Public sector 1/
Primary balance -1.7 -5.4 -5.6 -5.1 -4.1 -3.0 -2.0 -1.8
of which : Federal government -1.4 -5.0 -4.8 -4.5 -3.6 -2.5 -1.4 -1.3
Overall balance -2.7 -6.6 -7.3 -6.9 -6.2 -5.0 -3.8 -3.6
of which : Federal government -2.4 -6.2 -6.5 -6.3 -5.6 -4.4 -3.2 -3.0
Revenues 30.7 34.0 32.5 32.3 32.2 32.0 31.8 31.7
Primary expenditure 33.1 39.4 38.0 37.4 36.3 35.0 33.8 33.5
Total public debt (federal) 43.3 52.1 51.8 51.1 51.2 50.0 48.4 47.5
Money and credit
Monetary base (eop, y/y percent change) 27.5 34.9 24.4 23.7 20.7 16.5 13.8 12.8
Credit to the private sector (eop, y/y percent change) 28.9 35.6 26.4 21.2 18.4 14.8 15.3 14.0
Credit to the private sector real (eop, y/y percent change) … … -9.3 0.6 0.8 1.6 4.5 4.2
LEBAC interest rate (average) 2/ 16.0 28.1 29.8 25.2 20.1 16.3 13.7 13.1
LEBAC real interest rate (average) 2/ … … 5.0 5.1 4.4 4.4 3.7 3.4
LEBAC interest rate (eop) 2/ 16.3 32.2 28.3 22.8 17.7 15.1 13.2 13.0
LEBAC real interest rate (eop) 2/ … … 6.4 4.5 4.2 4.4 3.5 3.3
Memorandum items
Gross international reserves (billions of U.S. dollars) 42.0 25.6 33.3 36.5 49.2 56.5 61.2 66.6
Exchange rate (eop, Arg$/US$) 5.3 13.0 … … … … … …
Change in REER (average, percent change) 6.7 26.0 -12.8 3.7 2.9 2.9 2.9 2.9
Transfers from BCRA 0.9 1.3 1.4 0.6 0.2 0.1 0.0 0.0
Proj.
(Annual percentage changes unless otherwise indicated)
(Percent of GDP unless otherwise indicated)
Sources: Ministerio de Hacienda y Finanzas Públicas, Banco Central de la República Argentina (BCRA), and Fund staff estimates.
1/ The primary balance excludes profit transfers from the central bank of Argentina. Interest expenditure is net of property income from the social security fund.
2/ Average of LEBAC rates of all maturities.

ARGENTINA STAFF REPORT FOR THE 2016 ARTICLE IV CONSULTATION
KEY ISSUES
An inherited legacy of imbalances. Upon taking office in December last year,
Argentina’s new government faced pervasive macroeconomic imbalances,
microeconomic distortions, and a weakened institutional framework. These
encompassed unsustainably high consumption levels, historically low levels of
investment, and large fiscal deficits financed by money creation, which led to high
inflation. Distortions at the micro level included an extensive network of administrative
controls (for example, trade barriers, foreign exchange restrictions, and price controls)
and a business environment that eroded competitiveness and undermined medium-
term growth. There was also an important weakening of the institutional framework for
economic policymaking, perhaps most evident in the loss of credibility of the national
statistics agency.
Initial policy steps. Confronted with this difficult situation, the new government began
an ambitious and much needed transition toward a better economic policy framework,
reversing the serious macroeconomic imbalances and microeconomic distortions
inherited from the previous government. Important progress has been made. The peso
is now market determined, and foreign exchange controls have essentially been
eliminated. The increase in utility tariffs has brought prices more in line with underlying
costs. The settlement with creditors has allowed a return to international capital
markets by both the private and public sectors. Medium-term fiscal and inflation
targets have been announced in conjunction with a transition toward a modern system
of inflation targeting. Finally, the national statistics agency is being rebuilt, allowing for
the publication of improved and credible data on inflation, trade, the labor market, and
output.
Prospects. The reversal of the serious imbalances and distortions inherited from the
previous administration, while necessary to lay the foundation for robust future growth,
unavoidably had an adverse near-term impact on the Argentine economy. However, the
alternative of continuing with the unsustainable policy framework of the past
administration was simply not tenable, as it would have eventually led to a repeat of
Argentina’s history of crisis, contraction, and social distress. The economy is expected to
emerge from recession in 2017 and grow at a close to 3 percent pace over the medium
term. A gradual rebound of private investment is forecasted as fiscal imbalances and
inflation are reduced and supply side reform proceeds. High gross external financing
needs and an overly backward looking process for wage inflation represent negative
October 19, 2016

ARGENTINA
2 INTERNATIONAL MONETARY FUND
risks to the outlook. However, the better policy framework could trigger a stronger
rebound in private investment creating an important upside for growth.
Macroeconomic policy mix. The way forward for Argentina is to restore balance to the
fiscal accounts and deploy monetary policy to steadily bring down inflation. Getting the
balance right in this policy mix will be complex but critical. Frontloading the reduction
of the fiscal deficit to the extent allowed by the current economic, political, and social
constraints would allow for a more accelerated reduction in interest rates, ease the
upward pressure on the real exchange rate, improve the public debt dynamics, and
facilitate the needed rebalancing from consumption to investment.
Institutional reforms. Rebuilding the institutional framework for good policies will
significantly ease the economic cost of the transition. This includes securing the
operational independence of the central bank and anchoring expectations through
simple and transparent medium-term fiscal objectives. Strengthening public
expenditure management and increasing the efficiency of public spending would create
space for a needed reduction of the tax burden and for measures to alleviate the
impact of the transition on the poor. Supply-side priorities include putting in place a
better regulatory framework for energy and utilities, fully realigning utility tariffs toward
cost recovery, and instituting a transfer scheme to protect the poor. There is also a
broader need to scale back government involvement in private industries and creating
a better governance framework, including by making further progress on the
government’s ambitious anti-corruption plans. Such a set of policies will create an
environment that is more conducive to private investment and will generate significant
medium-term dividends in terms of more and better jobs as well as a steady
improvement in the living standards for Argentina’s population.

ARGENTINA
INTERNATIONAL MONETARY FUND 3
Approved By Nigel Chalk (WHD)
and Mary Goodman
(SPR)
The staff team comprising R. Cardarelli (head), L. Lusinyan,
J. Canales-Kriljenko, D. Singh (all WHD), M. Ortiz Villafañe (WHD,
local economist), P. Dudine (FAD), L. Jacome (MCM), A. Pienkowski
(SPR), Ch. DeLong, and F. Figueroa (both LEG) visited Buenos Aires
and Cordoba during September 19–30, 2016. J. L. Saboin (WHD)
provided research assistance. Mr. Werner (WHD) joined the
concluding meetings. Mr. Torres (OED) participated in the meetings.
The mission met with senior officials and representatives of private
sector, finance industry, academics, and think-tanks.
CONTENTS
2006–15: A LEGACY OF UNBALANCED GROWTH ______________________________________________ 5
2016: A WELL-MANAGED AND NECESSARY TRANSITION ____________________________________ 6
OUTLOOK AND RISKS _________________________________________________________________________ 14
RESTORING THE FOUNDATIONS FOR SUSTAINED GROWTH AND JOB CREATION ________ 21
A. Fighting Inflation ______________________________________________________________________________ 21
B. Restoring Fiscal Integrity ______________________________________________________________________ 24
C. Rebuilding Fiscal Institutions __________________________________________________________________ 30
D. Protecting the Poor ___________________________________________________________________________ 32
E. Creating New Institutional Structures __________________________________________________________ 35
STAFF APPRAISAL _____________________________________________________________________________ 40
BOXES
1. Poverty in Argentina____________________________________________________________________________ 7
2. Current Account and Exchange Rate __________________________________________________________ 13
3. Inflation, Expectations, and Wages ____________________________________________________________ 16
4. Inflation Inertia and the Cost of Disinflation ___________________________________________________ 22
5. Lessons from Past Episodes of Disinflation ____________________________________________________ 23
6. Government Spending in Argentina ___________________________________________________________ 25
7. Argentina’s Pension System: Options for Reform ______________________________________________ 27
8. Gender Gap Issues in Argentina _______________________________________________________________ 34
FIGURE
1. Effects of the Transition ________________________________________________________________________ 9

ARGENTINA
4 INTERNATIONAL MONETARY FUND
TABLES
1. Selected Economic and Financial Indicators ___________________________________________________ 43
2. Summary Balance of Payments, 2011–21 ______________________________________________________ 44
3. Consolidated Public Sector Operations, 2011–21 ______________________________________________ 45
4. Federal Government Operations, 2011–21 ____________________________________________________ 46
5. Summary Operations of the Financial System, 2011–21 _______________________________________ 47
6. External Debt, 2011–21 ________________________________________________________________________ 48
7. Public Debt, 2011–21 __________________________________________________________________________ 49
ANNEXES
I. External Sector Assessment ____________________________________________________________________ 50
II. Potential Cross-Border Spillovers ______________________________________________________________ 61
ARGENTINA
INTERNATIONAL MONETARY FUND 5
2006–15: A LEGACY OF UNBALANCED GROWTH
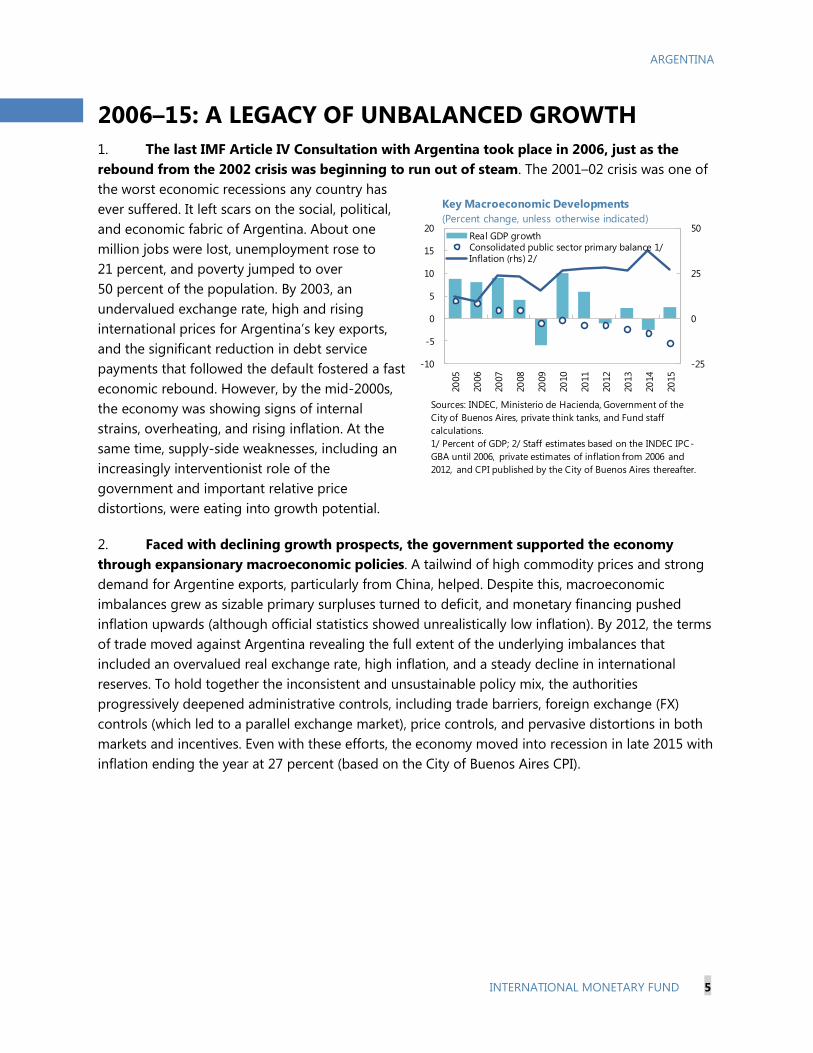
1. The last IMF Article IV Consultation with Argentina took place in 2006, just as the
rebound from the 2002 crisis was beginning to run out of steam. The 2001–02 crisis was one of
the worst economic recessions any country has
ever suffered. It left scars on the social, political,
and economic fabric of Argentina. About one
million jobs were lost, unemployment rose to
21 percent, and poverty jumped to over
50 percent of the population. By 2003, an
undervalued exchange rate, high and rising
international prices for Argentina’s key exports,
and the significant reduction in debt service
payments that followed the default fostered a fast
economic rebound. However, by the mid-2000s,
the economy was showing signs of internal
strains, overheating, and rising inflation. At the
same time, supply-side weaknesses, including an
increasingly interventionist role of the
government and important relative price
distortions, were eating into growth potential.
2. Faced with declining growth prospects, the government supported the economy
through expansionary macroeconomic policies. A tailwind of high commodity prices and strong
demand for Argentine exports, particularly from China, helped. Despite this, macroeconomic
imbalances grew as sizable primary surpluses turned to deficit, and monetary financing pushed
inflation upwards (although official statistics showed unrealistically low inflation). By 2012, the terms
of trade moved against Argentina revealing the full extent of the underlying imbalances that
included an overvalued real exchange rate, high inflation, and a steady decline in international
reserves. To hold together the inconsistent and unsustainable policy mix, the authorities
progressively deepened administrative controls, including trade barriers, foreign exchange (FX)
controls (which led to a parallel exchange market), price controls, and pervasive distortions in both
markets and incentives. Even with these efforts, the economy moved into recession in late 2015 with
inflation ending the year at 27 percent (based on the City of Buenos Aires CPI).
-25
0
25
50
-10
-5
0
5
10
15
20
20
05
20
06
20
07
20
08
20
09
20
10
20
11
20
12
20
13
20
14
20
15
Key Macroeconomic Developments
(Percent change, unless otherwise indicated)
Real GDP growthConsolidated public sector primary balance 1/Inflation (rhs) 2/
Sources: INDEC, Ministerio de Hacienda, Government of the
City of Buenos Aires, private think tanks, and Fund staff
calculations.
1/ Percent of GDP; 2/ Staff estimates based on the INDEC IPC-
GBA until 2006, private estimates of inflation from 2006 and
2012, and CPI published by the City of Buenos Aires thereafter.

ARGENTINA
6 INTERNATIONAL MONETARY FUND
3. The new government, which took office in December 2015, inherited an inconsistent
and distorted economic model. The policies of the past decade had pushed consumption to
unsustainable high levels, eroded potential growth
and international competiveness, resulted in one of
the lowest investment rate among emerging
market economies, and left Argentina close to a
balance of payment crisis with international
reserves virtually exhausted. In addition, the good
progress made in reducing poverty and income
inequality in the years following the 2001 crisis had
moved into reverse after 2011 and, by mid-2016,
32 percent of the urban population were living
below the poverty line (see Box 1).
2016: A WELL-MANAGED AND NECESSARY
TRANSITION
4. In the first few months of the new administration, bold steps were taken to:
Remove the various FX controls and let the exchange rate float, unifying the official and parallel
exchange markets, and correcting the overvaluation of the peso through a 40 percent
depreciation of the official rate in December 2015.
Announce a plan of fiscal consolidation to reach a zero primary balance by 2019.
Announce an inflation target of 20–25 percent for end-2016, falling to 5 percent by end-2019,
and begin the transition towards an
inflation-targeting regime.
Regain access to international capital
markets by reaching a settlement with
creditors. This allowed the federal
government, provinces and private
corporations to issue about US$37.8 billion
in bonds in global markets so far in 2016
(US$9.5 billion of which were used to finance
the agreement with holdout creditors).
Raise utility tariffs, especially in the Buenos
Aires metropolitan area by an average of
250 percent for electricity and subsequently by a 100–300 range for natural gas, water and
transportation. The most vulnerable were protected through a social tariff that allowed one fifth
of the consumers to receive a fixed amount of free electricity and a significantly subsidized tariff
for natural gas.
0
10
20
30
40
2006 2008 2010 2012 2014 2016Q2
Poverty Rate 1/
(Percent)
Sources: Pontificia Universidad Católica Argentina (UCA),
SEDLAC (CEDLAS and World Bank), and INDEC.
1/ Poverty line is US$4 per day for SEDLAC and is based on a
consumption basket for INDEC and UCA.
UCA
SEDLAC
INDEC
0
10
20
30
40
2015 2016
Provinces
Private sector
Federal government
Sources: BCRA and Fund staff estimates.
Debt Issuance in International Markets
(Billions of U.S. dollars, first nine months)

ARGENTINA
INTERNATIONAL MONETARY FUND 7
Box 1. Poverty in Argentina
The data on poverty published by the national statistics agency (INDEC) in September 2016 after
3 years of suspension show that, as of mid-2016,
32.2 percent of Argentina’s urban population (about
8.8 million people) lives below the poverty line (defined
as the level of income needed to satisfy essential
necessities for food, clothing, transportation, education,
health). Moreover, 6.3 percent (1.7 million people) of
the population lives in extreme poverty (with income
below what is needed to satisfy basic food necessities).
The data stand in stark contrast to the last published
statistic, according to which the poverty rate in
Argentina was 4.7 percent in the first half of 2013.
The new data released by INDEC also show that about 23 percent of Argentine households (about
2 million) lives below the poverty line, with their income being on average about 37 percent below the
poverty threshold (12,850 pesos or about US$900 per month). About 5 percent of households lives in
extreme poverty, with an income that on average is 40 percent below the threshold (4,930 pesos or
about US$350 per month). The geographical distribution shows that poverty is particularly high in the
Northeast of the country, where the household poverty rate is about 30 percent, compared to slightly
below 20 percent in the southern (Patagonica) region. The poverty picture is particularly worrisome
when looking at the age distribution, with about 47½ of children living in poverty and nearly one in
ten children in extreme poverty. By contrast, only 8 percent of the elderly population lives in poverty.
While different national definitions and data
availability make it difficult to compare poverty
rates across countries, based on official indicators
Argentina’s rate is among the highest in the
region. Based on standardized World
Bank/CEDLAS estimates of poverty rates (defined
as the share of population living with less than
US$4 per day) reveals that, using this definition,
in 2014 poverty in Argentina was higher than in
Chile and Uruguay but lower than Brazil, Mexico,
Peru, and Colombia.
Argentina: Poverty Rate
(Percent, 2016Q2)
Poverty
Extreme
poverty
Total (persons) 32.2 6.3
by age group
0–14 47.4 9.4
15–29 38.5 8.0
30–64 27.5 5.0
65 and above 8.0 1.3
Sources: INDEC and Fund staff calculations.
0
10
20
30
40
50
Poverty Rate
(Percent) 1/
US$4-a-day poverty line (2005 PPP)
Official poverty rate
Sources: SEDLAC (CEDLAS and The World Bank), INDEC, and
country authorities.
1/ As of 2014 except Argentina official (2016Q2), Chile (2013),
Colombia official (2015), and Uruguay official (2015).

ARGENTINA
8 INTERNATIONAL MONETARY FUND
Eliminate export taxes on most agricultural products (only for soybean and soybean products
there was a reduced rate of 30 and 27 percent, respectively).
Overhaul the national statistical agency (INDEC) leading to the publication of a new CPI and a
revised series for GDP, trade, poverty, and labor market data.
Unwind in a controlled way the significant increase in foreign currency forward contracts that
were entered into by the central bank in the final months of the previous administration.
5. These measures, while necessary to lay the foundation for robust future growth,
inevitably had an adverse impact on the Argentine economy which had already began to
contract in the last quarter of 2015. The peso depreciation and increase in utility prices have
pushed headline inflation (based on the City of
Buenos Aires CPI) to 44 percent year-on-year
(y/y) by September (core inflation of 40 percent),
and household real disposable incomes have
fallen, weakening consumption (Figure 1). To
reassert control over inflation, the central bank
quickly reduced the growth in monetary
aggregates which had a contractionary impact.
Public capital spending fell sharply in the first half
of 2016 as the new authorities reviewed the
quality of the ongoing projects with the goal of
eliminating waste and corruption. Further
headwinds arose from weak trading partner
demand, notably Brazil, and bad weather conditions. It is important to emphasize that the measures
that were taken were indispensable. While the exact form of the counterfactual is difficult to predict,
failing to address the unsustainable path that the Argentine economy was on would have led to
even worse outcomes that have been all-too-familiar to Argentina—potentially a run on local
currency assets, spiraling inflation, an abrupt fiscal adjustment as financing sources were exhausted,
and/or a depletion of foreign exchange reserves and balance of payments crisis.
10
20
30
40
50
Au
g-1
3
Oct-
13
De
c-13
Feb
-14
Ap
r-14
Jun
-14
Au
g-1
4
Oct-
14
De
c-14
Feb
-15
Ap
r-15
Jun
-15
Au
g-1
5
Oct-
15
De
c-15
Feb
-16
Ap
r-16
Jun
-16
Au
g-1
6
Monetary Aggregates
(Percent change, y/y, monthly averages)
Monetary base
M2
Sources: BCRA and Fund staff calculations.

ARGENTINA
INTERNATIONAL MONETARY FUND 9
Figure 1. Argentina: Effects of the Transition
Construction fell due to the brake on public works and
unfavorable weather, but there are signs of stabilization.
Motor vehicle production continued contracting, hurt
by a protracted recession in Brazil, Argentina's main
trading partner.
Inflation increased as a result of peso devaluation and
utility tariff adjustments.
Sources: Instituto Nacional de Estadística y Censos (INDEC), Asociación de Fabricantes de Cemento (ADFC), Ministerio de
Economía y Finanzas Públicas, Ministerio de Argricultura, Universidad Torcuato Di Tella (UTDT), provincial statistical office s,
Fundación de Investigaciones Económicas Latinoamericanas (FIEL), Confederación Argentina de la Mediana Empresa (CAME),
and Fund staff calculations.
Economic activity contracted in the first half of 2016.
-30
-20
-10
0
10
20
30
-30
-20
-10
0
10
20
30
Se
p-1
2
Mar-
13
Se
p-1
3
Mar-
14
Se
p-1
4
Mar-
15
Se
p-1
5
Mar-
16
Se
p-1
6
Cement domestic consumption (ADFC)
Construction activity (INDEC)
Indicators of Construction Activity
(Percent change, y/y)
-15
-10
-5
0
5
10
15
-50
-25
0
25
50
Se
p-1
2
Mar-
13
Se
p-1
3
Mar-
14
Se
p-1
4
Mar-
15
Se
p-1
5
Mar-
16
Se
p-1
6
Motor vehicle production (ADEFA)
Brazil: Industrial production (rhs)
Motor Vehicle Production
(Percent change, y/y)
-15
-10
-5
0
5
10
15
-15
-10
-5
0
5
10
15
Se
p-1
2
Mar-
13
Se
p-1
3
Mar-
14
Se
p-1
4
Mar-
15
Se
p-1
5
Mar-
16
Se
p-1
6Retail sales (CAME)
Supermarket sales, in real terms
Indicators of Consumption
(Percent change, y/y)
-15
-10
-5
0
5
10
15
30
40
50
60
70
Se
p-1
3
Mar-
14
Se
p-1
4
Mar-
15
Se
p-1
5
Mar-
16
Se
p-1
6
National consumer confidence (UTDT)
Real wages, y/y percent change (rhs)
Consumer Confidence and Real Wages
(50+=growth, unless otherwside indicated)
...driving down private consumption.Real wages have contracted, and consumer confidence
has declined...
0
5
10
15
20
0
10
20
30
40
50Se
p-1
3
Mar-
14
Se
p-1
4
Mar-
15
Se
p-1
5
Mar-
16
Se
p-1
6
City of Buenos Aires CPI
AR$/US$ exchange rate (rhs)
Inflation and Exchange Rate
(Percent change, y/y, unless otherwise indicated)
-15
-10
-5
0
5
10
-15
-10
-5
0
5
10
Au
g-1
2
Feb
-13
Au
g-1
3
Feb
-14
Au
g-1
4
Feb
-15
Au
g-1
5
Feb
-16
Au
g-1
6
FIEL - Industrial Production
INDEC - Monthly Estimator of Economic Activity
Indicators of Economic Activity
(Percent change, y/y, 3-month m.a.)

ARGENTINA
10 INTERNATIONAL MONETARY FUND
6. The authorities responded proactively to the downturn with a moderate fiscal stimulus
and a steady reduction in policy interest rates in the second half of 2016. Federal primary
spending fell by 8 percent in real terms in the first 7 months of 2016 as capital projects were
scrutinized, the irregular hiring of about
10,000 public employees was reversed, and utility
subsidies were reduced. This was despite an
increase in pensions,1 unemployment benefits, and
child benefits in the early days of the new
administration. By mid-year, efforts were being
taken to support the economy through public
infrastructure projects, transfers to provinces to
fund public works, further increases in pension
benefits (including the introduction of a universal
old-age pension) and unemployment subsidies, and
reducing the tax burden for small- and medium-
sized enterprises (Table). To further raise fiscal
resources, a tax amnesty program was announced
with a 10 percent one-off tax charged on resources
declared under the amnesty. Finally, the central bank
lowered the policy rate (on 35-day central bank
paper) from 45 to 31 percent, in effective terms, as
forward-looking indicators of inflation began to fall,
maintaining the ex-ante real interest rate in a range
between 3 and 6 percent (with ex-post rates
exhibiting strong volatility but trailing on average
below ex-ante rates since early 2016). As of early
October, inflation expectations for December
2017 were slightly above next year’s target band
(12–17 percent).
1 In compliance with past rulings of the Supreme Court, the June 2016 “Ley de Reparacion Historica” recognized a
debt to current retirees derived from the incorrect calculation of initial benefits and the improper application of the
indexation mechanism starting from 2002. The law also introduced a universal old-age pension that extended
pensions to all those 65 years and older without a contributory pension.
-15
0
15
30
45
60
Jan
-16
Feb
-16
Mar-
16
Ap
r-16
May-1
6
Jun
-16
Jul-
16
Au
g-1
6
Se
p-1
6
Oct-
16
No
v-1
6
De
c-16
Ex-ante real policy rate
Policy rate (35d LEBAC; effective annual rate)
Sources: BCRA, Consensus Forecast, and Fund staff calculations.
1/ Expectations: Consensus until June, BCRA's REM since July.
Policy Rate and Inflation Expectations
(Percent)
1-month inflation
expectation (annualized) 1/
-30
-20
-10
0
10Jan–July average August
Sources: Ministerio de Hacienda, INDEC, and Fund staff
calculations.
Real Growth of Federal Primary Expenditures
(Percent change, y/y)

ARGENTINA
INTERNATIONAL MONETARY FUND 11
Argentina: Fiscal Policy Measures
2016 2017
Export tax cut December 2015 Elimination of export taxes on all products except soy products and
leather. Cut in soy export tax rate by 5 percentage points.0.6 0.3*
VAT tax cut January 2016 VAT tax rebate on basic staples for low income households. 0.2 0.1*
Income tax reform January 2016 Increase in minimum taxable income to AR$30,000 per month. 0.9 0.8*
Pension package May 2016
• Retroactive payment of AR$83 billion to litigating pensioners over 4
years, with half the amount paid in cash in H2 2016 and the remainder
paid in equal portions between 2017 and 2019; to be financed below
the line through the sale of FGS assets.
• Increase in monthly pension of ½ million litigating pensioners by 45
percent, and of 2 million non-litigating but eligible pensioners by 35
percent, amounting to a projected increase in pension flows of AR$7
billion in 2016 and AR$60 billion in 2017.
• Introduction of a universal pension to all seniors 65 years and older,
equivalent to 80 percent of the minimum pension.
0.1 0.6
Increase in AUH child
subsidiesJanuary 2016 Expansion of beneficiaries of AUH child allowance to include children
of monotributistas.0.1
Increase in unemployment
benefitsJune 2016 Increase in unemployment benefits from AR$400 per month to
AR$3,000 per month for about 60,000 people.0.01
Subsidy for oil exports in
ChubutFebruary 2016
Subsidy of US$10 per barrel for oil exports, of which US$7.5 covered
by the federal government and US$2.5 by Chubut, effective for 6
months, in order to induce oil companies in area to normalize drilling
operations and avoid layoffs.
0.05
Subsidy for dairy farmers February 2016 Payment of AR$0.40 per liter for the first 3,000 daily liters of milk
produced in October-December 2015.0.01
Increase in coparticipation
transfers to provincesJanuary 2016
Repeal by Supreme Court of 15 percent tax coparticipation by
provinces, earmarked to finance ANSES, and one-time increase in
coparticipation transfers to City of Buenos Aires (offset by cut in
federal spending on police).
0.2 0.2
Increase in capital
expenditureJanuary 2016 Increase in capital expenditure towards infrastructure projects at the
federal and provincial level.0.2
Promotion regime for
SMEsJuly 2016
Tax incentive program for SMEs, including: (i) elimination of the
presumptive income tax (ganancia minima presunta ); (ii) income tax
deduction equivalent to 10 percent of new investments; and (iii) 90-day
deferral for VAT payments.
0.1
Reduction in energy
subsidies and introduction
of tarifa social
December 2015,
August 2016
In February 2016, 245 percent weighted average increase in electricity
tariffs for corporate and residential users across the country, relative
to September 2015. In April 2016, 166 percent weighted average
increase in natural gas tariffs for corporate and residential users
across the country, relative to November 2015. Tarifa social
introduced for low-income segments of the population, in addition to
150 kWh of free electricity per month for poor households. Public
transport tariffs also increased, with uncertain fiscal savings given
increased fuel cost to government for service provision. In August
2016, the Supreme Court ruled for a reversal of the increase in
residential natural gas tariffs, bearing a fiscal cost of about 0.2
percent of GDP in 2016. The government has since announced a 3-
year plan to phase out natural gas tariffs by 2019, with the exception
of the tarifa social that will be maintained. The estimated fiscal savings
in 2017 amount to ½ percent of GDP.
1.8 1.0
Increase in spending
efficiencyDecember 2015
Increase in efficiency of government expenditure in areas deemed
inefficient, including through the elimination of 11,000 improperly
hired public sector employees.
0.8
Tax amnesty May 2016Tax amnesty program for undeclared funds, with varying tax levels
depending on amount of funds declared, and options to invest in
government bonds of varying tenors in lieu of paying tax.
0.3
Reduction in provincial
transfersOctober 2016 Reduction in discretionary tranfers to provinces, included in Budget
2017.0.5
Sources: Ministerio de Hacienda and Fund staff estimates.
* These estimates represent the forgone revenue or savings from the measures implemented in 2016; they are not new measures.
Impact (percent of GDP)DescriptionAnnouncement dateMeasure

ARGENTINA
12 INTERNATIONAL MONETARY FUND
7. The trade balance has returned to a small surplus so far in 2016. The devaluation and
the removal of trade restrictions incentivized agricultural producers to sell previously accumulated
stocks but adverse weather conditions, weak
external demand (notably in Brazil), and lower
commodity prices meant that exports were still
about 2 percent lower in the first eight months of
2016 than in the equivalent period in 2015 (despite
stronger volume growth). The cross-currents from
the removal of restrictions on imports, on the one
hand, and the depreciation, weak demand, and
lower import prices, on the other, left import
growth at relatively high levels. The resolution with
holdout creditors and a rebound in dividend
payments to offshore parent companies (as FX
restrictions were lifted) resulted in a modest
worsening in the net income account (on a cash basis).
8. Capital inflows have maintained the peso within a narrow, market-determined range
versus the U.S. dollar. Residents took advantage of the removal of FX restrictions by moving assets
abroad in 2016 but these outflows were more-than-offset by public sector external debt issuance.
FDI inflows increased modestly (US$1.8 billion in
the first nine months of the year, on a cash basis).
With a stable nominal exchange rate, the high
inflation has appreciated the real exchange rate by
10 percent since the unification of the exchange
rate. The external position is judged by staff to be
moderately weaker than implied by medium-term
fundamentals and desirable policies (Box 2 and
Annex I). The authorities have maintained their
commitment to a floating exchange rate
arrangement, while building reserves
opportunistically, mostly through the proceeds of
external debt issuances by the sovereign.
-2
-1
0
1
2
3
0
2
4
6
8
Feb
-14
May-1
4
Au
g-1
4
No
v-1
4
Feb
-15
May-1
5
Au
g-1
5
No
v-1
5
Feb
-16
May-1
6
Au
g-1
6
Goods Trade
(Billions of U.S. dollars, NSA)
Trade balance (rhs)
Exports
Imports
Sources: INDEC and Haver Analytics.
-12
-9
-6
-3
0
3
6
9
12
20
14
Q2
20
14
Q3
20
14
Q4
20
15
Q1
20
15
Q2
20
15
Q3
20
15
Q4
20
16
Q1
20
16
Q2
20
16
Q3
Tho
usa
nd
s
Balance of Payments Flows
(Billions of U.S. dollars)
Current account
Financial and Capital account
Reserve accumulation
Sources: BCRA and Fund staff calculations.

ARGENTINA
INTERNATIONAL MONETARY FUND 13
9. Argentina’s financial system appears resilient to the ongoing macroeconomic
transition. Argentina’s financial system is mostly transactional and has generally low exposure to
credit or exchange rate risk. Banks are well capitalized (total and tier 1 capital ratios are well
above regulatory minimums at 16.2 and 15.3 percent, respectively, as of June 2016), have low
non-performing loans (under 2 percent), and relatively large provisions (above 140 percent of
nonperforming loans). The liquidity position of the banks appears comfortable, with the liquidity
coverage ratio in 2016 well exceeding the minimum set by the Basel Committee. Currency
Box 2. Current Accounts and Exchange Rate
Exchange rate and current account developments. Tight controls on balance of payments flows
and high inflation caused the real effective exchange rate (calculated using the City of Buenos Aires
CPI) to become overvalued by an estimated
50 percent in November 2015. While the
removal of FX restrictions in mid-December
2015 resulted in an immediate 40 percent
devaluation of the peso, as of August 2016
the real effective exchange rate (REER) was
about 10 percent above its early 2016 level.
Despite extensive trade and FX restrictions,
Argentina’s current account balance
deteriorated from near balance in 2012 to
-2½ percent of GDP in 2015, reflecting falling
commodity prices, strong domestic demand,
the real appreciation of the peso, and the
sharp worsening of the energy trade balance.
Current account and REER assessment. Although there is considerable uncertainty about any
estimated range, the real exchange rate appears modestly above the level implied by medium-term
fundamentals and desirable policies. The CA-regression approach of External Balance Assessment
(EBA) yields a cyclically-adjusted CA norm of about -1 percent of GDP. The desirable fiscal stance
subsumed in this estimate is based on a reduction of the overall general government fiscal deficit by
about 4 percent of GDP over the medium term (consistent with the authorities’ announced fiscal
consolidation plans and staff’s baseline). The assessment also assumes an increase in the FX reserves
over the medium term to around US$70 billion. With a 2016 cyclically-adjusted CA deficit of about
2¾ percent of GDP, the current account gap is estimated to be about -1½ percent of GDP. To a
considerable extent, this CA gap is explained by the fiscal and FX reserves policy gaps. The external
stability (ES) approach suggests that
the current account balance needed to
stabilize the net IIP position to staff’s
estimated steady-state value is about
-¾ percent of GDP (see Selected Issues
Paper, Chapter 7). Using an estimated
elasticity of the current account to
changes in the real exchange rate of
0.13 suggests that the REER is
overvalued by around 12–15 percent.
40
60
80
100
120
140
160
19
98
M8
20
01
M8
20
04
M8
20
07
M8
20
10
M8
20
13
M8
20
16
M8
Real Effective Exchange Rate
(Index, historical average=100)
Sources: Haver Analytics, BCRA, and Fund staff estimates.
Appreciation
Exchange Rate Assessment Tools
(Percent of GDP unless otherwise indicated)
Level 'Norms' CA gap REER gap
2016 (percent)
ES approach
Cyclically-adjusted CA -2.7 -0.8 -2.0 15.0
EBA-lite
Cyclically-adjusted CA -2.7 -1.1 -1.6 12.3
Source: Fund staff estimates.

ARGENTINA
14 INTERNATIONAL MONETARY FUND
mismatches are low and banks have an aggregate
net long FX position which limits risks from a sudden
currency depreciation.2 Corporate leverage is
generally low since companies mostly lacked access
to external funding and the domestic financial
system is small. Household debt is also relatively
low.
10. The administration’s approval ratings
remain high although the political climate is
becoming more challenging. Despite the economic
recession, the government’s approval rating remains
above levels seen during the previous
administration, and is one of the highest in Latin
America. However, the government does not have
a majority in Congress, and passage of legislation
is likely to become increasingly complex in the run-
up to the October 2017 congressional and
gubernatorial elections. A weak economy and high
poverty rates are likely to influence the
congressional discussion of the 2017 Budget, and
high inflation is likely to be at the forefront in the
next round of collective wage negotiations (that is
about to get underway).
OUTLOOK AND RISKS
11. The economy is expected to emerge from recession in late 2016 as the one-off impact
of the initial measures to remove macroeconomic distortions begins to fade. Staff is now
forecasting growth of -1¾ percent for 2016 as a whole rising to 2¾ percent in 2017, one of the
largest growth turnaround in the October 2016 World Economic Outlook. A modest headwind from
the planned reduction of the fiscal deficit should be offset by a pickup in private consumption, an
improving external environment, and a rebound of private investment. Over the medium term,
growth is expected to average around 3 percent as reforms are put in place to strengthen the
business environment, encourage investment, lower inflation, and restore order to fiscal finances.
However, data challenges and the uncertain process of Argentina’s transition away from its
previously unsustainable path create significant uncertainty in the outlook.
2 Banks’ gross FX position is also low as it represents around 17.6 percent of assets and 17.7 percent of liabilities
(data as of July 2016). Much of the FX assets are very liquid (deposits at the BCRA and cash), with 29.3 percent
corresponding to FX loans. But banks can only grant FX loans to those who actually have FX income (mainly
exporters) which significantly reduces risks from a depreciation of the peso.
0.0
0.5
1.0
1.5
2.0
2.5
3.0
3.5
0
20
40
60
80
Jun
-05
Jun
-06
Jun
-07
Jun
-08
Jun
-09
Jun
-10
Jun
-11
Jun
-12
Jun
-13
Jun
-14
Jun
-15
Jun
-16
Presidential approval rating
Confidence in government index (rhs)
Sources: UTDT and Poliarquia.
Government Approval Rating and Confidence
in Government Index
0
50
100
150
200
Arg
en
tin
a
Peru
Co
lom
bia
Bra
zil
Ch
ile
Ru
ssia
Po
lan
d
Ind
ia
Ch
ina
Ge
rman
y
US
A
Gre
ece UK
Italy
Jap
an
Sp
ain
Fra
nce
Po
rtu
gal
Belg
ium
Ire
land
Corporate Debt
(Percent of GDP) 1/
Avg. Latin America
Avg. other emerging markets
Avg. advanced economies
Source: BCRA.
1/ Data as of 2014, except Argentina as of Dec-2015 (estimated).

ARGENTINA
INTERNATIONAL MONETARY FUND 15
12. Inflation will continue to decline at a slow pace due to a relatively high degree of
inertia in the determination of wages and prices. Inflation has decelerated sharply since its peak
in April, as the pass-through from the exchange rate depreciation and the effects of the tariff
adjustment have dissipated. In August and September 2016, official headline inflation was affected
by the reversal of the increase in natural gas tariffs, which subtracted about 0.7 percentage points to
the index values in both months. Core inflation continued to decline and reached 1½ percent (m/m)
in September, consistent with about 20 percent
annual rate. However, collective wage bargaining is
still likely to inject a backward-looking element into
the determination of nominal wages, and this
nominal inertia is expected to slow the pace at
which inflation falls (Box 3). Headline inflation is
forecast to fall to 20 percent by end-2017—
assuming nominal wage increases can be held to
around 25 percent and energy subsidies are scaled
back in line with the budget assumptions—and to
single digits by 2021. A faster pace of disinflation
appears unadvisable given the significant impact on
growth that would accompany such a path for inflation.
13. The primary federal deficit is expected to fall to 4½ percent of GDP in 2017, a close to
neutral fiscal stance in cyclically adjusted terms. Based on the authorities’ budget plans, in 2017
spending on pensions and public works is expected to be more than offset by a 1 percent of GDP
reduction in transfers to the private sector (half of
which reflects lower energy subsidies) and a
½ percent of GDP cut in discretionary transfers to
provinces. At 4½ percent of GDP, staff’s forecast of
the federal primary deficit is modestly higher than
the deficit in the proposed 2017 Budget
(4.2 percent of GDP) due to differences in
macroeconomic projections. After 2017, the
primary federal deficit is expected to improve by
around ¾ percent of GDP per year, a result of an
elimination of energy subsidies by 2019 and lower
spending on goods and services and other current
spending. Gross debt of the federal government is projected to fall slowly (from 52 percent in 2015
to 48 percent of GDP by 2021), reflecting the lower deficit and the projected real appreciation of the
peso. Despite this adjustment, the gross fiscal financing needs in 2017 are around 11 percent of
GDP, which are expected to be met through an increase in external debt, central bank financing of
-8
0
8
16
24
32
40
48
-2
0
2
4
6
8
10
12
No
v-1
5
De
c-15
Jan
-16
Feb
-16
Mar-
16
Ap
r-16
May-1
6
Jun
-16
Jul-
16
Au
g-1
6
Se
p-1
6
Oct-
16
No
v-1
6
De
c-16
20
16
20
17
20
18
20
19
City of Buenos Aires INDEC
IMF IMF y/y (rhs)
Core City of Buenos Aires Core INDEC
Authorities' targets y/y (rhs)
Inflation
(Percent, m/m unless otherwise indicated)
Sources: INDEC, Government of the City of Buenos Aires, and
Fund staff calculations and estimates.
-2
-1
0
1
2
3
2015 2016 2017 2018 2019 2020 2021
Federal Government: Fiscal Impulse
(Percent of GDP)
Sources: Ministerio de Hacienda and Fund staff estimates.
Stimulus
Consolidation

ARGENTINA
16 INTERNATIONAL MONETARY FUND
Box 3. Inflation, Expectations, and Wages
Some stylized facts. Nominal wages grew
at a much faster pace than inflation after the
2001 crisis, allowing real wages to return to
pre-crisis levels by 2005. Since then, real
wages have been relatively sticky despite
recessions in 2009 and 2012. Persistently
high inflation and inflation expectations
have added to nominal inertia with a wage
setting system that is characterized by
extensive sectoral wage bargaining and a
de-facto high level of wage indexation,
despite the lack of formal backward
indexation.
An inflation model. Estimating a small
macroeconomic model for Argentina reveals a relatively high degree of persistence in nominal wage
growth, inflation, and inflation expectations. Real wages appear to respond relatively weakly to
changes in real activity:
�̇�𝑡 = 0.51�̇�𝑡𝑒 + 0.47�̇�𝑡 − 0.37𝑟𝑡 + 𝜖�̇�,𝑡
�̇�𝑡𝑒 = 5.4 + 0.57�̇�𝑡−1
𝑒 + 0.12�̇�𝑡 − 0.41𝑟𝑡 + 𝜖�̇�𝑒,𝑡
�̇�𝑡 = 0.96�̇�𝑡−1 + 0.13𝑔𝑡 + 𝜖�̇�,𝑡
where �̇�𝑡 is inflation rate, �̇�𝑡𝑒 inflation expectations, �̇�𝑡 nominal wage growth, 𝑟𝑡 the real interest rate,
𝑔𝑡 GDP growth, �̇�𝑡 the exchange rate appreciation, and ϵ are shocks.
Model performance and forecasts. The
estimated model seems to fit relatively well
Argentina’s inflation dynamics over the last
decade. Simulating the model forward, shows
inflation declining from 39 percent at
end-2016 to 20 percent in 2017. This would be
accompanied by a further 3¾ percent real
appreciation of the peso and 2.7 percent
growth in 2017. Using this same model,
reducing inflation to 17 percent by end-2017
(the upper end of the central bank’s target
band) would require a 400 basis point increase
in the path of real interest rates during the
course of this year and next, and would result
in a one percentage point lower growth in real
activity in 2017 relative to staff’s baseline.
0
5
10
15
20
25
30
35
40
De
c-03
Se
p-0
4
Jun
-05
Mar-
06
De
c-06
Se
p-0
7
Jun
-08
Mar-
09
De
c-09
Se
p-1
0
Jun
-11
Mar-
12
De
c-12
Se
p-1
3
Jun
-14
Mar-
15
De
c-15
Wages
Inflation
Inflation Expecations (UTDT)
Inflation and Wages
(Percent change, y/y 4-quarter m.a.)
Sources INDEC, Haver Analytics and Fund staff calculations.
0
10
20
30
40
50
20
06
Q4
20
07
Q4
20
08
Q4
20
09
Q4
20
10
Q4
20
11
Q4
20
12
Q4
20
13
Q4
20
14
Q4
20
15
Q4
20
16
Q4
20
17
Q4
20
18
Q4
20
19
Q4
Inflation Model for Argentina
(Percent change, y/y)
Actual inflation
Model inflation
Source: Fund staff estimates.
Proj.

ARGENTINA
INTERNATIONAL MONETARY FUND 17
1½ percent of GDP, and domestic
debt issuance. Gross fiscal
financing needs are expected to
remain substantial over the
medium term, averaging
8½ percent of GDP in 2018–19.
14. The current account
deficit is expected to rise
steadily to 4¼ percent of GDP
by 2021. A steady appreciation in
the real effective exchange rate,
relatively flat terms of trade, and
the swing to sustained growth are
expected to add to the current
account deficit. This is expected to
be financed by higher public debt
issuance, some repatriation of
offshore funds in 2016–17 (to take
advantage of the tax amnesty), and a rise of inward FDI. The central bank is expected to steadily
accumulate international reserves from current low levels (to 100 percent of the IMF’s reserve
adequacy metric by mid-2018). The reserve accumulation will be largely as a result of converting the
proceeds of government external debt issuance into pesos, consistent with the authorities’
commitment to let the exchange rate float freely under the inflation targeting (IT) regime.
15. The outlook is subject to a greater than usual degree of uncertainty but risks appear
broadly balanced around the baseline. Argentina is in a process of significant transition to a more
market-based economic framework and is simultaneously working to rebuild the statistical
information about their economy. The lack of a reliable statistical time series for certain data and the
unpredictable consequences of changes in relative prices, the removal of distortions, and a
reopening of the economy to international capital flows all add to the uncertainty around future
economic outcomes.
16. Upside risks. Staff’s baseline scenario is subject to a number of upside risks (Risk
Assessment Matrix Table):
A faster rebound in private investment. Argentine companies have relatively low levels of
leverage and have neglected investing in new capacity and technologies over the past several
years (in large part due to the distortions and policy interventions that the economy faced).
Indeed, as of 2015, investment in Argentina is the lowest as a share of output when compared to
other economies in Latin America. Under staff’s baseline, the investment rate is expected to pick
up gradually over time, consistent with a study of past cases of investment rebounds in
Macroeconomic Assumptions
(Percent change)
2015 2016 2017 2018 2019
Real GDP growth
Fund staff 2.5 -1.8 2.7 2.8 2.9
Authorities 2.4 -1.5 3.5 3.5 3.5
Total consumption
Fund staff 4.1 -1.8 2.3 2.7 2.7
Authorities 5.3 -0.9 3.5 3.6 3.7
Investment
Fund staff 4.2 -3.6 8.2 7.2 7.2
Authorities 5.5 -3.5 14.4 9.5 7.6
Exports
Fund staff -0.6 4.5 4.4 4.8 3.8
Authorities -0.4 6.9 7.7 6.0 5.2
Imports
Fund staff 5.6 1.3 6.8 7.6 6.3
Authorities 5.5 10.2 9.8 8.4 8.5
Total consumption deflator (average)
Fund staff 25.6 38.0 24.5 19.1 15.3
Authorities 24.7 35.2 19.4 13.9 8.3
Sources: Fund staff estimates and 2017 Budget proposal.

ARGENTINA
18 INTERNATIONAL MONETARY FUND
advanced and emerging economies, indicating that these rebounds generally take time to build
and coincide with an improvement in the fiscal position (see Chapter 1 of the Selected Issues
Paper). However, with Argentina re-
establishing itself in international markets
and with the important efforts to remove
domestic distortions already taken this year,
private investment (largely financed from
abroad and in both tradable sectors and
domestic infrastructure) could prove to be
much stronger than is assumed in the
baseline. This would imply less need for fiscal
support to growth and more room for
maneuver to both reduce the fiscal deficit
and to disinflate the economy with relatively
modest output costs.
A more successful tax amnesty. Increased disclosure and information sharing requirements across
tax jurisdictions have the potential to create strong incentives to declare assets under the tax
amnesty. This would lead to more tax revenues and, insofar as offshore funds of residents are
repatriated into government bonds, would meet some of the budget financing needs.
A stronger than expected recovery in Brazil. The October 2016 World Economic Outlook assumes
Brazil’s growth to rebound to 0.5 percent in 2017 after the 3.3 percent contraction in 2016. Brazil
accounts for about 20 percent of overall Argentina’s exports and 50 percent of its manufacturing
exports, so each 1 percentage point increase in Brazil’s growth above the 2017 forecast would
add an estimated ¼ percentage points to Argentina’s growth.
17. Downside risks. The gradual pace at which macroeconomic imbalances are resolved leaves
Argentina vulnerable to both domestic and external shocks:
A tightening of external financial conditions. Given the significant gross external borrowing needs
of the government, an exogenous tightening of global capital markets could prove very
disruptive. At best, a higher cost of financing would worsen debt dynamics and necessitate a
stronger fiscal correction over the medium term. At worst, a sudden stop to external borrowing
(e.g., owing to higher global risk aversion) could create financing shortfalls. With limited
recourse to domestic financing, this could necessitate a more front-loaded fiscal adjustment at a
time when external demand would also likely be weakening. Such a downside would create
depreciation pressures on the currency and cause the central bank to react procyclically to
contain inflation. The relatively high share of short-term foreign currency debt in a few
non-financial private sector industries also poses rollover risks (see Annex I).
10
14
18
22
26
20
00
20
02
20
04
20
06
20
08
20
10
20
12
20
14
20
16
20
18
20
20
Gross Fixed Capital Formation
(Percent of GDP, current prices)
Uruguay PeruMexico ColombiaBrazil ArgentinaChile
Sources: IMF, World Economic Outlook and Fund staff calculations.

ARGENTINA
INTERNATIONAL MONETARY FUND 19
Risk Assessment Matrix1/ Relative
Likelihood
High
A reassessment of global risk leads to portfolio rebalancing, lowering
capital flows into risk assets, including EMs. This would limit
availability of funding of Argentina's fiscal needs through external
bond issuances and repatriation of funds by non-bank domestic
private sector. Domestic financial sector's funding could increase, but
given its small size it would not be able to meet the gross financing
needs of the federal government (11 percent of GDP in 2017).
Tighter global financial conditions and
limited capital inflows would require a more
accelerated reduction of the fiscal deficit.
Medium
Upward pressures on inflation emerge because of higher wage
growth and/or higher persistence in inflation and/or stronger second
round effects from increase in tariffs. The currency could become
more overvalued, and expectations of a future depreciation might
increase, which would fuel inflation expectations and lower the
demand for the peso.
Facing a wage-price spiral and the risk of a
run on the peso, the central bank should
react by increasing interest rates. A faster
reduction of the fiscal deficit may also be
needed to immediately reduce inflationary
pressures.
High
Continued appreciation of the currency leads to a worsening of the
current peso misalignment, a deterioration of the external position,
and renewed bouts of balance of payments pressures. A sharp
devaluation of the currency realigns the currency and alleviates the
pressures, leading to a jump in inflation and an immediate
contraction of economic activity with high social costs, as
household’s purchasing power is reduced. High FX exposure of the
public sector can lead to a spike in public sector debt and financing
difficulties.
The central bank would need to increase
interest rates to defend the peso, while fiscal
policy could be tightened and re-oriented to
protect the most vulnerable segments of
society at zero cost for the budget (for
example, though a faster elimination of
energy subsidies, using the resources to fund
means-tested transfers).
Medium
Weaker activity in China would impact Argentina primarily through
trade channels, including through a negative impact on the terms of
trade, as commodity prices would fall. This would affect especially
soy sector, as about 3/4 of Argentina's soybean exports is destined to
China. Staff estimates suggest that a 1 percentage point decrease in
China's growth would lower Argentina's export growth by 0.4–0.7
percentage points. Slower growth in China would also affect
Argentina indirectly, through its negative impact on the region,
particularly on Brazil.
‧ The depreciation of the peso would help
the economy adjust to the terms of trade
shock.
‧ If needed, monetary and fiscal policy
stances could be relaxed (fiscal policy could
be re-oriented to protect the most vulnerable
segments of society).
‧ The authorities could accelerate structural
reforms to increase export competitiveness
and diversification.
High
Private investment and FDI could be higher than expected reflecting
stronger confidence effect. Also, export growth could be stronger
reflecting more positive impact of current and capital account
liberalization. A combination of stronger investment and exports
could boost growth to 4½ percent in 2017, if private investment
increases by at least one standard deviation of its historical average.
‧ The authorities could take advantage of the
stronger GDP path to accelerate the pace of
reduction of the fiscal deficit and to
implement supply-side reforms, especially
those that entail short-term costs, like
elimination of subsidies and other forms of
protection to specific sectors of the
economy.
High
A stronger recovery of Brazil would have important positive spillover
effects on Argentina's economy. The Brazilian market is especially
relevant for Argentine industrial exports. More than 45 percent of
exports of industrial manufactures go to Brazil. Staff estimates
suggest that a 1 percentage point increase in Brazil's growth would
boost Argentina's export growth by 0.7 percentage points, and has a
peak impact of ¼ percent on Argentina's growth.
‧ The authorities could take advantage of the
stronger GDP path to accelerate the pace of
reduction of the fiscal deficit and to
implement supply-side reforms, especially
those that entail short-term costs, like
elimination of subsidies and other forms of
protection to specific sectors of the
economy.
High
Based on a comparison of past experience in Argentina and abroad, it
is assumed that US$30 billion of wealth is declared, generating US$1.9
billion in additional tax revenues and US$2.6 billion in budgetary
financing. However, increased disclosure and information sharing
requirements in foreign banks, particularly in Europe, have the
potential to significantly increase the incentive to declare funds. More
optimistic estimates range between US$40–100 billion. In such an
upside scenario, there would be a pick up in fiscal revenues and less
need for government debt issuance. The smaller crowding out of the
private sector could lead to greater private investment and growth.
‧ The authorities could take advantage of
greater fiscal revenues and stronger GDP
growth to accelerate the pace of reduction of
the fiscal deficit and to implement supply-
side reforms, especially those that entail short-
term costs, like elimination of subsidies and
other forms of protection to specific sectors
of the economy.
Source of Risks Expected Impact Policy Response
Tighter and more
volatile global
financial
conditions
Medium
Downside Risks
Stronger recovery
in BrazilMedium
1/ The Risk Assessment Matrix (RAM) shows events that could materially alter the baseline path (the scenario most likely to materialize in the view of IMF staff).
The relative likelihood is the staff’s subjective assessment of the risks surrounding the baseline (“low” is meant to indicate a probability below 10 percent,
“medium” a probability between 10 and 30 percent, and “high” a probability between 30 and 50 percent). The RAM reflects staff views on the source of risks
and overall level of concern as of the time of discussions with the authorities. Non-mutually exclusive risks may interact and materialize jointly.
Higher and more
persistent inflation Medium
Significant China
slowdown
Low (in the
short run)
Stronger rebound
of private
investment and
exports due to a
more positive
impact of
liberalization
measures
Medium
Medium
A sudden
depreciation of the
currency
Upside Risks
HighA more successful
tax amnesty

ARGENTINA
20 INTERNATIONAL MONETARY FUND
A sudden depreciation of the currency. The continued real appreciation of the peso under staff’s
baseline could make the economy vulnerable to an abrupt correction of a currency
misalignment. In Argentina’s own history,
episodes of a persistently overvalued real
exchange rate have eventually led to a sharp
devaluation of the currency. Such a sudden
correction could lead to a contraction of economic
activity and high social costs, as the resulting jump
in inflation reduces household’s purchasing
power. While the low FX exposure of Argentina’s
private sector limits the risk of severe balance
sheet effects, the significant (and increasing) FX
exposure of the public sector poses a risk to the
public debt dynamics. For example, a 10 percent
depreciation of the real exchange rate would add
about 3½ percent of GDP to the public debt.
Higher and more entrenched inflation. Higher nominal wage increases in the forthcoming
collective wage negotiations and second-round effects from the increase in utilities tariffs that
are scheduled to be implemented would add to inflationary pressures. This could translate into
increased concerns about macroeconomic stability, including through a loss of international
competiveness, and potentially trigger capital outflows and downward pressure on the currency.
Monetary policy would need to react to re-establish a nominal anchor which could further eat
into economic activity.
18. Authorities’ view.
GDP growth in 2017–19 is expected to accelerate more strongly than in staff’s baseline.
Investment and export growth are expected to rebound more rapidly than assumed by staff. The
reforms taken in 2016 amount to a significant total factor productivity shock, and are expected
to generate a significant rebound of economic activity, reversing the decrease of potential
output and income per capita over the past decade.
Inflation. Reaching the inflation target 12–17 percent at end-2017 does not look ambitious, as
inflation expectations are now at levels consistent with year-over-year inflation being quite close
to the central bank’s (BCRA’s) target next year. The authorities noted that the current monetary
policy stance is adequate to lower inflation to the target range and that expectations are likely
to become more forward-looking as wage and price setters increasingly understand the BCRA’s
strong commitment to achieve the announced inflation targets. They also noted that the
increase in nominal wages needed to stabilize real wages at last year level varies across sectors.
A lower cost of capital and a better economic environment make up space for real wage
increases. In short, the authorities do not see a risk to their disinflation path stemming from
wage negotiations.
40
45
50
55
60
65
70
2014 2015 2016 2017 2018 2019 2020 2021
Baseline No adjustment
Constant REER
Federal Government Gross Debt
(Percent of GDP)
Sources: Ministerio de Hacienda and Fund staff estimates.

ARGENTINA
INTERNATIONAL MONETARY FUND 21
Exchange rate. The authorities are confident that the adoption of an IT monetary policy regime
with freely floating exchange rate will minimize the risk of currency misalignment as experienced
in the past. A strong currency should not deter the rebound of investment, given the improved
business conditions, productivity enhancing measures, and the abundance of capital at a time
where there is excess saving at a global level.
Risks. The authorities view the risks to their outlook as mostly on the upside. Removing the
pervasive distortions that were affecting trade and investment has the potential to generate an
ever sharper rebound of productivity and investment, which means there is a large upside risk to
their growth projections.
RESTORING THE FOUNDATIONS FOR SUSTAINED
GROWTH AND JOB CREATION
A. Fighting Inflation
19. Bringing inflation to a single-digit level is a key priority. The BCRA has managed well the
transition to an inflation targeting regime under difficult circumstances, and reconfirmed in
September 2016 the inflation targets that were announced early in the year. The pace at which this
disinflation is achieved should remain flexible and adapt to circumstances as they unfold, remaining
conscious of the economic costs and, particularly, the distributional impact. For example, if inflation
inertia remains high, lowering inflation to 5 percent by 2019 could result in sizable output losses
(Box 4, and Chapter 4 of the Selected Issues Paper). This is why past episodes of transition from
moderately high to single-digit inflation generally occurred over a longer period of time (Box 5 and
Chapter 5 of the Selected Issues Paper).
20. To support the central bank’s disinflation efforts, building credibility in the monetary
framework will be essential and will serve to lessen the economic and social costs in lowering
inflation. Creating robust institutional foundations for monetary policy based on inflation forecast
targeting would help build credibility over time and allow price formation to gradually become more
forward-looking, lessening the cost of disinflation and lowering the inflation premium that is
currently built into the domestic yield curve. The announced establishment of a six-member
Monetary Policy Council led by the BCRA Governor and the planned adoption (from January 2017)
of the 7-day repo rate as the policy rate are positive developments.3 Other steps that should be
taken immediately to strengthen the institutional underpinnings for monetary policy include (see
Selected Issues Paper, Chapter 5):
Establishing a clear price stability mandate for the central bank with operational independence;
3 The BCRA will conduct liquidity management and introduce standing facilities in connection with the 7-day policy
rate.

ARGENTINA
22 INTERNATIONAL MONETARY FUND
Eliminating central bank financing of the fiscal deficit;
Moving to less frequent decision points for the policy rate as macroeconomic conditions
stabilize (currently rate decisions are taken on a weekly basis); and
Continuing to build credibility in Argentina’s inflation statistics.
Box 4. Inflation Inertia and the Cost of Disinflation
Reducing inflation to a single digit is an essential step to achieve a more efficient allocation of resources,
increase savings, reduce income inequality, and ultimately boost the long-term growth potential of
Argentina’s economy. Disinflation processes, however, can also have short-term costs on economic activity,
which in a large part depend on the credibility of the monetary authorities and the degree of nominal inertia
in the economy, or the extent to which wages and prices are set in a forward-looking manner (Blanchard,
1998).1 Using a small macroeconomic model estimated on Argentine data (see Selected Issues Paper,
Chapter 4) allows establishing a quantitative link between the degree of nominal inertia in wage and price
determination and the output cost of disinflation. With a coefficient on past inflation in the Phillips curve of
0.7, a model simulation bringing inflation from its level in Q1:2016 (33 percent, y/y, based on the City of
Buenos Aires CPI) to 5 percent would require real interest rates to peak at 12 percent during the first year,
resulting in a cumulative output loss over three years of slightly above 10 percent of potential GDP.
However, if a greater weight was placed on
forward-looking inflation, the output losses
in the same model could be significantly
smaller. For example, if the coefficient on
lagged inflation in the Phillips curve was
0.5, this would reduce the needed
increase in real interest rates by more than
6 percentage points and would halve the
3-year output costs of bringing inflation
down to about 5 percent in the model
simulation. These results confirm that
building credibility about the inflation
targets and convincing economic agents to
place greater weight on forward-looking
inflation in the process of wage and price
determination could significantly reduce
the short-term output cost of disinflation.
_____________________
1/ Olivier Blanchard, “Optimal speed of disinflation: Hungary”, (1998), in “Moderate Inflation: The Experience of Transition
Economies” edited by Carlo Cottarelli and Gyorgy Szapary, IMF and National Bank of Hungary.
0 5 10 15
Real interest rate
Output loss
Real interest rate
Output loss
(Percent)
Source: Fund staff estimates.1 Maximum annual real interest rate and 3-year cumulative output losses
(expressed as percent of potential GDP) in a simulation where inflation is
reduced from its level in Q1:2016 to 5 percent using the model described
in Chapter 4 of the Selected Issue Papers. The inflation path in the two
scenarios is forced to be the same.
Inertia 0.7
Inertia 0.5
Output Cost of Disinflation and Inflation Inertia1

ARGENTINA
INTERNATIONAL MONETARY FUND 23
Box 5. Lessons from Past Episodes of Disinflation
Moderate inflation episodes. A sample of
35 episodes of moderate inflation (between 10 and
40 percent, y/y) reveals that, for the bulk (30 cases) it
took four years or more to reduce inflation to single
rates. In almost half of these cases, it took more
than 10 years to get inflation below 10 percent. In
many of these cases, the persistence of moderate or
high levels of inflation was accompanied by explicit
indexation of contracts (which led to a backward-
looking process for wage and price formation). As a
result, the economic cost of lowering inflation was
high, and most countries chose a more extended
horizon to bring down inflation. In Latin America, for
example, Chile and Colombia defeated inflation over
a period of more than 10 years during the 1980s
and 1990s, whereas in Mexico it lasted more than
four years after the “Tequila crisis.” These countries also saw a significant real appreciation of their
currencies during the disinflation process (of about 50 percent in Colombia, 40 percent in Chile, and about
80 percent in Mexico).
A role for institutions. In many of these cases, reforming the institutional framework for monetary policy
was an instrumental ingredient in reducing inflation (see Cukierman and others, 2002, or Jacome and
Vazquez, 2008).1 This typically implied granting independence to central banks and assigning them a narrow
price stability mandate. Fiscal adjustment also contributed to this effort. For example, Colombia, Chile, and
Mexico ran a sizable primary surplus during their disinflation episodes.
_____________
1/ See Chapter 5 of the Selected Issues Paper for the references.
21. Authorities’ view. The authorities stated that the announced pace of disinflation is
appropriate and they expect to achieve the 5 percent per year inflation target by 2019. They noted
that many countries that went from moderate to low inflation more gradually over time were facing
legal backward indexation (for example, Colombia in the 1990s), which is not the case of Argentina.
They also noted that staff is overestimating the output costs associated with disinflation in
Argentina. In the past, lower inflation in Argentina was generally associated with stronger, not
weaker, economic activity. This suggests that when starting from high and distortionary inflation
Inflation and Increase in Nominal Wages in Chile, Colombia, and Mexico, 1985–2000
Sources: Haver analytics and Fund staff calculations.
0
5
10
15
20
25
30
19
85
19
86
19
87
19
88
19
89
19
90
19
91
19
92
19
93
19
94
19
95
19
96
19
97
19
98
19
99
20
00
Chile
(Percent change, y/y)
Nominal wage
Inflation
Central Bank
independence
0
5
10
15
20
25
30
35
19
85
19
86
19
87
19
88
19
89
19
90
19
91
19
92
19
93
19
94
19
95
19
96
19
97
19
98
19
99
20
00
Colombia
(Percent change, y/y)
Nominal wage
Inflation
Central Bank
independence
0
10
20
30
40
50
19
90
19
91
19
92
19
93
19
94
19
95
19
96
19
97
19
98
19
99
20
00
Hu
nd
red
s
Mexico
(Percent change, y/y)
Nominal wage
Inflation
Central Bank
independence
0
2
4
6
8
10
12
14
16
<4 4-6 7-10 >10
Nu
mb
er
of
co
un
trie
s
Years until reaching single digit inflation
Bolivia
Guatemala
Hungary
Iceland
New Zealand
Poland
Tajikistan
ArmeniaAzerbaijan
Brazi lGeorgia
Kazakhstan
Chi le
ColombiaCosta Rica
EgyptGhanaGreece
Israel
Mexico
MoldovaParaguay
Russia
South AfricaTanzania
Uzbekistan
Armenia
Belarus
Bulgaria
Dom. Rep.Kyrgyz Rep.
Peru
Turkmenistan
Ukraine
Uruguay
Moderate Inflation Episodes and Convergence to Low Inflation
Source: Fund staff estimates.

ARGENTINA
24 INTERNATIONAL MONETARY FUND
levels, reducing inflation actually increases economic activity. If expectations were to deviate from
the targets announced in September, the authorities would not hesitate to tighten the monetary
policy stance as needed to return to the announced disinflation path. Showing the resolution to
meet the targets announced (for both inflation and transfers to the Treasury) is an effective way to
build the credibility necessary to reduce inflation inertia. The authorities’ position is that changing
the monetary policy institutional framework along the lines suggested by staff is effective once
credibility has been achieved. Their reading of the experience of other countries was of more mixed
results on the role played by such institutional changes. There have been cases where the central
bank’s charter was changed after inflation had been reduced, in order to lock-in its benefits, rather
than at the beginning of the disinflationary process (for example, the United Kingdom in the 1990s).
B. Restoring Fiscal Integrity
22. The government’s plan to lower the fiscal deficit remains a vital objective. The modest
pace of fiscal consolidation for next year implied by the proposed Budget for 2017 seems
appropriate given the domestic political and social constraints, and the need to support the
economy at a time when the population is still digesting the implications of this year’s costly
transition. However, in the event the upside risks materialize, the authorities should take the
opportunity to accelerate and frontload the reduction of fiscal imbalances as this would allow for a
more accommodative monetary policy stance, ease the upward pressures on the currency, improve
the public debt dynamics, and provide more support to the needed rebalancing from consumption
towards investment. Similarly, while the pace and composition of the shift in the fiscal position after
2017 will need to remain sensitive to the impact on growth, jobs, and the most vulnerable segments
of the Argentine population, frontloading the fiscal correction to the extent allowed by economic,
political, and social conditions would be desirable.
23. The needed reduction of the fiscal deficit should be based on a rationalization of
government spending. Wages, pensions, and energy subsidies have risen by 11 percent of GDP
over the past 8 years. Indeed, public spending in
Argentina is now the highest in Latin America and
one of the highest among emerging market
economies (Box 6). Much can be done to
strengthen public expenditure management,
improve governance, and increase the efficiency
of public spending (see Chapter 2 of the Selected
Issues Paper). Specifically, measures should be
targeted at:
Lowering wage expenditure. A structural
reduction in public employment (at both
federal and provincial levels) would be
facilitated by strengthening payroll management to track and control public employees,
undertaking a census to identify ghost workers, and putting in place an attrition-based
ARG
VZL ARGBRZ
BRZ
BRZ
ECU
0
5
10
15
20
25
30
35
40
45
Total Transfers Wages Pensions Interest G&S Capital
LATAM average
Argentina
Positive gap
between ARG
and LATAM
average
4%5%
5%
12%
General Government Expenditure
(Percent of GDP, 2015)
Source: Fund staff estimates.

ARGENTINA
INTERNATIONAL MONETARY FUND 25
reduction in government employment. In addition, decisions on nominal wage increases for
public employees should be based on forward-looking prospects for inflation.
Box 6. Government Spending in Argentina
Wage bill. Wages are the single largest component of general government expenditure in Argentina. At
12½ percent of GDP in 2015 (over two-thirds of which are paid by the provinces), the Argentine
government’s wage bill exceeded not only the
regional but also the advanced economy average of
10 percent. Public employment drove the increase in
the wage bill over the last decade with the number of
public sector employees rising from 2.3 million to
3.9 million persons from 2001–14. Over 80 percent of
this expansion was at the provincial and municipal
government levels.
Education and health spending. About 70 percent
of public expenditure in education and health is
directed towards employee salaries. On education,
while primary and tertiary education expenditure and
indicators in Argentina are comparable to regional
averages and produce relatively good outcomes,
secondary school spending is high compared to peers,
and does not appear to produce better education
outcomes. On health, Argentina’s public health
expenditure amounted to 32 percent of total
government expenditure, compared to 15 percent for
the LA6 and OECD, and 12 percent for EMs, and
efficiency frontier analysis, drawing on the outcomes of
a range of other EMs and advanced economies,
suggests that there may be room for efficiency gains
(although health outcomes may also depend on a
series of different factors, including educational
attainment and access to sanitation facilities and clean
water).
Energy subsidies. Energy subsidies have risen
dramatically over the past decade and, at 4 percent of
GDP in 2015, constitute the bulk of non-pension social
transfers. These subsidies are largely regressive, with
many poor segments of the population lacking access
to the subsidized products (the poorest quintile of
households received about 10 percent of residential
natural gas subsidies and about 18 percent of
residential electricity subsidies; the richest quintile
received about 35 percent and 20 percent, respectively).
300
350
400
450
500
550
600
0 4 8 12Teacher-student ratio, per 100 students
LAC
Argentina
EMs
OECD
Sources: World Bank and IMF staff estimates.
1/ Dotted line is LA6 average.
Secondary School Teachers and PISA Outcomes 1/
(Latest value available)
PIS
Asc
ore
, ove
rall
30
35
40
45
50
55
60
65
70
75
80
0 1000 2000 3000
He
alt
h A
dju
ste
d L
ife
Exp
ect
an
cy,
20
15
Total health expenditure per capita, PPP$
LAC Argentina EMs OECD
Health Spending Efficiency Frontier 1/(Latest available value)
Sources: World Bank and Fund staff estimates.
1/ Dotted Line is LA6 average.
0
5
10
15
20
25
8
9
10
11
12
13
Decile
1
Decile
2
Decile
3
Decile
4
Decile
5
Decile
6
Decile
7
Decile
8
Decile
9
Decile
10
Electricity Natural Gas (rhs)
Incidence of Residential Subsidies by Income Decile
(Percent of total subsidies)
Sources: CEDLAS (May 2015) and Fund staff estimates.

ARGENTINA
26 INTERNATIONAL MONETARY FUND
Eliminating untargeted energy subsidies. The current system of regressive energy subsidies should
be replaced with measures to protect the poor. This would free up significant fiscal resources to be
used for more productive purposes while protecting the poorest part of the population. The
government’s initial efforts to raise natural gas tariffs for households were reversed by the
Supreme Court. This subsequently led the government to consult with the public on a plan to
bring residential natural gas tariffs back to cost recovery by 2019, with a social tariff to protect the
poorest 1.5 million households. For 2017, under the proposed budget, the government plans to
lower gas and electricity subsidies by about ½ percent of GDP (to about 1½ percent of GDP). Staff
estimates suggest that, if successful, bringing both electricity and natural gas tariffs to cost
recovery while maintaining a social tariff would reduce spending by about 1 percent of GDP.
Reduce pension imbalances. Serious scrutiny of the pension system is needed to restore its
financial sustainability and reduce the contingent pension liabilities that will inevitably burden
Argentina’s young and/or its future generations (Box 7). Spending on pensions increased rapidly
over the last decade, from 4.8 percent of GDP in 2008 to 7.4 percent of GDP in 2015.4 This was
largely a product of increases in benefits (the dependency ratio during this period was broadly
unchanged). The flow imbalance in the pension system will reach 2¼ percent of GDP in 2023
and over 5 percent by 2066 (see Chapter 3 of the Selected Issues Paper). The present value of
the pension deficit, net of financial asset holding of the pension fund, is around 29 percent of
2016 GDP. Restoring a sustainable pension system would require parametric reforms, including
indexing benefits to inflation, reducing the replacement rate, and gradually increasing the
retirement age for women.
24. Authorities’ view. The authorities stressed that gradualism and flexibility are key to a
successful process of fiscal rebalancing. They noted that reducing the wage bill at both federal and
provincial levels will be a slow process, largely based on attrition, given the social cost associated
with reducing public sector employment in the context of a still ailing economy. The review of public
sector employment done at the federal level early this year suggests there is ample room for
efficiency gains. Efforts to modernize Argentina’s public administration are expected to achieve
significant cost savings and better quality of services over time, including by (i) integrating the
administration of human resources and purchases of goods and services across Ministries and public
agencies; (ii) digitalizing a vast number of administrative procedures; and (iii) reorganizing and
improving the utilization of information technology at all levels of the public administration,
including provinces and municipalities. On pensions, the authorities recognized that the current
system faces important long-term challenges, and noted that they are beginning to study the
impact of parametric reforms of the type suggested by staff. The government’s analysis will be a
contribution to the recently established commission on the pension reform, that will articulate a
comprehensive reform of Argentina’s pension system by end-2019. They noted that the effective
4 The latter figure excludes pensions of the police and military forces (0.5 percent of GDP in 2015) and disability and
other non-contributory pensions under the Ministry of Social Development (1.2 percent of GDP in 2015).

ARGENTINA
INTERNATIONAL MONETARY FUND 27
women retirement age is 63, which reduces the potential savings from increasing the minimum
retirement age to 65.
Box 7. Argentina’s Pension System: Options for Reform
Background. Pension spending has risen due to the expansion of the number of beneficiaries and the
introduction of a basic noncontributory pension. The structure of benefits has, however, been steadily
flattened over time. In addition to social security contributions, the system was funded by diverting to the
social security fund (ANSES) 15 percent of the national tax revenue pool. The system is partially funded with
around 10 percent in GDP in assets held by the Fondo de Garantia y Sustenibilidad.
Long-term projections. The imbalances in the system are exacerbated by:
the retroactive adjustment of benefits to past inflation introduced by the Ley de Reparacion Historica
(which will increase pension spending by an annual 0.7 percent of GDP over the medium term);
the introduction of a universal, minimum pension for the elderly regardless of their contribution history
(adding 2 percent of GDP to spending in the long run);
the Supreme Court ruling that the withholding of 15 percent of the common pool of tax revenues from
provinces was unconstitutional (implying a revenue loss of 1.6 percent of GDP by 2020); and
population aging (the old-age dependency ratio will double by 2066).
The cumulative impact of the net present value of pension liabilities over the next fifty years implies an
actuarial deficit of the system of around 30 percent of 2016 GDP.1
Options for reform. Correcting this imbalance would
require some combination of:
Change in the indexation formula. Pension benefits
are linked to wage growth and the growth of ANSES
revenues per disbursed benefit. This formula causes
benefits to increase at rates above CPI inflation, and
to rise faster when the growth in the number of
beneficiaries slows. Indexing benefits to realized
inflation from 2019 onwards would reduce the
actuarial deficit by about 20 percentage points of
GDP.
Lowering the replacement rate. The replacement rate
(the ratio of the benefit to the last wage earned) is
about 72 percent of the average wage, well above the
OECD average (of 53 percent). Lowering the rate to
60 percent would reduce the actuarial deficit by about
10 percentage points of GDP.
A gradual increase of retirement age for women. An
increase in the female retirement age from 60 to 65
over the next ten years would reduce the actuarial
deficit by 10 percentage points of GDP.
_________________________ 1/ The actuarial deficit is defined as the present value of the increase in the difference between benefits and contributions
relative to 2015. The estimate assumes a discount rate (real interest rate–growth differential) of 2.5 percent over the long run.
Using a discount rate of 1 percent would yield an actuarial deficit of 45 percent of 2016 GDP (see Selected Issues Paper).
50
60
70
80
90
100
Retirement
age Men
Life
Expectancy at
60, men
Retirement
age women
Life
Expectancy at
60, women
Retirement Age and Life Expectancy
(Years)
Argentina LAC OECD
Sources: OECD “Pensions at a Glance, 2015” and OECD, IADB, and
World Bank “Pensions at a Glance: Latin America and the Caribbean”.
0
20
40
60
80
100
Gross pension replacement
rate (average salary, men)
Net pension replacement
rate (average salary, men)
Pension Replacement Rate for a Male
Earning the Average Wage
(Percent)
Argentina LAC OECD
Sources: OECD “Pensions at a Glance, 2015” and OECD, IADB, and
World Bank “Pensions at a Glance: Latin America and the Caribbean”.

ARGENTINA
28 INTERNATIONAL MONETARY FUND
25. Fiscal space will also be needed to overhaul Argentina’s inefficient and burdensome
tax system, to make it more progressive, and to help encourage private entrepreneurship and
investment. Argentina’s general government
revenue as share of GDP (at 34 percent of GDP in
2015) is one of the highest in Latin America and
among emerging market economies. The federal
authorities have implemented a number of
measures that reduced the tax burden in 2016 by
about 1½ percent of GDP relative to 2015, including
an increase in the threshold for income that is
exempt from the personal income tax, a reduction
or elimination of exports taxes, a reduction of the
VAT on basic goods for low-income households,
and a range of measures to reduce the tax burden
on SMEs. The most immediate priorities in tax
policy are to:
Simplify the overall system. There are over 35 different types of taxes collected, with 15 of them
contributing only 1 percent of GDP to overall tax revenues. This imposes significant compliance
costs. At the same time, indirect taxes have multiple rates and special earmarking regimes, there
is a complex system of cross-exemptions and crediting that vary across the type of activity, the
location of that activity, or the type of tax base.
Reduce the marginal tax rate on labor. Employee’s and employer’s contributions for health and
social security together account for between 40 and 45 percent of wages, although with a cap
on employees’ contributions.5 This is above the OECD average, and hampers job creation in the
formal economy. A broad-based cut in contribution rates (of 2 percentage points) could be
financed by eliminating the current system of exemptions and deductions across provinces (that
account for 0.3 percent of GDP).
Raise and preserve over time the progressivity of the personal income tax (PIT). High inflation and
lack of adjustment of income tax brackets over the past decade meant that the PIT has become
less and less progressive. The authorities are about to submit to Congress a legislative proposal
that increases the dispersion of income tax brackets and marginal rates (lowering the bottom
rates while increasing the top marginal rate from 35 percent to 40 or 45 percent) with an
estimated annual fiscal cost of around ¼ percent of GDP (half of which borne by provinces).
However, increasing the highest marginal PIT rate above the corporate tax rate (currently
35 percent) could create incentives for tax arbitrage. Going forward, it will be important to
ensure that the real value of tax brackets is preserved.
5 The tax base for employee’s social security contribution is capped at an amount that is revised twice yearly
according to the pension indexation formula. Currently, the cap is 56,058 pesos per month, which is a little above
double the average wage of those contributing to the social security system.
15
25
35
45
19
95
19
97
19
99
20
01
20
03
20
05
20
07
20
09
20
11
20
13
20
15
Total General Government Revenue
(Percent of GDP)
Argentina LA, excl. ARGG20, excl. ARG EMs, excl. ARGOECD
Sources: Ministerio de Hacienda, OECD, IMF WEO database,
and Fund staff calculations.

ARGENTINA
INTERNATIONAL MONETARY FUND 29
Reduce the marginal tax rate on new capital. At 35 percent, the corporate income tax (CIT)
statutory rate is one of the highest in the region, and the lack of provisions to adjust depreciation
and capital allowances for inflation further increases the marginal tax rate on new capital
formation. There are also limited provisions for carrying forward losses, limited allowances for
depreciation, and low tax credits for R&D spending that raise the effective burden on
incremental investments. To encourage new physical and intellectual capital formation, the CIT
rate should be lowered by 5 percentage points, incentives for new R&D spending should be
expanded, and new investment should be encouraged through more generous depreciation
allowances, longer loss carry-forward, and inflation indexation of costs. The estimated annual
cost of these measures would be 0.3 percent of GDP for provinces and 0.2 percent of GDP for the
federal government.
Phasing out the financial transaction tax. The high marginal rate levied on transactions in
checking and saving accounts distorts the payment systems, discourages financial
intermediation, and incentivizes payments in cash. Removing this tax would imply a loss for the
federal government of about 1 percent of GDP.
Replacing the gross turnover tax and increasing
property taxes. Provinces should raise the
property tax (which yields about 0.3 percent of
GDP, well below international and regional
levels) 6 and replace the gross turnover tax—a
multi-stage sales tax that creates distortions
through cascading—with a less distortionary
tax on goods and services (the rate and base of
which would need to be determined by
provinces so that the impact on is revenue
neutral).
The net effect of all these measures is estimated to imply a loss of revenues of around
1¼ percent of GDP for the federal government (and a further ¾ percent of GDP for the provinces).
To minimize the impact on the budget and to support a pickup in private investment, a
simplification of the tax system and changes in the PIT and CIT could be implemented first, along
with the reduction in social security contribution rates, while the elimination of the financial
transaction tax could be phased in gradually. Changes at the provincial level need to be coordinated
with the reforms of the national tax system.
26. Authorities’ view. Reducing the high tax burden is essential, but any substantial changes in
Argentina’s tax system will need to be phased in gradually, to make sure that the fiscal costs are
sustainable. The authorities noted that, together with this year’s increase in the minimum income
subject to PIT (which is now one of the highest in the region), the reform proposal that will soon be
6 Revenues from property taxes amount to 0.5 percent of GDP in Brazil, 0.6 in Chile, 0.7 in Colombia, and 0.7 in
Uruguay.
0.0
0.4
0.8
1.2
1.6
2.0
Argentina LA EM'S OECD G20
Property Tax
(Percent of GDP)
Sources: Ministerio de Hacienda, OECD, IMF WEO database, and
Fund staff calculations.

ARGENTINA
30 INTERNATIONAL MONETARY FUND
discussed in Congress will significantly improve the progressivity of the PIT system. The proposal
may include a gradual increase of the income tax brackets over the next three years, to preserve
progressivity, which the authorities prefer to a formal indexation scheme as this could increase
inertia and may not increase the progressivity of the tax during the disinflation process. The financial
tax is a distortionary tax that weighs especially on SMEs, but can be eliminated only with caution and
within a more general reform of the tax system, given the large amount of revenues that it raises.
There is also a general agreement that the gross turnover tax is highly distortive, but replacing it
with another tax (such as a VAT or a sales tax at provincial level) could be too costly. These and
other tax changes will be reviewed by a special parliamentary commission that will form a proposal
for a comprehensive reform of the Argentina’s tax system to be sent to Congress by early 2018. The
authorities also expect significant increase in revenues from the ongoing reorganization of the tax
administration. In particular, the objective is to reduce VAT tax evasion from the current 30 percent
to the 20 percent that had been experienced a decade ago.
C. Rebuilding Fiscal Institutions
27. Introducing a simple, transparent, and credible medium-term fiscal plan that guides
expectations would be valuable. Such a fiscal framework should aim to improve the overall
management of fiscal policy, strengthen the credibility of fiscal objectives, and improve the
identification and management of fiscal risks. Some elements of a fiscal framework are already
formally in place in Argentina, under the existing Fiscal Responsibility Law (FRL), but the system lacks
credible enforcement.7 A complete revamping of the existing legislation could take time. However,
pending a fuller reform, both federal and provincial governments could introduce simple and
transparent medium-term fiscal objectives (for example, on fiscal deficits) in a clear and concise
policy statement that would be presented alongside the annual budget. That statement would
include details on the macroeconomic assumptions underlying the medium-term budget and the
key policy measures to be taken to achieve the deficit objectives. Over time, as uncertainty subsides
and credibility increases, other measures could be adopted to strengthen the fiscal framework
including:
Introducing a medium-term debt target, limits on growth of spending, and/or an overall deficit
ceiling, with transparent and easy-to-monitor escape clauses that allow deviating from the limits
in exceptional circumstances. The new framework would restrict the ability for the Executive to
exceed budget expenditure ceilings or reallocate spending beyond certain limits without the
approval of Congress. It should also include credible enforcement mechanisms, including a
7 The Law, introduced in 2004, was suspended in 2010. It states that primary spending growth in federal and
provincial budgets cannot exceed the projected rate of nominal GDP growth. It also imposes limits on debt service
ratios at provincial level, and it requires the federal and provincial governments to maintain primary current balances.
However, enforcement mechanisms are weak: the only sanction for the federal government is the exclusion from the
Federal Fiscal Responsibility Council, a committee representing the federal government and provinces that verifies
the application of the law and should coordinate fiscal policy across federal and provincial governments. Sanctions
for provinces mainly include suspension from the authorization to issue debt and reductions of discretionary
transfers from the federal government.

ARGENTINA
INTERNATIONAL MONETARY FUND 31
“comply-or-explain” obligation for the federal government and automatic cuts to transfers for
provinces in case the limits are exceeded.
Develop a fiscal risk analysis framework including the publication of a fiscal scenario analysis and
long-term fiscal sustainability analysis.
Create a new mid-year fiscal report with updated estimates of fiscal outturns for the year and
revised medium-term macroeconomic and fiscal projections.
Establish a fiscal council, with legal and operational independence, that evaluates
macroeconomic and budgetary forecasts, costs new policy initiatives, assesses fiscal plans, and
monitors fiscal performances (including compliance with the FRL).
28. Authorities’ view. The federal authorities agreed that it would be important to introduce a
medium-term fiscal framework, and said that they are planning to announce medium-term fiscal
targets before the end of the year. They pointed to a number of legislative initiatives that should
strengthen the institutional fiscal framework. In the context of the discussion of the 2017 Budget, a
proposal will be examined that limits the Executive’s power to increase total spending above Budget
appropriations and to move spending across different items (Ley de superpoderes). A proposal is
being considered that introduces a Congress Budget Office which would help Congress assess the
fiscal impact of legislative proposals. Finally, discussions with provinces are ongoing to reinstate the
Fiscal Responsibility Law over the next few months. While the exact contours of the Law are still to
be determined, it would likely include caps on current spending growth and fiscal deficit targets.
While the enforcement mechanisms are the same as under the old Law (and so based on the federal
government’s power to deny new debt issuance to provinces not complying with the limits) the
authorities are confident that the greater commitment to fiscal discipline from the federal
government will be shared by provinces and lend credibility to the new framework.
29. With about 40 percent of general government spending taking place at the sub-
national level, greater efficiency in government spending will require a rethink of Argentina’s
fiscal federal structure that:
Realigns spending authority and revenue autonomy. Provinces are responsible for a substantial
share of spending but enjoy limited tax autonomy and have been depending on the federal
government for financing. In 2015, one-third of total provincial resources came from by
discretionary federal transfers, and around 35 percent of provincial debt is owed to the federal
government. Realigning responsibilities could require returning some spending responsibility to
the federal government and/or allocating more revenue sources back to the provinces.
Addresses the complicated and inefficient sharing of resources across provinces. With the
legislation behind the co-participation scheme unchanged since 1988, intricate layers of patches
have been introduced over the years to correct for increasing socio-economic disparities across
provinces and to respond to political pressures. The lack of a mechanism to adjust the
distribution of revenues across provinces to reflect their changing revenue capacity and

ARGENTINA
32 INTERNATIONAL MONETARY FUND
spending needs adds uncertainty and volatility to fiscal policy at both provincial and federal
levels. As such, the current horizontal distribution of shared revenue and federal transfers across
provinces should be re-examined to make it more equitable, transparent, rules-based, and
stable.
Restricts the borrowing power of provinces. Although provinces appear to have low debt and
deficits, these aggregates mask significant heterogeneity and imbalances across provinces (see
Public Debt Sustainability Analysis). Debt and deficits are concentrated in a few provinces, and
the large share of foreign currency denominated debt poses risks (see Annex I). Consideration
should be given to strengthening prudential control mechanisms over provincial borrowing,
within constitutional limitations, perhaps to allow for a more active review role for the federal
government or to net debt service obligations from transfers to those provinces with weak fiscal
positions.
30. Authorities’ view. The authorities agreed that a new legal framework would be needed to
strengthen the institutions and rules of fiscal federalism in Argentina. However, delivering
fundamental legislative changes in this area will not be easy, as it would require a qualified majority
in Congress and approval from all provinces. The gradual devolution to provinces of the 15 percent
of co-participation revenues once attributed to ANSES is expected to alleviate the financial
difficulties experienced by many provinces last year. Therefore, provinces are expected to reduce
their external borrowing going forward. If this were not to happen, the federal authorities are ready
to tighten their debt approval policy, or to link it more explicitly to the issuance of debt needed to
finance an increase in capital spending. As envisaged in the 2017 Budget, the federal authorities are
planning to reduce discretionary transfers to provinces in the future, partly offsetting the increase in
co-participated revenues (the proportion of national revenues shared with provinces will increase
from 37 percent in 2015 to 40 percent next year).
D. Protecting the Poor
31. Measures need to be taken to protect the most vulnerable from the costs of the
ongoing transition. The new poverty data released by INDEC in September describes a critical
social condition (see Box 1). The current administration took measures to mitigate the effects of the
ongoing transition through an expansion of social programs, an adjustment in pensions, lower VAT
on basic goods, increasing the minimum income subject to PIT, and the introduction of a social tariff
for electricity and natural gas. Going forward, eliminating the highly regressive energy subsidies and
introducing a comprehensive mean-tested transfer program will help provide well-targeted support
to the poorest households. While such a safety net is being designed and implemented, the
government should maintain a lower tariff structure for low-income consumers. A lower tax on labor
would incentivize formal employment and bring more people under the umbrella of existing social
programs (including the public health and the public pension scheme).
32. But fundamentally it will be stronger and sustained growth and lower inflation that
will help reduce poverty. Sustaining job creation by removing macroeconomic imbalances and
securing strong and durable growth will have an important impact on supporting the poor. Using

ARGENTINA
INTERNATIONAL MONETARY FUND 33
CEDLAS estimate of the poverty level and staff estimate of the elasticity between GDP growth and
poverty, suggests that a one percent increase in per capita GDP per year would reduce poverty rate
by 0.4 percentage points.8 This implies that, under the staff baseline, the poverty rate would decline
by about 3¼ percentage points by 2021. A significant reduction of inflation will also help the protect
living standards of low income households. Continued progress in fostering gender equality in the
economy and addressing the remaining gender gaps would also contribute to increasing
Argentina’s potential growth and economic welfare (Box 8). This could require well targeted gender
budgeting initiatives, in particular with a focus on programs that facilitate or promote access of
women to educational and preventative health services (IMF, 2016).9
33. Authorities’ view. The authorities emphasized that protecting the most vulnerable from the
potential negative impact of the reforms is a key policy objective, and voiced a strong commitment
to reduce the poverty rate. In addition to the tax and spending measures taken by the
administration during the course of 2016, the authorities noted that their social policy will be based
on three main areas: (i) adopting an income policy that prevents excessive labor conflicts and fosters
consensus, (ii) improving the quality of public goods (including health and education), and
(iii) promoting inclusiveness and social mobility through more efficient and targeted social transfers,
which are better linked to active labor market policies. With between 1 and 1.5 million workers
receiving less than half of the minimum wage and largely in the informal sector, measures that build
job-related skills are needed to help reintroduce this segment of the labor force into Argentina’s
formal economy, although only strong growth will produce quality and sustainable employment.
The authorities also agreed that disinflation will reduce the inequality of the income distribution,
given the disproportionate incidence of the inflation tax on low-income households. In particular,
they noted that the inflation tax represents 20 percent of the income of the lowest decile of
Argentina’s households but only 3 percent for the top decile.
8 The growth elasticity of poverty is estimated as the percent change in poverty with respect to a one percent change
in per capita GDP, using CEDLAS data for poverty and INDEC GDP data for the period 2004–14.
9 Lucía Pérez Fragoso and Corina Rodríguez Enríquez, “Western Hemisphere: A Survey of Gender Budgeting Efforts”
(2016), IMF Working Paper n. 153.

ARGENTINA
34 INTERNATIONAL MONETARY FUND
Box 8. Gender Gap Issues in Argentina
Argentina’s levels of female education and political
representation exceed those observed in the region.
Argentina stands out in terms of female school enrollment,
vis-à-vis Chile and Uruguay, and even more when compared
to the average level of female education in Latin America and
the Caribbean (LAC). Argentina is a leader in the region in
female political representation and fares well in terms of
women’s labor force participation. However, when it comes
to indicators of maternity mortality and adolescent fertility,
Argentina is lagging behind its neighboring countries.
Between 2000 and 2012, female gross tertiary school enrollment increased from 64.7 percent in 2000
to 98.5 percent, surpassing men enrollment by a ratio close to 1.6. Higher education has allowed
women to increase their labor participation rate from 43 to
48 percent between 2000 and 2014 and to reduce their
unemployment rate from 17 to 10 percent—measured
as a proportion of female labor force—over the same
period. Nevertheless, in 2010, women’s average
earnings were only 77 percent of men’s. Moreover, in a
sample of firms with a total of 21,000 employees,
women accounted for only 37 percent of managers and
directors (World Bank 2012). Female participation in
politics is high, as they held 38 percent of seats in
parliament, both at the national and subnational levels,
in 2010, up from an average of 9 percent between 1990
to 2010, as a result a system of quotas established by
the Electoral Law.
Female health conditions have improved, but some
recent reversals in teen births and levels of domestic
violence are worrisome. Health indicators, such as birth
attendance by skilled health staff and the number of
pregnant women receiving prenatal care show that
coverage is close to universal. The maternal mortality
ratio—measured by 100,000 live births—declined from
60 percent to 52 percent between 2000 and 2015.
However, the adolescent fertility rate—computed as the
number of births per 1,000 women ages 15 to 19—has
increased by about 4 percentage points since 2007
(while overall fertility has decreased). Women’s health is
also impacted by the prevalence of domestic violence in one out of five couples as of 2008.
0
20
40
60
80
100
Female tertiary
school enrolment
(2012)
Matermity
mortality ratio
(2015), less is
beter
Adolescent
fertility ratio
(2014), less is
better
Female labor
force
participation
(2010)
Percent of seats
in Parliament
(2010)
Argentina
Chile
Uruguay
LAC
Sources: World Bank Equity Lab, Gender Note (2012), and Fund staff
calculations.
Selected Gender Indicators
0
20
40
60
80
100
200
0
200
1
200
2
200
3
200
4
200
5
200
6
200
7
200
8
200
9
201
0
201
1
201
2
Women
Men
Sources: World Bank Equity Lab and Fund staff calculations.
Tertiary School Enrolment
(Percent)
50
60
70
80
200
0
200
1
200
2
200
3
200
4
200
5
200
6
200
7
200
8
200
9
201
0
201
1
201
2
201
3
201
4
Adolescent fertility
Maternity mortality
Adolescent Fertility and Maternity Mortality
(Percent )
Sources: World Bank Equity Lab, and Fund staff calculations.

ARGENTINA
INTERNATIONAL MONETARY FUND 35
E. Creating New Institutional Structures
34. Improving governance, increasing
transparency, and tackling corruption are key
priorities. Strengthening public institutions and
clearly articulating their roles and responsibilities
will be essential to rebuild private sector
confidence in public administration and support
investment and growth. Over the past 15 years,
Argentina saw the largest decline in ranking of
any country in regulatory quality according to the
World Bank’s global governance indicators.
Argentina also scores poorly in the areas of rule
of law, anti-corruption, and government
effectiveness. Despite relatively good anti-corruption regulation, enforcement has been uneven and
corruption remains pervasive in public institutions, including in public procurement and public
works.10 High levels of corruption are also seen by firms as an obstacle to investing in Argentina
(World Bank Enterprise Survey, 2015). Moreover, Argentina ranks 121 among 189 countries in terms
of ease of doing business, mostly reflecting corruption and excessive bureaucracy.
35. The authorities began taking steps to rebuild public institutions, strengthen anti-
corruption controls, and step-up enforcement. These include initiatives to promote open
government, reduce bureaucracy, build human and institutional capacity, and increase digital
innovation in the public sector. A new framework for public tenders of infrastructure projects has
also been announced to increase transparency and prevent collusive practices. Staff welcomes the
recently proposed legislative reforms to provide additional tools to prosecute corruption, seize
assets linked to corruption, and introduce criminal liability for legal persons. These efforts would be
complemented by effectively mobilizing the anti-money laundering (AML) framework. In particular,
the authorities are encouraged to strengthen the AML/CFT controls in the financial sector, notably
relating to politically exposed persons, and ensure that financial intelligence is appropriately used in
advancing and supporting investigations and prosecutions of corruption.
36. Financial deepening will create scope for domestic financing of productive activity,
strengthen the monetary transmission channel, and include a greater share of the population
in the financial system. Argentina has a relatively small financial system: bank credit to the private
sector is only 13 percent of GDP, and stock market capitalization is only 10 percent of GDP. To a
large extent, restoring macroeconomic stability is the best contribution that policymakers can offer
to the developing of local financial markets. Low inflation and positive real rates are needed to
increase the base of long-term domestic currency savings that will allow banks to increase lending
10 A government report (“El estado del estado: Diagnóstico de la Administración Pública Nacional en diciembre de
2015”) paints a dire picture of the state of public administration and is expected to be followed by wide-ranging
investigations by the Anti-Corruption Office.
-1.5-1.0-0.50.00.51.01.5
Voice and
accountability
Political stability/
no violence
Government
effectiveness
Regulatory
quality
Rule of law
Control of
corruption
Argentina
EMs
LA6
Advanced
Worldwide Governance Indicators, 2014
(Index, -2.5 (weak) to +2.5 (strong) governance performance)
Source: World Bank WGI, 2015 Update.

ARGENTINA
36 INTERNATIONAL MONETARY FUND
to the private sector. In the meantime, some steps
have been taken to encourage greater domestic
intermediation:
Banking sector. The BCRA has eliminated
minimum interest rates for time deposits and
maximum interest rates for consumer loans,
increased information on bank fees, simplified
procedures for opening bank accounts,
eliminated bank transfer fees and fees to
maintain saving accounts. In addition, the
central bank has introduced a new inflation-
indexed account unit, to create a market for inflation-indexed fixed income instruments (both on
the deposit side and, for example, in mortgage loans).
Capital markets. The authorities are working at a reform of the 2012 Capital Markets Law, which
aims at developing closed-end mutual funds by equalizing tax treatment with open-end funds;
introduce legislation that provides for the enforceability of derivative netting; increases capital
requirements for broker dealers; and improves many aspect of corporate governance, including
by removing the power of the securities regulator to interfere in decisions approved by the
board of listed companies and strengthening its enforcement powers to take on anti-market
behavior. Progress has been made in improving capital market infrastructure: the creation of a
unified stock exchange (B&MA) will increase liquidity and lower transaction costs by
consolidating the trading platform, the central counterparty clearing house and the custodian
agency. The new central counterparty clearing house is expected to facilitate the development
of an interest rate swap market, currently quite limited in Argentina.
Insurance sector. Restrictions on insurance companies (that compelled them to invest in
infrastructure projects approved by a political committee and limited foreign investment) were
removed. Consideration is given to introducing tax incentives for investment in long-term assets,
such as life insurance and annuity products by updating the income tax deduction limits that
have been frozen since the early 1990s.
Public pension reserve fund. The new administration at ANSES has begun reforming the
governance and investment strategy of the public pension fund, which was significantly
mismanaged in the past. The objective is to preserve the fund’s capital, investing in projects
(mainly infrastructure projects and financial instruments that promote growth and support the
development of local capital markets) and using the returns to pay for the increase in pension
payments following the 2016 reforms. The authorities are considering utilizing part of the
endowment to set up a trust, which would securitize mortgages originated in banks (while asking
them to maintain a significant credit exposure) in order to help develop a local mortgage market.
0
20
40
60
80
100
Argentina Brazil Chile Colombia Mexico Peru
Financial Development
(Percent of GDP, 2014)
Bank credit to private
sector
Stock market
capitalization
Source: Global Financial Development Database.

ARGENTINA
INTERNATIONAL MONETARY FUND 37
37. There is significant scope to lower trade
barriers. Non-automatic import licenses remain for
around 1,500 tariff lines (about 10–15 percent of
volumes), and there is a broad system of controls
on professional services, patents, royalties, and
technology transfer contracts. As part of the
MERCOSUR trade bloc, in recent years Argentina
has lagged behind other regional peers in trade
liberalization, such as the members of the Pacific
Alliance (Chile, Mexico, Colombia, and Peru).11 A
comprehensive effort should be undertaken to
scale back existing trade barriers so as to raise
competitiveness, encourage new investment, and increase productivity.
38. The poor quality of infrastructure is a major impediment to investment and
productivity. Over the past 15 years, public
investment grew much less than current spending,
while private financing of infrastructure was very
limited. This has led to a severe infrastructure gaps,
including in transportation and energy production
(IMF 2016).12 Access to appropriate infrastructure in
terms of roads, railways, ports and energy is
especially important for exporting firms outside the
central region and metropolitan areas (see Selected
Issues Paper, Chapter 6).13 Filling the infrastructure
gap will take time and, given the limited scope for a
significant expansion of public spending, would
require initiatives to improve the institutional and
legal framework for private sector participation in infrastructure projects, including by introducing a
well-functioning, transparent, and competitive system of concessions.
39. Investment could be encouraged by reformulating the regulatory structure for utilities
and creating a more competitive crude oil and natural gas industry. The authorities should
11 As just one comparative indicator, Argentina has trade agreements with 43 countries, while Chile has agreements
with 91 countries. Colombia, Chile, and Peru, for example, have signed FTAs with the U.S., Canada, the EU, the EFTA,
and Korea, while MERCOSUR has been negotiating toward an FTA with the EU for almost 20 years without
concluding an agreement. Among the G20, Argentina has an FTA only with Brazil.
12 Valerie Cerra and others, “Highways to Heaven: Infrastructure Determinants and Trends in Latin America and the
Caribbean”, 2016, IMF Working paper, n.185.
13 The logistic cost of exporting a 40-foot container by land is US$1,842 in Argentina compared to US$1,000 in Brazil,
with data as of 2014 (World Bank, 2015). Countries improving their score by 1 in the logistic performance index (LPI)
increase their labor productivity by 35 percent on average (OECD, CAF, and ECLAC, 2013). All references are in
Chapter 6 of the Selected Issues Paper.
ARG
BRZ
CHL
URY
AUS
CHNIND
NZL
-0.2
0.0
0.2
0.4
0.6
2 3 4 5 6
Change in Export Market Share and
Transport Infrastructure
Quality of transport infrastructure (7=best)
Ch
an
ge
in m
ark
et
share
, 2005–14 (l
og
dif
f)
Sources: Direction of Trade Statistics and Global
Competitiveness Report (2014).
ARG BRA
CHL
COL
MEX
PER
0
20
40
60
80
100
0 2 4 6 8 10
Sh
are
of
du
ty f
ree t
ari
ff lin
es
Weighted-average tariff
Import Tariff Protection
(Percent)
Sources: World Bank WITS and Fund staff calculations.

ARGENTINA
38 INTERNATIONAL MONETARY FUND
establish an independent, rules-based regulatory structure for electricity generation, transmission,
and distribution, water and sewage, and natural gas. This should include clear, transparent, and
predictable mechanisms for adjusting tariffs. In addition, there should be accountability for the
quality of services and requirements to maintain the underlying infrastructure.
Natural gas. The 3-year plan for increasing natural gas tariffs for residential customers goes in
the right direction, and discussions are ongoing to update the old gas plan that fixes the
remuneration for natural gas producers and expires at end-2017. The old system (that
remunerates investment done before 2012 at prices well below current import prices and gas
produced with new investment at prices above current import prices) should be replaced by a
plan that guarantees remuneration at international prices, with caps and floors to avoid
excessive volatility, for a sufficiently long period of time so as to encourage investment in
exploration and production.
Crude oil prices are also regulated by
agreement between the government, refiners,
and the oil extraction companies, with
companies currently guaranteed a domestic
price of US$67 per barrel. The guaranteed price
should be phased out and investment
encouraged instead by better governance, a
clear long-term roadmap for their
development, and mechanisms to ensure
transparency, accountability, stability, and the
respect for contractual rights.
For electricity, the government plans to double the supply of effectively available electricity in
the next decade and reach a target for renewable resources to cover 25 percent of the country’s
energy needs. Two public auctions have been implemented so far this year, which awarded
10 years PPAs (Power Purchases Agreements) on thermal energy projects, both of which
attracted considerable interest also given the high rates of return offered. In the future,
improving the regulatory framework would ensure a more competitive tender process, allowing
further reductions in the cost of energy.
40. Argentina fares poorly in the areas of market efficiency and competition. This reflects
the existence of anticompetitive regulation and barriers to entry (particularly in network industries),
a weak antitrust framework, and significant and unpredictable government involvement in private
industry. Important progress is ongoing at the Argentina’s National Competition Commission, which
has recently been restructured. A law has been sent to Congress that makes the Commission
independent, giving it a clear mandate to conduct investigations, and impose fines, and bring cases
to court. The legislation also introduces leniency programs to incentivize whistleblowing; updates
the thresholds for fines and merger and acquisition cases (that had not been adjusted for inflation
over the past decade); and introduces a special chamber in the judiciary to adjudicate on
competition cases. The Commission has already issued a report to Congress on the state of
0
25
50
75
100
125
150
0.0
0.4
0.8
1.2
1.6
Aug-11 Aug-12 Aug-13 Aug-14 Aug-15 Aug-16
Crude Oil and Gasoline Prices
(U.S. dollars)
Argentina: avg. gasoline price (US$/litre)
International crude price (US$/barrel; rhs) 1/
Argentina: avg. reference crude price (US$/barrel; rhs)
Sources: Energy Secretariat, Haver Analytics and World Economic Outlook.
1/ Avg. crude price of UK Brent, Dubai Medium, and Alaska NS Heavy.

ARGENTINA
INTERNATIONAL MONETARY FUND 39
competition in the credit card industry and will follow up with studies on dominant position and
collusive behavior in other 13 sectors. The authorities have announced a Plan Productivo Nacional
that delineates an active industrial policy, aimed at maintaining or strengthening public support to
sectors deemed competitive (such as the automotive sector) and gradually eliminating it for
uncompetitive sectors (such as the electronic cluster in Terra del Fuego). The exact contours of the
plan have yet to be defined but should avoid an excessively active (i.e., picking-winners) industrial
policy. Instead, policy should seek to level the playing field by removing government support across
all sectors and lowering the tax burden more broadly.
41. Progress on supply-side reforms could generate significant pay-offs for medium-term
growth and jobs. An extensive literature finds that structural reforms, including product market
reforms, have a positive impact on growth over the medium and long term (IMF, 2015).14 In
Argentina, a number of reforms could be achieved through legislative changes at little or no fiscal
cost. Financial liberalization would support both consumption and investment by relaxing credit
constraints. Similarly, improving the regulatory framework and reducing barriers to entry and the
costs of doing business would stimulate FDI and productivity. Using OECD estimates on the impact
(after 10 years) of product market reforms (proxied by an indicator of regulation in network
industries) on GDP levels suggests that closing half the gap between Argentina and the OECD
average could add 1½ percent to GDP by 2021 and 0.6 percent to employment.15
42. Authorities’ view. The authorities agreed that fundamental supply-side reforms are needed
to improve the business climate and create the conditions for a more integrated, competitive,
productive, and inclusive economy. A multi-pillar Agreement on Productivity and Jobs has been
articulated (following the Plan Productivo Nacional) that aims at establishing a broad consensus on
measures to develop local capital markets, reduce cost of production, lower the tax burden, improve
labor legislation, foster innovation, increase competition, reduce red tape, and boost infrastructure.
While work in these areas has begun already, the authorities stressed that many of the reforms
would need to be phased in gradually, taking into account their political and social implications. For
example, removing costly and inefficient subsidies and protections for some sectors at a time when
the private sector is not creating new jobs could imply excessive social and economic costs. Rather,
it is preferable to try and incentivize a reallocation of resources from the least to the most
productive sectors, or production processes within sectors. The authorities said they are negotiating
with producers, provinces, and unions a gradual reduction of crude oil prices to international parity
over the next few months. Regulatory agencies in the energy sector are being redirected to their
original function, and new directors are being selected with more independence from political
pressure. The authorities intend to launch an ambitious program of infrastructure, increasing
government’s capital spending from 2 to 6 percent of GDP in about 8 years, two thirds of which in
partnership with the private sector. In order to achieve this objective a new law has been sent to
14 “Structural Reforms and Macroeconomic Performance: Initial Considerations for the Fund”. IMF Policy Paper,
November 2015.
15 Sebastian Barnes and others. “The GDP Impact of Reform: A Simple Simulation Framework,” (2011), OECD
Economics Department Working Papers, No. 834, OECD Publishing
ARGENTINA
40 INTERNATIONAL MONETARY FUND
Congress that aims at improving the institutional and legal framework for public-private
partnerships, including by setting up a special unit that will assess the social return associated with
these projects, as well as their macroeconomic and financial implications. Finally, the authorities are
committed to further step-up their anti-corruption efforts. The Anti-Corruption Office has embarked
on increasing transparency and accountability of government public officials by making public all
financial asset disclosures. Together with financial sectors stakeholders, the authorities have also
started utilizing the AML/CFT controls in advancing and supporting investigations and prosecutions
of corruption.
STAFF APPRAISAL
43. Upon taking office in December last year, Argentina’s new government inherited a
legacy of pervasive macroeconomic imbalances, microeconomic distortions, and a weakened
institutional framework. These encompassed unsustainably high consumption levels, historically
low levels of investment, and large fiscal deficits financed by money creation, which led to high
inflation. Distortions at the micro level included an extensive network of administrative controls (for
example, trade barriers, foreign exchange restrictions, and price controls) and a business
environment that eroded competitiveness and undermined medium-term growth. There was also an
important weakening of the institutional framework for economic policymaking, perhaps most
evident in the loss of credibility of the national statistics agency.
44. A necessary and unavoidable transition. Confronted with this difficult situation, the new
government began an ambitious and much needed transition toward a better economic policy
framework, reversing the serious macroeconomic imbalances and microeconomic distortions
inherited from the previous government. Important progress has been made. The peso is now
market determined, and foreign exchange controls have been essentially eliminated. The increase in
utility tariffs has brought prices more in line with underlying costs. The settlement with creditors has
allowed a return to international capital markets by both the private and public sectors. Medium-
term fiscal and inflation targets were announced in conjunction with a transition toward a modern
system of inflation targeting. Finally, the national statistics agency is being rebuilt, allowing for the
publication of improved and credible data on inflation, trade, labor market, and output.
45. Near-term costs but a more favorable future. The reversal of the serious imbalances and
distortions inherited from the previous administration, while necessary to lay the foundation for
robust future growth, unavoidably had an adverse near-term impact on the Argentine economy.
Indeed, the current recession had begun even before the new administration took office. However,
the alternative of continuing with the unsustainable policy framework of the past administration was
simply not tenable and would have eventually led to a repeat of Argentina’s history of crisis,
contraction, and social distress. Staff expects the economy to emerge from recession in late 2016,
and the planned fiscal consolidation in 2017 should be more-than-offset by a pickup in private
consumption, an improving external environment, and a rebound of private investment. It is no
accident that Argentina is forecast to experience one of the largest swings in growth—from negative
to positive—in 2017, based on the October 2016 World Economic Outlook.

ARGENTINA
INTERNATIONAL MONETARY FUND 41
46. With strong policy action and dramatic changes underway in the Argentine economy,
the outlook is subject to greater than normal uncertainty. On the upside, Argentina’s private
investment could prove to be more responsive to the measures taken so far to remove domestic
distortions, particularly given the clear underinvestment in a range of sectors over the past several
years. This would help with the fiscal position and would improve the outlook for long-term growth.
On the downside, given the expected reliance on external debt, a tightening of global financial
conditions could create pressures on the currency, affect the cost and availability of budgetary
financing, and impose a faster pace of fiscal consolidation. Higher inflationary pressures from
backward-looking nominal wage increases could lead to a more costly process of disinflation, which
would slow the rebound of economic activity that is expected for next year.
47. The government should be commended for its commitment to bring inflation down to
single-digit levels. The pace at which this disinflation is achieved should remain flexible and adapt
to circumstances as they unfold, remaining conscious of the economic costs and, particularly, the
distributional impact. To support these efforts, building credibility in the monetary policy framework,
including through strengthening the institutional underpinning for policy will be essential and will
serve to lessen the economic and social cost of lowering inflation. Positive steps continue to be
taken by the national statistics agency in restoring the credibility of Argentina’s statistics.
48. The government’s plan to lower the fiscal deficit remains a vital objective. The pace and
composition of this shift in the fiscal position will need to be sensitive to the impact on growth, jobs,
and on the most vulnerable segments of the Argentine population. Frontloading the fiscal correction
to the extent allowed by the current economic, political and social constraints would be desirable.
Doing so will allow for a more accelerated reduction in interest rates, ease the current upward
pressure on the real exchange rate, improve the public debt dynamics, and facilitate the needed
rebalancing from consumption to investment-driven growth. There will have to be a rationalization
of government spending, which has increased rapidly over the last decade. Much can be done to
strengthen public expenditure management, improve governance, and increase the efficiency of
public spending. Action is particularly needed on eliminating regressive energy subsidies, protecting
the poorest part of the population, addressing actuarial imbalances in the pension system, and
overhauling the inefficient and burdensome tax system. A clearer articulation to the public of the
policy measures that underlie the targeted reduction of the federal deficit in 2017 as well as a
simple, transparent and credible medium-term fiscal policy plan that guides expectations would
both be valuable.
49. Rebuilding the foundations for growth. Strong, sustained, and equitable growth will require
the implementation of an ambitious agenda of supply-side reforms. Near-term priorities include
putting in place a better regulatory framework for energy and utilities, fully realigning utilities tariffs
toward cost recovery while maintaining measures to protect the poor, and modernizing financial
market infrastructure and regulation. There is also a broader need to scale back government
involvement in private industries and create a better governance framework, including by making
further progress on the government’s ambitious anti-corruption plans. Such a set of policies will
create an environment that is more conducive to private investment and will generate significant

ARGENTINA
42 INTERNATIONAL MONETARY FUND
medium-term dividends in terms of more and better jobs as well as a steady improvement in the
living standards for Argentina’s population.
50. Staff proposes that the next Article IV Consultation take place on the standard
12-month cycle.

ARGENTINA
INTERNATIONAL MONETARY FUND 43
Table 1. Argentina: Selected Economic and Financial Indicators
Average
2009–14 2015 2016 2017 2018 2019 2020 2021
National income, prices, and labor markets 1/ 2/
GDP at constant prices 1.5 2.5 -1.8 2.7 2.8 2.9 3.1 3.3
Domestic demand 2.6 3.7 -2.2 3.4 3.6 3.6 3.5 3.6
Consumption 2.8 4.1 -1.8 2.3 2.7 2.7 2.9 3.0
Private 2.6 3.6 -1.7 2.5 2.8 2.8 3.0 3.1
Public 4.5 6.6 -2.5 1.6 2.1 2.4 2.5 2.5
Investment 1.6 4.2 -3.6 8.2 7.2 7.2 5.9 5.8
Exports -1.0 -0.6 4.5 4.4 4.8 3.8 5.5 4.8
Imports 4.4 5.6 1.3 6.8 7.6 6.3 6.3 5.6
Change in inventories and stat. disc. (contribution to growth) 0.1 -0.3 -0.1 0.0 0.0 0.0 0.0 0.0
Nominal GDP (billions of Argentine pesos) 2,609 5,843 8,043 10,173 12,466 14,801 17,016 19,259
CPI inflation (eop, y/y percent change) … … 39.4 20.5 17.5 13.0 10.3 9.4
Unemployment rate (percent) 7.5 … 9.2 8.5 8.3 7.5 6.9 6.8
External sector
Exports f.o.b. (goods, billions of U.S. dollars) 71.9 56.8 55.3 57.2 59.5 62.0 65.6 68.9
Imports f.o.b. (goods, billions of U.S. dollars) -60.1 -57.2 -51.6 -56.4 -61.1 -65.5 -70.2 -74.5
Trade balance (goods, billions of U.S. dollars) 11.7 -0.4 3.8 0.8 -1.5 -3.5 -4.5 -5.6
Trade balance (goods) 2.6 -0.1 0.7 0.1 -0.2 -0.5 -0.6 -0.7
Terms of trade (percent change) 1.6 -4.0 2.3 -2.9 -1.6 -0.4 -0.4 -0.2
Total external debt 31.4 25.2 31.7 32.5 33.8 34.5 34.6 34.6
Savings-Investment balance
Gross domestic investment 16.3 15.9 15.8 16.5 17.1 17.6 17.9 18.2
Gross national savings 15.9 13.4 13.5 13.3 13.5 13.7 13.9 14.0
Current account balance -0.4 -2.5 -2.3 -3.2 -3.6 -3.9 -4.0 -4.2
Public sector 3/
Primary balance -1.7 -5.4 -5.6 -5.1 -4.1 -3.0 -2.0 -1.8
of which : Federal government -1.4 -5.0 -4.8 -4.5 -3.6 -2.5 -1.4 -1.3
Overall balance -2.7 -6.6 -7.3 -6.9 -6.2 -5.0 -3.8 -3.6
of which : Federal government -2.4 -6.2 -6.5 -6.3 -5.6 -4.4 -3.2 -3.0
Revenues 30.7 34.0 32.5 32.3 32.2 32.0 31.8 31.7
Primary expenditure 33.1 39.4 38.0 37.4 36.3 35.0 33.8 33.5
Total public debt (federal) 43.3 52.1 51.8 51.1 51.2 50.0 48.4 47.5
Money and credit
Monetary base (eop, y/y percent change) 27.5 34.9 24.4 23.7 20.7 16.5 13.8 12.8
Credit to the private sector (eop, y/y percent change) 28.9 35.6 26.4 21.2 18.4 14.8 15.3 14.0
Credit to the private sector real (eop, y/y percent change) … … -9.3 0.6 0.8 1.6 4.5 4.2
LEBAC interest rate (average) 4/ 16.0 28.1 29.8 25.2 20.1 16.3 13.7 13.1
LEBAC real interest rate (average) 4/ … … 5.0 5.1 4.4 4.4 3.7 3.4
LEBAC interest rate (eop) 4/ 16.3 32.2 28.3 22.8 17.7 15.1 13.2 13.0
LEBAC real interest rate (eop) 4/ … … 6.4 4.5 4.2 4.4 3.5 3.3
Memorandum items
Gross international reserves (billions of U.S. dollars) 42.0 25.6 33.3 36.5 49.2 56.5 61.2 66.6
Exchange rate (eop, Arg$/US$) 5.3 13.0 … … … … … …
Change in REER (average, percent change) 6.7 26.0 -12.8 3.7 2.9 2.9 2.9 2.9
Transfers from BCRA 0.9 1.3 1.4 0.6 0.2 0.1 0.0 0.0
(Annual percentage changes unless otherwise indicated)
(Percent of GDP unless otherwise indicated)
1/ On February 1, 2013, the IMF issued a declaration of censure, and since then has called on Argentina to implement specified actions to address the quality of its official GDP
data. The new government that took office in December 2015 released a revised GDP series on June 29, 2016. At the IMF Executive Board meeting that took place on August 31,
2016, the revised series was considered to be in line with international standards.
2/ The consumer price data for Argentina before December 2013 reflect the CPI for the Greater Buenos Aires Area (CPI-GBA), while from December 2013 to October 2015 the data
reflect the national CPI (IPCNu). The new government that took office in December 2015 discontinued the IPCNu stating that it was flawed and released a new CPI for the Greater
Buenos Aires Area on June 15, 2016. Given the differences in geographical coverage, weights, sampling, and methodology of these series, the average CPI inflation for 2014, 2015,
and 2016 and end-of-period inflation for 2015 are not reported in the October 2016 World Economic Outlook. On February 1, 2013, the IMF issued a declaration of censure and
since then has called on Argentina to implement specified actions to address the quality of its official CPI data. At the meeting that took place on August 31, 2016, the IMF
Executive Board noted the important progress made in strengthening the accuracy of the CPI data. The Managing Director will report to the Executive Board on this issue again
by November 15, 2016. The Executive Board discussion on this issue will take place on November 9, 2016.
3/ The primary balance excludes profit transfers from the central bank of Argentina. Interest expenditure is net of property income from the social security fund.
4/ Average of LEBAC rates of all maturities.
Proj.
Sources: Ministerio de Hacienda y Finanzas Públicas, Banco Central de la República Argentina (BCRA), and Fund staff estimates.

ARGENTINA
44 INTERNATIONAL MONETARY FUND
Table 2. Argentina: Summary Balance of Payments, 2011–21
2011 2012 2013 2014 2015 2016 2017 2018 2019 2020 2021
Current account -4.4 -1.4 -12.1 -8.0 -15.9 -12.7 -19.3 -23.4 -27.7 -31.2 -35.2
Trade balance 12.2 14.9 4.7 6.0 -0.4 3.8 0.8 -1.5 -3.5 -4.5 -5.6
Exports f.o.b. 83.0 80.0 76.0 68.4 56.8 55.3 57.2 59.5 62.0 65.6 68.9
Primary products 19.8 19.0 17.8 14.2 13.3 13.9 14.3 14.4 14.7 14.9 15.2
Manufactures of agricultural origin 27.7 26.8 27.0 26.4 23.3 23.1 23.4 23.5 24.0 24.4 24.8
Manufactures of industrial origin 28.8 27.2 25.6 22.8 18.0 16.4 17.4 19.7 21.6 24.7 27.6
Energy 6.7 7.0 5.6 5.0 2.3 1.9 2.1 1.9 1.7 1.5 1.4
Imports f.o.b. -70.8 -65.0 -71.3 -62.4 -57.2 -51.6 -56.4 -61.1 -65.5 -70.2 -74.5
Capital goods -27.3 -25.1 -26.6 -23.7 -23.4 -22.0 -24.4 -26.7 -29.1 -31.5 -33.7
Intermediate goods -20.9 -19.0 -18.7 -17.8 -17.3 -15.1 -16.1 -17.1 -18.2 -19.5 -20.8
Consumer goods -13.2 -12.3 -14.1 -9.9 -10.0 -10.0 -10.6 -11.4 -11.8 -12.3 -12.5
Fuels and lubricants -9.4 -8.7 -11.9 -11.0 -6.5 -4.5 -5.3 -5.9 -6.4 -6.9 -7.4
Services, income and transfers -16.6 -16.3 -16.7 -14.0 -15.6 -16.5 -20.2 -21.8 -24.2 -26.7 -29.6
Services balance -2.2 -3.0 -3.7 -3.1 -3.9 -4.6 -4.9 -5.3 -5.4 -5.5 -5.6
Earnings and dividends, net -10.7 -9.2 -8.6 -6.9 -7.6 -7.1 -8.0 -9.1 -10.6 -12.4 -14.6
Interests, net -3.1 -3.6 -3.6 -3.9 -3.6 -4.4 -6.9 -7.1 -7.9 -8.5 -9.2
Other flows and transfers -0.6 -0.5 -0.8 -0.2 -0.4 -0.3 -0.3 -0.3 -0.3 -0.3 -0.3
Capital and financial account -1.7 -1.7 3.1 18.5 12.3 25.8 31.2 36.1 35.0 35.9 40.6
Capital account 0.1 0.0 0.0 0.1 0.1 0.0 0.1 0.0 0.0 0.0 0.0
Portfolio investment, net -3.9 -4.1 -0.3 6.4 -0.5 28.2 18.6 19.2 14.3 11.0 11.8
of which: public sector -3.4 -3.1 -0.9 5.8 -2.6 23.6 15.6 21.2 17.9 14.6 15.4
Foreign direct investment, net 9.4 14.3 8.9 3.1 11.1 6.3 9.8 13.4 17.6 21.6 25.7
Other investment, net -7.2 -11.9 -5.6 9.0 1.6 -8.8 2.7 3.5 3.1 3.2 3.1
Errors and omissions 0.3 -0.5 -3.2 -0.2 -1.3 -1.1 0.0 0.0 0.0 0.0 0.0
Overall balance -5.8 -3.6 -12.2 10.3 -4.9 16.7 3.2 12.7 7.3 4.7 5.4
Financing 5.8 3.6 12.2 -10.3 5.0 -16.7 -3.2 -12.7 -7.3 -4.7 -5.4
Change in gross reserves (increase -) 5.8 3.1 12.7 -0.8 5.9 -7.7 -3.2 -12.7 -7.3 -4.7 -5.4
Valuation changes and arrears 0.0 0.5 -0.5 -9.5 -0.9 -9.0 0.0 0.0 0.0 0.0 0.0
Current account -0.8 -0.2 -2.0 -1.4 -2.5 -2.3 -3.2 -3.6 -3.9 -4.0 -4.2
Trade balance 2.3 2.6 0.8 1.1 -0.1 0.7 0.1 -0.2 -0.5 -0.6 -0.7
Exports, f.o.b. 15.7 13.8 12.4 12.1 9.0 10.2 9.6 9.1 8.7 8.5 8.2
Imports f.o.b. -13.4 -11.2 -11.7 -11.1 -9.1 -9.5 -9.5 -9.4 -9.2 -9.1 -8.9
Capital and financial account -0.3 -0.3 0.5 3.3 2.0 4.8 5.2 5.5 4.9 4.6 4.8
Portfolio investment, net -0.7 -0.7 -0.1 1.1 -0.1 5.2 3.1 2.9 2.0 1.4 1.4
Foreign direct investment, net 1.8 2.5 1.5 0.6 1.8 1.2 1.6 2.1 2.5 2.8 3.1
Other investment, net -1.4 -2.1 -0.9 1.6 0.3 -1.6 0.5 0.5 0.4 0.4 0.4
Memorandum items:
Non-interest current account balance (US$bns) -1.3 2.2 -8.4 -4.1 -12.3 -8.3 -12.4 -16.3 -19.8 -22.7 -26.0
(in percent of GDP)Non-interest current account balance (% of GDP) -0.3 0.4 -1.4 -0.7 -2.0 -1.5 -2.1 -2.5 -2.8 -2.9 -3.1
Exports volumes (percent change) 3.4 -6.9 -3.7 -7.8 -1.7 5.7 4.3 4.8 3.8 5.5 4.8
Imports volumes (percent change) 22.1 -6.9 3.7 -12.5 3.8 0.2 7.0 7.4 6.6 6.2 5.7
Terms of trade (Index, 2004 = 100) 139.3 144.7 135.3 131.6 126.3 129.3 125.5 123.5 123.0 122.4 122.2
Change in REER (average, percent change) 10.2 20.9 4.3 -6.1 26.0 -12.8 3.7 2.9 2.9 2.9 2.9
Gross international reserves (US$bns) 46.4 43.3 30.6 31.4 25.6 33.3 36.5 49.2 56.5 61.2 66.6
(in months of imports of goods and services) 6.3 6.2 4.1 4.8 4.1 5.7 5.8 7.3 8.0 8.2 8.5
Sources: INDEC and Fund staff estimates.
Proj.
(Percent of GDP unless otherwise indicated)
(Billions of U.S. dollars)

ARGENTINA
INTERNATIONAL MONETARY FUND 45
Table 3. Argentina: Consolidated Public Sector Operations, 2011–211/
2011 2012 2013 2014 2015 2016 2017 2018 2019 2020 2021
Revenues 666,572 845,661 1,092,211 1,485,461 1,985,132 2,610,483 3,290,820 4,013,204 4,735,401 5,417,725 6,104,841
Tax revenues 485,168 612,917 792,089 1,074,207 1,427,152 1,865,919 2,360,382 2,873,121 3,381,759 3,861,476 4,343,488
Social security contributions 134,220 175,590 229,767 297,504 401,045 565,340 715,121 876,252 1,040,391 1,196,111 1,353,751
Other revenues 47,184 57,153 70,355 113,749 156,935 179,224 215,316 263,831 313,252 360,138 407,602
Primary Expenditures 696,932 884,694 1,172,133 1,633,714 2,301,838 3,057,283 3,807,587 4,525,485 5,185,657 5,751,094 6,456,605
Wages 227,576 294,392 378,231 523,683 737,876 1,011,357 1,279,306 1,581,432 1,900,198 2,210,252 2,501,549
Goods and services 53,335 64,257 86,279 120,322 157,827 203,277 257,133 302,605 344,488 362,017 371,212
Transfers to the private sector 277,235 356,044 466,110 663,035 927,581 1,278,410 1,589,976 1,831,725 2,038,774 2,260,704 2,544,720
Of which: federal pensions 147,085 204,617 272,066 363,385 535,697 712,389 991,129 1,214,450 1,441,940 1,657,762 1,876,244
Capital spending 77,671 83,176 120,990 171,594 209,423 311,093 411,825 504,618 599,142 688,818 779,600
Other 61,116 86,825 120,522 155,081 269,130 253,146 269,347 305,105 303,055 229,303 259,524
Primary balance -30,360 -39,033 -79,922 -148,254 -316,706 -446,799 -516,768 -512,281 -450,256 -333,369 -351,764
Interest cash 25,239 34,879 20,563 34,453 70,710 137,747 188,078 258,921 288,284 312,583 338,913
Overall balance -55,600 -73,912 -100,486 -182,707 -387,416 -584,547 -704,846 -771,202 -738,540 -645,952 -690,677
Revenues 30.6 32.1 32.6 32.4 34.0 32.5 32.3 32.2 32.0 31.8 31.7
Tax revenues 22.3 23.2 23.7 23.5 24.4 23.2 23.2 23.0 22.8 22.7 22.6
Social security contributions 6.1 6.6 6.9 6.6 7.2 7.0 7.0 7.0 7.0 7.0 7.0
Other revenues 2.2 2.2 2.1 2.4 2.4 2.2 2.1 2.1 2.1 2.1 2.1
Primary expenditures 32.0 33.5 35.0 35.7 39.4 38.0 37.4 36.3 35.0 33.8 33.5
Wages 10.4 11.2 11.3 11.4 12.6 12.6 12.6 12.7 12.8 13.0 13.0
Goods and services 2.4 2.4 2.6 2.6 2.7 2.5 2.5 2.4 2.3 2.1 1.9
Transfers to the private sector 12.7 13.5 13.9 14.5 15.9 15.9 15.6 14.7 13.8 13.3 13.2
Of which: federal pensions 6.8 7.8 8.1 7.9 9.2 8.9 9.7 9.7 9.7 9.7 9.7
Capital spending 3.6 3.2 3.6 3.7 3.6 3.9 4.0 4.0 4.0 4.0 4.0
Other 2.8 3.3 3.6 3.4 4.6 3.1 2.6 2.4 2.0 1.3 1.3
Primary balance -1.4 -1.5 -2.4 -3.2 -5.4 -5.6 -5.1 -4.1 -3.0 -2.0 -1.8
Interest cash 1.2 1.3 0.6 0.8 1.2 1.7 1.8 2.1 1.9 1.8 1.8
Overall balance -2.6 -2.8 -3.0 -4.0 -6.6 -7.3 -6.9 -6.2 -5.0 -3.8 -3.6
Cyclically-adjusted primary balance -2.4 -1.6 -2.9 -2.8 -5.8 -4.8 -4.3 -3.2 -2.0 -0.9 -0.8
Sources: Ministerio de Economía y Finanzas Públicas and Fund staff calculations.
1/ The primary balance excludes profit transfers from the central bank of Argentina. Interest expenditure is net of property income from the social security fund.
(Billions of Argentine pesos)
(Percent of GDP)
Proj.

ARGENTINA
46 INTERNATIONAL MONETARY FUND
Table 4. Argentina: Federal Government Operations, 2011–211/
2011 2012 2013 2014 2015 2016 2017 2018 2019 2020 2021
Revenues 541,494 687,143 874,966 1,175,494 1,591,344 2,068,379 2,605,091 3,172,967 3,737,772 4,270,776 4,806,730
Tax revenues 392,266 491,705 616,621 833,132 1,107,273 1,425,544 1,803,334 2,190,558 2,571,340 3,288,975 1,370,711
Social security contributions 133,680 174,388 229,890 300,889 419,419 564,169 715,121 876,252 1,040,391 1,353,751 519,758
Nontax revenues 15,547.7 21,050.0 28,454.5 41,472.7 64,652.5 78,666.3 86,635.8 106,156.6 126,041.7 164,004.8 70,291.2
Primary Expenditures 558,184 721,926 959,133 1,324,592 1,883,001 2,455,111 3,061,905 3,617,381 4,107,768 4,512,269 5,054,511
Federal expenditures 394,931 517,853 689,298 970,001 1,387,736 1,793,977 2,260,449 2,640,803 2,925,404 3,194,961 3,563,589
Wages 74,314 95,957 122,611 171,923 236,817 321,694 406,923 498,611 592,010 680,619 770,320
Goods and services 23,952 29,257 41,001 58,475 78,907 94,651 119,728 134,239 144,584 132,193 111,098
Pensions 147,085 204,617 272,066 363,385 535,697 712,389 991,129 1,214,450 1,441,940 1,657,762 1,876,244
Transfers to private sector 103,586 119,473 154,107 245,178 322,377 470,350 477,829 468,989 420,772 400,528 439,385
Capital 30,477 37,202 54,256 79,343 91,707 107,245 153,970 188,663 224,003 257,531 291,472
Other 15,516 31,346 45,257 51,696 122,232 87,648 110,869 135,850 102,095 66,329 75,070
Transfers to provinces 163,253 199,745 263,255 361,496 495,266 661,134 801,456 976,578 1,182,363 1,317,309 1,490,922
Automatic 123,239 156,731 204,149 280,205 398,471 542,506 702,265 879,969 1,067,658 1,253,498 1,418,701
Coparticipation 108,879 137,498 178,629 242,981 331,933 459,102 596,764 750,696 914,169 1,077,036 1,218,983
Discretionary 34,991 36,928 51,098 70,259 96,795 118,628 99,191 96,609 114,706 63,810 72,220
Primary balance -16,690 -30,455 -77,588 -156,003 -291,658 -386,732 -456,814 -444,414 -369,996 -241,494 -247,780
Interest cash 24,429 33,743 19,071 32,135 68,640 134,834 184,299 254,226 282,529 305,564 330,420
Overall balance -41,119 -64,197 -96,658 -188,138 -360,298 -521,566 -641,112 -698,640 -652,525 -547,057 -578,200
Revenues 24.9 26.0 26.1 25.7 27.2 25.7 25.6 25.5 25.3 25.1 25.0
Tax revenues 18.0 18.6 18.4 18.2 18.9 17.7 17.7 17.6 17.4 17.2 17.1
Social security contributions 6.1 6.6 6.9 6.6 7.2 7.0 7.0 7.0 7.0 7.0 7.0
Nontax revenues 0.7 0.8 0.8 0.9 1.1 1.0 0.9 0.9 0.9 0.9 0.9
Primary expenditures 25.6 27.2 28.4 29.1 32.2 30.5 30.1 29.0 27.8 26.5 26.2
Primary expenditures (excluding provinces) 18.1 19.6 20.6 21.2 23.7 22.3 22.2 21.2 19.8 18.8 18.5
Wages 3.4 3.6 3.7 3.8 4.1 4.0 4.0 4.0 4.0 4.0 4.0
Goods and services 1.1 1.1 1.2 1.3 1.4 1.2 1.2 1.1 1.0 0.8 0.6
Pensions 6.8 7.8 8.1 7.9 9.2 8.9 9.7 9.7 9.7 9.7 9.7
Private sector transfers 4.8 4.5 4.6 5.4 5.5 5.8 4.7 3.8 2.8 2.4 2.3
Capital 1.4 1.4 1.6 1.7 1.6 1.3 1.5 1.5 1.5 1.5 1.5
Other 0.7 1.2 1.4 1.1 2.1 1.1 1.1 1.1 0.7 0.4 0.4
Transfers to provinces 7.3 7.3 7.6 7.7 8.5 8.2 7.9 7.8 8.0 7.7 7.7
Automatic 5.7 5.9 6.1 6.1 6.8 6.7 6.9 7.1 7.2 7.4 7.4
Coparticipation 5.0 5.2 5.3 5.3 5.7 5.7 5.9 6.0 6.2 6.3 6.3
Discretionary 1.6 1.4 1.5 1.5 1.7 1.5 1.0 0.8 0.8 0.4 0.4
Primary balance -0.8 -1.2 -2.3 -3.4 -5.0 -4.8 -4.5 -3.6 -2.5 -1.4 -1.3
Interest cash 1.1 1.3 0.6 0.7 1.2 1.7 1.8 2.0 1.9 1.8 1.7
Overall balance -1.9 -2.4 -2.9 -4.1 -6.2 -6.5 -6.3 -5.6 -4.4 -3.2 -3.0
Cyclically-adjusted primary balance -1.5 -1.3 -2.8 -3.0 -5.3 -4.2 -3.9 -2.9 -1.7 -0.6 -0.4
(Percent of GDP)
(Billions of Argentine pesos)
Sources: Ministerio de Economía y Finanzas Públicas and Fund staff estimates.
1/ The primary balance excludes profit transfers from the central bank of Argentina. Interest expenditure is net of property income from the social security fund.
Proj.

ARGENTINA
INTERNATIONAL MONETARY FUND 47
Table 5. Argentina: Summary Operations of the Financial System, 2011–21
(Billions of Argentine pesos, end of period, unless otherwise indicated)
2011 2012 2013 2014 2015 2016 2017 2018 2019 2020 2021
Net foreign assets 172.9 193.0 183.5 219.0 157.5 287.1 378.8 678.2 882.1 1,025.2 1,199.9
Net domestic assets 50.0 114.4 193.7 243.5 466.4 488.7 580.6 479.8 466.9 510.1 532.3
Credit to the public sector (net) 191.5 311.7 472.2 697.7 1,194.4 1,431.1 1,649.3 1,901.4 2,089.4 2,231.6 2,349.6
Credit to the financial sector (net) -82.2 -115.6 -162.9 -265.1 -375.8 -457.9 -519.8 -705.2 -831.5 -913.6 -991.8
Official capital and other items (net) -59.3 -81.8 -115.7 -189.1 -352.2 -484.6 -549.0 -716.3 -791.0 -807.9 -825.6
Monetary base 222.9 307.4 377.2 462.6 623.9 775.8 959.4 1,158.0 1,349.1 1,535.3 1,732.2
Currency issued 173.1 237.0 289.2 358.8 478.8 595.4 736.2 888.6 1,035.3 1,178.2 1,329.3
Bank deposits at the Central Bank 49.9 70.3 88.0 103.8 145.1 180.5 223.1 269.3 313.8 357.1 402.9
Net foreign assets 168.3 195.9 182.5 218.6 155.9 280.2 373.7 675.1 881.7 1,027.9 1,205.9
Net domestic assets 308.6 439.9 620.1 815.3 1,330.7 1,641.6 2,047.5 2,290.5 2,604.9 2,977.1 3,361.7
Credit to the public sector (net) 145.6 233.9 362.2 585.6 1,136.1 1,409.1 1,724.1 1,993.1 2,228.7 2,420.5 2,609.4
Credit to the private sector 305.3 401.3 526.7 633.0 858.3 1,085.0 1,315.5 1,557.4 1,787.5 2,060.3 2,349.6
Net capital, reserves, and other assets -142.2 -195.4 -268.8 -403.3 -663.7 -852.5 -992.0 -1,260.1 -1,411.3 -1,503.6 -1,597.3
Liabilities with the private sector 477.1 635.5 802.3 1,033.7 1,484.7 1,921.5 2,421.0 2,965.3 3,486.4 4,004.8 4,567.3
Currency outside banks 151.2 209.9 257.7 315.8 425.5 532.4 658.4 794.7 925.8 1,053.6 1,188.8
Local currency deposits 273.4 386.3 499.4 653.8 920.4 1,186.1 1,490.4 1,828.8 2,148.8 2,467.0 2,808.0
Foreign currency deposits 52.4 39.2 45.1 64.1 138.7 203.0 272.2 341.8 411.7 484.2 570.5
Net foreign assets 7.9 7.3 5.5 4.8 2.7 3.6 3.7 5.4 6.0 6.0 6.2
Net domestic assets 2.3 4.3 5.8 5.3 8.0 6.1 5.7 3.8 3.2 3.0 2.8
Credit to the public sector (net) 8.8 11.8 14.1 15.2 20.4 17.8 16.2 15.3 14.1 13.1 12.2
Credit to the private sector -3.8 -4.4 -4.9 -5.8 -6.4 -5.7 -5.1 -5.7 -5.6 -5.4 -5.1
Official capital and other items (net) -2.7 -3.1 -3.5 -4.1 -6.0 -6.0 -5.4 -5.7 -5.3 -4.7 -4.3
Monetary base 10.2 11.7 11.3 10.1 10.7 9.6 9.4 9.3 9.1 9.0 9.0
Currency issued 7.9 9.0 8.6 7.8 8.2 7.4 7.2 7.1 7.0 6.9 6.9
Bank deposits at the central bank 2.3 2.7 2.6 2.3 2.5 2.2 2.2 2.2 2.1 2.1 2.1
Net foreign assets 7.7 7.4 5.5 4.8 2.7 3.5 3.7 5.4 6.0 6.0 6.3
Net domestic assets 14.2 16.7 18.5 17.8 22.8 20.4 20.1 18.4 17.6 17.5 17.5
Credit to the public sector (net) 6.7 8.9 10.8 12.8 19.4 17.5 16.9 16.0 15.1 14.2 13.5
Credit to the private sector 14.0 15.2 15.7 13.8 14.7 13.5 12.9 12.5 12.1 12.1 12.2
Net capital, reserves, and other assets -6.5 -7.4 -8.0 -8.8 -11.4 -10.6 -9.8 -10.1 -9.5 -8.8 -8.3
Liabilities with the private sector 21.9 24.1 24.0 22.6 25.4 23.9 23.8 23.8 23.6 23.5 23.7
Currency outside banks 6.9 8.0 7.7 6.9 7.3 6.6 6.5 6.4 6.3 6.2 6.2
Local currency deposits 12.5 14.6 14.9 14.3 15.8 14.7 14.7 14.7 14.5 14.5 14.6
Foreign currency deposits 2.4 1.5 1.3 1.4 2.4 2.5 2.7 2.7 2.8 2.8 3.0
Monetary base 62.5 84.4 69.8 85.4 161.3 151.9 183.5 198.6 191.1 186.2 196.9
Foreign exchange purchases 41.1 -16.1 81.9 -69.5 127.6 48.9 241.8 151.0 102.4 124.3
Public sector 32.7 47.8 77.8 128.1 175.7 152.0 150.0 140.0 110.0 80.0 50.0
Sterilization, (net) 16.2 -5.6 7.2 -121.4 -2.4 -141.8 -15.4 -183.1 -69.9 3.9 22.6
Other items, net 0.8 1.4 0.9 -3.1 57.5 14.1 0.0 0.0 0.0 0.0 0.0
Memorandum items:
M2 1/ 381.1 534.1 670.5 867.3 1,103.7 1,422.2 1,758.7 2,122.8 2,473.1 2,814.5 3,175.5
M2 (percent change) 1/ 30.7 40.1 25.5 29.4 27.3 28.9 23.7 20.7 16.5 13.8 12.8
Gross international reserves (US$ billions) 46.4 43.3 30.6 31.4 25.6 33.3 36.5 49.2 56.5 61.2 66.6
Credit to the private sector (eop, y/y percent change) 44.8 31.5 31.2 20.2 35.6 26.4 21.2 18.4 14.8 15.3 14.0
Credit to the private sector real (eop, y/y percent change) … … … … … -9.3 0.6 0.8 1.6 4.5 4.2
Short-term deposit rate (BADLAR) 2/ 13.4 13.8 17.0 22.6 21.6 27.7 23.7 17.7 15.1 13.2 13.0
LEBAC interest rate (eop) 3/ 14.1 13.8 16.4 28.5 32.2 28.3 22.8 17.7 15.1 13.2 13.0
LEBAC real interest rate (eop) 3/ … … … … … 6.4 4.5 4.2 4.4 3.5 3.3
Sources: Banco Central de la República Argentina (BCRA) and Fund staff estimates.
1/ Currency in circulation outside banks plus peso-denominated deposits in checking and savings accounts.
2/ Average interest rate for 1-month time deposits over AR$1 million in private banks.
3/ Average of LEBAC rates of all maturities.
Changes in monetary base (y/y, in AR$ billion)
I. Central Bank (Percent of GDP)
II. Consolidated Financial System (Percent of GDP)
Proj.
II. Consolidated Financial System
I. Central Bank

ARGENTINA
48 INTERNATIONAL MONETARY FUND
Table 6. Argentina: External Debt, 2011–21
2011 2012 2013 2014 2015 2016 2017 2018 2019 2020 2021
Total external debt (gross; includes holdouts) 156.3 157.2 153.0 156.4 158.6 172.4 193.1 220.0 245.0 267.8 290.8
Percent of GDP 29.7 27.1 25.0 27.8 25.2 31.7 32.5 33.8 34.5 34.6 34.6
By maturity
Long-term 78.1 78.1 76.3 88.5 85.7 93.2 104.3 118.9 132.4 144.7 157.1
Short-term (includes arrears) 78.2 79.1 76.8 68.0 72.9 79.3 88.8 101.1 112.6 123.1 133.7
Of which: Public sector 12.7 10.9 10.7 4.6 12.2 13.2 14.8 16.9 18.8 20.5 22.3
By type of creditor
Debt to official creditors 30.4 28.1 26.5 38.4 40.2 40.6 43.1 45.6 49.5 54.5 59.0
Debt to banks 8.9 9.0 8.3 7.5 7.0 7.6 8.6 9.8 10.9 11.9 12.9
Debt to other private creditors 117.0 120.1 118.1 110.6 111.3 124.1 141.4 164.6 184.6 201.4 218.9
By type of debtor
Official debt 88.4 87.0 85.7 92.4 92.4 100.4 115.0 138.6 160.4 180.0 199.9
Bank debt 3.9 3.1 2.7 2.6 2.8 3.0 3.1 3.1 3.1 3.1 3.1
Non-financial private sector 64.0 67.1 64.6 61.4 63.3 69.1 75.1 78.3 81.5 84.7 87.9
Sources: Instituto Nacional de Estadística y Censos (INDEC), Banco Central de la República Argentina (BCRA), and Fund staff estimates.
Proj.
(Billions of U.S. dollars)

ARGENTINA
INTERNATIONAL MONETARY FUND 49
Table 7. Argentina: Public Debt, 2011–21
2011 2012 2013 2014 2015 2016 2017 2018 2019 2020 2021
Gross federal debt 829 1,040 1,413 1,996 3,046 4,162 5,203 6,377 7,400 8,233 9,141
By currency:
In domestic currency 307 399 503 666 939 1,207 1,625 1,904 2,188 2,355 2,438
In foreign currency 522 642 910 1,330 2,107 2,955 3,578 4,473 5,212 5,877 6,704
By residency:
Held by external residents 309 352 471 675 1,050 1,444 1,946 2,646 3,297 3,879 4,516
Held by domestic residents 509 675 925 1,321 1,996 2,718 3,257 3,731 4,103 4,353 4,626
Gross federal debt 38.1 39.4 42.2 43.6 52.1 51.8 51.1 51.2 50.0 48.4 47.5
By currency:
In domestic currency 14.1 15.1 15.0 14.5 16.1 15.0 16.0 15.3 14.8 13.8 12.7
In foreign currency 24.0 24.3 27.2 29.0 36.1 36.7 35.2 35.9 35.2 34.5 34.8
By residency:
Held by external residents 3/ 14.2 13.4 14.1 14.7 18.0 18.0 19.1 21.2 22.3 22.8 23.4
Held by domestic residents 23.4 25.6 27.6 28.8 34.2 33.8 32.0 29.9 27.7 25.6 24.0
Sources: Ministerio de Economía y Finanzas Públicas and Fund staff estimates.
(Billions of Argentine pesos)
(Percent of GDP)
Proj.

ARGENTINA
50 INTERNATIONAL MONETARY FUND
Annex I. External Sector Assessment
Argentina’s external position is judged to be vulnerable to growing imbalances on the current account
and exchange rate. The current account deficit is estimated to be about 2 percent of GDP above level
implied by medium-term fundamentals and desirable policies. Since the 40 percent nominal
devaluation in December 2015, the real exchange rate has undergone an important appreciation as
strong capital inflows sustained a largely unchanged nominal exchange rate while a large wage and
price inflation differential with trading partners eroded competitiveness. The Argentine peso is
estimated to be overvalued by around 10–15 percent in 2016. Reserves are judged to be well below
adequate levels, and the significant reliance on debt-creating portfolio capital flows (including to
finance the public sector) makes Argentina vulnerable to a disruption to inward capital flows.
A. Current Account
Argentina’s current account (CA) balance
deteriorated substantially in recent years, from
near balance in 2012 to -2½ percent of GDP in
2015. This reflected falling commodity prices and a
nearly 50 percent real appreciation of the peso
between 2012 and November 2015, that weakened
competitiveness. A sharp worsening of the energy
trade balance due to domestic policy distortions
was also a factor.
The worsening of the CA reflected a sharp
decrease of national savings even as investment
levels fell. The strength in the peso, rising real wages, and accelerating inflation encouraged private
consumption while the growth in current spending increased public sector dissaving. However, the
true increase in external imbalances was masked by a range of controls.1 These included a tight
system of administrative controls to restrict both imports and the access to foreign exchange to
make payments for those imports that were approved. The availability of FX to make dividend
remittances was also limited. Since the new government took office in December 2015, most of the
controls have been lifted (see Annex Table 1) although non-automatic import licenses still apply to a
subset of products and services.
1 Also, the non-payments to the ‘holdout creditors’ helped mask the current account deficit, as the unpaid interest on
this debt was not included in the official current account balance.
115
120
125
130
135
140
145
150
-3
-2
-1
0
2012 2013 2014 2015 2016
Current Account and Terms of Trade
(Percent of GDP unless otherwise indicated)
Current account
Terms of trade (index, 2004=100; rhs)
Sources: INDEC and Fund staff calculations and estimates.

ARGENTINA
INTERNATIONAL MONETARY FUND 51
The CA deficit is expected to worsen over the medium term. The CA balance is expected to
improve slightly in 2016 (-2.3 percent of GDP) as the peso devaluation and the removal of trade
restrictions and export taxes were offset by weak external demand and higher net income outflows.
However, from 2017 onward, the steady upward movement in the real exchange rate, increased
dividends from higher FDI stocks, and higher debt service payment (as the public sector builds
external debt) will cause the CA deficit to rise to 4.2 percent of GDP by 2021 (5.0 in cyclically-
adjusted terms).2
While there is much uncertainty, the CA deficit in 2016 appears to be above levels consistent
with medium-term fundamentals and desirable policies. The CA assessment is made relative to
the expected 2016 CA position given the significant external payments distortions present in the
2015 CA outturn (which were largely addressed in 2016). The CA-regression approach of using the
EBA methodology yields a cyclically-adjusted CA norm of close to –1 percent of GDP. The desirable
fiscal stance assumed in this estimate is based on a reduction of the overall general government
fiscal deficit by about 4 percent of GDP over the medium term (consistent with the authorities’
announced fiscal consolidation plans and staff’s baseline). It also assumes an increase in the FX
reserves over the medium term to close to US$70 billion. With a 2016 cyclically-adjusted CA
expected to be about 2¾ percent of GDP, the CA gap in 2016 is estimated at about -1½ percent of
GDP. The external stability (ES) approach suggests that the current account balance needed to
stabilize the IIP position to the staff’s estimated steady-state value is about -¾ percent of GDP.
2 Prior to the exchange rate unification, staff and market estimates of FX overhang potentially arising from arrears on
imports and dividend payments amounted to about US$8 billion and US$9 billion, respectively. However, as FX
controls have been reduced since December 2015 and capital inflows to Argentina picked up, there has been little
evidence of FX pressures from these sources, suggesting that the estimates of import arrears may have been
overstated while dividends have likely been reinvested in the country.
-5
0
5
10
15
20
25
2006 2008 2010 2012 2014 2016
National Saving
(Percent of GDP)
Total
Private
Public
Sources: INDEC and Fund staff estimates.
0
5
10
15
20
25
2006 2008 2010 2012 2014 2016
Domestic Investment
(Percent of GDP)
Total
Private
Public
Sources: INDEC and Fund staff estimates.

ARGENTINA
52 INTERNATIONAL MONETARY FUND
B. Capital and Financial Accounts
Financial account restrictions, which had been building since 2002, reached a peak in 2011–15.
Access to foreign exchange for residents—including foreign exchange purchases for savings, direct
investment abroad and commercial banks’ foreign
exchange position—was severely restricted to
contain capital flight. The lack of access to
international capital markets meant that foreign
financing was largely limited to relatively low levels
of FDI. Indeed, over the last 15 years, FDI net
inflows to Argentina were almost half that of its
peers (reflecting an unstable macroeconomic
climate and weak investor confidence) leading to
lower levels of leverage among both the public and
private sectors.
Despite controls, it is likely that significant capital left through informal channels. Capital
account controls likely led to increased
circumvention of official channels to move
resident assets abroad. While there is no
directional bias in balance of payments ‘errors
and omissions’, it is likely that substantial over-
invoicing of imports payments occurred in the
past. Furthermore, resident-held wealth,
undeclared to the tax authorities, is thought to be
substantial (although it is difficult to assess its
evolution over time, given lack of data). For
instance, International Investment Position (IIP)
data indicates that ‘other investment’ foreign
assets were US$210 billion in 2015 (only US$30 billion has been declared to the tax authorities).
Foreign exchange controls have all but been eliminated. In December 2015, the authorities
rolled back many of the formal and informal controls on foreign exchange transactions, and further
steps were taken through August of this year to liberalize the system (see Annex Table 1). These
steps not only lifted the restrictive system put in place in 2011 (the “cepo cambiario”) but brought
Argentina to its most liberal foreign exchange system since 2001.
In the first half of 2016, the removal of most controls and a return to international markets
have led to a significant increase in gross flows in both directions. The removal of capital
controls allowed residents to officially move money abroad on a large scale through formal channels
for the first time since 2011 (estimated to be US$6 billion in 2016H1). In addition, in
the first half of 2016 an agreement with creditors caused the federal government to issue
US$19.3 billion of external debt to cover the principal payments on previously un-restructured debt
0
2
4
6
20
00
20
01
20
02
20
03
20
04
20
05
20
06
20
07
20
08
20
09
20
10
20
11
20
12
20
13
20
14
20
15
FDI
(Percent of GDP)
Average of Brazil, Chile, Colombia, Mexico, Peru, and
Uruguay
Argentina
Sources: IMF, World Economic Outlook database and staff
calculations.
-2
0
2
4
6
8
10
2010Q2 2011Q2 2012Q2 2013Q2 2014Q2 2015Q2 2016Q2
Capital Outflows
(Billions of U.S. dollars)
BoP flow restrictions
Sources: INDEC and Fund staff calculations.

ARGENTINA
INTERNATIONAL MONETARY FUND 53
(and the arrears on debt restructured under Argentina’s 2005 and 2010 debt exchange) and for
federal budget financing.
For the remainder of 2016, public external debt issuance should subside, and capital outflows
will moderate. The authorities are unlikely to issue any substantial new external debt for the
remainder of the year. Some external assets are assumed to be repatriated in order to purchase
domestically issued debt. This includes inflows from abroad to take advantage of the proposed tax
amnesty, which is assumed to be around US$2.2billion in 2016H2 (plus a similar amount from
domestically held wealth), and US$1.2bn in 2017H1 (again, with a similar amount from domestic
wealth).
Looking forward, public debt issuance and growing FDI will finance the current account over
the medium term. The government is expected to rely extensively on external debt issuance to
finance its fiscal deficit. Net external federal government bond issuance will average around
US$17 billion per year over 2017–21, in addition to around US$5 billion a year from IFIs. Such
large-scale issuance will have a crowding out effect on private sector net borrowing. Similarly, the
appreciating exchange rate will create a disincentive for net private inflows. FDI is expected to
increase gradually from around 1.8 percent of GDP (accruals basis) in 2015 to about 3 percent in
2021, as foreign investors finance an increasingly large proportion of domestic investment and
spending.
C. FX Intervention and Reserves
Following the 2001/2 crisis, a shift to significant current account surpluses due to the sharp
50 percent depreciation of the real exchange rate allowed the authorities to amass significant
reserves. Gross international reserves peaked in
2010 at US$52 billion (9-months import cover).
These purchases helped maintain a competitive
exchange rate, and provided buffers to withstand
temporary shocks.
Since 2010, external imbalances grew, and this
was reflected in a steady decline of reserve
coverage. Since 2010, the FX reserves were used to
service foreign currency denominated federal
government debt, with an overall cost of
US$55 billion. Reserves were also used to finance
private capital outflows and the growing CA deficit.
By end-2015, gross reserves were US$25.6 billion (58 percent of the IMF’s reserve adequacy metric,
with capital controls), while net reserves (gross reserve currency assets minus short-term FX
obligations) declined to around zero.
0
2
4
6
8
10
12
-30
-10
10
30
50
70
2010 2011 2012 2013 2014 2015
Gross International Reserves
(Billions of U.S. dollars)
Current account
Reserves
Reserves in months of imports (rhs)
Sources: INDEC and Fund staff calculations.

ARGENTINA
54 INTERNATIONAL MONETARY FUND
However, even this reserve drawdown was insufficient to meet the balance of payments
pressures, and the central bank intervened through selling significant amounts of foreign
exchange futures. Throughout 2015, the central
bank confronted devaluation expectations by
building a net short position in foreign exchange
futures in the local market (that settle in pesos) that
peaked in December at US$17.4 billion. The heavy
intervention in the domestic futures market,
combined with capital controls that prevented full
arbitrage, caused a substantial gap between rates
in the local and offshore markets. This led to losses
totaling AR$53.7 billion on the central bank’s
balance sheet (once the FX controls were lifted, the
exchange rate corrected, and the contracts
matured).
Since the floating and unification of the exchange rate in December 2015, there has been
relatively little FX intervention, and the central
bank has generally allowed the exchange rate
to adjust with market forces. The central bank
did sell US$0.7 billion in late February to contain
an ongoing depreciation of the peso but, since
then, has allowed the exchange rate to be
determined by market forces. As of end-August,
gross reserves were US$31.2 billion amounting to
5.4 months of import cover or 71 percent of the
IMF’s reserve adequacy metric. A large part of the
reserves (US$11 billion) is from a renminbi swap
line with China. In addition, the central bank’s FX
assets include around US$11 billion of reserve
requirements for FX bank deposits. Other short-term FX liabilities include a US$2.5 billion loan from
the BIS and a US$1 billion a repo with foreign banks.
By end-2016, reserves are expected to grow by a further US$2.2 billion, mainly as a result of
resident inflows under the tax amnesty program. While the regular net issuance of the provincial
and federal government for the remainder of the year will be around zero, the tax amnesty is
expected to draw in around US$4.5 billion in 2016 (includes tax payments and investments in
bonds/investment fund, from both domestic and external sources). This will help the government
build additional reserves of around US$2.2 billion, leaving end-2016 at US$33.3 billion (5.7 months
import cover).
0
10
20
30
40
50
60
70
1998
2000
2002
2004
2006
2008
2010
2012
2014
2016
ARA Metric Decomposition
(Billions of U.S. dollars)Export revenues
Broad money
Short-term Debt
Other Liabilities
Reserves
Sources: BCRA and Fund staff calculations and estimates.
Net reserves
Swap line, China
FX deposits
Repo with banks
BIS loanOther FX liabilities
31.2
0
5
10
15
20
25
30
35
Aug-16
International Reserves
(Billions of U.S. dollars)
Sources: BCRA and Fund staff calculations.

ARGENTINA
INTERNATIONAL MONETARY FUND 55
Reserves will increase substantially over the coming years funded by large-scale public debt
issuance. The significant net public debt issuance is likely to help build foreign exchange reserves to
around US$67 billion, or 8.7 months import cover with an assumption that the BCRA will purchase
these proceeds from the FX market. The pace of reserve accumulation envisaged in the baseline
would mitigate the pressure on the REER and provide important buffers for temporary external
shocks.
D. Real Exchange Rate
Argentina’s REER has appreciated significantly in
recent years. After the sharp devaluation in 2001
Argentina’s REER began a steady appreciation
trajectory that accelerated over the last few years
despite a one-off correction in 2014. By November
2015, the REER-CPI had doubled compared to its
end-2007 level. The bilateral real exchange with
Brazil, Argentina major trading partner, followed a
similar trend, with the ULC-based bilateral RER up
75 percent by end-2015 from its end-2007 level
(reflecting the greater increase in unit labor costs in
Argentina).
The stronger real value of the peso may have
hindered external competiveness. Since 2009,
Argentina’s share of world export markets has
steadily declined, as commodity prices have fallen
and non-price competitiveness has weakened.
However, this broad trend masks heterogeneity
between products. The loss of market shares was
greatest for Argentina’s main primary products
(cereals, soybeans) and energy products, also
reflecting high export taxes, export restrictions, and
domestic policies of regulated prices and subsidies
that discouraged investment and activity in these
sectors (see Selected Issues Paper, Chapter 6).
The removal of most FX controls in mid-December
2015 resulted in an immediate 40 percent
devaluation of the peso. However, since March
2016, debt-creating portfolio inflows (as the economy
re-leveraged through external financial markets) have
sustained the nominal exchange rate within a narrow
range. At the same time, the surge in domestic wage
40
60
80
100
120
140
160
180
1998M8 2001M8 2004M8 2007M8 2010M8 2013M8 2016M8
RER_US
REER (IMF)
REER (BCRA)
Multilateral and Bilateral CPI-based Real
Exchange Rates
(Index, historical average=100)
Sources: Haver Analytics, BCRA, and Fund staff estimates.
40
80
120
160
200
20
02
Q2
20
03
Q2
20
04
Q2
20
05
Q2
20
06
Q2
20
07
Q2
20
08
Q2
20
09
Q2
20
10
Q2
20
11
Q2
20
12
Q2
20
13
Q2
20
14
Q2
20
15
Q2
20
16
Q2
ULC-based
CPI-based
Bilateral Real Exchange Rate with Brazil, CPI-
and ULC-based (Index, 2002Q1=100)
Sources: Haver Analytics, BCRA, and Fund staff estimates.
0.40
0.47
0.35
2004 2005 2006 2007 2009 2010 2011 2012 2014 2015
Argentina's Export Share in World Exports
(Percent, 4-quarter m.a.)
Sources: IMF Direction of Trade Statistics and Fund staff
calculations.
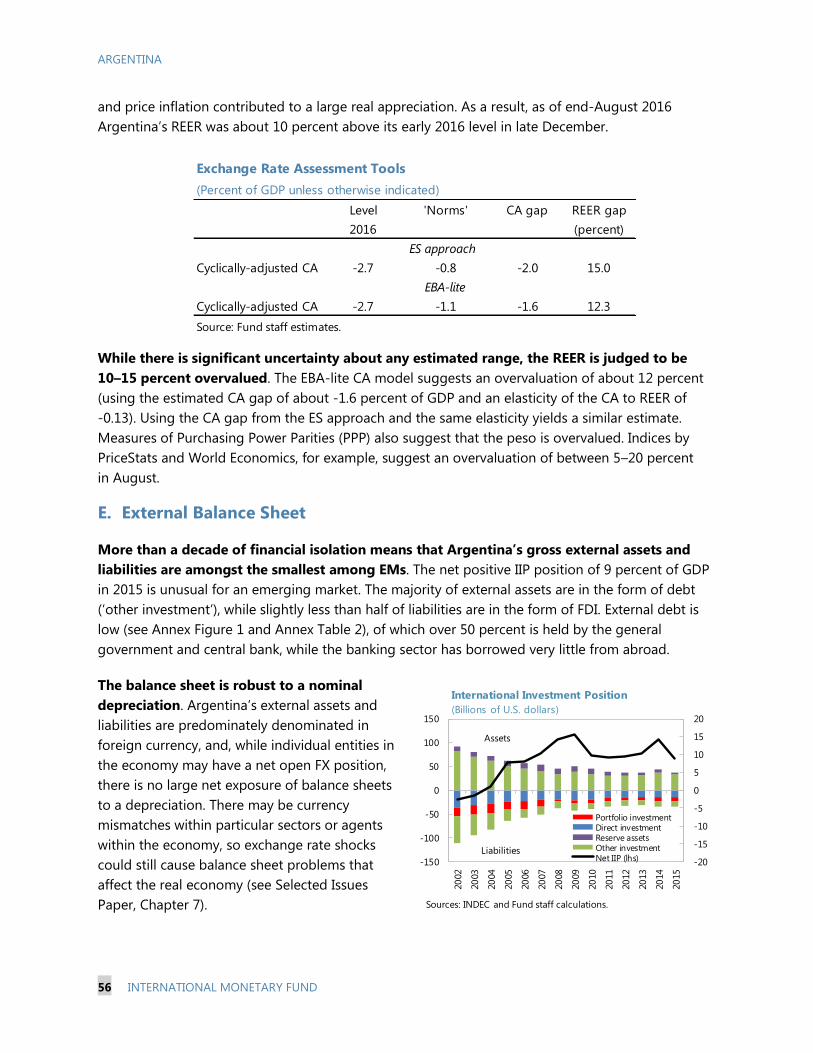
ARGENTINA
56 INTERNATIONAL MONETARY FUND
and price inflation contributed to a large real appreciation. As a result, as of end-August 2016
Argentina’s REER was about 10 percent above its early 2016 level in late December.
While there is significant uncertainty about any estimated range, the REER is judged to be
10–15 percent overvalued. The EBA-lite CA model suggests an overvaluation of about 12 percent
(using the estimated CA gap of about -1.6 percent of GDP and an elasticity of the CA to REER of
-0.13). Using the CA gap from the ES approach and the same elasticity yields a similar estimate.
Measures of Purchasing Power Parities (PPP) also suggest that the peso is overvalued. Indices by
PriceStats and World Economics, for example, suggest an overvaluation of between 5–20 percent
in August.
E. External Balance Sheet
More than a decade of financial isolation means that Argentina’s gross external assets and
liabilities are amongst the smallest among EMs. The net positive IIP position of 9 percent of GDP
in 2015 is unusual for an emerging market. The majority of external assets are in the form of debt
(‘other investment’), while slightly less than half of liabilities are in the form of FDI. External debt is
low (see Annex Figure 1 and Annex Table 2), of which over 50 percent is held by the general
government and central bank, while the banking sector has borrowed very little from abroad.
The balance sheet is robust to a nominal
depreciation. Argentina’s external assets and
liabilities are predominately denominated in
foreign currency, and, while individual entities in
the economy may have a net open FX position,
there is no large net exposure of balance sheets
to a depreciation. There may be currency
mismatches within particular sectors or agents
within the economy, so exchange rate shocks
could still cause balance sheet problems that
affect the real economy (see Selected Issues
Paper, Chapter 7).
Exchange Rate Assessment Tools
(Percent of GDP unless otherwise indicated)
Level 'Norms' CA gap REER gap
2016 (percent)
ES approach
Cyclically-adjusted CA -2.7 -0.8 -2.0 15.0
EBA-lite
Cyclically-adjusted CA -2.7 -1.1 -1.6 12.3
Source: Fund staff estimates.
-20
-15
-10
-5
0
5
10
15
20
-150
-100
-50
0
50
100
150
20
02
20
03
20
04
20
05
20
06
20
07
20
08
20
09
20
10
20
11
20
12
20
13
20
14
20
15
Portfolio investmentDirect investmentReserve assetsOther investmentNet IIP (lhs)
International Investment Position
(Billions of U.S. dollars)
Sources: INDEC and Fund staff calculations.
Liabilities
Assets
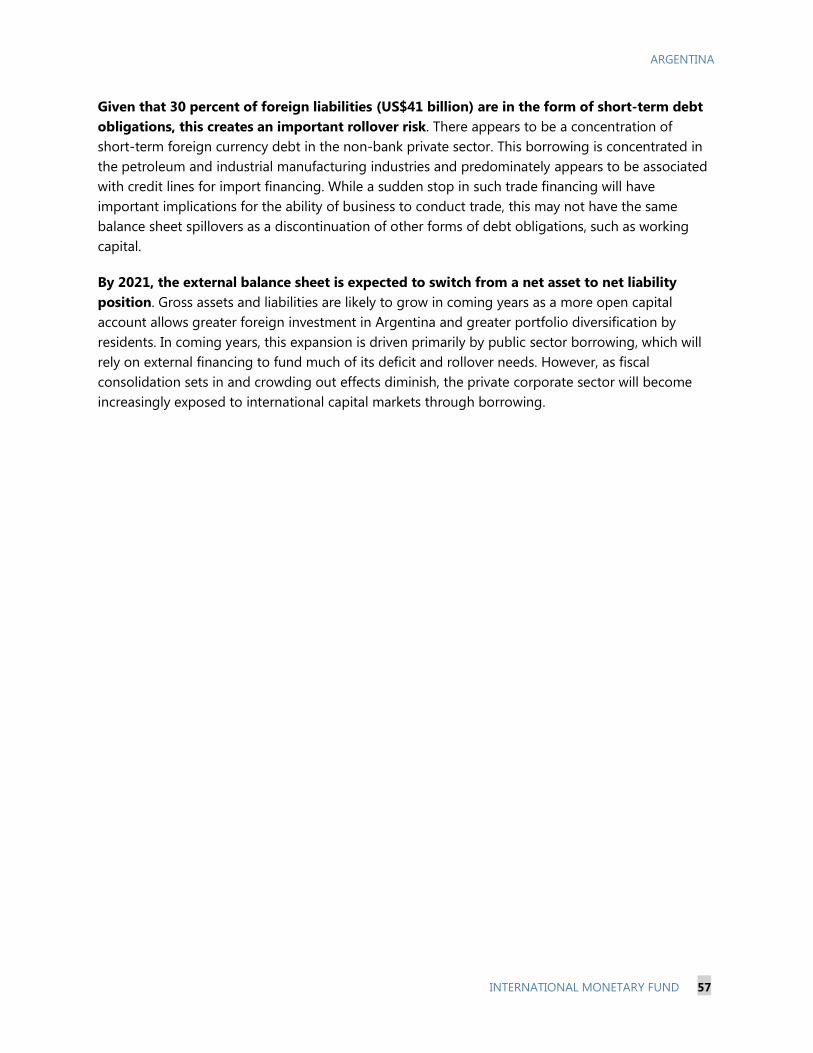
ARGENTINA
INTERNATIONAL MONETARY FUND 57
Given that 30 percent of foreign liabilities (US$41 billion) are in the form of short-term debt
obligations, this creates an important rollover risk. There appears to be a concentration of
short-term foreign currency debt in the non-bank private sector. This borrowing is concentrated in
the petroleum and industrial manufacturing industries and predominately appears to be associated
with credit lines for import financing. While a sudden stop in such trade financing will have
important implications for the ability of business to conduct trade, this may not have the same
balance sheet spillovers as a discontinuation of other forms of debt obligations, such as working
capital.
By 2021, the external balance sheet is expected to switch from a net asset to net liability
position. Gross assets and liabilities are likely to grow in coming years as a more open capital
account allows greater foreign investment in Argentina and greater portfolio diversification by
residents. In coming years, this expansion is driven primarily by public sector borrowing, which will
rely on external financing to fund much of its deficit and rollover needs. However, as fiscal
consolidation sets in and crowding out effects diminish, the private corporate sector will become
increasingly exposed to international capital markets through borrowing.

ARGENTINA
58 INTERNATIONAL MONETARY FUND
Selected Prior Controls Current status
Some sectors were given a monthly quota of dollars to
pay for their imports (Sep 2014)Control eliminated
Informal prior authorization from the central bank
required to make import payments (Dec 2011,
tightened Jun 2013, Oct 2013, Sep 2014, Feb 2015, Oct
2015, Nov 2015)
Control eliminated
Informal prior authorization and limits imposed by the
central bank on dividend payments Control eliminated
Informal requirement that importers match the volume
of imports with similar amount of FX inflows (exports
or FDI) (Feb 2014)
Control eliminated
Importers required to provide detailed information on
owners, employees, investment plans, etc. to get their
imports approved (Nov 2014)
Control eliminated
Temporary blockade on all import payments (Feb
2015)Control eliminated
Commercial banks needed to provide detailed
information on transactions and obtain central bank
approval before issuing letters of credit to importers
(Feb 2015)
Control eliminated
Ban on banks lending in pesos to exporters, designed
to force them to get dollar financing and thus increase
FX supply (Nov 2013)
Control eliminated
Prior authorization from the tax agency to purchase
dollars for savings (‘dólar ahorro’) (Oct 2011, tightened
Jul 2012, partially eased Jan 2014)
Control eliminated
FX purchases for tourism subject to controls and
required an authorization from the federal tax agency
(with a 35 percent tax surcharge since end-2013 that
also covers the use of credit and debit cards abroad)
(May 2012, tightened Aug 2012, Sep 2012, Mar 2013,
May 2013, Dec 2013)
Control eliminated
Web-based purchases abroad require prior
authorization and are limited to two transactions of up
to $25 per year. (Jan 2014)
Control eliminated
Cap on banks’ net FX position, including holdings of
cash and dollar bonds, and the net FX futures position
(tightened Feb 2014, Sep 2014, Nov 2015)
Control eased (maximum limit for banks’ net FX
position raised to 15% of computed capital).
Restriction on capital inflows: mandatory 365-day
unremunerated deposit equivalent to 30% of capital
inflow (2005)
Control eliminated (deposit amount reduced to 0%)
Restriction on FX transfers (inflows and outflows)
between local and foreign bank accounts.Control eliminated
Annex Table 1. Summary of Foreign Exchange Controls
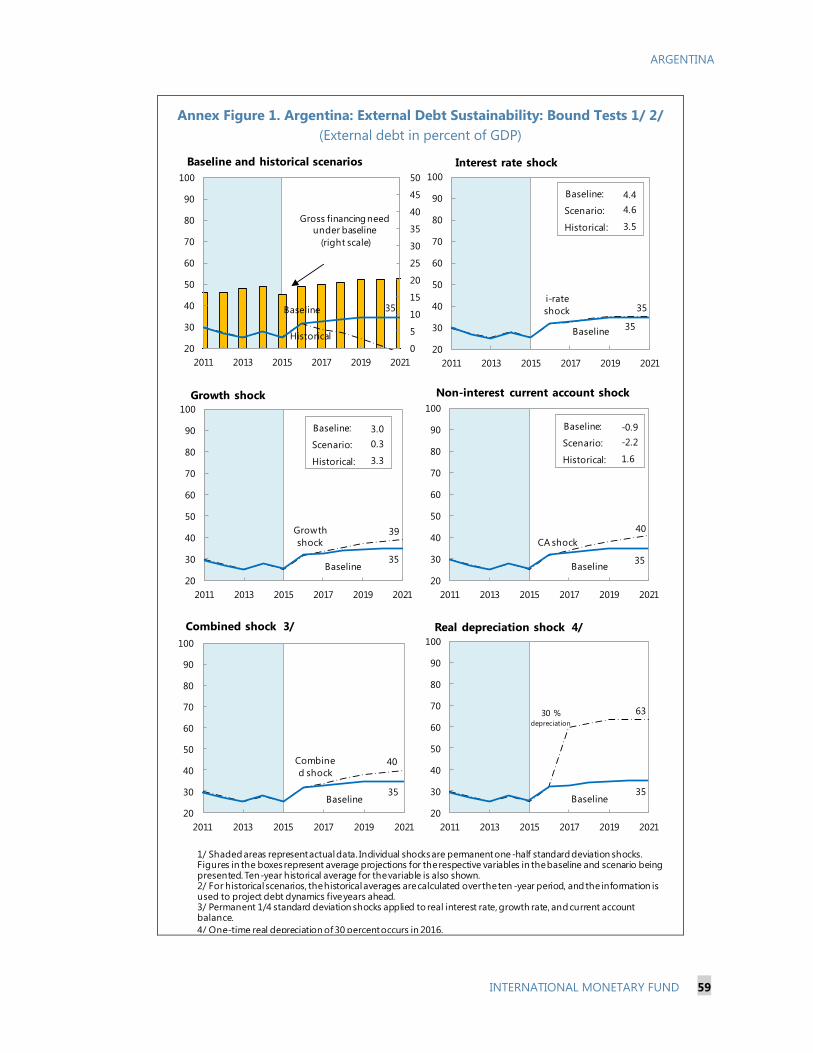
ARGENTINA
INTERNATIONAL MONETARY FUND 59
Annex Figure 1. Argentina: External Debt Sustainability: Bound Tests 1/ 2/
(External debt in percent of GDP)
i-rate
shock 35
Baseline35
20
30
40
50
60
70
80
90
100
2011 2013 2015 2017 2019 2021
Interest rate shock
1/ Shaded areas represent actual data. Individual shocks are permanent one-half standard deviation shocks. Figures in the boxes represent average projections for the respective variables in the baseline and scenario being presented. Ten-year historical average for the variable is also shown. 2/ For historical scenarios, the historical averages are calculated over the ten -year period, and the information is used to project debt dynamics five years ahead.3/ Permanent 1/4 standard deviation shocks applied to real interest rate, growth rate, and current account balance.
4/ One-time real depreciation of 30 percent occurs in 2016.
Historical
Baseline 35
0
5
10
15
20
25
30
35
40
45
50
20
30
40
50
60
70
80
90
100
2011 2013 2015 2017 2019 2021
Baseline and historical scenarios
CA shock
40
Baseline35
20
30
40
50
60
70
80
90
100
2011 2013 2015 2017 2019 2021
Non-interest current account shock
Combine
d shock 40
Baseline35
20
30
40
50
60
70
80
90
100
2011 2013 2015 2017 2019 2021
Combined shock 3/
30 % depreciation
63
Baseline35
20
30
40
50
60
70
80
90
100
2011 2013 2015 2017 2019 2021
Real depreciation shock 4/
Gross financing need
under baseline
(right scale)
Growth
shock 39
Baseline35
20
30
40
50
60
70
80
90
100
2011 2013 2015 2017 2019 2021
Growth shock
Baseline:
Scenario:
Historical:
4.4
4.6
3.5
Baseline:
Scenario:
Historical:
3.0
0.3
3.3
Baseline:
Scenario:
Historical:
-0.9
-2.2
1.6

ARGENTINA
60 INTERNATIONAL MONETARY FUND
Annex Table 2. Argentina: External Debt Sustainability Framework, 2011–21
(In percent of GDP, unless otherwise indicated)
Projections
2011 2012 2013 2014 2015 2016 2017 2018 2019 2020 2021 Debt-stabilizing
non-interest
current account 6/
Baseline: External debt 29.6 27.1 25.0 27.8 25.2 31.7 32.5 33.8 34.5 34.6 34.6 -3.4
Change in external debt -4.6 -2.5 -2.1 2.7 -2.6 6.6 0.8 1.3 0.8 0.1 0.0
Identified external debt-creating flows (4+8+9) -7.6 -4.9 -1.0 2.9 -2.2 0.3 -0.6 -0.7 -0.6 -0.7 -0.6
Current account deficit, excluding interest payments -0.1 -0.6 1.1 0.5 1.7 0.5 0.7 0.8 0.9 1.0 1.2
Deficit in balance of goods and services -5.2 -5.2 -3.2 -3.5 -2.2 -3.4 -2.4 -2.2 -1.8 -1.5 -1.1
Exports 18.7 16.4 14.8 14.6 11.2 13.0 12.0 11.2 10.7 10.4 9.9
Imports 13.4 11.2 11.7 11.1 9.1 9.7 9.5 9.1 8.9 8.8 8.8
Net non-debt creating capital inflows (negative) -1.7 -2.4 -1.5 -0.6 -1.8 -1.8 -1.9 -1.9 -1.9 -2.0 -2.0
Automatic debt dynamics 1/ -5.8 -1.8 -0.6 3.1 -2.1 1.6 0.6 0.5 0.4 0.3 0.2
Contribution from nominal interest rate 0.9 0.9 0.8 1.0 0.8 1.1 1.4 1.3 1.3 1.3 1.3
Contribution from real GDP growth -1.7 0.3 -0.6 0.7 -0.6 0.5 -0.8 -0.8 -0.9 -1.0 -1.0
Contribution from price and exchange rate changes 2/ -5.0 -3.0 -0.8 1.4 -2.3 ... ... ... ... ... ...
Residual, incl. change in gross foreign assets (2-3) 3/ 3.0 2.4 -1.1 -0.2 -0.4 6.3 1.4 1.9 1.4 0.7 0.5
External debt-to-exports ratio (in percent) 158.8 165.2 168.7 190.1 223.9 243.1 271.2 300.3 322.7 333.9 348.5
Gross external financing need (in billions of US dollars) 4/ 86.2 95.3 106.4 100.4 99.8 98.9 111.3 124.5 141.5 157.0 172.7
in percent of GDP 16.3 16.4 17.4 17.8 15.8 10-Year 10-Year 18.2 18.7 19.1 20.0 20.3 20.5
Scenario with key variables at their historical averages 5/ 31.7 29.0 27.1 24.5 21.5 18.3 -3.3
Historical Standard
Key Macroeconomic Assumptions Underlying Baseline Average Deviation
Real GDP growth (in percent) 6.0 -1.0 2.4 -2.5 2.5 3.3 5.3 -1.8 2.7 2.8 2.9 3.1 3.3
GDP deflator in US dollars (change in percent) 17.3 11.1 3.0 -5.4 9.1 9.1 8.5 -12.2 6.4 6.7 5.8 5.7 5.3
Nominal external interest rate (in percent) 3.4 3.2 3.2 3.5 3.3 3.5 0.4 3.9 4.9 4.5 4.3 4.1 4.0
Growth of exports (US dollar terms, in percent) 20.4 -3.3 -4.7 -9.3 -13.9 5.4 17.0 0.1 0.4 2.9 3.6 5.6 4.1
Growth of imports (US dollar terms, in percent) 30.7 -8.1 9.6 -12.4 -8.4 10.3 24.7 -8.2 8.0 4.0 7.1 8.2 8.0
Current account balance, excluding interest payments 0.1 0.6 -1.1 -0.5 -1.7 1.6 2.6 -0.5 -0.7 -0.8 -0.9 -1.0 -1.2
Net non-debt creating capital inflows 1.7 2.4 1.5 0.6 1.8 1.8 0.6 1.8 1.9 1.9 1.9 2.0 2.0
1/ Derived as [r - g - r(1+g) + ea(1+r)]/(1+g+r+gr) times previous period debt stock, with r = nominal effective interest rate on external debt; r = change in domestic GDP deflator in US dollar terms, g = real GDP growth rate,
e = nominal appreciation (increase in dollar value of domestic currency), and a = share of domestic-currency denominated debt in total external debt.
2/ The contribution from price and exchange rate changes is defined as [-r(1+g) + ea(1+r)]/(1+g+r+gr) times previous period debt stock. r increases with an appreciating domestic currency (e > 0) and rising inflation (based on GDP deflator).
3/ For projection, line includes the impact of price and exchange rate changes.
4/ Defined as current account deficit, plus amortization on medium- and long-term debt, plus short-term debt at end of previous period.
5/ The key variables include real GDP growth; nominal interest rate; dollar deflator growth; and both non-interest current account and non-debt inflows in percent of GDP.
6/ Long-run, constant balance that stabilizes the debt ratio assuming that key variables (real GDP growth, nominal interest rate, dollar deflator growth, and non-debt inflows in percent of GDP) remain at their levels
of the last projection year.
Actual
Annex Table 2. Argentina: External Debt Sustainability Framework, 2011-2021
(In percent of GDP, unless otherwise indicated)
AR
GEN
TIN
A
50
INTER
NA
TIO
NA
L MO
NETA
RY
FU
ND

ARGENTINA
INTERNATIONAL MONETARY FUND 61
Annex II. Potential Cross Border Spillovers
Argentina is a relatively closed economy, with modest trade and small financial linkages with the rest
of the world. A significant decline in growth in Brazil, China or the U.S. would, however, have a
material impact on exports and growth performance. Food commodity price shocks are also a source
of vulnerability. Argentina’s relative isolation from international capital markets, its positive net IIP
position, and the absence of large maturity and currency external balance sheet mismatches suggest
that vulnerabilities from external financial shocks are limited at present. A few regional economies are
highly dependent on imports from Argentina, in particular Bolivia and Trinidad and Tobago.
A. Inward Spillovers
International trade makes up a small component of GDP, and exports are relatively well
diversified in terms of market destination.
Argentina has the smallest ratio of exports to
GDP of all Latin American EMs—12 percent of
GDP in 2015, compared to an average of
24 percent across the region. This follows a
steady decline in importance of trade in the
economy since 2004, when the ratio was
21 percent. Compared to its regional peers,
Argentina is fairly well diversified in terms of
export market destinations,1 although about
40 percent of its exports still go to its 5 largest
export markets (average of 2014–15)—Brazil
(19 percent), China (7½ percent), the U.S. (6 percent), Chile (4 percent), and India (3 percent). Lower
activity in these economies will have an impact on Argentina’s exports and growth.
Cluster analysis suggests that Argentina is connected to the rest of world trade through the
United States. Examining the network characteristics2 of international bilateral trade links identifies
three major global trade ‘nodes’—the U.S., China, and Germany. Argentina forms part of the U.S.
trade cluster. This suggests that second-round effects from U.S. activity are also important—for
example, a decline in U.S. growth will also weaken activity in countries such as Brazil, Chile, and
Mexico, which will then impact trade with Argentina. The U.S. economy is also likely to be the main
conduit for shocks originating in the rest of the world.
1 As measured by an “export Gini coefficient”, which measures the share of exports by destination market compared
to a hypothetical scenario where exports are shared evenly across all possible markets. If exports were spread evenly
across all countries (‘full diversification’), then the coefficient would equal zero. If all exports went to one country (‘no
diversification’), the coefficient would equal one.
2 This analysis uses Hierarchical Network Navigator application on the MapEquation website. The tool uses an
algorithm developed by Rosvall and Bergstrom (2011)—Multilevel Compression of Random Walks on Networks
Reveals Hierarchical Organization in Large Integrated Systems.
0.65
0.70
0.75
0.80
0.85
0.90
Greater export
market diversity
Export Market Diversification
("Export Gini coefficient")
Sources: IMF, Direction of Trade Statistics and staff calculations.

ARGENTINA
62 INTERNATIONAL MONETARY FUND
Argentina’s export concentration in agricultural
commodities exposes it to commodity price shocks.
As of 2015, over 60 percent of exports is constituted by
agricultural commodities, comprising both primary
products and agriculture related manufacturing
products (vehicle exports make up a further 10 percent
of the total). The degree of diversification has declined
since 2005 largely driven by the growing specialization
in soy and cereal products. This leaves Argentina
vulnerable to shocks to global agricultural prices. For
example, a 10 percent decline in global agricultural
commodity prices would lead to around a 2 percent
decline in overall export values (direct effects only).
Relative isolation from international capital markets
shields Argentina from financial spillovers. As
discussed in detail in Chapter 7 of the Selected Issues
Paper, Argentina has relatively few links to international capital markets, and its positive net IIP position,
and the absence of significant currency or maturity mismatches imply that risks from external financial
stocks are contained. While 95 percent of portfolio investments are reported to be from the U.S. (CPIS
database), the ultimate holders of these liabilities are likely to be more broadly globally diffused.
B. Outward Spillovers
A number of regional economies are reliant on Argentina as an export market. Exports to
Argentina from Bolivia and Trinidad and Tobago (mainly liquefied natural gas) account for
17 percent and 13 percent of their total exports, respectively. This suggests that potential outward
trade spillovers to these countries could be large. Paraguay, Brazil, and Uruguay supply around
6 percent of their exports to Argentina, suggesting
a modest degree of interconnectedness, but not
enough to pose a major vulnerability to these
economies.
Argentina is unlikely to be a major source of
regional financial spillover risk. The crisis in the
early 2000s generated regional financial spillovers,
especially in Uruguay given its reliance on
Argentine resident deposits in the domestic
banking sector. These regional financial links are
much smaller today, with most financial assets
concentrated in global financial centers. Over 80
percent of Argentine portfolio assets (as reported by other economies) are concentrated in the U.S.,
Luxembourg, Italy, and the United Kingdom. Only 2 percent are reported to be held in Brazil, with
virtually no holdings in the rest of the region.
Network map
Sources: IMF, World Economic Outlook database, Mapequation website and Fund staff calculations.
0
4
8
12
16
20
10 Largest Exporters to Argentina
(Percent of exporter total exports)
Sources: Direction of Trade Statistics and Fund staff calculations.

ARGENTINA STAFF REPORT FOR THE 2016 ARTICLE IV CONSULTATION—
DEBT SUSTAINABILITY ANALYSIS
Prepared By
The Western Hemisphere Department
(In consultation with other departments)
PUBLIC DEBT SUSTAINABILITY ANALYSIS ___________________________________________ 2
A. Background __________________________________________________________________________ 2
B. Baseline Scenario ____________________________________________________________________ 3
C. Shocks and Stress Tests ______________________________________________________________ 5
BOX
1. Fiscal Outlook for Provinces __________________________________________________________ 4
TABLE
1. Federal Government—Funding Envelope and Sources _______________________________ 7
FIGURES
1. Public Sector Debt Sustainability Analysis (DSA)—Baseline Scenario _________________ 8
2. Public DSA—Composition of Public Debt and Alternative Scenarios _________________ 9
3. Public DSA—Realism of Baseline Assumptions ______________________________________ 10
4. Public DSA—Stress Tests ____________________________________________________________ 11
5. Public DSA—Risk Assessment _______________________________________________________ 12
CONTENTS
October 19, 2016

ARGENTINA
2 INTERNATIONAL MONETARY FUND
PUBLIC DEBT SUSTAINABILITY ANALYSIS
Federal government gross debt is 52 percent of GDP and is expected to decline slightly in the medium
term, as the improvement in the primary balance is largely offset by higher interest payments. Risks to
solvency are modest but there are vulnerabilities from the high share of external debt and sizable gross
public gross financing needs. In particular, given that more than two-thirds of public debt is foreign
currency denominated, the headline debt-to-GDP ratio is understated by the current overvaluation of
the exchange rate. Provincial debt was at around 5 percent of GDP in 2015, but most of provincial debt
is concentrated in few provinces with large deficits.
A. Background
At end-2015, the federal government gross debt stood at about AR$3,000 billion, amounting to
52.1 percent of GDP.1 Reported financial assets of the federal government amount to AR$22 billion,
implying a net debt measure that is very close to the gross level.
Currency composition.
72 percent of federal debt is
either denominated in foreign
currency or is FX-linked (mostly
U.S. dollars). About 20 percent
this FX debt is owed to the
official sector (the IADB, the
World Bank, and the Paris Club creditors) with virtually all of the remainder in the form of FX
bonds. Around one-third of peso-denominated debt are bonds linked to inflation or the U.S.
dollar (with contractual obligations settled in pesos).
Holdings. It is estimated that 35 percent of total debt was held by external creditors in 2015; and
three-quarters of the debt were issued under the
Argentine law. About 60 percent of federal debt
(equivalent to 21 percent of GDP) is held by intra-
public sector entities, predominantly the central
bank and social security fund (ANSES). The majority
of intra-public sector debt is either non-interest
bearing or earns interest that is netted out from the
overall balance (as in the case of ANSES). This
significantly reduces the headline effective interest
rate paid by the federal government.
1 This excludes the balance sheets of the provinces, ANSES, and the BCRA. It includes US$11.5 billion (1.8 percent of
GDP) of ‘untendered debt’, which was unresolved from the 2001 default.
Debt Composition, End of 2015
Peso, billion Percent of GDP Percent of total
Total public debt 3,046 52.1 100.0
FX denominated 2,108 36.1 69.2
Peso denominated 939 16.1 30.8
Unindexed 652 11.2 21.4
Inflation indexed 203 3.5 6.7
FX indexed 85 1.5 2.8
Sources: Ministerio de Hacienda and Fund staff calculations.
BCRA, 79.7 ANSES-FGS,
31.2
Banco
Nacion, 3.2
Other
public
agencies,
8.5
IFIs and
bilateral,
29.2
Private
sector, 65.4
Holdouts,
18.4
Sources: Ministerio de Hacienda, BCRA, and ANSES.
Federal Government Gross Debt by Creditor
(Billions of U.S. dollars, end-March, 2016)

ARGENTINA
INTERNATIONAL MONETARY FUND 3
Maturity. The average residual maturity of debt is 9.1 years, split between long maturity FX debt
(10.5 years) and short maturity peso debt (4 years).2 This high average maturity partly reflects
the long maturity debt issued in the 2005 and 2010 debt exchanges.
B. Baseline Scenario
Staff’s baseline outlook is as follows:
Primary deficit. Staff’s baseline assumes current
policies for 2016 and 2017. The expected
expansion of spending on pensions, together
with the increased co-participation transfers to
provinces, will largely be offset by a reduction in
subsidies and discretionary transfers to
provinces. The federal government primary
deficit is expected to decrease to about
4.5 percent of GDP in 2017 from 4.8 percent in
the previous year. From 2018 onwards, staff’s
baseline assumes a fiscal consolidation of about
¾–1 percent of GDP per year, to a primary
deficit of 1.3 percent of GDP in 2021. This pace of fiscal consolidation is consistent with staff’s
estimates of the amount of new financing that will realistically be available over the medium
term (see Table 1) and with a slightly slower pace of medium-term fiscal rebalancing than
announced by the authorities earlier in 2016. Finally, the pace of fiscal consolidation is within the
inter-quartile range of past consolidation episodes in other countries. For these reasons, it is
assessed to be realistic.
Debt servicing costs. The high levels of inflation experienced in recent years, together with a high
proportion of non-interest bearing debt financing, have generated significantly negative real
2 CPI-indexed debt makes up 10 percent of the local currency debt stock and has an average residual maturity of
22.4 years. Excluding this, the average residual maturity of local currency debt is 2 years.
Federal Government Debt Service Schedule
(Percent of GDP)
2015 2016 2017 2018 2019 2020 2021
Total 7.6 9.1 7.3 6.5 6.0 5.0 6.4
FX denominated 4.9 6.6 3.6 3.0 3.2 2.4 3.9
Amortization 4.1 5.3 2.4 1.6 1.7 0.9 2.4
Interest 0.8 1.3 1.3 1.4 1.5 1.5 1.5
Peso denominated 2.7 2.5 3.7 3.5 2.8 2.6 2.5
Amortization 1.5 1.4 2.4 2.1 1.7 1.6 1.6
Interest 1.3 1.1 1.3 1.4 1.2 1.0 0.9
Sources: Ministerio de Hacienda and Fund staff estimates.
-8
-7
-6
-5
-4
-3
-2
-1
0
2014 2015 2016 2017 2018 2019 2020 2021
Baseline
No adjustment
Federal Government Primary Balance
(Percent of GDP)
Sources: Ministerio de Hacienda and Fund staff estimates.

ARGENTINA
4 INTERNATIONAL MONETARY FUND
effective interest rates. This high inflation is partially offset by the valuation effect on foreign
currency-denominated debt from the nominal exchange rate depreciation.
Box 1. Fiscal Outlook for Provinces
Thanks to the federal-for-provincial debt swap
initiated in 2004, provincial debt steadily declined
during the past 10 years and reached 4.6 percent of
national GDP in 2015, or 38 percent of provincial tax
revenues (including the portion of the taxes shared
with the national government). A third of provincial
debt is held by the federal government. At the
same time, the combined primary deficit was below
0.1 percent of national GDP, on average, during
2005–14, but it picked up to 0.4 percent in 2015, on
account of an increase in the wage bill and current
transfers.
Under the baseline scenario, the provincial primary deficit is expected to increase to 0.7 percent of national
GDP in 2016, driven by higher wages and capital spending, and then decline gradually to 0.5 percent by
2021, mainly thanks to the devolution of shared revenues that were previously earmarked to ANSES, that is
assumed to more than offset lower discretionary transfers from the federal government. Debt is expected to
stabilize at 5.6 percent of national GDP in 2021. Although low, these aggregate numbers mask large
heterogeneity and vulnerabilities:
Most of provincial debt is concentrated in a
few provinces with large deficits. The province
and the autonomous city of Buenos Aires
(which account for about half of Argentina’s
population and GDP) contribute to over half
of total provincial debt, with another
20 percent concentrated in other five
provinces (Cordoba, Chubut, Mendoza,
Neuquen, and Santa Cruz).
Over 60 percent of provincial debt is
denominated in foreign currency. Since
January 2016, the seven provinces mentioned
above (those with the largest debt, and the
greatest share of FX-denominated debt) have
accessed international markets, issuing FX debt for a total of US$5.6 billion. This exposes them to
exchange rate risk. For example, a one step 50 percent depreciation in 2017 would increase debt to
47 percent of provincial revenues (from 38 under the baseline), the equivalent of 6.3 percent of national
GDP, by 2021.
Under staff’s baseline, the government will become less reliant on central bank funding and
increasingly more dependent on external market financing in foreign currency (the share of FX
debt and FX-linked will increase from 69 to 80 percent of total debt between 2015 and 2021).
0
20
40
60
80
100
120
140
160
0
2
4
6
8
10
12
14
16
2005
2006
2007
2008
2009
2010
2011
2012
2013
2014
2015
2016
2017
2018
2019
2020
2021
Provincial Debt Ratios
(Percent)
Debt-to-GDP
Debt-to-revenue (rhs)
Sources: Ministerio de Hacienda and Fund staff estimates.
0
20
40
60
80
100
0 20 40 60 80 100
Deb
t-to
-pro
vin
cia
l ta
x re
ven
ues
(prc
en
t)
Share of foreign currency denominated debt (percent of
total debt)
Debt to Provincial Revenue and Share of Debt
Denominated in Foregin Currency, 2016
Sources: Ministerio de Hacienda and Fund staff estimates.
Note: Red dots indicate the provinces that have been issuing
debt denominated in foreign currency since January 2016.

ARGENTINA
INTERNATIONAL MONETARY FUND 5
Along with the decline in inflation, this will push up real effective interest rates. As a result,
interest spending will increase from 2.1 percent of GDP in 2015 to 2.5 percent of GDP by 2021.
Debt. Debt is expected to decline slightly over staff’s forecast horizon, from 52 percent of GDP in
2015 to 47½ percent in 2021, well below
the ‘high risk’ summary indicator for
emerging markets (70 percent of GDP). In
the absence of any fiscal consolidation after
2016, the public debt ratio would reach
about 67 percent of GDP by 2021. In a
scenario where the current estimated REER
overvaluation (between 10 and 15 percent)
corrects through a nominal depreciation in
2016, and absent any further real
appreciation in the following years, gross
federal debt would reach 60 percent of
GDP in 2021.
Gross financing needs. The large overall fiscal deficit and amortization profiles in 2016–17 will
keep gross financing needs (GFNs) elevated at above 10 percent of GDP. In 2016, GFNs will peak
at 13.2 percent of GDP, slightly below the ‘high risk’ summary indicator. Going forward, fiscal
consolidation and lower amortization needs imply a decline of GFNs to 6–7 percent of GDP by
the end of the projection horizon.
C. Shocks and Stress Tests
Solvency risks are contained. The relatively low level of debt and the modest downward trajectory
suggest that the risk of a solvency crisis for the federal government is modest. Shocks to the
primary balance and interest rates are unlikely to cause debt to increase significantly. However,
the high and rising share of FX-denominated debt poses risks, especially given that the
exchange rate is currently viewed as overvalued (see above). In addition, a shock to real GDP
growth (-1 percent in 2017 and 2018) would cause debt-to-GDP ratio to jump to 66 percent in
2018. Finally, a combined macroeconomic shock could be very detrimental and push debt just
below 90 percent of GDP by 2018.
Liquidity risks are higher. The relatively high level of GFNs through the medium term increases
vulnerabilities to a liquidity crisis. A shock to real growth—with knock-on impacts to the primary
balance and credit spreads (each 1 percent deviation of the primary balance would increase
spreads by 25 basis points, for a total increase of 125 basis points in 2018)—would push GFNs to
15 percent of GDP. A shock to exchange rate would cause a similar spike, and a combined shock
would push GFNs as high as 19 percent of GDP.
40
45
50
55
60
65
70
2014 2015 2016 2017 2018 2019 2020 2021
Baseline No adjustment
Constant REER
Federal Government Gross Debt
(Percent of GDP)
Sources: Ministerio de Hacienda and Fund staff estimates.

ARGENTINA
6 INTERNATIONAL MONETARY FUND
Contingent liabilities could also increase the debt level. Under current policies, contingent
liabilities from the increase in pension spending over the long run are estimated to be
40 percent of GDP in net present value term.
Mitigating factors. Rollover risks are mitigated by intra-government cross holdings. The high share
of debt held by other public entities reduces the risk of a liquidity crisis. In times of stress, the
federal government will likely be able to rely on other public bodies (notably ANSES and the BCRA)
to rollover debt coming due and even purchase new issuances. While this can significantly reduce
rollover risks for the federal government, it would constrain the behavior of these public entities,
preventing them from diversifying risk and pursuing better yielding investment strategies, apart
from crowding out private sector credit. Importantly, these intra-government debt holdings do not
reduce solvency risks and should therefore not be ‘netted out’ of the headline debt stock. The
federal government is obliged to repay these claims in full, and a failure to do so would cause
significant problems on the balance sheets of these public entities.

ARGENTINA
INTERNATIONAL MONETARY FUND 7
Table 1. Argentina: Federal Government—Funding Envelope and Sources
Table 1. Argentina Federal Government: Funding Envelope and Sources with and without Fiscal Adjustment
2015 2016 2017 2018 2019 2020 2021
Primary balance excl. BCRA+ANSES -31.5 -26.1 -26.7 -23.2 -17.7 -11.0 -10.8
Percent of GDP -5.0 -4.8 -4.5 -3.6 -2.5 -1.4 -1.3
Interest (net of ANSES) 7.4 9.1 10.8 13.3 13.5 13.9 14.4
Overall balance excl. BCRA -38.9 -35.1 -37.5 -36.5 -31.3 -24.9 -25.2
Percent of GDP -6.2 -6.5 -6.3 -5.6 -4.4 -3.2 -3.0
Amortization 34.9 36.3 28.2 24.0 24.1 19.3 33.2
Percent of GDP 5.5 6.7 4.7 3.7 3.4 2.5 3.9
Gross financing needs 67.4 64.3 62.5 59.5 54.9 44.3 58.6
Percent of GDP 11.7 13.2 11.0 9.3 7.8 5.7 6.9
Total net new financing 38.9 35.1 37.5 36.5 31.3 24.9 25.2
Percent of GDP 6.2 6.5 6.3 5.6 4.4 3.2 3.0
Intra-public sector (excl. Banco Nacion) 26.0 12.6 10.6 10.1 7.2 5.5 4.3
BCRA 25.3 10.8 8.8 7.3 5.3 3.6 2.2
Profit transfer 8.4 7.4 3.5 1.3 0.7 0.0 0.0
Advances 16.9 3.4 5.3 6.0 4.6 3.6 2.2
ANSES (FGS) 0.2 0.4 0.8 0.4 0.3 0.2 0.3
Other government agencies 0.5 1.4 1.1 2.4 1.6 1.7 1.8
Private creditors 14.9 22.8 27.2 26.7 24.3 19.5 21.2
External creditors 1/ 1.5 11.0 18.1 23.7 21.8 19.5 19.6
IFIs 0.2 3.9 4.5 4.5 5.5 5.2 4.7
Paris Club & other official -0.6 -2.1 -2.0 -2.0 -1.6 -0.2 -0.2
Private bonds 1.9 18.7 15.6 21.2 17.9 14.5 15.0
Domestic creditors 13.5 11.8 9.2 3.0 2.5 0.0 1.6
Banking sector 0.9 5.3 5.1 0.2 1.7 1.6 2.1
Non-bank domestic creditors 12.6 6.5 4.1 2.8 0.8 -1.7 -0.5
Other (valuation effects) -2.1 -0.3 -0.3 -0.3 -0.2 -0.1 -0.2
Memo: Federal gross debt, percent of GDP 52.1 51.8 51.1 51.2 50.0 48.4 47.5
Primary balance excl. BCRA+ANSES -31.5 -26.1 -37.4 -41.9 -46.9 -52.2 -56.5
Percent of GDP -5.0 -4.8 -6.3 -6.4 -6.6 -6.7 -6.7
Interest (net of ANSES) 7.4 9.1 10.8 15.0 17.7 21.5 27.7
Overall balance excl. BCRA -38.9 -35.1 -48.2 -56.9 -64.6 -73.6 -84.2
Percent of GDP -6.2 -6.5 -8.1 -8.7 -9.1 -9.5 -10.0
Total net new financing 38.9 35.1 48.2 56.9 64.6 73.6 84.2
Identified (=baseline) 38.9 35.1 37.5 36.5 31.3 24.9 25.2
Unidentified … … 10.7 20.4 33.3 48.8 59.0
Memo: Federal gross debt, percent of GDP 52.1 51.8 52.9 55.8 58.6 62.1 66.6
Source: Fund staff estimates.
1/ Includes repayment to holdout creditors of US$9.5 billion in 2016.
(Billions of U.S. dollars, unless otherwise indicated)
Baseline (fiscal adjustment after 2017)
No fiscal adjustment after 2017

ARGENTINA
8 INTERNATIONAL MONETARY FUND
Figure 1. Argentina: Public Sector Debt Sustainability Analysis (DSA)—
Baseline Scenario
(In percent of GDP, unless otherwise indicated)
As of June 01, 20162/
2014 2015 2016 2017 2018 2019 2020 2021 Sovereign Spreads
Nominal gross public debt 48.5 43.6 52.1 51.8 51.1 51.2 50.0 48.4 47.5 EMBIG (bp) 3/ 441
Public gross financing needs 9.8 9.0 12.6 13.3 11.8 10.0 8.5 6.5 7.7 5Y CDS (bp) 363
Real GDP growth (in percent) 4.6 -2.5 2.5 -1.8 2.7 2.8 2.9 3.1 3.3 Ratings Foreign Local
Inflation (GDP deflator, in percent) 18.7 40.3 24.5 40.6 22.6 19.4 15.3 11.5 9.6 Moody's B3 B3
Nominal GDP growth (in percent) 24.1 36.8 27.6 37.6 26.5 22.5 18.7 15.0 13.2 S&Ps B- B-
Effective interest rate (in percent) 4/ 4.3 5.0 6.1 6.2 8.6 8.4 7.9 6.8 5.7 Fitch B B
2014 2015 2016 2017 2018 2019 2020 2021 cumulative
Change in gross public sector debt -2.1 1.4 8.5 -0.4 -0.6 0.0 -1.2 -1.6 -0.9 -4.7
Identified debt-creating flows -5.9 2.7 12.1 -7.2 -2.6 -2.4 -2.1 -2.2 -1.9 -18.5
Primary deficit 0.3 6.0 7.2 4.8 4.5 3.6 2.5 1.4 1.3 18.1
Primary (noninterest) revenue and grants 23.3 23.1 25.0 25.7 25.6 25.5 25.3 25.1 25.0 152.1
Primary (noninterest) expenditure 23.6 29.1 32.2 30.5 30.1 29.0 27.8 26.5 26.2 170.2
Automatic debt dynamics 5/
-5.8 -3.3 4.9 -12.0 -7.1 -6.0 -4.6 -3.6 -3.2 -36.5
Interest rate/growth differential 6/
-8.0 -9.8 -7.4 -12.0 -7.1 -6.0 -4.6 -3.6 -3.2 -36.5
Of which: real interest rate -6.3 -10.6 -6.5 -12.7 -6.0 -4.8 -3.4 -2.2 -1.8 -30.9
Of which: real GDP growth -1.8 0.8 -0.8 0.7 -1.1 -1.2 -1.2 -1.4 -1.4 -5.6
Exchange rate depreciation 7/
2.2 6.5 12.3 … … … … … … …
Other identified debt-creating flows -1.4 0.0 0.0 0.0 0.0 0.0 0.0 0.0 0.0 0.0
Government and Public Sector Finance: privatization -1.4 0.0 0.0 0.0 0.0 0.0 0.0 0.0 0.0 0.0
Contingent liabilities 0.0 0.0 0.0 0.0 0.0 0.0 0.0 0.0 0.0 0.0
Please specify (2) (e.g., ESM and Euroarea loans) 0.0 0.0 0.0 0.0 0.0 0.0 0.0 0.0 0.0 0.0
Residual, including asset changes 8/
2.8 -1.3 -3.5 6.8 2.0 2.4 1.0 0.5 1.0 13.8
Source: IMF staff.
1/ Public sector is defined as central government.
2/ Based on available data.
3/ EMBIG.
4/ Defined as interest payments divided by debt stock (excluding guarantees) at the end of previous year.
5/ Derived as [(r - π(1+g) - g + ae(1+r)]/(1+g+π+gπ)) times previous period debt ratio, with r = interest rate; π = growth rate of GDP deflator; g = real GDP growth rate;
a = share of foreign-currency denominated debt; and e = nominal exchange rate depreciation (measured by increase in local currency value of U.S. dollar).
6/ The real interest rate contribution is derived from the numerator in footnote 5 as r - π (1+g) and the real growth contribution as -g.
7/ The exchange rate contribution is derived from the numerator in footnote 5 as ae(1+r).
8/ Includes asset changes and interest revenues (if any). For projections, includes exchange rate changes during the projection period.
9/ Assumes that key variables (real GDP growth, real interest rate, and other identified debt-creating flows) remain at the level of the last projection year.
Adjusted to exclude the impact from the real exchange rate depreciation.
-0.3
balance 9/
primary
Debt, Economic and Market Indicators 1/
2005-2013
Actual
Projections
Contribution to Changes in Public Debt
Projections
2005-2013
Actual
debt-stabilizing
-20
-15
-10
-5
0
5
10
15
20
25
2005 2006 2007 2008 2009 2010 2011 2012 2013 2014 2015 2016 2017 2018 2019 2020 2021
Debt-Creating Flows
Primary deficit Real GDP growth Real interest rate Exchange rate depreciation
Other debt-creating flows Residual Change in gross public sector debt
projection
(in percent of GDP)
-40
-30
-20
-10
0
10
20
30
40
cumulative

ARGENTINA
INTERNATIONAL MONETARY FUND 9
Figure 2. Argentina: Public DSA—Composition of Public Debt and Alternative Scenarios
Baseline Scenario 2016 2017 2018 2019 2020 2021 Historical Scenario 2016 2017 2018 2019 2020 2021
Real GDP growth -1.8 2.7 2.8 2.9 3.1 3.3 Real GDP growth -1.8 3.3 3.3 3.3 3.3 3.3
Inflation 40.6 22.6 19.4 15.3 11.5 9.6 Inflation 40.6 22.6 19.4 15.3 11.5 9.6
Primary Balance -4.8 -4.5 -3.6 -2.5 -1.4 -1.3 Primary Balance -6.9 -1.9 -1.9 -1.9 -1.9 -1.9
Effective interest rate 6.2 8.6 8.4 7.9 6.8 5.7 Effective interest rate 6.2 8.6 7.4 6.9 5.2 4.2
Constant Primary Balance Scenario
Real GDP growth -1.8 2.7 2.8 2.9 3.1 3.3
Inflation 40.6 22.6 19.4 15.3 11.5 9.6
Primary Balance -6.9 -6.9 -6.9 -6.9 -6.9 -6.9
Effective interest rate 6.2 8.6 8.4 8.3 7.3 6.5
Source: Fund staff calculations and estimates.
Underlying Assumptions(in percent)
Argentina Public DSA - Composition of Public Debt and Alternative Scenarios
Alternative Scenarios
Composition of Public Debt
Baseline Historical Constant Primary Balance
0
10
20
30
40
50
60
70
2014 2015 2016 2017 2018 2019 2020 2021
Gross Nominal Public Debt
(in percent of GDP)
projection0
2
4
6
8
10
12
14
16
2014 2015 2016 2017 2018 2019 2020 2021
Public Gross Financing Needs
(in percent of GDP)
projection
0
10
20
30
40
50
60
70
80
2005 2007 2009 2011 2013 2015 2017 2019 2021
By Maturity
Medium and long-term
Short-term
projection
(in percent of GDP)
0
10
20
30
40
50
60
70
80
2005 2007 2009 2011 2013 2015 2017 2019 2021
By Currency
Local currency-denominated
Foreign currency-denominated
projection
(in percent of GDP)

Figure 3. Argentina: Public DSA—Realism of Baseline Assumptions
Source : IMF Staff.
1/ Plotted distribution includes surveillance countries, percentile rank refers to all countries.
2/ Projections made in the spring WEO vintage of the preceding year.
3/ Not applicable for Argentina, as it meets neither the positive output gap criterion nor the private credit growth criterion.
4/ Data cover annual obervations from 1990 to 2011 for advanced and emerging economies with debt greater than 60 percent of GDP. Percent of sample on vertical axis.
Argentina Public DSA - Realism of Baseline Assumptions
Forecast Track Record, versus surveillance countries
Boom-Bust Analysis 3/Assessing the Realism of Projected Fiscal Adjustment
-10
-8
-6
-4
-2
0
2
4
6
8
10
2007 2008 2009 2010 2011 2012 2013 2014 2015
Year 2/
Real GDP Growth
Interquartile range (25-75)
Median
Argentina forecast error
-0.19
63%Has a percentile rank of:
Argentina median forecast error, 2007-2015:
Distribution of
forecast errors: 1/
(in percent, actual-projection)
-10
-8
-6
-4
-2
0
2
4
2007 2008 2009 2010 2011 2012 2013 2014 2015
Year 2/
Primary Balance
Interquartile range (25-75)
Median
Argentina forecast error
-1.01
37%Has a percentile rank of:
Argentina median forecast error, 2007-2015:
Distribution of
forecast errors: 1/
(in percent of GDP, actual-projection)
-10
-5
0
5
10
15
2007 2008 2009 2010 2011 2012 2013 2014 2015
Year 2/
Inflation (Deflator)
Interquartile range (25-75)
Median
Argentina forecast error
0.28
55%Has a percentile rank of:
Argentina median forecast error, 2007-2015:
Distribution of
forecast errors: 1/
(in percent, actual-projection)
pess
imis
tic
op
tim
isti
c
-6
-4
-2
0
2
4
6
8
t-5 t-4 t-3 t-2 t-1 t t+1 t+2 t+3 t+4 t+5
Real GDP growth
Argent…
(in percent)
Not applicable for Argentina
0
2
4
6
8
10
12
14
Less -4 -3 -2 -1 0 1 2 3 4 5 6 7 8
Distribution 4/
Argentina
3-Year Adjustment in Cyclically-Adjusted
Primary Balance (CAPB)
(Percent of GDP)
Mo
re
3-year CAPB adjustment
greater than 3 percent of
GDP in approx. top quartilehas a percentile
rank of 18%
0
2
4
6
8
10
12Less -4 -3 -2 -1 0 1 2 3 4 5 6 7 8
Distribution 4/
Argentina
3-Year Average Level of Cyclically-Adjusted
Primary Balance (CAPB)
(Percent of GDP)
Mo
re
3-year average CAPB level
greater than 3.5 percent of
GDP in approx. top quartilehas a percentile
rank of 91%
10
IN
TER
NA
TIO
NA
L MO
NETA
RY F
UN
D
AR
GEN
TIN
A

ARGENTINA
INTERNATIONAL MONETARY FUND 11
Figure 4. Argentina: Public DSA—Stress Tests
Primary Balance Shock 2016 2017 2018 2019 2020 2021 Real GDP Growth Shock 2016 2017 2018 2019 2020 2021
Real GDP growth -1.8 2.7 2.8 2.9 3.1 3.3 Real GDP growth -1.8 -2.5 -2.5 2.9 3.1 3.3
Inflation 40.6 22.6 19.4 15.3 11.5 9.6 Inflation 40.6 21.3 18.1 15.3 11.5 9.6
Primary balance -6.9 -7.4 -6.1 -3.3 -2.2 -2.0 Primary balance -6.9 -7.8 -8.4 -3.3 -2.2 -2.0
Effective interest rate 6.2 8.6 8.6 8.1 7.0 5.8 Effective interest rate 6.2 8.6 8.5 8.6 7.7 6.6
Real Interest Rate Shock Real Exchange Rate Shock
Real GDP growth -1.8 2.7 2.8 2.9 3.1 3.3 Real GDP growth -1.8 2.7 2.8 2.9 3.1 3.3
Inflation 40.6 22.6 19.4 15.3 11.5 9.6 Inflation 40.6 39.9 19.4 15.3 11.5 9.6
Primary balance -6.9 -5.8 -4.5 -3.3 -2.2 -2.0 Primary balance -6.9 -5.8 -4.5 -3.3 -2.2 -2.0
Effective interest rate 6.2 8.6 8.8 9.0 8.3 7.5 Effective interest rate 6.2 11.3 7.8 7.9 7.2 6.3
Combined Shock
Real GDP growth -1.8 -2.5 -2.5 2.9 3.1 3.3
Inflation 40.6 21.3 18.1 15.3 11.5 9.6
Primary balance -6.9 -7.8 -8.4 -3.3 -2.2 -2.0
Effective interest rate 6.2 11.3 8.3 8.6 8.2 7.4
Source: IMF staff.
Argentina Public DSA - Stress Tests
Macro-Fiscal Stress Tests
Baseline Primary Balance Shock
Real GDP Growth Shock
Real Interest Rate Shock
(in percent)
Real Exchange Rate Shock
Combined Macro-Fiscal Shock
Additional Stress Tests
Baseline
Underlying Assumptions
0
10
20
30
40
50
60
70
2016 2017 2018 2019 2020 2021
Gross Nominal Public Debt(in percent of GDP)
0
50
100
150
200
250
300
2016 2017 2018 2019 2020 2021
Gross Nominal Public Debt
(in percent of Revenue)
0
2
4
6
8
10
12
14
16
18
2016 2017 2018 2019 2020 2021
Public Gross Financing Needs
(in percent of GDP)
0
10
20
30
40
50
60
70
80
90
100
2016 2017 2018 2019 2020 2021
Gross Nominal Public Debt(in percent of GDP)
0
50
100
150
200
250
300
350
400
2016 2017 2018 2019 2020 2021
Gross Nominal Public Debt
(in percent of Revenue)
0
5
10
15
20
25
2016 2017 2018 2019 2020 2021
Public Gross Financing Needs
(in percent of GDP)

ARGENTINA
12 INTERNATIONAL MONETARY FUND
Figure 5. Argentina: Public DSA—Risk Assessment
Argentina
Source: IMF staff.
5/ External financing requirement is defined as the sum of current account deficit, amortization of medium and long-term total external debt, and short-term total external
debt at the end of previous period.
4/ EMBIG, an average over the last 3 months, 03-Mar-16 through 01-Jun-16.
2/ The cell is highlighted in green if gross financing needs benchmark of 15% is not exceeded under the specific shock or baseline, yellow if exceeded under specific shock
but not baseline, red if benchmark is exceeded under baseline, white if stress test is not relevant.
200 and 600 basis points for bond spreads; 5 and 15 percent of GDP for external financing requirement; 0.5 and 1 percent for change in the share of short-term debt; 15
and 45 percent for the public debt held by non-residents; and 20 and 60 percent for the share of foreign-currency denominated debt.
Market
Perception
Debt level 1/ Real GDP
Growth Shock
Primary
Balance Shock
3/ The cell is highlighted in green if country value is less than the lower risk-assessment benchmark, red if country value exceeds the upper risk-assessment benchmark,
yellow if country value is between the lower and upper risk-assessment benchmarks. If data are unavailable or indicator is not relevant, cell is white.
Lower and upper risk-assessment benchmarks are:
Change in the
Share of Short-
Term Debt
Foreign
Currency
Debt
Public Debt
Held by Non-
Residents
Primary
Balance Shock
Real Interest
Rate Shock
Exchange Rate
Shock
Contingent
Liability Shock
Exchange Rate
Shock
Contingent
Liability shock
1/ The cell is highlighted in green if debt burden benchmark of 70% is not exceeded under the specific shock or baseline, yellow if exceeded under specific shock but not
baseline, red if benchmark is exceeded under baseline, white if stress test is not relevant.
Real Interest
Rate Shock
External
Financing
Requirements
Real GDP
Growth Shock
Heat Map
Upper early warning
Evolution of Predictive Densities of Gross Nominal Public Debt
(in percent of GDP)
Debt profile 3/
Lower early warning
(Indicators vis-à-vis risk assessment benchmarks, in 2015)
Debt Profile Vulnerabilities
Gross financing needs 2/
20
60
69%
1 2
200
600
499
bp
1 2
5
1512%
1 2
0.5
1
-
1.5%
1 2
EMBIGExternal Financing
Requirement
Annual Change in
Short-Term Public
Debt
Public Debt in
Foreign Currency
(in basis points) 4/ (in percent of GDP) 5/ (in percent of total) (in percent of total)
0
10
20
30
40
50
60
70
2014 2015 2016 2017 2018 2019 2020 2021
10th-25th 25th-75th 75th-90thPercentiles:Baseline
Symmetric Distribution
0
10
20
30
40
50
60
70
80
2014 2015 2016 2017 2018 2019 2020 2021
Restricted (Asymmetric) Distribution
no restriction on the growth rate shock
no restriction on the interest rate shock
0 is the max positive pb shock (percent GDP)
no restriction on the exchange rate shock
Restrictions on upside shocks:
15
45 34%
1 2
Public Debt Held
by Non-Residents
(in percent of total)

ARGENTINA STAFF REPORT FOR THE 2016 ARTICLE IV CONSULTATION—
INFORMATIONAL ANNEX
Prepared By
The Western Hemisphere Department
(In consultation with other departments)
FUND RELATIONS _______________________________________________________________________ 2
STATISTICAL ISSUES ____________________________________________________________________ 3
RELATIONS WITH THE WORLD BANK __________________________________________________ 6
RELATIONS WITH THE INTER-AMERICAN DEVELOPMENT BANK ____________________ 6
CONTENTS
October 19, 2016

ARGENTINA
2 INTERNATIONAL MONETARY FUND
FUND RELATIONS
The 2016 Article IV discussions were held in Buenos Aires and Cordoba during September 19–30.
The staff team comprised R. Cardarelli (head), L. Lusinyan, J. Canales-Kriljenko, D. Singh (all WHD),
M. Ortiz Villafañe (WHD, local economist), P. Dudine (FAD), L. Jacome (MCM), A. Pienkowski (SPR),
Ch. DeLong, and F. Figueroa (both LEG). J. L. Saboin (WHD) provided research assistance. Mr. Werner
(WHD) joined the concluding meetings. The mission met with senior officials and representatives of
private sector, finance industry, academics, and think-tanks. Mr. Torres (OED) participated in the
meetings.
Membership Status: Joined September 20, 1956; Article VIII
(As of August 31, 2016)
General Resources Account: SDR Million Percent of Quota
Quota 3,187.30 100.00
IMF Holdings of Currency 2,919.57 91.60
Reserve Tranche Position 267.75 8.40
SDR Department: SDR Million Percent of Quota
Net cumulative allocation 2,020.04 100.00
Holdings 1,785.48 88.39
Outstanding Purchases and Loans: None.
Latest Financial Arrangements:
Date of Expiration Amount Approved Amount Drawn
Type Arrangement Date (SDR Million) (SDR Million)
Stand-By Sep 20, 2003 Jan 05, 2006 8,981.00 4,171.00
Stand-By Jan 24, 2003 Aug 31, 2003 2,174.50 2,174.50
Stand-By Mar 10, 2000 Jan 23, 2003 16,936.80 9,756.31
of which SRF Jan 12, 2001 Jan 11, 2002 6,086.66 5,874.95
Overdue Obligations and Projected Payments to Fund 1/
(SDR Million; based on existing use of resources and present holdings of SDRs):
Forthcoming
2016 2017 2018 2019 2020
Principal
Charges/Interest 0.02 0.19 0.19 0.19 0.19
Total 0.02 0.19 0.19 0.19 0.19
1/ When a member has overdue financial obligations outstanding for more than three months, the
amount of such arrears will be shown in this section.

ARGENTINA
INTERNATIONAL MONETARY FUND 3
Implementation of HIPC Initiative: Not Applicable.
Implementation of Multilateral Debt Relief Initiative (MDRI): Not Applicable.
Implementation of Catastrophe Containment and Relief (CCR): Not Applicable.
As of February 4, 2015, the Post-Catastrophe Debt Relief Trust has been transformed to the
Catastrophe Containment and Relief (CCR) Trust.
Exchange Rate Arrangements: Argentina’s currency is the Argentine peso. The exchange rate
arrangement is classified as floating from December 17, 2015. Argentina has accepted the
obligations of Article VIII, Sections 2, 3, and 4. As part of the 2016 Article IV Consultation mission to
Argentina, a review of the exchange system for compliance with Article VIII, Sections 2(a) and 3 of
the Articles of Agreement was conducted. The restrictive exchange regime put in place in 2011 (the
“cepo cambiario”) has been removed, and Argentina maintains an exchange rate system free of
restrictions on payments and transfers for current international transactions, other than restrictions
notified to the Fund under Decision No. 144 (52/51).
Last Article IV Consultation: The Staff Report for the 2006 Article IV Consultation with Argentina
was considered by the Executive Board on July 28, 2006.
STATISTICAL ISSUES
(As of October 3, 2016)
I. Assessment of Data Adequacy for Surveillance
General: Data provision is adequate for surveillance, although structural breaks in a number of
macroeconomic series (including CPI, employment, unemployment, poverty) hamper empirical
analysis. The status of Argentina with respect to the accuracy of the CPI and GDP data will be
reassessed by the IMF Executive Board on November 9.
National Accounts: In June 2016, INDEC disseminated a new GDP series for 2004–15., which the
IMF Executive Board assessed in August 2016 to be in line with international standards. INDEC
published a methodology note and detailed estimates by economic activity of the GDP in
September 2016. These actions increase data availability and transparency of the national accounts.
Price statistics: A new CPI was disseminated in June 2016 with coverage restricted to Greater
Buenos Aires. At the request of INDEC, an IMF technical assistance mission visited Buenos Aires
during September and October 2016 to assess progress on improving CPI methods and to assist
with developing a national CPI. By October 2016, INDEC is planning to develop and disseminate a
national CPI that is scheduled for release in early 2019, using data from a new household
expenditure survey to be compiled in 2017–18.

ARGENTINA
4 INTERNATIONAL MONETARY FUND
Government Finance Statistics: Argentina disseminates data for general government operations,
central government operations, and central government debt.
Monetary and Financial Statistics: Only highly summarized data for the central bank and other
depository corporations are reported to STA. Data for other financial corporations, such as
insurance companies, pension funds, and investment funds, are not reported.
Financial sector surveillance: Data for the core and nine encouraged FSIs are reported quarterly.
External sector statistics: Argentina disseminates timely balance of payments, International
Investment Position (IIP), external debt, and the statistical framework of international reserves and
foreign currency liquidity, but the periodicity of the IIP is annual rather than quarterly. Data
provision is under the fifth edition of the Balance of Payments Manual (BPM5), circumstance that
contributes to Argentina’s argument for not recording liabilities pertaining to SDR’s allocations in
the balance of payments and IIP. Data re-disseminated by STA and converted to the updated
balance of payments manual, BPM6, includes these data, although it may be absent in external
debt reported to the World Bank. At the request of the authorities, a technical assistance mission
on external sector statistics will visit the National Institute of Statistics and Census (INDEC) in
November 2016. INDEC is the agency in charge of compiling and disseminating the balance of
payments and IIP. The main emphasis of the mission will be to assist the authorities to facilitate the
provision of quarterly IIP data.
II. Data Standards and Quality
Subscriber to the Fund’s Special Data Dissemination Standard (SDDS) since 1996.
No Data ROSC has been conducted.
III. Data Submission to STA
Argentina does not report GFS data for publication in International Financial Statistics (IFS) and its
last submission for the Government Finance Statistics Yearbook (GFSY) was in 2004. The authorities
are encouraged to resume the regular data submission for the IFS.

ARGENTINA
INTERNATIONAL MONETARY FUND 5
Argentina—Table of Common Indicators Required for Surveillance (As of October 3, 2016)
Date of latest observation
Date received
Frequency of data6
Frequency of reporting6
Frequency of publication6
Exchange Rates October 3, 2016 October 3, 2016 D D D
International Reserve Assets and Reserve
Liabilities of the Monetary Authorities1
October 3, 2016 October 3, 2016 D D D
Reserve/Base Money October 3, 2016 October 3, 2016 D D D
Broad Money October 3, 2016 October 3, 2016 D D D
Central Bank Balance Sheet August 2016 September 2016 M M M
Consolidated Balance Sheet of the Banking
System
August 2016 September 2016 M M M
Interest Rates2 October 3, 2016 October 3, 2016 D D D
Consumer Price Index August 2016 September 21, 2016 M M M
Revenue, Expenditure, Balance and Composition
of Financing3 – General Government4
2015 February 2016 A A A
Revenue, Expenditure, Balance and Composition
of Financing3– Central Government
August 2016 September 21, 2016 M M M
Stocks of Central Government and Central
Government –Guaranteed Debt5
Q2 2016 June 30, 2016 Q Q Q
External Current Account Balance Q2 2016 September 20, 2016 Q Q Q
Exports and Imports of Goods August 2016 September 27, 2016 M M M
GDP/GNP Q2 2016 September 22, 2016 Q Q Q
Gross External Debt Q2 2016 September 20, 2016 Q Q Q
International Investment Position7 Q2 2016 September 20, 2016 Q Q Q
1 Any reserve assets that are pledged or otherwise encumbered should be specified separately. Also, data should comprise short-term liabilities linked to a foreign currency but
settled by other means as well as the notional values of financial derivatives to pay and to receive foreign currency, including those linked to a foreign currency but settled by
other means. 2 Both market-based and officially-determined, including discount rates, money market rates, rates on treasury bills, notes, and bonds. 3 Foreign, domestic bank, and domestic nonbank financing. 4 The general government consists of the central government (budgetary funds, extra budgetary funds, and social security funds) and provincial governments. 5 Including currency and maturity composition. 6 Daily (D); weekly (W); monthly (M); quarterly (Q); annually (A); irregular (I); and not available (NA). 7 Includes external gross financial asset and liability positions vis-à-vis nonresidents.
ARGENTINA
6 INTERNATIONAL MONETARY FUND
RELATIONS WITH THE WORLD BANK1
The current Country Partnership Strategy (FY15–FY18) was presented to the World Bank Board of
Executive Directors in September 2014. The CPS, developed in consultations with the Government, is
built around nine specific results, most of which are aligned with the Government’s Pobreza Cero goal
of eradicating poverty (e.g., access to safe drinking water; youth insertion into labor market; effective
health care coverage; environmental clean-up). The Bank Group resumed lending to Argentina after
more than three years in 2014 with the first set of IBRD operations explicitly focusing and directly
supporting the vulnerable and the poor.
Currently, the IBRD portfolio consists of 21 investment projects for a total commitment of US$5.8 billion
(average size US$275 million) and of 3 big trust funds (two of GEF and one Montreal Protocol TF) for a
total of US$23.4 million. The overall approximate lending envelope for the four-year CPS period is
between US$4 billion and US$4.8 billion, US$2.4 billion of which has already been committed. The
portfolio includes ten new operations approved by the Board under the new Country Partnership
Strategy. As of June 30, 2016, Argentina’s exposure to the World Bank Group was US$6,862 million
(exposure to IBRD was US$ 5,737 million).
The Bank has agreed with the government on the lending program for FY17. In addition to the three
operations already approved in the water, social protection and trade areas for a total amount of
US$845 Million, the package includes a project to support financing of small and medium
enterprises, two urban transformation projects, a water and sanitation project, an energy renewables
guarantee, an additional financing for the Metropolitan Urban Transport Project, and a state
modernization project.
IFC has committed $1.9 billion (during FY15–FY16) in 22 projects, consisting of $1 billion from its
own account and $895 million in mobilization. The 22 projects of the IFC portfolio comprise 14 long-
term finance projects ($344 million IFC + $895 million mobilization) and 8 trade finance projects—
$672 million. As of end-FY16, the IFC portfolio stood at $1.7billion with 40 Projects. IFC is on target
to reach and potentially overshoot the investment commitment targeted for end FY18 ($1.7 billion).
RELATIONS WITH THE INTER-AMERICAN
DEVELOPMENT BANK2
Argentina’s current Country Strategy covers the period 2012–15, and focuses on interventions and
funding for two critical areas: the Norte Grande region and the Greater Buenos Aires area. The first
of these areas exhibits the lowest relative level of economic development in the country, together
with the highest incidence of poverty and social exclusion. The second suffers from high levels of
1 Prepared by the World Bank staff.
2 Prepared by the Inter-American Development Bank staff.

ARGENTINA
INTERNATIONAL MONETARY FUND 7
social exclusion, with major challenges for urban sustainability. Given the proposed geographic
focus, the Bank's strategy is based on the following objectives: the alleviation of obstacles to growth
with a special focus in Norte Grande; social and economic inclusion of the population, focused on
both regions; and urban sustainability and habitat improvement, with particular emphasis on the
Greater Buenos Aires area. The IDB is the main multilateral creditor of Argentina with a total debt
owed of US$11.2 billion in 2015 (53.6 percent of Argentina’s total multilateral debt).
Under the 2012–15 Strategy the following initiatives were approved: 15 sovereign guarantee
operations totaling US$2.6 billion, 28 private sector (non-sovereign guarantee) operations totaling
US$ 325.1 million, and 29 non-reimbursable technical cooperations for US$12 million. In addition,
another 3 sovereign guarantee operations for US$353 million and 4 technical cooperations for
nearly $1 million were approved in the first nine months of 2016.
As of September 2016, Argentina’s sovereign loan portfolio is composed of 47 operations, totaling
US$7.5 billion, with a disbursed percentage of nearly 58 percent. The portfolio is distributed as
follows: 36 percent dedicated to projects in the areas of infrastructure and energy, 28 percent in
climate change and sustainable development, 25 percent in institutions for development, 6 percent
in social sector, and 4 percent in integration and trade. Additionally, the private sector loans
portfolio comprises 13 operations with an approved value of US$247.5 million, and the non-
reimbursable technical cooperation portfolio includes 30 operations, with an approved value of
US$30.7 million.
Argentina: Approved Operations Under the 2012–15 Strategy and Transition Period
2012–15 Country Strategy January–September 2016
Number of
operations
Amount
(US$ million)
Number of
operations
Amount
(US$ million)
Sovereign guarantee 15 2,614 3 353
Non-sovereign guarantee 28 325.1 0 0
Technical cooperation 29 12 4 0.97
Argentina: IDB Portfolio by Type of Operation*
(As of September 30, 2016)
Number
of
operations
Amount
(US$ million)
Sovereign guarantee 47 7,485
Non-sovereign guarantee 13 247.5
Technical cooperation 30 30.7
*Excluding closed and fully disbursed operations.

ARGENTINA
8 INTERNATIONAL MONETARY FUND
Argentina: Sovereign Loan Portfolio by Sector*
(As of September 30, 2016)
Sectors Number of
operations
Current
approved
(US$ million)
Disbursed
(Percent)
Infrastructure and Energy 17 4,510 61.8
Climate Change and Sustainable Development 13 1,583 50.4
Institutions for Development 12 753 46.3
Social Sector 3 630 59.9
Integration and Trade 2 9 37.5
TOTAL 47 7,485 57.7
*Excluding closed and fully disbursed operations.
Argentina—Statement by the Staff on the Article IV Consultation
November 9, 2016
This note reports on information that has become available since the staff report was issued
and does not alter the thrust of the staff appraisal.
Economic outlook. The monthly indicator of economic activity showed positive 0.2 percent
(m/m) growth in August, the first time since March, but GDP is expected to have contracted
again in Q3. Construction activity fell by 13 percent (y/y) in September and industrial
production fell by around 7 percent (y/y) in Q3, driven by continued weakness in the
automotive sector. Private consumption indicators were mixed, with consumer confidence
increasing 6.3 percent in October but retail sales continuing to fall in real terms in August.
The trade balance continued to improve in September, mainly due to subdued imports.
Monetary policy. The central bank has maintained the policy rate unchanged for the past six
weeks at 26.75 percent, noting that inflation expectations for 2017 remain slightly above the
12–17 percent target (median inflation expectations for December 2017 were 19.7 percent in
October, slightly below the 20 percent expected in September). The construction and retail
sectors completed the second stage of their annual wage negotiations, which led to annual
salary increases of slightly below 40 percent in both cases.
Fiscal policy. The fiscal deficit widened in September, with primary spending increasing at
close to 37 percent (y/y), mainly reflecting increase in transfers to the private sector following
the utilities tariff rollback. The authorities have announced a bonus in December for those
receiving the minimum pension and beneficiaries of social transfers, with an estimated fiscal
cost of around 0.2 percent of GDP. The first round of the tax amnesty ended on October 31
with a better-than-expected result of about US$4.6 billion declared in cash terms.
Debt issuances and FX reserves. The Treasury successfully issued 7 and 10 years fixed-rate
peso bonds in October. Although conducted in the domestic market, the transactions attracted
substantial interest from foreign investors, generating FX inflows that increased reserves to
close to US$40 billion in late October (the highest level since mid-2013, up from around
US$30 billion at end September). This allowed the central bank to pay back a US$2.5 billion
loan from the BIS. The province of Buenos Aires managed to raise US$750 million, totaling
US$3 billion year-to-date, while Santa Fe raised US$250 million in its first ever international
debt sale.
Legislative progress. The lower house approved with a large majority the 2017 Budget with
an overall deficit target for next year of -4.2 percent of GDP as in the original proposal. The
Budget contains the obligation for provinces to reduce the fiscal deficit by 10 percent next year
relative to the 2016 outturn. The lower house also approved a bill that limits government’s
authority to reallocate spending without Congressional approval to 7.5 percent of total
spending in 2017, falling to 5 percent in 2018. Finally, the lower house approved a bill that
redesigns an institutional framework for public-private partnership investment projects. All
bills now move to the Senate for final approval.

Statement by Mr. Torres, Executive Director, on Argentina
November 9, 2016
This is Argentina’s first Article IV Consultation in ten years. In that period Argentina was
the only G20 member that did not open its books to the Fund’s scrutiny. That has radically
changed. Since December 2015, Argentina’s statistics agency recovered its independence and its
reports’ integrity. As I will explain below, Argentina is now looking its problems in the eye and
tackling them decisively. It is also complying with its responsibilities with the international
community, and as such, my authorities have consented to the publication of this Article IV
report. I turn now to address the policies that are being implemented to redress Argentina’s
macroeconomic imbalances.
Populism left the country in tatters. By December 2015 Argentina was running down its
reserves, despite having imposed self-inflicting restrictions in access to foreign exchange. The
country was bound to a balance-of-payment crisis, but the previous government kept kindling
domestic demand by subsidizing consumption and over-staffing the public sector.1 Imports
essential to the industry were delayed or simply blocked, putting firms and jobs at serious risk.
Decadent public infrastructure, high transaction costs, and the practice of protecting cronies and
using the tax-agency to bully “unruly” entrepreneurs made Argentina a “no-go” zone for
investors. Productivity and competitiveness plunged2, the economy stagnated (since 2011) and
entered in a recession cycle in Q4 2015. Fiscal deficits were handsomely financed by money-
printing and deposits at public institutions. Inflation was close to 30 percent (according to private
estimates, as nobody trusted the “Orwellian” official figures). The crisis was imminent. What has
changed?
Change is everywhere. I do not want to sound self-complacent because problems are still
looming large, yet it is only fair to note that in just 11 months in office President Macri’s
administration has achieved much more than what we could have reasonably expected. To begin
with, the crisis was averted and after 9 years of rigging statistics, economic agents are once again
believing in the official word.
Disassembling the bomb. Foreign exchange controls were successfully dismantled. The country
has now a single and floating exchange rate and access to foreign currencies is unrestricted.
Export taxes were eliminated (except for those on soy-beans, which were reduced) and the
litigation with creditors that had held-out from Argentina’s debt restructuring was successfully
settled. This allowed the country to regain access to credit markets. In April 2016, for the first
1 From 2001-2014 the number of public sector employees grew by 70 percent, with provinces and municipalities
being accountable for over 80 percent of this increase.
2 In the competitiveness index prepared by the Global Economic Forum, between 2005 and 2015 Argentina
descended from 54th position to 106th position.

time in 15 years, Argentina could tap international capital markets issuing bonds for US$ 16.5
billion. The issuance was four times oversubscribed and the money was mostly used to settle the
claims of the aforementioned holdout creditors, putting behind 15 years of litigation.
Bridling inflation. Just a few days after taking office the government pledged to bring down
annual inflation to about 5 percent by 2019 (see target-band below) and, together with the
virtually overnight removal of foreign exchange controls, the Central Bank of Argentina (BCRA)
announced the transition to an inflation-targeting regime. The aforementioned regime was
formally launched on September 26.3 As staff notes, the targets are ambitious, yet inflation is
already slowing down rapidly. In September, consumer prices increased by 1.1 percent (a far cry
from the 2.1 percent monthly average in 2012-20154) and wholesale prices just 0.4 percent.
Perhaps even more telling is that consensus expectations for 2017 are currently at 19.8 percent,
already very close to next year’s upper limit of the band.
The Central Bank’s commitment to delivering lower inflation is very clearly shown in the
reduction of monetary financing of the Treasury: BCRA transfers to the government were
reduced by half in real terms in 2016 over the previous year, and are planned to be cut even
further in 2017, when they will represent only a third of their 2015 amount in terms of GDP.
Markets are voting with their feet for tamed inflation. On October 13 the government
launched a new series of local bonds, denominated in Argentine pesos, with 10 and 7-year
maturity and with a fixed nominal interest rate. Thirteen bonds were placed and the issuance was
comfortably oversubscribed. Given Argentina’s un-glorious record of high inflation, this was
quite an achievement. However, the inverted yield-curve was even more remarkable showing
that investors were ready to accept lower yields for the longer-term bonds (15.5 percent vs. 16
percent, respectively).
Gradual and relentless fiscal consolidation. In 2015 the fiscal primary deficit was over 5
percent of GDP, the economy was in recession, and (as I will explain below) about 1/3 of
Argentineans did not have sufficient income to cover their very basic needs. This was a dramatic
situation, yet the government had no choice. It rapidly set out a roadmap for fiscal consolidation
and, as staff rightly notes, fiscal tightening will be relentless all over President Macri’s
administration. One of the first measures was to dismount energy subsidies that overall amounted
to approximately 4 percent of GDP (in 2015). Beyond being costly, these subsidies were
economically, environmentally, and socially perverse. On the one hand, they created incentives
3 http://www.bcra.gov.ar/Noticias/Regimen_de_Metas_de_Inflacion_en_Argentina.asp
4 As recorded by the Statistical Agency of the City of Buenos Aires, which published its own CPI. It should be noted
that in August, CPI as published by INDEC, was artificially low (0.2 percent) following a ruling from the Supreme
Court that required reversing gas-price increases.

for energy over-consumption; on the other hand, they benefited mostly the affluent and forced a
country with abundant gas reserves to import an increasingly large part of the gas, oil, and
electricity it needed. Prices are now being progressively reconciled with the actual cost of
production. Admittedly, this painful process has been rather tortuous, as injunctions forced the
government to temporarily reverse price increases. Nevertheless, energy subsidies are already
being progressively phased out and in 2017 savings will come close to 1 percent of GDP.
The drop in output has bottomed out. Despite a short-lived uptick in 2015 fueled by pre-
electoral fiscal stimulus, the economy had been stagnant since 2011 and started contracting in the
last quarter of 2015. When the new administration took office it had little wiggling room for
counter-cyclical fiscal policies. Rather, it had to face unpaid bills that had been pushed forward
by the previous administration; urgently address the aforementioned perverse structure of energy
subsidies; and remove the exchange rate controls. Moreover, it also had to pause ongoing public
works to take a close look at the integrity of pending bills. As a result, the contraction was more
prolonged and severe than expected. Nevertheless, output has bottomed out in the third quarter of
2016 and the year will end with a slightly positive growth rate. Activity is already picking up in
several sectors; most notably in construction (anticipated by a 16 percent increase in cement
deliveries in July and August) and the government’s growth projection for 2017 is 3.5 percent
(from a negative rate of 1.5 percent expected for this year). It is worth noting that the
government’s 3.5 percent growth projection is on the conservative side, as most private
consultants (including some advising the political opposition) are much more sanguine.
Some differences with staff. I do not want to take issue with staff’s projections but will note a
few points. Let me start by acknowledging staff’s difficulties in assessing changes in the quality
of public expenditures. It is always difficult to discern how improvements in quality could affect
the fiscal multiplier. The challenge for staff was compounded by the fact that Article IV
consultations were interrupted for the last 10 years. Yet, it is important to note that whatever the
“quality-enhanced” multiplier may be, the effect of public money spent on a road that is heavily
overpriced could be dramatically different from that of public money spent on a reasonably
priced road that is actually delivered.
It is also important to note that some of the staff’s projections bode ill with their assumptions.
For instance, in a world with low or squarely negative interest rates, staff assumes that
Argentina’s real interest rates will be between 4-5 percent until 2019 (Table 5). However, despite
these unusually positive interest rates, gross national savings remain almost unchanged over the
entire five-year period covered by staff’s forecast (Table 1).
Staff notes that Argentina’s banking sector is currently mostly “transactional”. This explains that
credit to GDP ratio is unusually low (13.5 percent according to staff5 and just 12 percent
according to BCRA estimates). Nonetheless, with such a low start, staff projects slightly less
than a 1 percent annual increase (average) for credit to the private sector over the five-year
period covered by the report (Table 1).
It is also important to note that staff is understating Argentina’s capacity to rebuild its gross
international reserves. Without going any further, staff is projecting US$ 36.5 billion of reserves
for end 2017, whereas by the end of October 2016 they were already standing at approximately
US$ 40 billion.6
Finally, staff is also understating the government’s fiscal effort as it fails to mention its endeavor
to re-capitalize the BCRA. Indeed, it has exchanged the non-transferable IOUs that the previous
administration had used to “buy” reserves from the central bank, with tradable bonds that are
actually paying interests (approximately US$ 1 billion since the government took office in 2016).
Argentina’s shame: a rich country with an impoverished population. In June 2015 the
previous government pretended that poverty had almost been eradicated from Argentina (just
under 5 percent of the population was deemed to be under the poverty line). As soon as the new
administration took office it decided to truly eradicate poverty, but also the practice of tailoring
official statistics to political expectations. Today, quite a different reality is exposed to the
daylight. Almost one out of every three adults is under the poverty line and about 40 percent of
children do not have sufficient means to cover basic needs. This is unforgivable in a rich country
that is just emerging from a decade of record commodity prices.
The authorities know that a vibrant economy is the best way to create jobs, restore dignity and
pull people out of poverty. However, the inherited reality is just too dramatic, leaving no time to
wait-and-hope. President Macri has publicly stated that reducing poverty is his administration’s
absolute priority and that by the end of his period he expects to be judged by how effectively he
delivers on that objective. The government is implementing very active social policies, including
many that come from the previous administration; nevertheless, for a change it is delivering
hand-outs transparently and not exchanging them for political support. Moreover, it needs to be
underscored that the government is putting special emphasis on training programs to revamp and
increase the working skills of those that have been striving in the informal economy. All in all,
Social Services will represent 64 percent of total public expenditures in 2017, which are about 15
5 Paragraph 36 of the staff report.
6 During October 2016 they increased by approximately US$ 7 billion and by October 27 they were standing at US$
39,841 billion. By October 31st they fell to 37.210 as the BCRA decided to pre-pay US$ 2.5 billion to the BIS.

percent of GDP.7 These transfers are indispensable to help the most vulnerable deal with this
stage of relative price variations and macro-economic rebalancing.
7 Among the main social programs is “Plan Nacional de Primera Infancia” (National Plan for Early Childhood)
which was launched at the beginning of 2016, whose objective is to eradicate malnutrition in children under the age
of 4. In education, in 2017 the national system will include all children over the age of 3; this will benefit more than
638,000 children. Moreover, 3,000 new kindergartens will be built before 2019. Recently, a national survey
“Aprender” was conducted to gain a broad picture and learn where the educational situation stands so that the
education policy can provide adequate measures. It is also worth noting that the “Asignación Universal por Hijo”, a
program created by the previous government that reaches 3.8 million children, is being maintained, enlarged, and
enhanced and now aims to add an additional 1 million infants with increased benefits.
Other programs that transfer income to the poor will also continue, such as “Argentina Trabaja” and “Ellas Hacen”,
albeit ensuring transparency and effectively ring-fencing transfers from all political interference. Moreover, a new
law approved by Congress refunds low-income households and pensioners 15 percentage points on VAT collected
on all debit card purchases, the minimum wage will also be increased by 33 percent in three stages, and important
programs on housing, water, transport, and health are underway. SMEs are also benefiting from several measures
and increased credit.


![Rebound of us_supplier_industry_final[1]](https://img.pdfslide.us/doc/110x75/5410260d7bef0a3e088b8281/rebound-of-ussupplierindustryfinal1.jpg)