Embed Size (px)
Citation preview
© 2016 International Monetary Fund
IMF Country Report No. 16/169
UNITED KINGDOM SELECTED ISSUES
This Selected Issues paper on the United Kingdom was prepared by a staff team of the
International Monetary Fund as background documentation for the periodic consultation
with the member country. It is based on the information available at the time it was
completed on June 1, 2016.
Copies of this report are available to the public from
International Monetary Fund Publication Services
PO Box 92780 Washington, D.C. 20090
Telephone: (202) 623-7430 Fax: (202) 623-7201
E-mail: [email protected] Web: http://www.imf.org
Price: $18.00 per printed copy
International Monetary Fund
Washington, D.C.
June 2016
UNITED KINGDOM SELECTED ISSUES
Approved By European Department
Prepared by an IMF staff team
MACROECONOMIC IMPLICATIONS OF THE UNITED KINGDOM LEAVING THE
EUROPEAN UNION ______________________________________________________________________ 4
A. Introduction ___________________________________________________________________________ 4
B. The UK In and Out of the EU ___________________________________________________________ 5
C. The Economics of EU Membership _____________________________________________________ 9
D. The Economic Effects on the UK of Leaving the EU ___________________________________ 23
E. Economic Effects on Other Countries__________________________________________________ 35
F. Conclusions ___________________________________________________________________________ 37
FIGURES
1. Financial Sector _______________________________________________________________________ 15
2. Migration and the Labor Market ______________________________________________________ 18
TABLE
1. Impact of Key Macroeconomic Variables ______________________________________________ 32
BOXES
1. Testing the Robustness of Estimated Effects of EU Membership on Trade and FDI ____ 39
2. How Does Political Uncertainty Affect Economies? ____________________________________ 41
3. What do we Learn from Disruptions to Other Longstanding Trade Relationships? ____ 42
APPENDICES
I. Glossary of Terms ______________________________________________________________________ 44
II. Comparison of Current and Potential Alternative Relationships with the EU __________ 46
CONTENTS
June 1, 2016
UNITED KINGDOM
2 INTERNATIONAL MONETARY FUND
III. Summary of Formal Assessments of EU Exit __________________________________________ 47
IV. Trade and Financial Exposures to the UK _____________________________________________ 49
V. Constructing the Conditional Transition Scenarios of Exit from the EU ________________ 53
References _______________________________________________________________________________ 59
UNITED KINGDOM
INTERNATIONAL MONETARY FUND 3
EXECUTIVE SUMMARY
The UK’s forthcoming referendum on European Union (EU) membership presents voters with a
momentous decision. Given the importance of the referendum, this paper aims to provide
information on some of the macroeconomic implications of the UK exiting the EU, while recognizing
that the choice of whether to remain in the EU is for UK voters to make and that their decisions will
reflect both economic and noneconomic factors.
In the event of a vote to leave the EU, the process for withdrawing and establishing a new economic
relationship with the EU could be expected to begin immediately. Alternatives—from maintaining
membership of the European Economic Area (EEA), to negotiated bespoke arrangements, to
defaulting to World Trade Organization (WTO) trade rules—imply tradeoffs between freer access to
the EU market and independence from the obligations that come with membership of the single
market.
Leaving the EU has potential implications for trade and investment, productivity and incomes, the
labor market, and the public finances. Most formal long-run assessments indicate that leaving the
EU would adversely affect the UK economy, but the range of estimates is large, and a few studies
even suggest the possibility of positive net economic benefits. Studies that find net gains, or only
very small losses, tend to assume the potential for rapid expansion of trade from new trade
agreements with other economies or a substantial boost to productivity from reducing EU-sourced
regulation. While theoretically possible, in practice the effects on output are unlikely to be
sufficiently large to make the net economic impact of exiting the EU positive.
In staff’s view, increased uncertainty and risk aversion in the short and medium run would result in a
material hit to incomes. The net long-run economic effects of leaving would also likely be negative
and substantial, though there is significant uncertainty about the precise magnitude. Reduced trade
access would likely lead to lower output and investment. Permanently lower incomes would be
associated with reduced consumption. Pass-through from a weaker pound would result in higher
prices for imported goods; depreciation would mitigate economic losses to the UK somewhat by
stimulating net exports, but not enough to offset declines in other expenditure categories. Fiscal
savings from reduced contributions to the EU budget would likely be outweighed by lower revenues
from expected lower output, resulting in a net fiscal loss.
The economic consequences for other countries would mainly be negative, albeit smaller than for
the UK, and concentrated in the EU. Within the EU, losses would vary widely, reflecting variation in
trade and financial exposures to the UK. Ireland, Malta, Cyprus, Luxembourg, the Netherlands, and
Belgium would likely be most affected.
UNITED KINGDOM
4 INTERNATIONAL MONETARY FUND
MACROECONOMIC IMPLICATIONS OF THE UNITED
KINGDOM LEAVING THE EUROPEAN UNION
A. Introduction
On June 23, 2016, voters in the United Kingdom will consider the question, “Should the United
Kingdom remain a member of the European Union or leave the European Union?”
The question of EU membership is both a political and an economic issue, and the referendum has
sparked a wide-ranging debate on the UK’s role in the EU. This paper focuses only on the
macroeconomic aspects of EU membership and a potential exit from it. The paper begins in Section
B with what membership of the EU means for the UK in terms of rights and obligations, the
procedure for leaving the EU, and potential alternative arrangements for trade and migration that
the UK could pursue. Section C then outlines the key macroeconomic channels—trade and
investment, productivity and incomes, the labor market, and the public finances—through which a
departure from the EU could affect the UK and provides some facts on each of those channels.
Section D presents evidence on the likely net economic effects for the UK, and Section E presents
evidence on the likely net economic effects for other countries. A summary and conclusions follow.
Appendices provide a glossary and additional information on potential alternative relationships with
the EU, formal assessments of EU exit, trade and financial exposures to the UK, and details on the
macroeconomic modeling of transition scenarios shown in this paper.
Given the range of plausible alternative arrangements with the EU, the number of channels by which
countries could be affected, and the uncertainty that a vote for exit could generate, the range of
possible effects on the UK and other economies is broad. Nonetheless, the balance of evidence
points to notable downward economic risks to the UK economy. The direct effects would be felt in
loss of income from reduced trade access, but extend to potential productivity losses, and would be
magnified if exit from the EU were also accompanied by restrictions on migration. The potential for
a wave of deregulation to generate productivity gains sufficient to offset losses from reduced trade
access to the European single market seems low, given the already relatively low degree of
regulation in the UK economy. Nor does it seem likely that the UK could quickly establish trade
agreements with other countries to substitute for those it has currently via EU membership. The
likelihood is therefore that output and employment would be lower should the UK leave the EU than
should it remain. In the short run, the uncertainty generated by navigating a complicated and
untested exit process could be damaging for investment, consumption, and employment; the
exchange rate could act as a buffer, but not by enough to offset the negative effects on demand
and output. Spillovers to other economies would likely be less severe, but still negative, with other
EU economies being some of the most affected.
UNITED KINGDOM
INTERNATIONAL MONETARY FUND 5
B. The UK In and Out of the EU
What does the EU provide to the UK?
1. EU membership provides access to the European single market. UK membership of the
EU ensures zero tariffs on exports to and imports from the rest of the EU. The EU is also a customs
union, which implies lower administrative costs of trade, such as from applying rules of origin, value-
added taxes, and physical checks. (The EU imposes a common external tariff on all goods entering
the union—see ¶18.) More significantly, EU membership provides access to the European single
market. The single market is more than a free trade agreement (FTA) or customs union—the intent is
a zone in which there are no barriers to the movement of goods, services, capital, and people. For
the UK in particular, the emphasis on services is crucial, as services account for four-fifths of UK GDP
and two-fifths of UK exports.
2. EU membership also provides FTAs with many other countries. The EU has trade
agreements in force with 60 other economies, whose combined GDP is 2½ times that of the UK. The
EU also has prospective agreements under negotiation with a further 67 economies, including Brazil,
Canada, India, Japan, and the US, with the aim of not only removing tariffs, but—more importantly—
opening up markets in services, investment, and public procurement.1 These markets are 10½ times
the size of UK GDP.
3. Membership provides UK-based firms with a “passport”, which is particularly
important for the financial sector. Firms operating in the UK have the right—known as the
passport—to provide business services in the rest of the EEA.2 The passport is relevant for many
firms, but particularly for the financial sector.3 For financial firms, the essence of the passport is the
mutual recognition of prudential standards. The passport means that financial firms based in the UK
can simply set up branches or offer services across borders directly—for example, an internationally-
owned financial firm can set up a headquarters in the UK to serve as a base from which to offer
services across Europe. Without a passport, such a firm would have to meet the varying
requirements of regulators in each country in which it wanted to offer services. The firm would likely
have to set up other subsidiaries, which is costly, as subsidiaries require separate capital structures
and management.
1 See the DG trade website: http://ec.europa.eu/trade/policy/countries-and-regions/agreements/index_en.htm.
2 For a definition of these and other terms, see Appendix 1.
3 For example, pharmaceutical companies based in the UK can more easily access the EU market via a single
marketing authorization granted by the European Medicines Agency (EMA).
UNITED KINGDOM
6 INTERNATIONAL MONETARY FUND
What does the EU require from the UK?
4. Domestic laws of member states like the UK are subject to the principles of the single
market. The European single market is founded on the “four freedoms” of movement of goods,
services, capital, and people. Single market rules are intended to make selling goods and services to
the 500 million residents of the EU easier and less costly for the UK and other EU members—the UK
and other EU members therefore have to follow harmonized standards. Consequently, domestic
laws and regulations that would impede the free movement of those inputs and outputs are, in
general, incompatible with the objective of a well-functioning single market. Hence, some domestic
laws have to be aligned with the principles of the single market. This also provides protection: the
UK can seek to have laws and rules in other countries that would discriminate against UK firms
overturned—in particular, EU state aid rules provide a framework for preventing firms from using
government support to gain advantage over competitors.4 Over time, a number of directives and
regulations have been added to better harmonize social, employment, health and safety, and
environmental policies across national borders.
5. The UK has negotiated a range of exemptions from EU directives.
The UK is carved out of the commitment of other member states to work toward “ever closer
union”. There is no obligation to join the euro, there will be no discrimination against the UK
because it is outside the euro area, and UK taxpayers will not be asked to pay for bail-outs of
euro area economies.5
The UK is outside the Schengen border-free area. As of February 2016, agreement was reached
providing, inter alia, concessions on benefits (e.g., a limit on access to in-work benefits by newly-
arrived EU workers, and lower rates for child support) (see HM Government, 2016b).
What procedures would be followed in the event of a vote to leave the EU?
6. The process for withdrawing from the EU and establishing a new arrangement would
be complicated. The government has stated that withdrawal from the EU would begin immediately
and would have to follow the rules of Article 50 of the Treaty on European Union (HM Government,
2016a).6
Invoking Article 50 would set off a two-year countdown for a withdrawal agreement. In the
event a new agreement had not been reached at the end of two years, the UK would lose access
to the single market and rights of its citizens to live in and travel freely in the EU, unless some
4 Note that these rules do not restrict fiscal policy, as each member government can set its own tax rates.
5 The UK was granted an opt-out from introducing the euro when the Maastricht Treaty was concluded in 1992.
6 It has sometimes been argued that the UK could simply repeal the 1972 European Communities Act. The UK
government considers that this would violate international law.
UNITED KINGDOM
INTERNATIONAL MONETARY FUND 7
sort of an extension were granted, which would require unanimous consent of all other 27 EU
member governments.
The process for negotiating withdrawal and a new agreement under Article 50 would set off a
complicated process that would run through the European Council, European Commission,
European Parliament, and Council of the European Union. No single state could veto a
withdrawal agreement, but a substantial majority would be required.7 It is not clear whether a
new agreement would require unanimous support—that would depend on the nature of the
agreement.8
7. The withdrawal would be associated with considerable uncertainty. The process is
untested—Article 50 has never been used. It would be exercised in a tight timeframe, unless that
were extended by all remaining EU governments, creating the risk that a new agreement could
become hostage to domestic political considerations in other European states. Such problems
would be more likely to arise if the UK were to seek both to retain access to the single market and to
increase its freedoms over regulations and migration (see ¶9 below).
What relationship could the UK have with the EU after an exit vote?
8. The UK would face a wide range of possible relationships with the EU, and it is not
possible to prejudge the outcome of any negotiations. No particular formal agreement is
guaranteed by the negotiations after an exit vote, although there is a default arrangement should
negotiations fail. Arrangements held by other countries illustrate the range of possibilities:
EEA membership: The UK could retain membership of the EEA, as in the case of Norway. In this
case, the UK would retain access to the single market, but also comply with the full regulatory
framework of the single market. It would lose voting rights on the determination of these
regulations and other EU decisions, pay contributions to EU members, and have to allow
freedom of movement of people. Norway is outside of the customs union with the EU and does
not benefit from the trade agreements negotiated by the EU (¶2).
A bilateral agreement: A notable precedent is Switzerland, which has established access to the
single market for specific sectors through treaties. This has secured tariff- and quota-free trade
with the EU on most goods, although, like Norway, it is outside the customs union. Although
Switzerland and the EU have an agreement on general insurance, there is no broader access for
financial services. In return, Switzerland has accepted free movement of people under the
7 Specifically, an enhanced qualified majority among the remaining EU states—implying 20 out of 27 states
representing 65 percent of the population—would be required, and a simple majority of MEPs in the European
Parliament.
8 An agreement focused solely on trade would need to be approved by the European Parliament and a qualified
majority of the European Council. A broader agreement that provided for wider cooperation would need to be
agreed by the European Parliament and unanimously by the European Council.
UNITED KINGDOM
8 INTERNATIONAL MONETARY FUND
Schengen agreement, has adopted EU regulations, and makes financial contributions to the EU.
Like Norway, it has no voting influence over EU laws.
WTO rules: The WTO has established rules such as maximum tariff rates, which both the UK and
the EU would be bound to follow, preventing punitive tariffs being imposed. In this scenario the
UK would lose access to the single market and have the same status as any country that has not
signed a preferential trade agreement with the EU. On the other hand, the UK would be
completely free to set its own regulations and to restrict migration, and would not contribute to
the EU budget. The relationship between the UK and the EU would default to this status in the
absence of an alternative agreement.
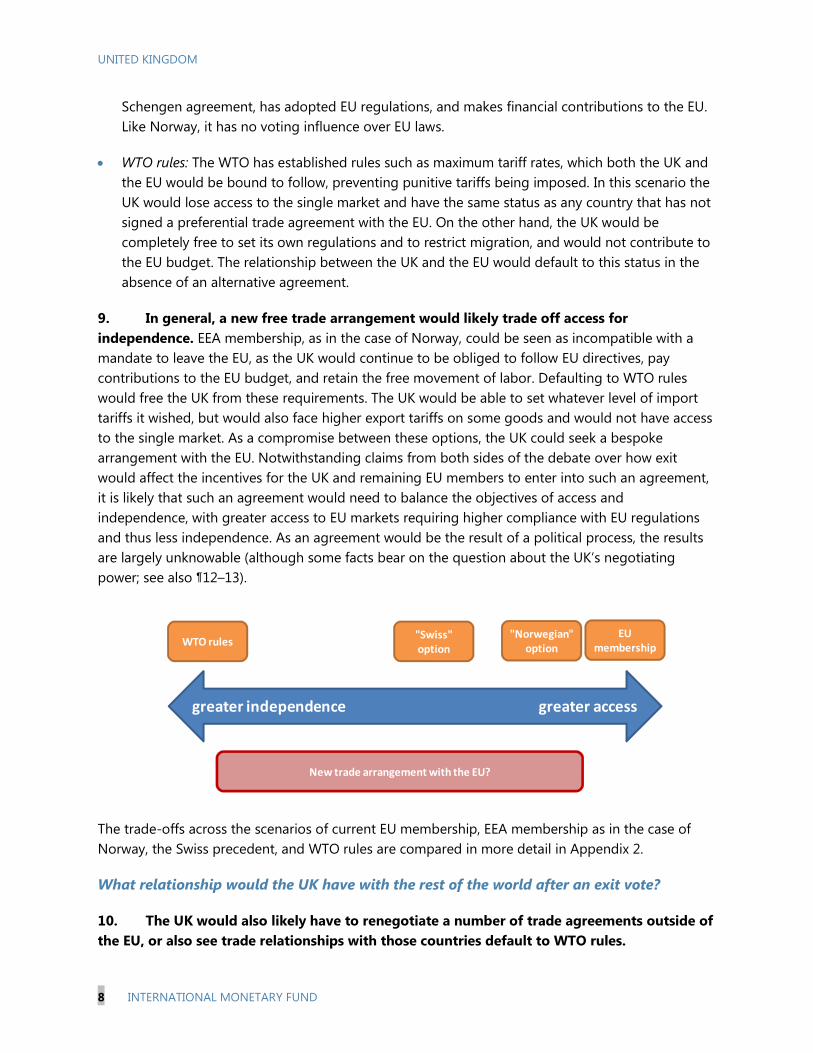
9. In general, a new free trade arrangement would likely trade off access for
independence. EEA membership, as in the case of Norway, could be seen as incompatible with a
mandate to leave the EU, as the UK would continue to be obliged to follow EU directives, pay
contributions to the EU budget, and retain the free movement of labor. Defaulting to WTO rules
would free the UK from these requirements. The UK would be able to set whatever level of import
tariffs it wished, but would also face higher export tariffs on some goods and would not have access
to the single market. As a compromise between these options, the UK could seek a bespoke
arrangement with the EU. Notwithstanding claims from both sides of the debate over how exit
would affect the incentives for the UK and remaining EU members to enter into such an agreement,
it is likely that such an agreement would need to balance the objectives of access and
independence, with greater access to EU markets requiring higher compliance with EU regulations
and thus less independence. As an agreement would be the result of a political process, the results
are largely unknowable (although some facts bear on the question about the UK’s negotiating
power; see also ¶12–13).
The trade-offs across the scenarios of current EU membership, EEA membership as in the case of
Norway, the Swiss precedent, and WTO rules are compared in more detail in Appendix 2.
What relationship would the UK have with the rest of the world after an exit vote?
10. The UK would also likely have to renegotiate a number of trade agreements outside of
the EU, or also see trade relationships with those countries default to WTO rules.
greater independence greater access
EU membership
WTO rules"Swiss"option
"Norwegian"option
New trade arrangement with the EU?
UNITED KINGDOM
INTERNATIONAL MONETARY FUND 9
The UK is party to a number of FTAs with other economies that have been negotiated by the EU.
If it were to leave the EU, the UK would likely find also itself without free trade access to those
economies. (The UK government views that it is not possible to apply the principle of
“presumption of continuity”, under which the successor state may inherit the treaty obligations
of the predecessor state, as was applied in cases such as the dissolution of Czechoslovakia.
Hence, the UK would not be able to ensure continuity by right, and agreements in which it
participates via EU membership would be subject to renegotiation.9)
To avoid such abrupt disruptions to trade, the UK would have to negotiate new trading
arrangements with trading partners outside the EU at the same time that it is negotiating both
the terms of its exit and its new arrangement with EU. The challenge of this task would add to
risks of heightened uncertainty and substantial trade disruptions during an extended transition
period that would likely run beyond the two-year window under Article 50.
C. The Economics of EU Membership
What are the channels through which the UK economy could be affected by leaving the
EU?
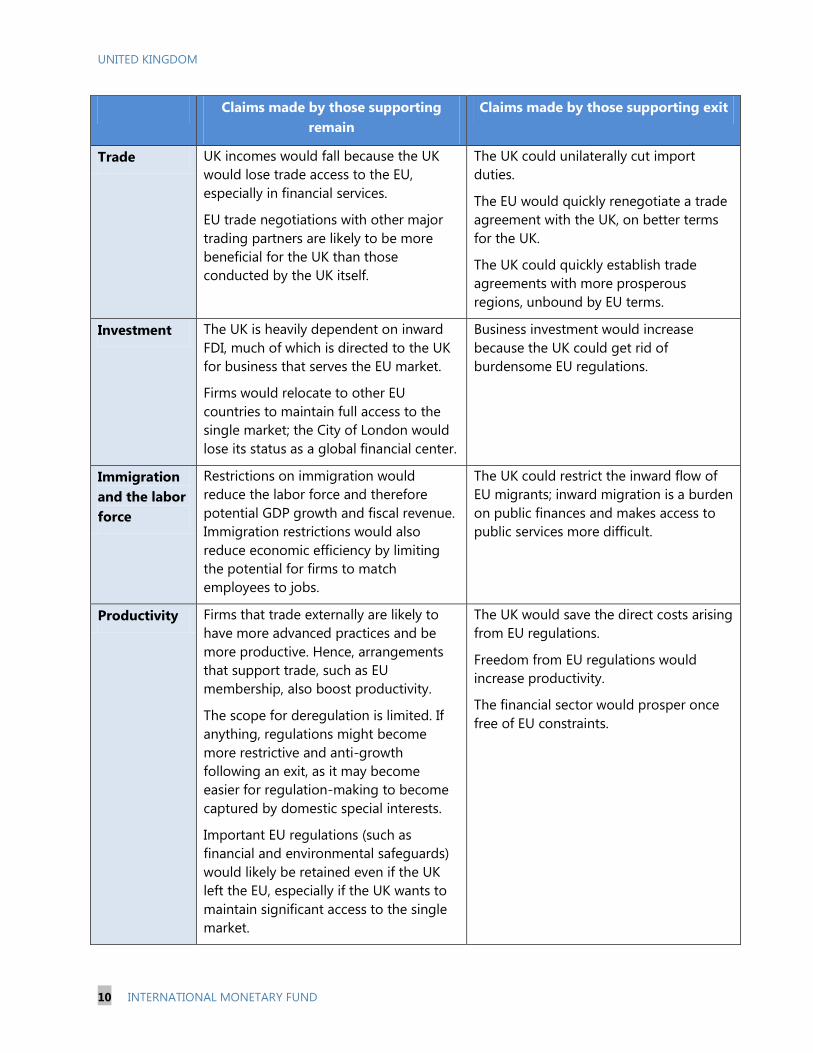
11. Leaving the EU has potential implications for trade and investment, productivity and
incomes, the labor market, and the public finances. Economic arguments for and against EU
membership revolve around five key dimensions:
External trade with the EU and other economies;
Inward investment to the UK;
The labor force and immigration;
Productivity effects from trade, migration, and regulation of the economy; and
Fiscal costs from membership of the EU and other arrangements.
For each of these, claims and counterclaims are made, the most common of which are summarized
below:
9No principle of state secession applies to treaties concluded by a multinational organization like the EU. EU
agreements all contain a territorial application clause, saying explicitly that they apply only to the territories to which
the EU Treaties apply; hence, once the UK has left the EU, the agreements no longer apply to the UK.
UNITED KINGDOM
10 INTERNATIONAL MONETARY FUND
Claims made by those supporting
remain
Claims made by those supporting exit
Trade UK incomes would fall because the UK
would lose trade access to the EU,
especially in financial services.
EU trade negotiations with other major
trading partners are likely to be more
beneficial for the UK than those
conducted by the UK itself.
The UK could unilaterally cut import
duties.
The EU would quickly renegotiate a trade
agreement with the UK, on better terms
for the UK.
The UK could quickly establish trade
agreements with more prosperous
regions, unbound by EU terms.
Investment The UK is heavily dependent on inward
FDI, much of which is directed to the UK
for business that serves the EU market.
Firms would relocate to other EU
countries to maintain full access to the
single market; the City of London would
lose its status as a global financial center.
Business investment would increase
because the UK could get rid of
burdensome EU regulations.
Immigration
and the labor
force
Restrictions on immigration would
reduce the labor force and therefore
potential GDP growth and fiscal revenue.
Immigration restrictions would also
reduce economic efficiency by limiting
the potential for firms to match
employees to jobs.
The UK could restrict the inward flow of
EU migrants; inward migration is a burden
on public finances and makes access to
public services more difficult.
Productivity Firms that trade externally are likely to
have more advanced practices and be
more productive. Hence, arrangements
that support trade, such as EU
membership, also boost productivity.
The scope for deregulation is limited. If
anything, regulations might become
more restrictive and anti-growth
following an exit, as it may become
easier for regulation-making to become
captured by domestic special interests.
Important EU regulations (such as
financial and environmental safeguards)
would likely be retained even if the UK
left the EU, especially if the UK wants to
maintain significant access to the single
market.
The UK would save the direct costs arising
from EU regulations.
Freedom from EU regulations would
increase productivity.
The financial sector would prosper once
free of EU constraints.
UNITED KINGDOM
INTERNATIONAL MONETARY FUND 11
Claims made by those supporting
remain
Claims made by those supporting exit
Fiscal Significant savings on contributions to
the EU budget have already been
granted to the UK.
Staying in the EU maintains a say on the
EU budget. The UK would have no say
but would likely have to contribute
anyway if it wanted to retain access to
the single market.
Concessions on migrant benefits have
been granted.
The UK would save from not having to
pay into the EU budget and from not
paying benefits to foreigners.
The following subsections present some facts about these five dimensions.
How important is trade with the EU to the UK?
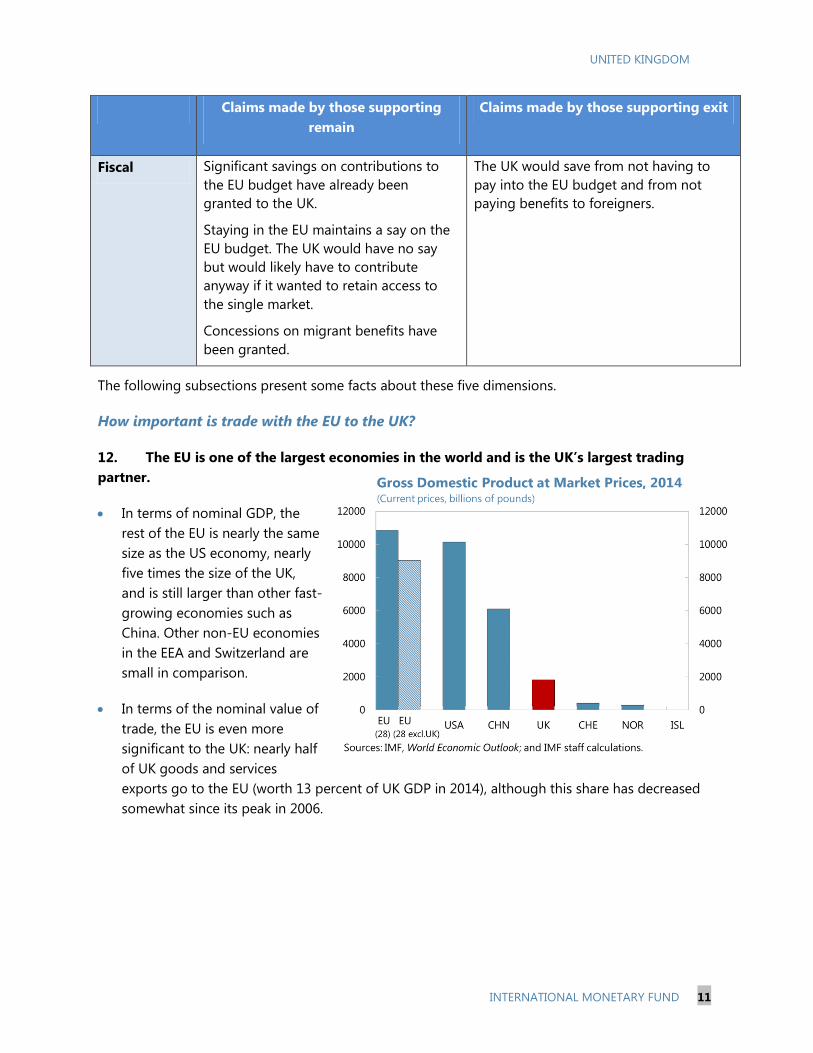
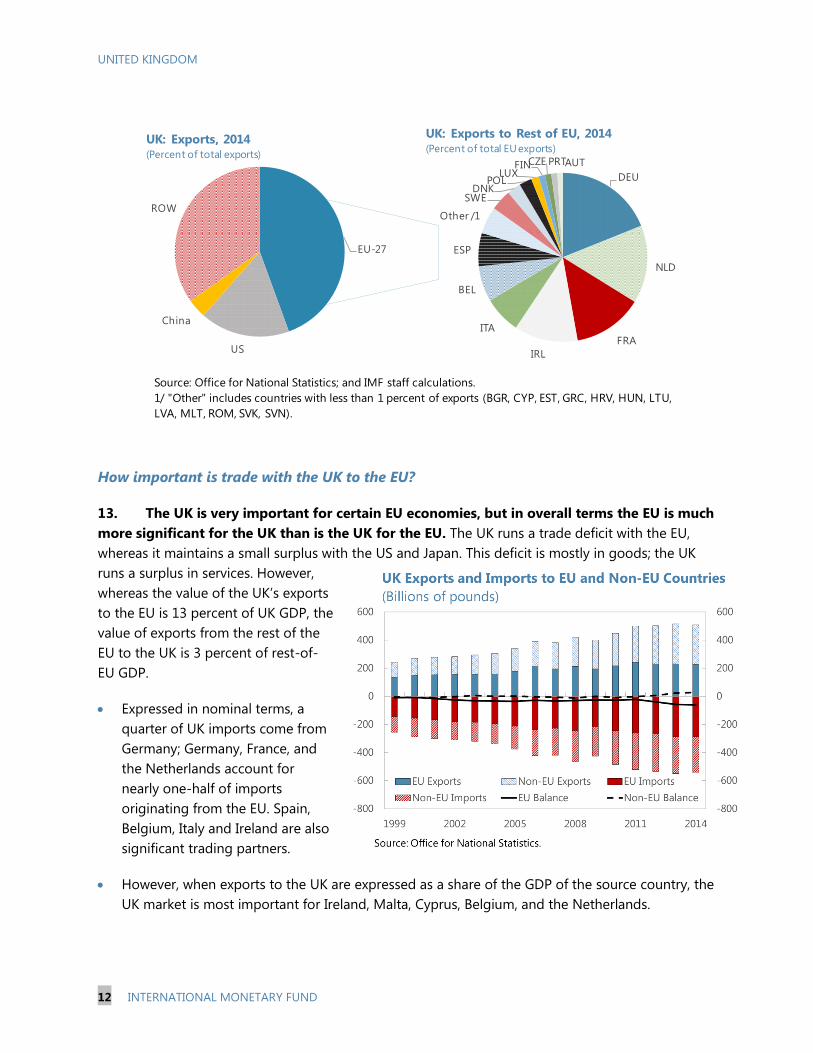
12. The EU is one of the largest economies in the world and is the UK’s largest trading
partner.
In terms of nominal GDP, the
rest of the EU is nearly the same
size as the US economy, nearly
five times the size of the UK,
and is still larger than other fast-
growing economies such as
China. Other non-EU economies
in the EEA and Switzerland are
small in comparison.
In terms of the nominal value of
trade, the EU is even more
significant to the UK: nearly half
of UK goods and services
exports go to the EU (worth 13 percent of UK GDP in 2014), although this share has decreased
somewhat since its peak in 2006.
UNITED KINGDOM
12 INTERNATIONAL MONETARY FUND
How important is trade with the UK to the EU?
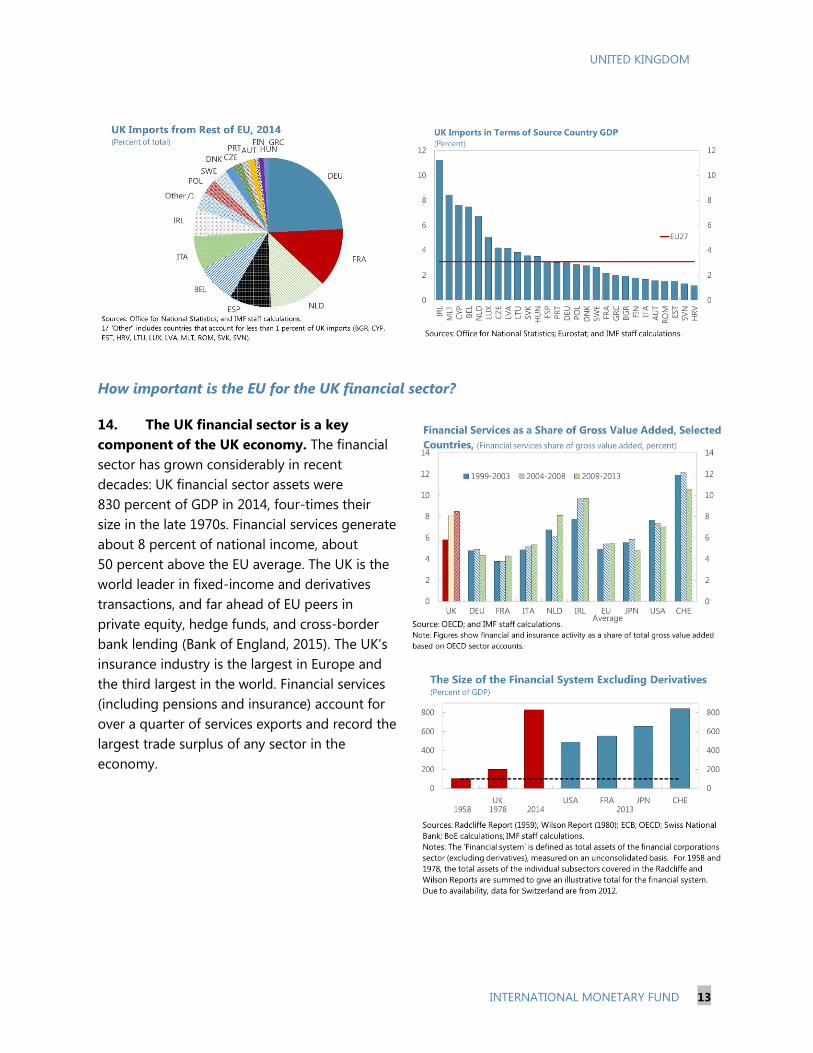
13. The UK is very important for certain EU economies, but in overall terms the EU is much
more significant for the UK than is the UK for the EU. The UK runs a trade deficit with the EU,
whereas it maintains a small surplus with the US and Japan. This deficit is mostly in goods; the UK
runs a surplus in services. However,
whereas the value of the UK’s exports
to the EU is 13 percent of UK GDP, the
value of exports from the rest of the
EU to the UK is 3 percent of rest-of-
EU GDP.
Expressed in nominal terms, a
quarter of UK imports come from
Germany; Germany, France, and
the Netherlands account for
nearly one-half of imports
originating from the EU. Spain,
Belgium, Italy and Ireland are also
significant trading partners.
However, when exports to the UK are expressed as a share of the GDP of the source country, the
UK market is most important for Ireland, Malta, Cyprus, Belgium, and the Netherlands.
Source: Office for National Statistics; and IMF staff calculations.
1/ "Other" includes countries with less than 1 percent of exports (BGR, CYP, EST, GRC, HRV, HUN, LTU,
LVA, MLT, ROM, SVK, SVN).
DEU
NLD
FRA
IRL
ITA
BEL
ESP
Other /1
SWEDNK
POLLUX
FINCZE PRTAUT
UK: Exports to Rest of EU, 2014(Percent of total EU exports)
EU-27
US
China
ROW
UK: Exports, 2014(Percent of total exports)
UNITED KINGDOM
INTERNATIONAL MONETARY FUND 13
How important is the EU for the UK financial sector?
14. The UK financial sector is a key
component of the UK economy. The financial
sector has grown considerably in recent
decades: UK financial sector assets were
830 percent of GDP in 2014, four-times their
size in the late 1970s. Financial services generate
about 8 percent of national income, about
50 percent above the EU average. The UK is the
world leader in fixed-income and derivatives
transactions, and far ahead of EU peers in
private equity, hedge funds, and cross-border
bank lending (Bank of England, 2015). The UK’s
insurance industry is the largest in Europe and
the third largest in the world. Financial services
(including pensions and insurance) account for
over a quarter of services exports and record the
largest trade surplus of any sector in the
economy.

UNITED KINGDOM
14 INTERNATIONAL MONETARY FUND
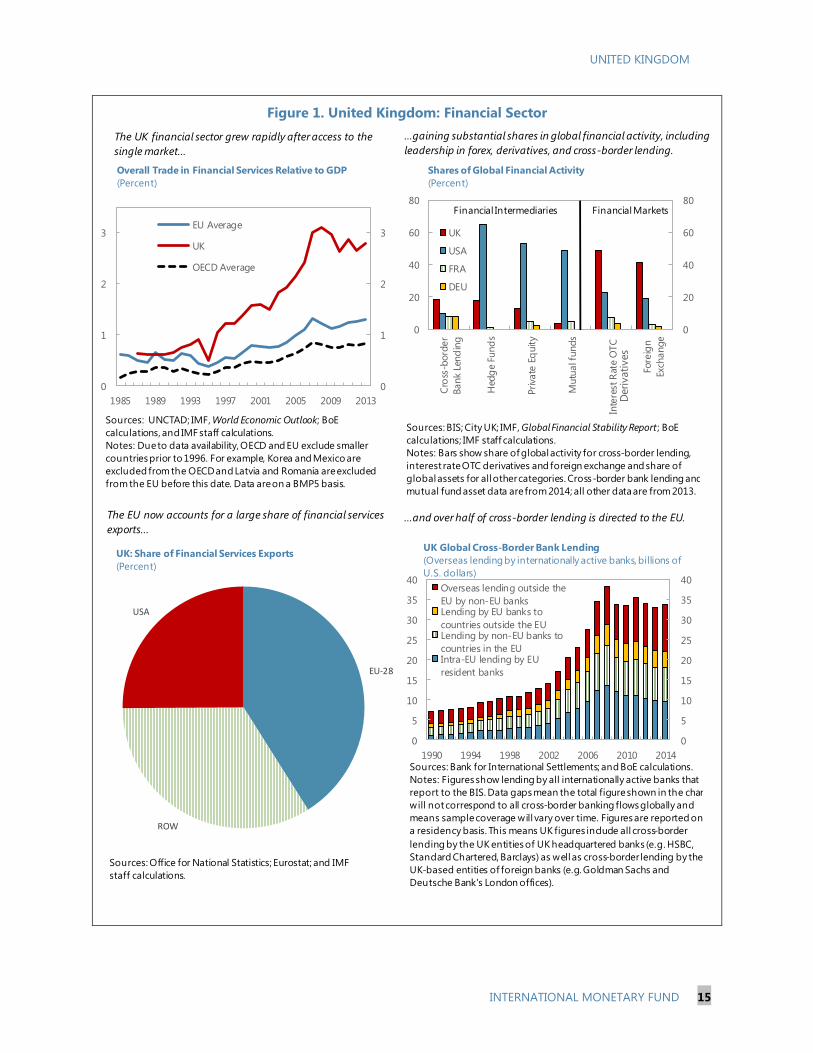
15. The growth of the UK financial sector owes much to the single market. UK financial
sector firms appear to have taken advantage of the passport: since the inception of the single
market in the early 1990s, UK trade in financial services as a percentage of GDP has risen much
faster than the OECD average (Bank of England, 2015). About a third of the UK’s financial and
insurance services exports are to the EU, and most of UK banks’ investments are in the EU. Inward
FDI to the financial sector also accelerated from the early 1990s. Consequently, the financial sector is
highly exposed to a loss of access to the single market (figure 1).
How has trade with the EU affected the UK over time?
16. UK trade with the EU has increased steadily since joining. The share of exports to the EU
appears to have increased noticeably after entering the European Economic Community (EEC), the
precursor to the EU, in the early 1970s. Just how much can be attributed to membership per se is
difficult to say with certainty. One illustrative comparison is with Switzerland: the share of Swiss
trade with the countries currently in the EU
has remained relatively constant over the
last half century, suggesting that its bilateral
trade treaties have acted more to preserve
than to boost trade access. By contrast, UK
trade on the same basis increased
noticeably, reaching a peak in 2006. Global
trade has decreased considerably after the
financial crisis, and the UK’s share of trade
with the EU has decreased noticeably, but
even so the EU remains the UK’s most
important trading partner.
UNITED KINGDOM
INTERNATIONAL MONETARY FUND 15
Figure 1. United Kingdom: Financial Sector
Figure 1. UK Financial Sector
0
1
2
3
0
1
2
3
1985 1989 1993 1997 2001 2005 2009 2013
EU Average
UK
OECD Average
Sources: UNCTAD; IMF, World Economic Outlook; BoE
calculations, and IMF staff calculations.
Notes: Due to data availability, OECD and EU exclude smaller
countries prior to 1996. For example, Korea and Mexico are
excluded from the OECD and Latvia and Romania are excluded
from the EU before this date. Data are on a BMP5 basis.
Overall Trade in Financial Services Relative to GDP
(Percent)
0
20
40
60
80
0
20
40
60
80
Cro
ss-b
ord
er
Bank
Lend
ing
Hed
ge
Fund
s
Priva
te E
quity
Mutu
al f
unds
Inte
rest
Rat
e O
TC
Fore
ign
Exch
ange
UK
USA
FRA
DEU
Sources: BIS; City UK; IMF, Global Financial Stability Report ; BoE
calculations; IMF staff calculations.
Notes: Bars show share of global activity for cross-border lending,
interest rate OTC derivatives and foreign exchange and share of
global assets for all other categories. Cross-border bank lending and
mutual fund asset data are from 2014; all other data are from 2013.
Shares of Global Financial Activity
(Percent)
Financial Intermediaries Financial Markets
0
5
10
15
20
25
30
35
40
0
5
10
15
20
25
30
35
40
1990 1994 1998 2002 2006 2010 2014
Overseas lending outside the
EU by non-EU banksLending by EU banks to
countries outside the EULending by non-EU banks to
countries in the EUIntra-EU lending by EU
resident banks
UK Global Cross-Border Bank Lending
(Overseas lending by internationally active banks, billions of
U.S. dollars)
Sources: Bank for International Settlements; and BoE calculations.
Notes: Figures show lending by all internationally active banks that
report to the BIS. Data gaps mean the total figure shown in the chart
will not correspond to all cross-border banking flows globally and
means sample coverage will vary over time. Figures are reported on
a residency basis. This means UK figures include all cross-border
lending by the UK entities of UK headquartered banks (e.g. HSBC,
Standard Chartered, Barclays) as well as cross-border lending by the
UK-based entities of foreign banks (e.g. Goldman Sachs and
Deutsche Bank's London offices).
Deri
vati
ves
The UK financial sector grew rapidly after access to the
single market...
…gaining substantial shares in global financial activity, including
leadership in forex, derivatives, and cross-border lending.
The EU now accounts for a large share of financial services
exports......and over half of cross-border lending is directed to the EU.
EU-28
ROW
USA
UK: Share of Financial Services Exports
(Percent)
Sources: Office for National Statistics; Eurostat; and IMF
staff calculations.

UNITED KINGDOM
16 INTERNATIONAL MONETARY FUND
17. Trade with the EU appears to have brought considerable benefits to the UK overall.
Quantifying the effects of trade on output and employment is not straightforward—one has to
know what would have happened in the absence of EU membership. Empirical exercises generally
find that reduced trade barriers due to EU membership have substantially increased UK incomes
(see, for example, Crafts, 2016, and Campos et al., 2014.) The evidence seems to support the notion
that trade has improved the allocation of resources by allowing the UK economy to specialize in
areas of comparative advantage and increase economies of scale. In addition, Bloom et al. (2011)
argue that trade has generated benefits through greater competition, bringing productivity gains by
adoption of leading-edge practices. Evidence suggests that the free trade agreement with the EU
has resulted in lower-priced products (Brienlich et al. 2016).
What would happen to tariffs if the UK left the EU?
18. The UK would be able to reduce import tariffs, while export tariffs and non-tariff
barriers for exports would likely increase in the absence of a negotiated agreement.
If the UK were to revert to WTO rules, it would be able to reduce import tariffs currently
imposed under the terms of the EU customs union. These tariffs can be high—for example, the
average for animal products is around 20 percent. On average, the tariff rate is calculated to be
5.3 percent in 2014, higher than for many advanced economies, including the US at
3.5 percent.10
To remain compliant with WTO rules, the UK would have to impose higher Most Favored Nation
(MFN) tariffs on imports from the 60 economies with which the UK currently has an agreement
via the EU, or remove all barriers for all WTO members (as in the case of Singapore).
Correspondingly, absent a new agreement with the EU, tariffs on UK exports to the EU would be
based on the EU’s standard MFN tariffs, compared with the zero tariff rates at present. In
addition, UK firms exporting to the EU would face higher administrative costs from not being
part of the EU customs union and higher non-tariff barriers to the extent that EU product and
services standards and regulations differed from those in the UK over time.
How important is the EU for investment in the UK?
19. The UK has been a magnet for foreign investment, most of it from the EU. The stock of
FDI in the UK is just over £1 trillion, or 57 percent of GDP. The UK typically receives by far the largest
share of intra-EU FDI, and almost half of the FDI received by the UK comes from the EU. The largest
contributions are from the Netherlands, France, Luxemburg, and Germany; after the EU, the US has
provided the most FDI.
10
See HM Government (2016c), charts 2B and 2C.
UNITED KINGDOM
INTERNATIONAL MONETARY FUND 17
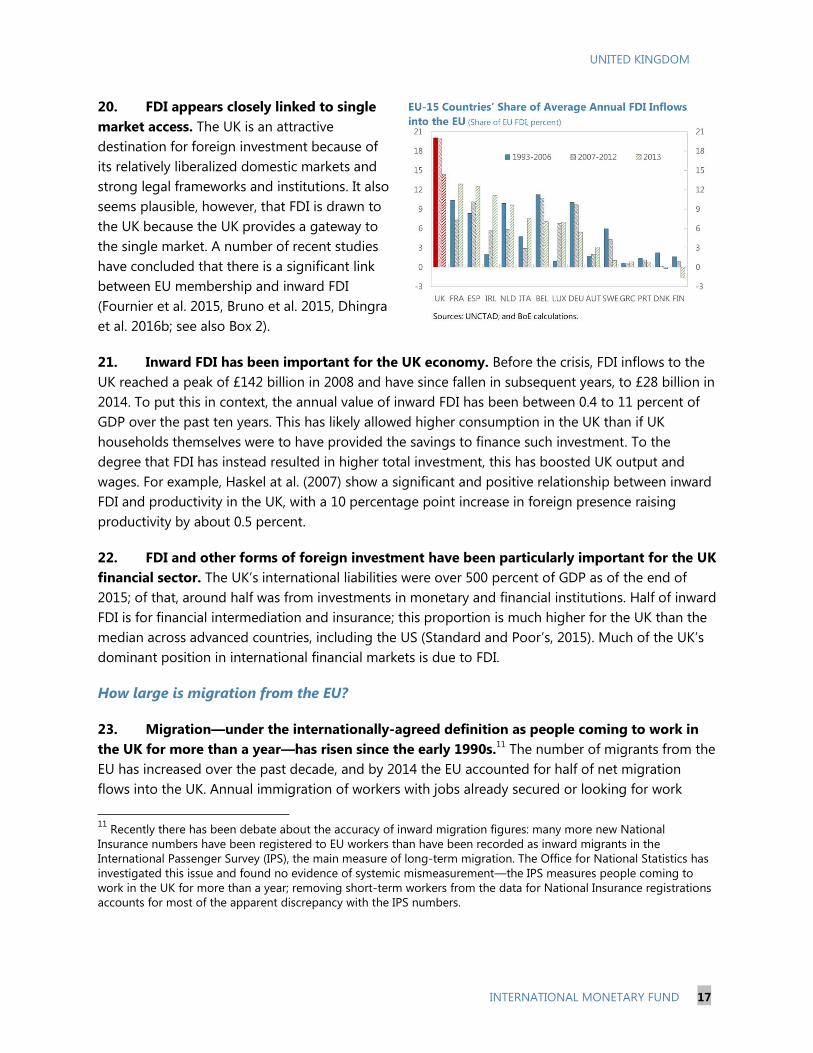
20. FDI appears closely linked to single
market access. The UK is an attractive
destination for foreign investment because of
its relatively liberalized domestic markets and
strong legal frameworks and institutions. It also
seems plausible, however, that FDI is drawn to
the UK because the UK provides a gateway to
the single market. A number of recent studies
have concluded that there is a significant link
between EU membership and inward FDI
(Fournier et al. 2015, Bruno et al. 2015, Dhingra
et al. 2016b; see also Box 2).
21. Inward FDI has been important for the UK economy. Before the crisis, FDI inflows to the
UK reached a peak of £142 billion in 2008 and have since fallen in subsequent years, to £28 billion in
2014. To put this in context, the annual value of inward FDI has been between 0.4 to 11 percent of
GDP over the past ten years. This has likely allowed higher consumption in the UK than if UK
households themselves were to have provided the savings to finance such investment. To the
degree that FDI has instead resulted in higher total investment, this has boosted UK output and
wages. For example, Haskel at al. (2007) show a significant and positive relationship between inward
FDI and productivity in the UK, with a 10 percentage point increase in foreign presence raising
productivity by about 0.5 percent.
22. FDI and other forms of foreign investment have been particularly important for the UK
financial sector. The UK’s international liabilities were over 500 percent of GDP as of the end of
2015; of that, around half was from investments in monetary and financial institutions. Half of inward
FDI is for financial intermediation and insurance; this proportion is much higher for the UK than the
median across advanced countries, including the US (Standard and Poor’s, 2015). Much of the UK’s
dominant position in international financial markets is due to FDI.
How large is migration from the EU?
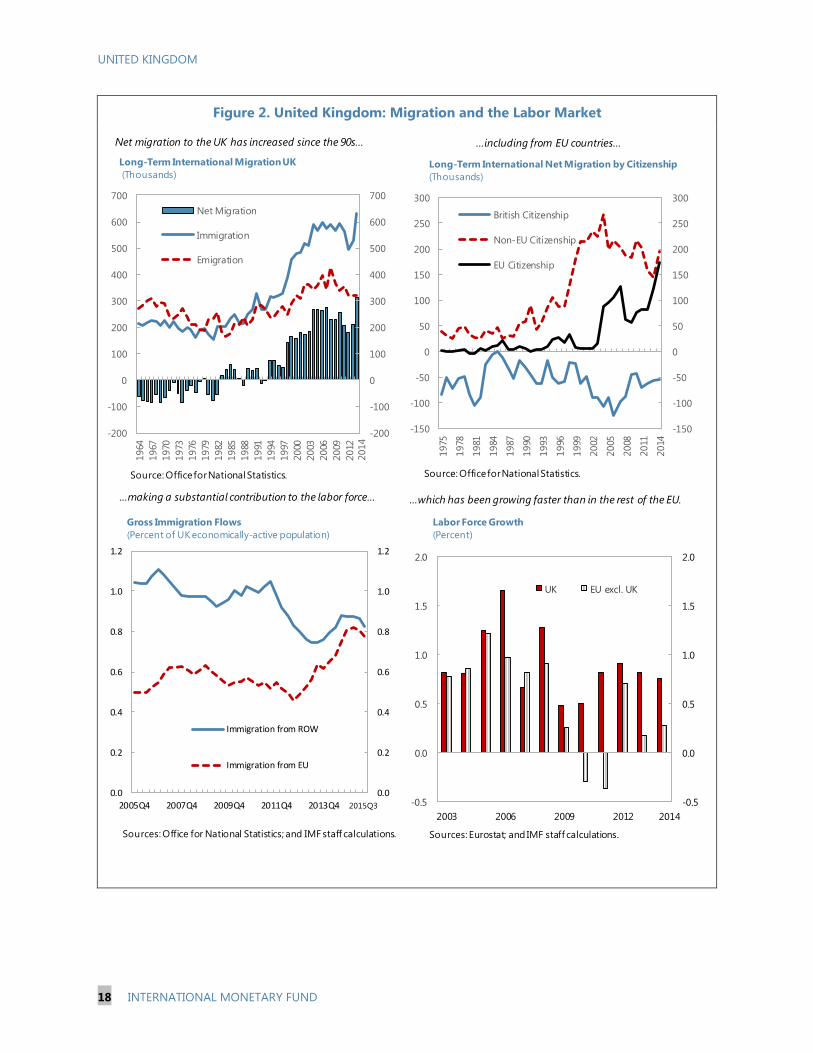
23. Migration—under the internationally-agreed definition as people coming to work in
the UK for more than a year—has risen since the early 1990s.11
The number of migrants from the
EU has increased over the past decade, and by 2014 the EU accounted for half of net migration
flows into the UK. Annual immigration of workers with jobs already secured or looking for work
11
Recently there has been debate about the accuracy of inward migration figures: many more new National
Insurance numbers have been registered to EU workers than have been recorded as inward migrants in the
International Passenger Survey (IPS), the main measure of long-term migration. The Office for National Statistics has
investigated this issue and found no evidence of systemic mismeasurement—the IPS measures people coming to
work in the UK for more than a year; removing short-term workers from the data for National Insurance registrations
accounts for most of the apparent discrepancy with the IPS numbers.
UNITED KINGDOM
18 INTERNATIONAL MONETARY FUND
Figure 2. United Kingdom: Migration and the Labor Market
Figure 2. UK Migration and the Labor Market
-200
-100
0
100
200
300
400
500
600
700
-200
-100
0
100
200
300
400
500
600
700
1964
1967
1970
1973
1976
1979
1982
1985
1988
1991
1994
1997
2000
2003
2006
2009
2012
Net Migration
Immigration
Emigration
Long-Term International Migration UK
(Thousands)
Source: Office for National Statistics.
.
2014
-150
-100
-50
0
50
100
150
200
250
300
-150
-100
-50
0
50
100
150
200
250
300
1975
1978
1981
1984
1987
1990
1993
1996
1999
2002
2005
2008
2011
2014
British Citizenship
Non-EU Citizenship
EU Citizenship
Long-Term International Net Migration by Citizenship
(Thousands)
Source: Office for National Statistics.
0.0
0.2
0.4
0.6
0.8
1.0
1.2
0.0
0.2
0.4
0.6
0.8
1.0
1.2
2005Q4 2007Q4 2009Q4 2011Q4 2013Q4
Immigration from ROW
Immigration from EU
Sources: Office for National Statistics; and IMF staff calculations.
2015Q3
Gross Immigration Flows
(Percent of UK economically-active population)
-0.5
0.0
0.5
1.0
1.5
2.0
-0.5
0.0
0.5
1.0
1.5
2.0
2003 2006 2009 2012
UK EU excl. UK
Labor Force Growth
(Percent)
Sources: Eurostat; and IMF staff calculations.
2014
Net migration to the UK has increased since the 90s... …including from EU countries…
…making a substantial contribution to the labor force… …which has been growing faster than in the rest of the EU.
UNITED KINGDOM
INTERNATIONAL MONETARY FUND 19
from the EU is now 0.8 percent of the active labor force; this immigration has helped keep the
growth rate of the labor force higher in the UK than in the rest of the EU for the past two decades.
Employed EU migrants now number just over 2 million, or 6 percent of the labor force (figure 2).
What are the macroeconomic effects of migration from the EU?
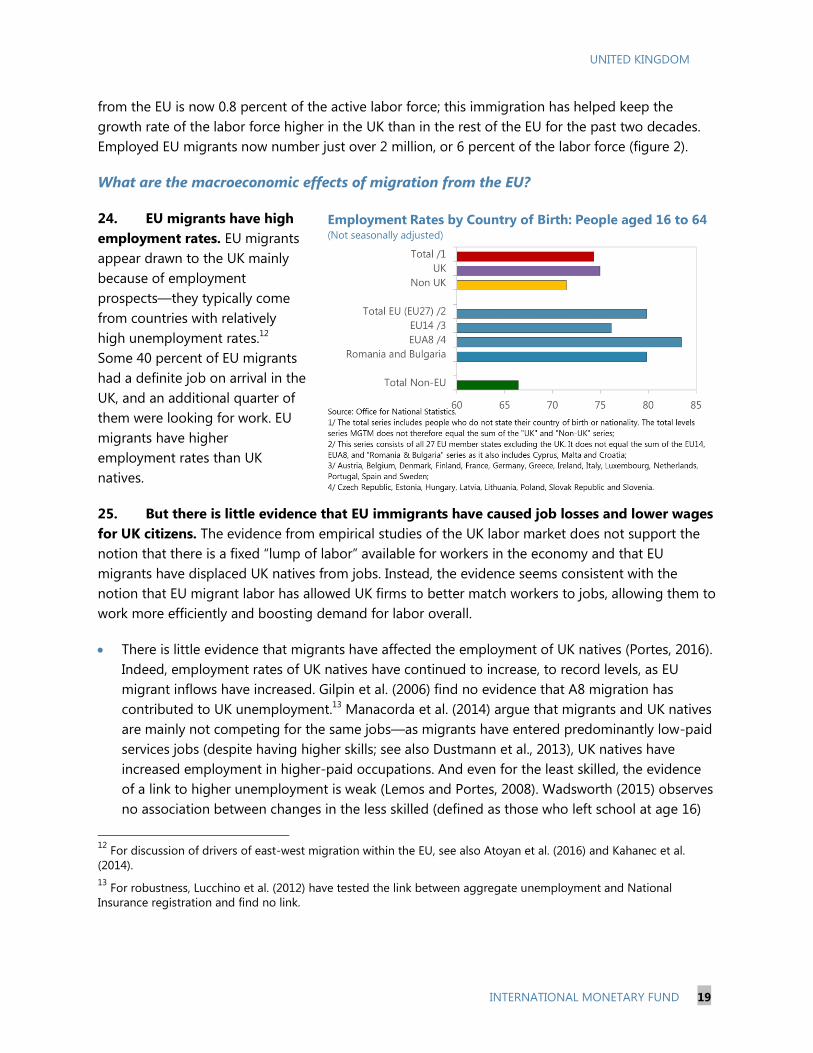
24. EU migrants have high
employment rates. EU migrants
appear drawn to the UK mainly
because of employment
prospects—they typically come
from countries with relatively
high unemployment rates.12
Some 40 percent of EU migrants
had a definite job on arrival in the
UK, and an additional quarter of
them were looking for work. EU
migrants have higher
employment rates than UK
natives.
25. But there is little evidence that EU immigrants have caused job losses and lower wages
for UK citizens. The evidence from empirical studies of the UK labor market does not support the
notion that there is a fixed “lump of labor” available for workers in the economy and that EU
migrants have displaced UK natives from jobs. Instead, the evidence seems consistent with the
notion that EU migrant labor has allowed UK firms to better match workers to jobs, allowing them to
work more efficiently and boosting demand for labor overall.
There is little evidence that migrants have affected the employment of UK natives (Portes, 2016).
Indeed, employment rates of UK natives have continued to increase, to record levels, as EU
migrant inflows have increased. Gilpin et al. (2006) find no evidence that A8 migration has
contributed to UK unemployment.13
Manacorda et al. (2014) argue that migrants and UK natives
are mainly not competing for the same jobs—as migrants have entered predominantly low-paid
services jobs (despite having higher skills; see also Dustmann et al., 2013), UK natives have
increased employment in higher-paid occupations. And even for the least skilled, the evidence
of a link to higher unemployment is weak (Lemos and Portes, 2008). Wadsworth (2015) observes
no association between changes in the less skilled (defined as those who left school at age 16)
12
For discussion of drivers of east-west migration within the EU, see also Atoyan et al. (2016) and Kahanec et al.
(2014).
13 For robustness, Lucchino et al. (2012) have tested the link between aggregate unemployment and National
Insurance registration and find no link.
UNITED KINGDOM
20 INTERNATIONAL MONETARY FUND
native youth NEET (‘not in education, employment, or training’) rate and changes in the share of
immigrants, nor evidence from comparing changes in unemployment across regions with high
and low migrant inflows.
Several studies on the UK labor market find that immigrants have not had much impact on
average wages (see Manacorda et al., 2006, and Dustman et al., 2005). The evidence on the
wages of the less skilled is mixed. Some have found evidence that migration might have had a
negative effect in some industries (Blanchflower and Shadforth, 2009, and Nickell and Saleheen,
2008; Dustmann et al., 2013 find small negative effects on lower incomes and positive effects on
higher incomes). But others find no conclusive results; Wadsworth and Vaitilingam (2015)
conclude that what effects there have been have been small.
26. Evidence suggests migration has boosted productivity and not just output. Migration
has directly added to the pool of available labor, directly boosting output. Immigrants from the EU
are also more skilled than UK natives on average, and the educational attainment gap between
migrants and natives has been rising over time (Wadsworth, 2015). They are over-represented in
high- as well as low-paid jobs. Empirical analysis suggests migrants have a positive impact on GDP
per capita (Boubtane et al. 2015), with the implication that a 50 percent decrease in the net
migration rate would be associated with a 0.3 percentage point decrease in productivity (Portes,
2015).
27. On balance, the empirical evidence finds EU immigrants make a net fiscal contribution
to the UK. As noted, EU migrants tend to have higher employment rates than UK citizens; they are
also on average younger and better educated (Migration Observatory, 2016). Consequently, they
receive less in terms of unemployment benefits on average and draw less on health services. EEA
migrants receive 10 percent of in-work benefits, even though they make up around 6 per cent of the
UK work force, reflecting the higher proportions of workers on low pay. Overall, immigrants from the
EU, and especially those from countries that joined the EU in 2004, are estimated to make a net
positive fiscal contribution to the UK (Dustmann and Frattini, 2014).14
Indirect fiscal contributions are
also likely to have been positive, to the extent that migrant workers have allowed firms to operate
more cheaply and efficiently and because training costs of migrants have mostly been absorbed
elsewhere.
What is the potential for further deregulation on leaving the EU?
28. Overall, the UK is already relatively lightly regulated. The UK already has relatively liberal
regulations on product and labor markets.
14
According to Dustman and Frattini (2014), net fiscal contributions between 2001 and 2011 of European immigrants
amounted to almost £20 billion. Jonathan Portes estimates that EEA nationals have paid more than £3 billion in taxes
on income while claiming about £0.5 billion in benefits (Financial Times, May 12, 2016).
UNITED KINGDOM
INTERNATIONAL MONETARY FUND 21
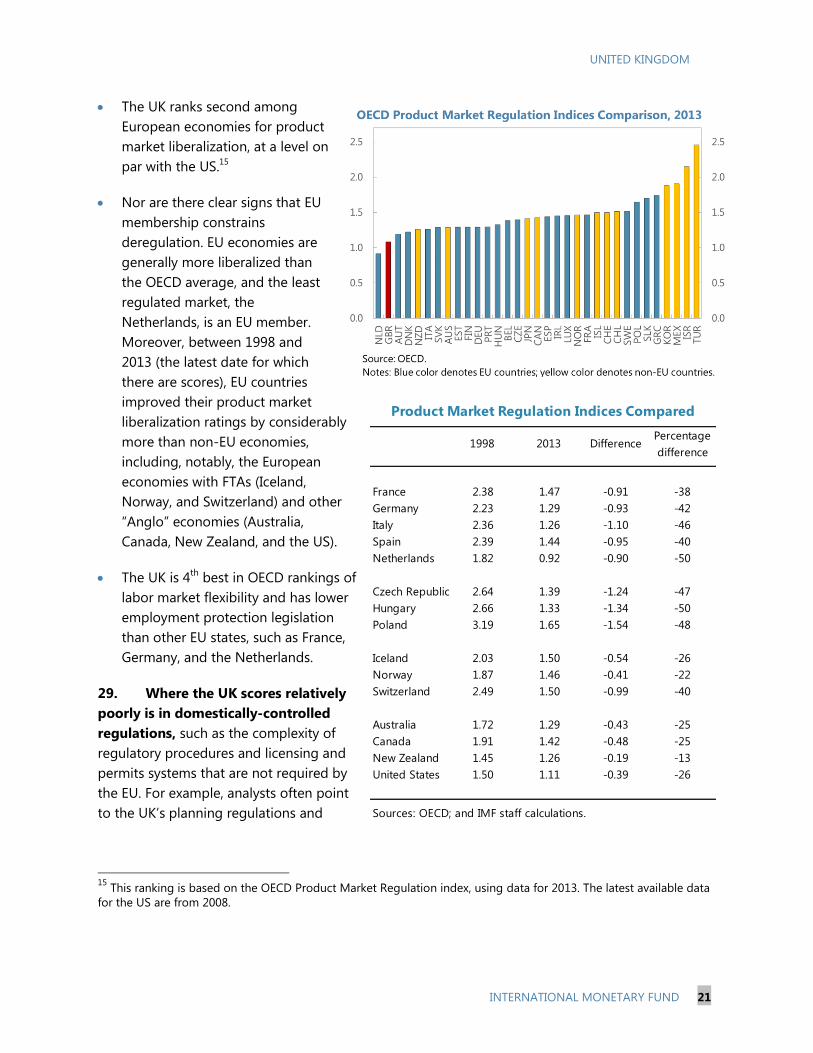
The UK ranks second among
European economies for product
market liberalization, at a level on
par with the US.15
Nor are there clear signs that EU
membership constrains
deregulation. EU economies are
generally more liberalized than
the OECD average, and the least
regulated market, the
Netherlands, is an EU member.
Moreover, between 1998 and
2013 (the latest date for which
there are scores), EU countries
improved their product market
liberalization ratings by considerably
more than non-EU economies,
including, notably, the European
economies with FTAs (Iceland,
Norway, and Switzerland) and other
“Anglo” economies (Australia,
Canada, New Zealand, and the US).
The UK is 4th
best in OECD rankings of
labor market flexibility and has lower
employment protection legislation
than other EU states, such as France,
Germany, and the Netherlands.
29. Where the UK scores relatively
poorly is in domestically-controlled
regulations, such as the complexity of
regulatory procedures and licensing and
permits systems that are not required by
the EU. For example, analysts often point
to the UK’s planning regulations and
15
This ranking is based on the OECD Product Market Regulation index, using data for 2013. The latest available data
for the US are from 2008.
France 2.38 1.47 -0.91 -38
Germany 2.23 1.29 -0.93 -42
Italy 2.36 1.26 -1.10 -46
Spain 2.39 1.44 -0.95 -40
Netherlands 1.82 0.92 -0.90 -50
Czech Republic 2.64 1.39 -1.24 -47
Hungary 2.66 1.33 -1.34 -50
Poland 3.19 1.65 -1.54 -48
Iceland 2.03 1.50 -0.54 -26
Norway 1.87 1.46 -0.41 -22
Switzerland 2.49 1.50 -0.99 -40
Australia 1.72 1.29 -0.43 -25
Canada 1.91 1.42 -0.48 -25
New Zealand 1.45 1.26 -0.19 -13
United States 1.50 1.11 -0.39 -26
Sources: OECD; and IMF staff calculations.
Product Market Regulation Indices Compared
1998 2013 DifferencePercentage
difference
UNITED KINGDOM
22 INTERNATIONAL MONETARY FUND
other restrictions on housing construction as being some of the UK’s most economically harmful
restrictions—regulations that are wholly under domestic control.
30. In addition, it seems likely that many regulations now imposed at the EU level would
be replaced with domestic equivalents in the event of an exit from the EU.
For example, European-imposed environmental regulations present a cost to UK businesses, but
deliberately so, to deter pollution and other negative externalities, and it is questionable
whether the UK would choose to forego environmental protection in the absence of EU rules.
Likewise, the Bank of England has indicated that it would be unlikely that financial regulations
currently directed at the EU level would be abandoned if the UK were to leave, including
because many of these financial regulations reflect globally-agreed standards that the UK itself
has promoted.
Many EU regulations would also likely have to be maintained if the UK were to be granted
substantial access to the single market via arrangements such as those negotiated by
Switzerland.
How much does the UK government pay to the EU?
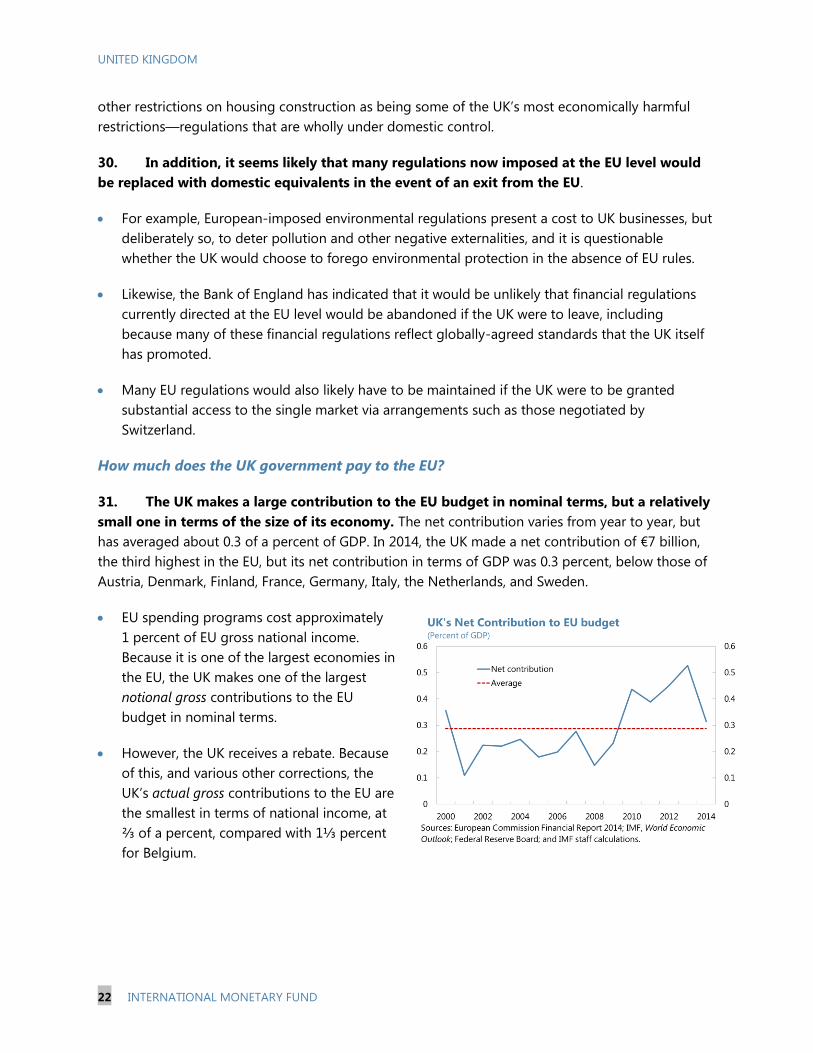
31. The UK makes a large contribution to the EU budget in nominal terms, but a relatively
small one in terms of the size of its economy. The net contribution varies from year to year, but
has averaged about 0.3 of a percent of GDP. In 2014, the UK made a net contribution of €7 billion,
the third highest in the EU, but its net contribution in terms of GDP was 0.3 percent, below those of
Austria, Denmark, Finland, France, Germany, Italy, the Netherlands, and Sweden.
EU spending programs cost approximately
1 percent of EU gross national income.
Because it is one of the largest economies in
the EU, the UK makes one of the largest
notional gross contributions to the EU
budget in nominal terms.
However, the UK receives a rebate. Because
of this, and various other corrections, the
UK’s actual gross contributions to the EU are
the smallest in terms of national income, at
⅔ of a percent, compared with 1⅓ percent
for Belgium.
UNITED KINGDOM
INTERNATIONAL MONETARY FUND 23
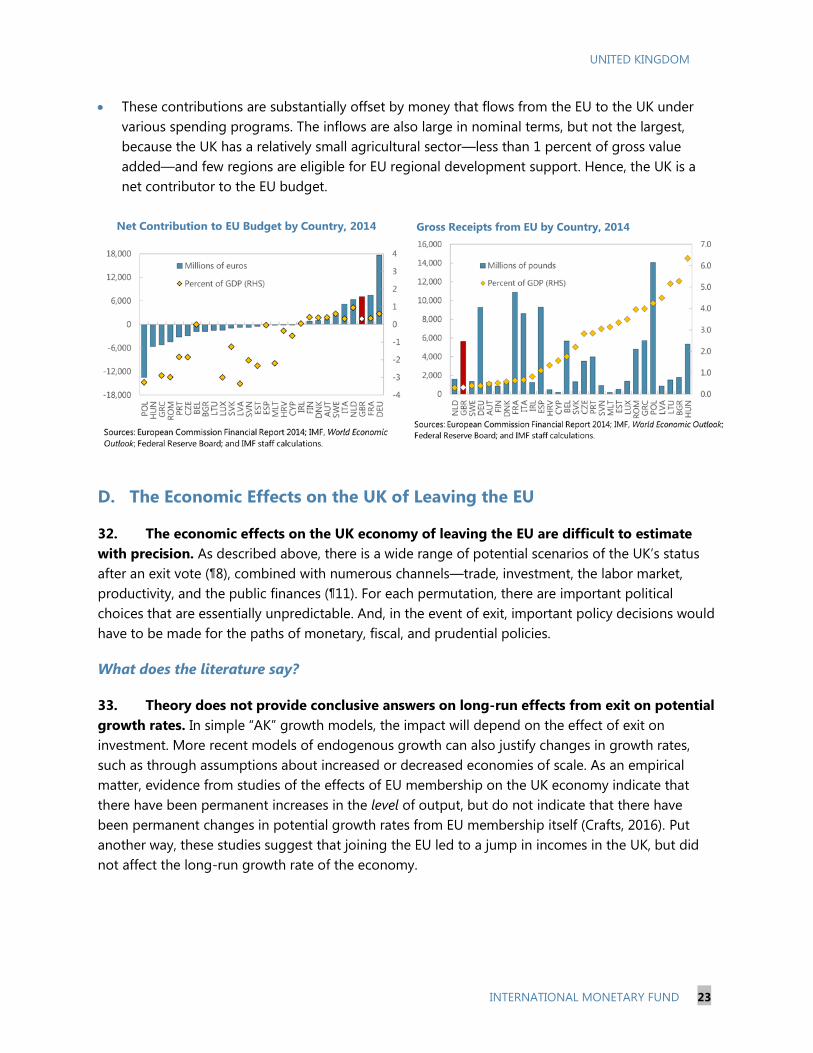
These contributions are substantially offset by money that flows from the EU to the UK under
various spending programs. The inflows are also large in nominal terms, but not the largest,
because the UK has a relatively small agricultural sector—less than 1 percent of gross value
added—and few regions are eligible for EU regional development support. Hence, the UK is a
net contributor to the EU budget.
D. The Economic Effects on the UK of Leaving the EU
32. The economic effects on the UK economy of leaving the EU are difficult to estimate
with precision. As described above, there is a wide range of potential scenarios of the UK’s status
after an exit vote (¶8), combined with numerous channels—trade, investment, the labor market,
productivity, and the public finances (¶11). For each permutation, there are important political
choices that are essentially unpredictable. And, in the event of exit, important policy decisions would
have to be made for the paths of monetary, fiscal, and prudential policies.
What does the literature say?
33. Theory does not provide conclusive answers on long-run effects from exit on potential
growth rates. In simple “AK” growth models, the impact will depend on the effect of exit on
investment. More recent models of endogenous growth can also justify changes in growth rates,
such as through assumptions about increased or decreased economies of scale. As an empirical
matter, evidence from studies of the effects of EU membership on the UK economy indicate that
there have been permanent increases in the level of output, but do not indicate that there have
been permanent changes in potential growth rates from EU membership itself (Crafts, 2016). Put
another way, these studies suggest that joining the EU led to a jump in incomes in the UK, but did
not affect the long-run growth rate of the economy.
UNITED KINGDOM
24 INTERNATIONAL MONETARY FUND
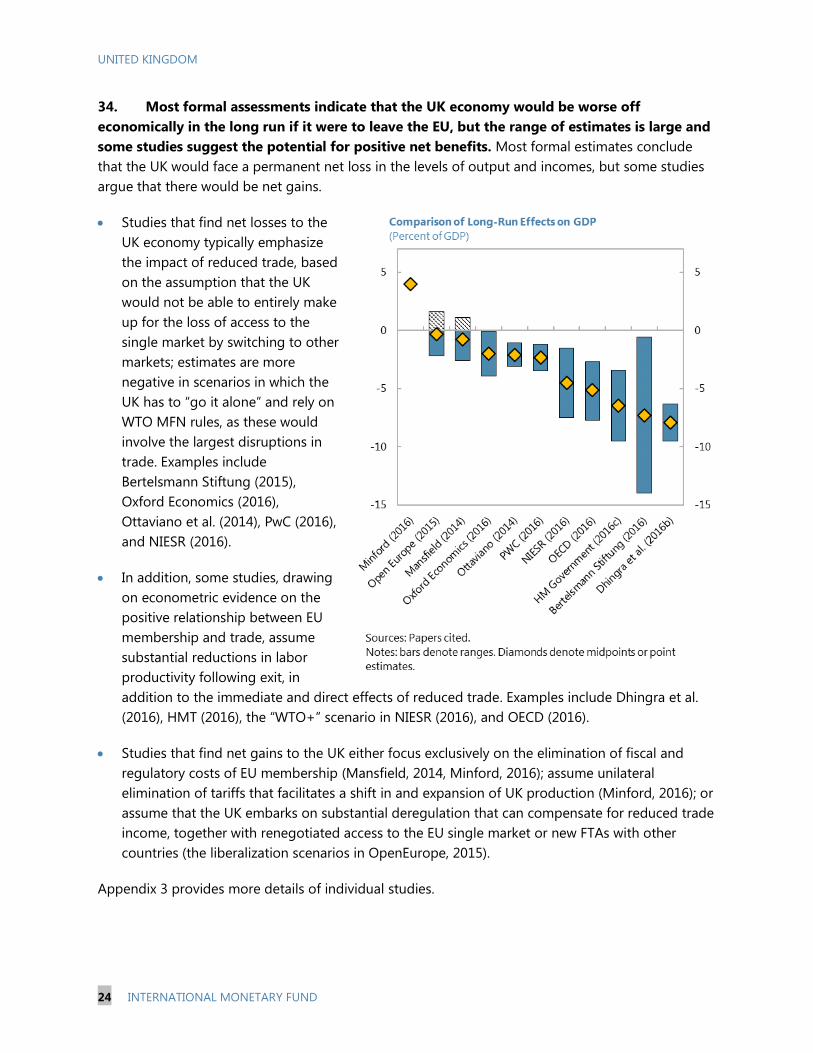
34. Most formal assessments indicate that the UK economy would be worse off
economically in the long run if it were to leave the EU, but the range of estimates is large and
some studies suggest the potential for positive net benefits. Most formal estimates conclude
that the UK would face a permanent net loss in the levels of output and incomes, but some studies
argue that there would be net gains.
Studies that find net losses to the
UK economy typically emphasize
the impact of reduced trade, based
on the assumption that the UK
would not be able to entirely make
up for the loss of access to the
single market by switching to other
markets; estimates are more
negative in scenarios in which the
UK has to “go it alone” and rely on
WTO MFN rules, as these would
involve the largest disruptions in
trade. Examples include
Bertelsmann Stiftung (2015),
Oxford Economics (2016),
Ottaviano et al. (2014), PwC (2016),
and NIESR (2016).
In addition, some studies, drawing
on econometric evidence on the
positive relationship between EU
membership and trade, assume
substantial reductions in labor
productivity following exit, in
addition to the immediate and direct effects of reduced trade. Examples include Dhingra et al.
(2016), HMT (2016), the “WTO+” scenario in NIESR (2016), and OECD (2016).
Studies that find net gains to the UK either focus exclusively on the elimination of fiscal and
regulatory costs of EU membership (Mansfield, 2014, Minford, 2016); assume unilateral
elimination of tariffs that facilitates a shift in and expansion of UK production (Minford, 2016); or
assume that the UK embarks on substantial deregulation that can compensate for reduced trade
income, together with renegotiated access to the EU single market or new FTAs with other
countries (the liberalization scenarios in OpenEurope, 2015).
Appendix 3 provides more details of individual studies.
UNITED KINGDOM
INTERNATIONAL MONETARY FUND 25
Is there a consensus on the effects on UK trade from leaving the EU?
35. Economists agree that increased barriers to the EU would be damaging to trade with
the EU—assessments vary about whether and how the UK could compensate. There is no
dispute among economists that increased trade barriers with the EU would lead to lower UK exports
to the EU. Studies differ in their assessment of the degree of deterioration and what the UK could do
to offset the damage.
Some have questioned whether the net effect on UK exports would be significant (see, for
example, Burrage, 2014). In contrast, some argue that loss of single market access would result
in substantial losses in productivity, in addition to significant direct losses from trade income
(see, for example, Dhingra et al., 2016). The robustness of empirical estimates of the effects of
EU membership on trade is discussed in Box 1. Debate also arises because an increase in tariffs
to WTO rates (¶18) is not the whole picture—assessments have to be made of the costs of being
outside the customs union and non-tariff barriers that would emerge as standards and
regulations diverged (see, for example, Ottaviano et al., 2014).
Some argue that the EU would rapidly come to agreement with the UK on a bespoke agreement
that maintained single market access while making concessions on regulations. This is clearly a
political question; some argue the UK’s size and trade deficit would work in its favor, while
others point to the disparities of UK-EU trade to argue the opposite (¶13).
Some proponents for leaving make the case that the UK could refocus trade on faster growing
regions (see, for example, Mansfield, 2014). In large part, one’s assessment of this argument will
depend on whether the UK has the legal right to demand continuity of existing trade
agreements (¶10) and/or the ability to quickly come to new arrangements (¶36, below).
How easily could the UK increase trade with other economies if it left the EU?
36. The EU is a natural trading partner, and substituting to other export markets would
likely take time.
As shown in Box 1, results from a standard empirical trade model—the so-called “gravity”
model—indicate that the geographic distance of a country from the UK is a good predictor of
the level of trade, both in goods and services. This finding suggests that European economies
are natural trading partners for the UK (see also Fournier et al., 2015, Head and Meyer, 2014).
The results also indicate that membership in the EU primarily creates additional trading
opportunities for the UK and does not simply divert British exports away from other markets to
Europe.
Substantial substitution of exports from Europe to other markets would require that the UK
negotiate new bilateral agreements to replace those now covered by arrangements with the EU
and, most likely, new trade agreements with other economies as well. Other countries’
experiences indicate that trade agreements usually take years to agree and implement, even
UNITED KINGDOM
26 INTERNATIONAL MONETARY FUND
when mutual gains are clear: for example, New Zealand took five years to implement its FTA with
China. The China-Switzerland agreement was reached relatively quickly—three years—but only
over a narrow range of goods and services. By contrast, the negotiations over the EU-Canada
Trade Agreement have taken seven years so far, and the agreement has yet to be ratified.
Could leaving the EU to unilaterally set tariffs to zero improve living standards?
37. Benefits from cutting import tariffs would likely be limited. If the UK were to leave the
EU, it would be free to reduce tariffs to zero (¶18). Reducing such tariffs would make UK consumers
better off, all else equal. This is a standard result in trade theory and the essence of the argument
presented in Minford (2016). One’s assessment of this argument will depend on judgment about the
likelihood of the scenario and other effects, notably exchange rate depreciation.
The scenario proposes unilateral reduction in tariffs to zero, with the assumption that perfect
competition ensures that all benefits accrue to UK consumers.16
On some particular goods, the
reduction in tariffs would be substantial. The effective rate would fall from 5½ percent; the
question is whether it would be feasible to reduce it to zero or it would more likely fall to some
level only somewhat smaller (such as the 3½ percent effective rate of the US). To illustrate the
political considerations involved, the scenario in Minford (2016) implies UK production shifting
entirely to services, at the expense of agriculture and manufacturing (1 and 12 percent of gross
value added, respectively). Producers in these sectors might raise political objections to such
developments, however. Indeed, it is possible that domestic political pressures may cause import
tariffs to rise following an exit, with adverse effects on UK consumers.
The obvious consequence of defaulting to WTO rules would be an increase in tariff rates on
exports to the EU from zero currently. The effective rate would be more than the notional tariff
rate (taking into account non-tariff costs, Ottaviano et al., 2014, use an effective rate of 7 percent
in their simulations). Whether this would overwhelm the benefits of unilateral reduction in
import tariffs depends on how susceptible UK exports to the EU are to these rates and how
easily the UK could divert its production to other markets (¶36). The exchange rate would likely
depreciate permanently, given the need to sell UK tradeable goods and services to other
economies (¶44, below). This would aid redirection of exports, but would also potentially
completely offset the reduction in import tariffs. A post-exit reduction in UK import duties would
expose some sectors (such as the auto industry) to a simultaneous increase in tariffs on their
exports to the EU and a reduction in tariffs on competing imports from outside the EU.
16
The scenario also assumes that the UK would save 0.8 percent of GDP from contributions to the EU budget (see
¶41) and would be able to reduce national insurance contributions by 2 percentage points.
UNITED KINGDOM
INTERNATIONAL MONETARY FUND 27
How much could cutting EU regulations benefit the UK?
38. Arguments are made that leaving the EU would allow the UK to get rid of burdensome
EU regulations, lowering business costs and facilitating higher output, investment, and
employment. For example, in OpenEurope (2015), scenarios in which the UK leaves the EU to strike
an FTA with the EU and pursue intensive deregulation yield net benefits ranging from ½ to
1½ percent of GDP. The crucial issue is whether intensive deregulation would be likely and whether
that would lead to large gains in output.
39. The potential for cuts in costs of regulation sufficient to outweigh losses from reduced
access to the single market appear slim. Estimating costs and benefits of regulation is extremely
difficult. Nonetheless, based on UK government impact studies, OpenEurope (2015) assesses that EU
regulations impose annual gross costs of £33 billion, with annual gross benefits of £59 billion, and
estimates that regulations costing net £8 billion could be eliminated in the event of an exit from the
EU. That assumes scrapping a range of employment (e.g., the Working Time and Agency Directives),
climate change (e.g., Renewables Directive), and financial regulations (e.g., Solvency II for insurance
firms), the first two of which might encounter considerable domestic opposition, and the last would
need to be replaced with an equivalent UK regime.17
But even if such cuts were possible, the direct
savings would be outweighed if losses in trade and related income arising from reduced access to
the single market access were larger than ½ percent of GDP.
40. Instead, a substantial productivity increase would likely be required to offset likely
losses from reduced access to the single market. Staff analysis and empirical evidence suggests
that reduced trade access would cause a permanent reduction in the level of output, worsened by
associated disinvestment, productivity reductions arising from lessened trade, and, if accompanied
by restrictive inward migration policies, labor shortages and mismatching. It is theoretically possible
that these effects could be offset by higher productivity as a result of increased policy flexibility and
deregulation following an EU exit. Many countries have experienced spurts in productivity, often for
reasons that are not well understood (Easterly et al., 1987). However, the UK is comparatively
deregulated already, and productivity problems in the UK are more to do with skills, infrastructure,
and planning problems than regulatory burdens associated with EU membership (LSE, 2013). This
raises the question of whether the required gains in productivity could be achieved quickly and be
sustained. Moreover, regulatory policies might actually become less supportive, not more
supportive, of growth following an exit.
What would be the fiscal impact of leaving the EU?
41. The UK would likely not save all of its contribution by leaving the EU. As noted (¶31),
the UK contributes roughly ⅔ of a percent of GDP to the EU budget on a gross basis. However, in
17
Note also that the UK, along with other countries, has already secured an individual opt-out for the Working Time
Directive.
UNITED KINGDOM
28 INTERNATIONAL MONETARY FUND
the event of leaving the EU, the UK’s saving might instead be closer to its net contribution of
⅓ percent of GDP. First, over 95 percent of funds that the UK receives are for R&D and university
research, regional development, and agriculture. Less could be spent on those items, but obviously
at the expense of those who already receive them. Second, if the UK were to seek access to the
single market after exiting the EU, it would most likely have to continue to make contributions to EU
member states, as do Norway and Switzerland.18
42. Relatively small GDP losses from trade would more than offset savings from reduced
EU contributions, resulting in net fiscal losses. Staff analysis below and other assessments using
formal macroeconomic models indicate that the direct fiscal saving from leaving the EU would be
outweighed by the fall in fiscal revenues arising from loss of trade income (and, potentially, lower
productivity). For example, assuming the revenue-to-GDP ratio stays constant, then each
1 percentage point decline in output would reduce fiscal revenue (and increase the fiscal deficit) by
an amount equivalent to about 0.4 percent of GDP. Consequently, any output losses in excess of
1 percent of GDP would result in net fiscal losses for the UK.19
What would be the impact of restricting inward migration?
43. As migrants add to productivity overall, restricting migration would likely lower GDP
per capita.
A problem with assessing the impact of restrictive migration is that it is not clear how
restrictions would be imposed (an immediate issue would be those EU migrants already living
and working in the UK). Sanchez Martinez and Lisenkova (2014) assume no change to the
current population of migrants and find that if the net flow of future inward migration were cut
by half, GDP and GDP per capita would fall in the long run by 11.0 and 2.7 percent, respectively.
It is sometimes proposed that the UK could increase productivity by picking highly-skilled EU
workers on the basis of a points system, as it does already under the “Tier 2” system for non-EU
nationals. The effect of such a policy is not clear: EU migrants are more educated overall and are
already overrepresented in higher-paid (as well as lower-paid) jobs. Cutting the numbers of EU
migrants able to enter lower-paid jobs would tend to increase productivity via “batting average”
effects if the effect were to slow employment growth in lower-paid jobs, but it seems more likely
that the net effect would be to constrain UK firms. (Some industries would be particularly
adversely affected by restrictions on immigration: hospitality, food and drink, and construction.
Rolfe and Hudson-Sharpe (2016) find that employers are concerned about their ability to fill
vacancies in the event of restrictions on EU migrants.)
18
Norway and Switzerland do not formally contribute to the EU budget, but do make payments to EU member
states.
19 This could be a generous figure: the Institute for Financial Studies calculates that a reduction in national income of
only 0.6 percent would outweigh the saving of the EU budget contribution. See Emmerson et al. (2016).
UNITED KINGDOM
INTERNATIONAL MONETARY FUND 29
On balance—assessing the long-run economic impact of exiting the EU
44. The UK economy would likely be worse off economically in the long run. Based on an
assessment of the evidence and other studies, it seems most likely that the net effect on GDP from
exiting the EU would be negative, with the degree depending on the alternative arrangement
reached with the EU.
Reduced trade access would lower returns to capital, causing firms to reduce investment and
lower real wages.
Lower permanent income, associated with lower real wages, would result in reduced
consumption.
A permanent reduction in export demand would be associated with a permanent depreciation in
the real exchange rate, to eventually restore the current account balance to equilibrium. This
would cause imported goods to become more expensive. Exports would be more competitively
priced, but not by enough to fully offset reduced export demand from higher trade barriers.
Losses would likely be accentuated to the extent that reduced trade brought reductions in
productivity and foreign investment. Restrictions on inward migration would also damage not
just labor supply but, potentially, skill levels and efficiency.
Assessing the short-run economic impact of exiting the EU—the role of uncertainty and
risk aversion
45. Another risk is that of an immediate market disruption following the vote. Asset prices
in the UK (and, to a lesser degree, the rest of the EU) would likely fall in the aftermath of a vote for
exit. Of particular concern is the possibility, in extremis, for liquidity to dry up, especially for the
funding of UK banks, which could cause a credit squeeze on UK households and businesses (Bank of
England, 2015b).20
46. Uncertainty and increased risk aversion would likely play a significant role during the
transition period. During the protracted period in which the UK would have to negotiate new
arrangements with the EU and its other trading partners, UK and foreign firms operating in the UK
would need to make decisions about how to position themselves. Uncertainty about new
arrangements would provide an incentive to hold off on investment and hiring; some firms might
even decide to pull out of the UK and relocate to EU countries to the extent that their businesses
depend on access to the single market. The same arguments apply to households, which could
decide to hold off on buying durable goods and houses. The resulting shortfall in demand would
20
The Bank of England will offer additional indexed long-term repo operations and will continue to offer dollar
liquidity in the weeks around the referendum to try to ensure the smooth functioning of sterling money markets.
UNITED KINGDOM
30 INTERNATIONAL MONETARY FUND
generate more unemployment; the resulting job insecurity would likely cause households to reduce
consumption (Box 2).
47. To assess these risks, staff considered scenarios for limited and more adverse
uncertainty. The aim of the scenarios is to explore the implications of the transition to a new long-
run relationship with the EU—which can be expected to have implications in the short run, to the
extent that households and firms are forward looking—and the additional effects of increased risk
and uncertainty about the new long run.
To examine these issues, two scenarios are considered:
Limited uncertainty, associated with convergence to an EEA-type regime. Households and firms
are relatively confident about the new long run, and therefore uncertainty dissipates relatively
quickly. The new trading arrangement brings some costs (such as from being outside the
customs union), and output is lower by 1½ percent in the long run. In terms of historical
experiences, the uncertainty is about one-quarter of that experienced during the global financial
crisis.
An adverse scenario in which negotiations with the EU do not proceed smoothly and the UK
eventually defaults to WTO rules. The implications of the new long run are relatively slow to
emerge, but the difficulty of the negotiations generates considerable uncertainty and larger
increases in risk premia than in the limited scenario. The uncertainty is at the same level of that
experienced during the global financial crisis, but is somewhat slower to peak and takes longer
to dissipate. Under this scenario, output is lower by about 4½ percent in the long run.
The scenarios are intended to be illustrative and are not predictions; nor are they meant to indicate
upper and lower bounds to what could happen. In particular, although the scenarios considered
here are based on reasonable assumptions about the impact of different types of post-EU
arrangements on trade, investment, and productivity, they should not be interpreted as casting
doubt on the plausibility of assumptions employed in other studies. Changes in assumptions would
lead to different outcomes; as discussed (¶34–35), some studies have found significantly larger long-
run effects of EU exit on UK GDP. Instead, the assumptions about long-run costs in the range
considered here allow a greater focus on the impact of uncertainty on medium-term economic
activity—that is, the short-run impacts shown below are driven substantially by the impact of
uncertainty on economic activity rather than anticipation of substantial long-run costs.
In both scenarios, monetary policy is assumed to remain on hold for two years after the decision to
leave the EU. This is a technical assumption imposed to simplify the interpretation of the results, and
not a normative conclusion about desirable monetary policy. It is worth noting, however, that the
Bank of England has emphasized that the course of monetary policy in the aftermath of a vote to
leave the EU would depend on an assessment of the impact on demand, supply, and the exchange
rate, with no presumption that monetary policy would become either more or less accommodative.
UNITED KINGDOM
INTERNATIONAL MONETARY FUND 31
The scenarios are informed by a range of tools, ranging from analysis of historical episodes,
econometric evidence, and simulations from structural macroeconomic models. These tools are used
as inputs and cross-checked in the “financial programming” framework staff uses to prepare its
macroeconomic projections. For more details on the tools and assumptions, see Appendix V.
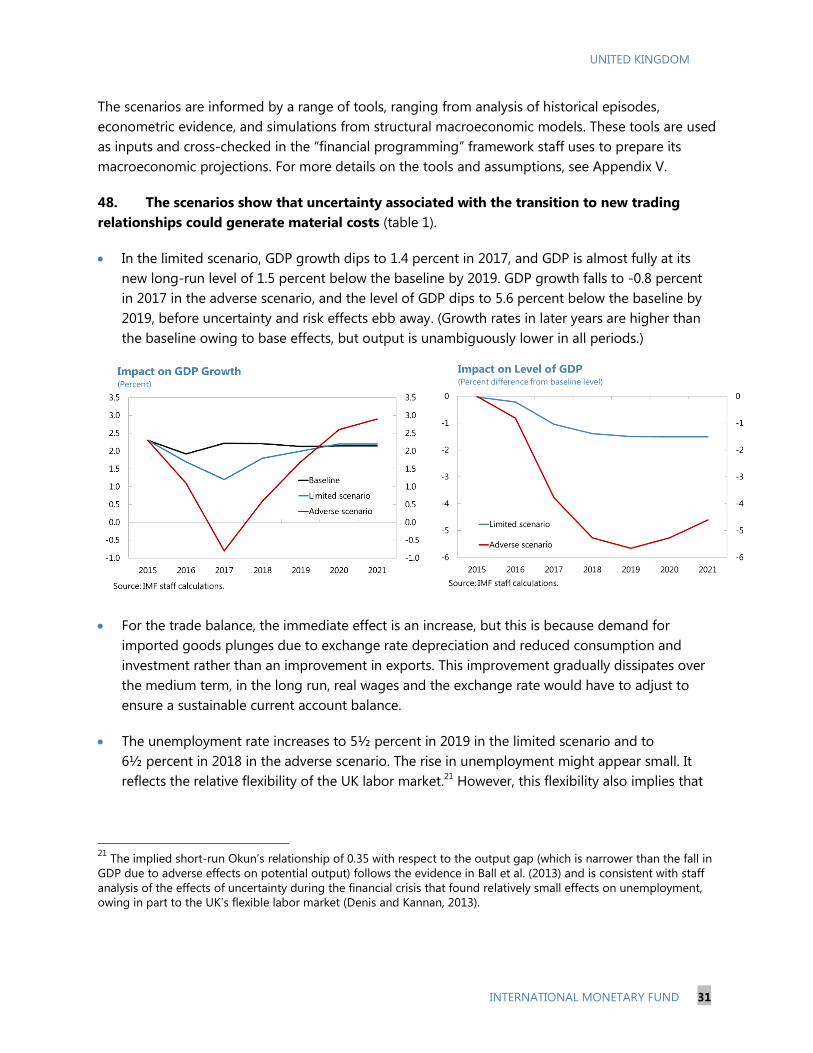
48. The scenarios show that uncertainty associated with the transition to new trading
relationships could generate material costs (table 1).
In the limited scenario, GDP growth dips to 1.4 percent in 2017, and GDP is almost fully at its
new long-run level of 1.5 percent below the baseline by 2019. GDP growth falls to -0.8 percent
in 2017 in the adverse scenario, and the level of GDP dips to 5.6 percent below the baseline by
2019, before uncertainty and risk effects ebb away. (Growth rates in later years are higher than
the baseline owing to base effects, but output is unambiguously lower in all periods.)
For the trade balance, the immediate effect is an increase, but this is because demand for
imported goods plunges due to exchange rate depreciation and reduced consumption and
investment rather than an improvement in exports. This improvement gradually dissipates over
the medium term, in the long run, real wages and the exchange rate would have to adjust to
ensure a sustainable current account balance.
The unemployment rate increases to 5½ percent in 2019 in the limited scenario and to
6½ percent in 2018 in the adverse scenario. The rise in unemployment might appear small. It
reflects the relative flexibility of the UK labor market.21
However, this flexibility also implies that
21
The implied short-run Okun’s relationship of 0.35 with respect to the output gap (which is narrower than the fall in
GDP due to adverse effects on potential output) follows the evidence in Ball et al. (2013) and is consistent with staff
analysis of the effects of uncertainty during the financial crisis that found relatively small effects on unemployment,
owing in part to the UK’s flexible labor market (Denis and Kannan, 2013).
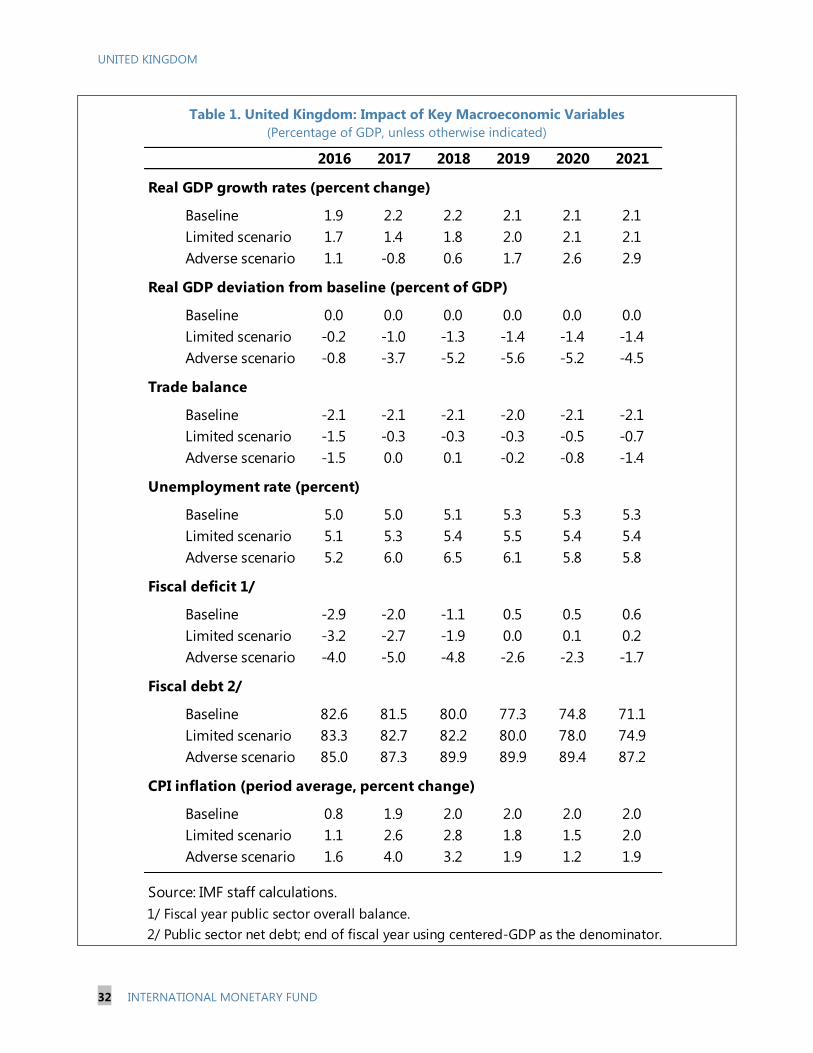
UNITED KINGDOM
32 INTERNATIONAL MONETARY FUND
Table 1. United Kingdom: Impact of Key Macroeconomic Variables
(Percentage of GDP, unless otherwise indicated)
2016 2017 2018 2019 2020 2021
Real GDP growth rates (percent change)
Baseline 1.9 2.2 2.2 2.1 2.1 2.1
Limited scenario 1.7 1.4 1.8 2.0 2.1 2.1
Adverse scenario 1.1 -0.8 0.6 1.7 2.6 2.9
Real GDP deviation from baseline (percent of GDP)
Baseline 0.0 0.0 0.0 0.0 0.0 0.0
Limited scenario -0.2 -1.0 -1.3 -1.4 -1.4 -1.4
Adverse scenario -0.8 -3.7 -5.2 -5.6 -5.2 -4.5
Trade balance
Baseline -2.1 -2.1 -2.1 -2.0 -2.1 -2.1
Limited scenario -1.5 -0.3 -0.3 -0.3 -0.5 -0.7
Adverse scenario -1.5 0.0 0.1 -0.2 -0.8 -1.4
Unemployment rate (percent)
Baseline 5.0 5.0 5.1 5.3 5.3 5.3
Limited scenario 5.1 5.3 5.4 5.5 5.4 5.4
Adverse scenario 5.2 6.0 6.5 6.1 5.8 5.8
Fiscal deficit 1/
Baseline -2.9 -2.0 -1.1 0.5 0.5 0.6
Limited scenario -3.2 -2.7 -1.9 0.0 0.1 0.2
Adverse scenario -4.0 -5.0 -4.8 -2.6 -2.3 -1.7
Fiscal debt 2/
Baseline 82.6 81.5 80.0 77.3 74.8 71.1
Limited scenario 83.3 82.7 82.2 80.0 78.0 74.9
Adverse scenario 85.0 87.3 89.9 89.9 89.4 87.2
CPI inflation (period average, percent change)
Baseline 0.8 1.9 2.0 2.0 2.0 2.0
Limited scenario 1.1 2.6 2.8 1.8 1.5 2.0
Adverse scenario 1.6 4.0 3.2 1.9 1.2 1.9
Source: IMF staff calculations.
1/ Fiscal year public sector overall balance.
2/ Public sector net debt; end of fiscal year using centered-GDP as the denominator.
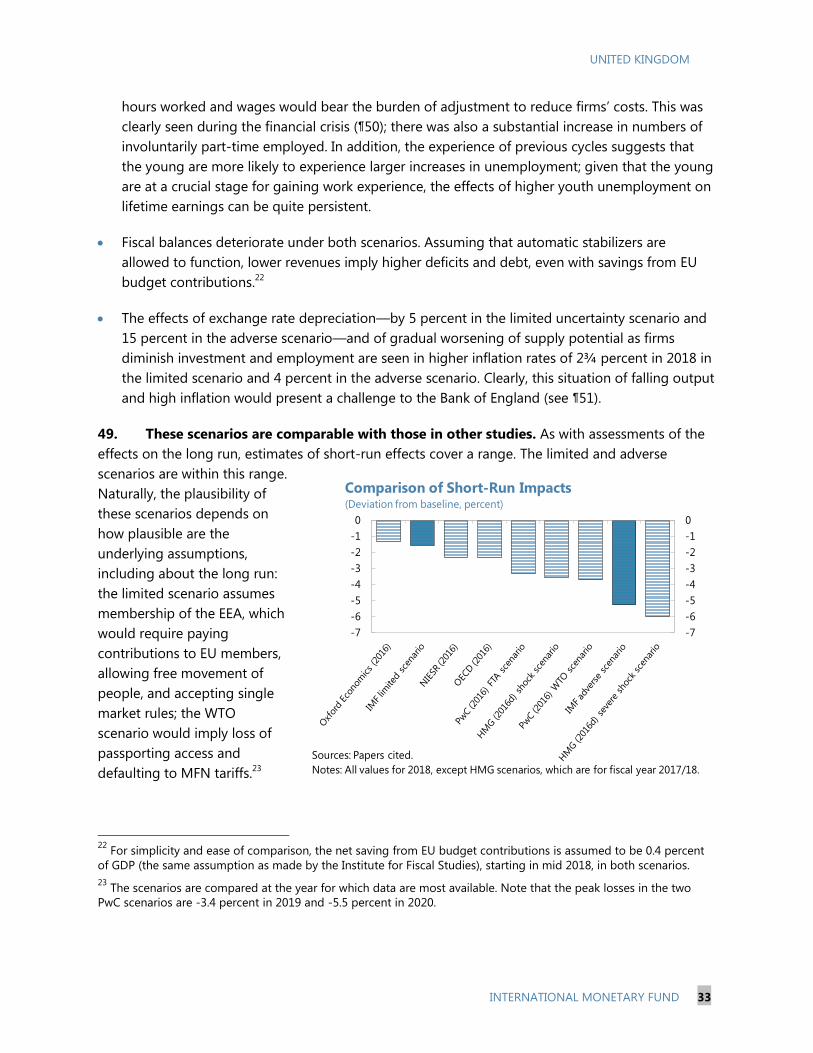
UNITED KINGDOM
INTERNATIONAL MONETARY FUND 33
hours worked and wages would bear the burden of adjustment to reduce firms’ costs. This was
clearly seen during the financial crisis (¶50); there was also a substantial increase in numbers of
involuntarily part-time employed. In addition, the experience of previous cycles suggests that
the young are more likely to experience larger increases in unemployment; given that the young
are at a crucial stage for gaining work experience, the effects of higher youth unemployment on
lifetime earnings can be quite persistent.
Fiscal balances deteriorate under both scenarios. Assuming that automatic stabilizers are
allowed to function, lower revenues imply higher deficits and debt, even with savings from EU
budget contributions.22
The effects of exchange rate depreciation—by 5 percent in the limited uncertainty scenario and
15 percent in the adverse scenario—and of gradual worsening of supply potential as firms
diminish investment and employment are seen in higher inflation rates of 2¾ percent in 2018 in
the limited scenario and 4 percent in the adverse scenario. Clearly, this situation of falling output
and high inflation would present a challenge to the Bank of England (see ¶51).
49. These scenarios are comparable with those in other studies. As with assessments of the
effects on the long run, estimates of short-run effects cover a range. The limited and adverse
scenarios are within this range.
Naturally, the plausibility of
these scenarios depends on
how plausible are the
underlying assumptions,
including about the long run:
the limited scenario assumes
membership of the EEA, which
would require paying
contributions to EU members,
allowing free movement of
people, and accepting single
market rules; the WTO
scenario would imply loss of
passporting access and
defaulting to MFN tariffs.23
22
For simplicity and ease of comparison, the net saving from EU budget contributions is assumed to be 0.4 percent
of GDP (the same assumption as made by the Institute for Fiscal Studies), starting in mid 2018, in both scenarios.
23 The scenarios are compared at the year for which data are most available. Note that the peak losses in the two
PwC scenarios are -3.4 percent in 2019 and -5.5 percent in 2020.
-7
-6
-5
-4
-3
-2
-1
0
-7
-6
-5
-4
-3
-2
-1
0
Comparison of Short-Run Impacts (Deviation from baseline, percent)
Sources: Papers cited.
Notes: All values for 2018, except HMG scenarios, which are for fiscal year 2017/18.
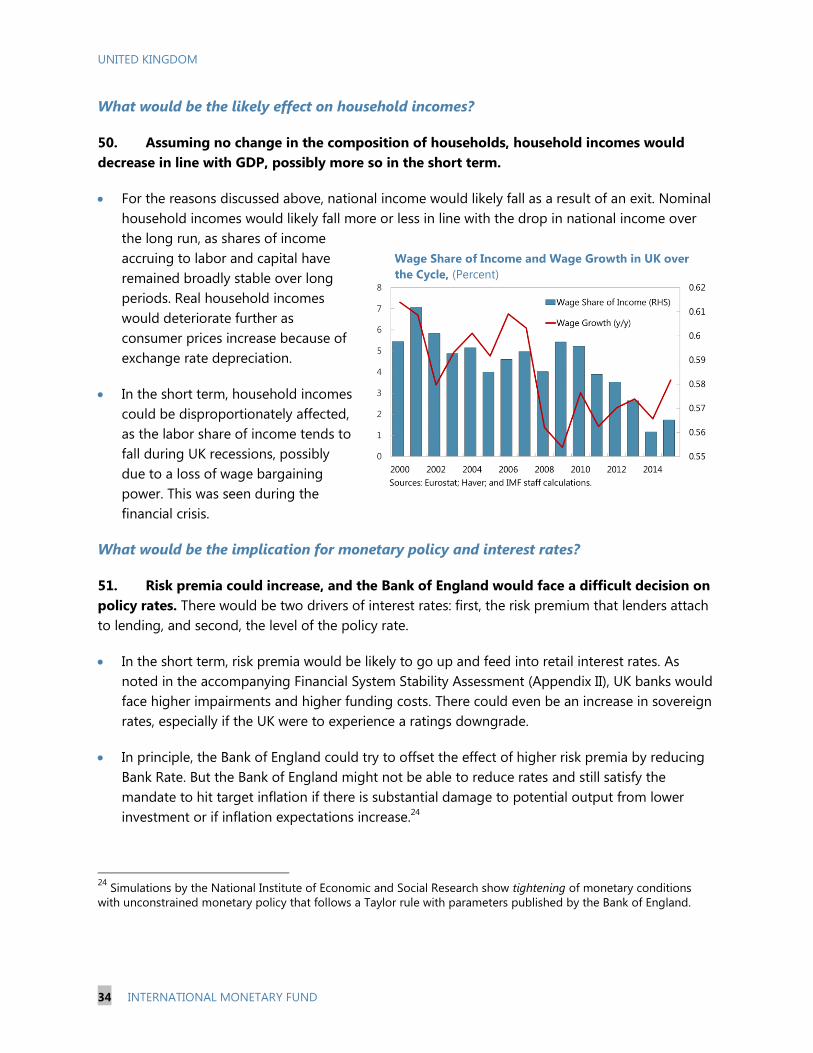
UNITED KINGDOM
34 INTERNATIONAL MONETARY FUND
What would be the likely effect on household incomes?
50. Assuming no change in the composition of households, household incomes would
decrease in line with GDP, possibly more so in the short term.
For the reasons discussed above, national income would likely fall as a result of an exit. Nominal
household incomes would likely fall more or less in line with the drop in national income over
the long run, as shares of income
accruing to labor and capital have
remained broadly stable over long
periods. Real household incomes
would deteriorate further as
consumer prices increase because of
exchange rate depreciation.
In the short term, household incomes
could be disproportionately affected,
as the labor share of income tends to
fall during UK recessions, possibly
due to a loss of wage bargaining
power. This was seen during the
financial crisis.
What would be the implication for monetary policy and interest rates?
51. Risk premia could increase, and the Bank of England would face a difficult decision on
policy rates. There would be two drivers of interest rates: first, the risk premium that lenders attach
to lending, and second, the level of the policy rate.
In the short term, risk premia would be likely to go up and feed into retail interest rates. As
noted in the accompanying Financial System Stability Assessment (Appendix II), UK banks would
face higher impairments and higher funding costs. There could even be an increase in sovereign
rates, especially if the UK were to experience a ratings downgrade.
In principle, the Bank of England could try to offset the effect of higher risk premia by reducing
Bank Rate. But the Bank of England might not be able to reduce rates and still satisfy the
mandate to hit target inflation if there is substantial damage to potential output from lower
investment or if inflation expectations increase.24
24
Simulations by the National Institute of Economic and Social Research show tightening of monetary conditions
with unconstrained monetary policy that follows a Taylor rule with parameters published by the Bank of England.
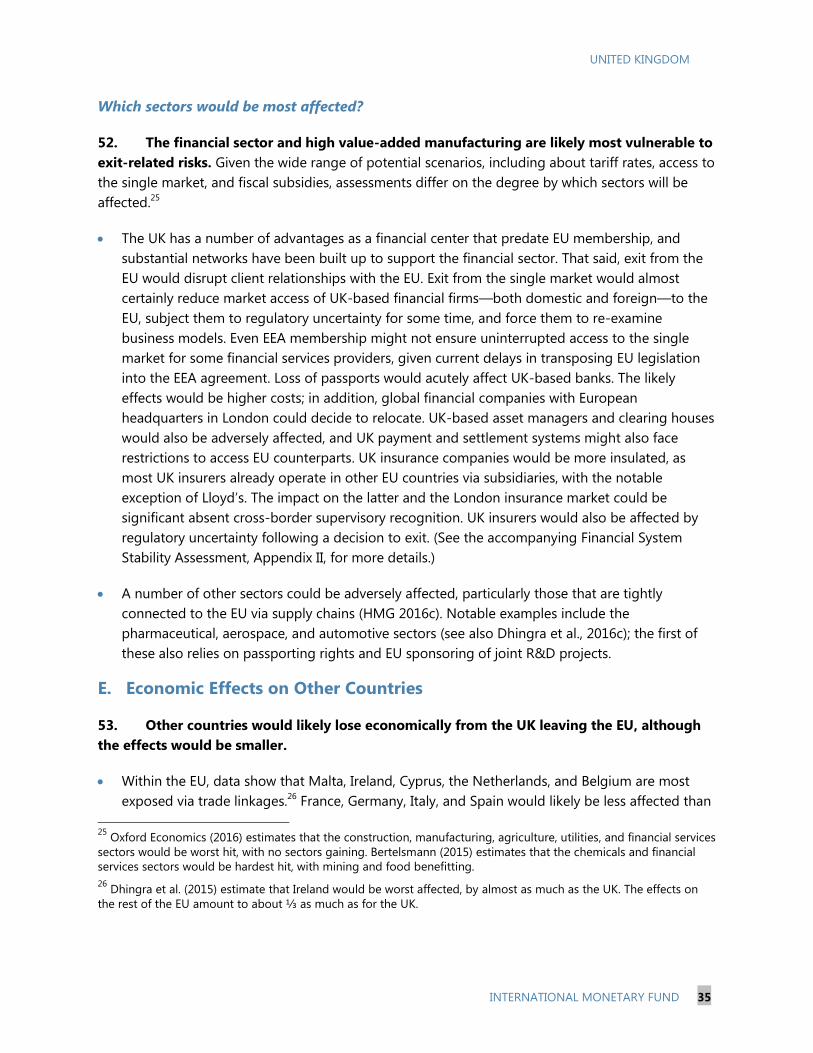
UNITED KINGDOM
INTERNATIONAL MONETARY FUND 35
Which sectors would be most affected?
52. The financial sector and high value-added manufacturing are likely most vulnerable to
exit-related risks. Given the wide range of potential scenarios, including about tariff rates, access to
the single market, and fiscal subsidies, assessments differ on the degree by which sectors will be
affected.25
The UK has a number of advantages as a financial center that predate EU membership, and
substantial networks have been built up to support the financial sector. That said, exit from the
EU would disrupt client relationships with the EU. Exit from the single market would almost
certainly reduce market access of UK-based financial firms—both domestic and foreign—to the
EU, subject them to regulatory uncertainty for some time, and force them to re-examine
business models. Even EEA membership might not ensure uninterrupted access to the single
market for some financial services providers, given current delays in transposing EU legislation
into the EEA agreement. Loss of passports would acutely affect UK-based banks. The likely
effects would be higher costs; in addition, global financial companies with European
headquarters in London could decide to relocate. UK-based asset managers and clearing houses
would also be adversely affected, and UK payment and settlement systems might also face
restrictions to access EU counterparts. UK insurance companies would be more insulated, as
most UK insurers already operate in other EU countries via subsidiaries, with the notable
exception of Lloyd’s. The impact on the latter and the London insurance market could be
significant absent cross-border supervisory recognition. UK insurers would also be affected by
regulatory uncertainty following a decision to exit. (See the accompanying Financial System
Stability Assessment, Appendix II, for more details.)
A number of other sectors could be adversely affected, particularly those that are tightly
connected to the EU via supply chains (HMG 2016c). Notable examples include the
pharmaceutical, aerospace, and automotive sectors (see also Dhingra et al., 2016c); the first of
these also relies on passporting rights and EU sponsoring of joint R&D projects.
E. Economic Effects on Other Countries
53. Other countries would likely lose economically from the UK leaving the EU, although
the effects would be smaller.
Within the EU, data show that Malta, Ireland, Cyprus, the Netherlands, and Belgium are most
exposed via trade linkages.26
France, Germany, Italy, and Spain would likely be less affected than
25
Oxford Economics (2016) estimates that the construction, manufacturing, agriculture, utilities, and financial services
sectors would be worst hit, with no sectors gaining. Bertelsmann (2015) estimates that the chemicals and financial
services sectors would be hardest hit, with mining and food benefitting.
26 Dhingra et al. (2015) estimate that Ireland would be worst affected, by almost as much as the UK. The effects on
the rest of the EU amount to about ⅓ as much as for the UK.
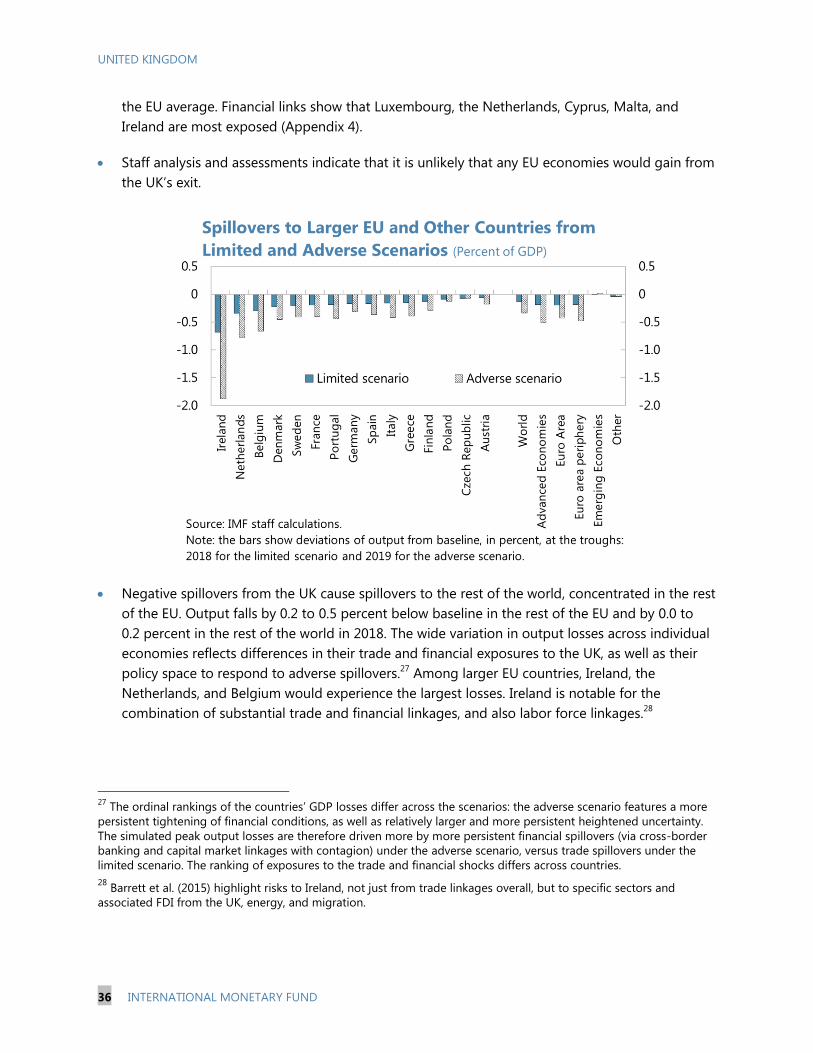
UNITED KINGDOM
36 INTERNATIONAL MONETARY FUND
the EU average. Financial links show that Luxembourg, the Netherlands, Cyprus, Malta, and
Ireland are most exposed (Appendix 4).
Staff analysis and assessments indicate that it is unlikely that any EU economies would gain from
the UK’s exit.
Negative spillovers from the UK cause spillovers to the rest of the world, concentrated in the rest
of the EU. Output falls by 0.2 to 0.5 percent below baseline in the rest of the EU and by 0.0 to
0.2 percent in the rest of the world in 2018. The wide variation in output losses across individual
economies reflects differences in their trade and financial exposures to the UK, as well as their
policy space to respond to adverse spillovers.27
Among larger EU countries, Ireland, the
Netherlands, and Belgium would experience the largest losses. Ireland is notable for the
combination of substantial trade and financial linkages, and also labor force linkages.28
27
The ordinal rankings of the countries’ GDP losses differ across the scenarios: the adverse scenario features a more
persistent tightening of financial conditions, as well as relatively larger and more persistent heightened uncertainty.
The simulated peak output losses are therefore driven more by more persistent financial spillovers (via cross-border
banking and capital market linkages with contagion) under the adverse scenario, versus trade spillovers under the
limited scenario. The ranking of exposures to the trade and financial shocks differs across countries.
28 Barrett et al. (2015) highlight risks to Ireland, not just from trade linkages overall, but to specific sectors and
associated FDI from the UK, energy, and migration.
UNITED KINGDOM
INTERNATIONAL MONETARY FUND 37
Oxford Economics (2016) finds small losses to the rest of the EU, although losses to Ireland are
nearly half that of the UK. The OECD (2016) finds that losses to the EU overall are 1 percent of
GDP by 2020, about one-third of the loss experienced by the UK in their scenario.
A potential mitigating factor is that some countries might benefit from the relocation of
business (such as financial services) from the UK. This is not modeled and represents an upside
risk to EU economies.
A downside risk is that the UK’s exit from the UK causes a repricing of risk more generally,
including in euro area periphery economies. This is not modeled.
Around three-quarters of EU spending goes toward cohesion policy (directed to economic,
social, and regional development) and to agriculture and rural development. Net recipients of
EU funds would be exposed to the UK’s withdrawal—Hungary, Estonia, Bulgaria, Denmark,
Lithuania, Latvia, Poland, and Romania benefit by over 3 percent of domestic GDP. Based on the
UK’s contribution (net of its rebate) to the EU budget, the UK’s exit would mechanically imply a
10 percent reduction funds available for EU payments, absent any other changes.
Trade and financial exposures of non-EU G-20 countries are small (Appendix IV). However, there
could be material effects for a number of other countries. Hong Kong SAR, Iceland, Norway and
Singapore have notably high goods and services exports to the UK (as a percentage of own
GDP), and goods exports of Equatorial Guinea, Seychelles, Cambodia, Belize, Norway, Costa Rica,
Iceland, Guyana, Tuvalu, Mauritius, Algeria, Solomon Islands, Fiji, South Africa, and Vietnam were
higher in 2014 than the EU average.
F. Conclusions
54. A vote to leave the EU would result in a protracted period of heightened uncertainty,
leading to a hit to output.
Following a decision to exit, the UK would need to negotiate the terms of its withdrawal and a
new relationship with the EU (unless it abandoned single market access and relied on WTO rules,
which would significantly raise trade barriers). The UK would also need to simultaneously
renegotiate the arrangements it has with a large number of other countries, or else see them
revert to WTO rules.
These processes and their eventual outcomes could well remain unresolved for years, weighing
heavily on investment and economic sentiment during the interim and depressing output. In
addition, volatility in key financial markets would likely rise as markets adjust to new
circumstances. Estimates of the effects on output and incomes are naturally highly uncertain.
Nonetheless, even a comparatively limited amount of uncertainty, associated with a relatively
smooth transition to an EEA-type trading arrangement, could have a material impact on short-
term growth, while an adverse scenario could push the economy into a recession in 2017.
UNITED KINGDOM
38 INTERNATIONAL MONETARY FUND
55. The long-run effects on UK output and incomes would also likely be negative and
substantial.
Most assessments, including those of staff, point to sizable long-run losses in incomes, as
increased barriers would reduce trade, investment, and productivity. The wide range of
estimated losses largely reflects differing assumptions about the UK’s future economic
relationships with the EU and the rest of the world.
Any output losses in excess of 1 percent of GDP would result in net fiscal losses for the UK, as
reduced revenue due to lower output would more than offset any gains from eliminating the
UK’s net EU budget contribution of ⅓ percent of GDP.
The prospect to substantially improve productivity by eliminating regulation seems remote, as
many regulations would likely be replaced by equivalents and because those regulations that are
most associated with damage to business relate to domestic issues such as planning.
56. Spillovers to other countries would be felt mostly by EU countries. Those most exposed
include Ireland, Cyprus, Malta, the Netherlands, and Belgium. But net recipients of EU spending—
notably recent accession states—could also be affected, unless EU budget contributions were
increased to compensate for the UK’s withdrawal.
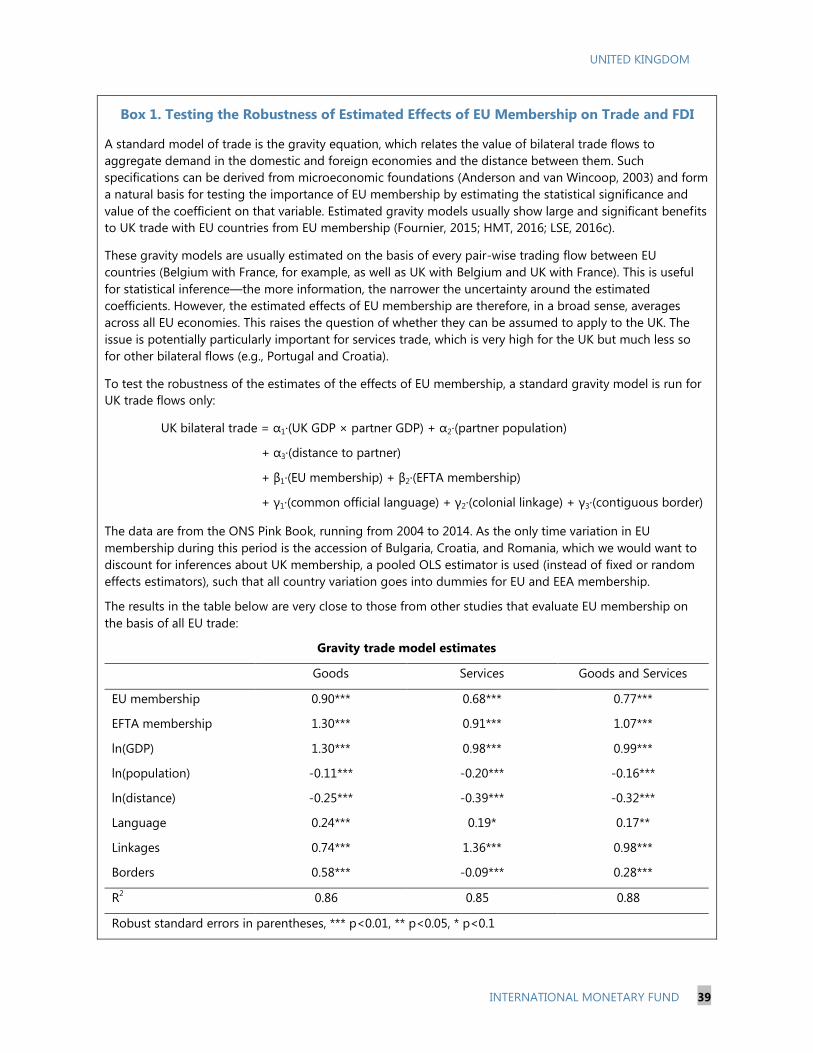
UNITED KINGDOM
INTERNATIONAL MONETARY FUND 39
Box 1. Testing the Robustness of Estimated Effects of EU Membership on Trade and FDI
A standard model of trade is the gravity equation, which relates the value of bilateral trade flows to
aggregate demand in the domestic and foreign economies and the distance between them. Such
specifications can be derived from microeconomic foundations (Anderson and van Wincoop, 2003) and form
a natural basis for testing the importance of EU membership by estimating the statistical significance and
value of the coefficient on that variable. Estimated gravity models usually show large and significant benefits
to UK trade with EU countries from EU membership (Fournier, 2015; HMT, 2016; LSE, 2016c).
These gravity models are usually estimated on the basis of every pair-wise trading flow between EU
countries (Belgium with France, for example, as well as UK with Belgium and UK with France). This is useful
for statistical inference—the more information, the narrower the uncertainty around the estimated
coefficients. However, the estimated effects of EU membership are therefore, in a broad sense, averages
across all EU economies. This raises the question of whether they can be assumed to apply to the UK. The
issue is potentially particularly important for services trade, which is very high for the UK but much less so
for other bilateral flows (e.g., Portugal and Croatia).
To test the robustness of the estimates of the effects of EU membership, a standard gravity model is run for
UK trade flows only:
UK bilateral trade = α1·(UK GDP × partner GDP) + α2·(partner population)
+ α3·(distance to partner)
+ β1·(EU membership) + β2·(EFTA membership)
+ γ1·(common official language) + γ2·(colonial linkage) + γ3·(contiguous border)
The data are from the ONS Pink Book, running from 2004 to 2014. As the only time variation in EU
membership during this period is the accession of Bulgaria, Croatia, and Romania, which we would want to
discount for inferences about UK membership, a pooled OLS estimator is used (instead of fixed or random
effects estimators), such that all country variation goes into dummies for EU and EEA membership.
The results in the table below are very close to those from other studies that evaluate EU membership on
the basis of all EU trade:
Gravity trade model estimates
Goods Services Goods and Services
EU membership 0.90*** 0.68*** 0.77***
EFTA membership 1.30*** 0.91*** 1.07***
ln(GDP) 1.30*** 0.98*** 0.99***
ln(population) -0.11*** -0.20*** -0.16***
ln(distance) -0.25*** -0.39*** -0.32***
Language 0.24*** 0.19* 0.17**
Linkages 0.74*** 1.36*** 0.98***
Borders 0.58*** -0.09*** 0.28***
R2 0.86 0.85 0.88
Robust standard errors in parentheses, *** p<0.01, ** p<0.05, * p<0.1
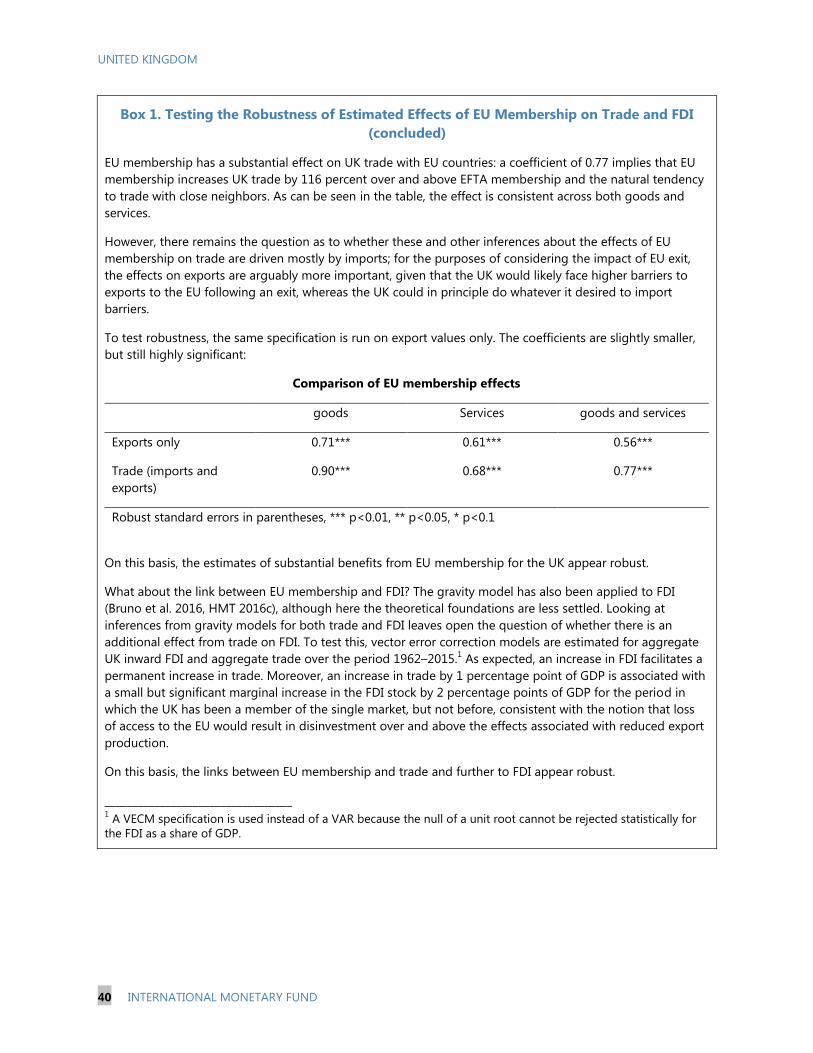
UNITED KINGDOM
40 INTERNATIONAL MONETARY FUND
Box 1. Testing the Robustness of Estimated Effects of EU Membership on Trade and FDI
(concluded)
EU membership has a substantial effect on UK trade with EU countries: a coefficient of 0.77 implies that EU
membership increases UK trade by 116 percent over and above EFTA membership and the natural tendency
to trade with close neighbors. As can be seen in the table, the effect is consistent across both goods and
services.
However, there remains the question as to whether these and other inferences about the effects of EU
membership on trade are driven mostly by imports; for the purposes of considering the impact of EU exit,
the effects on exports are arguably more important, given that the UK would likely face higher barriers to
exports to the EU following an exit, whereas the UK could in principle do whatever it desired to import
barriers.
To test robustness, the same specification is run on export values only. The coefficients are slightly smaller,
but still highly significant:
Comparison of EU membership effects
goods Services goods and services
Exports only 0.71*** 0.61*** 0.56***
Trade (imports and
exports)
0.90*** 0.68*** 0.77***
Robust standard errors in parentheses, *** p<0.01, ** p<0.05, * p<0.1
On this basis, the estimates of substantial benefits from EU membership for the UK appear robust.
What about the link between EU membership and FDI? The gravity model has also been applied to FDI
(Bruno et al. 2016, HMT 2016c), although here the theoretical foundations are less settled. Looking at
inferences from gravity models for both trade and FDI leaves open the question of whether there is an
additional effect from trade on FDI. To test this, vector error correction models are estimated for aggregate
UK inward FDI and aggregate trade over the period 1962–2015.1 As expected, an increase in FDI facilitates a
permanent increase in trade. Moreover, an increase in trade by 1 percentage point of GDP is associated with
a small but significant marginal increase in the FDI stock by 2 percentage points of GDP for the period in
which the UK has been a member of the single market, but not before, consistent with the notion that loss
of access to the EU would result in disinvestment over and above the effects associated with reduced export
production.
On this basis, the links between EU membership and trade and further to FDI appear robust.
__________________________________ 1 A VECM specification is used instead of a VAR because the null of a unit root cannot be rejected statistically for
the FDI as a share of GDP.
UNITED KINGDOM
INTERNATIONAL MONETARY FUND 41
Box 2. How Does Political Uncertainty Affect Economies?
Economists have long suspected that increased uncertainty causes people to become more cautious and have proposed
a number of channels by which heightened uncertainty could affect the economy.
Firms will postpone investment and hiring and wait before entering new markets—as uncertainty increases, the
“option value” of not committing increases. Similarly, firms can minimize the risk of holding unsold goods by
reducing inventories.
The same argument applies to households’ decisions about purchases of durable goods, especially large financial
commitments, such as cars and houses. Even for nondurable goods, households might increase precautionary
savings.
Asset prices would be expected to fall, not just because falling demand would be associated with reduced yields
(such as from dividends, in the case of equities), but also because risk premia would be expected to rise in response
to higher uncertainty.1
Estimating the effects of changes in uncertainty is difficult. Nonetheless, a range of studies of the effects of changes in
uncertainty support the notion that an increase in uncertainty is likely to result in reduced private demand and falling
asset prices.
Output: Denis and Kannan (2013) found that uncertainty played a significant role in depressing output in the UK in
the aftermath of the global financial crisis, accounting for about a quarter of the decline.
Investment: Bloom et al. (2013) find that increases in uncertainty about economic policy foreshadow declines in
investment and employment. Using the same approach, Gulen and Ion (2016) find that a doubling of policy
uncertainty is associated with an average decrease in quarterly investment rates of approximately 9 percent relative
to the average investment rate in the sample. The authors estimate that one third of the downturn of US capital
investment during the financial crisis can be attributed to policy uncertainty, a result corroborated independently by
Stein and Stone (2012). Of particular relevance to thinking about the effects of the EU referendum is the literature
on the effects of electoral uncertainty. Julio and Yook (2012) find that investment declines during election years, and
particularly so when the election result is uncertain and the impact of the election in terms of policies could be
large—average investment rates drop by 12 percent in such cases. Similarly, Handley and Limao (2012) find that
uncertainty around Portugal’s accession to the European Community in 1986 caused firms to put off entering
markets.
Consumption: Giavazzi and McMahon (2012) estimate that the 1998 German election induced households to
increase savings rates by 3 percentage points of household disposable income. Leduc and Liu (2015) find that
uncertainty tends to increase unemployment, fears of which could further depress consumption—Benito (2006)
finds that increased job insecurity in the UK has been associated with lower consumption, especially of young and
less skilled workers.
Asset prices: Pastor and Veronesi (2013) find that political uncertainty increases the equity risk premium, the more so
when the economy is weak. Kelly et al. (2015) look at options prices around elections and political summits in 20
countries and find that the cost of financial insurance against uncertainty soars as political uncertainty increases.
On this basis, the effects of uncertainty seem to be universally negative, and potentially quite strong and persistent, even
if ultimately temporary.
__________________________________ 1 An increase in uncertainty does not per se make assets risky; rather, investors will demand higher compensation—lower prices—to
hold those assets that could deliver low returns at the time when the ability to increase consumption is most valuable (i.e., during a
downturn).
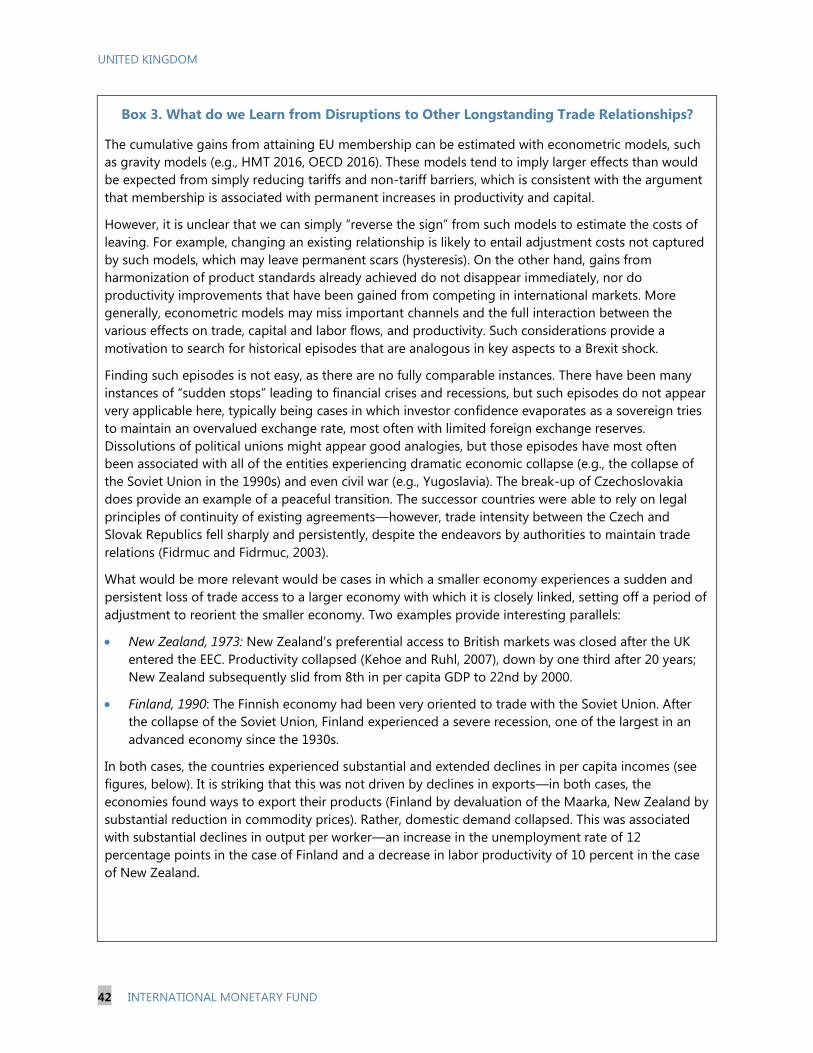
UNITED KINGDOM
42 INTERNATIONAL MONETARY FUND
Box 3. What do we Learn from Disruptions to Other Longstanding Trade Relationships?
The cumulative gains from attaining EU membership can be estimated with econometric models, such
as gravity models (e.g., HMT 2016, OECD 2016). These models tend to imply larger effects than would
be expected from simply reducing tariffs and non-tariff barriers, which is consistent with the argument
that membership is associated with permanent increases in productivity and capital.
However, it is unclear that we can simply “reverse the sign” from such models to estimate the costs of
leaving. For example, changing an existing relationship is likely to entail adjustment costs not captured
by such models, which may leave permanent scars (hysteresis). On the other hand, gains from
harmonization of product standards already achieved do not disappear immediately, nor do
productivity improvements that have been gained from competing in international markets. More
generally, econometric models may miss important channels and the full interaction between the
various effects on trade, capital and labor flows, and productivity. Such considerations provide a
motivation to search for historical episodes that are analogous in key aspects to a Brexit shock.
Finding such episodes is not easy, as there are no fully comparable instances. There have been many
instances of “sudden stops” leading to financial crises and recessions, but such episodes do not appear
very applicable here, typically being cases in which investor confidence evaporates as a sovereign tries
to maintain an overvalued exchange rate, most often with limited foreign exchange reserves.
Dissolutions of political unions might appear good analogies, but those episodes have most often
been associated with all of the entities experiencing dramatic economic collapse (e.g., the collapse of
the Soviet Union in the 1990s) and even civil war (e.g., Yugoslavia). The break-up of Czechoslovakia
does provide an example of a peaceful transition. The successor countries were able to rely on legal
principles of continuity of existing agreements—however, trade intensity between the Czech and
Slovak Republics fell sharply and persistently, despite the endeavors by authorities to maintain trade
relations (Fidrmuc and Fidrmuc, 2003).
What would be more relevant would be cases in which a smaller economy experiences a sudden and
persistent loss of trade access to a larger economy with which it is closely linked, setting off a period of
adjustment to reorient the smaller economy. Two examples provide interesting parallels:
New Zealand, 1973: New Zealand’s preferential access to British markets was closed after the UK
entered the EEC. Productivity collapsed (Kehoe and Ruhl, 2007), down by one third after 20 years;
New Zealand subsequently slid from 8th in per capita GDP to 22nd by 2000.
Finland, 1990: The Finnish economy had been very oriented to trade with the Soviet Union. After
the collapse of the Soviet Union, Finland experienced a severe recession, one of the largest in an
advanced economy since the 1930s.
In both cases, the countries experienced substantial and extended declines in per capita incomes (see
figures, below). It is striking that this was not driven by declines in exports—in both cases, the
economies found ways to export their products (Finland by devaluation of the Maarka, New Zealand by
substantial reduction in commodity prices). Rather, domestic demand collapsed. This was associated
with substantial declines in output per worker—an increase in the unemployment rate of 12
percentage points in the case of Finland and a decrease in labor productivity of 10 percent in the case
of New Zealand.
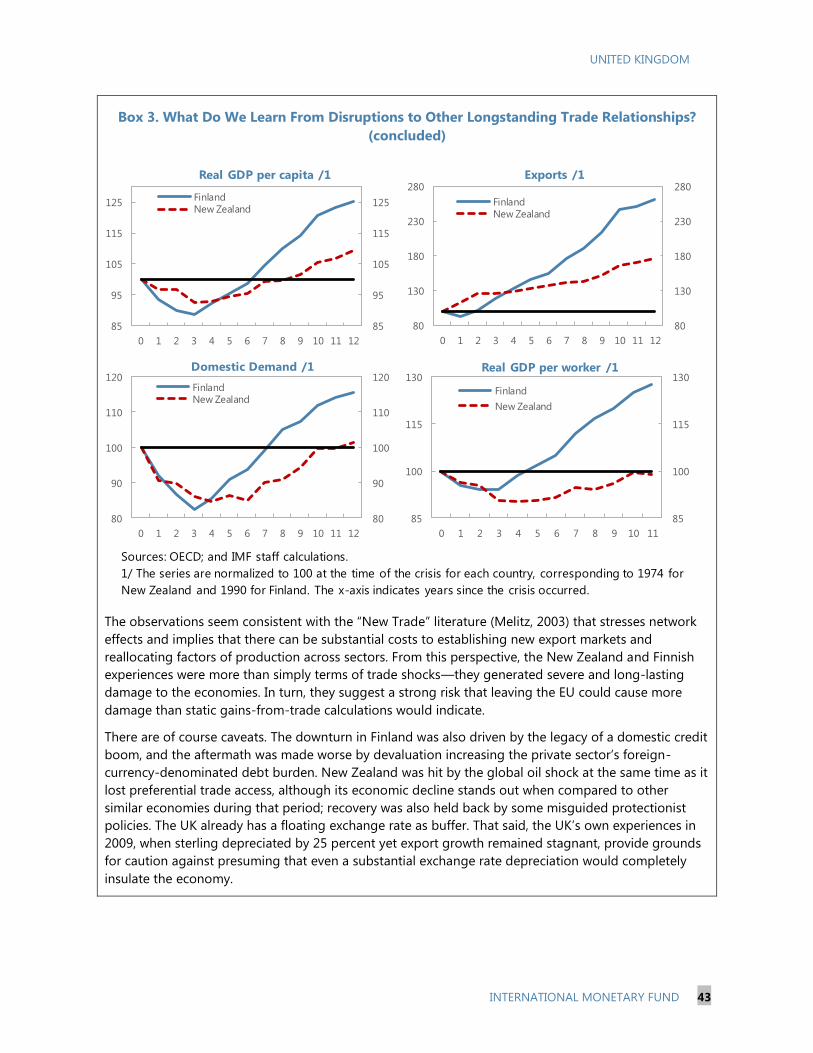
UNITED KINGDOM
INTERNATIONAL MONETARY FUND 43
Box 3. What Do We Learn From Disruptions to Other Longstanding Trade Relationships?
(concluded)
The observations seem consistent with the “New Trade” literature (Melitz, 2003) that stresses network
effects and implies that there can be substantial costs to establishing new export markets and
reallocating factors of production across sectors. From this perspective, the New Zealand and Finnish
experiences were more than simply terms of trade shocks—they generated severe and long-lasting
damage to the economies. In turn, they suggest a strong risk that leaving the EU could cause more
damage than static gains-from-trade calculations would indicate.
There are of course caveats. The downturn in Finland was also driven by the legacy of a domestic credit
boom, and the aftermath was made worse by devaluation increasing the private sector’s foreign-
currency-denominated debt burden. New Zealand was hit by the global oil shock at the same time as it
lost preferential trade access, although its economic decline stands out when compared to other
similar economies during that period; recovery was also held back by some misguided protectionist
policies. The UK already has a floating exchange rate as buffer. That said, the UK’s own experiences in
2009, when sterling depreciated by 25 percent yet export growth remained stagnant, provide grounds
for caution against presuming that even a substantial exchange rate depreciation would completely
insulate the economy.
Sources: OECD; and IMF staff calculations.
1/ The series are normalized to 100 at the time of the crisis for each country, corresponding to 1974 for
New Zealand and 1990 for Finland. The x-axis indicates years since the crisis occurred.
85
95
105
115
125
85
95
105
115
125
0 1 2 3 4 5 6 7 8 9 10 11 12
Real GDP per capita /1
FinlandNew Zealand
80
90
100
110
120
80
90
100
110
120
0 1 2 3 4 5 6 7 8 9 10 11 12
Domestic Demand /1
FinlandNew Zealand
80
130
180
230
280
80
130
180
230
280
0 1 2 3 4 5 6 7 8 9 10 11 12
Exports /1
FinlandNew Zealand
85
100
115
130
85
100
115
130
0 1 2 3 4 5 6 7 8 9 10 11
Real GDP per worker /1
Finland
New Zealand
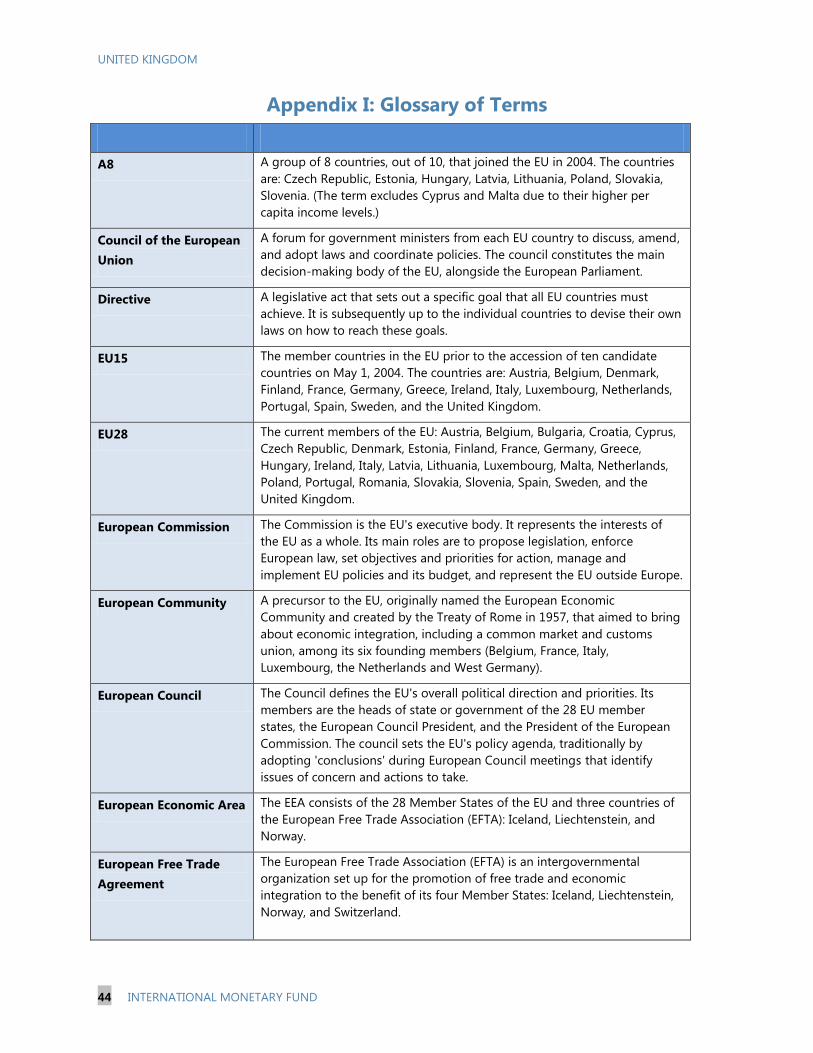
UNITED KINGDOM
44 INTERNATIONAL MONETARY FUND
Appendix I: Glossary of Terms
A8 A group of 8 countries, out of 10, that joined the EU in 2004. The countries
are: Czech Republic, Estonia, Hungary, Latvia, Lithuania, Poland, Slovakia,
Slovenia. (The term excludes Cyprus and Malta due to their higher per
capita income levels.)
Council of the European
Union
A forum for government ministers from each EU country to discuss, amend,
and adopt laws and coordinate policies. The council constitutes the main
decision-making body of the EU, alongside the European Parliament.
Directive A legislative act that sets out a specific goal that all EU countries must
achieve. It is subsequently up to the individual countries to devise their own
laws on how to reach these goals.
EU15 The member countries in the EU prior to the accession of ten candidate
countries on May 1, 2004. The countries are: Austria, Belgium, Denmark,
Finland, France, Germany, Greece, Ireland, Italy, Luxembourg, Netherlands,
Portugal, Spain, Sweden, and the United Kingdom.
EU28 The current members of the EU: Austria, Belgium, Bulgaria, Croatia, Cyprus,
Czech Republic, Denmark, Estonia, Finland, France, Germany, Greece,
Hungary, Ireland, Italy, Latvia, Lithuania, Luxembourg, Malta, Netherlands,
Poland, Portugal, Romania, Slovakia, Slovenia, Spain, Sweden, and the
United Kingdom.
European Commission The Commission is the EU's executive body. It represents the interests of
the EU as a whole. Its main roles are to propose legislation, enforce
European law, set objectives and priorities for action, manage and
implement EU policies and its budget, and represent the EU outside Europe.
European Community A precursor to the EU, originally named the European Economic
Community and created by the Treaty of Rome in 1957, that aimed to bring
about economic integration, including a common market and customs
union, among its six founding members (Belgium, France, Italy,
Luxembourg, the Netherlands and West Germany).
European Council The Council defines the EU's overall political direction and priorities. Its
members are the heads of state or government of the 28 EU member
states, the European Council President, and the President of the European
Commission. The council sets the EU's policy agenda, traditionally by
adopting 'conclusions' during European Council meetings that identify
issues of concern and actions to take.
European Economic Area The EEA consists of the 28 Member States of the EU and three countries of
the European Free Trade Association (EFTA): Iceland, Liechtenstein, and
Norway.
European Free Trade
Agreement
The European Free Trade Association (EFTA) is an intergovernmental
organization set up for the promotion of free trade and economic
integration to the benefit of its four Member States: Iceland, Liechtenstein,
Norway, and Switzerland.
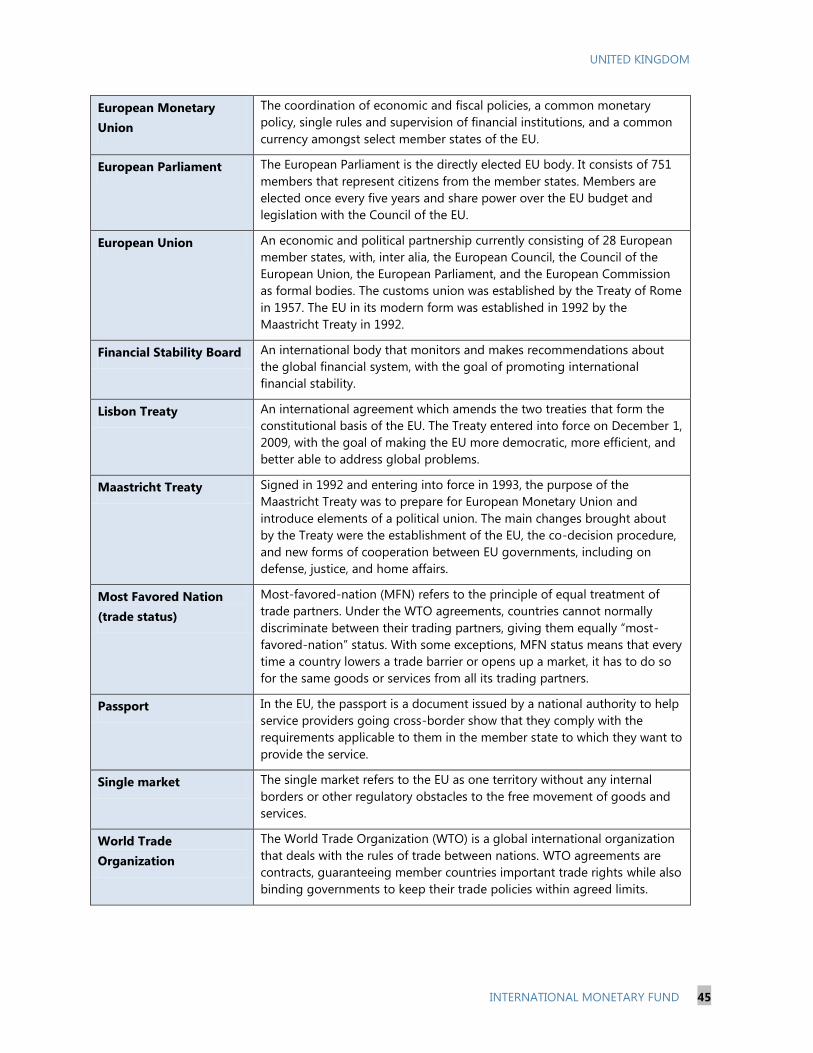
UNITED KINGDOM
INTERNATIONAL MONETARY FUND 45
European Monetary
Union
The coordination of economic and fiscal policies, a common monetary
policy, single rules and supervision of financial institutions, and a common
currency amongst select member states of the EU.
European Parliament The European Parliament is the directly elected EU body. It consists of 751
members that represent citizens from the member states. Members are
elected once every five years and share power over the EU budget and
legislation with the Council of the EU.
European Union An economic and political partnership currently consisting of 28 European
member states, with, inter alia, the European Council, the Council of the
European Union, the European Parliament, and the European Commission
as formal bodies. The customs union was established by the Treaty of Rome
in 1957. The EU in its modern form was established in 1992 by the
Maastricht Treaty in 1992.
Financial Stability Board An international body that monitors and makes recommendations about
the global financial system, with the goal of promoting international
financial stability.
Lisbon Treaty An international agreement which amends the two treaties that form the
constitutional basis of the EU. The Treaty entered into force on December 1,
2009, with the goal of making the EU more democratic, more efficient, and
better able to address global problems.
Maastricht Treaty Signed in 1992 and entering into force in 1993, the purpose of the
Maastricht Treaty was to prepare for European Monetary Union and
introduce elements of a political union. The main changes brought about
by the Treaty were the establishment of the EU, the co-decision procedure,
and new forms of cooperation between EU governments, including on
defense, justice, and home affairs.
Most Favored Nation
(trade status)
Most-favored-nation (MFN) refers to the principle of equal treatment of
trade partners. Under the WTO agreements, countries cannot normally
discriminate between their trading partners, giving them equally “most-
favored-nation” status. With some exceptions, MFN status means that every
time a country lowers a trade barrier or opens up a market, it has to do so
for the same goods or services from all its trading partners.
Passport In the EU, the passport is a document issued by a national authority to help
service providers going cross-border show that they comply with the
requirements applicable to them in the member state to which they want to
provide the service.
Single market The single market refers to the EU as one territory without any internal
borders or other regulatory obstacles to the free movement of goods and
services.
World Trade
Organization
The World Trade Organization (WTO) is a global international organization
that deals with the rules of trade between nations. WTO agreements are
contracts, guaranteeing member countries important trade rights while also
binding governments to keep their trade policies within agreed limits.
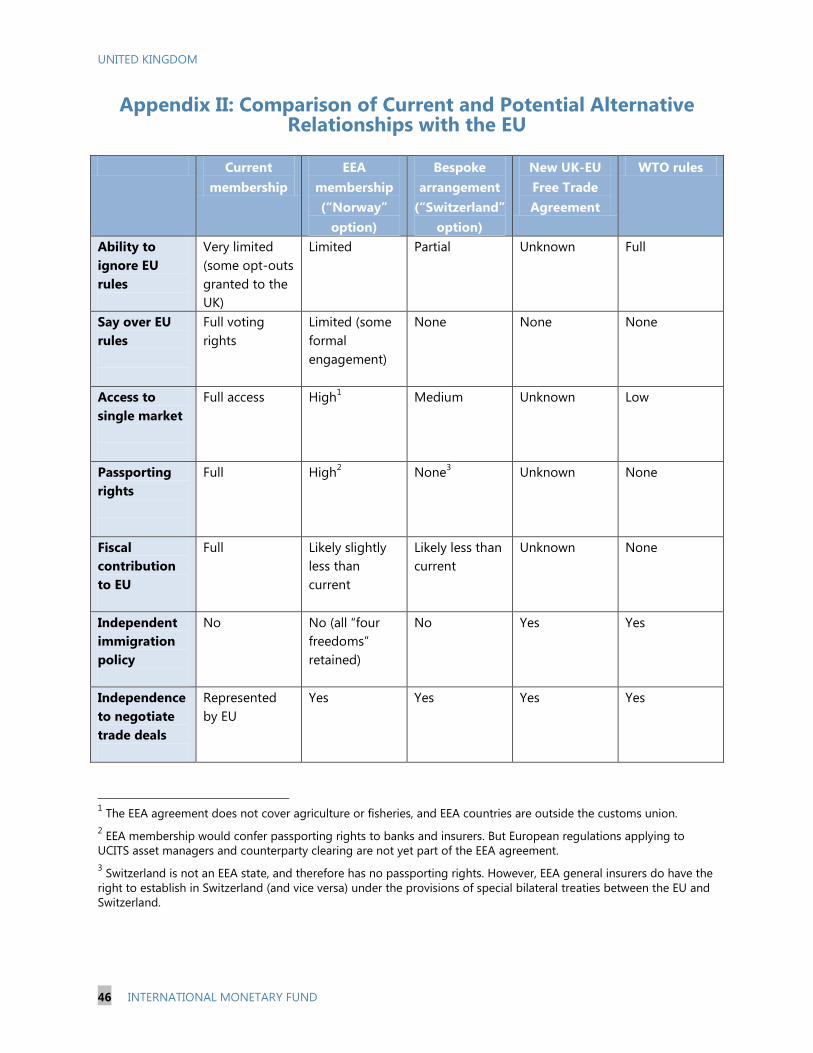
UNITED KINGDOM
46 INTERNATIONAL MONETARY FUND
Appendix II: Comparison of Current and Potential Alternative Relationships with the EU
Current
membership
EEA
membership
(“Norway”
option)
Bespoke
arrangement
(“Switzerland”
option)
New UK-EU
Free Trade
Agreement
WTO rules
Ability to
ignore EU
rules
Very limited
(some opt-outs
granted to the
UK)
Limited Partial Unknown Full
Say over EU
rules
Full voting
rights
Limited (some
formal
engagement)
None None None
Access to
single market
Full access High1 Medium Unknown Low
Passporting
rights
Full High2 None
3 Unknown None
Fiscal
contribution
to EU
Full Likely slightly
less than
current
Likely less than
current
Unknown None
Independent
immigration
policy
No No (all “four
freedoms”
retained)
No Yes Yes
Independence
to negotiate
trade deals
Represented
by EU
Yes Yes Yes Yes
1 The EEA agreement does not cover agriculture or fisheries, and EEA countries are outside the customs union.
2 EEA membership would confer passporting rights to banks and insurers. But European regulations applying to
UCITS asset managers and counterparty clearing are not yet part of the EEA agreement.
3 Switzerland is not an EEA state, and therefore has no passporting rights. However, EEA general insurers do have the
right to establish in Switzerland (and vice versa) under the provisions of special bilateral treaties between the EU and
Switzerland.
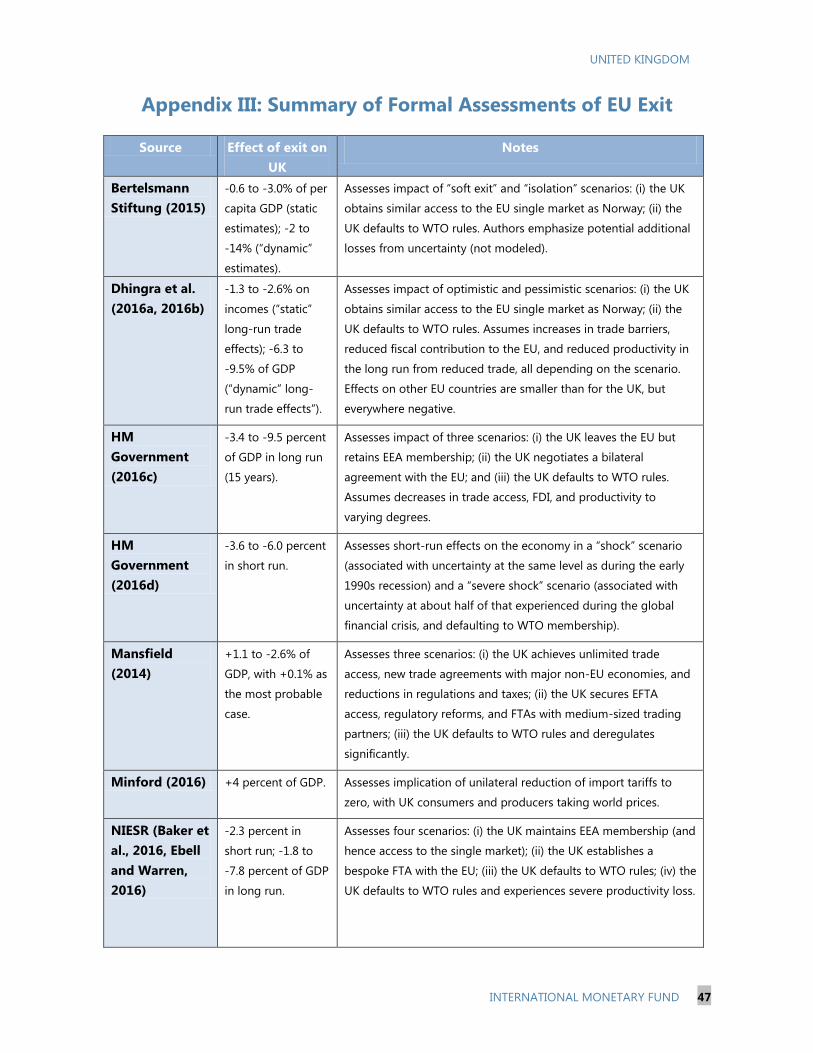
UNITED KINGDOM
INTERNATIONAL MONETARY FUND 47
Appendix III: Summary of Formal Assessments of EU Exit
Source Effect of exit on
UK
Notes
Bertelsmann
Stiftung (2015)
-0.6 to -3.0% of per
capita GDP (static
estimates); -2 to
-14% (“dynamic”
estimates).
Assesses impact of “soft exit” and “isolation” scenarios: (i) the UK
obtains similar access to the EU single market as Norway; (ii) the
UK defaults to WTO rules. Authors emphasize potential additional
losses from uncertainty (not modeled).
Dhingra et al.
(2016a, 2016b)
-1.3 to -2.6% on
incomes (“static”
long-run trade
effects); -6.3 to
-9.5% of GDP
(“dynamic” long-
run trade effects”).
Assesses impact of optimistic and pessimistic scenarios: (i) the UK
obtains similar access to the EU single market as Norway; (ii) the
UK defaults to WTO rules. Assumes increases in trade barriers,
reduced fiscal contribution to the EU, and reduced productivity in
the long run from reduced trade, all depending on the scenario.
Effects on other EU countries are smaller than for the UK, but
everywhere negative.
HM
Government
(2016c)
-3.4 to -9.5 percent
of GDP in long run
(15 years).
Assesses impact of three scenarios: (i) the UK leaves the EU but
retains EEA membership; (ii) the UK negotiates a bilateral
agreement with the EU; and (iii) the UK defaults to WTO rules.
Assumes decreases in trade access, FDI, and productivity to
varying degrees.
HM
Government
(2016d)
-3.6 to -6.0 percent
in short run.
Assesses short-run effects on the economy in a “shock” scenario
(associated with uncertainty at the same level as during the early
1990s recession) and a “severe shock” scenario (associated with
uncertainty at about half of that experienced during the global
financial crisis, and defaulting to WTO membership).
Mansfield
(2014)
+1.1 to -2.6% of
GDP, with +0.1% as
the most probable
case.
Assesses three scenarios: (i) the UK achieves unlimited trade
access, new trade agreements with major non-EU economies, and
reductions in regulations and taxes; (ii) the UK secures EFTA
access, regulatory reforms, and FTAs with medium-sized trading
partners; (iii) the UK defaults to WTO rules and deregulates
significantly.
Minford (2016) +4 percent of GDP. Assesses implication of unilateral reduction of import tariffs to
zero, with UK consumers and producers taking world prices.
NIESR (Baker et
al., 2016, Ebell
and Warren,
2016)
-2.3 percent in
short run; -1.8 to
-7.8 percent of GDP
in long run.
Assesses four scenarios: (i) the UK maintains EEA membership (and
hence access to the single market); (ii) the UK establishes a
bespoke FTA with the EU; (iii) the UK defaults to WTO rules; (iv) the
UK defaults to WTO rules and experiences severe productivity loss.
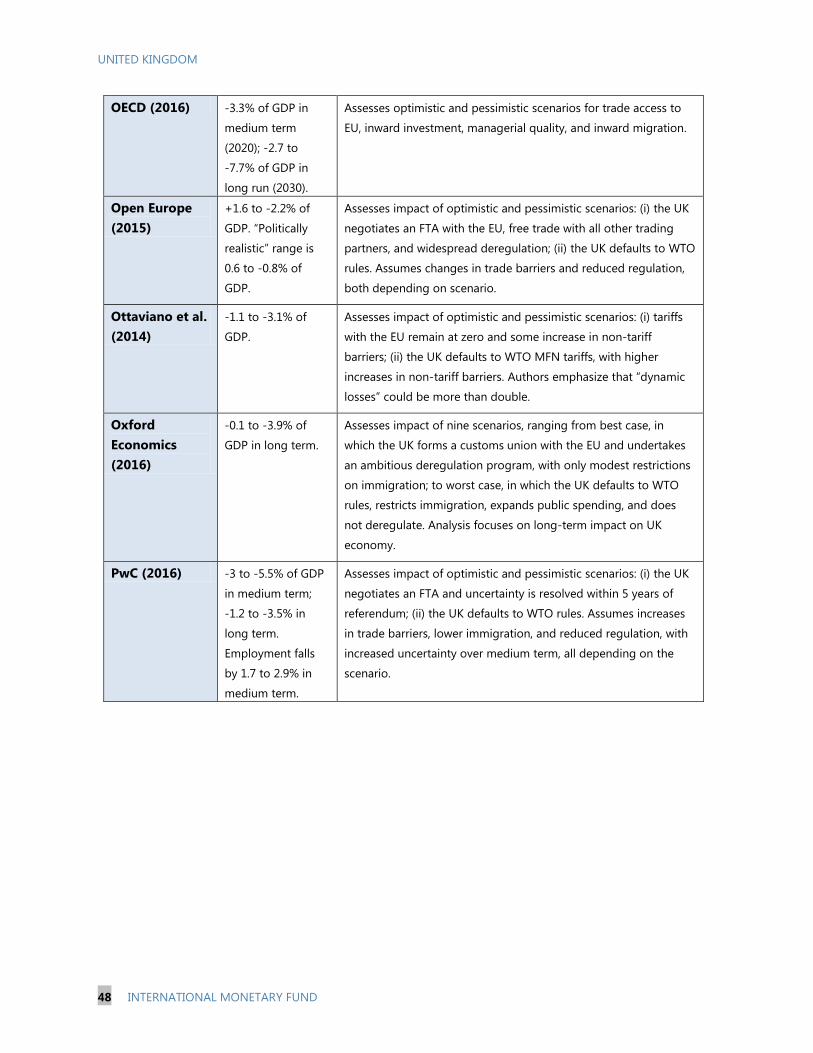
UNITED KINGDOM
48 INTERNATIONAL MONETARY FUND
OECD (2016) -3.3% of GDP in
medium term
(2020); -2.7 to
-7.7% of GDP in
long run (2030).
Assesses optimistic and pessimistic scenarios for trade access to
EU, inward investment, managerial quality, and inward migration.
Open Europe
(2015)
+1.6 to -2.2% of
GDP. “Politically
realistic” range is
0.6 to -0.8% of
GDP.
Assesses impact of optimistic and pessimistic scenarios: (i) the UK
negotiates an FTA with the EU, free trade with all other trading
partners, and widespread deregulation; (ii) the UK defaults to WTO
rules. Assumes changes in trade barriers and reduced regulation,
both depending on scenario.
Ottaviano et al.
(2014)
-1.1 to -3.1% of
GDP.
Assesses impact of optimistic and pessimistic scenarios: (i) tariffs
with the EU remain at zero and some increase in non-tariff
barriers; (ii) the UK defaults to WTO MFN tariffs, with higher
increases in non-tariff barriers. Authors emphasize that “dynamic
losses” could be more than double.
Oxford
Economics
(2016)
-0.1 to -3.9% of
GDP in long term.
Assesses impact of nine scenarios, ranging from best case, in
which the UK forms a customs union with the EU and undertakes
an ambitious deregulation program, with only modest restrictions
on immigration; to worst case, in which the UK defaults to WTO
rules, restricts immigration, expands public spending, and does
not deregulate. Analysis focuses on long-term impact on UK
economy.
PwC (2016) -3 to -5.5% of GDP
in medium term;
-1.2 to -3.5% in
long term.
Employment falls
by 1.7 to 2.9% in
medium term.
Assesses impact of optimistic and pessimistic scenarios: (i) the UK
negotiates an FTA and uncertainty is resolved within 5 years of
referendum; (ii) the UK defaults to WTO rules. Assumes increases
in trade barriers, lower immigration, and reduced regulation, with
increased uncertainty over medium term, all depending on the
scenario.
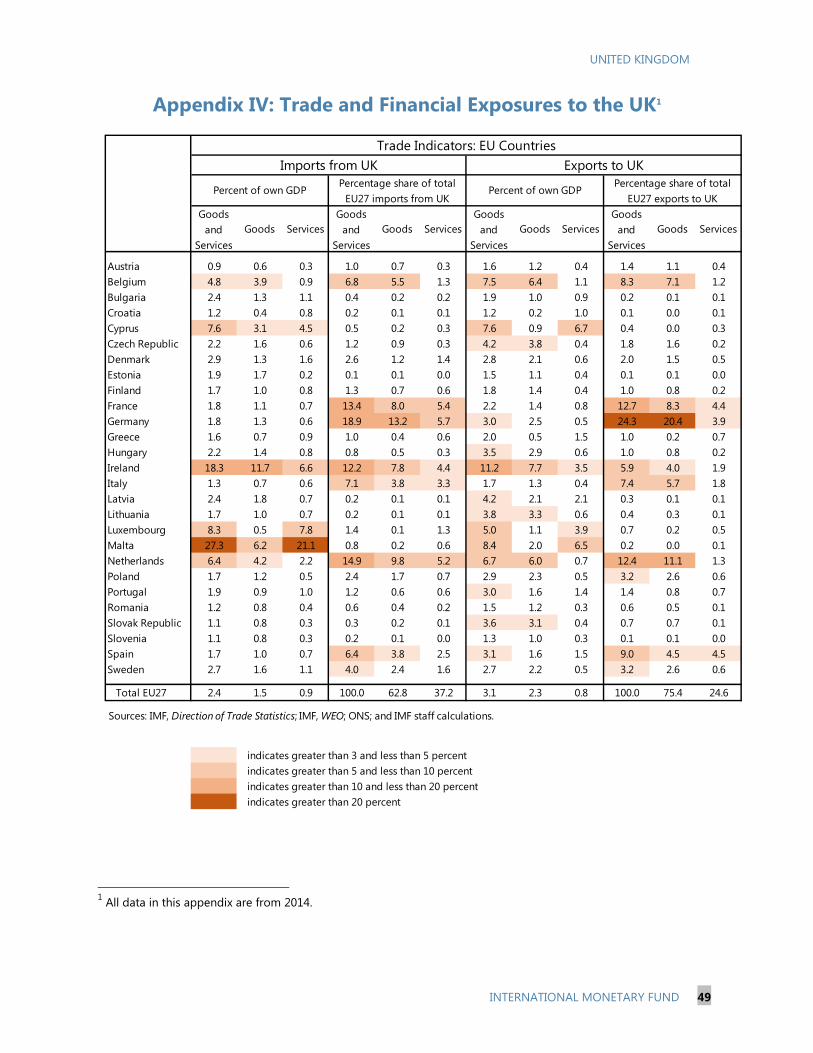
UNITED KINGDOM
INTERNATIONAL MONETARY FUND 49
Appendix IV: Trade and Financial Exposures to the UK1
1 All data in this appendix are from 2014.
Goods
and
Services
Goods Services
Goods
and
Services
Goods Services
Goods
and
Services
Goods Services
Goods
and
Services
Goods Services
Austria 0.9 0.6 0.3 1.0 0.7 0.3 1.6 1.2 0.4 1.4 1.1 0.4
Belgium 4.8 3.9 0.9 6.8 5.5 1.3 7.5 6.4 1.1 8.3 7.1 1.2
Bulgaria 2.4 1.3 1.1 0.4 0.2 0.2 1.9 1.0 0.9 0.2 0.1 0.1
Croatia 1.2 0.4 0.8 0.2 0.1 0.1 1.2 0.2 1.0 0.1 0.0 0.1
Cyprus 7.6 3.1 4.5 0.5 0.2 0.3 7.6 0.9 6.7 0.4 0.0 0.3
Czech Republic 2.2 1.6 0.6 1.2 0.9 0.3 4.2 3.8 0.4 1.8 1.6 0.2
Denmark 2.9 1.3 1.6 2.6 1.2 1.4 2.8 2.1 0.6 2.0 1.5 0.5
Estonia 1.9 1.7 0.2 0.1 0.1 0.0 1.5 1.1 0.4 0.1 0.1 0.0
Finland 1.7 1.0 0.8 1.3 0.7 0.6 1.8 1.4 0.4 1.0 0.8 0.2
France 1.8 1.1 0.7 13.4 8.0 5.4 2.2 1.4 0.8 12.7 8.3 4.4
Germany 1.8 1.3 0.6 18.9 13.2 5.7 3.0 2.5 0.5 24.3 20.4 3.9
Greece 1.6 0.7 0.9 1.0 0.4 0.6 2.0 0.5 1.5 1.0 0.2 0.7
Hungary 2.2 1.4 0.8 0.8 0.5 0.3 3.5 2.9 0.6 1.0 0.8 0.2
Ireland 18.3 11.7 6.6 12.2 7.8 4.4 11.2 7.7 3.5 5.9 4.0 1.9
Italy 1.3 0.7 0.6 7.1 3.8 3.3 1.7 1.3 0.4 7.4 5.7 1.8
Latvia 2.4 1.8 0.7 0.2 0.1 0.1 4.2 2.1 2.1 0.3 0.1 0.1
Lithuania 1.7 1.0 0.7 0.2 0.1 0.1 3.8 3.3 0.6 0.4 0.3 0.1
Luxembourg 8.3 0.5 7.8 1.4 0.1 1.3 5.0 1.1 3.9 0.7 0.2 0.5
Malta 27.3 6.2 21.1 0.8 0.2 0.6 8.4 2.0 6.5 0.2 0.0 0.1
Netherlands 6.4 4.2 2.2 14.9 9.8 5.2 6.7 6.0 0.7 12.4 11.1 1.3
Poland 1.7 1.2 0.5 2.4 1.7 0.7 2.9 2.3 0.5 3.2 2.6 0.6
Portugal 1.9 0.9 1.0 1.2 0.6 0.6 3.0 1.6 1.4 1.4 0.8 0.7
Romania 1.2 0.8 0.4 0.6 0.4 0.2 1.5 1.2 0.3 0.6 0.5 0.1
Slovak Republic 1.1 0.8 0.3 0.3 0.2 0.1 3.6 3.1 0.4 0.7 0.7 0.1
Slovenia 1.1 0.8 0.3 0.2 0.1 0.0 1.3 1.0 0.3 0.1 0.1 0.0
Spain 1.7 1.0 0.7 6.4 3.8 2.5 3.1 1.6 1.5 9.0 4.5 4.5
Sweden 2.7 1.6 1.1 4.0 2.4 1.6 2.7 2.2 0.5 3.2 2.6 0.6
Total EU27 2.4 1.5 0.9 100.0 62.8 37.2 3.1 2.3 0.8 100.0 75.4 24.6
indicates greater than 3 and less than 5 percent
indicates greater than 5 and less than 10 percent
indicates greater than 10 and less than 20 percent
indicates greater than 20 percent
Trade Indicators: EU Countries
Imports from UK
Percent of own GDPPercentage share of total
EU27 imports from UK
Exports to UK
Percent of own GDPPercentage share of total
EU27 exports to UK
Sources: IMF, Direction of Trade Statistics; IMF, WEO; ONS; and IMF staff calculations.
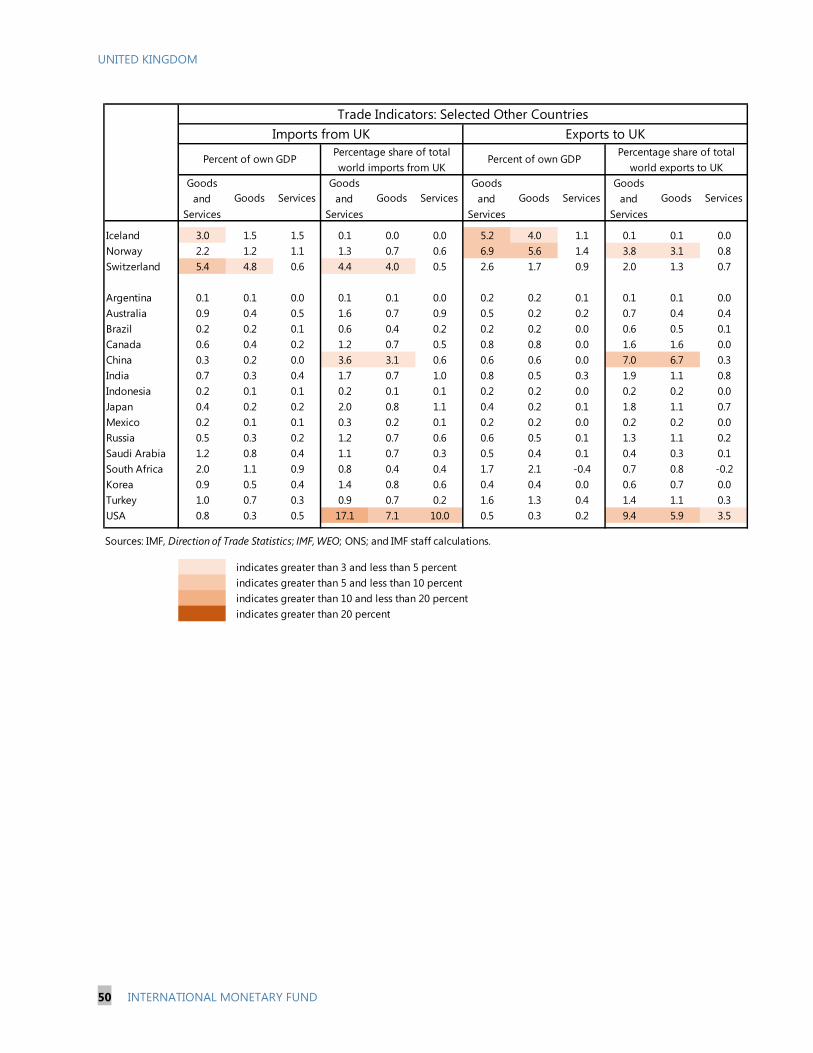
UNITED KINGDOM
50 INTERNATIONAL MONETARY FUND
Goods
and
Services
Goods Services
Goods
and
Services
Goods Services
Goods
and
Services
Goods Services
Goods
and
Services
Goods Services
Iceland 3.0 1.5 1.5 0.1 0.0 0.0 5.2 4.0 1.1 0.1 0.1 0.0
Norway 2.2 1.2 1.1 1.3 0.7 0.6 6.9 5.6 1.4 3.8 3.1 0.8
Switzerland 5.4 4.8 0.6 4.4 4.0 0.5 2.6 1.7 0.9 2.0 1.3 0.7
Argentina 0.1 0.1 0.0 0.1 0.1 0.0 0.2 0.2 0.1 0.1 0.1 0.0
Australia 0.9 0.4 0.5 1.6 0.7 0.9 0.5 0.2 0.2 0.7 0.4 0.4
Brazil 0.2 0.2 0.1 0.6 0.4 0.2 0.2 0.2 0.0 0.6 0.5 0.1
Canada 0.6 0.4 0.2 1.2 0.7 0.5 0.8 0.8 0.0 1.6 1.6 0.0
China 0.3 0.2 0.0 3.6 3.1 0.6 0.6 0.6 0.0 7.0 6.7 0.3
India 0.7 0.3 0.4 1.7 0.7 1.0 0.8 0.5 0.3 1.9 1.1 0.8
Indonesia 0.2 0.1 0.1 0.2 0.1 0.1 0.2 0.2 0.0 0.2 0.2 0.0
Japan 0.4 0.2 0.2 2.0 0.8 1.1 0.4 0.2 0.1 1.8 1.1 0.7
Mexico 0.2 0.1 0.1 0.3 0.2 0.1 0.2 0.2 0.0 0.2 0.2 0.0
Russia 0.5 0.3 0.2 1.2 0.7 0.6 0.6 0.5 0.1 1.3 1.1 0.2
Saudi Arabia 1.2 0.8 0.4 1.1 0.7 0.3 0.5 0.4 0.1 0.4 0.3 0.1
South Africa 2.0 1.1 0.9 0.8 0.4 0.4 1.7 2.1 -0.4 0.7 0.8 -0.2
Korea 0.9 0.5 0.4 1.4 0.8 0.6 0.4 0.4 0.0 0.6 0.7 0.0
Turkey 1.0 0.7 0.3 0.9 0.7 0.2 1.6 1.3 0.4 1.4 1.1 0.3
USA 0.8 0.3 0.5 17.1 7.1 10.0 0.5 0.3 0.2 9.4 5.9 3.5
indicates greater than 3 and less than 5 percent
indicates greater than 5 and less than 10 percent
indicates greater than 10 and less than 20 percent
indicates greater than 20 percent
Trade Indicators: Selected Other Countries
Imports from UK Exports to UK
Percent of own GDPPercentage share of total
world imports from UKPercent of own GDP
Percentage share of total
world exports to UK
Sources: IMF, Direction of Trade Statistics; IMF, WEO; ONS; and IMF staff calculations.
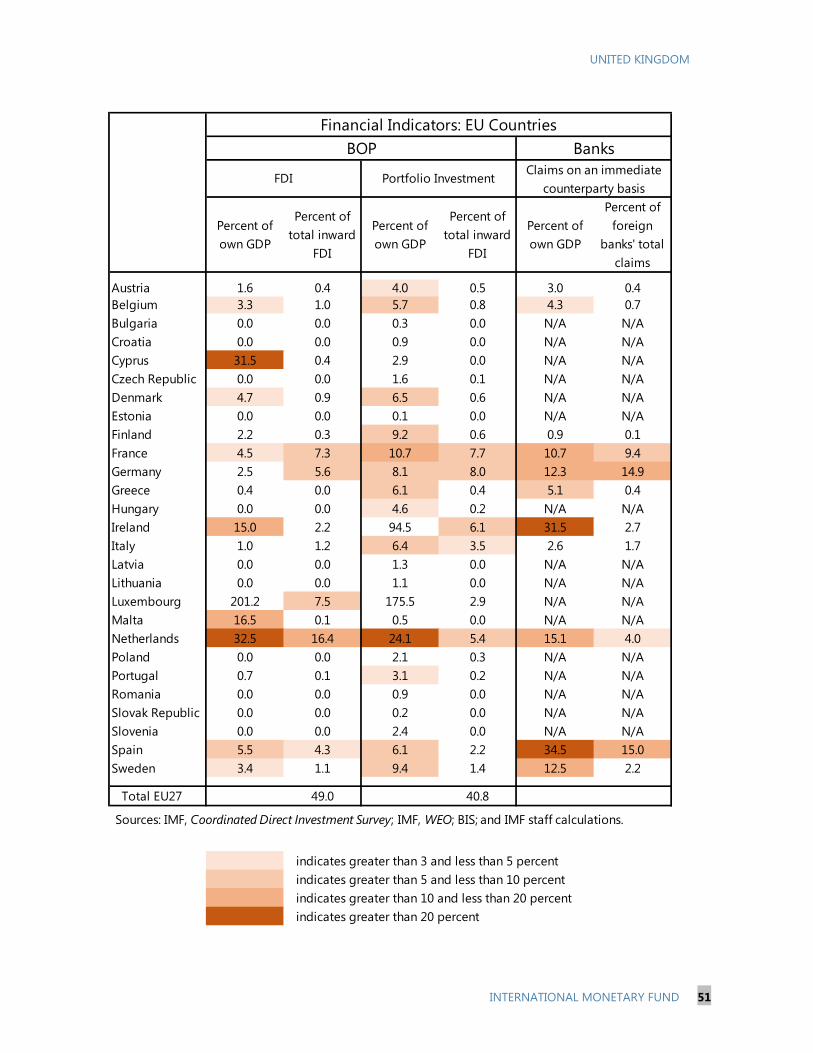
UNITED KINGDOM
INTERNATIONAL MONETARY FUND 51
Percent of
own GDP
Percent of
total inward
FDI
Percent of
own GDP
Percent of
total inward
FDI
Percent of
own GDP
Percent of
foreign
banks' total
claims
Austria 1.6 0.4 4.0 0.5 3.0 0.4
Belgium 3.3 1.0 5.7 0.8 4.3 0.7
Bulgaria 0.0 0.0 0.3 0.0 N/A N/A
Croatia 0.0 0.0 0.9 0.0 N/A N/A
Cyprus 31.5 0.4 2.9 0.0 N/A N/A
Czech Republic 0.0 0.0 1.6 0.1 N/A N/A
Denmark 4.7 0.9 6.5 0.6 N/A N/A
Estonia 0.0 0.0 0.1 0.0 N/A N/A
Finland 2.2 0.3 9.2 0.6 0.9 0.1
France 4.5 7.3 10.7 7.7 10.7 9.4
Germany 2.5 5.6 8.1 8.0 12.3 14.9
Greece 0.4 0.0 6.1 0.4 5.1 0.4
Hungary 0.0 0.0 4.6 0.2 N/A N/A
Ireland 15.0 2.2 94.5 6.1 31.5 2.7
Italy 1.0 1.2 6.4 3.5 2.6 1.7
Latvia 0.0 0.0 1.3 0.0 N/A N/A
Lithuania 0.0 0.0 1.1 0.0 N/A N/A
Luxembourg 201.2 7.5 175.5 2.9 N/A N/A
Malta 16.5 0.1 0.5 0.0 N/A N/A
Netherlands 32.5 16.4 24.1 5.4 15.1 4.0
Poland 0.0 0.0 2.1 0.3 N/A N/A
Portugal 0.7 0.1 3.1 0.2 N/A N/A
Romania 0.0 0.0 0.9 0.0 N/A N/A
Slovak Republic 0.0 0.0 0.2 0.0 N/A N/A
Slovenia 0.0 0.0 2.4 0.0 N/A N/A
Spain 5.5 4.3 6.1 2.2 34.5 15.0
Sweden 3.4 1.1 9.4 1.4 12.5 2.2
Total EU27 49.0 40.8
indicates greater than 3 and less than 5 percent
indicates greater than 5 and less than 10 percent
indicates greater than 10 and less than 20 percent
indicates greater than 20 percent
Claims on an immediate
counterparty basis
Banks
Financial Indicators: EU Countries
BOP
FDI Portfolio Investment
Sources: IMF, Coordinated Direct Investment Survey; IMF, WEO; BIS; and IMF staff calculations.
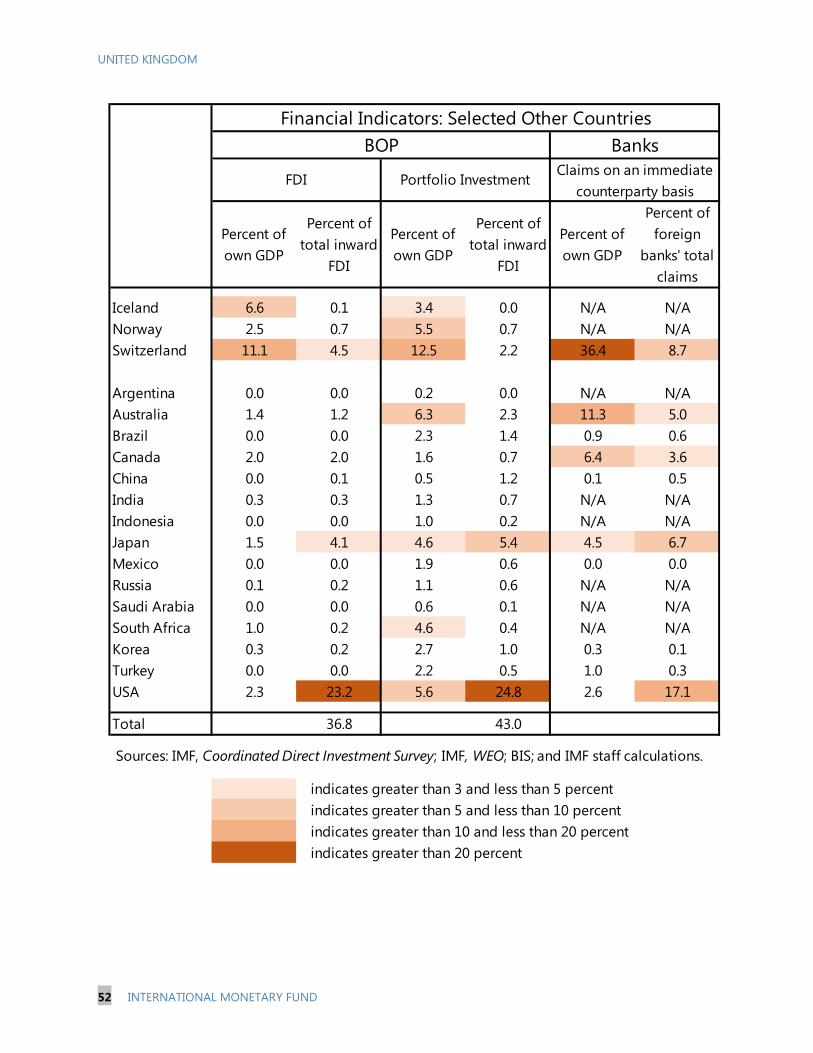
UNITED KINGDOM
52 INTERNATIONAL MONETARY FUND
Percent of
own GDP
Percent of
total inward
FDI
Percent of
own GDP
Percent of
total inward
FDI
Percent of
own GDP
Percent of
foreign
banks' total
claims
Iceland 6.6 0.1 3.4 0.0 N/A N/A
Norway 2.5 0.7 5.5 0.7 N/A N/A
Switzerland 11.1 4.5 12.5 2.2 36.4 8.7
Argentina 0.0 0.0 0.2 0.0 N/A N/A
Australia 1.4 1.2 6.3 2.3 11.3 5.0
Brazil 0.0 0.0 2.3 1.4 0.9 0.6
Canada 2.0 2.0 1.6 0.7 6.4 3.6
China 0.0 0.1 0.5 1.2 0.1 0.5
India 0.3 0.3 1.3 0.7 N/A N/A
Indonesia 0.0 0.0 1.0 0.2 N/A N/A
Japan 1.5 4.1 4.6 5.4 4.5 6.7
Mexico 0.0 0.0 1.9 0.6 0.0 0.0
Russia 0.1 0.2 1.1 0.6 N/A N/A
Saudi Arabia 0.0 0.0 0.6 0.1 N/A N/A
South Africa 1.0 0.2 4.6 0.4 N/A N/A
Korea 0.3 0.2 2.7 1.0 0.3 0.1
Turkey 0.0 0.0 2.2 0.5 1.0 0.3
USA 2.3 23.2 5.6 24.8 2.6 17.1
Total 36.8 43.0
indicates greater than 3 and less than 5 percent
indicates greater than 5 and less than 10 percent
indicates greater than 10 and less than 20 percent
indicates greater than 20 percent
Financial Indicators: Selected Other Countries
BOP
FDI Portfolio InvestmentClaims on an immediate
counterparty basis
Banks
Sources: IMF, Coordinated Direct Investment Survey; IMF, WEO; BIS; and IMF staff calculations.
UNITED KINGDOM
INTERNATIONAL MONETARY FUND 53
Appendix V: Constructing the Conditional Transition Scenarios of Exit from the EU
A number of possible effects are relevant for the scenarios considered in this paper: loss of access to
the single market; potential repercussions for investment and productivity; potential restrictions on
migration, affecting labor supply and productivity; increased risk and risk aversion; and direct effects
from uncertainty about the UK’s eventual economic relations with the EU and the rest of the world.
These effects can all differ in degree and timing, depending on the scenario considered.
Conceptually, these effects can be allocated into two “layers” that can be used to build up the profile
of the projections:
First, the transition to the new steady state of the economy under the assumption that agents
are risk neutral and fully understand the path to the long run (i.e., the “certainty equivalent”
response); and
Second, the additional effects of risk and uncertainty.
Note that this distinction does not correspond to “short run” vs. “long run”—the certainty equivalent
path will involve dynamics arising from agent’s expectations of the new steady state. Indeed, a key
judgment (below) is the degree to which households and firms would front-load adjustment
because of what they anticipate about the future.
The modeling of risk and uncertainty is distinct. To illustrate, take the investment equation estimated
by Julio and Yook (2012):
investment = f(uncertainty, Tobin’s Q, cash flow, aggregate demand)
The equation is specified with both a measure of uncertainty—the focus of their exercise—and
Tobin’s Q. As the latter is the ratio of the market value of assets to the book value of assets, it will
reflect current market pricing of risk. Hence the treatment of uncertainty and risk is separate, and
judgments on risk premia are needed in addition to the certainty equivalent responses, which will be
based on expectations of the path of future riskless interest rates.
Because the scenarios are complex and unusual, multiple methods were used independently to
provide evidence on the adjustment of the economy: empirical and narrative analysis of historical
episodes; reduced-form, atheoretical empirical analysis of responses to uncertainty; model-based
simulations, both of the new steady state and the transition to the long run; and the IMF’s traditional
“financial programming” approach to conditional projections. Each of these methods has
advantages and weaknesses; each was run independently and the results compared to converge on
the scenarios shown in ¶47–48.
The analysis begins with the new steady state. For this, bilateral trade changes from the LSE’s trade
model analysis of limited and more severe scenarios were assumed (Dhingra et al. 2016), with
additional small losses to investment and productivity based on the microeconometric studies
UNITED KINGDOM
54 INTERNATIONAL MONETARY FUND
quoted in the text (¶17, 20; see also Box 1). In the projections shown in the text, the economy loses
1½ and 4½ percent of GDP in the long run.
These assumptions are not meant to indicate predictions of likely full effects from leaving the EU.
Instead, as the focus of interest is the medium-term transition to new steady states, in which the
effects of uncertainty and risk are important, they are deliberately conservative—if instead very
severe losses in bilateral trade were assumed, these effects would dominate over the transition
period. However, as noted in the text and Appendix 3, HMT, the OECD, and NIESR present scenarios
with larger losses to output.
To apply the next layer, assumptions need to be made about the scale and effects of risk and
uncertainty. The scale, duration, and effects of uncertainty are estimated and cross-checked by two
methods: episode analysis, applied to the financial programming approach, and a structural VAR. As
seen in the text, with these additional effects, output is 1½ and 5½ percent below the baseline after
two years.
A. Estimating the effects of uncertainty
Episode Analysis
The UK has experienced two notable episodes of macroeconomic adjustment and uncertainty over
the past quarter century: the ERM crisis of 1992, and the global financial crisis that began in 2007.
The ERM crisis at first appears similar: the UK experienced a sudden regime shift as it was forced off
its fixed exchange rate with the Deutschemark in September 1992. However, the ERM crisis is
arguably better viewed as the culmination of pressures and vulnerabilities that had accumulated up
to that point, notably from maintaining an overvalued exchange rate and an inability to respond to a
credit boom—year-over-year GDP growth reached its trough in the middle of 1991, well before
Black Wednesday itself.
The UK’s experience of the global financial crisis is more instructive. Denis and Kannan (2013) find
that a quarter of the decline in output during the recession that followed the global financial crisis
can be attributed to uncertainty. The full effects of uncertainty peaked a year after the shock. They
also find that the role of uncertainty in the UK and the US over this period was nearly identical,
which gives some confidence that empirical analysis of the experience of the US could also be
applied to the UK. In particular, Gulen and Ion (2016) and Stein and Stone (2012) independently find,
with very different methods, that around a third of the decline in business investment in the US in
the aftermath of the global financial crisis can be attributed to uncertainty effects.
In the UK, GDP declined by around 6 percent from peak to trough from the start of 2008 to the
middle of 2009. Business investment declined by around 18 percent from peak to trough, with a
6 percent decline in private consumption. This episode analysis suggests that, taking the global
financial crisis as a benchmark, uncertainty of around half of that experienced during the global
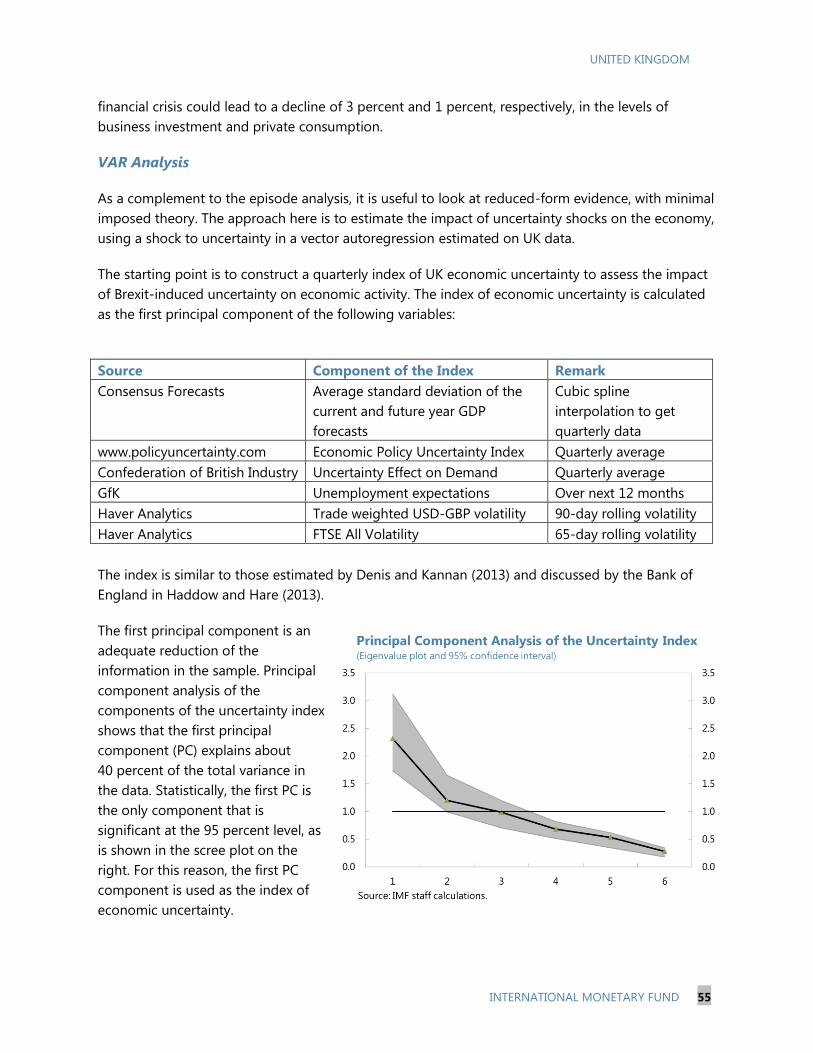
UNITED KINGDOM
INTERNATIONAL MONETARY FUND 55
financial crisis could lead to a decline of 3 percent and 1 percent, respectively, in the levels of
business investment and private consumption.
VAR Analysis
As a complement to the episode analysis, it is useful to look at reduced-form evidence, with minimal
imposed theory. The approach here is to estimate the impact of uncertainty shocks on the economy,
using a shock to uncertainty in a vector autoregression estimated on UK data.
The starting point is to construct a quarterly index of UK economic uncertainty to assess the impact
of Brexit-induced uncertainty on economic activity. The index of economic uncertainty is calculated
as the first principal component of the following variables:
Source Component of the Index Remark
Consensus Forecasts Average standard deviation of the
current and future year GDP
forecasts
Cubic spline
interpolation to get
quarterly data
www.policyuncertainty.com Economic Policy Uncertainty Index Quarterly average
Confederation of British Industry Uncertainty Effect on Demand Quarterly average
GfK Unemployment expectations Over next 12 months
Haver Analytics Trade weighted USD-GBP volatility 90-day rolling volatility
Haver Analytics FTSE All Volatility 65-day rolling volatility
The index is similar to those estimated by Denis and Kannan (2013) and discussed by the Bank of
England in Haddow and Hare (2013).
The first principal component is an
adequate reduction of the
information in the sample. Principal
component analysis of the
components of the uncertainty index
shows that the first principal
component (PC) explains about
40 percent of the total variance in
the data. Statistically, the first PC is
the only component that is
significant at the 95 percent level, as
is shown in the scree plot on the
right. For this reason, the first PC
component is used as the index of
economic uncertainty.
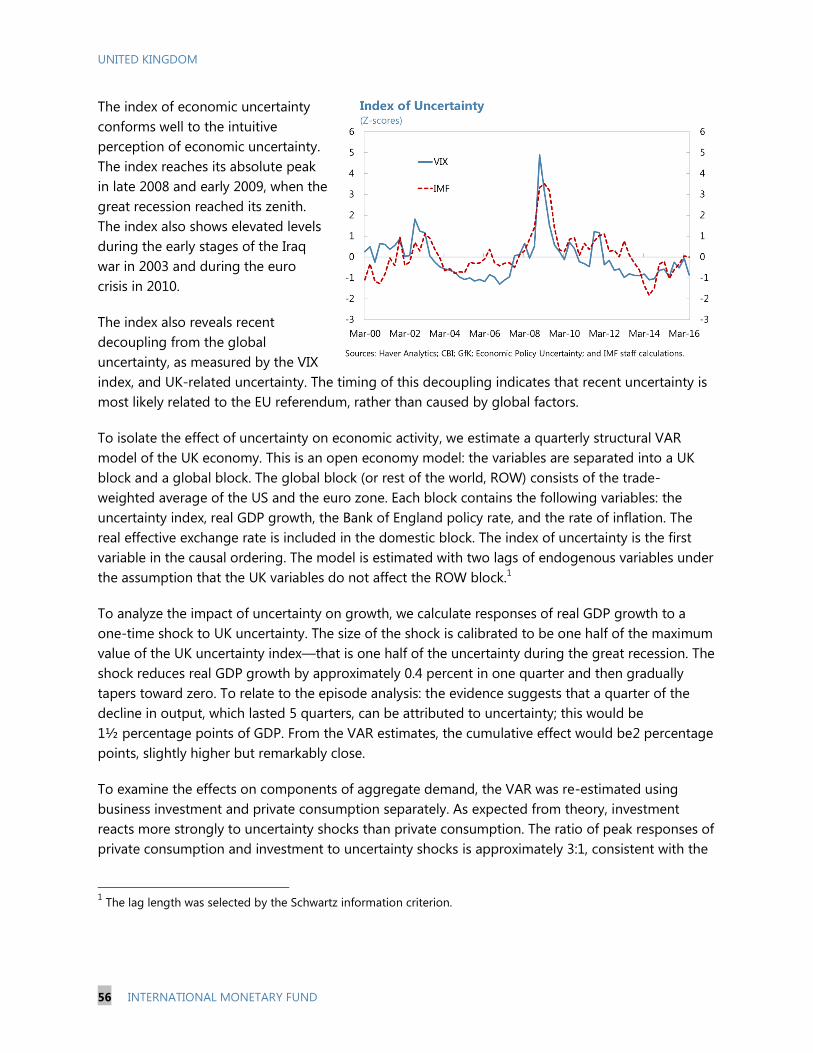
UNITED KINGDOM
56 INTERNATIONAL MONETARY FUND
The index of economic uncertainty
conforms well to the intuitive
perception of economic uncertainty.
The index reaches its absolute peak
in late 2008 and early 2009, when the
great recession reached its zenith.
The index also shows elevated levels
during the early stages of the Iraq
war in 2003 and during the euro
crisis in 2010.
The index also reveals recent
decoupling from the global
uncertainty, as measured by the VIX
index, and UK-related uncertainty. The timing of this decoupling indicates that recent uncertainty is
most likely related to the EU referendum, rather than caused by global factors.
To isolate the effect of uncertainty on economic activity, we estimate a quarterly structural VAR
model of the UK economy. This is an open economy model: the variables are separated into a UK
block and a global block. The global block (or rest of the world, ROW) consists of the trade-
weighted average of the US and the euro zone. Each block contains the following variables: the
uncertainty index, real GDP growth, the Bank of England policy rate, and the rate of inflation. The
real effective exchange rate is included in the domestic block. The index of uncertainty is the first
variable in the causal ordering. The model is estimated with two lags of endogenous variables under
the assumption that the UK variables do not affect the ROW block.1
To analyze the impact of uncertainty on growth, we calculate responses of real GDP growth to a
one-time shock to UK uncertainty. The size of the shock is calibrated to be one half of the maximum
value of the UK uncertainty index—that is one half of the uncertainty during the great recession. The
shock reduces real GDP growth by approximately 0.4 percent in one quarter and then gradually
tapers toward zero. To relate to the episode analysis: the evidence suggests that a quarter of the
decline in output, which lasted 5 quarters, can be attributed to uncertainty; this would be
1½ percentage points of GDP. From the VAR estimates, the cumulative effect would be2 percentage
points, slightly higher but remarkably close.
To examine the effects on components of aggregate demand, the VAR was re-estimated using
business investment and private consumption separately. As expected from theory, investment
reacts more strongly to uncertainty shocks than private consumption. The ratio of peak responses of
private consumption and investment to uncertainty shocks is approximately 3:1, consistent with the
1 The lag length was selected by the Schwartz information criterion.
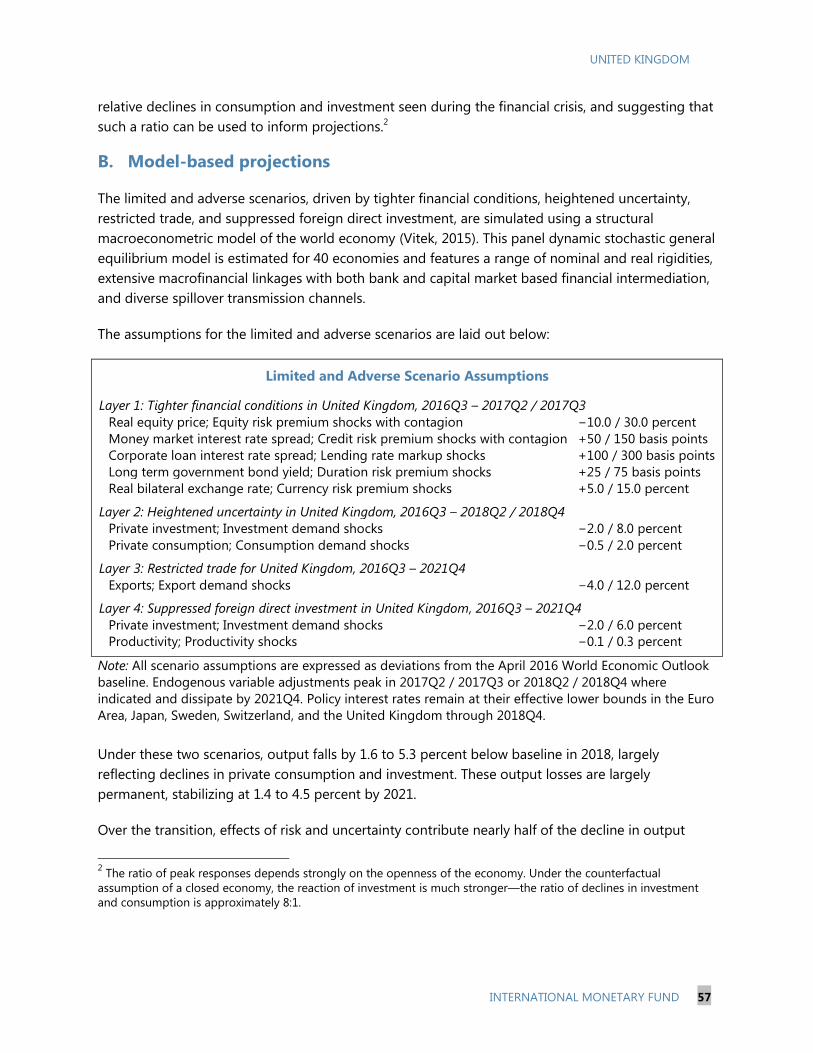
UNITED KINGDOM
INTERNATIONAL MONETARY FUND 57
relative declines in consumption and investment seen during the financial crisis, and suggesting that
such a ratio can be used to inform projections.2
B. Model-based projections
The limited and adverse scenarios, driven by tighter financial conditions, heightened uncertainty,
restricted trade, and suppressed foreign direct investment, are simulated using a structural
macroeconometric model of the world economy (Vitek, 2015). This panel dynamic stochastic general
equilibrium model is estimated for 40 economies and features a range of nominal and real rigidities,
extensive macrofinancial linkages with both bank and capital market based financial intermediation,
and diverse spillover transmission channels.
The assumptions for the limited and adverse scenarios are laid out below:
Limited and Adverse Scenario Assumptions
Layer 1: Tighter financial conditions in United Kingdom, 2016Q3 – 2017Q2 / 2017Q3
Real equity price; Equity risk premium shocks with contagion −10.0 / 30.0 percent
Money market interest rate spread; Credit risk premium shocks with contagion +50 / 150 basis points
Corporate loan interest rate spread; Lending rate markup shocks +100 / 300 basis points
Long term government bond yield; Duration risk premium shocks +25 / 75 basis points
Real bilateral exchange rate; Currency risk premium shocks +5.0 / 15.0 percent
Layer 2: Heightened uncertainty in United Kingdom, 2016Q3 – 2018Q2 / 2018Q4
Private investment; Investment demand shocks −2.0 / 8.0 percent
Private consumption; Consumption demand shocks −0.5 / 2.0 percent
Layer 3: Restricted trade for United Kingdom, 2016Q3 – 2021Q4
Exports; Export demand shocks −4.0 / 12.0 percent
Layer 4: Suppressed foreign direct investment in United Kingdom, 2016Q3 – 2021Q4
Private investment; Investment demand shocks −2.0 / 6.0 percent
Productivity; Productivity shocks −0.1 / 0.3 percent
Note: All scenario assumptions are expressed as deviations from the April 2016 World Economic Outlook
baseline. Endogenous variable adjustments peak in 2017Q2 / 2017Q3 or 2018Q2 / 2018Q4 where
indicated and dissipate by 2021Q4. Policy interest rates remain at their effective lower bounds in the Euro
Area, Japan, Sweden, Switzerland, and the United Kingdom through 2018Q4.
Under these two scenarios, output falls by 1.6 to 5.3 percent below baseline in 2018, largely
reflecting declines in private consumption and investment. These output losses are largely
permanent, stabilizing at 1.4 to 4.5 percent by 2021.
Over the transition, effects of risk and uncertainty contribute nearly half of the decline in output
2 The ratio of peak responses depends strongly on the openness of the economy. Under the counterfactual
assumption of a closed economy, the reaction of investment is much stronger—the ratio of declines in investment
and consumption is approximately 8:1.
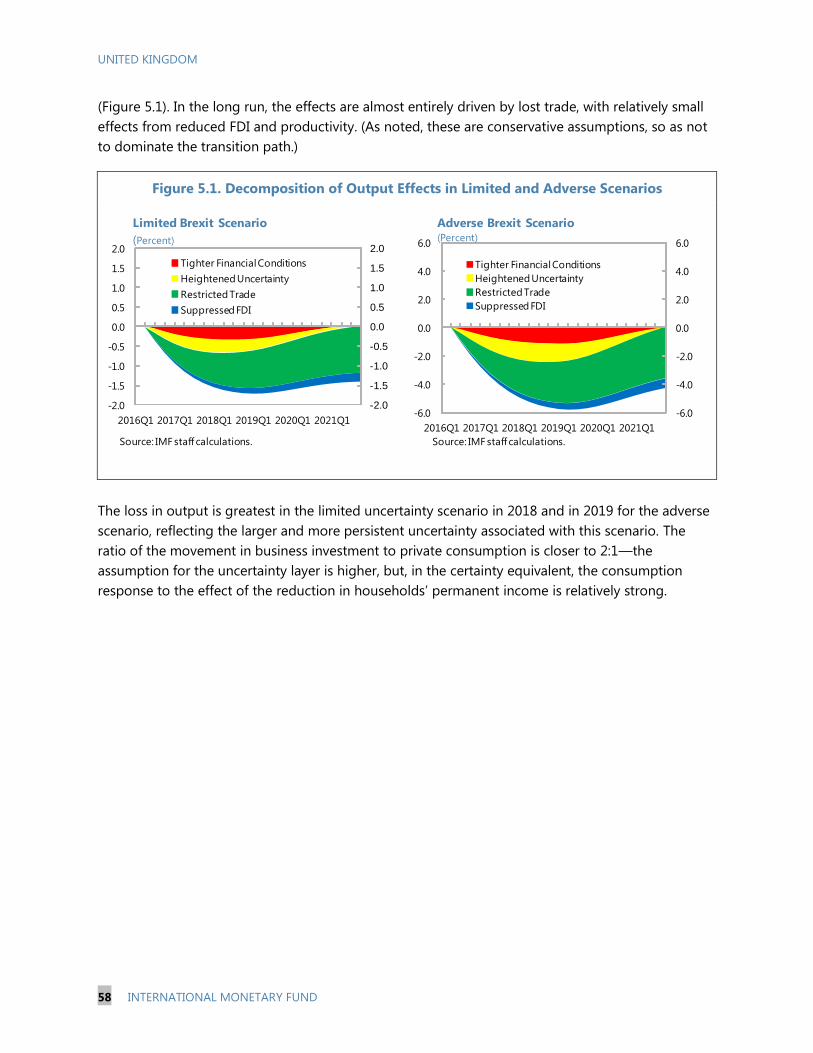
UNITED KINGDOM
58 INTERNATIONAL MONETARY FUND
(Figure 5.1). In the long run, the effects are almost entirely driven by lost trade, with relatively small
effects from reduced FDI and productivity. (As noted, these are conservative assumptions, so as not
to dominate the transition path.)
Figure 5.1. Decomposition of Output Effects in Limited and Adverse Scenarios
The loss in output is greatest in the limited uncertainty scenario in 2018 and in 2019 for the adverse
scenario, reflecting the larger and more persistent uncertainty associated with this scenario. The
ratio of the movement in business investment to private consumption is closer to 2:1—the
assumption for the uncertainty layer is higher, but, in the certainty equivalent, the consumption
response to the effect of the reduction in households’ permanent income is relatively strong.
-2.0
-1.5
-1.0
-0.5
0.0
0.5
1.0
1.5
2.0
-2.0
-1.5
-1.0
-0.5
0.0
0.5
1.0
1.5
2.0
2016Q1 2017Q1 2018Q1 2019Q1 2020Q1 2021Q1
Tighter Financial Conditions
Heightened Uncertainty
Restricted Trade
Suppressed FDI
Limited Brexit Scenario
(Percent)
Source: IMF staff calculations.
-6.0
-4.0
-2.0
0.0
2.0
4.0
6.0
-6.0
-4.0
-2.0
0.0
2.0
4.0
6.0
2016Q1 2017Q1 2018Q1 2019Q1 2020Q1 2021Q1
Tighter Financial Conditions
Heightened Uncertainty
Restricted Trade
Suppressed FDI
Adverse Brexit Scenario(Percent)
Source: IMF staff calculations.
UNITED KINGDOM
INTERNATIONAL MONETARY FUND 59
References
Ahn, JaeBin, Era Dabla-Norris, Romain Duval, Bingjie Hu and Lamin Njie (2016), “Reassessing the
productivity gains from trade liberalization”, International Monetary Fund Working Paper WP/16/77.
Anderson, James E. and Eric van Wincoop (2003), “Gravity with gravitas: a solution to the border
puzzle”, American Economic Review 93(1), 170–192.
Armstrong, Angus (2016), “EU membership, financial services and stability”, National Institute
Economic Review No. 236.
Atoyan, Ruben, Lone Christiansen, Allan Dizioli, Christian Ebeke, Nadeem Ilahi, Anna Ilyina, Gil
Mehrez, Haonan Qu, Faezeh Raei, Alaina Rhee, and Daria Zakharova (2016), “Should they stay or
should they go? Economic impact of emigration on eastern Europe”, IMF Staff Discussion Note.
Baker, Jess, Oriol Carreras, Rebecca Piggott, Monique Ebell, Simon Kirby, Jack Meaning, James
Warren, and Ian Hurst (2016), “The short-term economic impact of leaving the EU”, National Institute
Economic Review No. 236.
Ball, Laurence M. Ball, Daniel Leigh, and Prakash Loungani (2013), “Okun's law: fit at fifty?”, NBER
Working Paper No. 18668.
Barrett, Alan, Adele Bergin, John FitzGerald, Derek Lambert, Daire McCoy, Edgar Morgenroth, Iulia
Siedschlag, and Zuzanna Studnicka (2015), “Scoping the possible economic implications of Brexit on
Ireland”, ESRI Research Series No. 48.
Bank of England (2015a), “EU membership and the Bank of England”.
Bank of England (2015b), Financial Policy Committee Statement from its policy meeting, 23 March
2016.
Begg, Ian (2016), “The EU budget and UK contribution”, National Institute Economic Review No. 236.
Benito, Anrew (2006), “Does job insecurity affect household consumption?”, Oxford Economic Papers
(56), 157–81.
Bernanke, Ben S. (1983), “Irreversibility, uncertainty, and cyclical investment”, Quarterly Journal of
Economics 98 (1), 85–106.
Bertelsmann Stiftung (2015), “Costs and benefits of a United Kingdom exit from the European
Union”.
UNITED KINGDOM
60 INTERNATIONAL MONETARY FUND
Bloom, Nicholas, Mirko Draca, and John van Reenen (2011), “Trade induced technical change? The
impact of Chinese imports on innovation, IT and productivity”, NBER Working Paper No. 16717.
Blanchflower, David G. and Helen Lawton (2008), “The impact of the recent expansion of the EU on
the UK Labour Market”, IZA Discussion Paper No. 3695.
Boubtane, Ekrame, Jean-Christophe Dumont, and Christophe Rault (2015), “Immigration and
Economic Growth in the OECD Countries 1986–2006”, CESifo Working Paper Series No. 5392.
Breinlich, Holger, Swati Dhingra, and Gianmarco Ottaviano (2016), “How have the EU's trade
agreements impacted consumers?” CEP Discussion Paper No. 1417.
Bruno, Randolph, Nauro Campos, Saul Estrin, and Meng Tian (2016), “Technical Appendix to ‘The
impact of Brexit on foreign investment in the UK’ Gravitating towards Europe: an econometric
analysis of the FDI effects of EU membership”.
Burrage, Michael (2014), “Where’s the insider advantage? A comparative study of UK exports to EU
and non-EU nations between 1960 and 2012”, Civitas: Institute for the Study of Civil Society.
Campos, Nauro F. and Fabrizio Coricelli (2015), “Some unpleasant Brexit econometrics”.
Campos, Nauro F., Fabrizio Coricelli, and Luigi Moretti (2014), “Economic growth and political
integration: estimating the benefits from membership in the European Union using the synthetic
counterfactuals method”, CEPR Discussion Paper No. 9968.
Carreras, Oriol, Monique Ebell, Simon Kirby, Jack Meaning, Rebecca Piggott, and James Warren
(2016), “The long and the short of it: what price UK Exit from the EU?”, National Institute of
Economic and Social Research.
Centre for European Reform (2014), “The economic consequences of leaving the EU: The final report
of the CER commission on the UK and the EU single markets”.
Crafts, Nicholas (2016), “The growth effects of EU membership for the UK: a review”, manuscript,
University of Warwick.
Dabla-Norris, Era, Si Guo, Vikram Haksar, Minsuk Kim, Kalpana Kochhar, Kevin Wiseman, and
Aleksandra Zdzienicka (2015), “The new normal: a sector-level perspective on productivity trends in
advanced economies”, IMF Staff Discussion Note SDN/15/03.
Davis, Scott R., Nicholas Bloom, and Steven J. Davis (2013), “Measuring economic policy uncertainty”,
NBER Working Paper 21633.
UNITED KINGDOM
INTERNATIONAL MONETARY FUND 61
Denis, Stephanie, and Prakash Kannan (2013), “The impact of uncertainty shocks on the UK
economy”, International Monetary Fund Working Paper WP/13/66.
Dhingra, Swati, Gianmarco Ottaviano, and Thomas Sampson (2015), “Should we stay or should we
go? The economic consequences of leaving the EU”.
Dhingra, Swati, Gianmarco Ottaviano, Thomas Sampson, and John Van Reenen (2016a), “The
consequences of Brexit for UK trade and living standards”, CEP Brexit Analysis paper CEPBREXIT02.
Dhingra, Swati, Gianmarco Ottaviano, Thomas Sampson, and John Van Reenen (2016b), “The impact
of Brexit on foreign investment in the UK” CEP Brexit Analysis paper CEPBREXIT03.
Dhingra, Swati, Gianmarco Ottaviano, John Van Reenen and Jonathan Wadsworth (2016), “Brexit and
the impact of immigration on the UK”, CEP Brexit Analysis paper CEPBREXIT05.
Dustmann, Christian, Tommaso Frattini, and Ian P. Preston (2014), “The effects of immigration along
the distribution of wages”, Review of Economic Studies 80, 145–173.
Dustmann, Christian, and Tommaso Frattini (2014), “The fiscal impacts of immigration to the UK”,
The Economic Journal 124, F593–F643.
Ebell, Monique, and James Warren (2016), “The long-term economic impact of leaving the EU”,
National Institute Economic Review No. 236.
Emmerson, Carl, Paul Johnson, Ian Mitchell, and David Phillips (2016), “Brexit and the UK’s public
finances”, Institute for Fiscal Studies Report 116.
Fidrmuc, Jan, and Jaarko Fidrmuc (2003), “Disintegration and trade”, Review of International
Economics 11(5), 811–829.
Fournier, Jean-Marc, Aurore Domps, Yaëlle Gorin, Xavier Guillet, and Délia Morchoisne (2015),
“Implicit regulatory barriers in the EU single market”, OECD Economics Department Working Paper
No. 1181.
Giavazzi, Francesco, and Michael McMahon (2012), “Policy uncertainty and household savings”,
Review of Economics and Statistics 94(2), 517–531.
Global Counsel (2015), “BREXIT: the impact on the UK and the EU”.
Gulen, Huseyin, and Mihai Ion (2016), “Policy uncertainty and corporate investment”, The Review of
Financial Studies, 29(3).
UNITED KINGDOM
62 INTERNATIONAL MONETARY FUND
Haddow, Abigail, and Chris Hare (2013), “Macroeconomic uncertainty: what is it, how can we
measure it and why does it matter?” Bank of England Quarterly Bulletin 2013 Q2, pp. 100–109.
Handley, Kyle, and Nuno Limao (2012), “Trade and investment under policy uncertainty: theory and
firm evidence,” American Economic Journal: Policy, forthcoming.
Haskel, Jonathan E., Sonia C. Pereira, and Matthew J. Slaughter (2007), “Does inward foreign direct
investment boost the productivity of domestic firms”, The Review of Economics and Statistics 89(3),
482–496.
House of Commons Library (2013), “The economic impact of EU membership on the UK”, Standard
Note SN/EP/6730.
HM Government (2016a), “The process for withdrawing from the European Union”.
HM Government (2016b), “The best of both worlds: the United Kingdom’s special status in a
reformed European Union”.
HM Government (2016c), “HM Treasury analysis: the long-term economic impact of EU membership
and the alternatives”.
HM Government (2016d), “HM Treasury analysis: the immediate economic impact of leaving the EU”.
International Monetary Fund (2016), United Kingdom: Staff Report for the 2015 Article IV
Consultation, IMF Country Report No.16/57.
Julio, Brandon, and Youngsuk Yook (2012), “Political uncertainty and corporate investment cycles”,
The Journal of Finance 67(1), 45–84.
Kahanec, Martin, Mariola Pytlikov , and Klaus Zimmermann (2014), “The free movement of workers
in an enlarged European Union: institutional underpinnings of economic adjustment”, IZA Discussion
Paper 8456.
Kehoe, Timothy J., and Kim J. Ruhl (2007), “Recent great depressions: aggregate growth in New
Zealand and Switzerland” in Timothy J. Kehoe and Edward C Prescott [eds], Great Depressions of the
Twentieth Century, Federal Reserve Bank of Minneapolis, pp. 335–372.
Kelly, Bryan, Lubos Pastor, and Pietro Veronesi (2015), “The price of political uncertainty: theory and
evidence from the option market”, The Journal of Finance (forthcoming).
Leduc, Sylvain, and Zheng Liu (2015), “Uncertainty shocks are aggregate demand shocks”, Federal
Reserve Bank of San Francisco working paper.
UNITED KINGDOM
INTERNATIONAL MONETARY FUND 63
LSE Growth Commission (2013), Investing for Prosperity.
Lucchino, Paolo, Chiara Rosazza-Bondibene, and Jonathan Portes (2012), “Examining the relationship
between immigration and unemployment using national insurance number registration data”, NIESR
Discussion Paper No. 386.
Manacorda, Marco, Alan Manning, and Jonathan Wadsworth (2012), “The impact of immigration on
the structure of wages: theory and evidence from Britain”, Journal of the European Economic
Association 10(1), pp. 120–51.
Melitz, Marc J. (2003), "The impact of trade on intra-industry reallocations and aggregate industry
productivity", Econometrica 71, 1695–1725.
Migration Advisory Committee (2014), “Migrants in low-skilled work”, Migration Advisory Committee
Summary Report.
Migration Observatory (2016), “Characteristics and outcomes of migrants in the UK labour market”,
University of Oxford.
Minford, Patrick, “Brexit and trade: what are the options?” in Economists for Brexit (2016), The
Economy after Brexit.
Mrkaic, Mico (2016), “A firm-level analysis of labor productivity in the United Kingdom”, United
Kingdom: Selected Issues, IMF Country Report No. 16/58.
Nickell, Steven .J., and Jumana Saleheen (2008), “The impact of immigration on occupational wages:
British evidence”, Staff Working Paper No. 574.
OECD (2016), “The consequences of Brexit: a taxing decision”, OECD Economic Policy Paper No. 16.
Open Europe (2015), “The consequences, challenges and opportunities facing Britain outside EU”.
Ottaviano, Gianmarco, João Paulo Pessoa, Thomas Sampson, and John Van Reenen (2014), “The
costs and benefits of leaving the EU”.
Oxford Economics (2016), “Assessing the economic implications of Brexit”.
Pastor, Lubos, and Pietro Veronesi (2013), “Political uncertainty and risk premia”, Journal of Financial
Economics 110(3), 520–545.
Portes, Jonathan (2015), “The Bank of England’s EU analysis: free movement and immigration”.
UNITED KINGDOM
64 INTERNATIONAL MONETARY FUND
Portes, Jonathan (2016), “Immigration, free movement, and the EU referendum”, National Institute
Economic Review No. 236.
Pritchett, Lance, and Lawrence H. Summers (2014), “Asiaphoria meets regression to the mean”, NBER
Working Paper 20573.
PwC (2016), “Leaving the EU: Implications for the UK economy”.
Rolfe, Heather and Nathan Hudson-Sharp (2016), “The impact of free movement on the labour
market: case studies of hospitality, food processing and construction”, National Institute for
Economic and Social Research.
Sanchez Martinez, Miguel, and Katerina Lisenkova (2014), “The long-term economic impact of
reducing migration in the UK”, National Institute Economic Review 229: R22–R30.
Standard and Poors (2015), “Brexit risk for the UK and its financial services: It’s complicated”.
Stein, Luke C.D., and Elizabeth C. Stone (2012), “The effect of uncertainty on investment, hiring, and
R&D: Causal evidence from equity options”, working paper, Arizona State University.
Vitek, Francis (2015), “Macrofinancial analysis in the world economy: a panel dynamic stochastic
general equilibrium approach”, International Monetary Fund Working Paper WP/15/227.
Wadsworth, Jonathan (2015), “Immigration and the UK Labour Market”, CEP Election Analyses Paper
EA019.
Wadsworth, Jonathan, and R. Vaitilingam (2015), “Immigration, the European Union and the UK
labour market”, LSE, CEP Policy Analysis.