Embed Size (px)
Citation preview
© 2015 International Monetary Fund
IMF Country Report No. 15/236
IRAQ SELECTED ISSUES
This paper on Iraq was prepared by a staff team of the International Monetary Fund as
background documentation for the periodic consultation with the member country. It is
based on the information available at the time it was completed on July 14, 2015.
Copies of this report are available to the public from
International Monetary Fund Publication Services
PO Box 92780 Washington, D.C. 20090
Telephone: (202) 623-7430 Fax: (202) 623-7201
E-mail: [email protected] Web: http://www.imf.org
Price: $18.00 per printed copy
International Monetary Fund
Washington, D.C.
August 2015
IRAQ SELECTED ISSUES Approved By Middle East and Central Asia Department
Prepared By Koba Gvenetadze and Amgad Hegazy
THE IRAQI OIL SECTOR: DEVELOPMENTS AND PROSPECTS AFTER THE TWIN
SHOCK _____________________________________________________________________________________ 2
A. Introduction _____________________________________________________________________________ 2
B. Recent Developments ___________________________________________________________________ 3
C. Impact of the Insurgency on Regional Oil Production and Exports _____________________ 5
D. The Oil Factor in Baghdad-Erbil Relations ______________________________________________ 8
E. Renegotiation of Contracts ____________________________________________________________ 10
F. Oil Sector Expansion Plans Under Revision ____________________________________________ 10 References _______________________________________________________________________________ 14
FOOD AND ELECTRICITY SUBSIDIES IN IRAQ _________________________________________ 15
A. Food Subsidies: The Public Distribution System (PDS) ________________________________ 15
B. Electricity Subsidies ___________________________________________________________________ 20 References _______________________________________________________________________________ 30
CONTENTS
July 14, 2015
IRAQ
2 INTERNATIONAL MONETARY FUND
THE IRAQI OIL SECTOR: DEVELOPMENTS AND PROSPECTS AFTER THE TWIN SHOCK1 A. Introduction
1. The Iraqi economy was affected by the two major challenges during 2014—ISIS insurgency and the fall in global oil prices. The ISIS insurgency put pressure on budget through increased military and humanitarian spending and threatened the security of oil facilities. The spillover from falling oil prices to the economy was strong as the structure of the economy is not diversified and oil is effectively Iraq’s only export. The impact of ISIS insurgency and weak global prices are fully unfolding in 2015. This paper will describe the Iraqi oil sector developments under the twin shock and discuss its impact on oil sector growth prospects in the short- and medium-term.
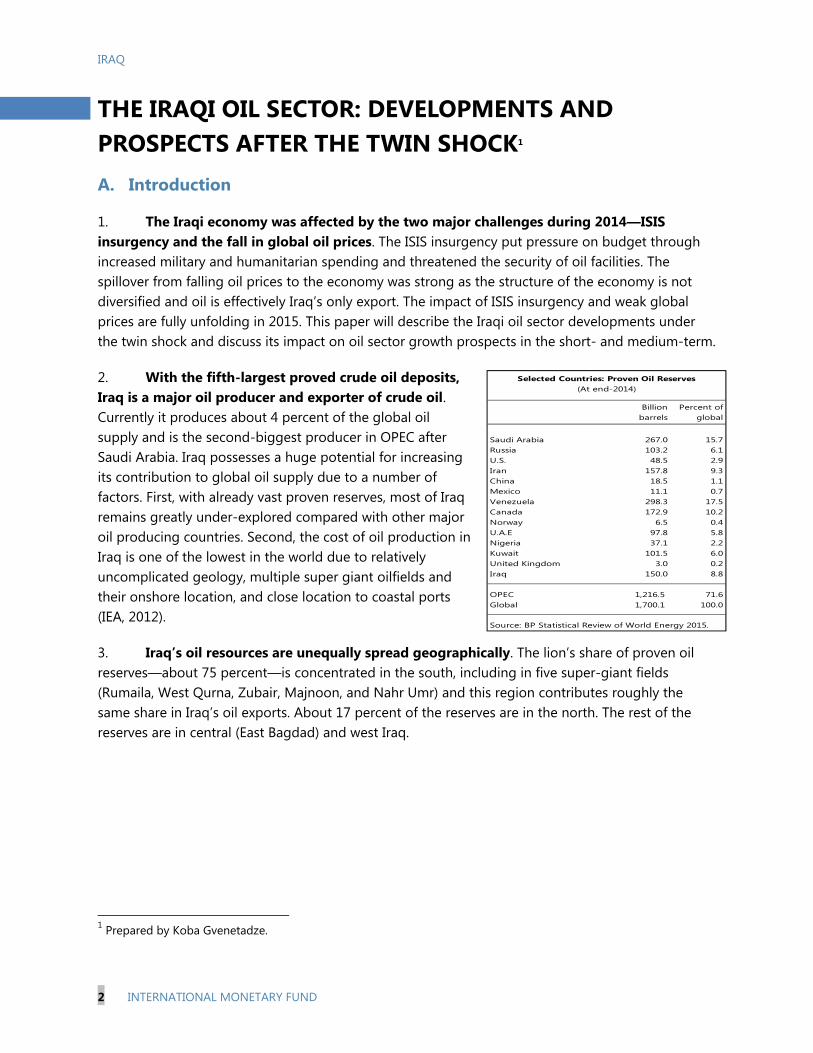
2. With the fifth-largest proved crude oil deposits, Iraq is a major oil producer and exporter of crude oil. Currently it produces about 4 percent of the global oil supply and is the second-biggest producer in OPEC after Saudi Arabia. Iraq possesses a huge potential for increasing its contribution to global oil supply due to a number of factors. First, with already vast proven reserves, most of Iraq remains greatly under-explored compared with other major oil producing countries. Second, the cost of oil production in Iraq is one of the lowest in the world due to relatively uncomplicated geology, multiple super giant oilfields and their onshore location, and close location to coastal ports (IEA, 2012).
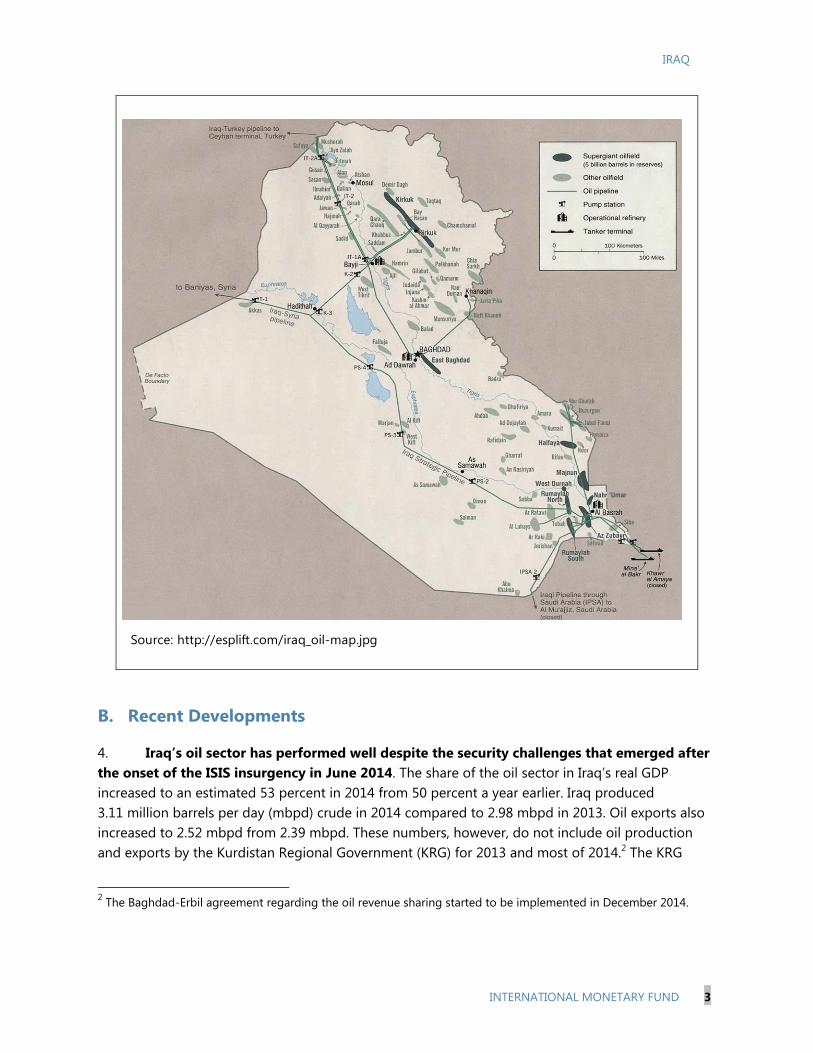
3. Iraq’s oil resources are unequally spread geographically. The lion’s share of proven oil reserves—about 75 percent—is concentrated in the south, including in five super-giant fields (Rumaila, West Qurna, Zubair, Majnoon, and Nahr Umr) and this region contributes roughly the same share in Iraq’s oil exports. About 17 percent of the reserves are in the north. The rest of the reserves are in central (East Bagdad) and west Iraq.
1 Prepared by Koba Gvenetadze.
Billion barrels
Percent of global
Saudi Arabia 267.0 15.7Russia 103.2 6.1U.S. 48.5 2.9Iran 157.8 9.3China 18.5 1.1Mexico 11.1 0.7Venezuela 298.3 17.5Canada 172.9 10.2Norway 6.5 0.4U.A.E 97.8 5.8Nigeria 37.1 2.2Kuwait 101.5 6.0United Kingdom 3.0 0.2Iraq 150.0 8.8
OPEC 1,216.5 71.6Global 1,700.1 100.0
Source: BP Statistical Review of World Energy 2015.
Selected Countries: Proven Oil Reserves(At end-2014)
IRAQ
INTERNATIONAL MONETARY FUND 3
B. Recent Developments
4. Iraq’s oil sector has performed well despite the security challenges that emerged after the onset of the ISIS insurgency in June 2014. The share of the oil sector in Iraq’s real GDP increased to an estimated 53 percent in 2014 from 50 percent a year earlier. Iraq produced 3.11 million barrels per day (mbpd) crude in 2014 compared to 2.98 mbpd in 2013. Oil exports also increased to 2.52 mbpd from 2.39 mbpd. These numbers, however, do not include oil production and exports by the Kurdistan Regional Government (KRG) for 2013 and most of 2014.2 The KRG
2 The Baghdad-Erbil agreement regarding the oil revenue sharing started to be implemented in December 2014.
Source: http://esplift.com/iraq_oil-map.jpg
IRAQ
4 INTERNATIONAL MONETARY FUND
crude oil production is estimated to have averaged 0.22 mbpd in 2013 (IEA, MTMR, 2014). For the second half of 2014, the KRG has reportedly produced 0.35 mbpd of crude oil. The KRG Ministry of Natural Resources has announced a target to achieve 1.0 mbpd oil production in 2015.
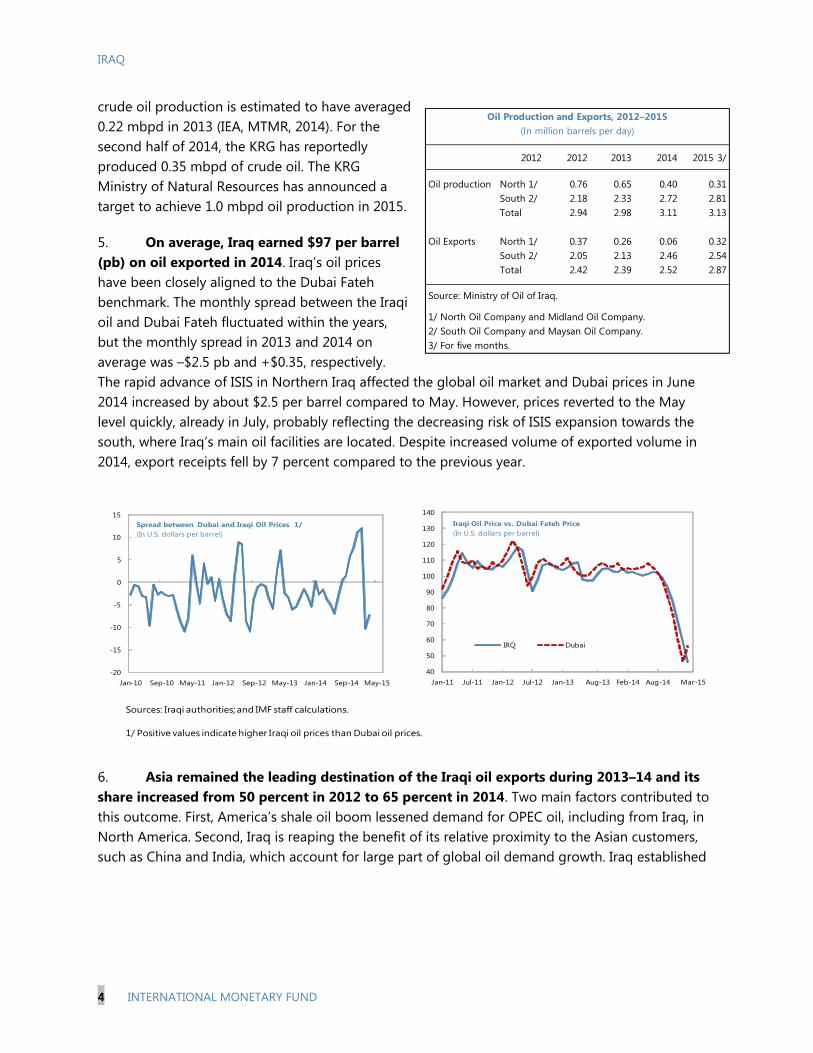
5. On average, Iraq earned $97 per barrel (pb) on oil exported in 2014. Iraq’s oil prices have been closely aligned to the Dubai Fateh benchmark. The monthly spread between the Iraqi oil and Dubai Fateh fluctuated within the years, but the monthly spread in 2013 and 2014 on average was –$2.5 pb and +$0.35, respectively. The rapid advance of ISIS in Northern Iraq affected the global oil market and Dubai prices in June 2014 increased by about $2.5 per barrel compared to May. However, prices reverted to the May level quickly, already in July, probably reflecting the decreasing risk of ISIS expansion towards the south, where Iraq’s main oil facilities are located. Despite increased volume of exported volume in 2014, export receipts fell by 7 percent compared to the previous year.
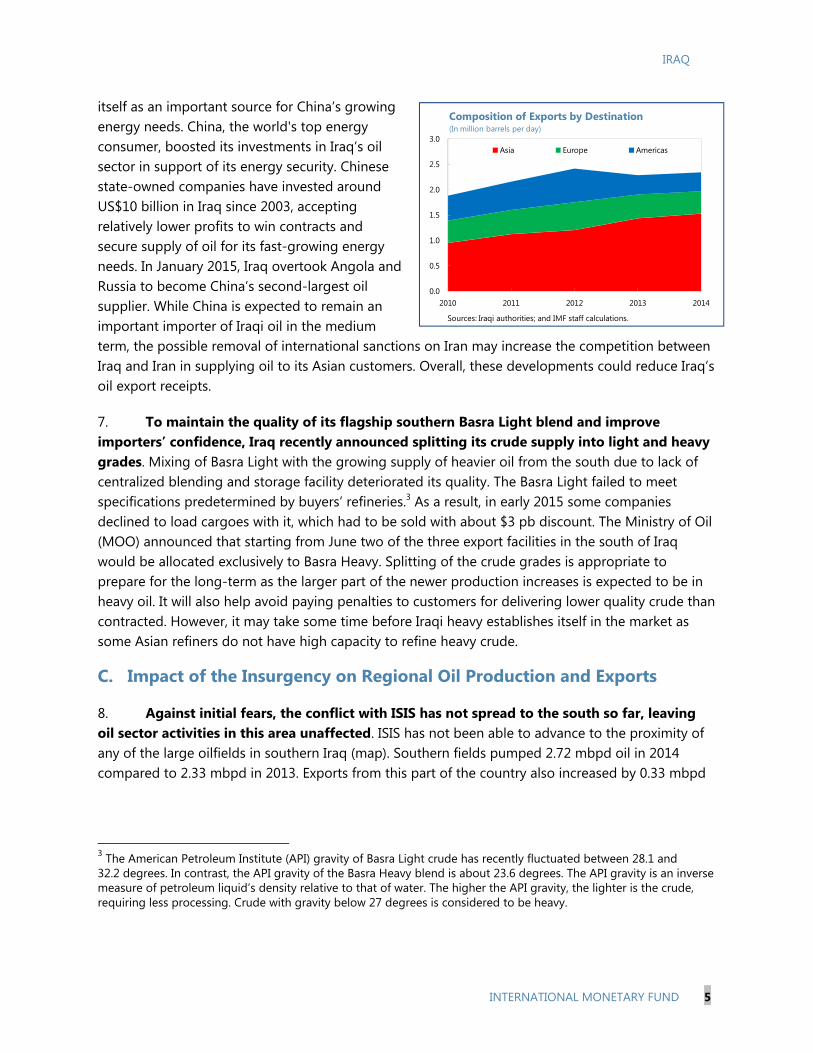
6. Asia remained the leading destination of the Iraqi oil exports during 2013–14 and its share increased from 50 percent in 2012 to 65 percent in 2014. Two main factors contributed to this outcome. First, America’s shale oil boom lessened demand for OPEC oil, including from Iraq, in North America. Second, Iraq is reaping the benefit of its relative proximity to the Asian customers, such as China and India, which account for large part of global oil demand growth. Iraq established
2012 2012 2013 2014 2015 3/
Oil production North 1/ 0.76 0.65 0.40South 2/ 2.18 2.33 2.72Total 2.94 2.98 3.11
Oil Exports North 1/ 0.37 0.26 0.06South 2/ 2.05 2.13 2.46Total 2.42 2.39 2.52
Source: Ministry of Oil of Iraq.
1/ North Oil Company and Midland Oil Company. 2/ South Oil Company and Maysan Oil Company.3/ For five months.
0.322.542.87
Oil Production and Exports, 2012–2015(In million barrels per day)
0.312.813.13
Sources: Iraqi authorities; and IMF staff calculations.
1/ Positive values indicate higher Iraqi oil prices than Dubai oil prices.
-20
-15
-10
-5
0
5
10
15
Jan-10 Sep-10 May-11 Jan-12 Sep-12 May-13 Jan-14 Sep-14 May-15
Spread between Dubai and Iraqi Oil Prices 1/ (In U.S. dollars per barrel)
40
50
60
70
80
90
100
110
120
130
140
Jan-11 Jul-11 Jan-12 Jul-12 Jan-13 Aug-13 Feb-14 Aug-14 Mar-15
IRQ Dubai
Iraqi Oil Price vs. Dubai Fateh Price(In U.S. dollars per barrel)
IRAQ
INTERNATIONAL MONETARY FUND 5
itself as an important source for China’s growing energy needs. China, the world's top energy consumer, boosted its investments in Iraq’s oil sector in support of its energy security. Chinese state-owned companies have invested around US$10 billion in Iraq since 2003, accepting relatively lower profits to win contracts and secure supply of oil for its fast-growing energy needs. In January 2015, Iraq overtook Angola and Russia to become China’s second-largest oil supplier. While China is expected to remain an important importer of Iraqi oil in the medium term, the possible removal of international sanctions on Iran may increase the competition between Iraq and Iran in supplying oil to its Asian customers. Overall, these developments could reduce Iraq’s oil export receipts.
7. To maintain the quality of its flagship southern Basra Light blend and improve importers’ confidence, Iraq recently announced splitting its crude supply into light and heavy grades. Mixing of Basra Light with the growing supply of heavier oil from the south due to lack of centralized blending and storage facility deteriorated its quality. The Basra Light failed to meet specifications predetermined by buyers’ refineries.3 As a result, in early 2015 some companies declined to load cargoes with it, which had to be sold with about $3 pb discount. The Ministry of Oil (MOO) announced that starting from June two of the three export facilities in the south of Iraq would be allocated exclusively to Basra Heavy. Splitting of the crude grades is appropriate to prepare for the long-term as the larger part of the newer production increases is expected to be in heavy oil. It will also help avoid paying penalties to customers for delivering lower quality crude than contracted. However, it may take some time before Iraqi heavy establishes itself in the market as some Asian refiners do not have high capacity to refine heavy crude.
C. Impact of the Insurgency on Regional Oil Production and Exports
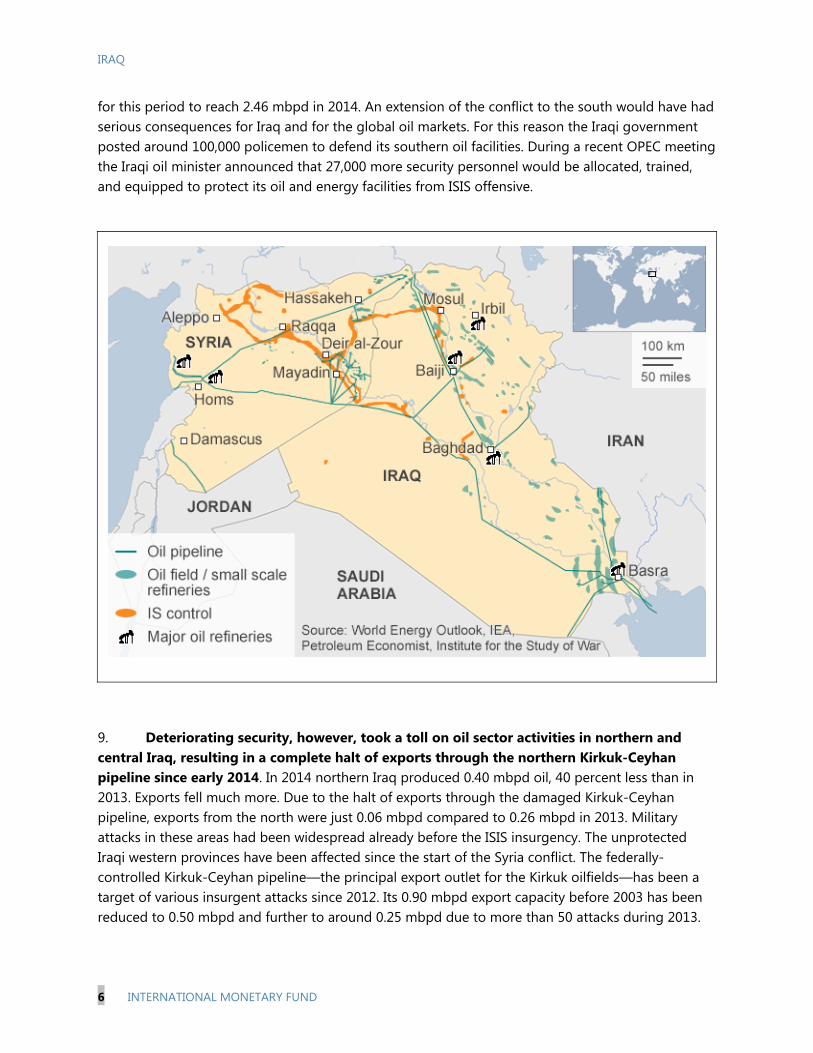
8. Against initial fears, the conflict with ISIS has not spread to the south so far, leaving oil sector activities in this area unaffected. ISIS has not been able to advance to the proximity of any of the large oilfields in southern Iraq (map). Southern fields pumped 2.72 mbpd oil in 2014 compared to 2.33 mbpd in 2013. Exports from this part of the country also increased by 0.33 mbpd
3 The American Petroleum Institute (API) gravity of Basra Light crude has recently fluctuated between 28.1 and 32.2 degrees. In contrast, the API gravity of the Basra Heavy blend is about 23.6 degrees. The API gravity is an inverse measure of petroleum liquid’s density relative to that of water. The higher the API gravity, the lighter is the crude, requiring less processing. Crude with gravity below 27 degrees is considered to be heavy.
0.0
0.5
1.0
1.5
2.0
2.5
3.0
2010 2011 2012 2013 2014
Asia Europe Americas
Sources: Iraqi authorities; and IMF staff calculations.
Composition of Exports by Destination(In million barrels per day)
IRAQ
6 INTERNATIONAL MONETARY FUND
for this period to reach 2.46 mbpd in 2014. An extension of the conflict to the south would have had serious consequences for Iraq and for the global oil markets. For this reason the Iraqi government posted around 100,000 policemen to defend its southern oil facilities. During a recent OPEC meeting the Iraqi oil minister announced that 27,000 more security personnel would be allocated, trained, and equipped to protect its oil and energy facilities from ISIS offensive.
9. Deteriorating security, however, took a toll on oil sector activities in northern and central Iraq, resulting in a complete halt of exports through the northern Kirkuk-Ceyhan pipeline since early 2014. In 2014 northern Iraq produced 0.40 mbpd oil, 40 percent less than in 2013. Exports fell much more. Due to the halt of exports through the damaged Kirkuk-Ceyhan pipeline, exports from the north were just 0.06 mbpd compared to 0.26 mbpd in 2013. Military attacks in these areas had been widespread already before the ISIS insurgency. The unprotected Iraqi western provinces have been affected since the start of the Syria conflict. The federally-controlled Kirkuk-Ceyhan pipeline—the principal export outlet for the Kirkuk oilfields—has been a target of various insurgent attacks since 2012. Its 0.90 mbpd export capacity before 2003 has been reduced to 0.50 mbpd and further to around 0.25 mbpd due to more than 50 attacks during 2013.
IRAQ
INTERNATIONAL MONETARY FUND 7
It was ultimately shut down in early March 2014 as workers could not carry out repair works due to continued violence and repeated attacks. Furthermore, ISIS occupied most of the unexplored northern territories (with the exception of Kurdistan) and western parts of Iraq, posing a threat to the exploration activities of the international oil companies’ (IOCs) in this area. Some of the IOCs working in the surrounding areas abandoned or suspended their exploration projects, delaying future development of oilfields.
10. ISIS surrounded Iraq’s Baiji refinery shortly after the start of the insurgency and it has been out of commission since then. The Baiji refinery, located about 155 miles north of Baghdad, had been contributing more than a quarter (about 0.18 mbpd) of country's entire refining capacity before the ISIS invasion. The Iraqi forces retook the refinery from ISIS militants in November, but later lost its control, regaining it again in April 2015 with the help of the U.S.-led coalition airstrikes. The battle caused a fire and severe damage to Baiji’s storage tanks. The fight for Baiji refinery continues.
11. The KRG Peshmerga forces moved into the previously federally controlled northern city of Kirkuk to fill a security vacuum after government troops fled the city due to rapid ISIS advancement. The status of ethnically diverse and oil-rich Kirkuk has been one of the thorniest topics between Baghdad and Erbil over Iraq’s disputed territories. According to the Article 140 of Iraq’s 2005 constitution, the legal status of the Kirkuk governorate should have been determined through the referendum by no later than December 31, 2007. However, the referendum never took place. The constitution also stipulated that a census had to be conducted before the referendum takes place. The KRG has effectively been controlling large parts of Kirkuk’s oilfields since mid-July. Oilfields around Kirkuk are estimated to hold about 10 billion barrels of oil. The oil produced from Kirkuk field is currently shipped through the KRG autonomous pipeline to the Turkish border in line with the Baghdad/Erbil agreement on oil-revenue sharing (see below).
12. According to some estimates, ISIS controlled only four oilfields in northern Iraq by end-2014 compared to seven fields in mid-2014. Total production capacity of these fields for this period is estimated to have fallen from about 0.08 mbpd to 0.02 mbpd. Allegedly ISIS has been using part of the produced oil for its own oil supply. Reportedly, it has created a sophisticated smuggling system to ship the rest of the produced oil on tanker trucks to small refineries in northern Iraq and sell at a major discount at the long-standing black export market via Turkey. It has also been reported that after the invasion ISIS got hold of about three million barrels of oil by draining pipelines, storage tanks, and pumping stations (IEA, OMR, October 2014). The revenues from smuggled oil are thereafter used by ISIS to pay for fighters and military commanders, and finance some public sector activities in captured territories.
IRAQ
8 INTERNATIONAL MONETARY FUND
D. The Oil Factor in Baghdad-Erbil Relations
13. Baghdad and Erbil have been in disagreement on the rights and modalities over the control and exploitation of oil reserves since the enactment of the 2005 constitution. Articles 111 and 112 of the constitution are supposed to define the control and distribution of natural resources, but they are not entirely clear and exhaustive, allowing different interpretations by each side.4 According to Baghdad, the federal government has the exclusive right to develop and export oil and sign contracts covering the Iraqi territory and the KRG is not allowed to adopt unilateral and permanent measures over the management of oil and gas fields. Erbil’s interpretation, however, is that it also is entitled to enter into contracts and export oil independently of Baghdad. A hydrocarbon law could settle the legal issues between the KRG and the federal government regarding ownership, development, sharing, and exporting of natural resources. The original hydrocarbon law, submitted to the parliament back in 2007, has not been approved due to disagreements among the various parliamentary factions. The current government, which is considered to be more inclusive in terms of sectarian representation compared to previous governments, has a better chance to accomplish this challenging task. In the absence of a national hydrocarbon law, the KRG passed its own hydrocarbon law in 2007. In April 2015 the KRG adopted the Oil and Gas Revenue Fund law which defines the principles of spending of oil revenues, including allocation to the future generation fund, and aims at improving transparency of spending.
14. The landlocked KRG has been striving to export oil independently in spite of Baghdad’s disapproval and in an attempt to achieve greater economic autonomy. Small scale independent oil exports to Turkey by trucks reportedly started at end-2012. In 2013 about 0.04 mbpd of the KRG production is estimated to have been sold to truckers at a discounted price and exported to Turkey. An estimated 0.18 mbpd was processed at local refineries and an increasing number of so-called “tea pot” refineries in the KRG and then also trucked to Turkey and Iran. In 2014 the KRG advanced work toward creating its independent network for oil exports. It upgraded existing pipelines on its territory, built a new pipeline connecting the region to Ceyhan terminal on Turkey’s Mediterranean coast, linked it to Kirkuk, and started to ship oil (an estimated 0.3 mbpd) in
4 Article 111: Oil and gas are owned by all the people of Iraq in all the regions and governorates. Article 112: First: The federal government, with the producing governorates and regional governments, shall undertake the management of oil and gas extracted from present fields, provided that it distributes its revenues in a fair manner in proportion to the population distribution in all parts of the country, specifying an allotment for a specified period for the damaged regions which were unjustly deprived of them by the former regime, and the regions that were damaged afterwards in a way that ensures balanced development in different areas of the country, and this shall be regulated by a law. Second: The federal government, with the producing regional and governorate governments, shall together formulate the necessary strategic policies to develop the oil and gas wealth in a way that achieves the highest benefit to the Iraqi people using the most advanced techniques of the market principles and encouraging investment. Source: http://www.iraqinationality.gov.iq/attach/iraqi_constitution.pdf
IRAQ
INTERNATIONAL MONETARY FUND 9
May bypassing federal government control. Truck shipments supplemented the KRG oil exports to Turkey through the export pipeline. Baghdad warned potential customers that any oil exported from Iraq outside the State Oil Marketing Organization (SOMO) would be illegal and a violation of country’s constitution. The federal government had been blocking the KRG cargoes through litigation, making it difficult for the KRG to find buyers and forcing it to sell crude at a considerable discount.
15. In February 2014 Baghdad suspended federal budget transfers to the KRG due to the standoff over revenue sharing and the legality of contracts signed by the KRG. Reflecting its share of the country’s population, the KRG had been receiving 17 percent of the federal budget revenue in exchange for an agreed level of oil production. The KRG managed to export around 0.19 mbpd oil between June and November 2014 and earned an amount equivalent to about one-third of the $8 billion in transfers suspended by the federal budget. The cut in federal transfers plunged the KRG into economic difficulties. It further strengthened the KRG’s incentive to carry on independent oil shipments.
16. Under the pressure of the ISIS insurgency and sharply falling oil prices, Baghdad and Erbil reached an oil revenue sharing agreement in December 2014. According to the deal, the KRG committed to export 0.55 mbpd oil on behalf of the federal government, including 0.30 mbpd from the Kirkuk field through the new KRG-Turkey pipeline, and 0.25 mbpd from the new fields of the core KRG territory. All exports have to be marketed by SOMO. In return, the federal government resumed fiscal transfers to the cash-constrained KRG. Kurdish exports through the northern corridor boosted Iraq’s overall production, exports, and more importantly, revenues for the federal government to battle ISIS. The financially stronger KRG also became better-positioned to continue fighting ISIS in the north. Apart from the positive financial impact, the agreement was a landmark achievement that demonstrated Erbil’s and Baghdad’s collaboration and commitment to fight ISIS.
17. While the agreement has been working relatively well, some problems have been reported in June. In particular, the KRG announced that it had to increase direct sales to repay the debt accumulated in 2014 because of in advance oil sales, but it still remained committed to the 2015 federal Budget Law.5 Adhering to the preliminary agreement on oil revenue sharing and ultimately reaching a long-standing solution will be beneficial for both Baghdad and Erbil.
5 Monthly Export Report, June 2015, Kurdistan Regional Government.
IRAQ
10 INTERNATIONAL MONETARY FUND
E. Renegotiation of Contracts
18. Falling oil prices have triggered the renegotiation of existing oilfield development contracts by the federal government. Mirroring different interpretations of power distribution embedded in the 2005 constitution, the Iraqi federal government and the KRG have employed different contractual systems for upstream oil sector development.
19. Starting 2009 the federal government has been awarding so-called Technical Service Contracts (TSCs) to the IOCs. Under the Iraqi TSC, the IOCs don’t have a share in production; instead the government reimburses IOCs for the cost of oil production (including investment expenses) and pays a flat fee per-barrel (US$1–5, depending on contracts). While the TSCs gave relatively low profit margins to the IOCs, the guaranteed and quick cost recovery provided solid incentives for them to stay in business. The TSCs were lucrative for the government when oil prices were high, but they became less attractive with falling oil prices as revenues from oil exports plummeted and payment obligations to the IOCs remained high. To reduce the burden of the investment payments, the MOO has asked the IOCs working in the southern fields to cut down development plans and lower oilfields’ development budgets. Production peaks have been adjusted downwards in five out of twelve contracts and the decisions for the rest of the contracts are pending. The MOO has requested to renegotiate the contracts and proposed to link the flat per barrel fees to oil prices but lock the resultant fees into the pre-determined corridor. However, the companies have so far not accepted this proposal.
20. Aiming to attract further interest in its hydrocarbon sector and promote economic development, the KRG created a more open contractual system. In spite of Baghdad’s opposition, it has reportedly entered into dozens of Production Sharing Contracts (PSC) with a number of international companies, giving them an equity stake in discovered oilfields. Development of northern oilfields brought lucrative signing bonuses and revenues. Oil development projects also attracted foreign investments and created tertiary-sector employment. However, continued objections from the federal government and existing uncertainty over the constitutionality of oil deals with the KRG have slowed down development of the region’s oil and gas resources. Apart from questioning the legality of KRG’s awarded contracts, Baghdad has been asking for increased transparency and accountability of the KRG contracts.
F. Oil Sector Expansion Plans Under Revision
21. The Iraqi government set an ambitious target to increase oil production capacity to over 13 mbpd when it signed service contracts with major IOCs during 2009–10.6 While recognizing Iraq’s huge potential for oil production growth capacity, oil markets analysts were doubtful that this target could be met. In fact, production targets have been officially revised
6 IEA 2012 report on Iraq assumed oil production of 4.2 mbpd by 2015, 6.1 mbpd by 2020, and 8.3 mbpd by 2035 as a Central Scenario.
IRAQ
INTERNATIONAL MONETARY FUND 11
downwards substantially since then. The baseline scenario of Iraq’s 2013 National Energy Strategy targeted oil production to increase from 4.5 mbpd in 2014 to 9 mbpd by 2020 (IEA, OMR, May 2015). The government’s latest targets for oil production and oil export are 7 mbpd, and 6 mbpd, respectively, by 2020.
22. It is unlikely that the government will meet the production (3.8 mbpd) and export (3.3 mbpd) targets set in the approved 2015 budget. Based on average actual oil production (3.13 mbpd) and export (2.87 mbpd) for the first five months, production and exports for the remainder of the year should average 4.28 mbpd and 3.61 mbpd, respectively, to meet these targets. (In 2014 production averaged 3.11 mbpd and exports averaged 2.52 mbpd). Northern exports averaged 0.32 mbpd during the same period and they should average 0.71 mbpd for the remainder of the year to reach an average 0.55 mbpd in 2014 set in Baghdad/Erbil agreement. Achieving these levels will be extremely difficult, if not impossible, task despite continued growth in oil production and exports.
23. A number of factors will impact Iraq’s medium-term oil sector expansion plans.
Conflict with ISIS. While the government is slowly retaking ISIS-controlled territory, the fight against ISIS could be protracted. Fear of continuation or outbreak of new hostilities could suspend implementation of the next phases of some of the existing projects or deter IOCs from starting new projects.
Extended period of lower oil prices. Pressure from the sharp drop in oil prices was already felt in 2014. Because of lower-than budgeted oil prices the government has been delaying payments to the IOCs which reduced their profit margin. IOCs have also lowered their investment plans at the request of the MOO. Apart from the developments in Iraq, currently the IOCs are generally less inclined to invest in oil projects due to the weaker profitability prospects.
Limitations of Technical Service Contracts. IOCs will be assessing the profitability of further investments in Iraq versus investment opportunities in other locations, where their profit is not constrained by fee-per-barrel based TSCs.
Insufficient storage facilities. Up until February 2015, the Basra terminal had 9.5 million oil storage capacity, enough to store production of just seven days during bad weather when oil cannot be shipped. Three newly opened storage tanks increased the storage capacity to 10.5 million and completion of another 4–5 million barrels storages capacity is planned by end 2015. This should help deal with halting oil production caused by bad weather. New ramping stations are also necessary to increase export potential.
Insufficient pipeline capacity. Iraq’s southern export capacity increased with the addition of a three Single Point Moorings (offshore oil loading system) to export crude oil via the Gulf. However, these are not enough to keep up with increasing southern export capacities. Iraq’s plan to ramp up production and diversify oil export routes through a 1 mbpd, 1,050 mile long
IRAQ
12 INTERNATIONAL MONETARY FUND
pipeline from its southern oilfields to the Jordanian port of Aqaba will most likely be delayed because of security concerns and lack of financial resources.
Water and gas injection. Iraq has to reduce gas flaring and develop new gas fields to meet its oil production targets. Injection of gas or water is necessary to increase oil recovery rates. About 10 to 12 bbl/d seawater is needed to maintain oil reservoir pressure and keep up production from its fields in the south. The start of the Common Seawater Supply Project (CSSP), which should provide treated seawater from the Gulf to oilfields in southern Iraq through pipelines, has been postponed several times. In February 2015 it was announced that the American company Parsons has been awarded a front-end engineering design deal for CSSP.
Cumbersome bureaucratic procedures. Many IOCs voiced concerns over the inefficient and slow procedures for approval of field development plans and signing off on contracts to advance projects. Focusing on the fight with ISIS could delay the approval of new oil plans. Procedures for visa issuance for expatriate workers and customs clearing of equipment have also been criticized. The MOO acknowledged these shortcomings and in response prepared a decree on “Facilitation and Simplification of Procedures in Oil Projects Execution” that was approved by the cabinet in March 2015.
24. Market observers have been revising downward Iraq’s medium-term oil production forecast taking into account these factors.
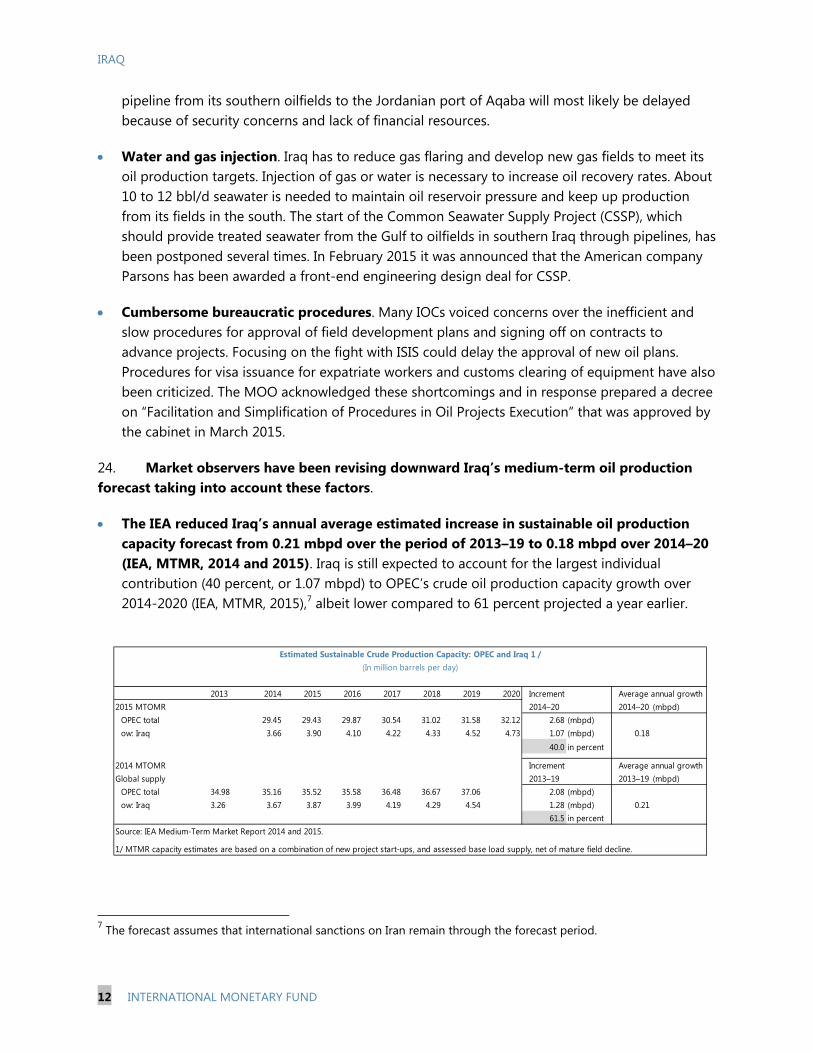
The IEA reduced Iraq’s annual average estimated increase in sustainable oil production capacity forecast from 0.21 mbpd over the period of 2013–19 to 0.18 mbpd over 2014–20 (IEA, MTMR, 2014 and 2015). Iraq is still expected to account for the largest individual contribution (40 percent, or 1.07 mbpd) to OPEC’s crude oil production capacity growth over 2014-2020 (IEA, MTMR, 2015),7 albeit lower compared to 61 percent projected a year earlier.
7 The forecast assumes that international sanctions on Iran remain through the forecast period.
2013 2014 2015 2016 2017 2018 2019 2020 Increment Average annual growth2015 MTOMR 2014–20 2014–20 (mbpd)
OPEC total 29.45 29.43 29.87 30.54 31.02 31.58 32.12 2.68 (mbpd)ow: Iraq 3.66 3.90 4.10 4.22 4.33 4.52 4.73 1.07 (mbpd) 0.18
40.0 in percent
2014 MTOMR Increment Average annual growthGlobal supply 2013–19 2013–19 (mbpd)
OPEC total 34.98 35.16 35.52 35.58 36.48 36.67 37.06 2.08 (mbpd)ow: Iraq 3.26 3.67 3.87 3.99 4.19 4.29 4.54 1.28 (mbpd) 0.21
61.5 in percent Source: IEA Medium-Term Market Report 2014 and 2015.
1/ MTMR capacity estimates are based on a combination of new project start-ups, and assessed base load supply, net of mature field decline.
Estimated Sustainable Crude Production Capacity: OPEC and Iraq 1 /(In million barrels per day)
IRAQ
INTERNATIONAL MONETARY FUND 13
BMI Research also forecasts that the current challenges will negatively impact longer-term investment in expansion of oil projects in Iraq. It revised down Iraq’s oil production forecast in 2015 from 3.7 to 3.5 mbpd. The main factors behind the downward revision were a lack of oil export growth from the southern fields and limited (0.100 mbpd) additional oil from the KRG during 2015. BMI projects 0.5 percent and 1.4 percent production increase in 2016 and 2017, respectively, mainly on account of the existing projects reaching their peak capacity.
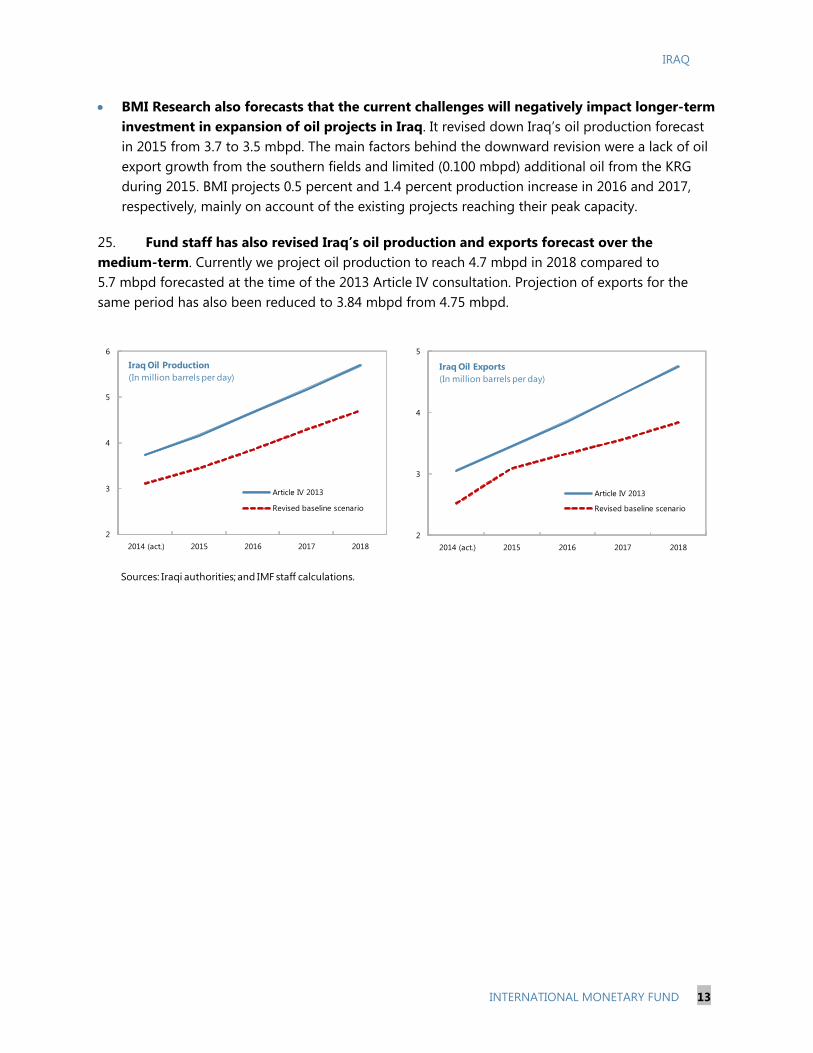
25. Fund staff has also revised Iraq’s oil production and exports forecast over the medium-term. Currently we project oil production to reach 4.7 mbpd in 2018 compared to 5.7 mbpd forecasted at the time of the 2013 Article IV consultation. Projection of exports for the same period has also been reduced to 3.84 mbpd from 4.75 mbpd.
Sources: Iraqi authorities; and IMF staff calculations.
2
3
4
5
6
2014 (act.) 2015 2016 2017 2018
Iraq Oil Production(In million barrels per day)
Article IV 2013
Revised baseline scenario
2
3
4
5
2014 (act.) 2015 2016 2017 2018
Iraq Oil Exports (In million barrels per day)
Article IV 2013
Revised baseline scenario
IRAQ
14 INTERNATIONAL MONETARY FUND
References
BMI Research, (A Fitch Group Company), 2015, “Iraq: Industry Trend Analysis—Oil Production Growth to Struggle,” (April).
International Energy Agency (IEA), 2012, “Iraq Energy Outlook”
———, 2014a, Medium-Term Market Report (MTMR), “Market Analysis and Forecasts to 2019”
———, 2014b, Oil Market Report.
———, 2015a, Medium-Term Market Report (MTMR), “Market Analysis and Forecasts to 2020”
———, 2015b, Oil Market Report (OMR)
Kurdistan Regional Government, 2015, Monthly Export Report
IRAQ
INTERNATIONAL MONETARY FUND 15
FOOD AND ELECTRICITY SUBSIDIES IN IRAQ1 This note focuses on food and electricity subsidies in Iraq. Together with subsidies on fuels, they make up for the bulk of subsidies, for a total subsidy cost at least about 9 percent of GDP (2014), of which 1.8 percent from food, 3.4 percent on electricity, and 3.6 percent on fuels according to staff estimates. These figures may actually be conservative—according to the authorities, energy subsidy alone accounts for about 13 percent of GDP.2 The note reviews how the food and electricity subsidy systems work, and presents some suggestions on reform, together with quantified reform scenarios. While it is difficult to plan subsidy reform in Iraq under the current challenging circumstances, the fiscal pressures from the conflict and the decline in oil prices may actually mobilize support for reform, especially with effective communication about the trade-offs between reducing subsidies and cutting other, more necessary government expenses or increasing non-oil taxation. In addition, the conflict with ISIS is undermining the distribution of in-kind food subsidies through the Public Distribution System, the main food vehicle, and may therefore accelerate reform towards more efficient social safety nets such as cash transfers. Explicit recording of subsidies on the government budget as a line item would improve transparency and facilitate reform.
A. Food Subsidies: The Public Distribution System (PDS)
Current Structure, Institutional Setup and Key Issues
1. The main food subsidy mechanism in Iraq is the Public Distribution System (PDS).3 The PDS is a ration card system through which the government provides a list of subsidized food commodities to the vast majority of the population, benefiting over seven million Iraqi households. The ration card covers disbursed quantities for a number of commodities: wheat flour (nine kilograms/card/person/month), rice (three kilograms), sugar (two kilograms), vegetable oil (one liter), and children’s milk (three packs; 450 grams each). The government’s General Company for Trade in Grains is in charge of ensuring adequate provision of food commodities to beneficiaries. The government purchases local crops from farmers after each season at administered prices, and sells them to beneficiaries through the ration cards at subsidized prices. Locally administered prices are determined by the Ministry of Agriculture and Cabinet, with the cost accounting maintained by the Ministry of Trade. Quantities imported are determined by the shortfall between the volumes needed for the PDS basket and local production. The system makes use of silos and warehouses to maintain inventories.
1 Prepared by Amgad Hegazy. 2 See analysis below for food and electricity, and MCD subsidy study for fuels (based on the price-gap approach). The full cost of fuel subsidies along the entire chain for the sector—apart from the direct product subsidy—is more difficult to measure given lack of accurate information on a product by product basis. 3 The conflict with ISIS is affecting the PDS by limiting coverage in the conflict-affected areas and restricting the variety of food stuffs provided under the scheme. The description of the PDS in this section is mostly based on the pre-conflict set-up.
IRAQ
16 INTERNATIONAL MONETARY FUND
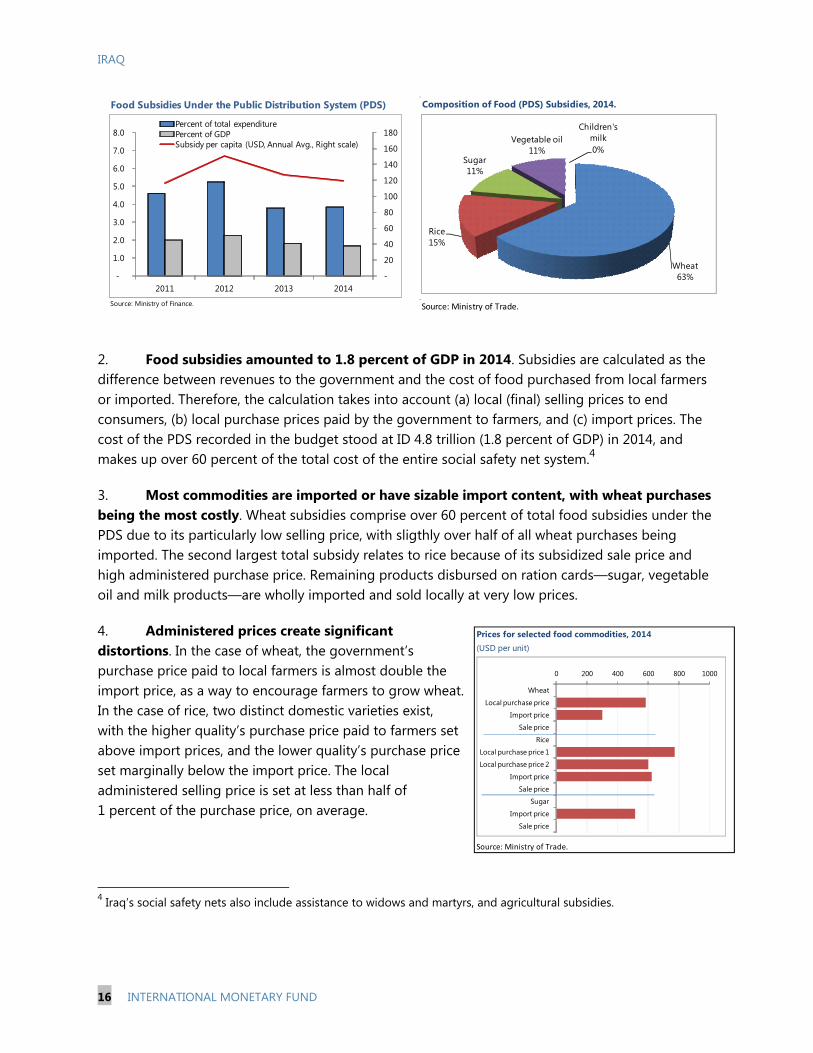
2. Food subsidies amounted to 1.8 percent of GDP in 2014. Subsidies are calculated as the difference between revenues to the government and the cost of food purchased from local farmers or imported. Therefore, the calculation takes into account (a) local (final) selling prices to end consumers, (b) local purchase prices paid by the government to farmers, and (c) import prices. The cost of the PDS recorded in the budget stood at ID 4.8 trillion (1.8 percent of GDP) in 2014, and makes up over 60 percent of the total cost of the entire social safety net system.4
3. Most commodities are imported or have sizable import content, with wheat purchases being the most costly. Wheat subsidies comprise over 60 percent of total food subsidies under the PDS due to its particularly low selling price, with sligthly over half of all wheat purchases being imported. The second largest total subsidy relates to rice because of its subsidized sale price and high administered purchase price. Remaining products disbursed on ration cards—sugar, vegetable oil and milk products—are wholly imported and sold locally at very low prices.
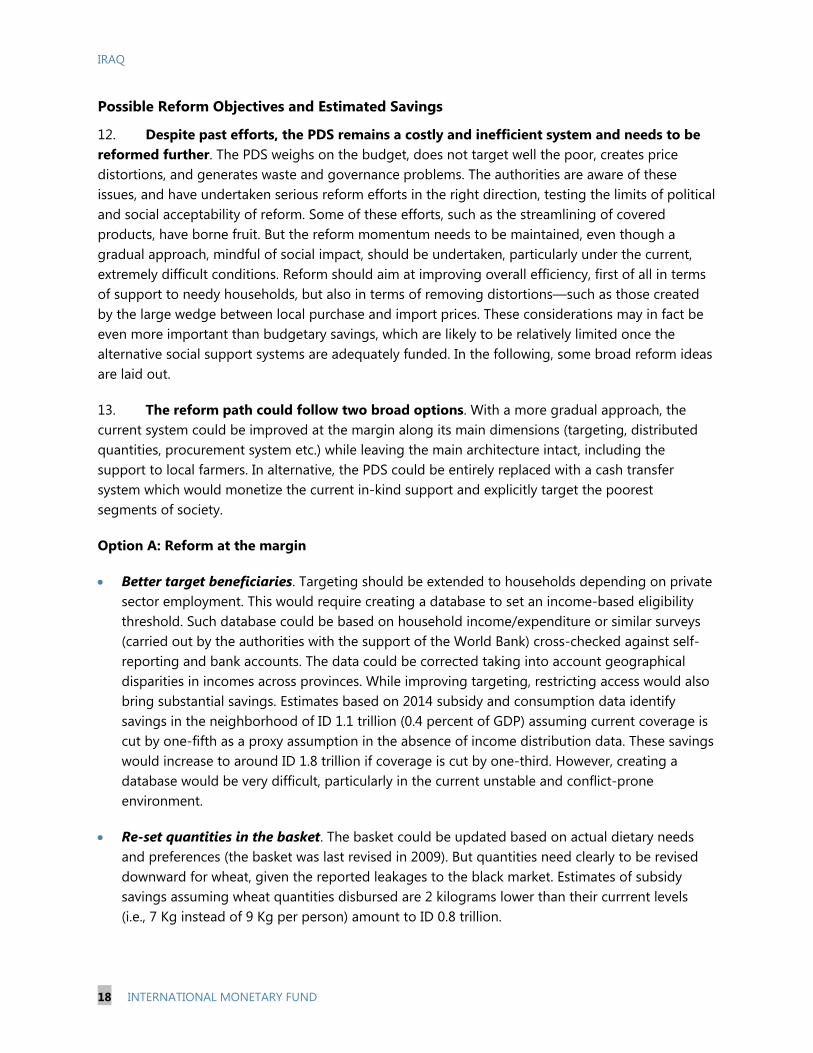
4. Administered prices create significant distortions. In the case of wheat, the government’s purchase price paid to local farmers is almost double the import price, as a way to encourage farmers to grow wheat. In the case of rice, two distinct domestic varieties exist, with the higher quality’s purchase price paid to farmers set above import prices, and the lower quality’s purchase price set marginally below the import price. The local administered selling price is set at less than half of 1 percent of the purchase price, on average.
4 Iraq’s social safety nets also include assistance to widows and martyrs, and agricultural subsidies.
Composition of Food (PDS) Subsidies, 2014.
Source: Ministry of Trade.
Wheat63%
Rice15%
Sugar11%
Vegetable oil11%
Children's milk0%
Food Subsidies Under the Public Distribution System (PDS)
Source: Ministry of Finance.
-
20
40
60
80
100
120
140
160
180
-
1.0
2.0
3.0
4.0
5.0
6.0
7.0
8.0
2011 2012 2013 2014
Percent of total expenditurePercent of GDPSubsidy per capita (USD, Annual Avg., Right scale)
Prices for selected food commodities, 2014 (USD per unit)
Source: Ministry of Trade.
0 200 400 600 800 1000
Wheat
Local purchase price
Import price
Sale price
Rice
Local purchase price 1
Local purchase price 2
Import price
Sale price
Sugar
Import price
Sale price
IRAQ
INTERNATIONAL MONETARY FUND 17
5. The administrative costs of the PDS are relatively low. Administrative costs in 2014 (defined as all costs except purchase costs) were ID 697 billion, or 0.3 percent of GDP. This amount is about 13 percent of the total PDS cost. Costs related to transportation and wages comprise over 60 percent of total administrative costs.
6. Subsidized wheat flour quantities exceed consumer needs. Wheat flour quantities disbursed on ration cards are reportedly higher than typical household consumption (which according to some estimates would amount at 6–7 kilos compared to 9 kilos of the allocation). Excess subsidized quantities reportedly find their way to the black market where they are resold at a profit margin.
7. The timing of import procurement is inefficient. Food import needs to cover part of the disbursed quantities through the PDS take place when the need arises. As such, import costs—and hence, the subsidy burden—are affected by exogenous factors, such as a surge in demand by other, price-making globally important players (e.g., Egypt and Brazil in the case of the wheat market).
8. Targeting of beneficiaries has been improved for public employees, but not for private sector employees. In recent years, the government made an effort to improve PDS targeting by excluding public sector employees with a monthly income of ID 1.5 million ($1286) or higher. This income threshold was possible to determine given that public workers’ payrolls are known and could be easily differentiated and identified based on income. However, this approach could not be applied to private sector beneficiaries—who comprise around 50 percent of total labor force—given the lack of information on their salary structures.
9. The government made other attempts to reform the PDS in the past, but the most radical changes faced difficulties. The government streamlined the list of subsidized commodities in mid-2009, de facto eliminating subsidies on tea, beans, soap, detergents, and adults’ milk, which where all available on ration cards prior to that time. However, more ambitious attempts to replace the PDS with a cash transfer system in 2012–13 led to widespread demonstrations, and the government had to backtrack, leaving the in-kind nature of the system unchanged.
10. Governance issues have historically affected the distribution of commodities. In Iraq, as in other countries with similar schemes, the cumbersome structure of the in-kind subsidy system appears to have generated governance issues. Several former officials were charged with corruption and embezzlement related to food imports (May 2009). In addition, observers have attributed the reported delays in commodities reaching distribution outlets (by up to more than one month at a time) to poor management and corruption along the delivery channel.
11. The ISIS insurgency since mid-2014 is undermining the coverage of the PDS. The intensification of the conflict with ISIS has negatively affected the coverage of the distribution system, impacting the disbursement of some products to eligible households in areas under ISIS control. ISIS’ smuggling and abuse of the system has also been reported.
IRAQ
18 INTERNATIONAL MONETARY FUND
Possible Reform Objectives and Estimated Savings 12. Despite past efforts, the PDS remains a costly and inefficient system and needs to be reformed further. The PDS weighs on the budget, does not target well the poor, creates price distortions, and generates waste and governance problems. The authorities are aware of these issues, and have undertaken serious reform efforts in the right direction, testing the limits of political and social acceptability of reform. Some of these efforts, such as the streamlining of covered products, have borne fruit. But the reform momentum needs to be maintained, even though a gradual approach, mindful of social impact, should be undertaken, particularly under the current, extremely difficult conditions. Reform should aim at improving overall efficiency, first of all in terms of support to needy households, but also in terms of removing distortions—such as those created by the large wedge between local purchase and import prices. These considerations may in fact be even more important than budgetary savings, which are likely to be relatively limited once the alternative social support systems are adequately funded. In the following, some broad reform ideas are laid out.
13. The reform path could follow two broad options. With a more gradual approach, the current system could be improved at the margin along its main dimensions (targeting, distributed quantities, procurement system etc.) while leaving the main architecture intact, including the support to local farmers. In alternative, the PDS could be entirely replaced with a cash transfer system which would monetize the current in-kind support and explicitly target the poorest segments of society.
Option A: Reform at the margin
Better target beneficiaries. Targeting should be extended to households depending on private sector employment. This would require creating a database to set an income-based eligibility threshold. Such database could be based on household income/expenditure or similar surveys (carried out by the authorities with the support of the World Bank) cross-checked against self-reporting and bank accounts. The data could be corrected taking into account geographical disparities in incomes across provinces. While improving targeting, restricting access would also bring substantial savings. Estimates based on 2014 subsidy and consumption data identify savings in the neighborhood of ID 1.1 trillion (0.4 percent of GDP) assuming current coverage is cut by one-fifth as a proxy assumption in the absence of income distribution data. These savings would increase to around ID 1.8 trillion if coverage is cut by one-third. However, creating a database would be very difficult, particularly in the current unstable and conflict-prone environment.
Re-set quantities in the basket. The basket could be updated based on actual dietary needs and preferences (the basket was last revised in 2009). But quantities need clearly to be revised downward for wheat, given the reported leakages to the black market. Estimates of subsidy savings assuming wheat quantities disbursed are 2 kilograms lower than their currrent levels (i.e., 7 Kg instead of 9 Kg per person) amount to ID 0.8 trillion.
IRAQ
INTERNATIONAL MONETARY FUND 19
Lower government purchase price of wheat, link it to import cost, and partially compensate farmers. The government’s policy of supporting farmers can be still pursued even if prices are lowered, which would bring substantial savings. For example, capping wheat purchase price at 25 percent above import prices (instead of being set at double the import price as at present) would yield ID 0.8 trillion in estimated subsidy savings. The price should also be linked to movements in international prices. As partial compensation, the government can assist farmers through other means, including from the rollout of a system of government discounts on seeds, fertilizers, cultivating machinery, or similar measures.
Improve import procurement methods, particularly with regard to timing. By relying on a risk-based system that better manages the interplay between local harvest times, consumption patterns, stocks of commodity inventories and a closer monitoring of international food prices, the government would be in better position to avoid peak purchase times created by market price makers. This is particularly important for wheat due to its high import content.
Strengthen governance to improve PDS distribution. Better institutional governance and accountability along the chain (from borders, to inventories/silos, to transportation, to delivery and finally at the outlet stage) through improved controls over, and monitoring of, the delivery of subsidized commodities at each stage of the process, is needed. This would necessitate a more prudent system of checks and balances at every stage of the distribution process, with clear roles and accountability frameworks, supported by stepped-up coordination among various authorities (e.g., between the Ministry of Trade, Customs Authority, Ministry of Interior).
Option B: Replace PDS with a cash transfer system
Moving to a cash transfer system would improve efficiency and could drastically reduce governance issues. With the PDS mechanisms indirectly undermined by the ISIS insurgency, a cash transfer system may also become the only viable approach. At the same time, a proposal to transform the PDS into a cash transfer system would also likely increase resistance to reform from farmers and vested interests. Furthermore, it would require setting up an adequate targeting system to avoid a quasi-universal transfer approach. Cross-country experience of a well-planned and gradual phasing out of in-kind subsidies in favor of cash transfers is encouraging. Iran’s experience, while focused on energy, is a case in point that could be applied to food subsidy reform in Iraq. In 2010, Iran envisaged migration to cash transfers through a gradual, five-year plan to eliminate subsidies on energy products and replace them with unconditional cash transfers to the entire population. Revenue from price increases on fuel, electricity, and gas were redistributed among population segments and sectors. In the initial phases (2011), the government cash transfer handouts were reported to be $40 a month per individual applicable to 90 percent of the population. A fraction of the revenue was also earmarked for assistance to affected industry sectors.
IRAQ
20 INTERNATIONAL MONETARY FUND
14. A communication and consultation strategy can support the reform of the PDS. In advance of reform initiatives, beneficiaries should be brought on board by consulting them on the strategic choice between food rations and cash transfers. Reform implementation should also be supported by a communication campaign that would point to the advantages of change and the compensating measures to alleviate the impact of the reform (including for local farmers).
15. The government should introduce mitigating measures, where needed, and strengthen social safety nets. A successful reform of the PDS should improve support to the poor. However, the poorest segments may be negatively affected if the introduction of an adequate social safety net (e.g., a cash transfer system replacing the PDS) is delayed compared to the elimination of the in-kind subsidies. The government is implementing a Social Protection Strategic Framework with the support of the World Bank, which is also intended to mitigate the effects of subsidy reform.
B. Electricity Subsidies
Current Structure, Institutional Setup and Key Issues
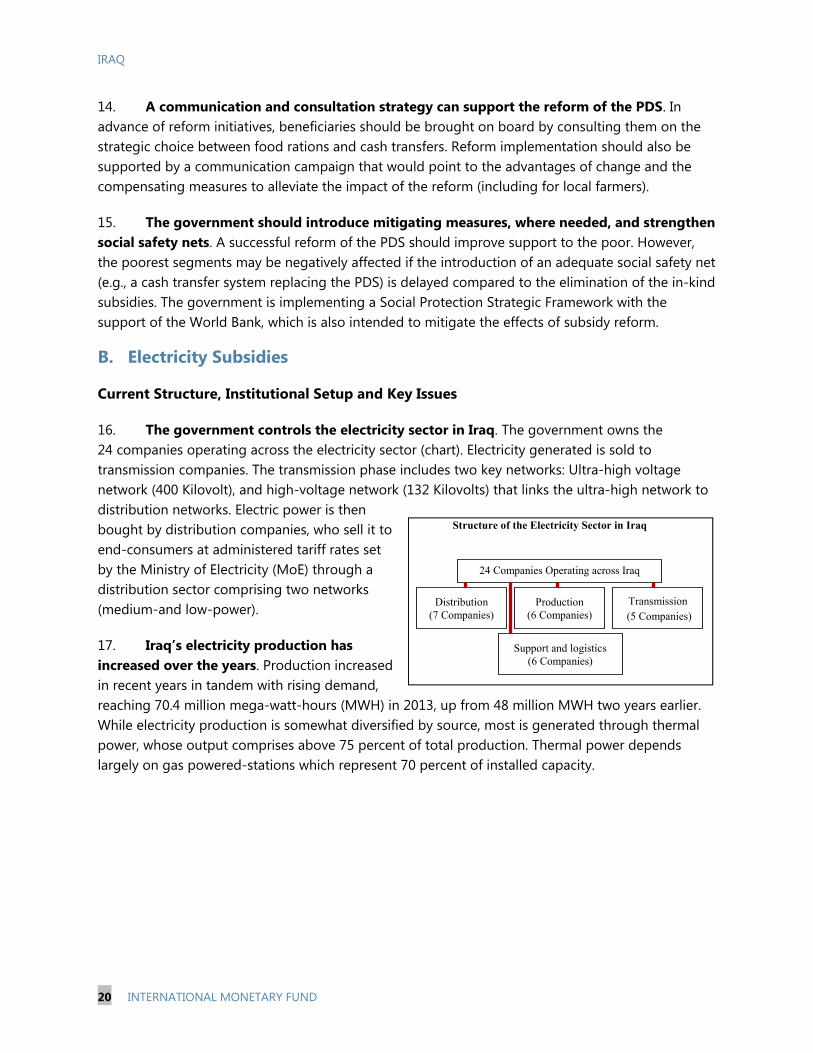
16. The government controls the electricity sector in Iraq. The government owns the 24 companies operating across the electricity sector (chart). Electricity generated is sold to transmission companies. The transmission phase includes two key networks: Ultra-high voltage network (400 Kilovolt), and high-voltage network (132 Kilovolts) that links the ultra-high network to distribution networks. Electric power is then bought by distribution companies, who sell it to end-consumers at administered tariff rates set by the Ministry of Electricity (MoE) through a distribution sector comprising two networks (medium-and low-power).
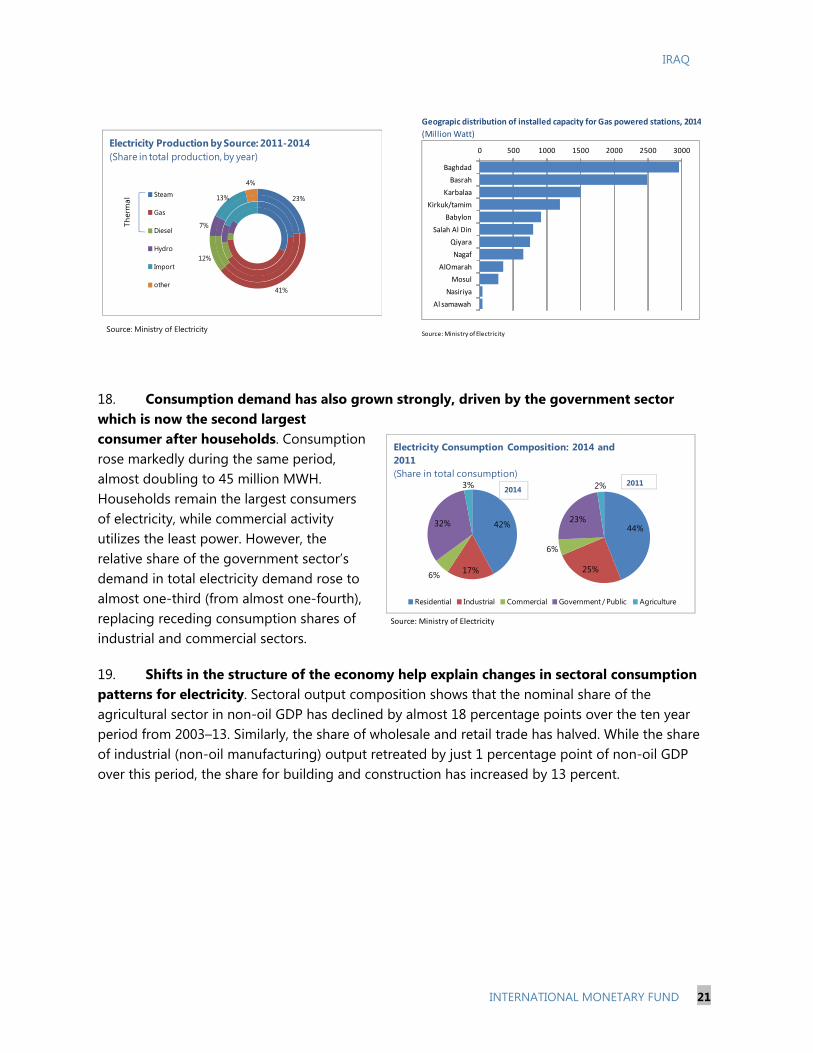
17. Iraq’s electricity production has increased over the years. Production increased in recent years in tandem with rising demand, reaching 70.4 million mega-watt-hours (MWH) in 2013, up from 48 million MWH two years earlier. While electricity production is somewhat diversified by source, most is generated through thermal power, whose output comprises above 75 percent of total production. Thermal power depends largely on gas powered-stations which represent 70 percent of installed capacity.
Structure of the Electricity Sector in Iraq
24 Companies Operating across Iraq
Production (6 Companies)
Distribution (7 Companies)
Support and logistics (6 Companies)
Transmission (5 Companies)
IRAQ
INTERNATIONAL MONETARY FUND 21
Source: Ministry of Electricity
18. Consumption demand has also grown strongly, driven by the government sector which is now the second largest consumer after households. Consumption rose markedly during the same period, almost doubling to 45 million MWH. Households remain the largest consumers of electricity, while commercial activity utilizes the least power. However, the relative share of the government sector’s demand in total electricity demand rose to almost one-third (from almost one-fourth), replacing receding consumption shares of industrial and commercial sectors.
19. Shifts in the structure of the economy help explain changes in sectoral consumption patterns for electricity. Sectoral output composition shows that the nominal share of the agricultural sector in non-oil GDP has declined by almost 18 percentage points over the ten year period from 2003–13. Similarly, the share of wholesale and retail trade has halved. While the share of industrial (non-oil manufacturing) output retreated by just 1 percentage point of non-oil GDP over this period, the share for building and construction has increased by 13 percent.
23%
41%
12%
7%
13%
4%
Electricity Production by Source: 2011-2014 (Share in total production, by year)
Steam
Gas
Diesel
Hydro
Import
other
Ther
mal
Geograpic distribution of installed capacity for Gas powered stations, 2014
(Million Watt)
Source: Ministry of Electricity
0 500 1000 1500 2000 2500 3000
Baghdad
Basrah
Karbalaa
Kirkuk/tamim
Babylon
Salah Al Din
Qiyara
Nagaf
AlOmarah
Mosul
Nasiriya
Al samawah
Source: Ministry of Electricity
42%
17%6%
32%
3%
Electricity Consumption Composition: 2014 and 2011 (Share in total consumption)
Residential Industrial Commercial Government / Public Agriculture
44%
25%
6%
23%
2%20142011
IRAQ
22 INTERNATIONAL MONETARY FUND
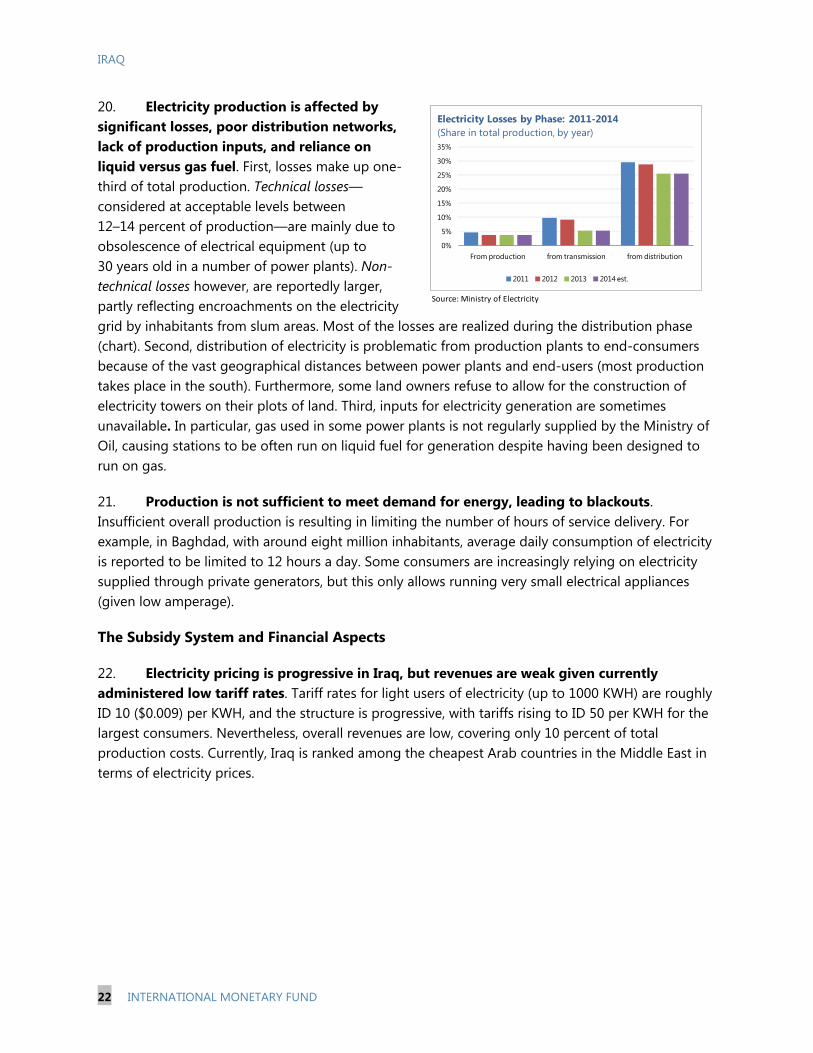
20. Electricity production is affected by significant losses, poor distribution networks, lack of production inputs, and reliance on liquid versus gas fuel. First, losses make up one-third of total production. Technical losses—considered at acceptable levels between 12–14 percent of production—are mainly due to obsolescence of electrical equipment (up to 30 years old in a number of power plants). Non-technical losses however, are reportedly larger, partly reflecting encroachments on the electricity grid by inhabitants from slum areas. Most of the losses are realized during the distribution phase (chart). Second, distribution of electricity is problematic from production plants to end-consumers because of the vast geographical distances between power plants and end-users (most production takes place in the south). Furthermore, some land owners refuse to allow for the construction of electricity towers on their plots of land. Third, inputs for electricity generation are sometimes unavailable. In particular, gas used in some power plants is not regularly supplied by the Ministry of Oil, causing stations to be often run on liquid fuel for generation despite having been designed to run on gas.
21. Production is not sufficient to meet demand for energy, leading to blackouts. Insufficient overall production is resulting in limiting the number of hours of service delivery. For example, in Baghdad, with around eight million inhabitants, average daily consumption of electricity is reported to be limited to 12 hours a day. Some consumers are increasingly relying on electricity supplied through private generators, but this only allows running very small electrical appliances (given low amperage).
The Subsidy System and Financial Aspects
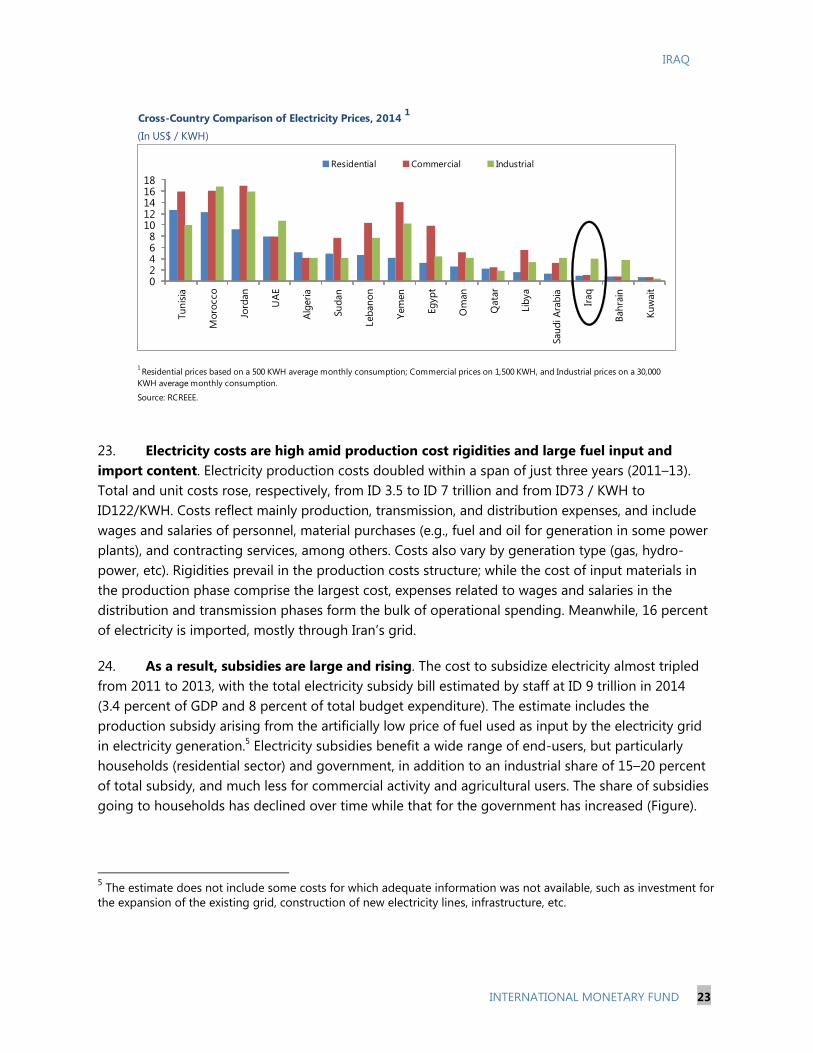
22. Electricity pricing is progressive in Iraq, but revenues are weak given currently administered low tariff rates. Tariff rates for light users of electricity (up to 1000 KWH) are roughly ID 10 ($0.009) per KWH, and the structure is progressive, with tariffs rising to ID 50 per KWH for the largest consumers. Nevertheless, overall revenues are low, covering only 10 percent of total production costs. Currently, Iraq is ranked among the cheapest Arab countries in the Middle East in terms of electricity prices.
Source: Ministry of Electricity
0%
5%
10%
15%
20%
25%
30%
35%
From production from transmission from distribution
Electricity Losses by Phase: 2011-2014(Share in total production, by year)
2011 2012 2013 2014 est.
IRAQ
INTERNATIONAL MONETARY FUND 23
23. Electricity costs are high amid production cost rigidities and large fuel input and import content. Electricity production costs doubled within a span of just three years (2011–13). Total and unit costs rose, respectively, from ID 3.5 to ID 7 trillion and from ID73 / KWH to ID122/KWH. Costs reflect mainly production, transmission, and distribution expenses, and include wages and salaries of personnel, material purchases (e.g., fuel and oil for generation in some power plants), and contracting services, among others. Costs also vary by generation type (gas, hydro-power, etc). Rigidities prevail in the production costs structure; while the cost of input materials in the production phase comprise the largest cost, expenses related to wages and salaries in the distribution and transmission phases form the bulk of operational spending. Meanwhile, 16 percent of electricity is imported, mostly through Iran’s grid.
24. As a result, subsidies are large and rising. The cost to subsidize electricity almost tripled from 2011 to 2013, with the total electricity subsidy bill estimated by staff at ID 9 trillion in 2014 (3.4 percent of GDP and 8 percent of total budget expenditure). The estimate includes the production subsidy arising from the artificially low price of fuel used as input by the electricity grid in electricity generation.5 Electricity subsidies benefit a wide range of end-users, but particularly households (residential sector) and government, in addition to an industrial share of 15–20 percent of total subsidy, and much less for commercial activity and agricultural users. The share of subsidies going to households has declined over time while that for the government has increased (Figure).
5 The estimate does not include some costs for which adequate information was not available, such as investment for the expansion of the existing grid, construction of new electricity lines, infrastructure, etc.
Source: RCREEE.
Cross-Country Comparison of Electricity Prices, 2014 1
1 Residential prices based on a 500 KWH average monthly consumption; Commercial prices on 1,500 KWH, and Industrial prices on a 30,000 KWH average monthly consumption.
(In US$ / KWH)
02468
1012141618
Tuni
sia
Mor
occo
Jord
an
UAE
Alge
ria
Suda
n
Leba
non
Yem
en
Egyp
t
Om
an
Qat
ar
Liby
a
Saud
i Ara
bia
Iraq
Bahr
ain
Kuw
ait
Residential Commercial Industrial
IRAQ
24 INTERNATIONAL MONETARY FUND
25. The electricity sector is affected by several financial issues:
a. Non-payment of electricity tariffs by consumers. The authorities report rampant tariff evasion by end-users, often justified because of poor-quality (and intermittent) service, which forces many consumers to rely on private providers of electricity generators for their power supply. In addition, many public or state-owned entities are delinquent. Non-compliance is made easier by the poor consumption monitoring by electricity companies.
b. Ministry of Oil-Ministry of Electricity cross-debt. During 2013 and 2014, lack of reconciliation between the Ministry of Electricity and the Ministry of Oil over the exact quantities of petroleum products delivered as inputs for electricity generation has resulted in dues on the electricity sector to the budget worth ID 4 trillion (according to the MoE).
c. Inadequate coverage of electricity subsidies by the federal budget. The MoE estimates the annual cost of subsidies on the budget for electricity purposes at roughly ID 10 Trillion (which is broadly consistent with staff’s estimate). However, the MoF’s current transfers (ID 314 billion in 2014) besides other capital investments for the sector have been recently insufficient to cover MoE’s total costs, which resorts to independent borrowing and postponement of non-essential expenses. In addition, the government does not explicitly record the total subsidy costs on budget as a clear line item.
d. Investment in recent years favored production capacity over transmission and distribution. Investment in electricity over the past decade focused on the production phase, leading to bottlenecks in distribution networks over the years and inability of networks to accommodate such high (growing) production capacities.
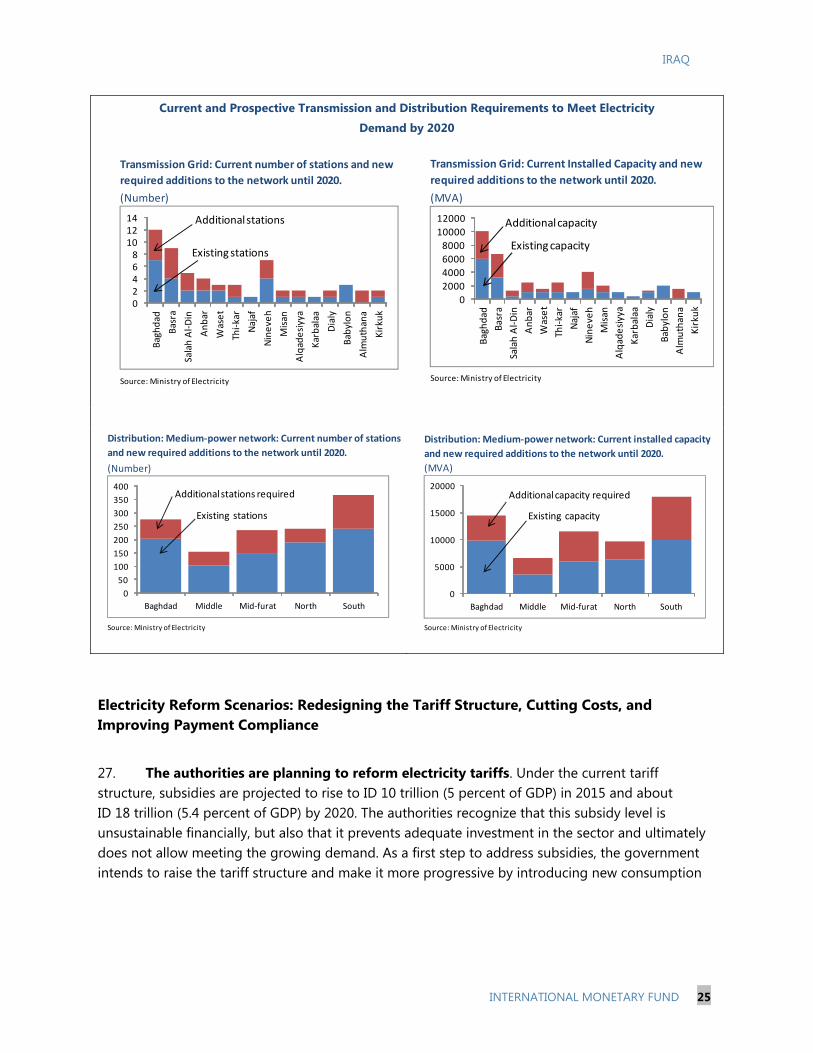
26. The expected cost of rehabilitation and expansion of the electricity sector in the coming years is high. The MoE estimates the cost of expanding the electricity sector to meet rising electricity/power demand over the next five years at $25 billion. Of this, $6.7 billion would be needed for additional electricity generation, $8.6 billion for transmission, and $9.6 billion for distribution. However, international investment—so far mostly financed by donors such as the Japan International Cooperation Agency—remains very limited, as poor security conditions keep away international investors.
IRAQ
INTERNATIONAL MONETARY FUND 25
Current and Prospective Transmission and Distribution Requirements to Meet Electricity
Demand by 2020
Electricity Reform Scenarios: Redesigning the Tariff Structure, Cutting Costs, and Improving Payment Compliance
27. The authorities are planning to reform electricity tariffs. Under the current tariff structure, subsidies are projected to rise to ID 10 trillion (5 percent of GDP) in 2015 and about ID 18 trillion (5.4 percent of GDP) by 2020. The authorities recognize that this subsidy level is unsustainable financially, but also that it prevents adequate investment in the sector and ultimately does not allow meeting the growing demand. As a first step to address subsidies, the government intends to raise the tariff structure and make it more progressive by introducing new consumption
(Number)
Source: Ministry of Electricity
Transmission Grid: Current number of stations and new
required additions to the network until 2020.
02468
101214
Bag
hd
ad
Bas
ra
Sala
h A
l-D
in
An
bar
Was
et
Thi-
kar
Naj
af
Nin
eve
h
Mis
an
Alq
ade
siyy
a
Kar
bal
aa
Dia
ly
Bab
ylo
n
Alm
uth
ana
Kir
kuk
Additional stations
Existing stations
(MVA)
Source: Ministry of Electricity
Transmission Grid: Current Installed Capacity and new
required additions to the network until 2020.
0
2000
4000
6000
8000
10000
12000
Bag
hd
ad
Bas
ra
Sala
h A
l-D
in
An
bar
Was
et
Thi-
kar
Naj
af
Nin
eve
h
Mis
an
Alq
ade
siyy
a
Kar
bal
aa
Dia
ly
Bab
ylo
n
Alm
uth
ana
Kir
kuk
Additional capacity
Existing capacity
(Number)
Source: Ministry of Electricity
Distribution: Medium-power network: Current number of stations
and new required additions to the network until 2020.
0
50
100
150
200
250
300
350
400
Baghdad Middle Mid-furat North South
Additional stations required
Existing stations
(MVA)
Source: Ministry of Electricity
Distribution: Medium-power network: Current installed capacity
and new required additions to the network until 2020.
0
5000
10000
15000
20000
Baghdad Middle Mid-furat North South
Additional capacity required
Existing capacity
IRAQ
26 INTERNATIONAL MONETARY FUND
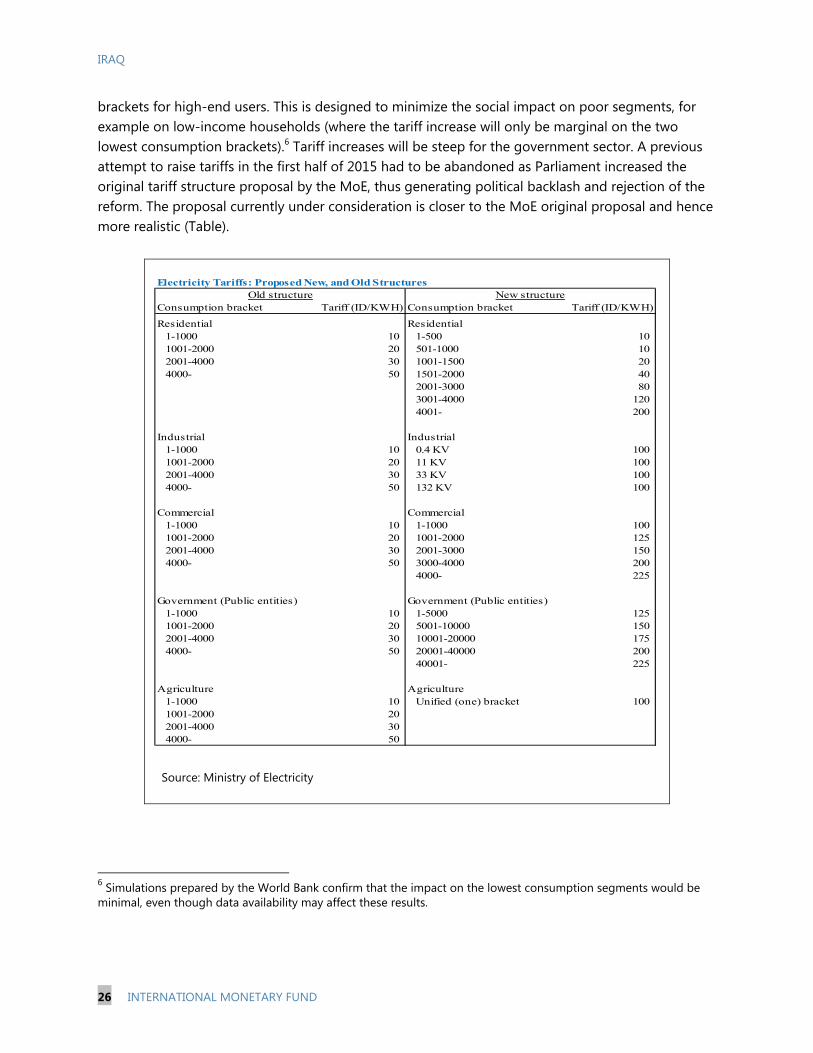
brackets for high-end users. This is designed to minimize the social impact on poor segments, for example on low-income households (where the tariff increase will only be marginal on the two lowest consumption brackets).6 Tariff increases will be steep for the government sector. A previous attempt to raise tariffs in the first half of 2015 had to be abandoned as Parliament increased the original tariff structure proposal by the MoE, thus generating political backlash and rejection of the reform. The proposal currently under consideration is closer to the MoE original proposal and hence more realistic (Table).
6 Simulations prepared by the World Bank confirm that the impact on the lowest consumption segments would be minimal, even though data availability may affect these results.
Source: Ministry of Electricity
Electricity Tariffs: Proposed New, and Old Structures
Consumption bracket Tariff (ID/KWH) Consumption bracket Tariff (ID/KWH)
Residential Residential1-1000 10 1-500 10 1001-2000 20 501-1000 10 2001-4000 30 1001-1500 20 4000- 50 1501-2000 40
2001-3000 80 3001-4000 120 4001- 200
Industrial Industrial1-1000 10 0.4 KV 100 1001-2000 20 11 KV 100 2001-4000 30 33 KV 100 4000- 50 132 KV 100
Commercial Commercial1-1000 10 1-1000 100 1001-2000 20 1001-2000 125 2001-4000 30 2001-3000 150 4000- 50 3000-4000 200
4000- 225
Government (Public entities) Government (Public entities)1-1000 10 1-5000 125 1001-2000 20 5001-10000 150 2001-4000 30 10001-20000 175 4000- 50 20001-40000 200
40001- 225
Agriculture Agriculture1-1000 10 Unified (one) bracket 100 1001-2000 20 2001-4000 30 4000- 50
Old structure New structure
IRAQ
INTERNATIONAL MONETARY FUND 27
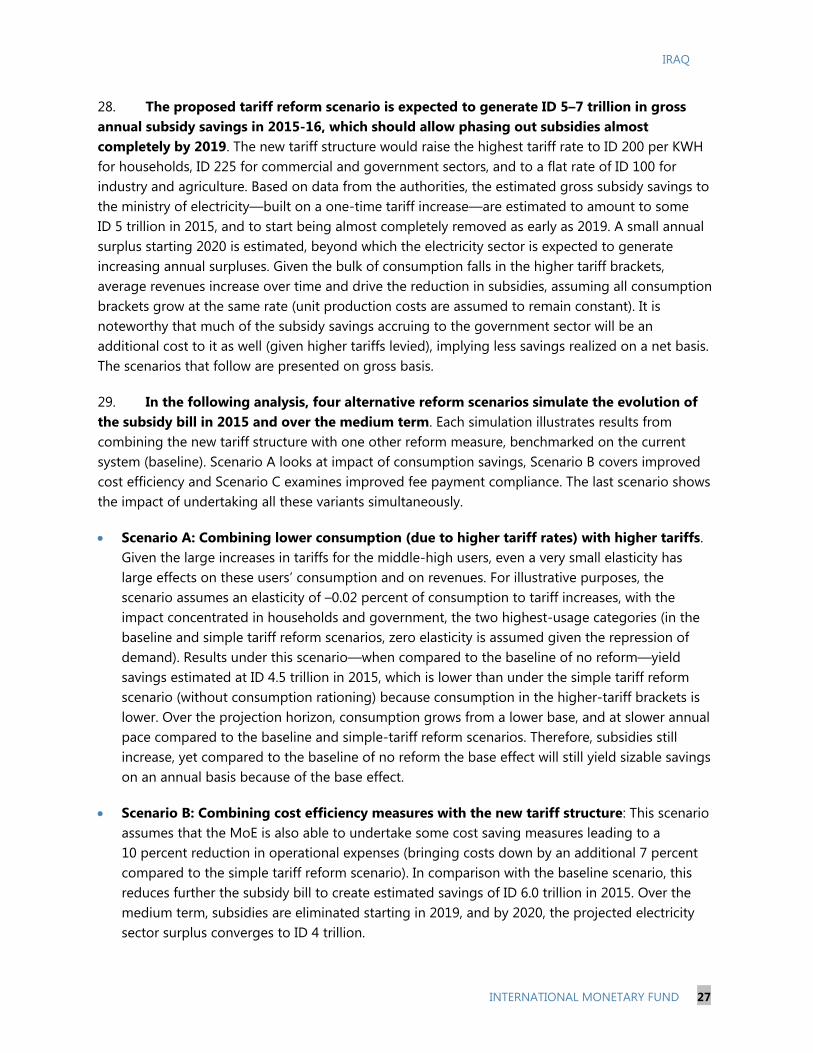
28. The proposed tariff reform scenario is expected to generate ID 5–7 trillion in gross annual subsidy savings in 2015-16, which should allow phasing out subsidies almost completely by 2019. The new tariff structure would raise the highest tariff rate to ID 200 per KWH for households, ID 225 for commercial and government sectors, and to a flat rate of ID 100 for industry and agriculture. Based on data from the authorities, the estimated gross subsidy savings to the ministry of electricity—built on a one-time tariff increase—are estimated to amount to some ID 5 trillion in 2015, and to start being almost completely removed as early as 2019. A small annual surplus starting 2020 is estimated, beyond which the electricity sector is expected to generate increasing annual surpluses. Given the bulk of consumption falls in the higher tariff brackets, average revenues increase over time and drive the reduction in subsidies, assuming all consumption brackets grow at the same rate (unit production costs are assumed to remain constant). It is noteworthy that much of the subsidy savings accruing to the government sector will be an additional cost to it as well (given higher tariffs levied), implying less savings realized on a net basis. The scenarios that follow are presented on gross basis.
29. In the following analysis, four alternative reform scenarios simulate the evolution of the subsidy bill in 2015 and over the medium term. Each simulation illustrates results from combining the new tariff structure with one other reform measure, benchmarked on the current system (baseline). Scenario A looks at impact of consumption savings, Scenario B covers improved cost efficiency and Scenario C examines improved fee payment compliance. The last scenario shows the impact of undertaking all these variants simultaneously.
Scenario A: Combining lower consumption (due to higher tariff rates) with higher tariffs. Given the large increases in tariffs for the middle-high users, even a very small elasticity has large effects on these users’ consumption and on revenues. For illustrative purposes, the scenario assumes an elasticity of –0.02 percent of consumption to tariff increases, with the impact concentrated in households and government, the two highest-usage categories (in the baseline and simple tariff reform scenarios, zero elasticity is assumed given the repression of demand). Results under this scenario—when compared to the baseline of no reform—yield savings estimated at ID 4.5 trillion in 2015, which is lower than under the simple tariff reform scenario (without consumption rationing) because consumption in the higher-tariff brackets is lower. Over the projection horizon, consumption grows from a lower base, and at slower annual pace compared to the baseline and simple-tariff reform scenarios. Therefore, subsidies still increase, yet compared to the baseline of no reform the base effect will still yield sizable savings on an annual basis because of the base effect.
Scenario B: Combining cost efficiency measures with the new tariff structure: This scenario assumes that the MoE is also able to undertake some cost saving measures leading to a 10 percent reduction in operational expenses (bringing costs down by an additional 7 percent compared to the simple tariff reform scenario). In comparison with the baseline scenario, this reduces further the subsidy bill to create estimated savings of ID 6.0 trillion in 2015. Over the medium term, subsidies are eliminated starting in 2019, and by 2020, the projected electricity sector surplus converges to ID 4 trillion.
IRAQ
28 INTERNATIONAL MONETARY FUND
Scenario C: Combining improvements in fee payment compliance with higher tariffs: This scenario assumes better compliance through, for instance, better service provision and/or more stringent penalties for noncompliance and enhanced monitoring capacity by the MoE. This scenario estimates subsidy bill savings over the baseline scenario in the neighborhood of ID 5.8 trillion over 2015, with a small surplus starting in 2019 and increasing to ID 3.8 trillion by end of the projection horizon.
Finally, a combined reform scenario takes into account the new tariff structure, consumption rationalization, cost efficiency and better compliance simultaneously. This scenario yields estimated savings of ID 5.7–6.7 trillion in the short term (2015–16) compared with the baseline scenario, with the subsidy burden continuing in outer years, to around ID 6 trillion by 2020.
30. These results underline that tariff reform should be deepened and complemented by reform in cost structure, institutional framework, tariff collection, investment and renewable energy.
The tariff structure may need to be gradually increased further in the future, and should be linked to costs or energy price benchmarks, as well as to appropriate mitigating measures.
Production costs need to be reduced through technical and organizational restructuring along the production-transmission-distribution chain.
Institutional framework:
a. The true cost of subsidies needs to be reflected on-budget. The transfers from MoF to MoE reflect only a portion of the true subsidy burden on MoF accounts. Explicit recording of subsidy costs on budget is essential to give a comprehensive and transparent view of the financial interrelationship between MoF and MoE and compensate financial losses of the MoE which are the result of government policy.
Source: Ministry of Electricity and IMF Staff calculations.
(20)
(15)
(10)
(5)
-
5
2015 2016 2017 2018 2019 2020
Baseline (no reform)
Tariff Reform Scenario
Tariff Reform plus Consumption saving scenario
Tariff Reform plus Cost cutting scenario
Tariff Reform plus Better compliance scenario
Tariff Reform plus Combined Reform scenario
Subsidy Estimates Under Alternative Electricity Tariff Reform Scenarios: 2015-2020 1
(Trillion Dinars; negative values denote subsidy)
1 Tariff reform based on authorities' design of the newly proposed tariff rates structure and electricity consumption brackets.
IRAQ
INTERNATIONAL MONETARY FUND 29
b. Intra-government debts need to be addressed, and resolved, by means of an agreement among all stakeholders to settle dues simultaneously (for example through an exchange of checks).
c. Some companies in the sector are inefficient and will need to be reformed.
Stronger compliance for payments of electricity bills. The MoE should start strengthening its monitoring capacity, including over state entities which continue to fail to pay their dues. This should be done in close coordination and collaboration with the ministerial cabinet and legal apparatus, as well as enforcement through stringent penalties for non-compliance/evasion (including with the support of the Ministry of Interior).
Investment in the electricity sector. Given limited available resources to invest in new infrastructure and power plants, a portion of subsidies saved should be devoted to support investment.
Cooperation and coordination with other state entities. Strengthened cooperation among MoF, MoE and the Ministry of Planning on the choice and implementation of electricity-related investment projects and its funding options, would be crucial to ensure effective execution, follow-up, and to prevent recurrence of mismatches in investment spending between production, transmission and distribution phases.
Renewable energy sources and integration with regional electricity networks. The authorities should continue exploring how best gains from renewable energy can be harnessed, and consider prospects of integration in regional energy markets to raise electric power provision to adequacy levels (e.g., link with GCC electricity grid) and exploring synergies across other regions (such as links with the European Union to harness the different peak load times between the regions, provided such connections are viable and feasible).
IRAQ
30 INTERNATIONAL MONETARY FUND
References
Arab Future Energy Index (AFEX), 2015, Regional Center for Renewable Energy and Energy Efficiency
(RCREEE).
International Monetary Fund, 2014, “Subsidy Reform in the Middle East and North Africa: Recent
Progress and Challenges Ahead,” (Washington: IMF, Middle East and Central Asia Department).
———, 2015a, “Fiscal Monitor: Now is the Time—Fiscal Policies for Sustainable Growth,”
(Washington: IMF, Fiscal Affairs Department).
———, 2015b, “Saudi Arabia: Tackling Emerging Economic Challenges to Sustain Growth,”
(Washington: IMF, Middle East and Central Asia Department)
USAID, 2006, “Iraq in Perspective—An Analysis of What Does and What Does Not work in a
Transitional State: How to Make Subsidy Reform Work in a Transitional State.”
United Nations, 2014, “Food and Agriculture Organization (FAO), Food and Agriculture Policy
Decisions: Trends, Emerging Issues and Policy Alignments since the 2007/08 Food Security
Crisis.”
World Bank, COSIT, and KRSO, 2007, Household Socio-Economic Survey, Iraq.
———, 2011, Iraq: Rationalization of the Universal Public Distribution System. Concept Note
———, 2014, “Republic of Iraq: Public Expenditure Review—Toward More Efficient Spending For
Better Service Delivery.”