Embed Size (px)
Citation preview
©2013 International Monetary Fund
IMF Country Report No. 13/239
UNITED ARAB EMIRATES 2013 ARTICLE IV CONSULTATION
Under Article IV of the IMF’s Articles of Agreement, the IMF holds bilateral discussions with members, usually every year. In the context of the 2013 Article IV consultation with United Arab Emirates, the following documents have been released and are included in this package: Staff Report for the 2013 Article IV consultation, prepared by a staff team of the IMF, following discussions that ended on May 15, 2013, with the officials of United Arab Emirates on economic developments and policies. Based on information available at the time of these discussions, the staff report was completed on June 27, 2013. The views expressed in the staff report are those of the staff team and do not necessarily reflect the views of the Executive Board of the IMF.
Informational Annex prepared by the IMF.
Press Release (PR) summarizing the views of the Executive Board.
The document listed below has been or will be separately released.
Selected Issues Paper and Statistical Appendix
The policy of publication of staff reports and other documents allows for the deletion of market-sensitive information.
Copies of this report are available to the public from
International Monetary Fund Publication Services 700 19th Street, N.W. Washington, D.C. 20431
Telephone: (202) 623-7430 Telefax: (202) 623-7201 E-mail: [email protected] Internet: http://www.imf.org
International Monetary Fund Washington, D.C.
July 2013
UNITED ARAB EMIRATES STAFF REPORT FOR THE 2013 ARTICLE IV CONSULTATION
KEY ISSUES Economic context. The non-oil economy has been gathering strength amid favorable oil prices and capital inflows. The real estate market has started to recover from the 2009 crisis, in some segments rapidly, and there have been a number of announcements of new megaprojects in real estate and tourism. Growth in oil production will likely slow in the context of an amply supplied global oil market. Policy Focus. In this environment, economic and financial policies should focus on measures that will help prevent a renewed cycle of exuberant risk-taking and strengthen the fiscal position, while completing the agenda of dealing with the legacy of the 2009 crisis by continuing the deleveraging and restructuring of government-related entities (GRE). Macroeconomic policy mix. The UAE plans for continued fiscal consolidation this year at an appropriate pace, helping to further unwind the fiscal stimulus of recent years without undermining the economic recovery. Medium-term fiscal plans point to further consolidation. Monetary policy is expected to stay accommodative under the U.S. dollar peg. GREs. Building on progress in restructuring the debt of GREs, Dubai should continue to focus on strengthening the GRE sector. This should include proactive management of upcoming debt maturities and improving the GREs’ transparency and governance. The new megaprojects should be executed at a measured pace, and new risk-taking by GREs should be avoided. Financial stability. The banking system maintains significant capital and liquidity buffers. To preempt the build-up of new vulnerabilities, swift implementation of the planned new prudential regulations for mortgage lending and loan concentration will be important. This will mitigate the risk of rapid credit expansion and undue concentration of loans to the real estate and GRE sectors in the future. Mortgage lending rules could be complemented by targeted increases in real estate-related fees, should housing price increases continue unabated.
June 27, 2013
UNITED ARAB EMIRATES
2 INTERNATIONAL MONETARY FUND
Approved By Alfred Kammer; David Marston
Discussions were held in Abu Dhabi during April 30–May 15, 2013. The staff team comprised Harald Finger (head), Zsofia Arvai, Ozgur Demirkol, Alberto Behar (all MCD) and Asmaa El-Ganainy (FAD). The team met with H. E. Governor of the Central Bank of United Arab Emirates Sultan Bin Nasser Al Suwaidi, H. E. Under Secretary, Ministry of Finance, Younis Alkhoori, the heads of economy and finance departments of the emirates, as well as other senior officials and representatives from the business and financial community. Mr. Geadah, Alternate Executive Director, joined for part of the mission.
CONTENTS
BACKGROUND ___________________________________________________________________________________ 4
RECENT DEVELOPMENTS ________________________________________________________________________ 4
OUTLOOK AND RISKS ___________________________________________________________________________ 7
POLICY DISCUSSIONS __________________________________________________________________________ 12
A. Correcting Imbalances while Supporting the Economy ___________________________________ 12
B. Managing Old and New Risks Stemming from GREs ______________________________________ 15
C. Financial Sector Soundness and Financial Spillovers ______________________________________ 17
D. Structural and Statistical Issues ____________________________________________________________ 19
STAFF APPRAISAL ______________________________________________________________________________ 21 BOXES 1. Real Estate Market Developments _______________________________________________________________5 2. Hydrocarbon Sector Outlook ____________________________________________________________________9 3. Quantifying the External Risks to the UAE Outlook ____________________________________________ 11 4. Dubai’s Debt Sustainability ____________________________________________________________________ 14 FIGURE 1. Monetary and Financial Developments ________________________________________________________ 23 TABLES 1. Selected Macroeconomic Indicators, 2008–18 _________________________________________________ 24 2. Balance of Payments, 2008–18 _________________________________________________________________ 25 3. Consolidated Government Finances, 2008–14 _________________________________________________ 26 3a. Abu Dhabi Government Finances, 2008–14 __________________________________________________ 27 3b. Dubai Government Finances, 2008–14 _______________________________________________________ 28 4. Monetary Survey, 2008–14 ____________________________________________________________________ 29

UNITED ARAB EMIRATES
INTERNATIONAL MONETARY FUND 3
APPENDICES I. Dubai and Abu Dhabi Debt _____________________________________________________________________ 30 II. Exchange Rate Assessment ____________________________________________________________________ 32 APPENDIX TABLES 1. Dubai: Maturing Bonds and Syndicated Loans ________________________________________________ 30 2. Abu Dhabi: Maturing Bonds, Syndicated and Bilateral Loans __________________________________ 31
UNITED ARAB EMIRATES
4 INTERNATIONAL MONETARY FUND
-15
-10
-5
0
5
10
15
20
-15
-10
-5
0
5
10
15
20
2000 2001 2002 2003 2004 2005 2006 2007 2008 2009 2010 2011 2012
GCC average GDP growthReal GDPReal Non-oil GDPReal Oil GDP
Real GDP Growth, 2000–12 (Annual percent change)
Sources: Country authorities; and IMF staff estimates.
-6
-4
-2
0
2
4
6
8
10
-6
-4
-2
0
2
4
6
8
10
Jan-09 Jul-09 Jan-10 Jul-10 Jan-11 Jul-11 Jan-12 Jul-12 Jan-13
Inflation Housing Non-Housing
CPI Inflation, 2009−April 2013 (Annual percent change)
Sources: Haver; and IMF staff estimates.
BACKGROUND 1. The UAE has profited from its safe-haven status amid the political and social unrest that has been sweeping through the MENA region. Against a backdrop of political stability, confidence has further increased, tourism has been firm, demand from expatriates from the broader region has increased, and capital inflows have strengthened amid high global liquidity. The real estate sector, which had been impaired since the 2009 crisis, has stabilized in Abu Dhabi and started to recover in Dubai.
2. The economic diversification drive is gathering further steam. Dubai aims to build on its early achievements in becoming a hub for retail and wholesale trade, as well as a major tourism and real estate investment destination for the wider region, and recently announced plans for several new megaprojects in real estate and tourism. Dubai is a candidate city for the World Expo 2020, and if it succeeds in its bid, the implementation of many of these plans will likely accelerate. While Abu Dhabi continues to expand its hydrocarbon production capacity, the emirate is actively pursuing an economic diversification strategy that relies primarily on petrochemicals, financial services, aviation, renewable energy, and cultural tourism.
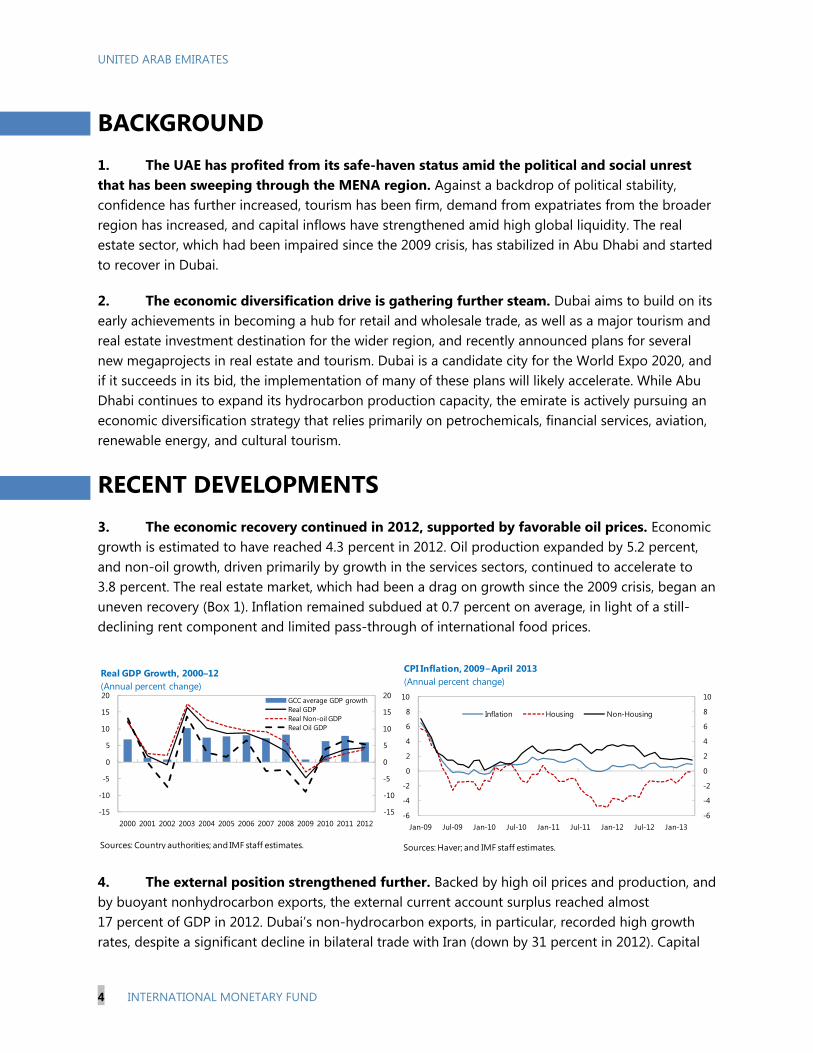
RECENT DEVELOPMENTS 3. The economic recovery continued in 2012, supported by favorable oil prices. Economic growth is estimated to have reached 4.3 percent in 2012. Oil production expanded by 5.2 percent, and non-oil growth, driven primarily by growth in the services sectors, continued to accelerate to 3.8 percent. The real estate market, which had been a drag on growth since the 2009 crisis, began an uneven recovery (Box 1). Inflation remained subdued at 0.7 percent on average, in light of a still-declining rent component and limited pass-through of international food prices.
4. The external position strengthened further. Backed by high oil prices and production, and by buoyant nonhydrocarbon exports, the external current account surplus reached almost 17 percent of GDP in 2012. Dubai’s non-hydrocarbon exports, in particular, recorded high growth rates, despite a significant decline in bilateral trade with Iran (down by 31 percent in 2012). Capital
UNITED ARAB EMIRATES
INTERNATIONAL MONETARY FUND 5
inflows also strengthened, with corporates and banks having been active in issuing conventional debt and sukuk throughout the year, taking advantage of falling risk premia, particularly for Dubai. Gross foreign inflows to the banking sector also remained steady, reflecting the UAE’s perceived safe-haven status and a modest interest rate differential with international rates. As a consequence, central bank reserves increased markedly and reached $47 billion in 2012, covering 3.3 months of imports (net of re-exports), just over half of short-term debt, or 20 percent of M2. While substantially below the range suggested by the Fund’s new reserve adequacy metric1 ($82-123 billion), central bank reserves are small relative to foreign assets in sovereign wealth funds, which are mandated to make resources available in case of need and have a sufficiently liquid portfolio to do so. As a result, external buffers appear adequate.
Box 1. Real Estate Market Developments
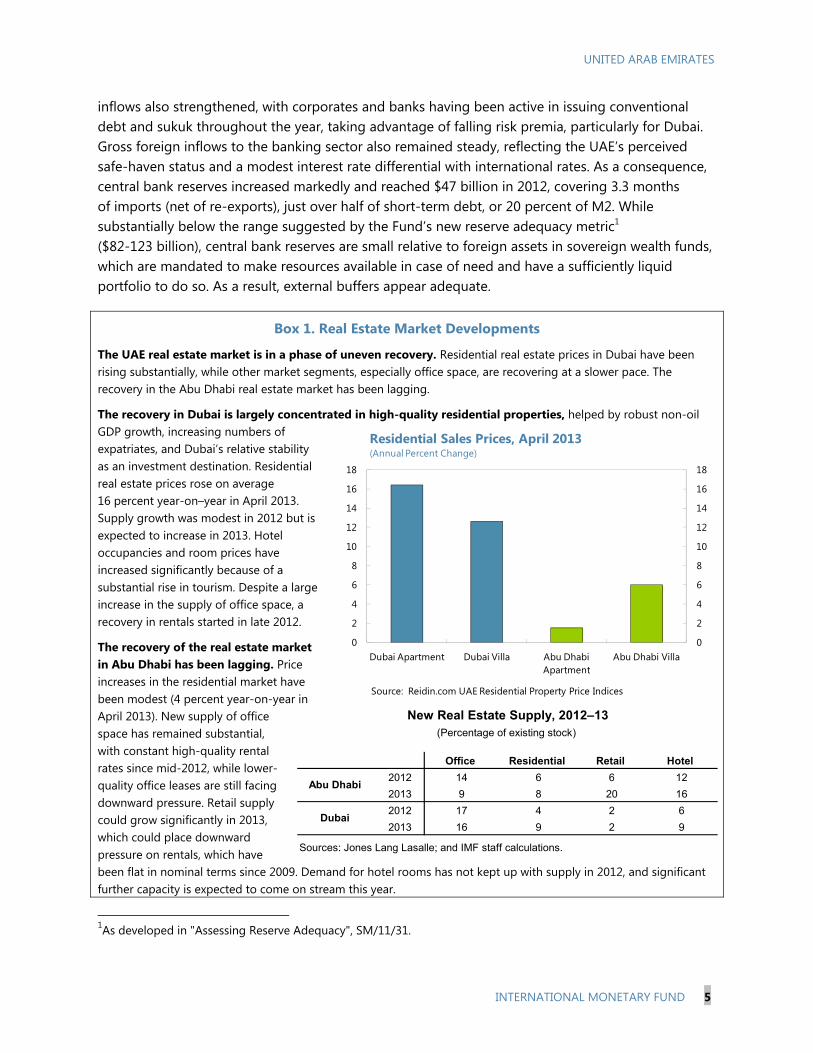
The UAE real estate market is in a phase of uneven recovery. Residential real estate prices in Dubai have been rising substantially, while other market segments, especially office space, are recovering at a slower pace. The recovery in the Abu Dhabi real estate market has been lagging.
The recovery in Dubai is largely concentrated in high-quality residential properties, helped by robust non-oil GDP growth, increasing numbers of expatriates, and Dubai’s relative stability as an investment destination. Residential real estate prices rose on average 16 percent year-on–year in April 2013. Supply growth was modest in 2012 but is expected to increase in 2013. Hotel occupancies and room prices have increased significantly because of a substantial rise in tourism. Despite a large increase in the supply of office space, a recovery in rentals started in late 2012.
The recovery of the real estate market in Abu Dhabi has been lagging. Price increases in the residential market have been modest (4 percent year-on-year in April 2013). New supply of office space has remained substantial, with constant high-quality rental rates since mid-2012, while lower-quality office leases are still facing downward pressure. Retail supply could grow significantly in 2013, which could place downward pressure on rentals, which have been flat in nominal terms since 2009. Demand for hotel rooms has not kept up with supply in 2012, and significant further capacity is expected to come on stream this year.
1As developed in "Assessing Reserve Adequacy", SM/11/31.
0
2
4
6
8
10
12
14
16
18
0
2
4
6
8
10
12
14
16
18
Dubai Apartment Dubai Villa Abu Dhabi Apartment
Abu Dhabi Villa
Source: Reidin.com UAE Residential Property Price Indices
Residential Sales Prices, April 2013(Annual Percent Change)
Office Residential Retail Hotel
2012 14 6 6 12
2013 9 8 20 16
2012 17 4 2 6
2013 16 9 2 9
Sources: Jones Lang Lasalle; and IMF staff calculations.
New Real Estate Supply, 2012–13(Percentage of existing stock)
Abu Dhabi
Dubai
UNITED ARAB EMIRATES
6 INTERNATIONAL MONETARY FUND
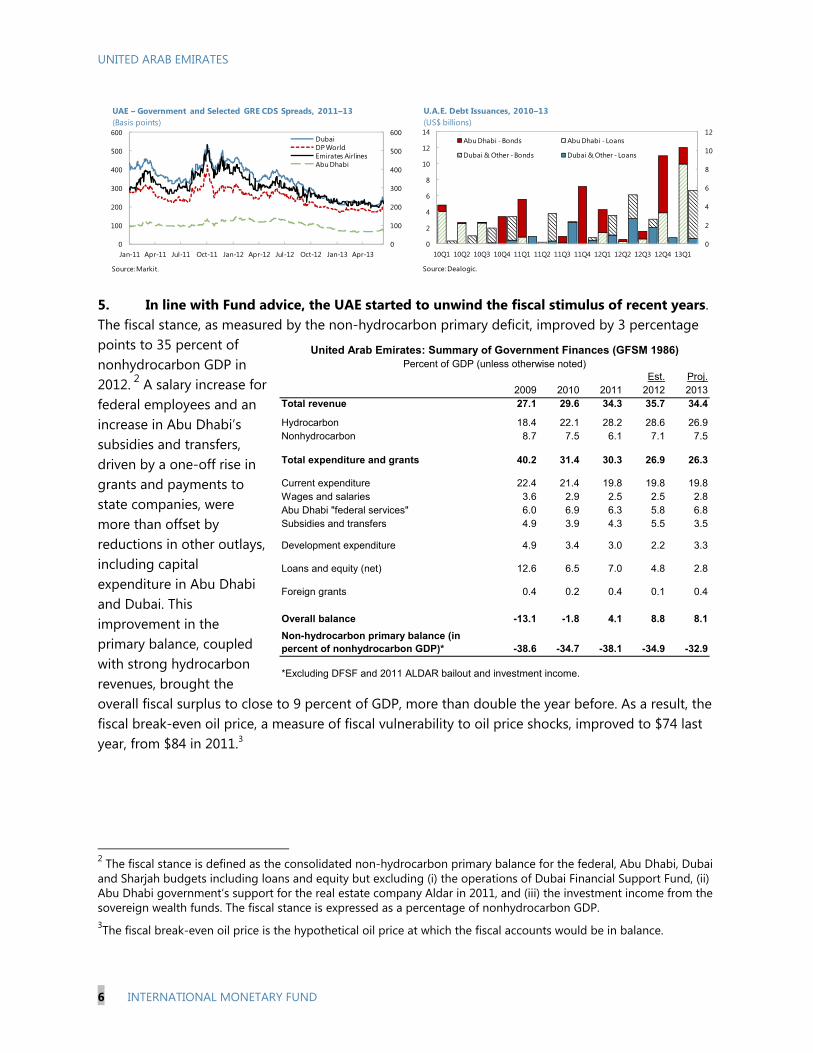
5. In line with Fund advice, the UAE started to unwind the fiscal stimulus of recent years. The fiscal stance, as measured by the non-hydrocarbon primary deficit, improved by 3 percentage points to 35 percent of nonhydrocarbon GDP in 2012. 2 A salary increase for federal employees and an increase in Abu Dhabi’s subsidies and transfers, driven by a one-off rise in grants and payments to state companies, were more than offset by reductions in other outlays, including capital expenditure in Abu Dhabi and Dubai. This improvement in the primary balance, coupled with strong hydrocarbon revenues, brought the overall fiscal surplus to close to 9 percent of GDP, more than double the year before. As a result, the fiscal break-even oil price, a measure of fiscal vulnerability to oil price shocks, improved to $74 last year, from $84 in 2011.3
2 The fiscal stance is defined as the consolidated non-hydrocarbon primary balance for the federal, Abu Dhabi, Dubai and Sharjah budgets including loans and equity but excluding (i) the operations of Dubai Financial Support Fund, (ii) Abu Dhabi government’s support for the real estate company Aldar in 2011, and (iii) the investment income from the sovereign wealth funds. The fiscal stance is expressed as a percentage of nonhydrocarbon GDP. 3The fiscal break-even oil price is the hypothetical oil price at which the fiscal accounts would be in balance.
Est. Proj.2009 2010 2011 2012 2013
Total revenue 27.1 29.6 34.3 35.7 34.4
Hydrocarbon 18.4 22.1 28.2 28.6 26.9Nonhydrocarbon 8.7 7.5 6.1 7.1 7.5
Total expenditure and grants 40.2 31.4 30.3 26.9 26.3
Current expenditure 22.4 21.4 19.8 19.8 19.8Wages and salaries 3.6 2.9 2.5 2.5 2.8Abu Dhabi "federal services" 6.0 6.9 6.3 5.8 6.8Subsidies and transfers 4.9 3.9 4.3 5.5 3.5
Development expenditure 4.9 3.4 3.0 2.2 3.3
Loans and equity (net) 12.6 6.5 7.0 4.8 2.8
Foreign grants 0.4 0.2 0.4 0.1 0.4
Overall balance -13.1 -1.8 4.1 8.8 8.1
Non-hydrocarbon primary balance (in percent of nonhydrocarbon GDP)* -38.6 -34.7 -38.1 -34.9 -32.9
United Arab Emirates: Summary of Government Finances (GFSM 1986)Percent of GDP (unless otherwise noted)
*Excluding DFSF and 2011 ALDAR bailout and investment income.
0
100
200
300
400
500
600
0
100
200
300
400
500
600
Jan-11 Apr-11 Jul-11 Oct-11 Jan-12 Apr-12 Jul-12 Oct-12 Jan-13 Apr-13
DubaiDP WorldEmirates AirlinesAbu Dhabi
UAE – Government and Selected GRE CDS Spreads, 2011–13 (Basis points)
Source: Markit.
0
2
4
6
8
10
12
0
2
4
6
8
10
12
14
10Q1 10Q2 10Q3 10Q4 11Q1 11Q2 11Q3 11Q4 12Q1 12Q2 12Q3 12Q4 13Q1
Abu Dhabi - Bonds Abu Dhabi - Loans
Dubai & Other - Bonds Dubai & Other - Loans
U.A.E. Debt Issuances, 2010–13(US$ billions)
Source: Dealogic.
UNITED ARAB EMIRATES
INTERNATIONAL MONETARY FUND 7
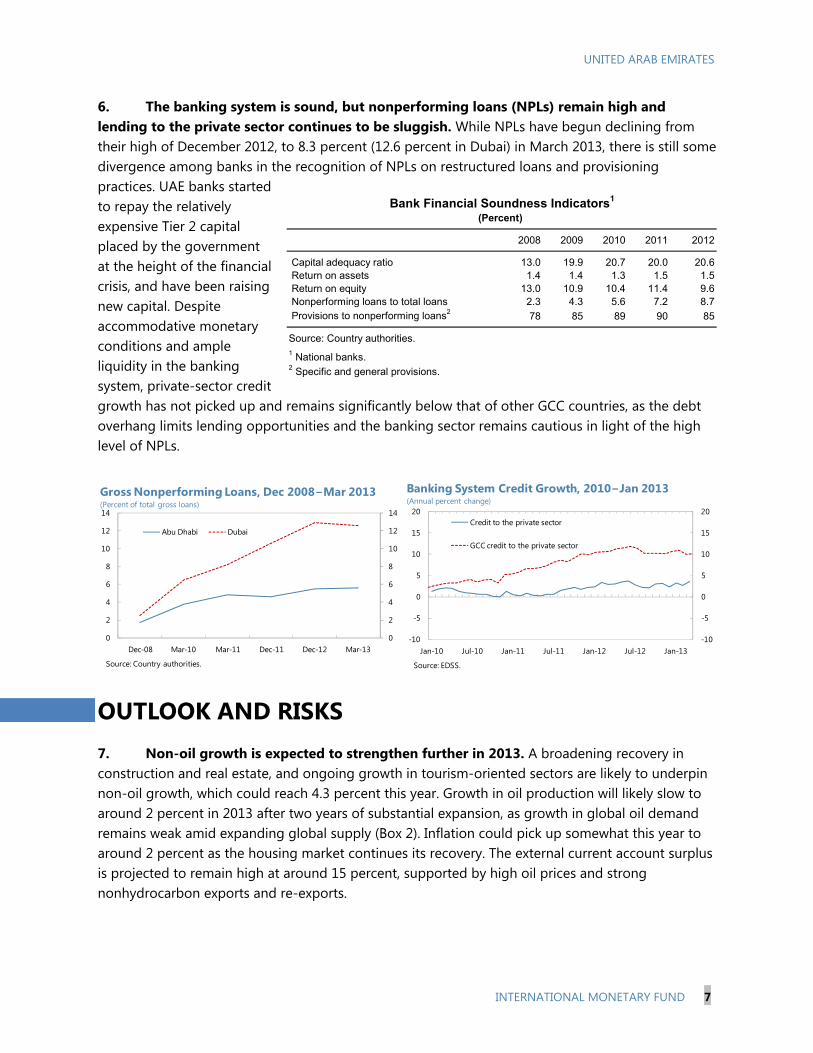
6. The banking system is sound, but nonperforming loans (NPLs) remain high and lending to the private sector continues to be sluggish. While NPLs have begun declining from their high of December 2012, to 8.3 percent (12.6 percent in Dubai) in March 2013, there is still some divergence among banks in the recognition of NPLs on restructured loans and provisioning practices. UAE banks started to repay the relatively expensive Tier 2 capital placed by the government at the height of the financial crisis, and have been raising new capital. Despite accommodative monetary conditions and ample liquidity in the banking system, private-sector credit growth has not picked up and remains significantly below that of other GCC countries, as the debt overhang limits lending opportunities and the banking sector remains cautious in light of the high level of NPLs.
OUTLOOK AND RISKS 7. Non-oil growth is expected to strengthen further in 2013. A broadening recovery in construction and real estate, and ongoing growth in tourism-oriented sectors are likely to underpin non-oil growth, which could reach 4.3 percent this year. Growth in oil production will likely slow to around 2 percent in 2013 after two years of substantial expansion, as growth in global oil demand remains weak amid expanding global supply (Box 2). Inflation could pick up somewhat this year to around 2 percent as the housing market continues its recovery. The external current account surplus is projected to remain high at around 15 percent, supported by high oil prices and strong nonhydrocarbon exports and re-exports.
2008 2009 2010 2011 2012
Capital adequacy ratio 13.0 19.9 20.7 20.0 20.6 Return on assets 1.4 1.4 1.3 1.5 1.5 Return on equity 13.0 10.9 10.4 11.4 9.6 Nonperforming loans to total loans 2.3 4.3 5.6 7.2 8.7 Provisions to nonperforming loans2 78 85 89 90 85
Source: Country authorities. 1 National banks.2 Specific and general provisions.
Bank Financial Soundness Indicators1
(Percent)
0
2
4
6
8
10
12
14
0
2
4
6
8
10
12
14
Dec-08 Mar-10 Mar-11 Dec-11 Dec-12 Mar-13
Abu Dhabi Dubai
Source: Country authorities.
Gross Nonperforming Loans, Dec 2008−Mar 2013(Percent of total gross loans)
-10
-5
0
5
10
15
20
-10
-5
0
5
10
15
20
Jan-10 Jul-10 Jan-11 Jul-11 Jan-12 Jul-12 Jan-13
Credit to the private sector
GCC credit to the private sector
Source: EDSS.
Banking System Credit Growth, 2010−Jan 2013 (Annual percent change)
UNITED ARAB EMIRATES
8 INTERNATIONAL MONETARY FUND
8. Medium-term growth and diversification prospects are promising. Based on Dubai’s further expansion plans in its core services sectors and Abu Dhabi’s intensified diversification efforts, non-hydrocarbon growth is expected to remain strong at above 4 percent in the medium term.
9. Downside risks to this outlook have declined over the past year but remain substantial (see risk assessment matrix and Box 3). Domestically, a key medium-term risk is related to a possible renewed building up of a boom-and-bust cycle in light of the recovering real estate market and the announcement of new megaprojects. On the external side, a major downside risk is the possibility of an abrupt reversal of capital inflows, which could be triggered, for example, by monetary policy tightening in the United States or a re-emergence of global financial stress. This could affect rollovers or raise borrowing costs for banks (though these maintain large liquidity buffers), GREs, private borrowers, and government. Another downside risk is a deeper than expected economic slowdown in emerging markets, particularly in Asia, reflecting the UAE’s close links with international financial markets and emerging Asian economies. If adverse external developments trigger a large and prolonged decline in hydrocarbon prices, it would ultimately result in reduced fiscal spending and non-hydrocarbon GDP growth and could expose weaknesses in the balance sheets of GREs and other companies. That said, the UAE’s substantial foreign assets and improving fiscal position provide insulation against moderate or short-lived shocks.
10. There are also a number of upside risks to the outlook. A faster recovery in the advanced economies would have a positive effect on global growth and oil prices. More generally, higher oil prices would further support fiscal revenues and the external current account, as long as oil exports are not disrupted and confidence is maintained. Adequate macroeconomic policies and borrowing restraint by GREs in the currently favorable economic conditions can support high and sustainable economic growth without incurring undue macroeconomic risks.
UNITED ARAB EMIRATES
INTERNATIONAL MONETARY FUND 9
Box 2. Hydrocarbon Sector Outlook
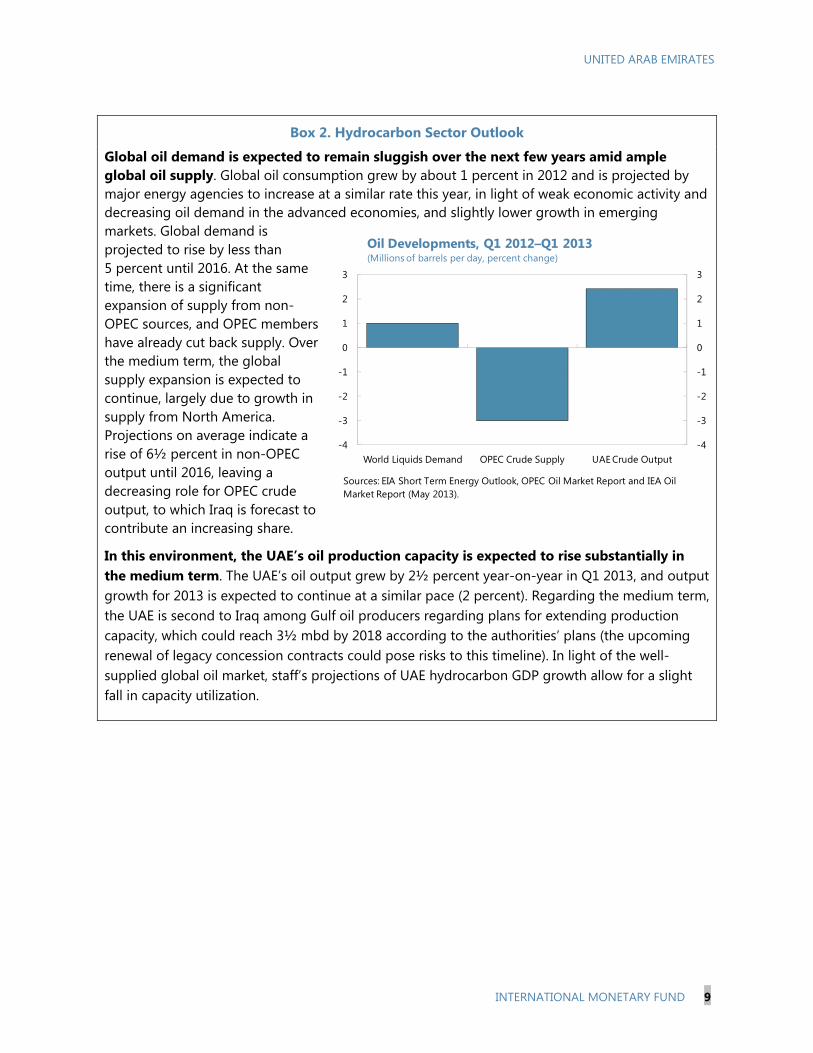
Global oil demand is expected to remain sluggish over the next few years amid ample global oil supply. Global oil consumption grew by about 1 percent in 2012 and is projected by major energy agencies to increase at a similar rate this year, in light of weak economic activity and decreasing oil demand in the advanced economies, and slightly lower growth in emerging markets. Global demand is projected to rise by less than 5 percent until 2016. At the same time, there is a significant expansion of supply from non-OPEC sources, and OPEC members have already cut back supply. Over the medium term, the global supply expansion is expected to continue, largely due to growth in supply from North America. Projections on average indicate a rise of 6½ percent in non-OPEC output until 2016, leaving a decreasing role for OPEC crude output, to which Iraq is forecast to contribute an increasing share.
In this environment, the UAE’s oil production capacity is expected to rise substantially in the medium term. The UAE’s oil output grew by 2½ percent year-on-year in Q1 2013, and output growth for 2013 is expected to continue at a similar pace (2 percent). Regarding the medium term, the UAE is second to Iraq among Gulf oil producers regarding plans for extending production capacity, which could reach 3½ mbd by 2018 according to the authorities’ plans (the upcoming renewal of legacy concession contracts could pose risks to this timeline). In light of the well-supplied global oil market, staff’s projections of UAE hydrocarbon GDP growth allow for a slight fall in capacity utilization.
-4
-3
-2
-1
0
1
2
3
-4
-3
-2
-1
0
1
2
3
World Liquids Demand OPEC Crude Supply UAE Crude Output
Sources: EIA Short Term Energy Outlook, OPEC Oil Market Report and IEA Oil Market Report (May 2013).
Oil Developments, Q1 2012–Q1 2013(Millions of barrels per day, percent change)
UNITED ARAB EMIRATES
10 INTERNATIONAL MONETARY FUND
UAE: Risk Assessment Matrix
Likelihood / Nature of Risks
Expected Impact on Economy if Risk is Realized
Policy Responses to Reduce Vulnerabilities
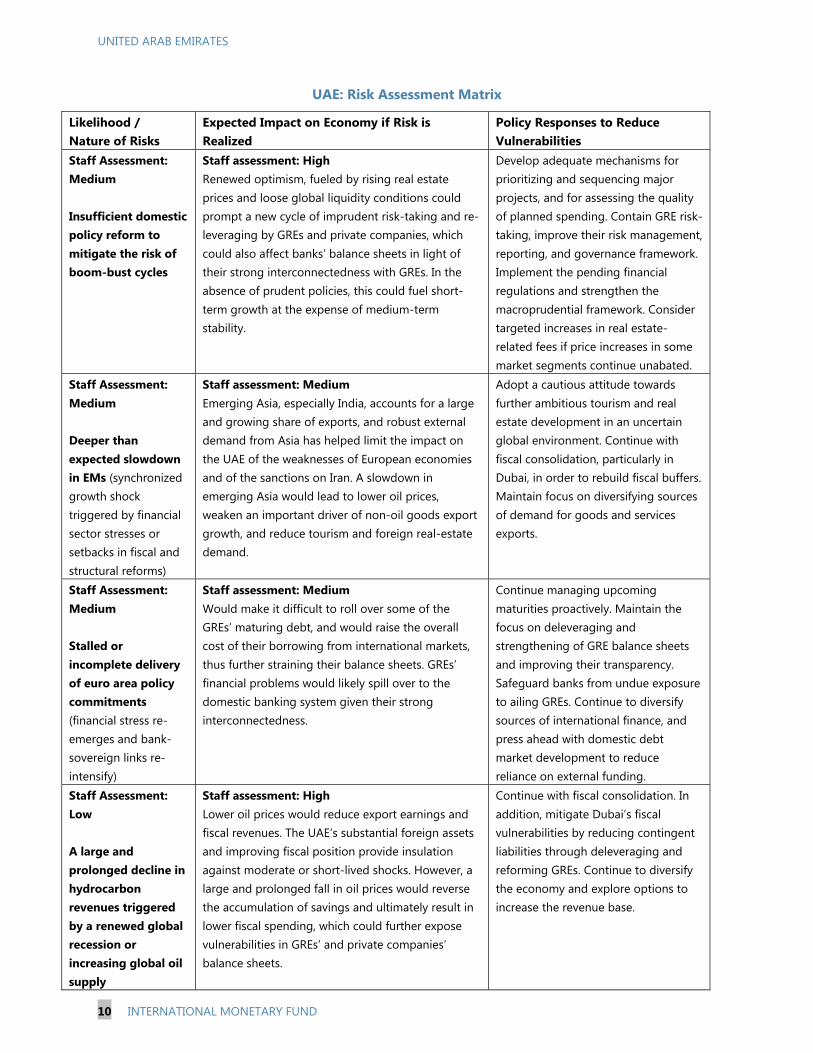
Staff Assessment: Medium Insufficient domestic policy reform to mitigate the risk of boom-bust cycles
Staff assessment: High Renewed optimism, fueled by rising real estate prices and loose global liquidity conditions could prompt a new cycle of imprudent risk-taking and re-leveraging by GREs and private companies, which could also affect banks’ balance sheets in light of their strong interconnectedness with GREs. In the absence of prudent policies, this could fuel short-term growth at the expense of medium-term stability.
Develop adequate mechanisms for prioritizing and sequencing major projects, and for assessing the quality of planned spending. Contain GRE risk-taking, improve their risk management, reporting, and governance framework. Implement the pending financial regulations and strengthen the macroprudential framework. Consider targeted increases in real estate- related fees if price increases in some market segments continue unabated.
Staff Assessment: Medium Deeper than expected slowdown in EMs (synchronized growth shock triggered by financial sector stresses or setbacks in fiscal and structural reforms)
Staff assessment: Medium Emerging Asia, especially India, accounts for a large and growing share of exports, and robust external demand from Asia has helped limit the impact on the UAE of the weaknesses of European economies and of the sanctions on Iran. A slowdown in emerging Asia would lead to lower oil prices, weaken an important driver of non-oil goods export growth, and reduce tourism and foreign real-estate demand.
Adopt a cautious attitude towards further ambitious tourism and real estate development in an uncertain global environment. Continue with fiscal consolidation, particularly in Dubai, in order to rebuild fiscal buffers. Maintain focus on diversifying sources of demand for goods and services exports.
Staff Assessment: Medium Stalled or incomplete delivery of euro area policy commitments (financial stress re-emerges and bank-sovereign links re-intensify)
Staff assessment: Medium Would make it difficult to roll over some of the GREs’ maturing debt, and would raise the overall cost of their borrowing from international markets, thus further straining their balance sheets. GREs’ financial problems would likely spill over to the domestic banking system given their strong interconnectedness.
Continue managing upcoming maturities proactively. Maintain the focus on deleveraging and strengthening of GRE balance sheets and improving their transparency. Safeguard banks from undue exposure to ailing GREs. Continue to diversify sources of international finance, and press ahead with domestic debt market development to reduce reliance on external funding.
Staff Assessment: Low A large and prolonged decline in hydrocarbon revenues triggered by a renewed global recession or increasing global oil supply
Staff assessment: High Lower oil prices would reduce export earnings and fiscal revenues. The UAE’s substantial foreign assets and improving fiscal position provide insulation against moderate or short-lived shocks. However, a large and prolonged fall in oil prices would reverse the accumulation of savings and ultimately result in lower fiscal spending, which could further expose vulnerabilities in GREs’ and private companies’ balance sheets.
Continue with fiscal consolidation. In addition, mitigate Dubai’s fiscal vulnerabilities by reducing contingent liabilities through deleveraging and reforming GREs. Continue to diversify the economy and explore options to increase the revenue base.
UNITED ARAB EMIRATES
INTERNATIONAL MONETARY FUND 11
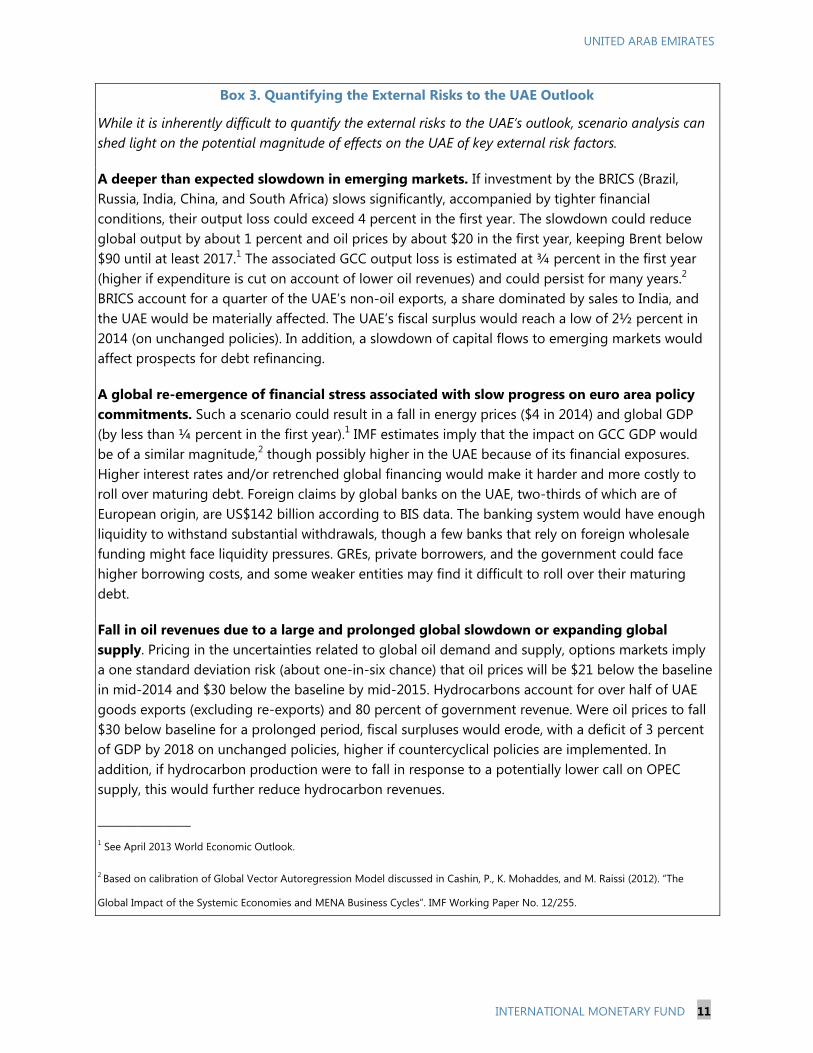
Box 3. Quantifying the External Risks to the UAE Outlook
While it is inherently difficult to quantify the external risks to the UAE’s outlook, scenario analysis can shed light on the potential magnitude of effects on the UAE of key external risk factors.
A deeper than expected slowdown in emerging markets. If investment by the BRICS (Brazil, Russia, India, China, and South Africa) slows significantly, accompanied by tighter financial conditions, their output loss could exceed 4 percent in the first year. The slowdown could reduce global output by about 1 percent and oil prices by about $20 in the first year, keeping Brent below $90 until at least 2017.1 The associated GCC output loss is estimated at ¾ percent in the first year (higher if expenditure is cut on account of lower oil revenues) and could persist for many years.2
BRICS account for a quarter of the UAE’s non-oil exports, a share dominated by sales to India, and the UAE would be materially affected. The UAE’s fiscal surplus would reach a low of 2½ percent in 2014 (on unchanged policies). In addition, a slowdown of capital flows to emerging markets would affect prospects for debt refinancing.
A global re-emergence of financial stress associated with slow progress on euro area policy commitments. Such a scenario could result in a fall in energy prices ($4 in 2014) and global GDP (by less than ¼ percent in the first year).1 IMF estimates imply that the impact on GCC GDP would be of a similar magnitude,2 though possibly higher in the UAE because of its financial exposures. Higher interest rates and/or retrenched global financing would make it harder and more costly to roll over maturing debt. Foreign claims by global banks on the UAE, two-thirds of which are of European origin, are US$142 billion according to BIS data. The banking system would have enough liquidity to withstand substantial withdrawals, though a few banks that rely on foreign wholesale funding might face liquidity pressures. GREs, private borrowers, and the government could face higher borrowing costs, and some weaker entities may find it difficult to roll over their maturing debt.
Fall in oil revenues due to a large and prolonged global slowdown or expanding global supply. Pricing in the uncertainties related to global oil demand and supply, options markets imply a one standard deviation risk (about one-in-six chance) that oil prices will be $21 below the baseline in mid-2014 and $30 below the baseline by mid-2015. Hydrocarbons account for over half of UAE goods exports (excluding re-exports) and 80 percent of government revenue. Were oil prices to fall $30 below baseline for a prolonged period, fiscal surpluses would erode, with a deficit of 3 percent of GDP by 2018 on unchanged policies, higher if countercyclical policies are implemented. In addition, if hydrocarbon production were to fall in response to a potentially lower call on OPEC supply, this would further reduce hydrocarbon revenues.
——————— 1 See April 2013 World Economic Outlook.
2 Based on calibration of Global Vector Autoregression Model discussed in Cashin, P., K. Mohaddes, and M. Raissi (2012). “The
Global Impact of the Systemic Economies and MENA Business Cycles”. IMF Working Paper No. 12/255.
UNITED ARAB EMIRATES
12 INTERNATIONAL MONETARY FUND
POLICY DISCUSSIONS In the context of a strengthening economic recovery, quickly rising real estate prices in some market segments, and newly announced megaprojects in real estate and tourism, discussions focused on policies to strengthen fiscal and external buffers, bolster the GRE and financial sectors, and minimize the risk of entering a renewed boom/bust cycle, while continuing to focus on managing the legacy of the 2009 crisis by continuing the deleveraging and restructuring of GREs.
A. Correcting Imbalances while Supporting the Economy 11. The authorities plan for continued fiscal consolidation in 2013. The combined budgets of the federal and emirate governments indicate a consolidation of the fiscal stance by around 2 percent of nonhydrocarbon GDP, driven by continued consolidation in Abu Dhabi and Dubai. The fiscal consolidation is expected to be achieved by a rationalization of capital spending and subsidies and transfers, while spending on goods and services, defense and security, and the wage bill are expected to increase. A notable increase in development spending is a large affordable housing program in Abu Dhabi which will be offset by cuts in other capital spending including loans and equity. Dubai scaled down its development spending last year after completing a series of important infrastructure projects and intends to cut overall spending in 2013, except for an increase in wages and salaries.
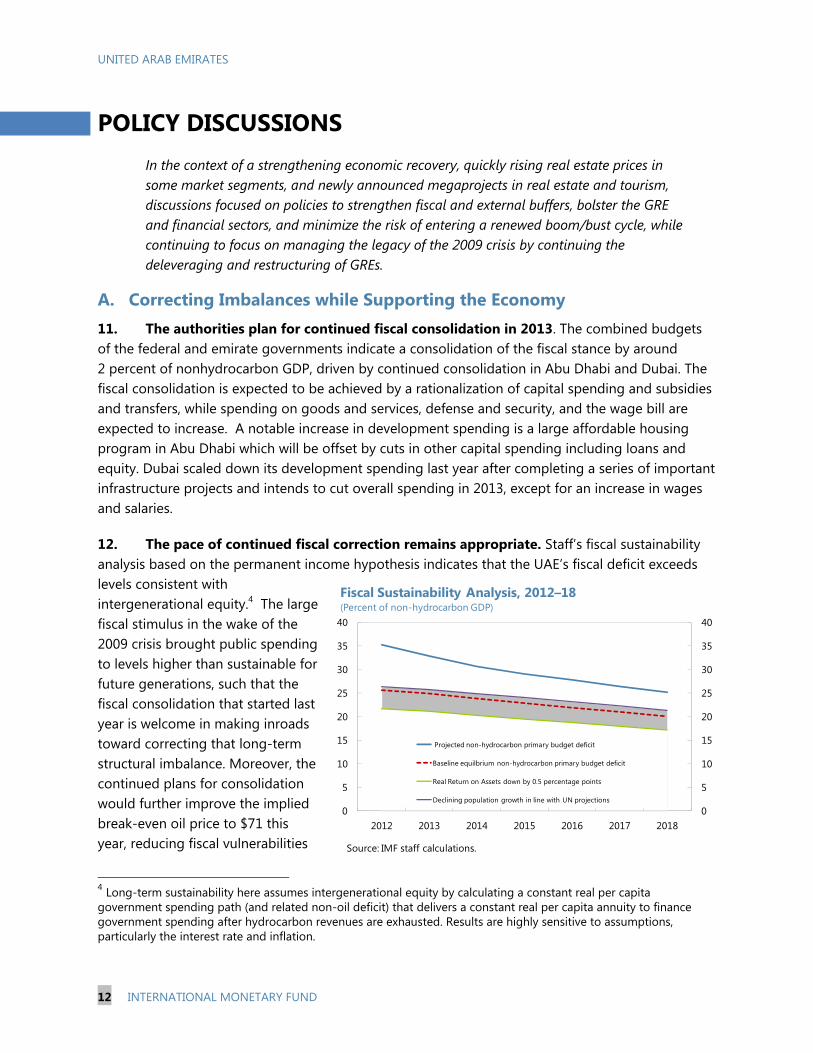
12. The pace of continued fiscal correction remains appropriate. Staff’s fiscal sustainability analysis based on the permanent income hypothesis indicates that the UAE’s fiscal deficit exceeds levels consistent with intergenerational equity.4 The large fiscal stimulus in the wake of the 2009 crisis brought public spending to levels higher than sustainable for future generations, such that the fiscal consolidation that started last year is welcome in making inroads toward correcting that long-term structural imbalance. Moreover, the continued plans for consolidation would further improve the implied break-even oil price to $71 this year, reducing fiscal vulnerabilities
4 Long-term sustainability here assumes intergenerational equity by calculating a constant real per capita government spending path (and related non-oil deficit) that delivers a constant real per capita annuity to finance government spending after hydrocarbon revenues are exhausted. Results are highly sensitive to assumptions, particularly the interest rate and inflation.
0
5
10
15
20
25
30
35
40
0
5
10
15
20
25
30
35
40
2012 2013 2014 2015 2016 2017 2018
Projected non-hydrocarbon primary budget deficit
Baseline equilbrium non-hydrocarbon primary budget deficit
Real Return on Assets down by 0.5 percentage points
Declining population growth in line with UN projections
Source: IMF staff calculations.
Fiscal Sustainability Analysis, 2012–18(Percent of non-hydrocarbon GDP)
UNITED ARAB EMIRATES
INTERNATIONAL MONETARY FUND 13
to a marked decline in oil prices. At the same time, the recovery in the non-oil economy has gained momentum and is unlikely to be undermined by the planned pace of withdrawal of fiscal stimulus.
13. Medium-term fiscal plans point to further consolidation. Both Abu Dhabi and Dubai target continued gradual consolidation in their non-oil balances through 2017, further correcting for the UAE’s long-term intergenerational fiscal imbalances, reducing oil-price related risks, and, in the case of Dubai, addressing debt-related concerns. Fiscal consolidation will be driven by restraint in capital expenditure in the context of solid economic growth. It should also be supported by reductions in energy subsidies, which would create fiscal space while improving energy efficiency. Moreover, limiting further wage bill increases would support the objectives of maintaining flexibility of the budget and making private sector employment more attractive for nationals. Over the medium- to long-term, efforts should focus on returning the fiscal stance to levels consistent with intergenerational equity. At the emirate level, a faster pace of consolidation in Dubai would be desirable to address the emirate’s continued debt-related risks, as indicated by the debt sustainability analysis (Box 4). In Abu Dhabi, planned cuts in subsidies and transfers in 2013 should be sustained in the period ahead.
14. Ensuring the long-term sustainability of Dubai’s public finances would require efforts to secure a stable and buoyant revenue base. Dubai’s non-hydrocarbon revenues amounted to a mere 5½ percent of GDP in 2012. Currently, the government of Dubai has no plans to implement income or corporate taxes, and the timing of the GCC-wide initiative of introducing a VAT is uncertain. Targeted increases in real estate-related fees from the current level of 2 percent could be considered, particularly if risks of overheating in the real estate market rise, which would help mitigate risks of a renewed real estate bubble while generating revenue in support of the emirate’s ongoing fiscal consolidation.5 The government of Dubai indicated that fee increases (or the introduction of new fees) could affect the emirate’s competitiveness, and would thus likely only be considered in coordination with other emirates and the federal government.
15. The introduction of a medium-term fiscal framework (MTFF) can help secure effective implementation of the UAE’s fiscal policy objectives and enhance fiscal coordination. A medium-term planning horizon is particularly important to prevent volatile oil revenues from translating into expenditure fluctuations that can destabilize the economy and reduce the quality of government spending. The federal government, Dubai, and Abu Dhabi have all made progress in developing MTFFs. The federal government adopted a medium-term budget in line with the federal strategy to set future budget priorities. Abu Dhabi has been making progress in developing analytical capacity for MTFF to inform policy decision making, while Dubai implements a three-year budget framework to guide the budgeting process. Based on these achievements, the authorities should continue to refine their MTFFs, and, in the case of Abu Dhabi, increasingly integrate its MTFF into the budget formulation process.
5 By way of comparison, in the context of a sharp run-up in real estate prices, Hong Kong SAR has increasingly tightened its policies, and recently raised fees for properties resold within six months from 15 to 20 percent and introduced a 5 percent fee for properties resold within two to three years. A 15 percent fee was introduced for buyers who are not permanent residents.
UNITED ARAB EMIRATES
14 INTERNATIONAL MONETARY FUND
Box 4. Dubai’s Debt Sustainability
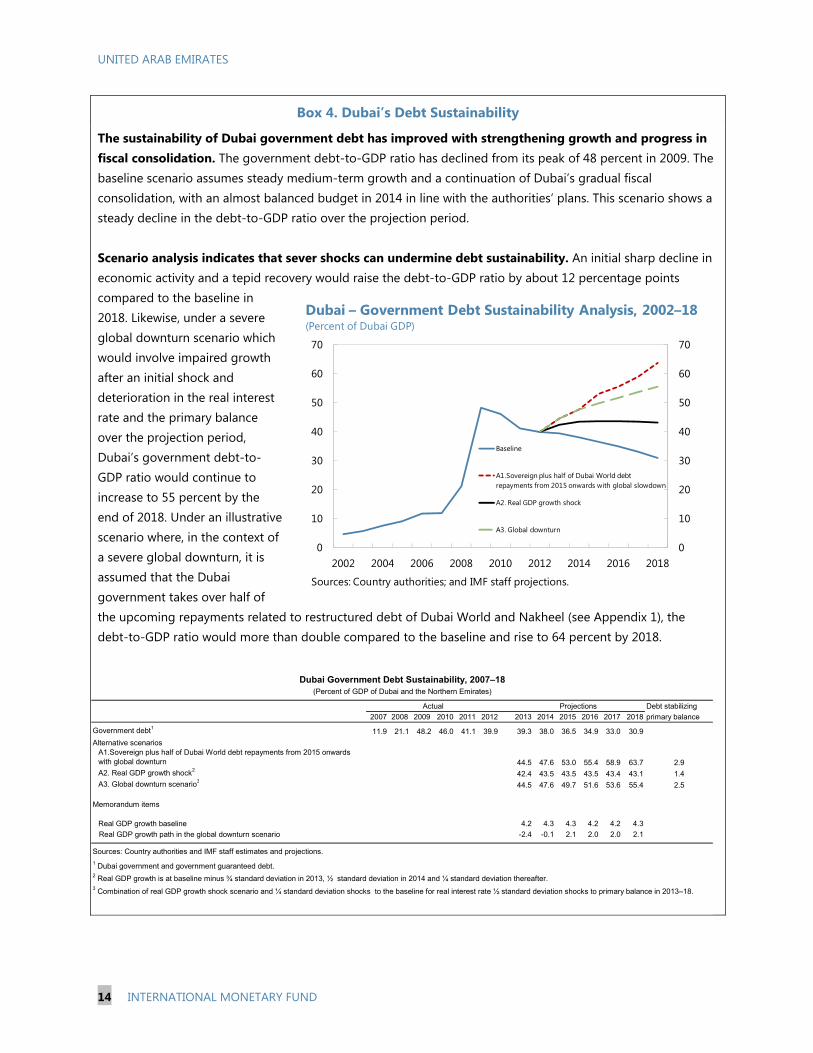
The sustainability of Dubai government debt has improved with strengthening growth and progress in fiscal consolidation. The government debt-to-GDP ratio has declined from its peak of 48 percent in 2009. The baseline scenario assumes steady medium-term growth and a continuation of Dubai’s gradual fiscal consolidation, with an almost balanced budget in 2014 in line with the authorities’ plans. This scenario shows a steady decline in the debt-to-GDP ratio over the projection period. Scenario analysis indicates that sever shocks can undermine debt sustainability. An initial sharp decline in economic activity and a tepid recovery would raise the debt-to-GDP ratio by about 12 percentage points compared to the baseline in 2018. Likewise, under a severe global downturn scenario which would involve impaired growth after an initial shock and deterioration in the real interest rate and the primary balance over the projection period, Dubai’s government debt-to-GDP ratio would continue to increase to 55 percent by the end of 2018. Under an illustrative scenario where, in the context of a severe global downturn, it is assumed that the Dubai government takes over half of the upcoming repayments related to restructured debt of Dubai World and Nakheel (see Appendix 1), the debt-to-GDP ratio would more than double compared to the baseline and rise to 64 percent by 2018.
0
10
20
30
40
50
60
70
0
10
20
30
40
50
60
70
2002 2004 2006 2008 2010 2012 2014 2016 2018
Baseline
A1.Sovereign plus half of Dubai World debt repayments from 2015 onwards with global slowdown
A2. Real GDP growth shock
A3. Global downturn
Sources: Country authorities; and IMF staff projections.
Dubai – Government Debt Sustainability Analysis, 2002–18(Percent of Dubai GDP)
Debt stabilizing
2007 2008 2009 2010 2011 2012 2013 2014 2015 2016 2017 2018 primary balance
Government debt1 11.9 21.1 48.2 46.0 41.1 39.9 39.3 38.0 36.5 34.9 33.0 30.9
Alternative scenariosA1.Sovereign plus half of Dubai World debt repayments from 2015 onwards with global downturn 44.5 47.6 53.0 55.4 58.9 63.7 2.9A2. Real GDP growth shock2
42.4 43.5 43.5 43.5 43.4 43.1 1.4A3. Global downturn scenario3
44.5 47.6 49.7 51.6 53.6 55.4 2.5
Memorandum items
Real GDP growth baseline 4.2 4.3 4.3 4.2 4.2 4.3
Real GDP growth path in the global downturn scenario -2.4 -0.1 2.1 2.0 2.0 2.1
Sources: Country authorities and IMF staff estimates and projections.
1 Dubai government and government guaranteed debt.2 Real GDP growth is at baseline minus ¾ standard deviation in 2013, ½ standard deviation in 2014 and ¼ standard deviation thereafter.
Dubai Government Debt Sustainability, 2007–18(Percent of GDP of Dubai and the Northern Emirates)
Actual Projections
3 Combination of real GDP growth shock scenario and ¼ standard deviation shocks to the baseline for real interest rate ½ standard deviation shocks to primary balance in 2013–18.
UNITED ARAB EMIRATES
INTERNATIONAL MONETARY FUND 15
16. Monetary policy continues to support the U.S. dollar peg, which has served the UAE well. The policy rate has been at 1 percent with a stable spread over the Fed funds rate since 2008 (Figure 1), and there are few near-term inflationary risks despite an expected pick-up in the housing component of inflation. The real effective exchange rate (REER) depreciated slightly in 2012, continuing a trend since 2009. Different methodologies yield mixed results for the exchange rate assessment (Appendix 2). The projected current account balance of 7.4 percent for 2018 is close to the estimate for the norm implied by the macrobalance approach (7 percent). The external sustainability approach, which considers the level of imports consistent with intergenerational equity, implies a need to accumulate further savings of about 9 percent of GDP in 2018. Since the adjustment needs are centered on government rather than the private sector (see above), adjustment should occur through fiscal consolidation rather than exchange rate devaluation. By contrast, the equilibrium exchange rate approach indicates that the currency has not matched the increase in oil prices since 2009, which implies moderate undervaluation under this model.
B. Managing Old and New Risks Stemming from GREs
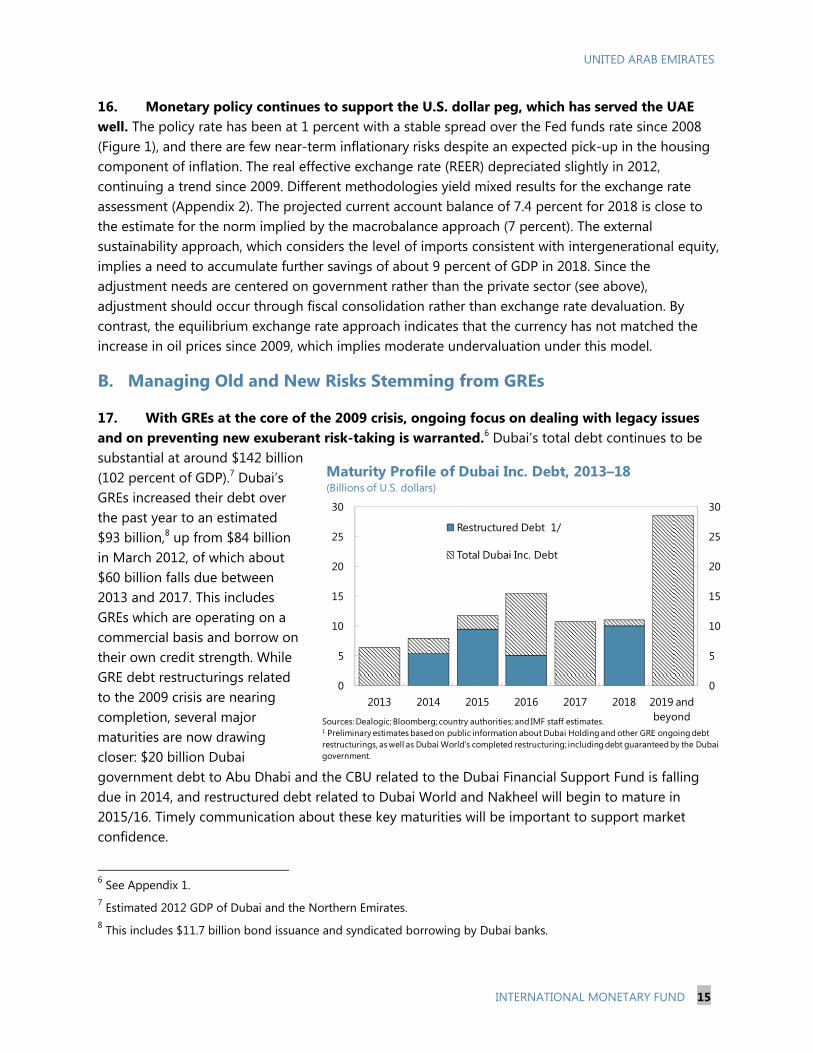
17. With GREs at the core of the 2009 crisis, ongoing focus on dealing with legacy issues and on preventing new exuberant risk-taking is warranted.6 Dubai’s total debt continues to be substantial at around $142 billion (102 percent of GDP).7 Dubai’s GREs increased their debt over the past year to an estimated $93 billion,8 up from $84 billion in March 2012, of which about $60 billion falls due between 2013 and 2017. This includes GREs which are operating on a commercial basis and borrow on their own credit strength. While GRE debt restructurings related to the 2009 crisis are nearing completion, several major maturities are now drawing closer: $20 billion Dubai government debt to Abu Dhabi and the CBU related to the Dubai Financial Support Fund is falling due in 2014, and restructured debt related to Dubai World and Nakheel will begin to mature in 2015/16. Timely communication about these key maturities will be important to support market confidence.
6 See Appendix 1. 7 Estimated 2012 GDP of Dubai and the Northern Emirates. 8 This includes $11.7 billion bond issuance and syndicated borrowing by Dubai banks.
0
5
10
15
20
25
30
0
5
10
15
20
25
30
2013 2014 2015 2016 2017 2018 2019 and beyond
Restructured Debt 1/
Total Dubai Inc. Debt
Sources: Dealogic; Bloomberg; country authorities; and IMF staff estimates.1 Preliminary estimates based on public information about Dubai Holding and other GRE ongoing debt restructurings, as well as Dubai World's completed restructuring; including debt guaranteed by the Dubai government.
Maturity Profile of Dubai Inc. Debt, 2013–18(Billions of U.S. dollars)
UNITED ARAB EMIRATES
16 INTERNATIONAL MONETARY FUND
18. Dubai’s ambitious expansion plans warrant measured execution amid strengthening access to external financing. Dubai’s megaprojects will be executed to a large extent through GREs. Although further investment in the development of Dubai’s economy is welcome, the authorities should ensure that execution will be gradual and structured in a way that strictly limits risk-taking by the still highly indebted GRE sector. This will help contain fiscal risks and reduce the likelihood of another boom-bust cycle. Managing these risks thus calls for prioritizing and sequencing major projects, assessing the quality of planned spending, and for improving the framework to manage scrutiny, selection, delivery, and funding of major projects.
19. Ongoing focus on improving the transparency of Dubai’s GREs will be important to strengthen their resilience. Abu Dhabi has made notable progress in monitoring and disseminating GRE debt and other financial data through its debt management office. Data availability on financial conditions, debt stocks and maturity profiles of Dubai’s GREs, however, continues to be inadequate for an assessment of the sector’s financial health and associated macroeconomic risks. The Dubai government has created a dedicated team for government debt and guarantee issuance. Building on this, Dubai should establish a full debt management office, which would be tasked with implementing a proper risk management framework entailing effective identification, assessment, monitoring, and reporting of contingent liabilities arising from GREs.
20. Further strengthening the Dubai GREs’ corporate governance is also key. The Dubai government has replaced many GRE boards of directors since the 2009 crisis, with representation of key government officials on these boards, and introduced a requirement for approval by the Supreme Fiscal Committee of any new GRE borrowing. Building on these improvements, key steps for further strengthening the GRE’s corporate governance include (i) delineating clearly their commercial and noncommercial operations; (ii) expanding the coverage of the 2009 corporate governance code to public companies; (iii) strengthening the role and independence of company boards to allow for more effective decision making; and (iv) improving risk management practices.
21. The Dubai government emphasized that important lessons have been learnt from the 2009 crisis. While acknowledging that certain segments of the Dubai real estate market have been recovering fast and that Dubai GREs have been regaining access to foreign funding, the Dubai government stressed that the exuberance of the pre-crisis period that led to the previous boom-bust cycle is unlikely to return as the planned megaprojects will be executed in a gradual manner over the medium- and long-term. Regarding Dubai’s debt, the Dubai authorities noted that, as in the case of their January 2013 bond issuance, which pre-funded the 2013 government bond maturities, they would continue to be proactive in debt refinancing, aiming to diversify funding sources and to extend maturities by taking advantage of the low interest rate environment.
UNITED ARAB EMIRATES
INTERNATIONAL MONETARY FUND 17
C. Financial Sector Soundness and Financial Spillovers
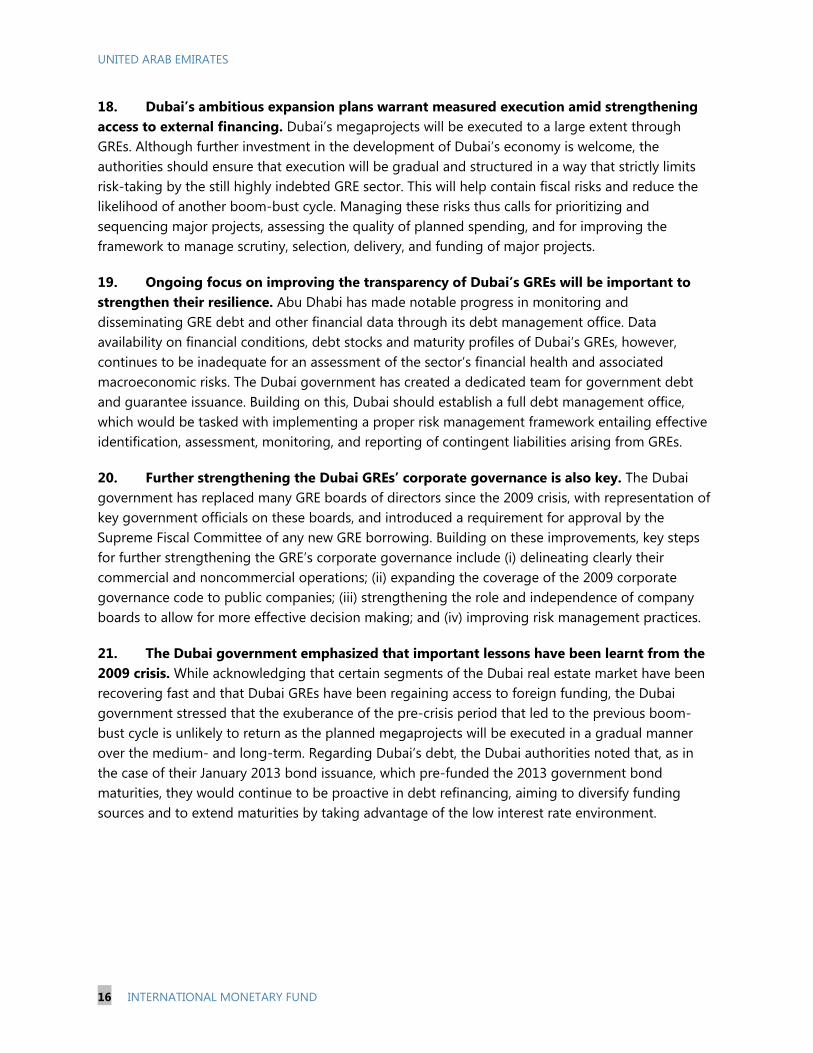
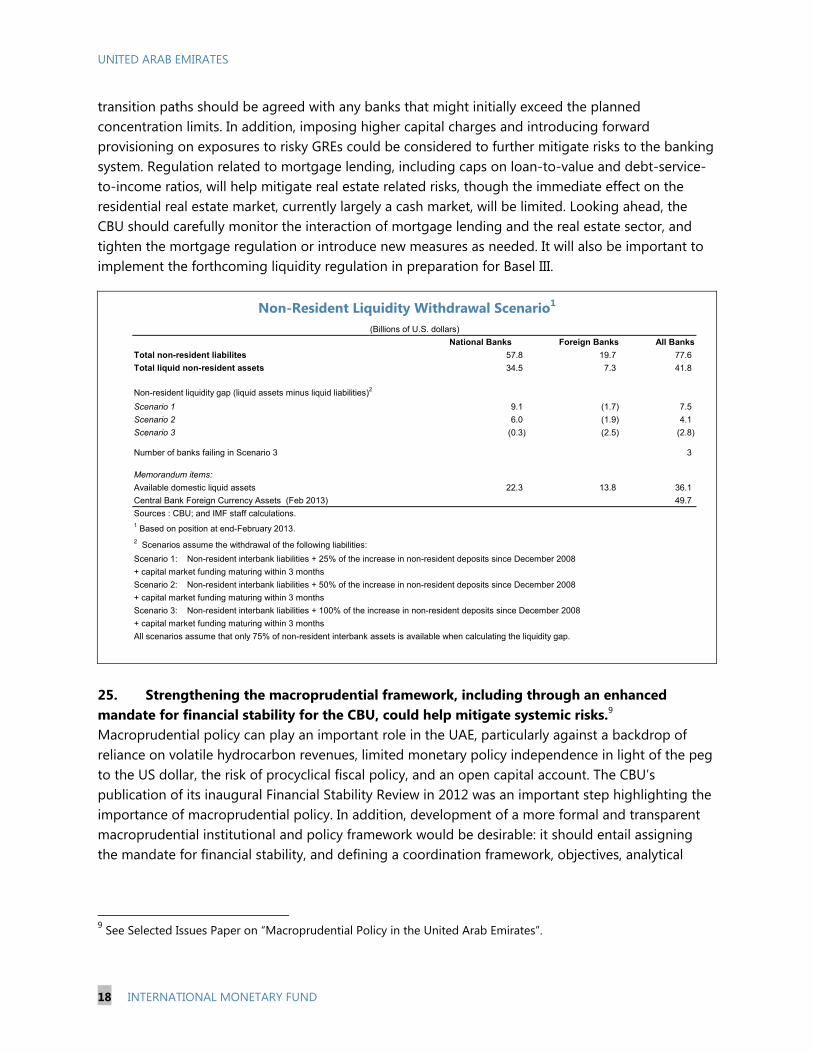
22. The banking system maintains significant capital and liquidity buffers. While the level of NPLs may have peaked, a potential further restructuring of GRE debt, including possibly on already restructured debt, could still raise this level. Joint CBU/IMF staff stress tests show that the domestic banking system could absorb even a significant increase in NPLs, with only a few banks falling somewhat below the mandated minimum capital adequacy requirement in the event of an extreme shock. Nonetheless, stricter recognition of NPLs and higher provisioning, particularly for restructured loans, would further strengthen confidence in the banking system. Stress tests on non-resident liquidity withdrawal from the system further show that it would take a very large shock to generate even a moderate systemic liquidity need, concentrated in a few banks, and still well within banks’ holdings of CDs and reserves at the CBU.
Credit Risk Stress Testing for UAE Banks
23. Shielding the banking system from concentration risk to the GRE and real estate sectors is key. The UAE’s banks are strongly interconnected with GREs through ownership and financial linkages. The interconnectedness, coupled with non-transparent corporate governance structures and practices, makes managing the evolution of interconnected leverage challenging, and could give rise to systemic risks. While GRE activities remain an integral part of the UAE economy and their regular financial operations are key to supporting balanced growth, it remains essential that rapid credit expansion and undue loan concentration to this sector be avoided to lessen the risk of a renewed boom-bust cycle and to safeguard financial stability.
24. Implementing the planned mortgage lending regulation and loan concentration limits on GREs and emirate governments will help bolster financial stability. Following the consultation with banks, these regulations should be implemented as soon as possible. Gradual
Regulatory capital
Tier 1 capital
Regulatory capital
Tier 1 capital
CAR (Feb 2013) 20.8 16.8 19.8 14.9NPL ratio (Feb 2013) 8.3 8.3 12.6 12.6
Baseline scenarioNPL ratio1 11.3 11.3 15.6 15.6CAR 19.7 15.5 17.8 13.1
Stress scenario(50 percent increase in NPLs from baseline)NPL ratio 17.0 17.0 23.4 23.4CAR 16.6 12.3 13.5 8.2
Number of banks falling below the regulatory minimum in the stress scenario 2 4 … …
Memorandum itemsMinimum regulatory capital 12.0 8.0 12.0 8.0Source: IMF staff estimates and calculations.
1 Takes into account potential NPLs pertaining to a scenario whereby Dubai World's restructured loans maturing in 2015 need to be restructured again at maturity.
(Percent) UAE Local Banks Dubai Banks
UNITED ARAB EMIRATES
18 INTERNATIONAL MONETARY FUND
transition paths should be agreed with any banks that might initially exceed the planned concentration limits. In addition, imposing higher capital charges and introducing forward provisioning on exposures to risky GREs could be considered to further mitigate risks to the banking system. Regulation related to mortgage lending, including caps on loan-to-value and debt-service-to-income ratios, will help mitigate real estate related risks, though the immediate effect on the residential real estate market, currently largely a cash market, will be limited. Looking ahead, the CBU should carefully monitor the interaction of mortgage lending and the real estate sector, and tighten the mortgage regulation or introduce new measures as needed. It will also be important to implement the forthcoming liquidity regulation in preparation for Basel III.
Non-Resident Liquidity Withdrawal Scenario1
25. Strengthening the macroprudential framework, including through an enhanced mandate for financial stability for the CBU, could help mitigate systemic risks.9 Macroprudential policy can play an important role in the UAE, particularly against a backdrop of reliance on volatile hydrocarbon revenues, limited monetary policy independence in light of the peg to the US dollar, the risk of procyclical fiscal policy, and an open capital account. The CBU’s publication of its inaugural Financial Stability Review in 2012 was an important step highlighting the importance of macroprudential policy. In addition, development of a more formal and transparent macroprudential institutional and policy framework would be desirable: it should entail assigning the mandate for financial stability, and defining a coordination framework, objectives, analytical
9 See Selected Issues Paper on “Macroprudential Policy in the United Arab Emirates”.
National Banks Foreign Banks All Banks
Total non-resident liabilites 57.8 19.7 77.6
Total liquid non-resident assets 34.5 7.3 41.8
Non-resident liquidity gap (liquid assets minus liquid liabilities)2
Scenario 1 9.1 (1.7) 7.5
Scenario 2 6.0 (1.9) 4.1
Scenario 3 (0.3) (2.5) (2.8)
Number of banks failing in Scenario 3 3
Memorandum items:
Available domestic liquid assets 22.3 13.8 36.1
Central Bank Foreign Currency Assets (Feb 2013) 49.7
Sources : CBU; and IMF staff calculations.1 Based on position at end-February 2013.2 Scenarios assume the withdrawal of the following liabilities:
Scenario 1: Non-resident interbank liabilities + 25% of the increase in non-resident deposits since December 2008
+ capital market funding maturing within 3 months
Scenario 2: Non-resident interbank liabilities + 50% of the increase in non-resident deposits since December 2008
+ capital market funding maturing within 3 months
Scenario 3: Non-resident interbank liabilities + 100% of the increase in non-resident deposits since December 2008
+ capital market funding maturing within 3 months
All scenarios assume that only 75% of non-resident interbank assets is available when calculating the liquidity gap.
(Billions of U.S. dollars)
UNITED ARAB EMIRATES
INTERNATIONAL MONETARY FUND 19
methods, and the policy toolkit. The adoption of the draft Financial Services Law would provide an opportunity to establish the legal base for an improved macroprudential policy framework.
26. The planned financial sector assessment will be a welcome opportunity to review the sector’s strengths and weaknesses. The mission believes that an assessment under the Financial Sector Assessment Program (FSAP), now planned for late 2014, could play an important role in further strengthening the CBU as banking system regulator and supervisor, while facilitating further financial sector development.
27. Gross foreign inflows to the banking sector remain steady and would deserve closer monitoring. Non-resident deposits have increased by more than 15 percent in 2012 and account for 12 percent of total deposits. In the context of mounting international efforts against money laundering and tax crimes, the authorities are encouraged to continue improving their understanding of the origin of financial inflows and of the beneficial owners of deposits and loans in the UAE. This would assist in effectively mitigating potential financial sector risks. In light of the 2008 anti-money laundering and combating the financing of terrorism (AML/CFT) mutual evaluation report and follow-up reports, as well as of the revised Financial Action Task Force (FATF) standard, the authorities are encouraged to continue their efforts in bolstering the soundness of the financial sector which could benefit from measures designed to improve compliance with the standard, including those related to customer due diligence, cross-border cash couriers, and hawaladars. In addition, staff invites the authorities to undergo an AML/CFT assessment in the context of the planned FSAP.
28. The CBU agreed that the banking system should be shielded from excessive exposure to the real estate and GRE sectors. The CBU highlighted its efforts to ensure that the banking system continues to have adequate buffers in the coming years, when a significant amount of restructured debt is coming due. To this end, it imposed increasing general provisioning requirements over time, and also stated its intention to continue with its policy of restricting dividend distributions as needed. It stressed that the planned mortgage lending and loan concentration caps, which were calibrated following consultation with the banking sector, will limit excessive exposure while allowing for continued lending to these important sectors. The CBU underscored recent measures it has taken to strengthen its macroprudential framework and analysis, including increased resources for the Financial Stability Unit and expanding the analytical toolkit. The authorities also noted that the current draft of the Financial Services Law explicitly provides a legal base for an improved financial stability framework. They also stressed their strong efforts in the area of AML/CFT, including domestic regulation and international cooperation.
D. Structural and Statistical Issues
29. Effective intergovernmental coordination of fiscal policy will reinforce effective demand management and fiscal sustainability. Given the federal structure, fiscal coordination between the federal and emirate governments is important for strengthening near- and medium-term fiscal planning. Notable progress has been made in sharing information on fiscal outcomes among governments, facilitated by the Fiscal Policy Coordination Council. Staff encouraged the
UNITED ARAB EMIRATES
20 INTERNATIONAL MONETARY FUND
authorities to further strengthen fiscal coordination by continuing to improve the quality and scope of shared information, leveraging the information for macrofiscal analysis to inform policy-making, enhancing expenditure policy coordination, and jointly discussing budgets and medium-term fiscal plans. The authorities agreed on the importance of sustained efforts in this area, in collaboration with the IMF through technical assistance.
30. Developing the local currency debt market should be given greater urgency. Domestic debt market development would help reduce UAE firms’ reliance on foreign funding and provide an alternative to borrowing from the domestic banking sector, especially for long-term funds. As a first step, the government securities market should be developed, providing a benchmark yield curve and facilitating liquidity management with a view to the forthcoming Basel III liquidity norms for banks. The federal and Abu Dhabi governments are both considering the issuance of domestic debt to meet these objectives.
31. The UAE has been working for several years on a set of laws in a push to modernize its legislative system.10 Swiftly passing these laws, in particular the Insolvency Law, the Financial Services Law, and the Public Debt Law, would be crucial to improving the effectiveness of the debt restructuring process and financial sector regulation and supervision, as well as to developing the domestic debt market.
32. Steering nationals towards private-sector jobs has become a priority. Only a fraction of nationals currently work in the private sector, and emiratization efforts have primarily been based on training and placement programs and partnership initiatives with the private sector. The authorities are considering additional measures to attract Emiratis to the private sector, recognizing that effective labor market reform is a long-term policy agenda, with a wide range of measures including reforms to the sponsorship system, internal labor market mobility, improved social protection schemes, and, possibly, subsidies for employing nationals in the private sector.
33. Further improving the UAE’s statistical capacity remains key. The authorities have made laudable progress in preparing consolidated government finance statistics, as evidenced by the UAE’s submission of its fiscal accounts to the GFS Yearbook for the first time in 2012. Moreover, the planned introduction of an international transactions reporting system at the CBU will be an important step toward strengthening the quality of balance of payments statistics. It will be important to maintain the momentum of strengthening economic statistics by providing adequate resources for improving the quality of the national accounts and for producing demographic and labor markets statistics, while continuing to strengthen balance of payments statistics. The authorities indicated interest in beginning to develop statistics on the International Investment Position, which will be essential to close an important statistical gap.
10 These laws include the Commercial Companies Law, Auditors Law, Arbitration Law, Foreign Investment Law, Industry Law, Insolvency Law, Small and Medium Enterprises Law, Financial Services Law, and Public Debt Law.
UNITED ARAB EMIRATES
INTERNATIONAL MONETARY FUND 21
STAFF APPRAISAL 34. Short- and medium-term growth prospects are positive, and external downside risks, while still substantial, have declined. The non-oil economy is projected to expand by over 4 percent per annum in the coming years on the back of Dubai’s strong core services sectors and Abu Dhabi’s diversification efforts. The still-uncertain global economic and financial environment could pose external risks to this favorable outlook, although the UAE’s sizeable foreign assets and improving fiscal position provide significant buffers.
35. In this environment, it will be key to enact policies to strengthen the economy’s resilience and mitigate the risk of entering a renewed boom-bust cycle. The pace of recovery in some segments of the real estate market and a number of announcements since late 2012 of new megaprojects in real estate and tourism warrant a cautious approach to policymaking. This approach should entail implementing further fiscal consolidation, limiting new risk-taking by the large and still highly indebted GRE sector, and devising prudent financial sector regulation. At the same time, there is a need for continued focus on dealing with the legacy of the 2009 crisis.
36. Fiscal policy is appropriately aimed at consolidation. The strengthening economy allows for further withdrawal of the large fiscal stimulus implemented in the context of the 2009 crisis, bringing spending again closer to levels consistent with intergenerational equity, and further reducing break-even oil prices. Fiscal consolidation will also help contain fiscal vulnerabilities stemming from Dubai in the face of potentially large contingent liabilities. Should the rise in real estate prices in some sectors continue unabated, the authorities should consider implementing targeted increases in real estate-related fees, which could help mitigate speculative price pressures while generating revenue in support of fiscal consolidation. Building on recent progress in developing MTFFs, such frameworks should continue to be refined, and, in the case of Abu Dhabi, increasingly integrated into the budget formulation process.
37. Building on progress in restructuring the debt of GREs, Dubai should continue to focus on strengthening the GRE sector. The total debt of the Dubai government and GREs continues to be large, and GREs are likely to continue facing financial challenges in light of large outstanding debt and significant maturities, including on restructured debt, falling due between 2014 and 2018. Many of Dubai’s GREs continue to be nontransparent, making an assessment of the sector’s financial health and associated macroeconomic risks difficult. Improving the transparency and governance of GREs, as well as timely communication about key maturing debt will be important to support market confidence.
38. Close oversight of the GREs will be essential to prevent a renewed cycle of risk-taking. Dubai’s GREs and banks are increasingly regaining access to external financing in an environment of high global liquidity and search for yield. Renewed large-scale external and domestic borrowing to finance ambitious real estate and tourism projects should be preempted to avoid setting off a new boom-bust cycle. Continued close oversight of GREs by the Dubai Supreme Fiscal Committee will be
UNITED ARAB EMIRATES
22 INTERNATIONAL MONETARY FUND
essential, and should be strengthened by developing adequate mechanisms for prioritizing and sequencing major projects, and for assessing the quality of planned spending.
39. The implementation of planned prudential regulations will help mitigate the risk of a build-up of banking sector vulnerabilities. With significant capital and liquidity buffers, banks show substantial resilience to shocks. Building on this strength, it will be important to preempt the build-up of new vulnerabilities. Swift implementation of the planned new prudential regulations for mortgage lending and loan concentration would mitigate the risk of rapid credit expansion and undue loan concentration to the real estate and GRE sectors in the future. These policies should be complemented by developing a more formal and transparent macroprudential institutional and policy framework. The proposed new Financial Services Law provides an opportunity to establish the legal base for such a framework. Developing the domestic fixed income market would support banks’ liquidity management as they prepare for the introduction of the Basel III liquidity norms, and would help the diversification of funding sources for corporates. The planned assessment under the FSAP will be a welcome opportunity to review the financial sector’s strengths and weaknesses. This assessment would also be a suitable occasion to conduct a review of the UAE’s AML/CFT policies.
40. Staff welcomes the notable progress made in fiscal coordination among the federal and emirate governments. Building on this achievement, coordination can be further strengthened by improving the quality and availability of fiscal information and macrofiscal analysis, jointly discussing budgets and MTFFs, and enhancing expenditure policy coordination.
41. Staff encourages the authorities to build on recent progress in improving statistics. It will be important to maintain the recent momentum of strengthening economic statistics by providing adequate resources for improving the quality of the national accounts and for producing demographic and labor markets statistics, while continuing to strengthen balance of payments statistics. Developing statistics on the International Investment Position will be essential to close an important gap.
42. It is recommended that the next Article IV consultation take place on the standard 12-month cycle.
UNITED ARAB EMIRATES
INTERNATIONAL MONETARY FUND 23
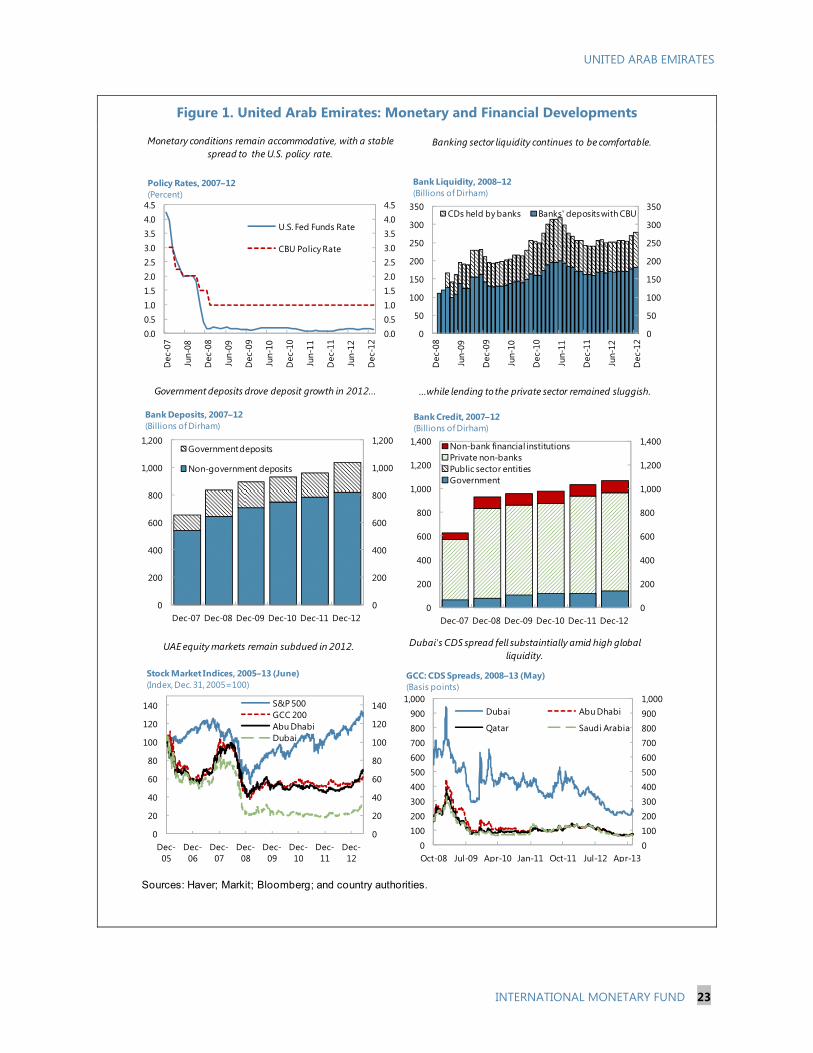
Figure 1. United Arab Emirates: Monetary and Financial Developments
Sources: Haver; Markit; Bloomberg; and country authorities.
0.00.51.01.52.02.53.03.54.04.5
0.00.51.01.52.02.53.03.54.04.5
Dec
-07
Jun-
08
Dec
-08
Jun-
09
Dec
-09
Jun-
10
Dec
-10
Jun-
11
Dec
-11
Jun-
12
Dec
-12
U.S. Fed Funds Rate
CBU Policy Rate
Policy Rates, 2007–12(Percent)
0
50
100
150
200
250
300
350
0
50
100
150
200
250
300
350
Dec
-08
Jun-
09
Dec
-09
Jun-
10
Dec
-10
Jun-
11
Dec
-11
Jun-
12
Dec
-12
CDs held by banks Banks' deposits with CBU
Bank Liquidity, 2008–12(Billions of Dirham)
0
200
400
600
800
1,000
1,200
0
200
400
600
800
1,000
1,200
Dec-07 Dec-08 Dec-09 Dec-10 Dec-11 Dec-12
Government deposits
Non-government deposits
Bank Deposits, 2007–12(Billions of Dirham)
0
200
400
600
800
1,000
1,200
1,400
0
200
400
600
800
1,000
1,200
1,400
Dec-07 Dec-08 Dec-09 Dec-10 Dec-11 Dec-12
Non-bank financial institutionsPrivate non-banksPublic sector entitiesGovernment
Bank Credit, 2007–12(Billions of Dirham)
0
20
40
60
80
100
120
140
0
20
40
60
80
100
120
140
Dec-05
Dec-06
Dec-07
Dec-08
Dec-09
Dec-10
Dec-11
Dec-12
S&P 500GCC 200Abu DhabiDubai
Stock Market Indices, 2005–13 (June)(Index, Dec. 31, 2005=100)
0
100
200
300
400
500
600
700
800
900
1,000
0
100
200
300
400
500
600
700
800
900
1,000
Oct-08 Jul-09 Apr-10 Jan-11 Oct-11 Jul-12 Apr-13
Dubai Abu Dhabi
Qatar Saudi Arabia
GCC: CDS Spreads, 2008–13 (May)(Basis points)
Monetary conditions remain accommodative, with a stable spread to the U.S. policy rate.
Banking sector liquidity continues to be comfortable.
Government deposits drove deposit growth in 2012... ...while lending to the private sector remained sluggish.
UAE equity markets remain subdued in 2012. Dubai's CDS spread fell substaintially amid high global liquidity.
UNITED ARAB EMIRATES
24 INTERNATIONAL MONETARY FUND
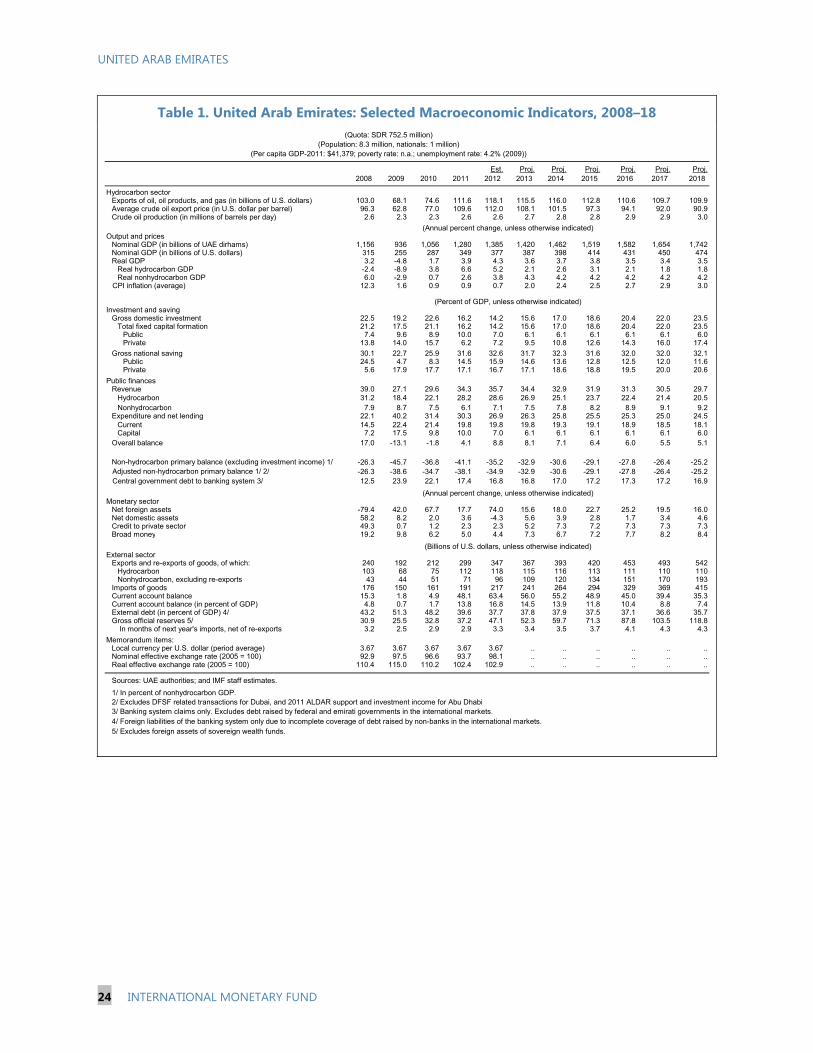
Table 1. United Arab Emirates: Selected Macroeconomic Indicators, 2008–18
Est. Proj. Proj. Proj. Proj. Proj. Proj.2008 2009 2010 2011 2012 2013 2014 2015 2016 2017 2018
Hydrocarbon sectorExports of oil, oil products, and gas (in billions of U.S. dollars) 103.0 68.1 74.6 111.6 118.1 115.5 116.0 112.8 110.6 109.7 109.9Average crude oil export price (in U.S. dollar per barrel) 96.3 62.8 77.0 109.6 112.0 108.1 101.5 97.3 94.1 92.0 90.9Crude oil production (in millions of barrels per day) 2.6 2.3 2.3 2.6 2.6 2.7 2.8 2.8 2.9 2.9 3.0
Output and pricesNominal GDP (in billions of UAE dirhams) 1,156 936 1,056 1,280 1,385 1,420 1,462 1,519 1,582 1,654 1,742Nominal GDP (in billions of U.S. dollars) 315 255 287 349 377 387 398 414 431 450 474Real GDP 3.2 -4.8 1.7 3.9 4.3 3.6 3.7 3.8 3.5 3.4 3.5
Real hydrocarbon GDP -2.4 -8.9 3.8 6.6 5.2 2.1 2.6 3.1 2.1 1.8 1.8Real nonhydrocarbon GDP 6.0 -2.9 0.7 2.6 3.8 4.3 4.2 4.2 4.2 4.2 4.2
CPI inflation (average) 12.3 1.6 0.9 0.9 0.7 2.0 2.4 2.5 2.7 2.9 3.0
Investment and savingGross domestic investment 22.5 19.2 22.6 16.2 14.2 15.6 17.0 18.6 20.4 22.0 23.5
Total fixed capital formation 21.2 17.5 21.1 16.2 14.2 15.6 17.0 18.6 20.4 22.0 23.5Public 7.4 9.6 8.9 10.0 7.0 6.1 6.1 6.1 6.1 6.1 6.0Private 13.8 14.0 15.7 6.2 7.2 9.5 10.8 12.6 14.3 16.0 17.4
Gross national saving 30.1 22.7 25.9 31.6 32.6 31.7 32.3 31.6 32.0 32.0 32.1Public 24.5 4.7 8.3 14.5 15.9 14.6 13.6 12.8 12.5 12.0 11.6Private 5.6 17.9 17.7 17.1 16.7 17.1 18.6 18.8 19.5 20.0 20.6
Public financesRevenue 39.0 27.1 29.6 34.3 35.7 34.4 32.9 31.9 31.3 30.5 29.7
Hydrocarbon 31.2 18.4 22.1 28.2 28.6 26.9 25.1 23.7 22.4 21.4 20.5Nonhydrocarbon 7.9 8.7 7.5 6.1 7.1 7.5 7.8 8.2 8.9 9.1 9.2
Expenditure and net lending 22.1 40.2 31.4 30.3 26.9 26.3 25.8 25.5 25.3 25.0 24.5Current 14.5 22.4 21.4 19.8 19.8 19.8 19.3 19.1 18.9 18.5 18.1Capital 7.2 17.5 9.8 10.0 7.0 6.1 6.1 6.1 6.1 6.1 6.0
Overall balance 17.0 -13.1 -1.8 4.1 8.8 8.1 7.1 6.4 6.0 5.5 5.1
Non-hydrocarbon primary balance (excluding investment income) 1/ -26.3 -45.7 -36.8 -41.1 -35.2 -32.9 -30.6 -29.1 -27.8 -26.4 -25.2 Adjusted non-hydrocarbon primary balance 1/ 2/ -26.3 -38.6 -34.7 -38.1 -34.9 -32.9 -30.6 -29.1 -27.8 -26.4 -25.2 Central government debt to banking system 3/ 12.5 23.9 22.1 17.4 16.8 16.8 17.0 17.2 17.3 17.2 16.9
Monetary sectorNet foreign assets -79.4 42.0 67.7 17.7 74.0 15.6 18.0 22.7 25.2 19.5 16.0Net domestic assets 58.2 8.2 2.0 3.6 -4.3 5.6 3.9 2.8 1.7 3.4 4.6Credit to private sector 49.3 0.7 1.2 2.3 2.3 5.2 7.3 7.2 7.3 7.3 7.3Broad money 19.2 9.8 6.2 5.0 4.4 7.3 6.7 7.2 7.7 8.2 8.4
External sectorExports and re-exports of goods, of which: 240 192 212 299 347 367 393 420 453 493 542
Hydrocarbon 103 68 75 112 118 115 116 113 111 110 110Nonhydrocarbon, excluding re-exports 43 44 51 71 96 109 120 134 151 170 193
Imports of goods 176 150 161 191 217 241 264 294 329 369 415Current account balance 15.3 1.8 4.9 48.1 63.4 56.0 55.2 48.9 45.0 39.4 35.3Current account balance (in percent of GDP) 4.8 0.7 1.7 13.8 16.8 14.5 13.9 11.8 10.4 8.8 7.4External debt (in percent of GDP) 4/ 43.2 51.3 48.2 39.6 37.7 37.8 37.9 37.5 37.1 36.6 35.7Gross official reserves 5/ 30.9 25.5 32.8 37.2 47.1 52.3 59.7 71.3 87.8 103.5 118.8
In months of next year's imports, net of re-exports 3.2 2.5 2.9 2.9 3.3 3.4 3.5 3.7 4.1 4.3 4.3
Memorandum items:Local currency per U.S. dollar (period average) 3.67 3.67 3.67 3.67 3.67 .. .. .. .. .. ..Nominal effective exchange rate (2005 = 100) 92.9 97.5 96.6 93.7 98.1 .. .. .. .. .. ..Real effective exchange rate (2005 = 100) 110.4 115.0 110.2 102.4 102.9 .. .. .. .. .. ..
Sources: UAE authorities; and IMF staff estimates.
1/ In percent of nonhydrocarbon GDP.2/ Excludes DFSF related transactions for Dubai, and 2011 ALDAR support and investment income for Abu Dhabi3/ Banking system claims only. Excludes debt raised by federal and emirati governments in the international markets.4/ Foreign liabilities of the banking system only due to incomplete coverage of debt raised by non-banks in the international markets.5/ Excludes foreign assets of sovereign wealth funds.
(Billions of U.S. dollars, unless otherwise indicated)
(Annual percent change, unless otherwise indicated)
(Quota: SDR 752.5 million)(Population: 8.3 million, nationals: 1 million)
(Per capita GDP-2011: $41,379; poverty rate: n.a.; unemployment rate: 4.2% (2009))
(Percent of GDP, unless otherwise indicated)
(Annual percent change, unless otherwise indicated)
UNITED ARAB EMIRATES
INTERNATIONAL MONETARY FUND 25
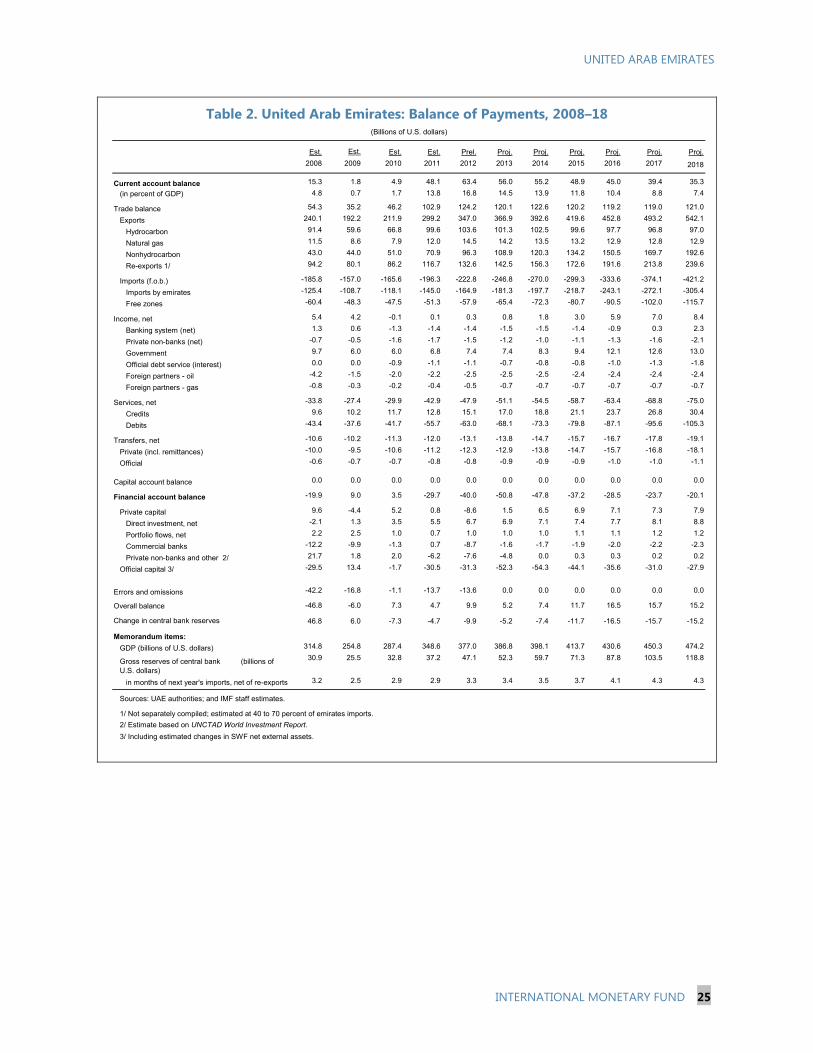
Table 2. United Arab Emirates: Balance of Payments, 2008–18
Est. Est. Est. Est. Prel. Proj. Proj. Proj. Proj. Proj. Proj.
2008 2009 2010 2011 2012 2013 2014 2015 2016 2017 2018
Current account balance 15.3 1.8 4.9 48.1 63.4 56.0 55.2 48.9 45.0 39.4 35.3
(in percent of GDP) 4.8 0.7 1.7 13.8 16.8 14.5 13.9 11.8 10.4 8.8 7.4
Trade balance 54.3 35.2 46.2 102.9 124.2 120.1 122.6 120.2 119.2 119.0 121.0
Exports 240.1 192.2 211.9 299.2 347.0 366.9 392.6 419.6 452.8 493.2 542.1
Hydrocarbon 91.4 59.6 66.8 99.6 103.6 101.3 102.5 99.6 97.7 96.8 97.0
Natural gas 11.5 8.6 7.9 12.0 14.5 14.2 13.5 13.2 12.9 12.8 12.9
Nonhydrocarbon 43.0 44.0 51.0 70.9 96.3 108.9 120.3 134.2 150.5 169.7 192.6
Re-exports 1/ 94.2 80.1 86.2 116.7 132.6 142.5 156.3 172.6 191.6 213.8 239.6
Imports (f.o.b.) -185.8 -157.0 -165.6 -196.3 -222.8 -246.8 -270.0 -299.3 -333.6 -374.1 -421.2
Imports by emirates -125.4 -108.7 -118.1 -145.0 -164.9 -181.3 -197.7 -218.7 -243.1 -272.1 -305.4
Free zones -60.4 -48.3 -47.5 -51.3 -57.9 -65.4 -72.3 -80.7 -90.5 -102.0 -115.7
Income, net 5.4 4.2 -0.1 0.1 0.3 0.8 1.8 3.0 5.9 7.0 8.4
Banking system (net) 1.3 0.6 -1.3 -1.4 -1.4 -1.5 -1.5 -1.4 -0.9 0.3 2.3
Private non-banks (net) -0.7 -0.5 -1.6 -1.7 -1.5 -1.2 -1.0 -1.1 -1.3 -1.6 -2.1
Government 9.7 6.0 6.0 6.8 7.4 7.4 8.3 9.4 12.1 12.6 13.0
Official debt service (interest) 0.0 0.0 -0.9 -1.1 -1.1 -0.7 -0.8 -0.8 -1.0 -1.3 -1.8
Foreign partners - oil -4.2 -1.5 -2.0 -2.2 -2.5 -2.5 -2.5 -2.4 -2.4 -2.4 -2.4
Foreign partners - gas -0.8 -0.3 -0.2 -0.4 -0.5 -0.7 -0.7 -0.7 -0.7 -0.7 -0.7
Services, net -33.8 -27.4 -29.9 -42.9 -47.9 -51.1 -54.5 -58.7 -63.4 -68.8 -75.0
Credits 9.6 10.2 11.7 12.8 15.1 17.0 18.8 21.1 23.7 26.8 30.4
Debits -43.4 -37.6 -41.7 -55.7 -63.0 -68.1 -73.3 -79.8 -87.1 -95.6 -105.3
Transfers, net -10.6 -10.2 -11.3 -12.0 -13.1 -13.8 -14.7 -15.7 -16.7 -17.8 -19.1
Private (incl. remittances) -10.0 -9.5 -10.6 -11.2 -12.3 -12.9 -13.8 -14.7 -15.7 -16.8 -18.1
Official -0.6 -0.7 -0.7 -0.8 -0.8 -0.9 -0.9 -0.9 -1.0 -1.0 -1.1
Capital account balance 0.0 0.0 0.0 0.0 0.0 0.0 0.0 0.0 0.0 0.0 0.0
Financial account balance -19.9 9.0 3.5 -29.7 -40.0 -50.8 -47.8 -37.2 -28.5 -23.7 -20.1
Private capital 9.6 -4.4 5.2 0.8 -8.6 1.5 6.5 6.9 7.1 7.3 7.9
Direct investment, net -2.1 1.3 3.5 5.5 6.7 6.9 7.1 7.4 7.7 8.1 8.8
Portfolio flows, net 2.2 2.5 1.0 0.7 1.0 1.0 1.0 1.1 1.1 1.2 1.2
Commercial banks -12.2 -9.9 -1.3 0.7 -8.7 -1.6 -1.7 -1.9 -2.0 -2.2 -2.3
Private non-banks and other 2/ 21.7 1.8 2.0 -6.2 -7.6 -4.8 0.0 0.3 0.3 0.2 0.2
Official capital 3/ -29.5 13.4 -1.7 -30.5 -31.3 -52.3 -54.3 -44.1 -35.6 -31.0 -27.9
Errors and omissions -42.2 -16.8 -1.1 -13.7 -13.6 0.0 0.0 0.0 0.0 0.0 0.0
Overall balance -46.8 -6.0 7.3 4.7 9.9 5.2 7.4 11.7 16.5 15.7 15.2
Change in central bank reserves 46.8 6.0 -7.3 -4.7 -9.9 -5.2 -7.4 -11.7 -16.5 -15.7 -15.2
Memorandum items:
GDP (billions of U.S. dollars) 314.8 254.8 287.4 348.6 377.0 386.8 398.1 413.7 430.6 450.3 474.2
Gross reserves of central bank (billions of U.S. dollars)
30.9 25.5 32.8 37.2 47.1 52.3 59.7 71.3 87.8 103.5 118.8
in months of next year's imports, net of re-exports 3.2 2.5 2.9 2.9 3.3 3.4 3.5 3.7 4.1 4.3 4.3
Sources: UAE authorities; and IMF staff estimates.
1/ Not separately compiled; estimated at 40 to 70 percent of emirates imports.
2/ Estimate based on UNCTAD World Investment Report.
3/ Including estimated changes in SWF net external assets.
(Billions of U.S. dollars)
UNITED ARAB EMIRATES
26 INTERNATIONAL MONETARY FUND
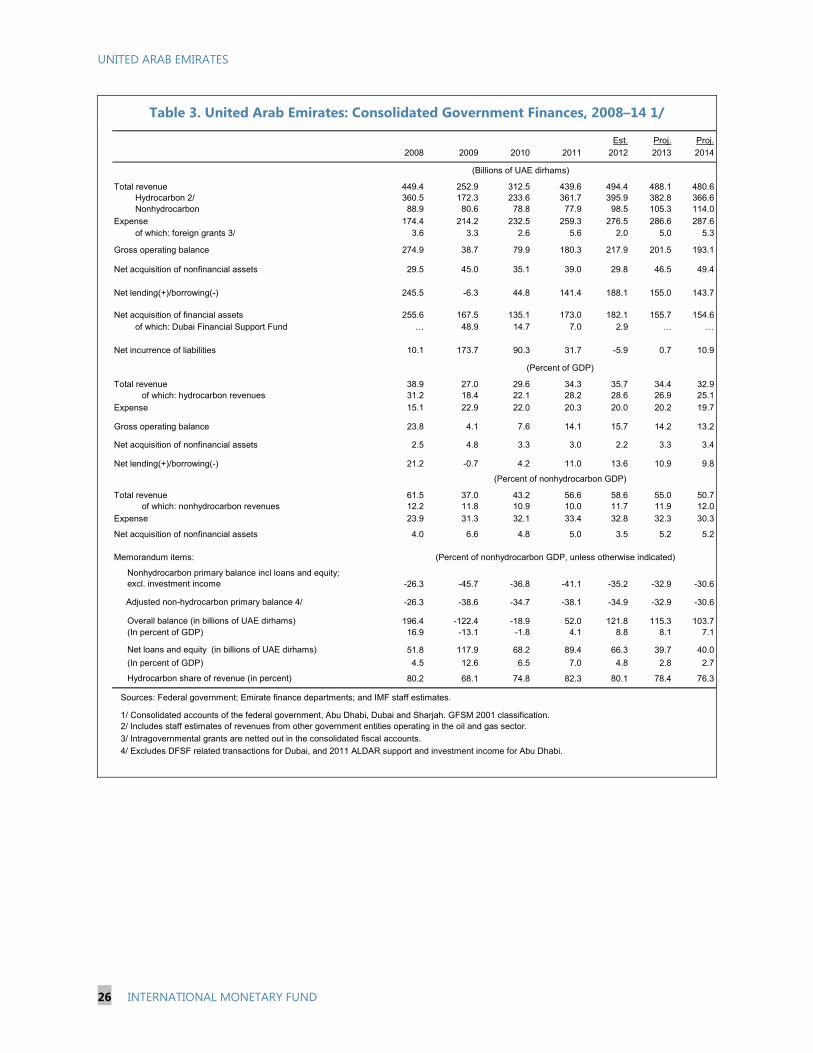
Table 3. United Arab Emirates: Consolidated Government Finances, 2008–14 1/
Est. Proj. Proj.
2008 2009 2010 2011 2012 2013 2014
Total revenue 449.4 252.9 312.5 439.6 494.4 488.1 480.6 Hydrocarbon 2/ 360.5 172.3 233.6 361.7 395.9 382.8 366.6 Nonhydrocarbon 88.9 80.6 78.8 77.9 98.5 105.3 114.0
Expense 174.4 214.2 232.5 259.3 276.5 286.6 287.6 of which: foreign grants 3/ 3.6 3.3 2.6 5.6 2.0 5.0 5.3
Gross operating balance 274.9 38.7 79.9 180.3 217.9 201.5 193.1
Net acquisition of nonfinancial assets 29.5 45.0 35.1 39.0 29.8 46.5 49.4
Net lending(+)/borrowing(-) 245.5 -6.3 44.8 141.4 188.1 155.0 143.7
Net acquisition of financial assets 255.6 167.5 135.1 173.0 182.1 155.7 154.6 of which: Dubai Financial Support Fund … 48.9 14.7 7.0 2.9 … …
Net incurrence of liabilities 10.1 173.7 90.3 31.7 -5.9 0.7 10.9
Total revenue 38.9 27.0 29.6 34.3 35.7 34.4 32.9 of which: hydrocarbon revenues 31.2 18.4 22.1 28.2 28.6 26.9 25.1
Expense 15.1 22.9 22.0 20.3 20.0 20.2 19.7
Gross operating balance 23.8 4.1 7.6 14.1 15.7 14.2 13.2
Net acquisition of nonfinancial assets 2.5 4.8 3.3 3.0 2.2 3.3 3.4
Net lending(+)/borrowing(-) 21.2 -0.7 4.2 11.0 13.6 10.9 9.8
Total revenue 61.5 37.0 43.2 56.6 58.6 55.0 50.7 of which: nonhydrocarbon revenues 12.2 11.8 10.9 10.0 11.7 11.9 12.0
Expense 23.9 31.3 32.1 33.4 32.8 32.3 30.3
Net acquisition of nonfinancial assets 4.0 6.6 4.8 5.0 3.5 5.2 5.2
Memorandum items:
Nonhydrocarbon primary balance incl loans and equity; excl. investment income -26.3 -45.7 -36.8 -41.1 -35.2 -32.9 -30.6
Adjusted non-hydrocarbon primary balance 4/ -26.3 -38.6 -34.7 -38.1 -34.9 -32.9 -30.6
Overall balance (in billions of UAE dirhams) 196.4 -122.4 -18.9 52.0 121.8 115.3 103.7(In percent of GDP) 16.9 -13.1 -1.8 4.1 8.8 8.1 7.1
Net loans and equity (in billions of UAE dirhams) 51.8 117.9 68.2 89.4 66.3 39.7 40.0
(In percent of GDP) 4.5 12.6 6.5 7.0 4.8 2.8 2.7
Hydrocarbon share of revenue (in percent) 80.2 68.1 74.8 82.3 80.1 78.4 76.3
Sources: Federal government; Emirate finance departments; and IMF staff estimates.
1/ Consolidated accounts of the federal government, Abu Dhabi, Dubai and Sharjah. GFSM 2001 classification.2/ Includes staff estimates of revenues from other government entities operating in the oil and gas sector.
3/ Intragovernmental grants are netted out in the consolidated fiscal accounts.
4/ Excludes DFSF related transactions for Dubai, and 2011 ALDAR support and investment income for Abu Dhabi.
(Percent of nonhydrocarbon GDP, unless otherwise indicated)
(Billions of UAE dirhams)
(Percent of nonhydrocarbon GDP)
(Percent of GDP)
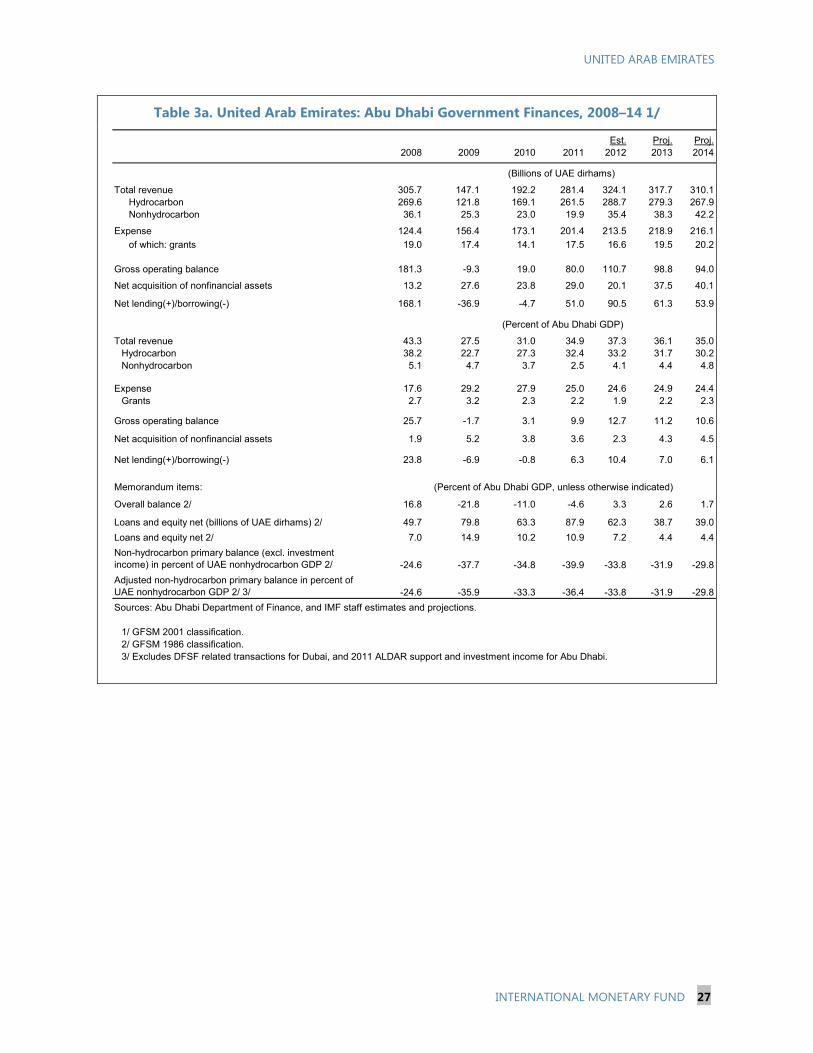
UNITED ARAB EMIRATES
INTERNATIONAL MONETARY FUND 27
Table 3a. United Arab Emirates: Abu Dhabi Government Finances, 2008–14 1/
Est. Proj. Proj.2008 2009 2010 2011 2012 2013 2014
Total revenue 305.7 147.1 192.2 281.4 324.1 317.7 310.1Hydrocarbon 269.6 121.8 169.1 261.5 288.7 279.3 267.9Nonhydrocarbon 36.1 25.3 23.0 19.9 35.4 38.3 42.2
Expense 124.4 156.4 173.1 201.4 213.5 218.9 216.1
of which: grants 19.0 17.4 14.1 17.5 16.6 19.5 20.2
Gross operating balance 181.3 -9.3 19.0 80.0 110.7 98.8 94.0
Net acquisition of nonfinancial assets 13.2 27.6 23.8 29.0 20.1 37.5 40.1
Net lending(+)/borrowing(-) 168.1 -36.9 -4.7 51.0 90.5 61.3 53.9
Total revenue 43.3 27.5 31.0 34.9 37.3 36.1 35.0Hydrocarbon 38.2 22.7 27.3 32.4 33.2 31.7 30.2Nonhydrocarbon 5.1 4.7 3.7 2.5 4.1 4.4 4.8
Expense 17.6 29.2 27.9 25.0 24.6 24.9 24.4Grants 2.7 3.2 2.3 2.2 1.9 2.2 2.3
Gross operating balance 25.7 -1.7 3.1 9.9 12.7 11.2 10.6
Net acquisition of nonfinancial assets 1.9 5.2 3.8 3.6 2.3 4.3 4.5
Net lending(+)/borrowing(-) 23.8 -6.9 -0.8 6.3 10.4 7.0 6.1
Memorandum items:
Overall balance 2/ 16.8 -21.8 -11.0 -4.6 3.3 2.6 1.7
Loans and equity net (billions of UAE dirhams) 2/ 49.7 79.8 63.3 87.9 62.3 38.7 39.0
Loans and equity net 2/ 7.0 14.9 10.2 10.9 7.2 4.4 4.4
Non-hydrocarbon primary balance (excl. investment income) in percent of UAE nonhydrocarbon GDP 2/ -24.6 -37.7 -34.8 -39.9 -33.8 -31.9 -29.8
Adjusted non-hydrocarbon primary balance in percent of UAE nonhydrocarbon GDP 2/ 3/ -24.6 -35.9 -33.3 -36.4 -33.8 -31.9 -29.8
Sources: Abu Dhabi Department of Finance, and IMF staff estimates and projections.
1/ GFSM 2001 classification.2/ GFSM 1986 classification.3/ Excludes DFSF related transactions for Dubai, and 2011 ALDAR support and investment income for Abu Dhabi.
(Percent of Abu Dhabi GDP, unless otherwise indicated)
(Percent of Abu Dhabi GDP)
(Billions of UAE dirhams)
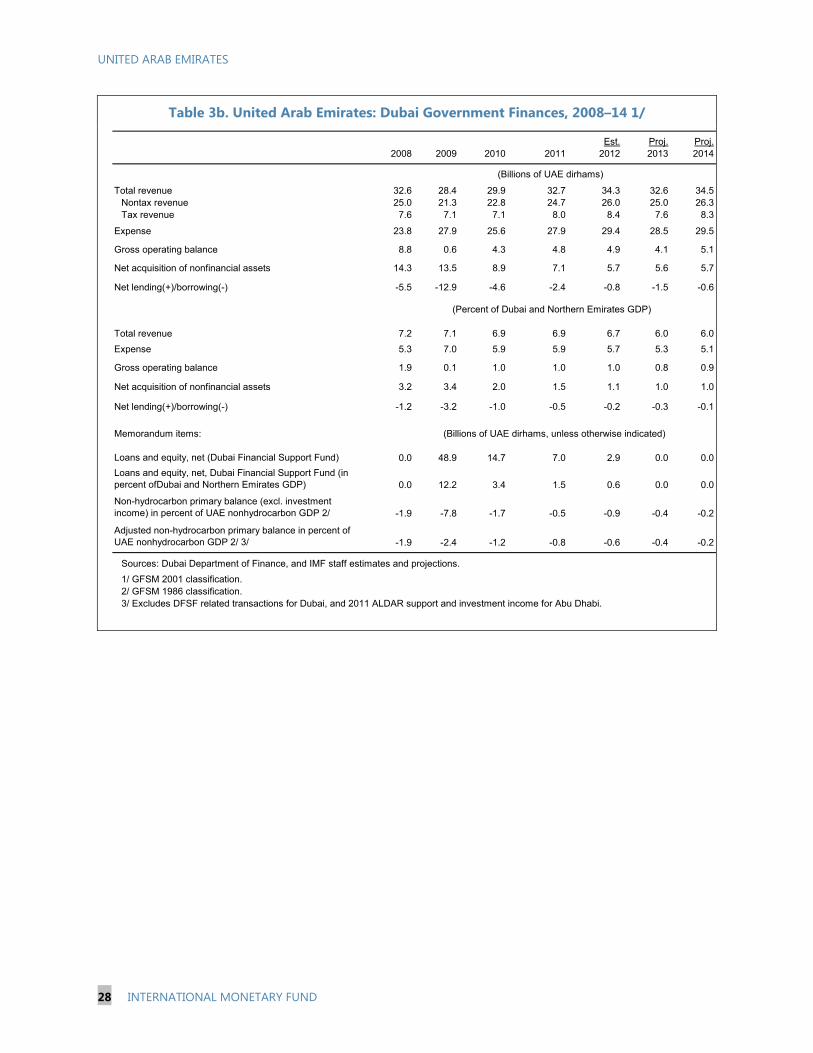
UNITED ARAB EMIRATES
28 INTERNATIONAL MONETARY FUND
Table 3b. United Arab Emirates: Dubai Government Finances, 2008–14 1/
Est. Proj. Proj.2008 2009 2010 2011 2012 2013 2014
Total revenue 32.6 28.4 29.9 32.7 34.3 32.6 34.5Nontax revenue 25.0 21.3 22.8 24.7 26.0 25.0 26.3Tax revenue 7.6 7.1 7.1 8.0 8.4 7.6 8.3
Expense 23.8 27.9 25.6 27.9 29.4 28.5 29.5
Gross operating balance 8.8 0.6 4.3 4.8 4.9 4.1 5.1
Net acquisition of nonfinancial assets 14.3 13.5 8.9 7.1 5.7 5.6 5.7
Net lending(+)/borrowing(-) -5.5 -12.9 -4.6 -2.4 -0.8 -1.5 -0.6
Total revenue 7.2 7.1 6.9 6.9 6.7 6.0 6.0
Expense 5.3 7.0 5.9 5.9 5.7 5.3 5.1
Gross operating balance 1.9 0.1 1.0 1.0 1.0 0.8 0.9
Net acquisition of nonfinancial assets 3.2 3.4 2.0 1.5 1.1 1.0 1.0
Net lending(+)/borrowing(-) -1.2 -3.2 -1.0 -0.5 -0.2 -0.3 -0.1
Memorandum items:
Loans and equity, net (Dubai Financial Support Fund) 0.0 48.9 14.7 7.0 2.9 0.0 0.0
Loans and equity, net, Dubai Financial Support Fund (in percent ofDubai and Northern Emirates GDP) 0.0 12.2 3.4 1.5 0.6 0.0 0.0
Non-hydrocarbon primary balance (excl. investment income) in percent of UAE nonhydrocarbon GDP 2/ -1.9 -7.8 -1.7 -0.5 -0.9 -0.4 -0.2
Adjusted non-hydrocarbon primary balance in percent of UAE nonhydrocarbon GDP 2/ 3/ -1.9 -2.4 -1.2 -0.8 -0.6 -0.4 -0.2
Sources: Dubai Department of Finance, and IMF staff estimates and projections.
1/ GFSM 2001 classification.2/ GFSM 1986 classification.3/ Excludes DFSF related transactions for Dubai, and 2011 ALDAR support and investment income for Abu Dhabi.
(Billions of UAE dirhams)
(Percent of Dubai and Northern Emirates GDP)
(Billions of UAE dirhams, unless otherwise indicated)
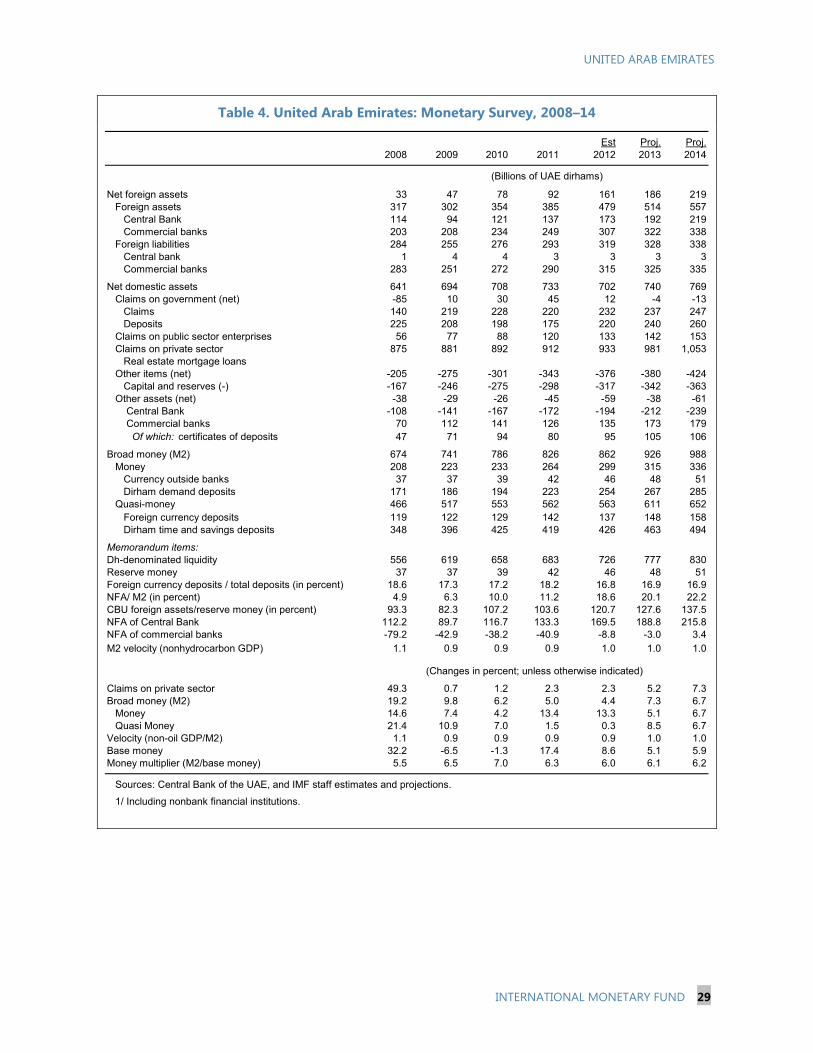
UNITED ARAB EMIRATES
INTERNATIONAL MONETARY FUND 29
Table 4. United Arab Emirates: Monetary Survey, 2008–14
Est Proj. Proj.2008 2009 2010 2011 2012 2013 2014
Net foreign assets 33 47 78 92 161 186 219Foreign assets 317 302 354 385 479 514 557
Central Bank 114 94 121 137 173 192 219Commercial banks 203 208 234 249 307 322 338
Foreign liabilities 284 255 276 293 319 328 338Central bank 1 4 4 3 3 3 3Commercial banks 283 251 272 290 315 325 335
Net domestic assets 641 694 708 733 702 740 769Claims on government (net) -85 10 30 45 12 -4 -13
Claims 140 219 228 220 232 237 247Deposits 225 208 198 175 220 240 260
Claims on public sector enterprises 56 77 88 120 133 142 153Claims on private sector 875 881 892 912 933 981 1,053
Real estate mortgage loansOther items (net) -205 -275 -301 -343 -376 -380 -424 Capital and reserves (-) -167 -246 -275 -298 -317 -342 -363Other assets (net) -38 -29 -26 -45 -59 -38 -61
Central Bank -108 -141 -167 -172 -194 -212 -239 Commercial banks 70 112 141 126 135 173 179
Of which: certificates of deposits 47 71 94 80 95 105 106
Broad money (M2) 674 741 786 826 862 926 988Money 208 223 233 264 299 315 336
Currency outside banks 37 37 39 42 46 48 51Dirham demand deposits 171 186 194 223 254 267 285
Quasi-money 466 517 553 562 563 611 652Foreign currency deposits 119 122 129 142 137 148 158Dirham time and savings deposits 348 396 425 419 426 463 494
Memorandum items:Dh-denominated liquidity 556 619 658 683 726 777 830Reserve money 37 37 39 42 46 48 51Foreign currency deposits / total deposits (in percent) 18.6 17.3 17.2 18.2 16.8 16.9 16.9NFA/ M2 (in percent) 4.9 6.3 10.0 11.2 18.6 20.1 22.2CBU foreign assets/reserve money (in percent) 93.3 82.3 107.2 103.6 120.7 127.6 137.5NFA of Central Bank 112.2 89.7 116.7 133.3 169.5 188.8 215.8NFA of commercial banks -79.2 -42.9 -38.2 -40.9 -8.8 -3.0 3.4M2 velocity (nonhydrocarbon GDP) 1.1 0.9 0.9 0.9 1.0 1.0 1.0
Claims on private sector 49.3 0.7 1.2 2.3 2.3 5.2 7.3Broad money (M2) 19.2 9.8 6.2 5.0 4.4 7.3 6.7
Money 14.6 7.4 4.2 13.4 13.3 5.1 6.7Quasi Money 21.4 10.9 7.0 1.5 0.3 8.5 6.7
Velocity (non-oil GDP/M2) 1.1 0.9 0.9 0.9 0.9 1.0 1.0Base money 32.2 -6.5 -1.3 17.4 8.6 5.1 5.9Money multiplier (M2/base money) 5.5 6.5 7.0 6.3 6.0 6.1 6.2
Sources: Central Bank of the UAE, and IMF staff estimates and projections.
1/ Including nonbank financial institutions.
(Billions of UAE dirhams)
(Changes in percent; unless otherwise indicated)
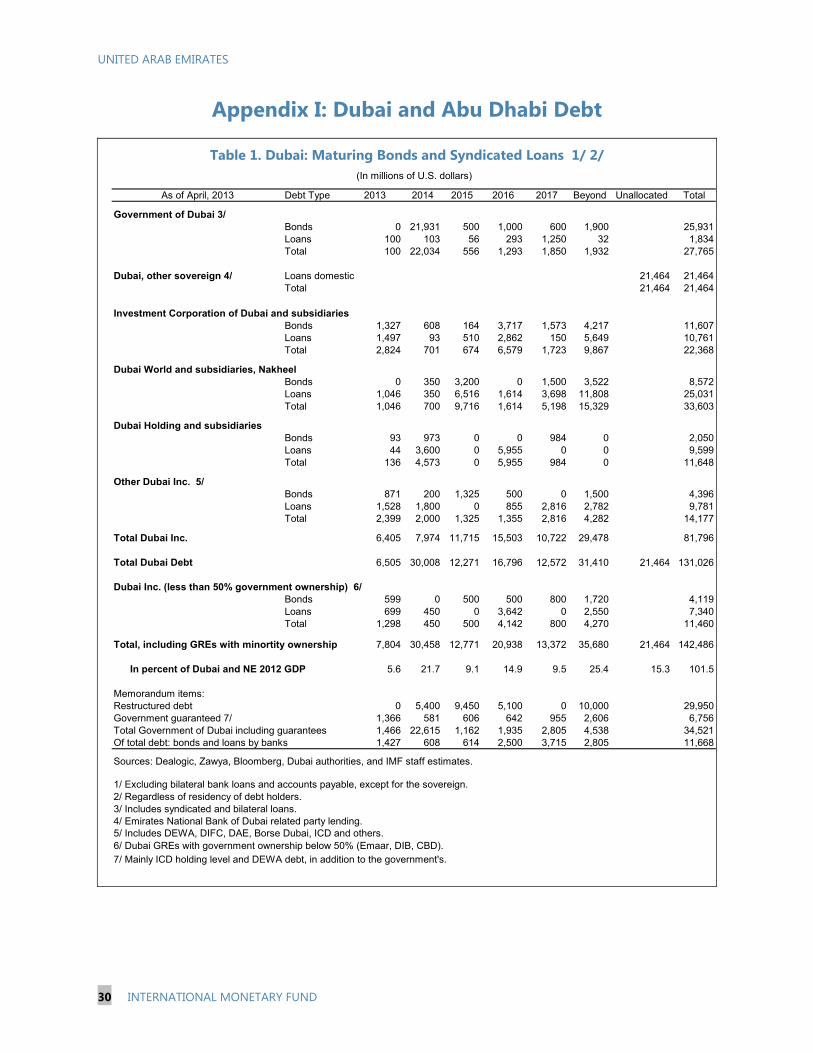
UNITED ARAB EMIRATES
30 INTERNATIONAL MONETARY FUND
Appendix I: Dubai and Abu Dhabi Debt
Table 1. Dubai: Maturing Bonds and Syndicated Loans 1/ 2/
As of April, 2013 Debt Type 2013 2014 2015 2016 2017 Beyond Unallocated Total
Government of Dubai 3/Bonds 0 21,931 500 1,000 600 1,900 25,931Loans 100 103 56 293 1,250 32 1,834Total 100 22,034 556 1,293 1,850 1,932 27,765
Dubai, other sovereign 4/ Loans domestic 21,464 21,464Total 21,464 21,464
Investment Corporation of Dubai and subsidiariesBonds 1,327 608 164 3,717 1,573 4,217 11,607Loans 1,497 93 510 2,862 150 5,649 10,761Total 2,824 701 674 6,579 1,723 9,867 22,368
Dubai World and subsidiaries, NakheelBonds 0 350 3,200 0 1,500 3,522 8,572Loans 1,046 350 6,516 1,614 3,698 11,808 25,031Total 1,046 700 9,716 1,614 5,198 15,329 33,603
Dubai Holding and subsidiariesBonds 93 973 0 0 984 0 2,050Loans 44 3,600 0 5,955 0 0 9,599Total 136 4,573 0 5,955 984 0 11,648
Other Dubai Inc. 5/Bonds 871 200 1,325 500 0 1,500 4,396Loans 1,528 1,800 0 855 2,816 2,782 9,781Total 2,399 2,000 1,325 1,355 2,816 4,282 14,177
Total Dubai Inc. 6,405 7,974 11,715 15,503 10,722 29,478 81,796
Total Dubai Debt 6,505 30,008 12,271 16,796 12,572 31,410 21,464 131,026
Dubai Inc. (less than 50% government ownership) 6/Bonds 599 0 500 500 800 1,720 4,119Loans 699 450 0 3,642 0 2,550 7,340Total 1,298 450 500 4,142 800 4,270 11,460
Total, including GREs with minortity ownership 7,804 30,458 12,771 20,938 13,372 35,680 21,464 142,486
In percent of Dubai and NE 2012 GDP 5.6 21.7 9.1 14.9 9.5 25.4 15.3 101.5
Memorandum items:Restructured debt 0 5,400 9,450 5,100 0 10,000 29,950Government guaranteed 7/ 1,366 581 606 642 955 2,606 6,756Total Government of Dubai including guarantees 1,466 22,615 1,162 1,935 2,805 4,538 34,521Of total debt: bonds and loans by banks 1,427 608 614 2,500 3,715 2,805 11,668
Sources: Dealogic, Zawya, Bloomberg, Dubai authorities, and IMF staff estimates.
1/ Excluding bilateral bank loans and accounts payable, except for the sovereign.2/ Regardless of residency of debt holders.3/ Includes syndicated and bilateral loans.4/ Emirates National Bank of Dubai related party lending.5/ Includes DEWA, DIFC, DAE, Borse Dubai, ICD and others.6/ Dubai GREs with government ownership below 50% (Emaar, DIB, CBD).7/ Mainly ICD holding level and DEWA debt, in addition to the government's.
(In millions of U.S. dollars)
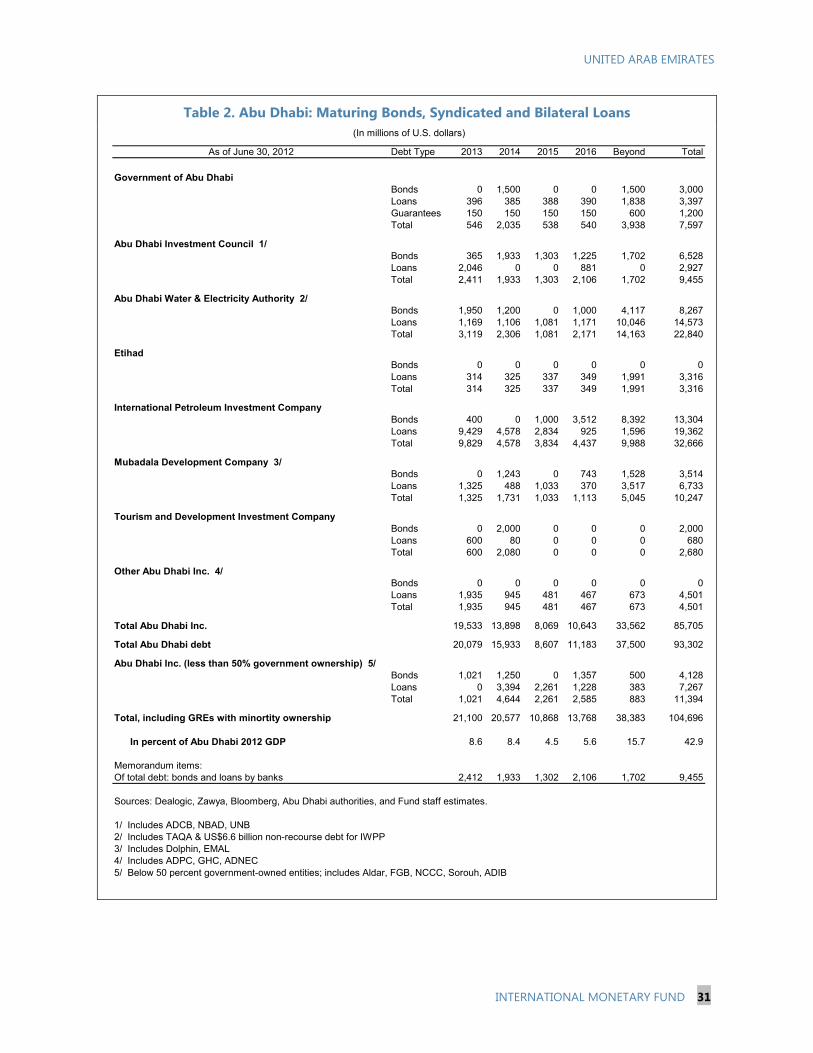
UNITED ARAB EMIRATES
INTERNATIONAL MONETARY FUND 31
Table 2. Abu Dhabi: Maturing Bonds, Syndicated and Bilateral Loans
As of June 30, 2012 Debt Type 2013 2014 2015 2016 Beyond Total
Government of Abu DhabiBonds 0 1,500 0 0 1,500 3,000Loans 396 385 388 390 1,838 3,397Guarantees 150 150 150 150 600 1,200Total 546 2,035 538 540 3,938 7,597
Abu Dhabi Investment Council 1/Bonds 365 1,933 1,303 1,225 1,702 6,528Loans 2,046 0 0 881 0 2,927Total 2,411 1,933 1,303 2,106 1,702 9,455
Abu Dhabi Water & Electricity Authority 2/Bonds 1,950 1,200 0 1,000 4,117 8,267Loans 1,169 1,106 1,081 1,171 10,046 14,573Total 3,119 2,306 1,081 2,171 14,163 22,840
EtihadBonds 0 0 0 0 0 0Loans 314 325 337 349 1,991 3,316Total 314 325 337 349 1,991 3,316
International Petroleum Investment Company Bonds 400 0 1,000 3,512 8,392 13,304Loans 9,429 4,578 2,834 925 1,596 19,362Total 9,829 4,578 3,834 4,437 9,988 32,666
Mubadala Development Company 3/Bonds 0 1,243 0 743 1,528 3,514Loans 1,325 488 1,033 370 3,517 6,733Total 1,325 1,731 1,033 1,113 5,045 10,247
Tourism and Development Investment CompanyBonds 0 2,000 0 0 0 2,000Loans 600 80 0 0 0 680Total 600 2,080 0 0 0 2,680
Other Abu Dhabi Inc. 4/Bonds 0 0 0 0 0 0Loans 1,935 945 481 467 673 4,501Total 1,935 945 481 467 673 4,501
Total Abu Dhabi Inc. 19,533 13,898 8,069 10,643 33,562 85,705
Total Abu Dhabi debt 20,079 15,933 8,607 11,183 37,500 93,302
Abu Dhabi Inc. (less than 50% government ownership) 5/Bonds 1,021 1,250 0 1,357 500 4,128Loans 0 3,394 2,261 1,228 383 7,267Total 1,021 4,644 2,261 2,585 883 11,394
Total, including GREs with minortity ownership 21,100 20,577 10,868 13,768 38,383 104,696
In percent of Abu Dhabi 2012 GDP 8.6 8.4 4.5 5.6 15.7 42.9
Memorandum items:Of total debt: bonds and loans by banks 2,412 1,933 1,302 2,106 1,702 9,455
Sources: Dealogic, Zawya, Bloomberg, Abu Dhabi authorities, and Fund staff estimates.
1/ Includes ADCB, NBAD, UNB2/ Includes TAQA & US$6.6 billion non-recourse debt for IWPP3/ Includes Dolphin, EMAL4/ Includes ADPC, GHC, ADNEC5/ Below 50 percent government-owned entities; includes Aldar, FGB, NCCC, Sorouh, ADIB
(In millions of U.S. dollars)
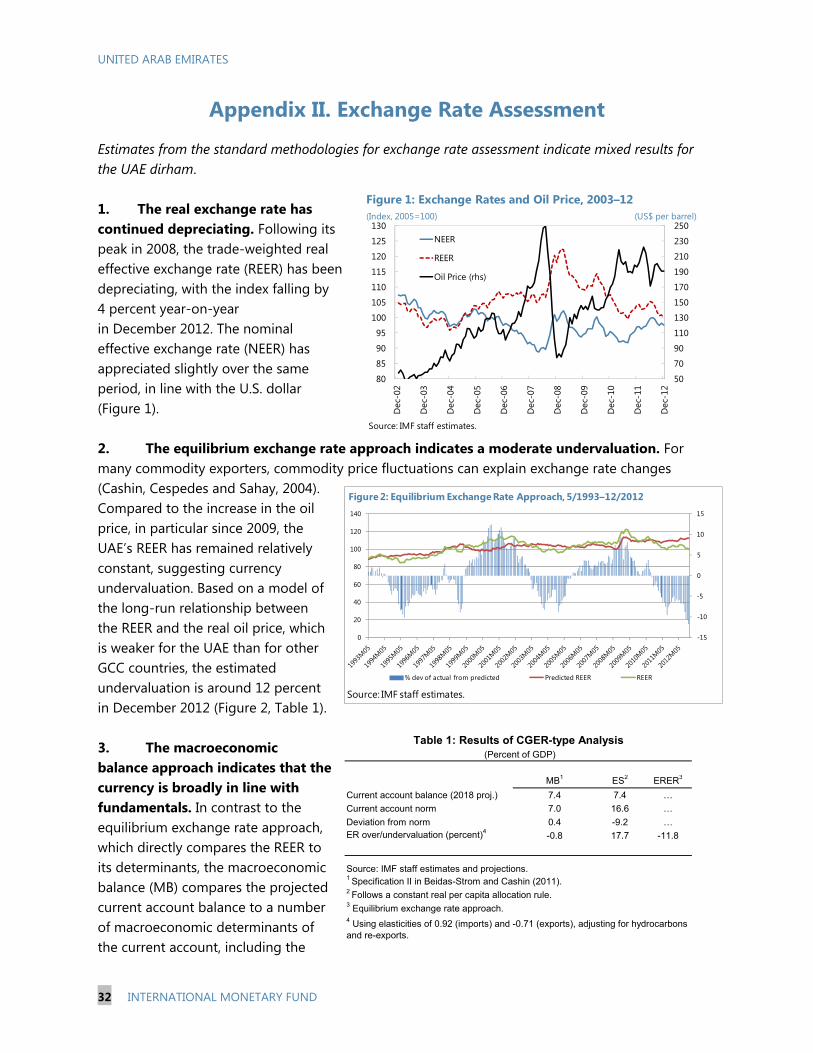
UNITED ARAB EMIRATES
32 INTERNATIONAL MONETARY FUND
Appendix II. Exchange Rate Assessment
Estimates from the standard methodologies for exchange rate assessment indicate mixed results for the UAE dirham. 1. The real exchange rate has continued depreciating. Following its peak in 2008, the trade-weighted real effective exchange rate (REER) has been depreciating, with the index falling by 4 percent year-on-year in December 2012. The nominal effective exchange rate (NEER) has appreciated slightly over the same period, in line with the U.S. dollar (Figure 1). 2. The equilibrium exchange rate approach indicates a moderate undervaluation. For many commodity exporters, commodity price fluctuations can explain exchange rate changes (Cashin, Cespedes and Sahay, 2004). Compared to the increase in the oil price, in particular since 2009, the UAE’s REER has remained relatively constant, suggesting currency undervaluation. Based on a model of the long-run relationship between the REER and the real oil price, which is weaker for the UAE than for other GCC countries, the estimated undervaluation is around 12 percent in December 2012 (Figure 2, Table 1). 3. The macroeconomic balance approach indicates that the currency is broadly in line with fundamentals. In contrast to the equilibrium exchange rate approach, which directly compares the REER to its determinants, the macroeconomic balance (MB) compares the projected current account balance to a number of macroeconomic determinants of the current account, including the
MB1 ES2 ERER3
Current account balance (2018 proj.) 7.4 7.4 …
Current account norm 7.0 16.6 …
Deviation from norm 0.4 -9.2 …ER over/undervaluation (percent)4
-0.8 17.7 -11.8
Source: IMF staff estimates and projections.1 Specification II in Beidas-Strom and Cashin (2011).2 Follows a constant real per capita allocation rule. 3 Equilibrium exchange rate approach.4 Using elasticities of 0.92 (imports) and -0.71 (exports), adjusting for hydrocarbons and re-exports.
Table 1: Results of CGER-type Analysis (Percent of GDP)
50
70
90
110
130
150
170
190
210
230
250
80
85
90
95
100
105
110
115
120
125
130
Dec
-02
Dec
-03
Dec
-04
Dec
-05
Dec
-06
Dec
-07
Dec
-08
Dec
-09
Dec
-10
Dec
-11
Dec
-12
NEER
REER
Oil Price (rhs)
Source: IMF staff estimates.
Figure 1: Exchange Rates and Oil Price, 2003–12(Index, 2005=100) (US$ per barrel)
-15
-10
-5
0
5
10
15
0
20
40
60
80
100
120
140
Figure 2: Equilibrium Exchange Rate Approach, 5/1993–12/2012
% dev of actual from predicted Predicted REER REER
Source: IMF staff estimates.
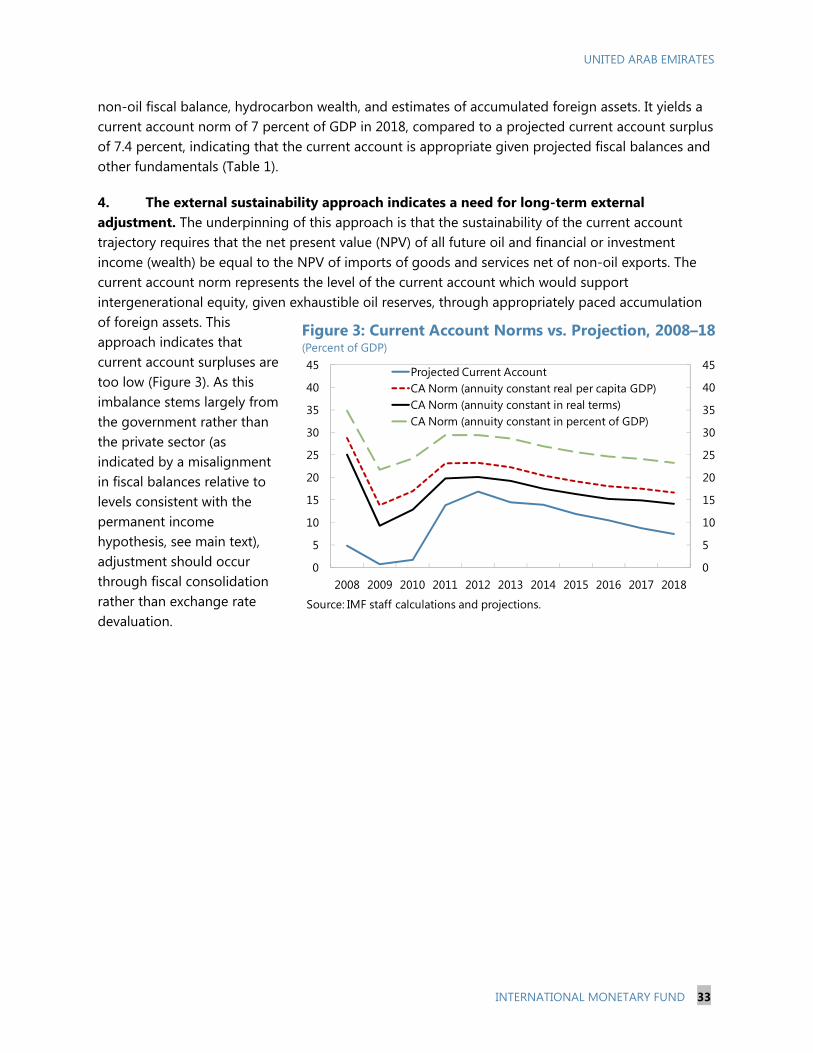
UNITED ARAB EMIRATES
INTERNATIONAL MONETARY FUND 33
non-oil fiscal balance, hydrocarbon wealth, and estimates of accumulated foreign assets. It yields a current account norm of 7 percent of GDP in 2018, compared to a projected current account surplus of 7.4 percent, indicating that the current account is appropriate given projected fiscal balances and other fundamentals (Table 1).
4. The external sustainability approach indicates a need for long-term external adjustment. The underpinning of this approach is that the sustainability of the current account trajectory requires that the net present value (NPV) of all future oil and financial or investment income (wealth) be equal to the NPV of imports of goods and services net of non-oil exports. The current account norm represents the level of the current account which would support intergenerational equity, given exhaustible oil reserves, through appropriately paced accumulation of foreign assets. This approach indicates that current account surpluses are too low (Figure 3). As this imbalance stems largely from the government rather than the private sector (as indicated by a misalignment in fiscal balances relative to levels consistent with the permanent income hypothesis, see main text), adjustment should occur through fiscal consolidation rather than exchange rate devaluation.
0
5
10
15
20
25
30
35
40
45
0
5
10
15
20
25
30
35
40
45
2008 2009 2010 2011 2012 2013 2014 2015 2016 2017 2018
Projected Current AccountCA Norm (annuity constant real per capita GDP)CA Norm (annuity constant in real terms)CA Norm (annuity constant in percent of GDP)
Source: IMF staff calculations and projections.
Figure 3: Current Account Norms vs. Projection, 2008–18(Percent of GDP)
UNITED ARAB EMIRATES STAFF REPORT FOR THE 2013 ARTICLE IV CONSULTATION—INFORMATIONAL ANNEX Prepared By
Middle East and Central Asia Department
FUND RELATIONS ________________________________________________________________________ 2
RELATIONS WITH THE WORLD BANK GROUP __________________________________________ 4
STATISTICAL ISSUES ______________________________________________________________________ 5
CONTENTS
June 27, 2013
UNITED ARAB EMIRATES
2 INTERNATIONAL MONETARY FUND
FUND RELATIONS (As of May 31, 2013) Membership Status: Joined 9/22/72; accepted Article VIII status in February 1974
General Resources Account
SDR Million Percent Quota Quota 752.50 100.00 Fund holdings of currency 502.46 66.77 Reserve tranche position 250.62 33.30
SDR Department SDR Million Percent Allocation Net cumulative allocation 568.41 100.00 Holdings 542.13 95.38
Outstanding Purchases and Loans: None
Latest Financial Arrangements: None
Projected Payments to Fund
Forthcoming 2013 2014 2015 2016 2017 Principal Charges/interest 0.01 0.02 0.02 0.02 0.02 Total 0.01 0.02 0.02 0.02 0.02
Implementation of HIPC Initiative:
Not Applicable
Implementation of Multilateral
Debt Relief Initiative (MDRI): Not Applicable
Implementation of Post-Catastrophe Debt Relief (PCDR): Not Applicable
Exchange Arrangement
The U.A.E dirham was officially pegged to the SDR at the rate of AED 4.76190=SDR1 from November 1980 to February 2002albeit de facto it was pegged to the dollar at a fixed parity. Since then, the de jure and de facto exchange rate regime has been a conventional peg to the U.S. dollar, with the mid-point between the official buying and selling rates fixed at AED 3.6725 = US$1.
The U.A.E. has accepted the obligation of Article VIII, Sections 2, 3, and 4. There are no restrictions on the making of payments and transfer for current international transactions, except for those
UNITED ARAB EMIRATES
INTERNATIONAL MONETARY FUND 3
restrictions for security reasons that have been notified to the Fund, by the authorities, in accordance with Executive Board Decision No. 144 (52/51).
Article IV Consultation
The U.A.E. is on the annual consultation cycle. The previous consultation discussions were held during February 28-March 14, 2012. The Article IV consultation was concluded on May 14, 2012. The staff report was published on May 18, 2012, and is available at http://www.imf.org/external/pubs/cat/longres.aspx?sk=25930.0 (Country Report No. 12/116).
FSAP Participation, ROSCs, and OFC Assessments
FSAP missions visited U.A.E. in 2003 and 2007. Technical Assistance:
FAD Public Expenditure Management Follow up May 2003
STA Multi-sector December 2003
MFD Anti-Money Laundering/Combating Terrorist Financing March 2004
STA Coordinated Portfolio Investment Survey April 2004
FAD Revenue Diversification and VAT Feasibility November 2005
FAD Public Financial Management November 2005
FAD Gulf Cooperation Council: Options for Indirect and Taxation March 2006
FAD UAE: Options for New Indirect Taxation and Intergovernmental Fiscal Relations
March 2006
STA Compilation of a High-Frequency CPI Index March 2007
STA Multi-sector April 2008
STA Balance of Payments March-April 2009
MCM Macroprudential Tools and Liquidity Management January 2011
STA National Accounts September 2011
MCM Payment Systems November 2011
STA Balance of Payments Statistics June 2012
FAD Fiscal Coordination June 2012
STA Government Finance Statistics April 2013
STA National Accounts Statistics May 2013
Resident Representative: None
UNITED ARAB EMIRATES
4 INTERNATIONAL MONETARY FUND
RELATIONS WITH THE WORLD BANK GROUP (As of May 2013) Technical cooperation between the United Arab Emirates (UAE) and the Bank started in 1980 on a case-by-case-basis. By 1994, the relationship developed to the extent that a Framework Agreement for technical cooperation was signed to facilitate an ongoing program of advisory services. At the federal level, the Bank provided assistance to the Ministry of Finance in the area of debt market development: a bond market development strategy was completed in May 2008, and the Bank later assisted with certain aspects of its implementation. In 2010, the Ministry of Labor requested technical assistance in labor market development, including Emiratization policies and Labor Market Information System development; the project was completed in 2011. Currently, the Bank is helping develop a national health insurance scheme and is preparing a public expenditure review in the health and higher education sectors. The Bank has also delivered technical assistance to individual Emirates. In Ras Al Khaimah (RAK), technical cooperation included assistance in promoting a better investment climate and in mobilizing private investment. Following such assistance, an investors' conference (May 2005) attracted major strategic, financial and individual investors from around the world. More recently, the Bank provided advice to the Government of RAK on a multi-jurisdictional student loan program design. In Abu Dhabi, the Bank provided assistance to Abu Dhabi Food Control Authority on a food security program for the Emirate of Abu Dhabi; at present, the Bank is providing assistance to Abu Dhabi Judicial Department on a court reform process and is in dialogue with Abu Dhabi Council to support private sector development efforts. In Dubai, the Bank assisted in the analysis of retirement planning options for expatriate workers; follow-up technical assistance is under discussion. Currently, the Bank is analyzing the impact of utilizing the Bank's framework to enhance the quality of education in private schools.
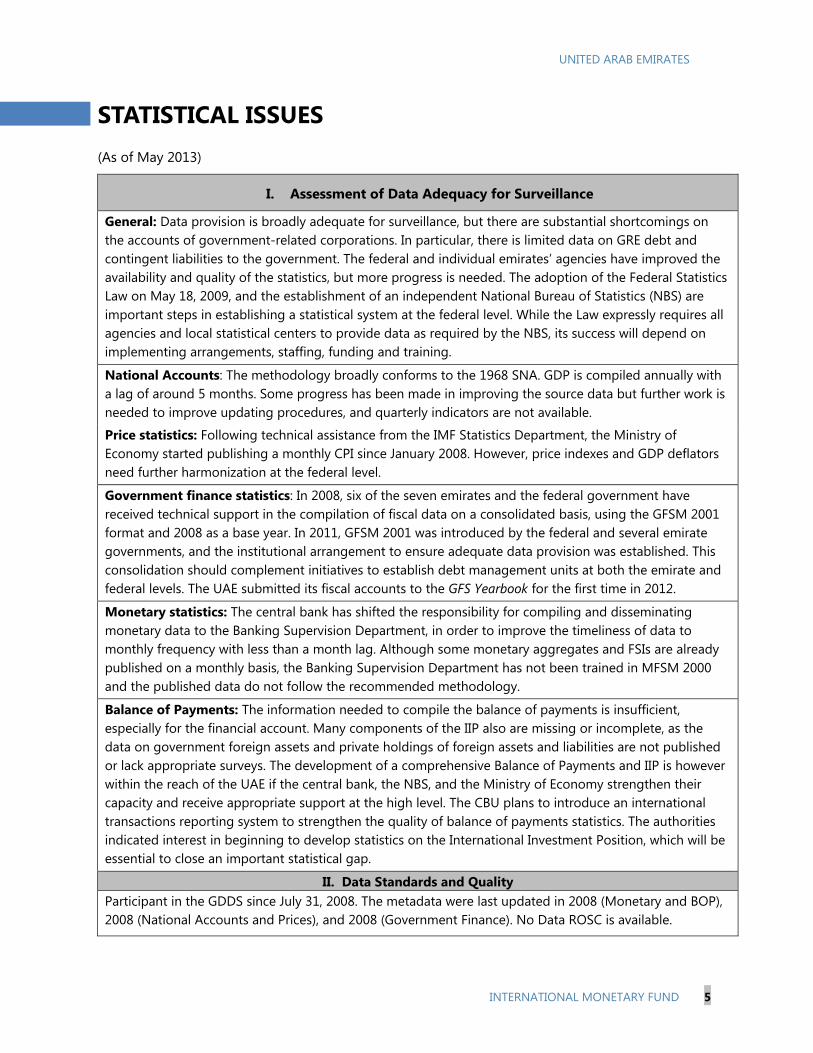
UNITED ARAB EMIRATES
INTERNATIONAL MONETARY FUND 5
STATISTICAL ISSUES (As of May 2013)
I. Assessment of Data Adequacy for Surveillance
General: Data provision is broadly adequate for surveillance, but there are substantial shortcomings on the accounts of government-related corporations. In particular, there is limited data on GRE debt and contingent liabilities to the government. The federal and individual emirates’ agencies have improved the availability and quality of the statistics, but more progress is needed. The adoption of the Federal Statistics Law on May 18, 2009, and the establishment of an independent National Bureau of Statistics (NBS) are important steps in establishing a statistical system at the federal level. While the Law expressly requires all agencies and local statistical centers to provide data as required by the NBS, its success will depend on implementing arrangements, staffing, funding and training.
National Accounts: The methodology broadly conforms to the 1968 SNA. GDP is compiled annually with a lag of around 5 months. Some progress has been made in improving the source data but further work is needed to improve updating procedures, and quarterly indicators are not available.
Price statistics: Following technical assistance from the IMF Statistics Department, the Ministry of Economy started publishing a monthly CPI since January 2008. However, price indexes and GDP deflators need further harmonization at the federal level.
Government finance statistics: In 2008, six of the seven emirates and the federal government have received technical support in the compilation of fiscal data on a consolidated basis, using the GFSM 2001 format and 2008 as a base year. In 2011, GFSM 2001 was introduced by the federal and several emirate governments, and the institutional arrangement to ensure adequate data provision was established. This consolidation should complement initiatives to establish debt management units at both the emirate and federal levels. The UAE submitted its fiscal accounts to the GFS Yearbook for the first time in 2012.
Monetary statistics: The central bank has shifted the responsibility for compiling and disseminating monetary data to the Banking Supervision Department, in order to improve the timeliness of data to monthly frequency with less than a month lag. Although some monetary aggregates and FSIs are already published on a monthly basis, the Banking Supervision Department has not been trained in MFSM 2000 and the published data do not follow the recommended methodology.
Balance of Payments: The information needed to compile the balance of payments is insufficient, especially for the financial account. Many components of the IIP also are missing or incomplete, as the data on government foreign assets and private holdings of foreign assets and liabilities are not published or lack appropriate surveys. The development of a comprehensive Balance of Payments and IIP is however within the reach of the UAE if the central bank, the NBS, and the Ministry of Economy strengthen their capacity and receive appropriate support at the high level. The CBU plans to introduce an international transactions reporting system to strengthen the quality of balance of payments statistics. The authorities indicated interest in beginning to develop statistics on the International Investment Position, which will be essential to close an important statistical gap.
II. Data Standards and Quality Participant in the GDDS since July 31, 2008. The metadata were last updated in 2008 (Monetary and BOP), 2008 (National Accounts and Prices), and 2008 (Government Finance). No Data ROSC is available.
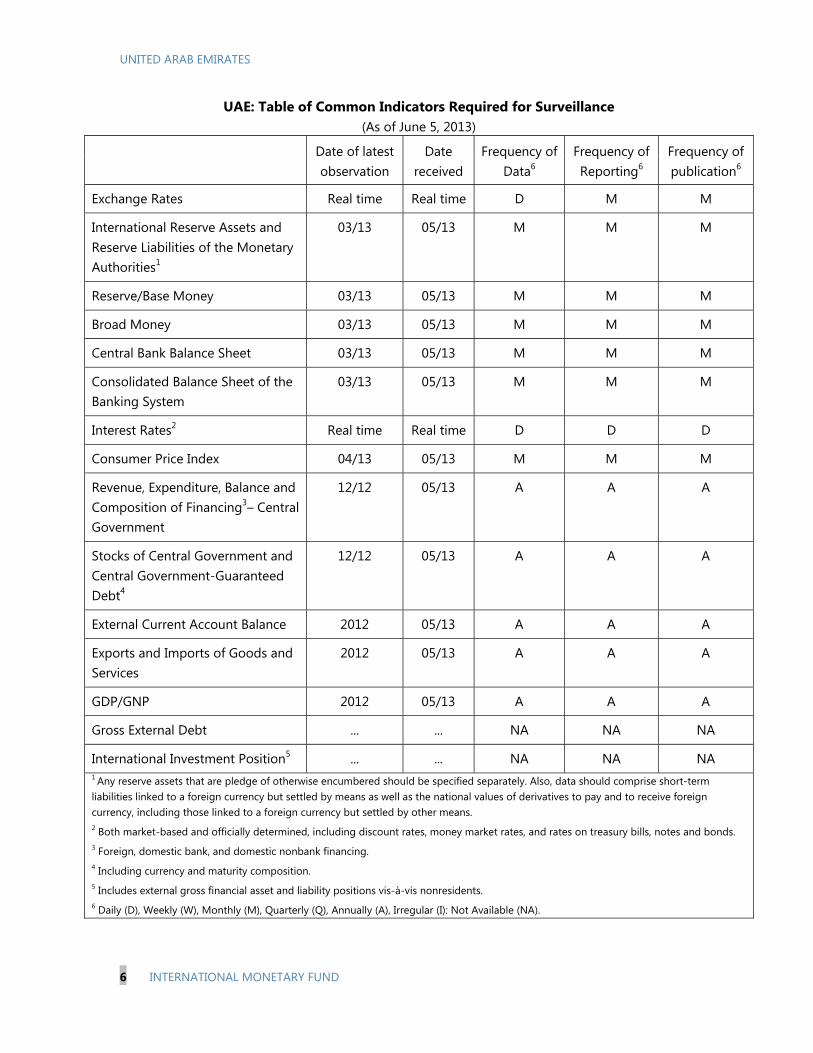
UNITED ARAB EMIRATES
6 INTERNATIONAL MONETARY FUND
UAE: Table of Common Indicators Required for Surveillance (As of June 5, 2013)
Date of latest observation
Date received
Frequency of Data6
Frequency of Reporting6
Frequency of publication6
Exchange Rates Real time Real time D M M
International Reserve Assets and Reserve Liabilities of the Monetary Authorities1
03/13 05/13 M M M
Reserve/Base Money 03/13 05/13 M M M
Broad Money 03/13 05/13 M M M
Central Bank Balance Sheet 03/13 05/13 M M M
Consolidated Balance Sheet of the Banking System
03/13 05/13 M M M
Interest Rates2 Real time Real time D D D
Consumer Price Index 04/13 05/13 M M M
Revenue, Expenditure, Balance and Composition of Financing3– Central Government
12/12 05/13 A A A
Stocks of Central Government and Central Government-Guaranteed Debt4
12/12 05/13 A A A
External Current Account Balance 2012 05/13 A A A
Exports and Imports of Goods and Services
2012 05/13 A A A
GDP/GNP 2012 05/13 A A A
Gross External Debt ... ... NA NA NA
International Investment Position5 ... ... NA NA NA 1 Any reserve assets that are pledge of otherwise encumbered should be specified separately. Also, data should comprise short-term liabilities linked to a foreign currency but settled by means as well as the national values of derivatives to pay and to receive foreign currency, including those linked to a foreign currency but settled by other means. 2 Both market-based and officially determined, including discount rates, money market rates, and rates on treasury bills, notes and bonds. 3 Foreign, domestic bank, and domestic nonbank financing. 4 Including currency and maturity composition. 5 Includes external gross financial asset and liability positions vis-à-vis nonresidents. 6 Daily (D), Weekly (W), Monthly (M), Quarterly (Q), Annually (A), Irregular (I): Not Available (NA).

Press Release No. 13/283
FOR IMMEDIATE RELEASE
July 30, 2013
IMF Executive Board Concludes 2013 Article IV Consultation with
United Arab Emirates
On July 15, 2013, the Executive Board of the International Monetary Fund (IMF) concluded
the Article IV consultation with United Arab Emirates and considered and endorsed the staff
appraisal without a meeting.1
The economic recovery continued in 2012 supported by favorable oil prices, capital inflows
and the UAE’s safe-haven status amid the regional political and social unrest. Overall GDP
growth is projected to have reached 4.3 percent in 2012 as hydrocarbon production expanded
by around 5.2 percent, and non-oil growth accelerated to 3.8 percent. The external current
account surplus rose to almost 17 percent of GDP supported also by buoyant
non-hydrocarbon exports. A broadening recovery in construction and real estate, and ongoing
growth in tourism-oriented sectors are expected to underpin a further acceleration in non-oil
growth to 4.3 percent this year. At the same time, growth in oil production will likely slow in
the context of ample global supply. Non-hydrocarbon growth is expected to remain strong at
above 4 percent in the medium term, though subject to substantial external risks. Inflation
remained subdued at 0.7 percent in 2012, and is expected to pick up only moderately in 2013.
Aiming to build on its achievements in becoming a regional services and tourism hub, Dubai
recently announced plans for several new megaprojects in real estate and tourism that will be
executed to a large extent through its Government-Related Entities (GRE). Dubai’s GREs are
increasingly regaining access to external financing in an environment of ample global
liquidity, while their debt continues to be high. While GRE debt restructurings related to the
2009 crisis are nearing completion, several large maturities are now drawing closer,
including on restructured debt, between 2014 and 2018.
The banking system maintains significant capital and liquidity buffers, and non-performing
loans may finally have peaked at 8.7 percent in December 2012. Nonetheless, further
restructuring of GRE debt, including possibly on already restructured debt, could still add
materially to this level. Despite the accommodative monetary stance under the peg to the
U.S. dollar, lending to the private sector has remained sluggish.
1 Under Article IV of the IMF's Articles of Agreement, the IMF holds bilateral discussions with members,
usually every year. A staff team visits the country, collects economic and financial information, and discusses
with officials the country's economic developments and policies. On return to headquarters, the staff prepares a
report, which forms the basis for discussion by the Executive Board.
International Monetary Fund
Washington, D.C. 20431 USA
2
Executive Board Assessment
In concluding the 2013 Article IV consultation with the United Arab Emirates, Executive
Directors endorsed staff’s appraisal, as follows:
Short- and medium-term growth prospects are positive, and external downside risks, while
still substantial, have declined. The non-oil economy is projected to expand by over 4 percent
per annum in the coming years on the back of Dubai’s strong core services sectors and Abu
Dhabi’s diversification efforts. The still-uncertain global economic and financial
environment could pose external risks to this favorable outlook, although the UAE’s sizeable
foreign assets and improving fiscal position provide significant buffers.
In this environment, it will be key to enact policies to strengthen the economy’s resilience
and mitigate the risk of entering a renewed boom-bust cycle. The pace of recovery in some
segments of the real estate market and a number of announcements since late 2012 of new
megaprojects in real estate and tourism warrant a cautious approach to policymaking. This
approach should entail implementing further fiscal consolidation, limiting new risk-taking by
the large and still highly indebted GRE sector, and devising prudent financial sector
regulation. At the same time, there is a need for continued focus on dealing with the legacy
of the 2009 crisis.
Fiscal policy is appropriately aimed at consolidation. The strengthening economy allows for
further withdrawal of the large fiscal stimulus implemented in the context of the 2009 crisis,
bringing spending again closer to levels consistent with intergenerational equity, and further
reducing break-even oil prices. Fiscal consolidation will also help contain fiscal
vulnerabilities stemming from Dubai in the face of potentially large contingent liabilities.
Should the rise in real estate prices in some sectors continue unabated, the authorities should
consider implementing targeted increases in real estate-related fees, which could help
mitigate speculative price pressures while generating revenue in support of fiscal
consolidation. Building on recent progress in developing Medium Term Fiscal Frameworks
(MTFFs), such frameworks should continue to be refined, and, in the case of Abu Dhabi,
increasingly integrated into the budget formulation process.
Building on progress in restructuring the debt of GREs, Dubai should continue to focus on
strengthening the GRE sector. The total debt of the Dubai government and GREs continues
to be large, and GREs are likely to continue facing financial challenges in light of large
outstanding debt and significant maturities, including on restructured debt, falling due
between 2014 and 2018. Many of Dubai’s GREs continue to be nontransparent, making an
assessment of the sector’s financial health and associated macroeconomic risks difficult.
Improving the transparency and governance of GREs, as well as timely communication about
key maturing debt will be important to support market confidence.
Close oversight of the GREs will be essential to prevent a renewed cycle of risk-taking.
Dubai’s GREs and banks are increasingly regaining access to external financing in an
environment of high global liquidity and search for yield. Renewed large-scale external and
3
domestic borrowing to finance ambitious real estate and tourism projects should be
preempted to avoid setting off a new boom-bust cycle. Continued close oversight of GREs by
the Dubai Supreme Fiscal Committee will be essential, and should be strengthened by
developing adequate mechanisms for prioritizing and sequencing major projects, and for
assessing the quality of planned spending.
The implementation of planned prudential regulations will help mitigate the risk of a build-
up of banking sector vulnerabilities. With significant capital and liquidity buffers, banks
show substantial resilience to shocks. Building on this strength, it will be important to
preempt the build-up of new vulnerabilities. Swift implementation of the planned new
prudential regulations for mortgage lending and loan concentration would mitigate the risk of
rapid credit expansion and undue loan concentration to the real estate and GRE sectors in the
future. These policies should be complemented by developing a more formal and transparent
macroprudential institutional and policy framework. The proposed new Financial Services
Law provides an opportunity to establish the legal base for such a framework. Developing
the domestic fixed income market would support banks’ liquidity management as they
prepare for the introduction of the Basel III liquidity norms, and would help the
diversification of funding sources for corporates. The planned assessment under the Financial
Sector Assessment Program (FSAP) will be a welcome opportunity to review the financial
sector’s strengths and weaknesses. This assessment would also be a suitable occasion to
conduct a review of the UAE’s Anti-Money Laundering/Combating the Financing of
Terrorism policies.
Staff welcomes the notable progress made in fiscal coordination among the federal and
emirate governments. Building on this achievement, coordination can be further strengthened
by improving the quality and availability of fiscal information and macrofiscal analysis,
jointly discussing budgets and MTFFs, and enhancing expenditure policy coordination.
Staff encourages the authorities to build on recent progress in improving statistics. It will be
important to maintain the recent momentum of strengthening economic statistics by
providing adequate resources for improving the quality of the national accounts and for
producing demographic and labor markets statistics, while continuing to strengthen balance
of payments statistics. Developing statistics on the International Investment Position will be
essential to close an important gap.
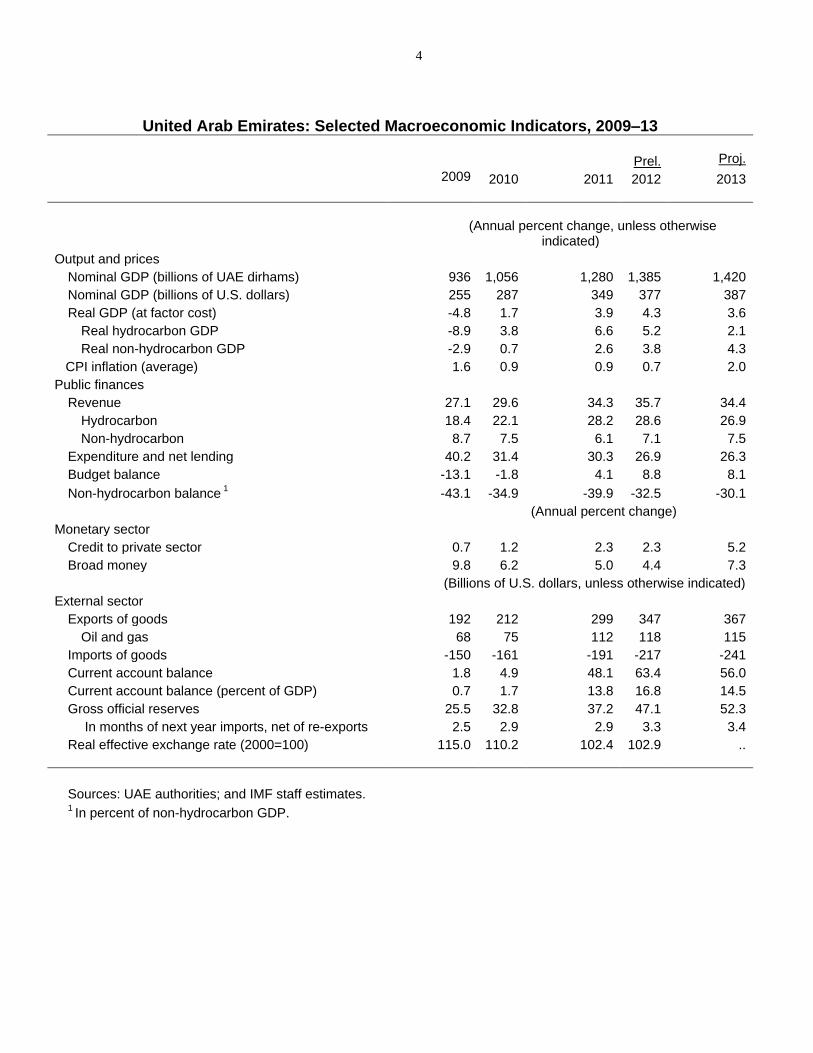
4
United Arab Emirates: Selected Macroeconomic Indicators, 2009–13
Prel. Proj.
2009 2010 2011 2012 2013
(Annual percent change, unless otherwise
indicated)
Output and prices
Nominal GDP (billions of UAE dirhams) 936 1,056 1,280 1,385 1,420
Nominal GDP (billions of U.S. dollars) 255 287 349 377 387
Real GDP (at factor cost) -4.8 1.7 3.9 4.3 3.6
Real hydrocarbon GDP -8.9 3.8 6.6 5.2 2.1
Real non-hydrocarbon GDP -2.9 0.7 2.6 3.8 4.3
CPI inflation (average) 1.6 0.9 0.9 0.7 2.0
Public finances
Revenue 27.1 29.6 34.3 35.7 34.4
Hydrocarbon 18.4 22.1 28.2 28.6 26.9
Non-hydrocarbon 8.7 7.5 6.1 7.1 7.5
Expenditure and net lending 40.2 31.4 30.3 26.9 26.3
Budget balance -13.1 -1.8 4.1 8.8 8.1
Non-hydrocarbon balance 1 -43.1 -34.9 -39.9 -32.5 -30.1
(Annual percent change)
Monetary sector
Credit to private sector 0.7 1.2 2.3 2.3 5.2
Broad money 9.8 6.2 5.0 4.4 7.3
(Billions of U.S. dollars, unless otherwise indicated)
External sector
Exports of goods 192 212 299 347 367
Oil and gas 68 75 112 118 115
Imports of goods -150 -161 -191 -217 -241
Current account balance 1.8 4.9 48.1 63.4 56.0
Current account balance (percent of GDP) 0.7 1.7 13.8 16.8 14.5
Gross official reserves 25.5 32.8 37.2 47.1 52.3
In months of next year imports, net of re-exports 2.5 2.9 2.9 3.3 3.4
Real effective exchange rate (2000=100) 115.0 110.2 102.4 102.9 ..
Sources: UAE authorities; and IMF staff estimates. 1 In percent of non-hydrocarbon GDP.