Embed Size (px)
Citation preview
1
Imerys
Group Presentation
2Group presentation I September 2013
Table of contentsTable of contentsTable of contentsTable of contentsGroup presentation
� Imerys: the world leader of mineral-based specialty products
� A profitable and solid business model
� Development strategy: accelerating growth by enlarging
our business footprint
� Conclusion
3Group presentation I September 2013
Disclaimer
More comprehensive information about Imerys is available on the Company’s website
(www.imerys.com), under Regulated Information, including its Registration Document filed
under No. D.13-0195 on March 21, 2013 with Autorité des marchés financiers. Imerys draws
the attention of investors to the “Risk factors” set forth in section 4 of the Registration
Document.
This document contains projections and other forward-looking statements. Investors are
cautioned that such projections and forward-looking statements are subject to various risks
and uncertainties (many of which are difficult to predict and generally beyond the control of
Imerys) that could cause actual results and developments to differ materially from those
expressed or implied.
Photo credits: Imerys photo library, RR, X.
4Group presentation I September 2013
IMERYS
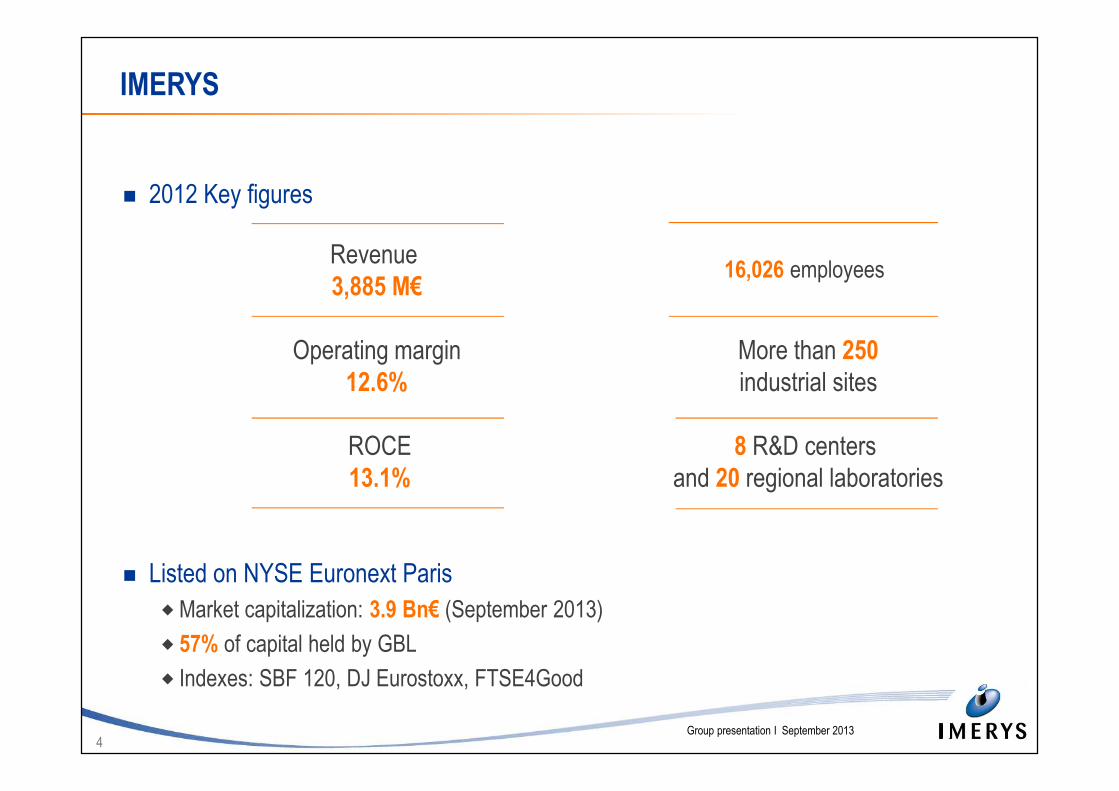
� 2012 Key figures
� Listed on NYSE Euronext Paris
�Market capitalization: 3.9 Bn€ (September 2013)
� 57% of capital held by GBL
� Indexes: SBF 120, DJ Eurostoxx, FTSE4Good
Revenue
3,885 M€
Operating margin
12.6%
ROCE
13.1%
More than 250
industrial sites
8 R&D centers
and 20 regional laboratories
16,026 employees
5Group presentation I September 2013
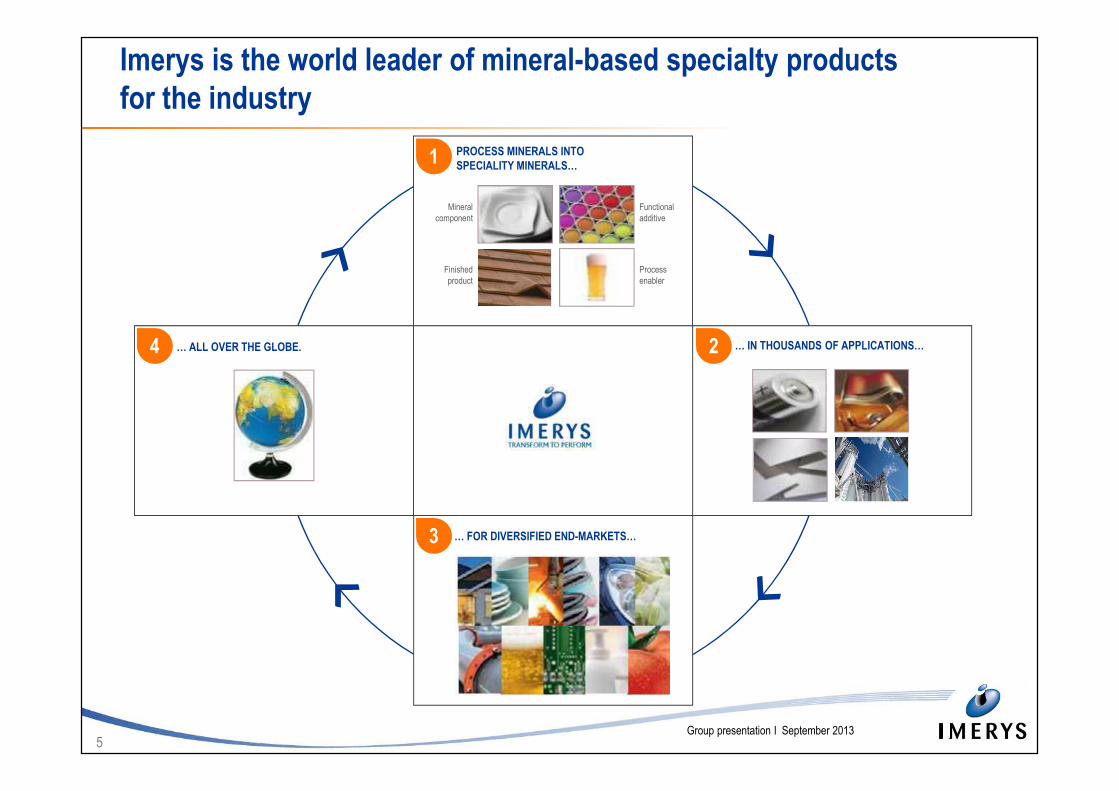
Imerys is the world leader of mineral-based specialty products
for the industry
… IN THOUSANDS OF APPLICATIONS…
PROCESS MINERALS INTO
SPECIALITY MINERALS…
Finished
product
Process
enabler
Mineral
component
Functional
additive
… ALL OVER THE GLOBE.
… FOR DIVERSIFIED END-MARKETS…
1
2
3
4
6Group presentation I September 2013
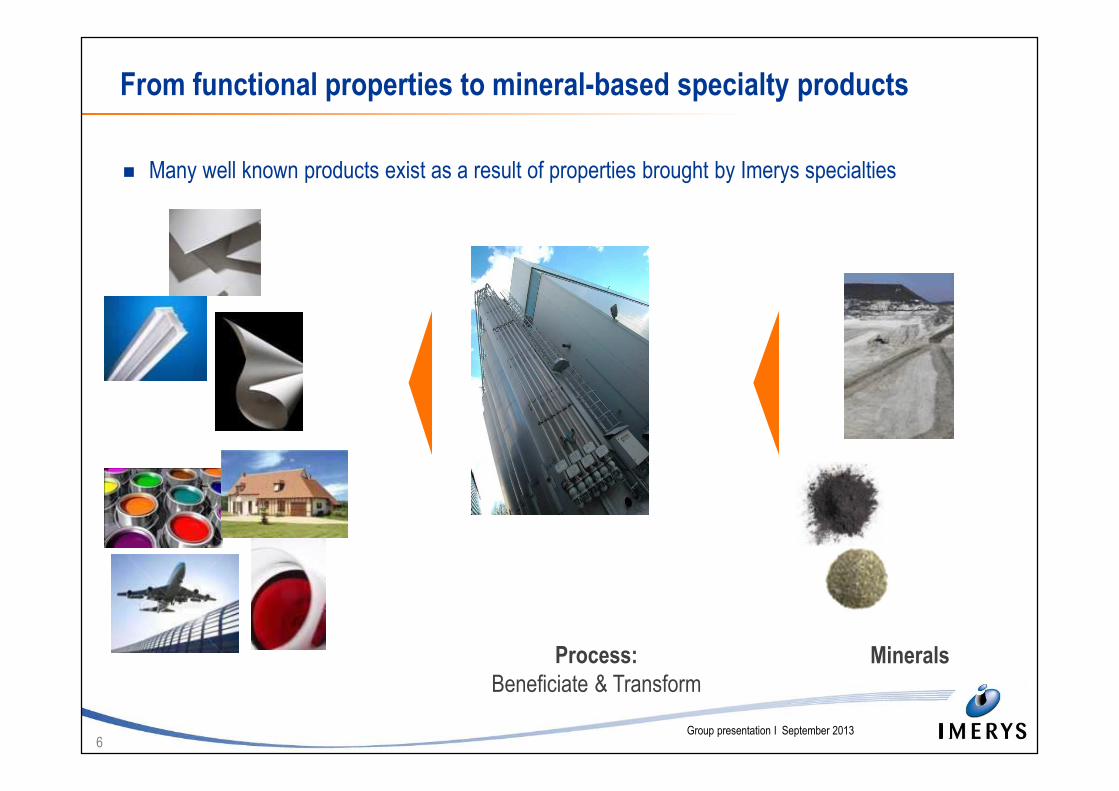
From functional properties to mineral-based specialty products
� Many well known products exist as a result of properties brought by Imerys specialties
MineralsProcess:
Beneficiate & Transform
7Group presentation I September 2013
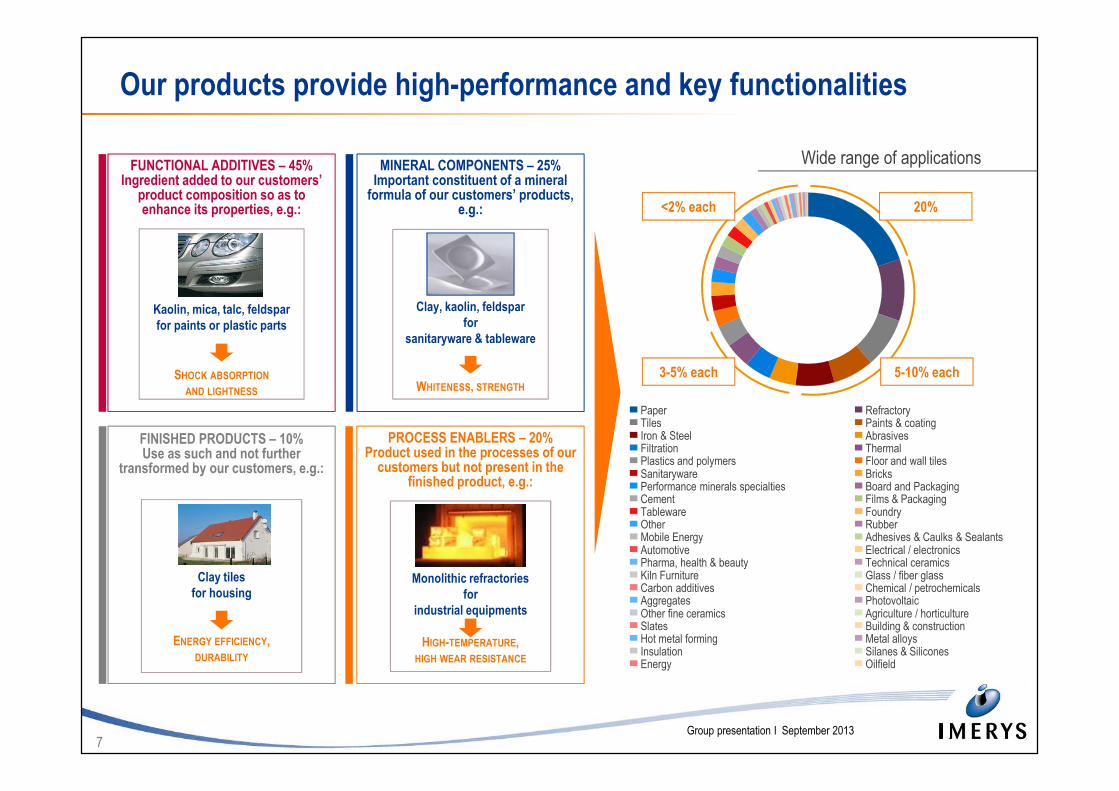
FUNCTIONAL ADDITIVES – 45%Ingredient added to our customers’
product composition so as to enhance its properties, e.g.:
PROCESS ENABLERS – 20%Product used in the processes of our
customers but not present in the finished product, e.g.:
Monolithic refractories
for
industrial equipments
HIGH-TEMPERATURE,
HIGH WEAR RESISTANCE
Our products provide high-performance and key functionalities
MINERAL COMPONENTS – 25%Important constituent of a mineral
formula of our customers’ products, e.g.:
Clay, kaolin, feldspar
for
sanitaryware & tableware
WHITENESS, STRENGTH
Kaolin, mica, talc, feldspar
for paints or plastic parts
SHOCK ABSORPTION
AND LIGHTNESS
Paper RefractoryTiles Paints & coatingIron & Steel AbrasivesFiltration ThermalPlastics and polymers Floor and wall tilesSanitaryware BricksPerformance minerals specialties Board and PackagingCement Films & PackagingTableware FoundryOther RubberMobile Energy Adhesives & Caulks & SealantsAutomotive Electrical / electronicsPharma, health & beauty Technical ceramicsKiln Furniture Glass / fiber glassCarbon additives Chemical / petrochemicalsAggregates PhotovoltaicOther fine ceramics Agriculture / horticultureSlates Building & constructionHot metal forming Metal alloysInsulation Silanes & SiliconesEnergy Oilfield
FINISHED PRODUCTS – 10%Use as such and not further
transformed by our customers, e.g.:
Clay tiles
for housing
ENERGY EFFICIENCY,
DURABILITY
0
Wide range of applications
<2% each
3-5% each
20%
5-10% each
8Group presentation I September 2013
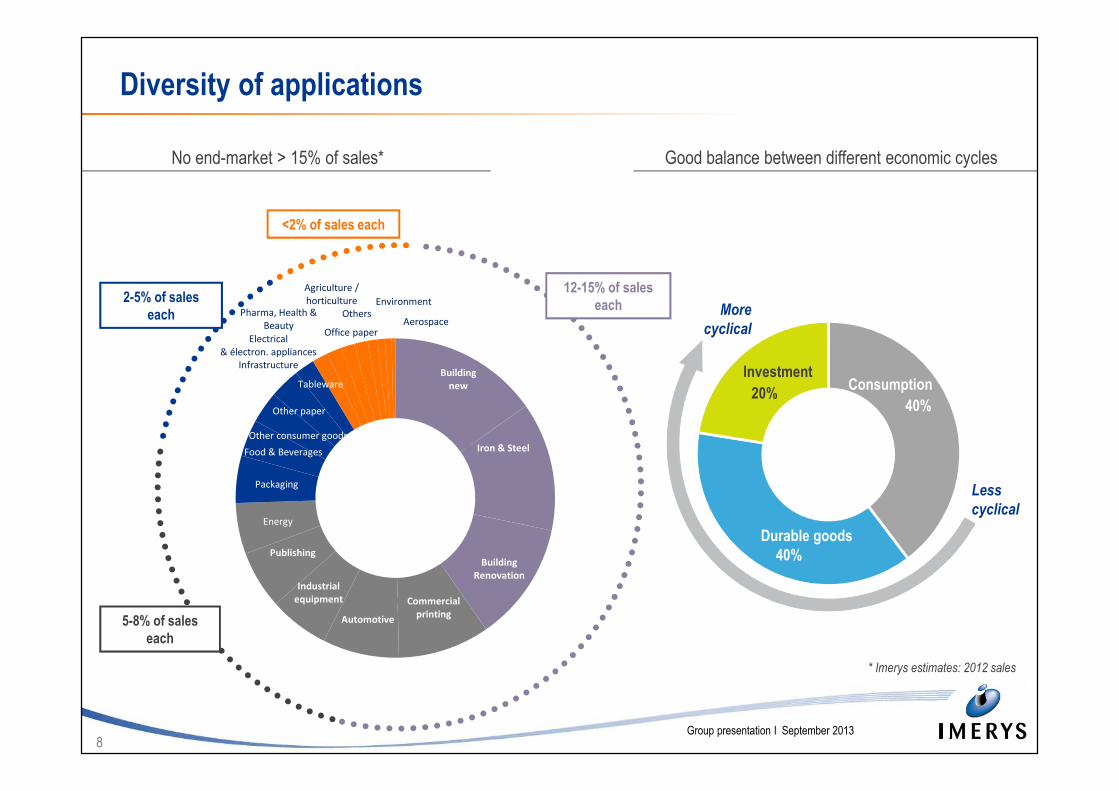
Diversity of applications
* Imerys estimates: 2012 sales
Consumption
40%
Durable goods
40%
Investment
20%
More
cyclical
Less
cyclical
12-15% of sales
each
<2% of sales each
2-5% of sales
each
5-8% of sales
each
Good balance between different economic cyclesNo end-market > 15% of sales*
Building
new
Iron & Steel
Building
Renovation
Commercial
printingAutomotive
Industrial
equipment
Publishing
Energy
Packaging
Food & Beverages
Other consumer goods
Other paper
Tableware
Infrastructure
Electrical
& électron. appliances
Pharma, Health &
BeautyOffice paper
Environment
Agriculture /
horticulture
OthersAerospace
9Group presentation I September 2013
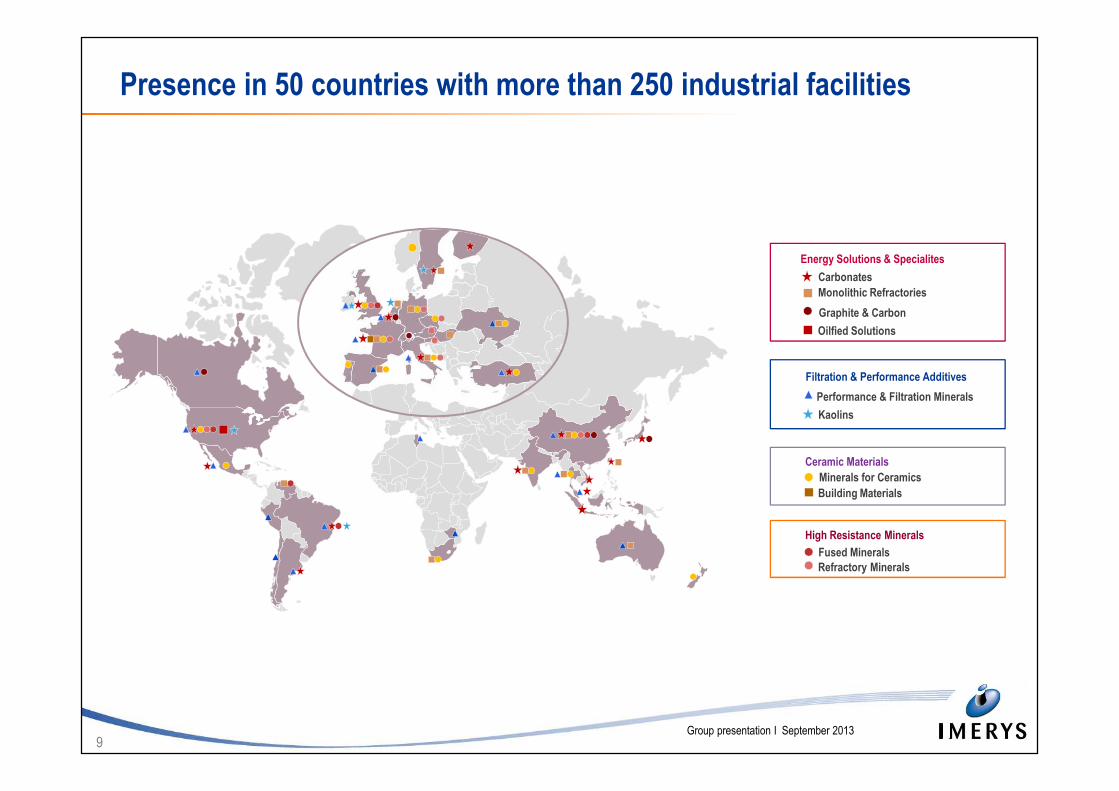
Presence in 50 countries with more than 250 industrial facilities
Minerals for Ceramics
Energy Solutions & Specialites
Performance & Filtration Minerals
Filtration & Performance Additives
Kaolins
Ceramic Materials
Monolithic Refractories
High Resistance Minerals
Building Materials
Fused Minerals
Refractory Minerals
Graphite & Carbon
Carbonates
Oilfied Solutions
10Group presentation I September 2013
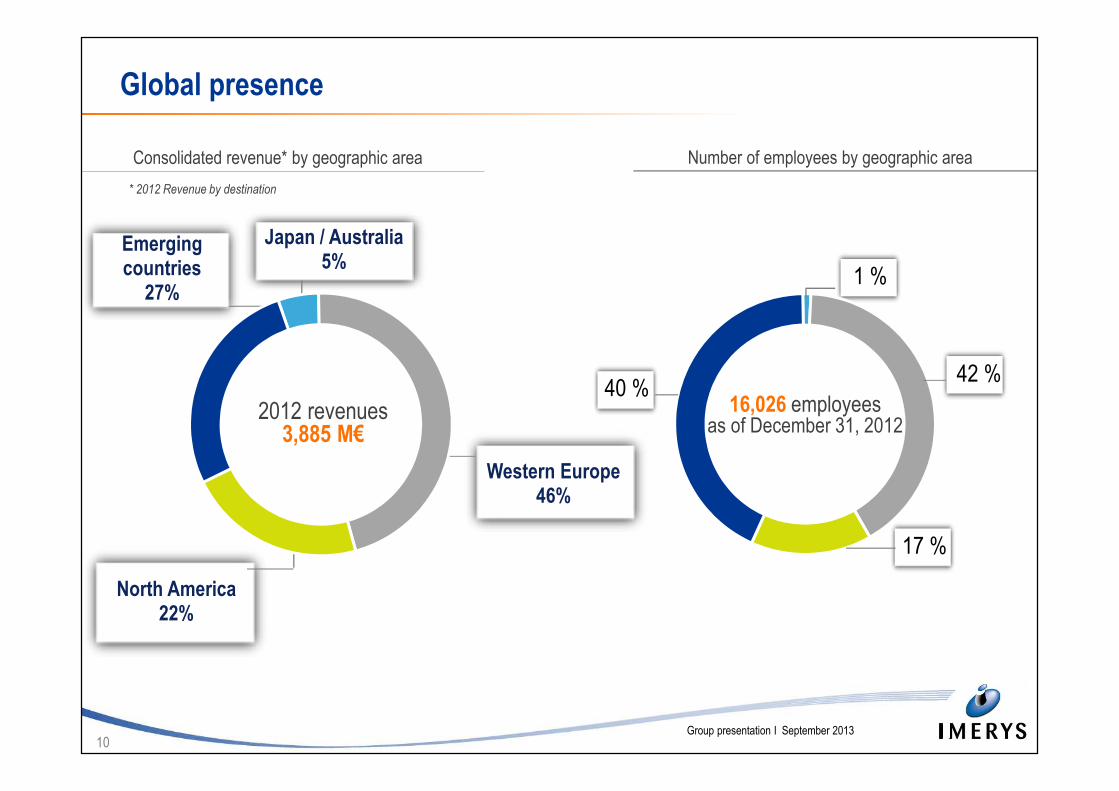
2012 revenues3,885 M€
1 %
42 %
17 %
40 %16,026 employees
as of December 31, 2012
Global presence
* 2012 Revenue by destination
Number of employees by geographic areaConsolidated revenue* by geographic area
Japan / Australia5%
Western Europe46%
North America22%
Emerging countries
27%
11Group presentation I September 2013
Table of contentsTable of contentsTable of contentsTable of contentsGroup presentation
� Imerys: the world leader of mineral-based specialty products
� A profitable and solid business model
� Development strategy: accelerating growth by enlarging
our business footprint
� Conclusion
12Group presentation I September 2013
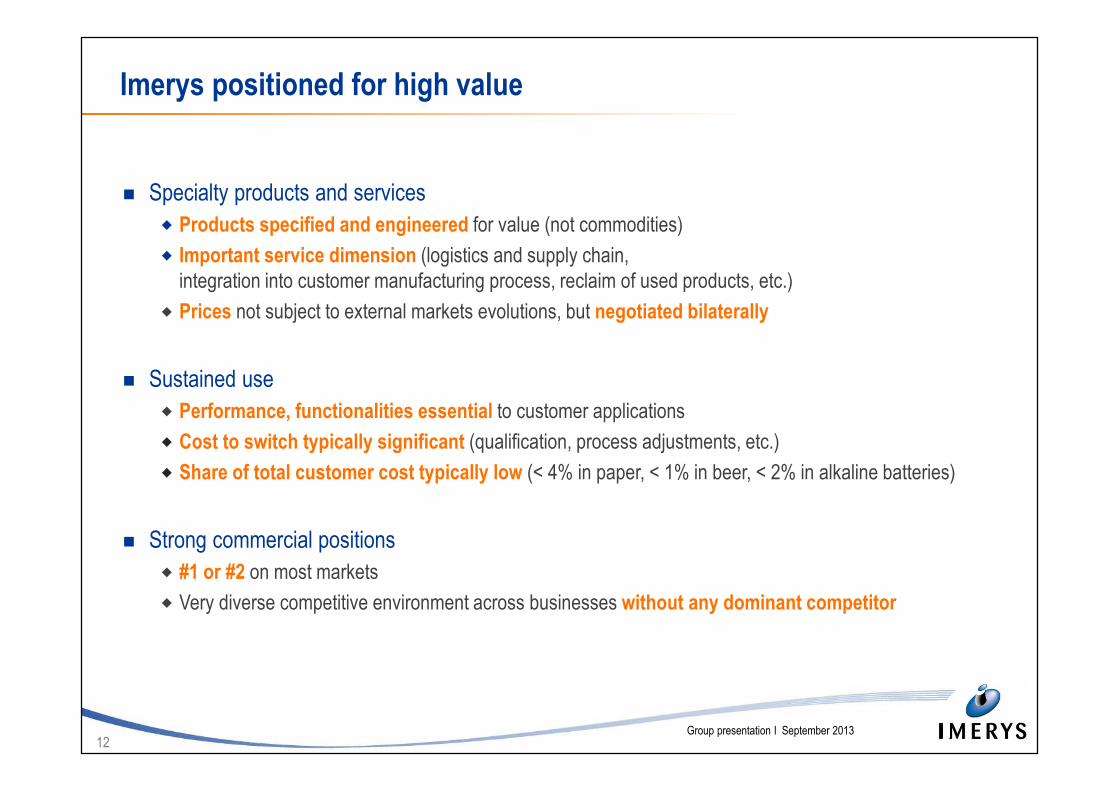
Imerys positioned for high value
� Specialty products and services
� Products specified and engineered for value (not commodities)
� Important service dimension (logistics and supply chain,
integration into customer manufacturing process, reclaim of used products, etc.)
� Prices not subject to external markets evolutions, but negotiated bilaterally
� Sustained use
� Performance, functionalities essential to customer applications
� Cost to switch typically significant (qualification, process adjustments, etc.)
� Share of total customer cost typically low (< 4% in paper, < 1% in beer, < 2% in alkaline batteries)
� Strong commercial positions
� #1 or #2 on most markets
� Very diverse competitive environment across businesses without any dominant competitor
13Group presentation I September 2013
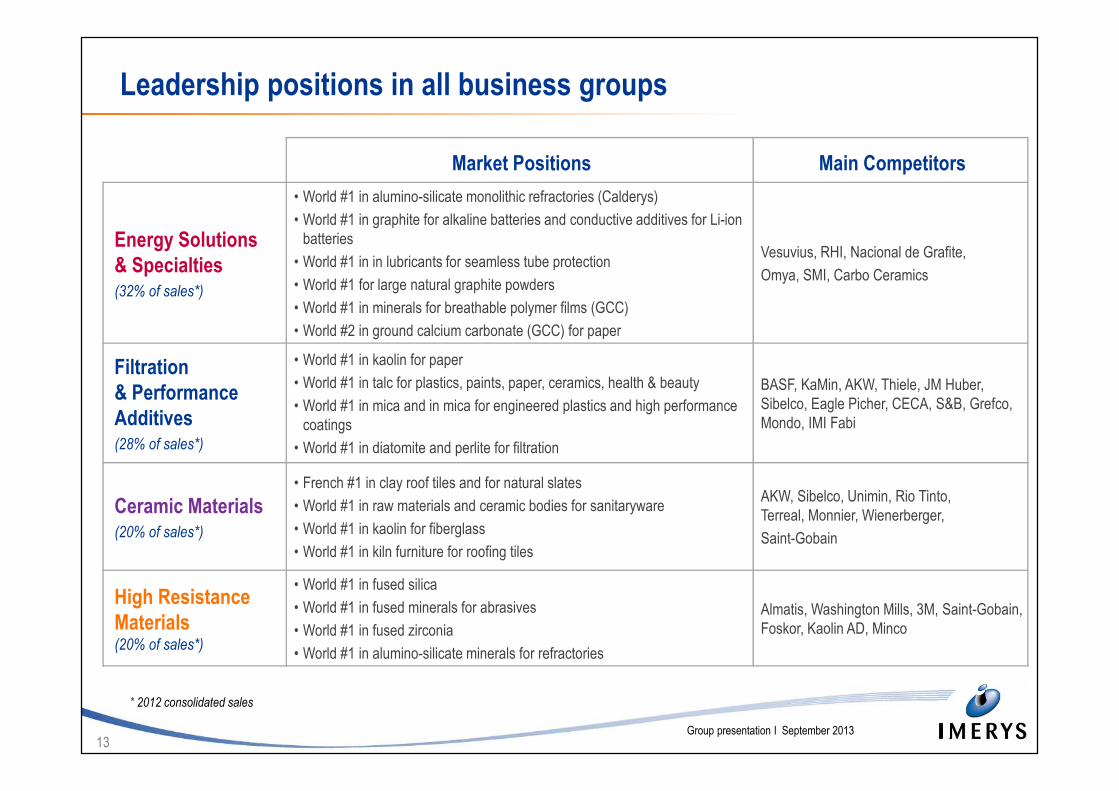
Leadership positions in all business groups
* 2012 consolidated sales
Market Positions Main Competitors
Energy Solutions
& Specialties(32% of sales*)
• World #1 in alumino-silicate monolithic refractories (Calderys)
• World #1 in graphite for alkaline batteries and conductive additives for Li-ion
batteries
• World #1 in in lubricants for seamless tube protection
• World #1 for large natural graphite powders
• World #1 in minerals for breathable polymer films (GCC)
• World #2 in ground calcium carbonate (GCC) for paper
Vesuvius, RHI, Nacional de Grafite,
Omya, SMI, Carbo Ceramics
Filtration
& Performance
Additives(28% of sales*)
• World #1 in kaolin for paper
• World #1 in talc for plastics, paints, paper, ceramics, health & beauty
• World #1 in mica and in mica for engineered plastics and high performance
coatings
• World #1 in diatomite and perlite for filtration
BASF, KaMin, AKW, Thiele, JM Huber,
Sibelco, Eagle Picher, CECA, S&B, Grefco,
Mondo, IMI Fabi
Ceramic Materials(20% of sales*)
• French #1 in clay roof tiles and for natural slates
• World #1 in raw materials and ceramic bodies for sanitaryware
• World #1 in kaolin for fiberglass
• World #1 in kiln furniture for roofing tiles
AKW, Sibelco, Unimin, Rio Tinto,
Terreal, Monnier, Wienerberger,
Saint-Gobain
High Resistance
Materials(20% of sales*)
• World #1 in fused silica
• World #1 in fused minerals for abrasives
• World #1 in fused zirconia
• World #1 in alumino-silicate minerals for refractories
Almatis, Washington Mills, 3M, Saint-Gobain,
Foskor, Kaolin AD, Minco
14Group presentation I September 2013
Our unique range of mineral assets is leveraged
as a source of competitive advantage
� Over 20 years of high-quality mineral reserves
� 30 minerals totalling 600 Mt of reserves
� 121 mining sites
� Strong in-house geological and mining expertise
� 140 geologists
� Upward integration to the mine whenever necessary
to sustain cost / quality / availability
� 2/3 of Imerys sales generated “from mine to market”
15Group presentation I September 2013
Our core competitive advantages include know-how, technology,
industrial efficiency
� Unique process know-how
� Mechanical treatment (sorting, shaping, sieving, cycloning, elutriation, etc.)
� Thermal treatment (fusion, calcination, sintering, etc.)
� Formulation of proprietary recipes
� High-volume production (tiles)
� Operational excellence
� Group-wide Key Performance Indicators
� Three-year Sustainable Development Plan to make further progress
across the Group (governance, human rights, environment, safety, communities, innovation,
purchasing, human resources)
16Group presentation I September 2013
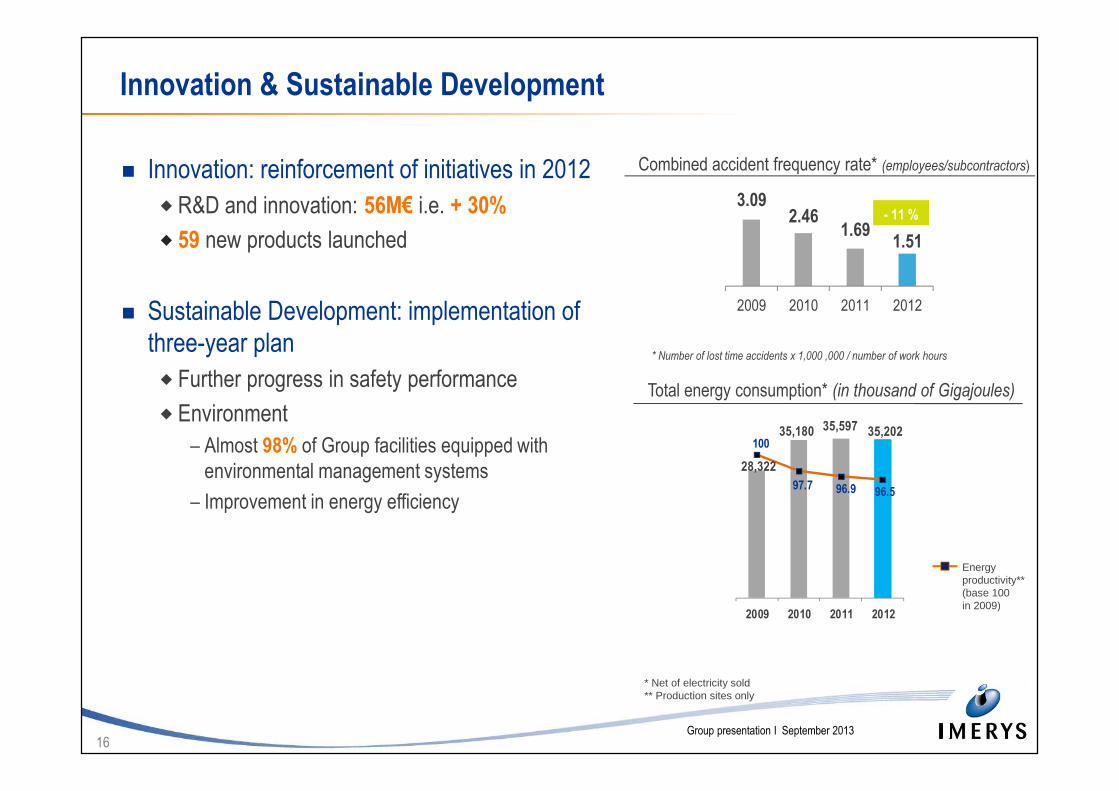
Innovation & Sustainable Development
� Innovation: reinforcement of initiatives in 2012
� R&D and innovation: 56M€ i.e. + 30%
� 59 new products launched
� Sustainable Development: implementation of
three-year plan
� Further progress in safety performance
� Environment
‒ Almost 98% of Group facilities equipped with
environmental management systems
‒ Improvement in energy efficiency
* Net of electricity sold** Production sites only
* Number of lost time accidents x 1,000 ,000 / number of work hours
Energyproductivity**(base 100in 2009)
Combined accident frequency rate* (employees/subcontractors)
Total energy consumption* (in thousand of Gigajoules)
28,322
35,180 35,597 35,202 100
97.7 96.9 96.5
2009 2010 2011 2012
3.092.46
1.691.51
2009 2010 2011 2012
- 11 %
17Group presentation I September 2013
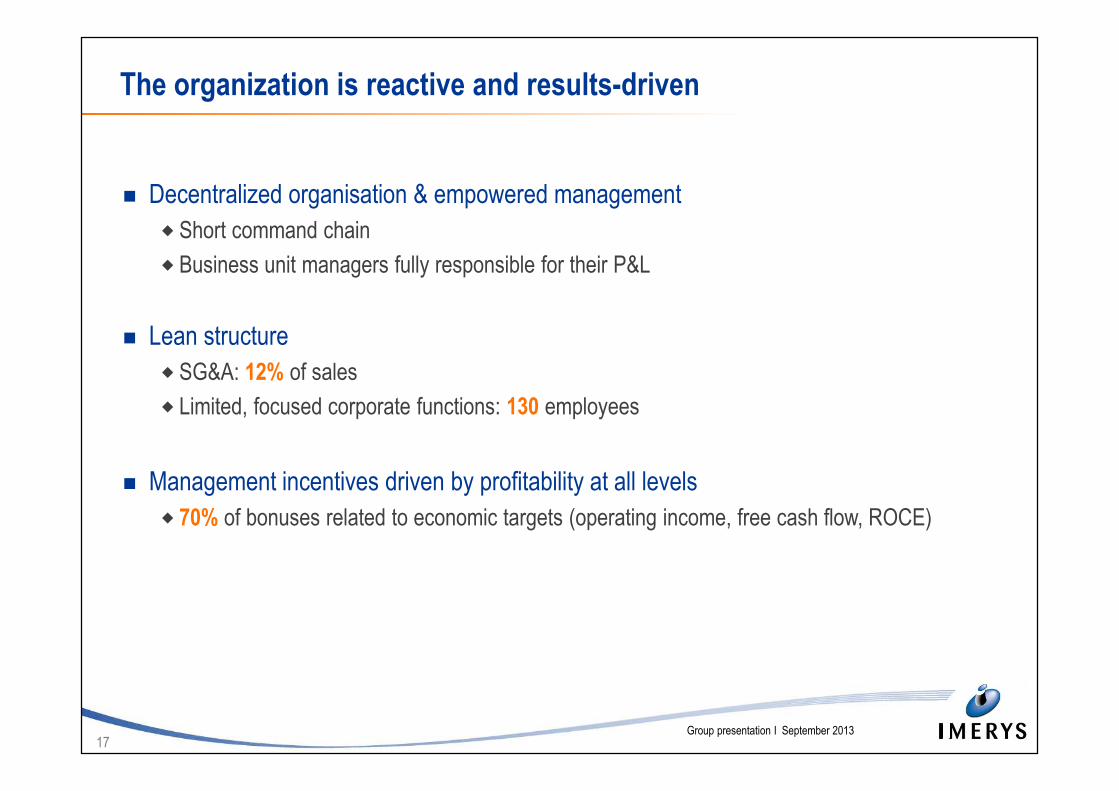
The organization is reactive and results-driven
� Decentralized organisation & empowered management
� Short command chain
� Business unit managers fully responsible for their P&L
� Lean structure
� SG&A: 12% of sales
� Limited, focused corporate functions: 130 employees
� Management incentives driven by profitability at all levels
� 70% of bonuses related to economic targets (operating income, free cash flow, ROCE)
18Group presentation I September 2013
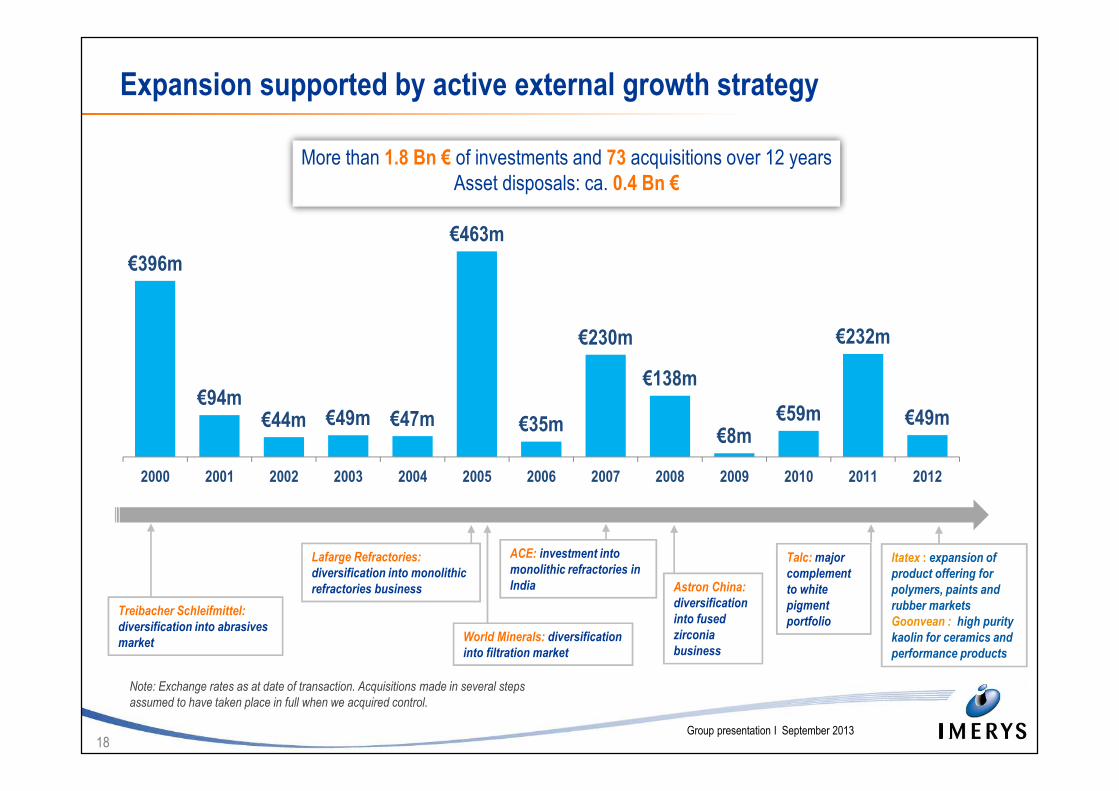
Note: Exchange rates as at date of transaction. Acquisitions made in several steps
assumed to have taken place in full when we acquired control.
5
World Minerals: diversification
into filtration market
ACE: investment into
monolithic refractories in
India Astron China:
diversification
into fused
zirconia
business
Talc: major
complement
to white
pigment
portfolioTreibacher Schleifmittel:
diversification into abrasives
market
Lafarge Refractories:
diversification into monolithic
refractories business
More than 1.8 Bn € of investments and 73 acquisitions over 12 years
Asset disposals: ca. 0.4 Bn €
€396m
€94m€44m €49m €47m
€463m
€35m
€230m
€138m
€8m€59m
€232m
€49m
2000 2001 2002 2003 2004 2005 2006 2007 2008 2009 2010 2011 2012
Itatex : expansion of
product offering for
polymers, paints and
rubber markets
Goonvean : high purity
kaolin for ceramics and
performance products
Expansion supported by active external growth strategy
19Group presentation I September 2013
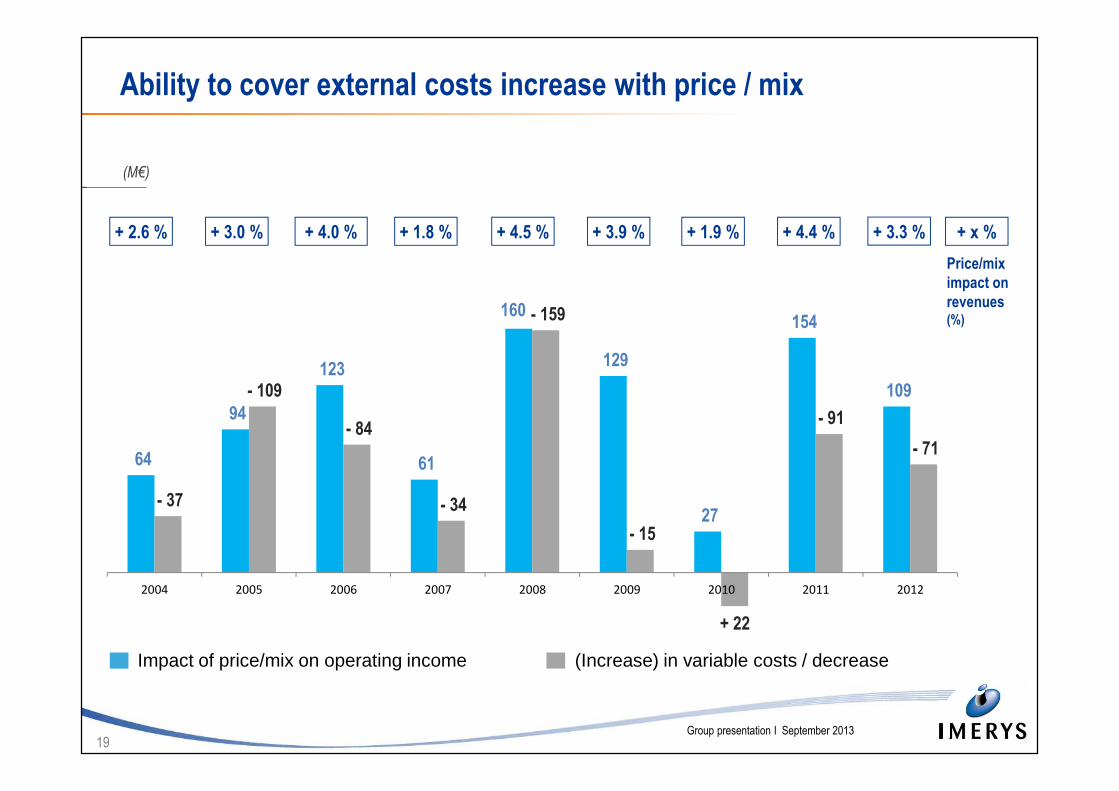
Ability to cover external costs increase with price / mix
(M€)
Price/mix
impact on
revenues(%)
+ 1.9 %+ 3.9 %+ 4.5 %+ 1.8 %+ 4.0 %+ 3.0 %+ 2.6 % + 4.4 % + x %
64
94
123
61
160
129
27
154
109
- 37
- 109
- 84
- 34
- 159
- 15
+ 22
- 91
- 71
2004 2005 2006 2007 2008 2009 2010 2011 2012
+ 3.3 %
Impact of price/mix on operating income (Increase) in variable costs / decrease
20Group presentation I September 2013
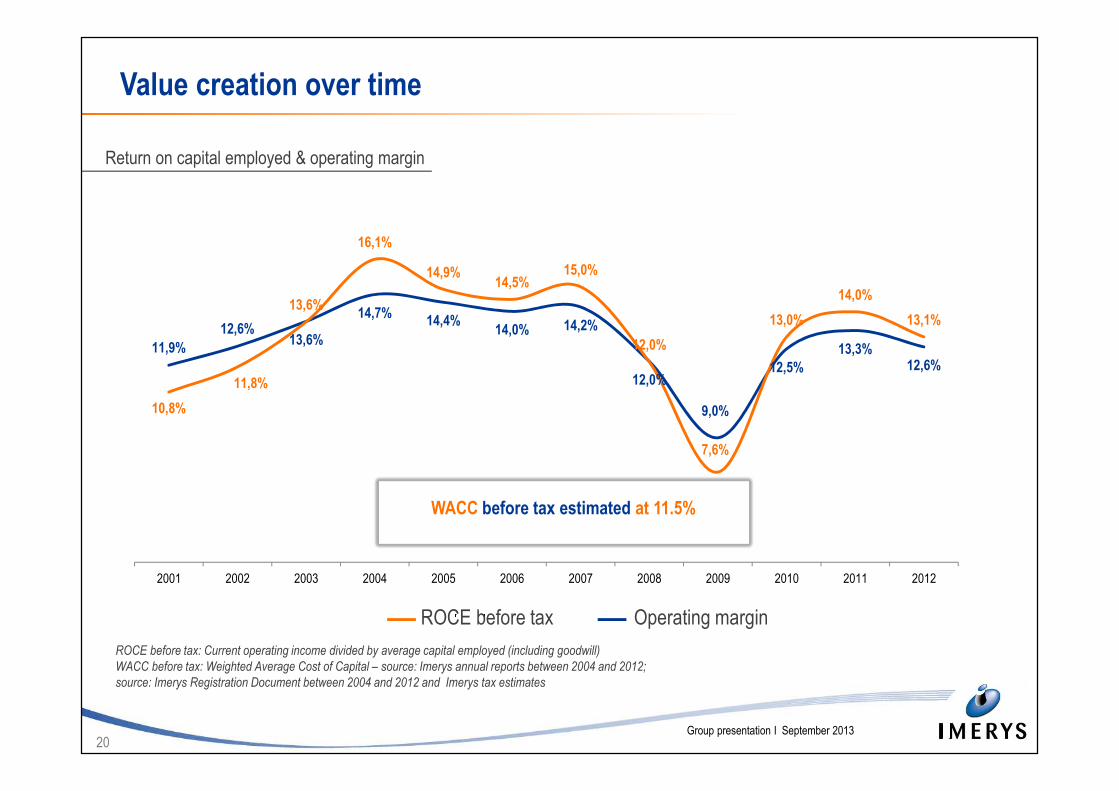
11,9%
12,6%13,6%
14,7%14,4%
14,0% 14,2%
12,0%
9,0%
12,5%
13,3%12,6%
10,8%
11,8%
13,6%
16,1%
14,9%14,5%
15,0%
12,0%
7,6%
13,0%
14,0%
13,1%
2001 2002 2003 2004 2005 2006 2007 2008 2009 2010 2011 2012
Value creation over time
ROCE before tax: Current operating income divided by average capital employed (including goodwill)
WACC before tax: Weighted Average Cost of Capital – source: Imerys annual reports between 2004 and 2012;
source: Imerys Registration Document between 2004 and 2012 and Imerys tax estimates
ROCE before tax Operating margin
WACC before tax estimated at 11.5%
Return on capital employed & operating margin
21Group presentation I September 2013
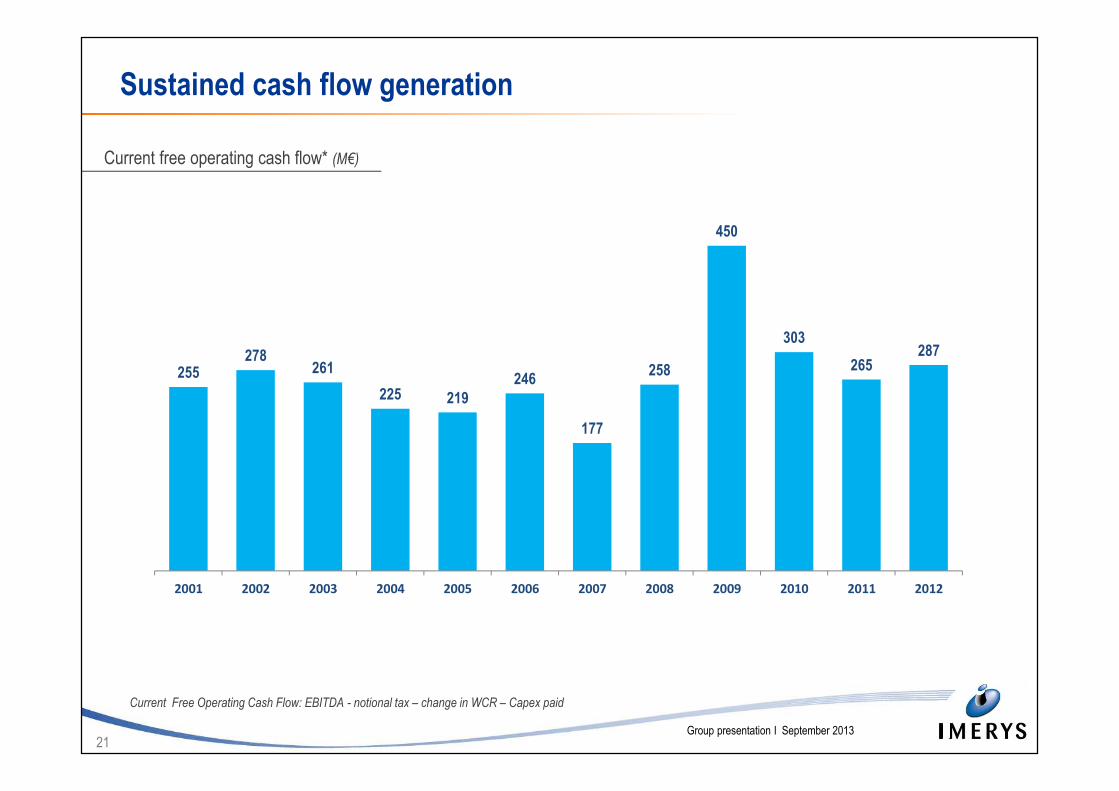
Sustained cash flow generation
Current Free Operating Cash Flow: EBITDA - notional tax – change in WCR – Capex paid
Current free operating cash flow* (M€)
255278
261
225 219
246
177
258
450
303
265287
2001 2002 2003 2004 2005 2006 2007 2008 2009 2010 2011 2012
22Group presentation I September 2013
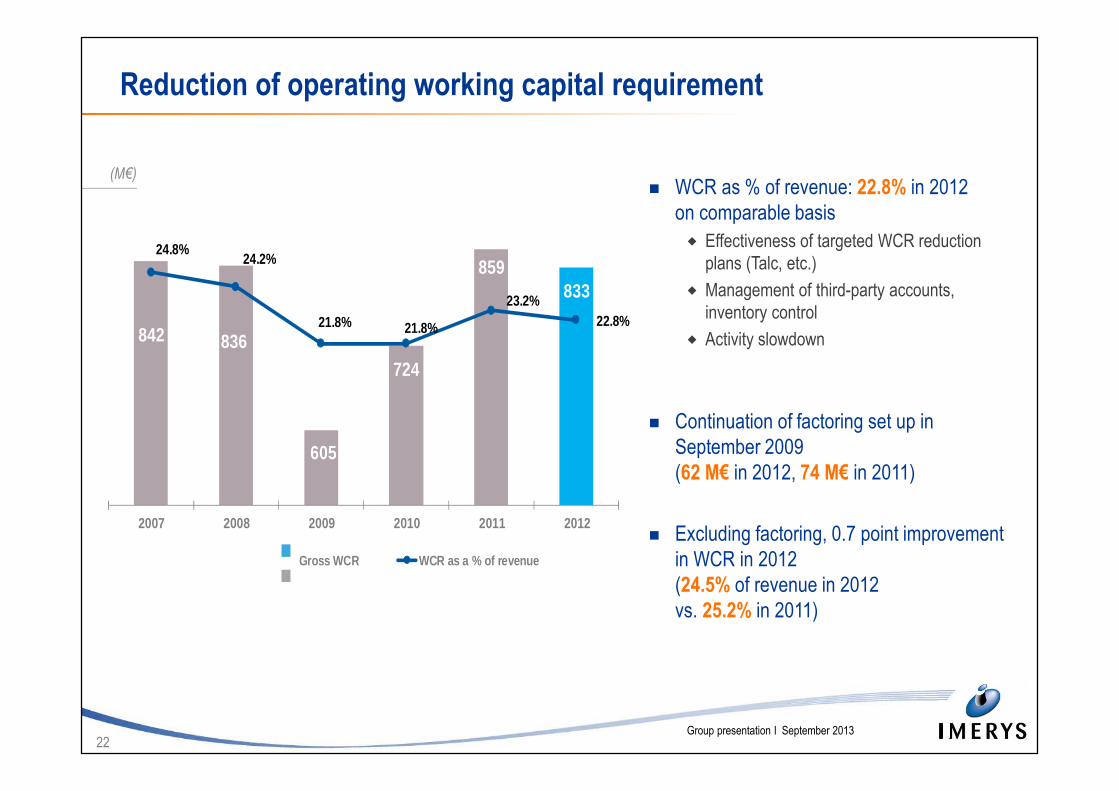
Reduction of operating working capital requirement
� WCR as % of revenue: 22.8% in 2012
on comparable basis
� Effectiveness of targeted WCR reduction
plans (Talc, etc.)
� Management of third-party accounts,
inventory control
� Activity slowdown
� Continuation of factoring set up in
September 2009
(62 M€ in 2012, 74 M€ in 2011)
� Excluding factoring, 0.7 point improvement
in WCR in 2012
(24.5% of revenue in 2012
vs. 25.2% in 2011)
842 836
605
724
859833
24.8%24.2%
21.8% 21.8%
23.2%22.8%
15
17
19
21
23
25
27
2007 2008 2009 2010 2011 2012
Gross WCR WCR as a % of revenue
(M€)
23Group presentation I September 2013
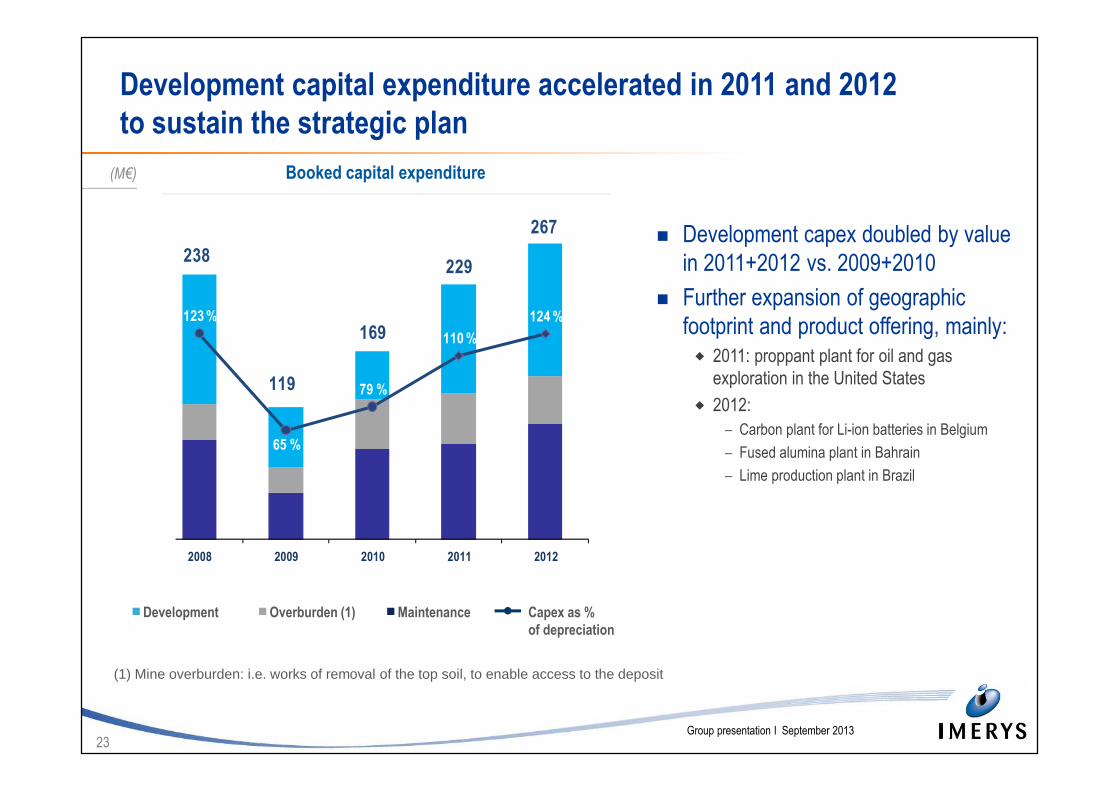
123 %
65 %
79 %
110 %
124 %
0%
50%
100%
150%
200%
0
50
100
150
200
250
300
2008 2009 2010 2011 2012
238
119
169
229
267� Development capex doubled by value
in 2011+2012 vs. 2009+2010
� Further expansion of geographic
footprint and product offering, mainly: � 2011: proppant plant for oil and gas
exploration in the United States
� 2012:
‒ Carbon plant for Li-ion batteries in Belgium
‒ Fused alumina plant in Bahrain
‒ Lime production plant in Brazil
Booked capital expenditure
Maintenance Capex as %
of depreciation
Overburden (1)Development
(1) Mine overburden: i.e. works of removal of the top soil, to enable access to the deposit
Development capital expenditure accelerated in 2011 and 2012
to sustain the strategic plan
(M€)
24Group presentation I September 2013
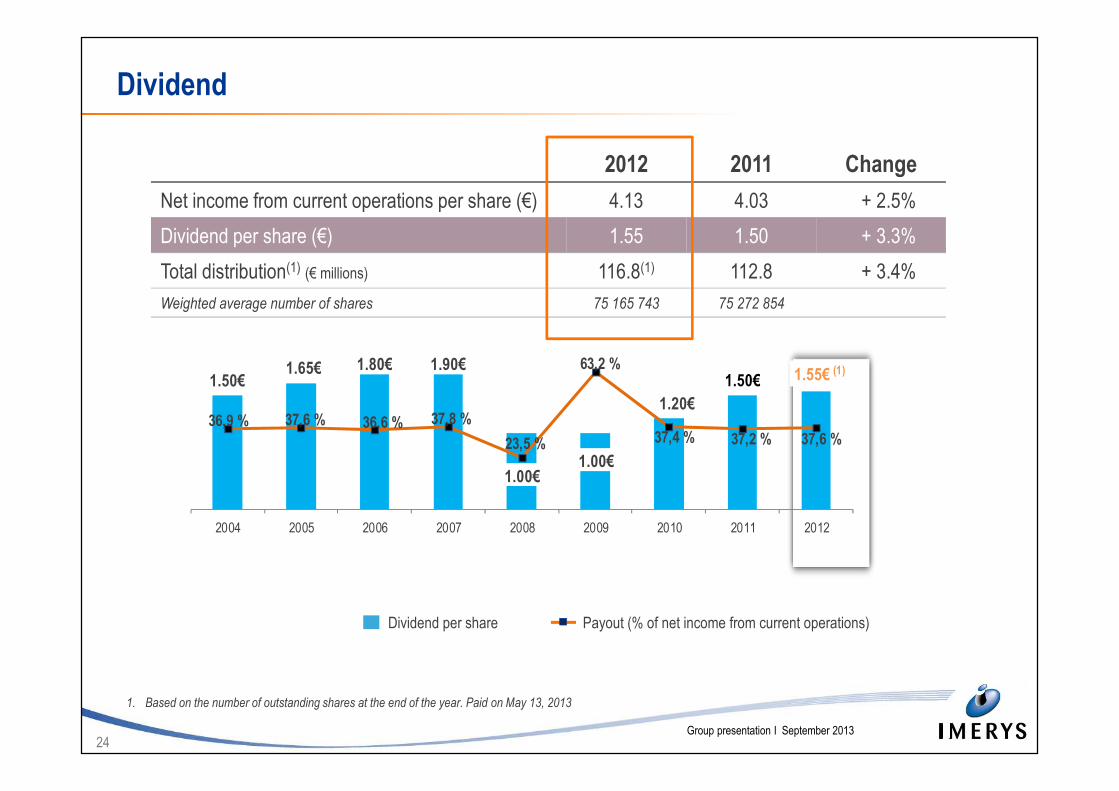
1.50€1.65€ 1.80€ 1.90€
1.00€1.00€
1.20€
1.50€ 1.55€ (1)
36,9 % 37,6 % 36,6 % 37,8 %
23,5 %
63,2 %
37,4 % 37,2 % 37,6 %
2004 2005 2006 2007 2008 2009 2010 2011 2012
1. Based on the number of outstanding shares at the end of the year. Paid on May 13, 2013
Dividend
2012 2011 Change
Net income from current operations per share (€) 4.13 4.03 + 2.5%
Dividend per share (€) 1.55 1.50 + 3.3%
Total distribution(1) (€ millions) 116.8(1) 112.8 + 3.4%
Weighted average number of shares 75 165 743 75 272 854
Payout (% of net income from current operations)Dividend per share
25Group presentation I September 2013
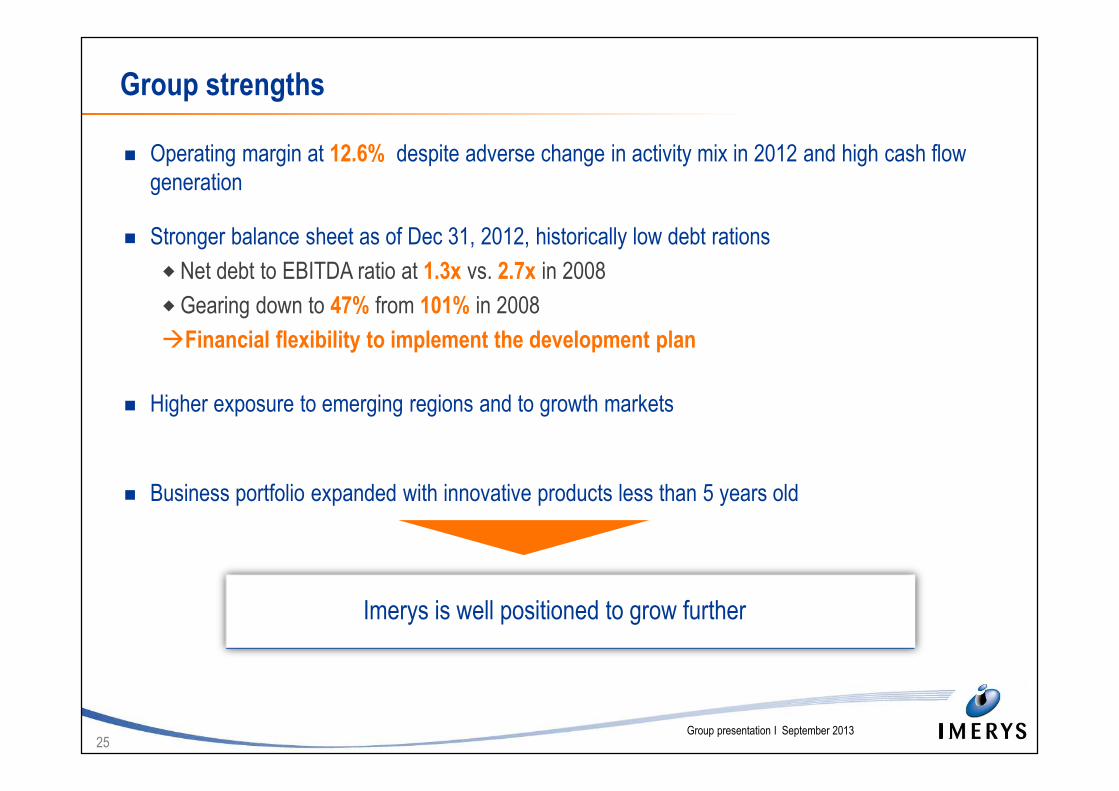
Group strengths
� Operating margin at 12.6% despite adverse change in activity mix in 2012 and high cash flow
generation
� Stronger balance sheet as of Dec 31, 2012, historically low debt rations
� Net debt to EBITDA ratio at 1.3x vs. 2.7x in 2008
�Gearing down to 47% from 101% in 2008
�Financial flexibility to implement the development plan
� Higher exposure to emerging regions and to growth markets
� Business portfolio expanded with innovative products less than 5 years old
Imerys is well positioned to grow further
26Group presentation I September 2013
Table of contentsTable of contentsTable of contentsTable of contentsGroup presentation
� Imerys: the world leader of mineral-based specialty products
� A profitable and solid business model
� Development strategy: accelerating growth by enlarging
our business footprint
� Conclusion
27Group presentation I September 2013
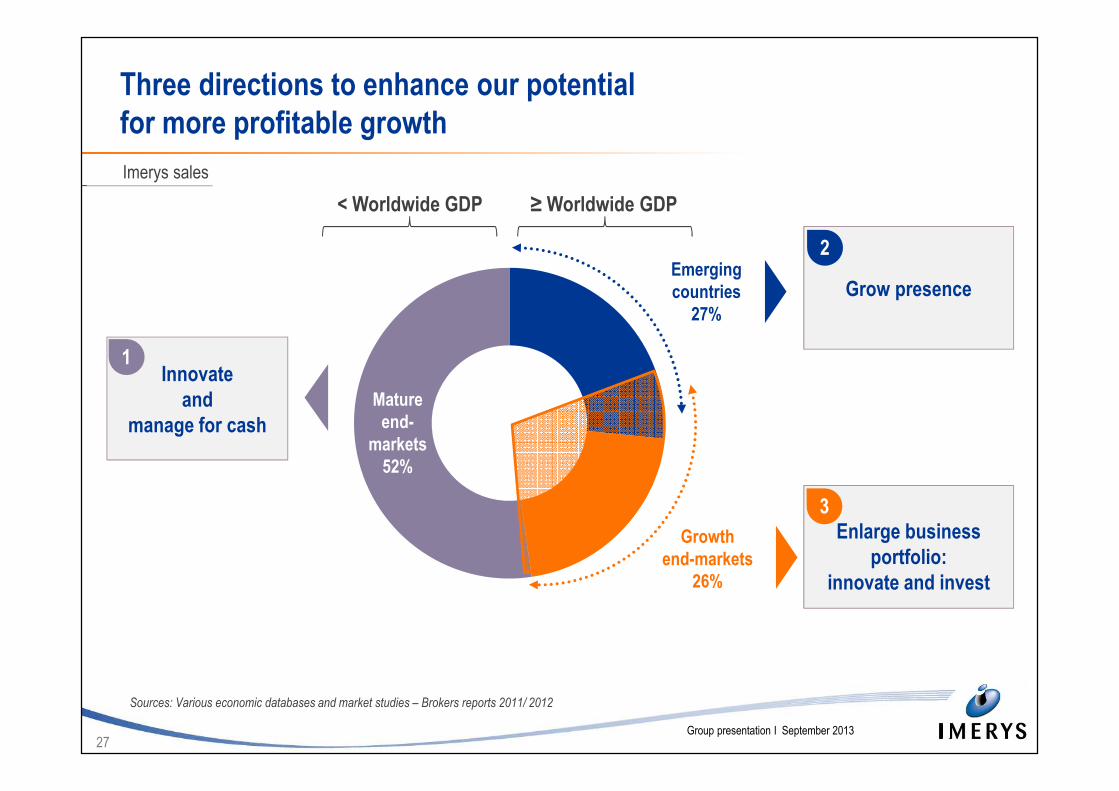
Three directions to enhance our potential
for more profitable growth
Sources: Various economic databases and market studies – Brokers reports 2011/ 2012
< Worldwide GDP ≥ Worldwide GDP
Mature
end-
markets
52%
Emerging
countries
27%
Growth
end-markets
26%
Innovate
and
manage for cash
Enlarge business
portfolio:
innovate and invest
Grow presence
Imerys sales
2
1
3
28Group presentation I September 2013
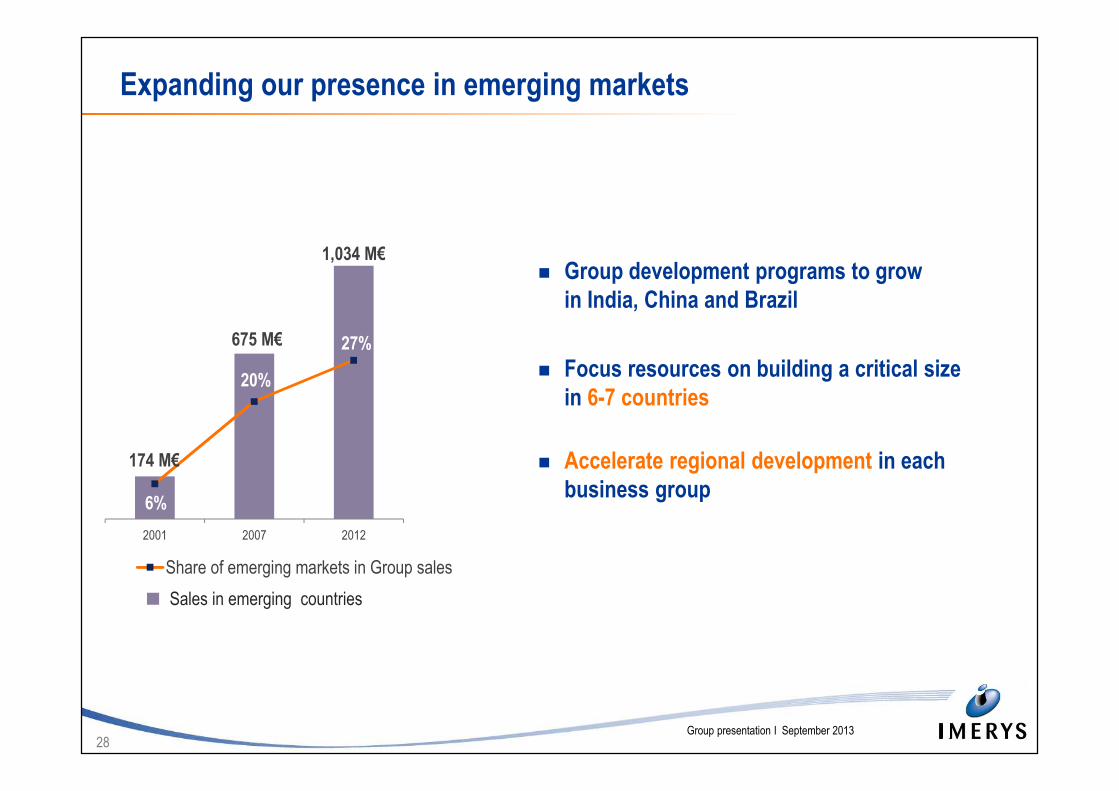
Sales in emerging countries
Expanding our presence in emerging markets
174 M€
675 M€
1,034 M€
6%
20%
27%
0
5
10
15
20
25
30
35
40
45
50
2001 2007 2012
Share of emerging markets in Group sales
� Group development programs to grow
in India, China and Brazil
� Focus resources on building a critical size
in 6-7 countries
� Accelerate regional development in each
business group
29Group presentation I September 2013
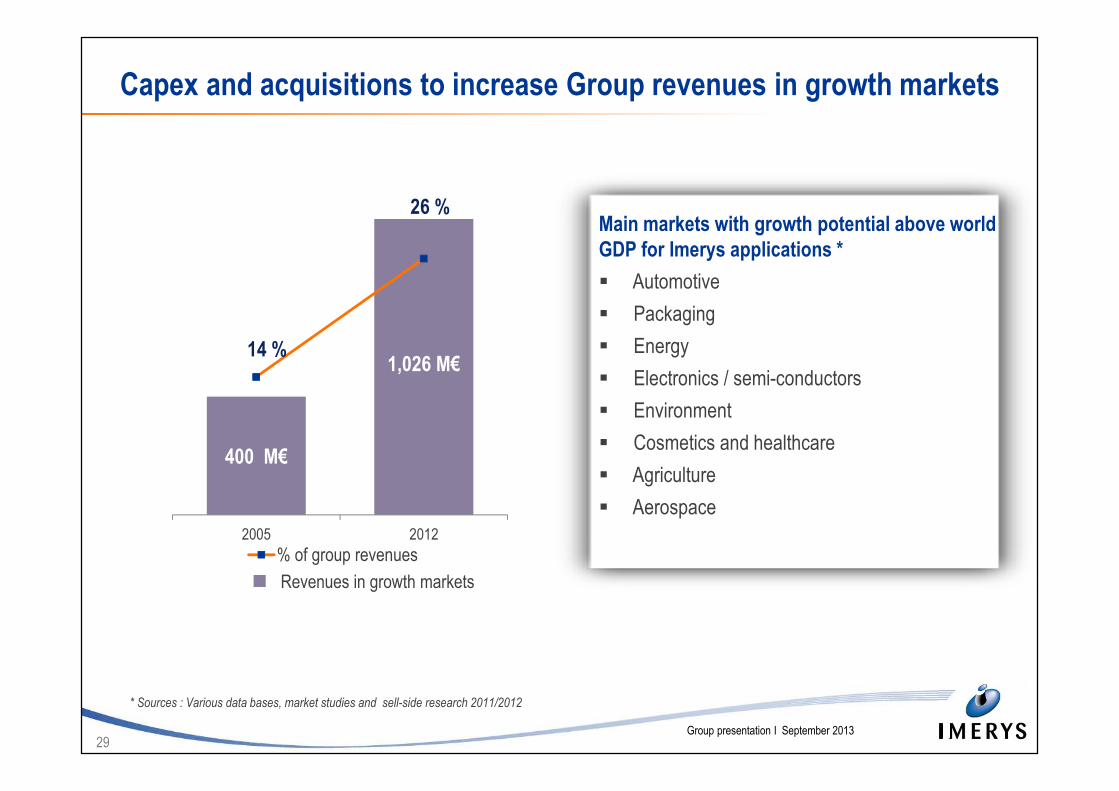
Main markets with growth potential above world
GDP for Imerys applications *
� Automotive
� Packaging
� Energy
� Electronics / semi-conductors
� Environment
� Cosmetics and healthcare
� Agriculture
� Aerospace
Capex and acquisitions to increase Group revenues in growth markets
Revenues in growth markets
* Sources : Various data bases, market studies and sell-side research 2011/2012
400 M€
1,026 M€14 %
26 %
0,0%
5,0%
10,0%
15,0%
20,0%
25,0%
30,0%
0
100
200
300
400
500
600
700
800
900
1000
2005 2012
% of group revenues
30Group presentation I September 2013
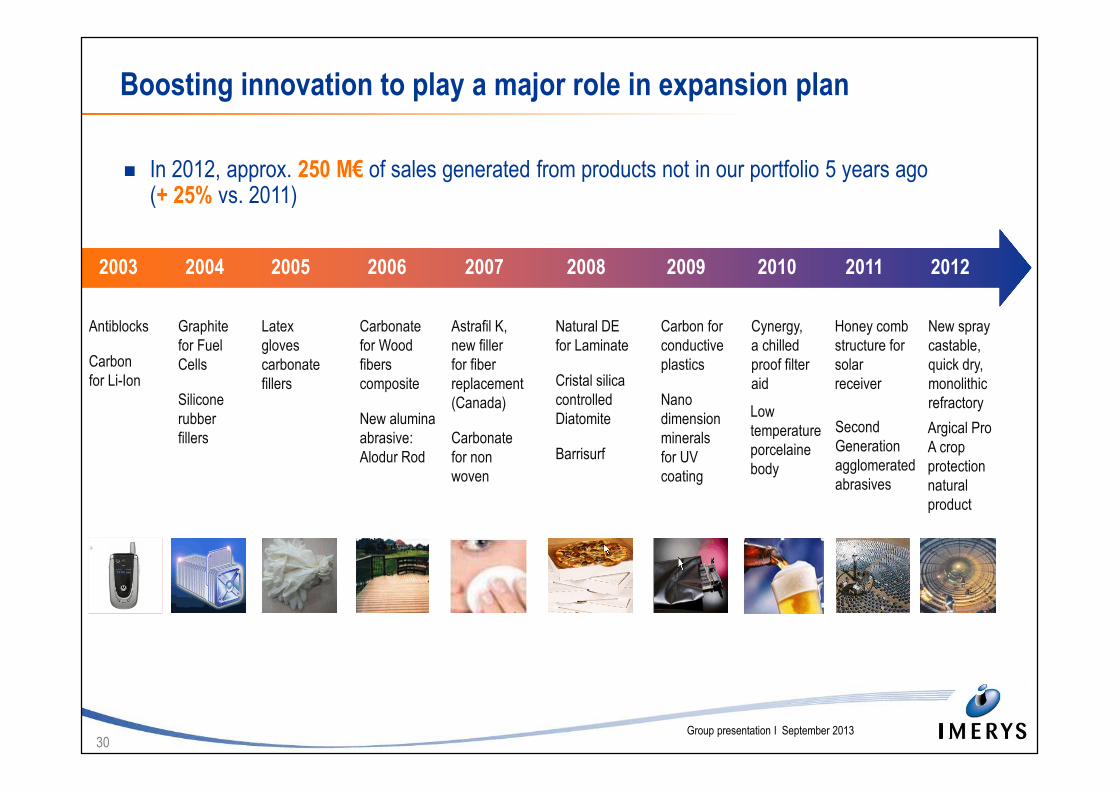
2003 2004
Antiblocks
Carbon
for Li-Ion
Graphite
for Fuel
Cells
Silicone
rubber
fillers
2005 2006
Latex
gloves
carbonate
fillers
Carbonate
for Wood
fibers
composite
New alumina
abrasive:
Alodur Rod
2007
Astrafil K,
new filler
for fiber
replacement
(Canada)
Carbonate
for non
woven
2008
Natural DE
for Laminate
Cristal silica
controlled
Diatomite
Barrisurf
2009 2010
Carbon for
conductive
plastics
Nano
dimension
minerals
for UV
coating
Cynergy,
a chilled
proof filter
aid
Boosting innovation to play a major role in expansion plan
� In 2012, approx. 250 M€ of sales generated from products not in our portfolio 5 years ago (+ 25% vs. 2011)
2011 2012
Honey comb
structure for
solar
receiver
New spray
castable,
quick dry,
monolithic
refractory
Second
Generation
agglomerated
abrasives
Argical Pro
A crop
protection
natural
product
Low
temperature
porcelaine
body
31Group presentation I September 2013
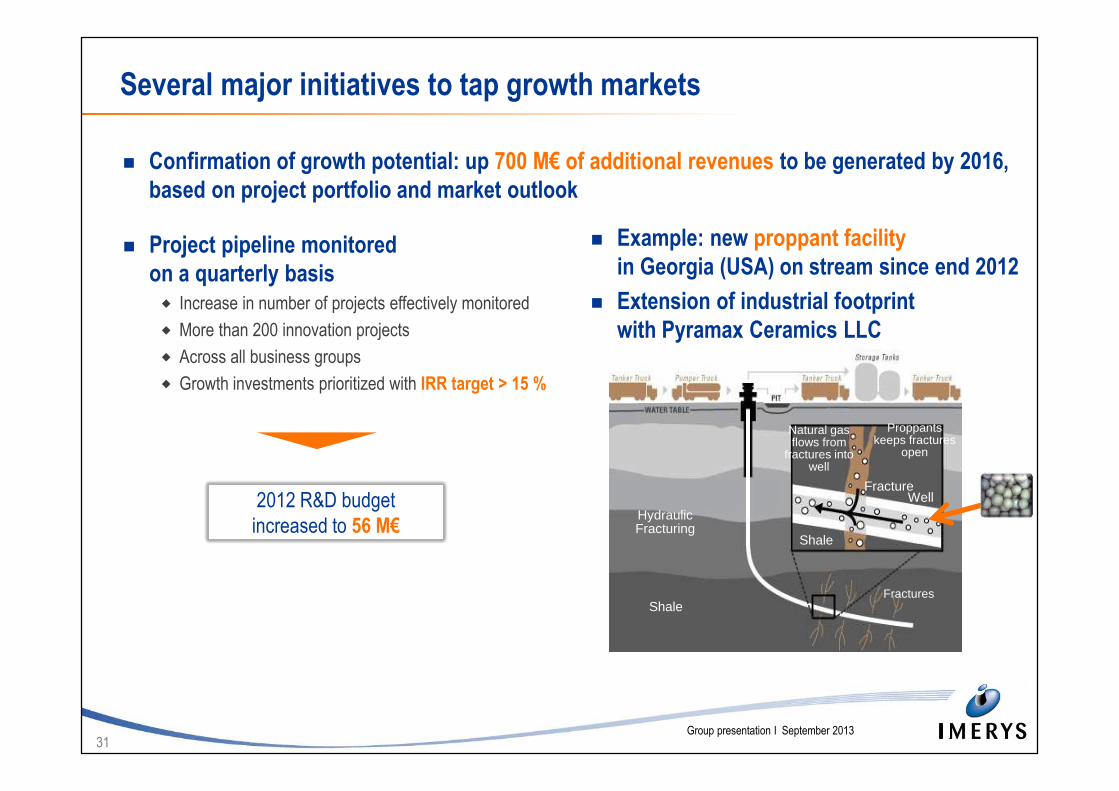
2012 R&D budget
increased to 56 M€
2012 R&D budget
increased to 56 M€
� Project pipeline monitored
on a quarterly basis� Increase in number of projects effectively monitored
� More than 200 innovation projects
� Across all business groups
� Growth investments prioritized with IRR target > 15 %
Several major initiatives to tap growth markets
� Example: new proppant facility
in Georgia (USA) on stream since end 2012
� Extension of industrial footprint
with Pyramax Ceramics LLC
� Confirmation of growth potential: up 700 M€ of additional revenues to be generated by 2016,
based on project portfolio and market outlook
HydraulicFracturing
Shale
Shale
Proppantskeeps fractures
open
Fractures
FractureWell
Natural gasflows from
fractures intowell
32Group presentation I September 2013
Acquisitions: an important driver to enlarge the Group’s business
portfolio
� Successful track-record
� Treibacher: entry into Abrasives applications, new competence in fusion
� World Minerals: entry into non-cyclical filtration business, new application competencies
� Lafarge Refractories: build-up from existing monolithic refractories business Plibrico
� Talc: a new mineral to strengthen current applications and increase presence
in attractive markets (additional competence in polymers applications used in automotive industry,
new applications in health & beauty)
� Business portfolio expansion will continue mainly through acquisitions
� With stringent return criteria: target ROCE of 15%
Growth potential of target a key decision factor
33Group presentation I September 2013
Table of contentsTable of contentsTable of contentsTable of contentsGroup presentation
� Imerys: the world leader of mineral-based specialty products
� A profitable and solid business model
� Development strategy: accelerating growth by enlarging
our business footprint
� Conclusion
34Group presentation I September 2013
Ambition 2012 – 2016 to increase value
� Generate organic growth* above worldwide GDP
� Increase resilience through additional products and geographical diversification
� Seize selective external growth opportunities
Maximize value creation for shareholders
* Excluding exchange rates and perimeter effects
35
� Imerys 154 rue de l’UniversitéF-75007 Paris + 33 (0) 1 49 55 63 00 www.imerys.com
� Analysts / Investors contactPascale Arnaud+ 33 (0) 1 49 55 63 [email protected]