Embed Size (px)
Citation preview

Imaging System for Mesopic Vision
H.Yaguchi, Y.Ushio, K.Kikuchi, D.K.Thahn, J.ShiH.Yaguchi, Y.Ushio, K.Kikuchi, D.K.Thahn, J.Shin, and S.Shioiri*n, and S.Shioiri*
Chiba University and Tohoku University*Chiba University and Tohoku University*
CHIBA UNIV.
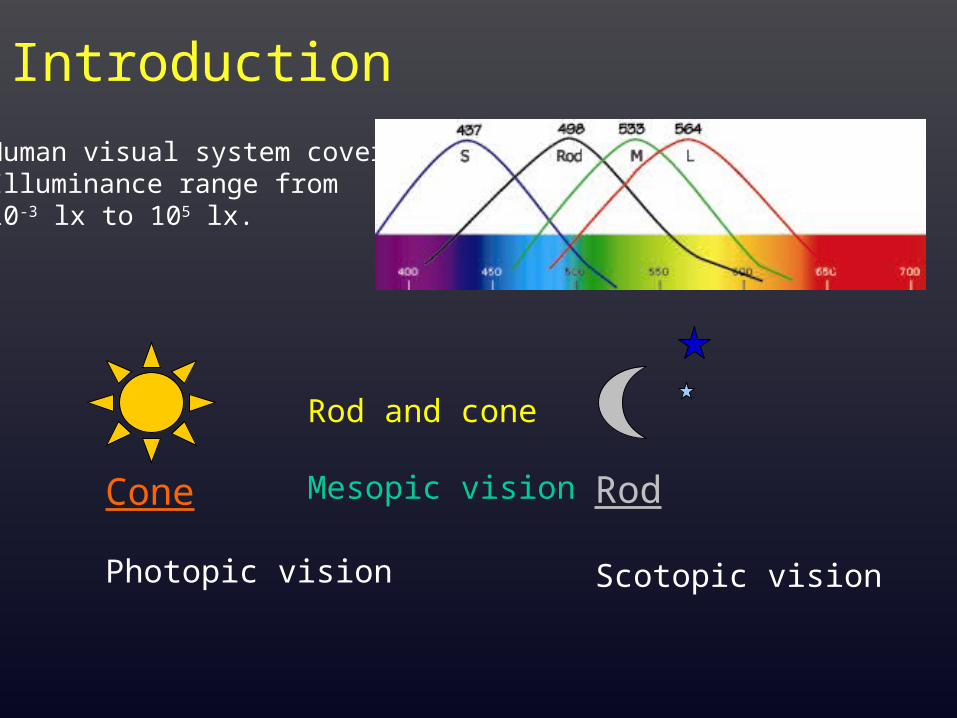
IntroductionHuman visual system coversIlluminance range from10-3 lx to 105 lx.
Cone
Photopic vision
Rod
Scotopic vision
Rod and cone
Mesopic vision

How does color appearance change with illuminance ?
To predict color appearance in mesopic vision from the photopic image.

Outline
• Experiment of the haploscopic color matching.
• A mesopic color appearance model.• A imaging system for mesopic color appearance.
• Examples of mesopic color images.
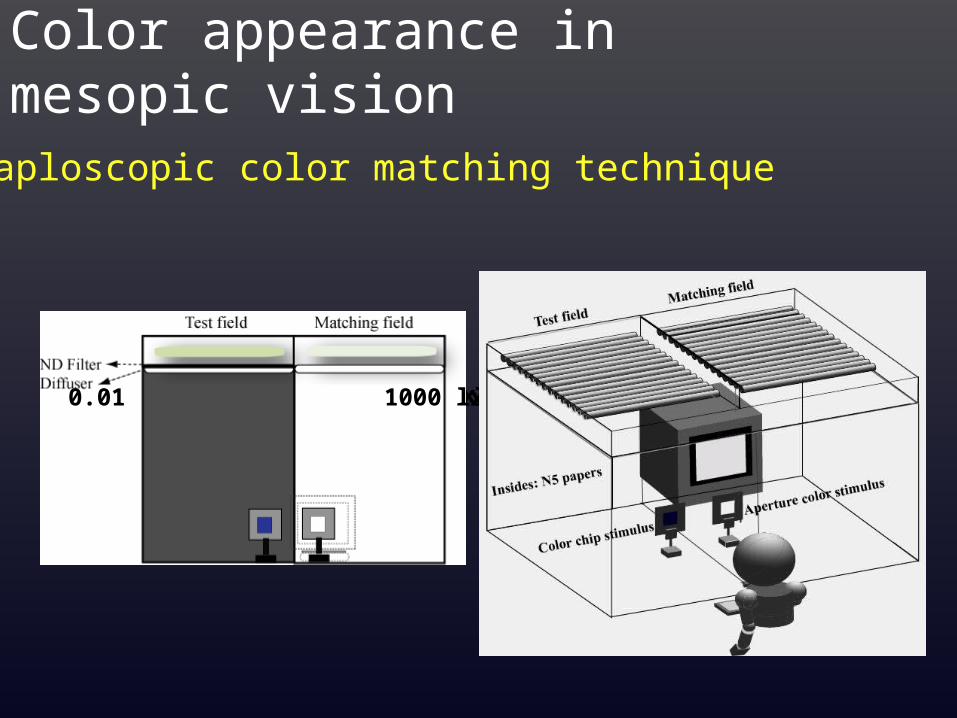
Color appearance in mesopic vision
•Haploscopic color matching technique
1000 1000 lx100 1000 lx10 1000 lx1 1000 lx0.1 1000 lx0.01 1000 lx

Color appearance in mesopic vision•Stimuli
Test field
48 Munsel color chips…chromatic: 45 , achromatic: 3
Matching field
21” CRT display (SONY Multiscan G500) Controlled by VSG (15 bits color, Cambridge System)
Stimulus size… 1010º

Results: Hue and Chroma
• Chroma reduces continuously with decrease of the illuminance level until 0.01 lx.
• The loci of matching color on the a*-b* diagram are not straight for many test color chips, indicating that hue shifts with the change in illuminance level.

Results: Chroma
• Reddish and yellowish color (Y, YR, R, RP, P) : Chroma rapidly decreases from 100 to 1 lx, and constant below 0.1 lx.
• Greenish and bluish color (PB, B,BG, G, GY): Chroma rapidly decreases from 1000 to 1 lx, does not change below 1 lx.

Results: Lightness
• Reddish and yellowish color: Lightness gradually reduces from 10 to 0.01 lx.
• Greenish and bluish color: Minimum lightness is observed around 10 to 1 lx.

Results: Achromatic Lightness
• The Stevens effect: Perceived lightness range is reduced with decreasing illuminance.

Correlation between perceived lightness at 0.01 lx and photopic and scotop
ic luminance
Photopic luminance Scotopic luminance
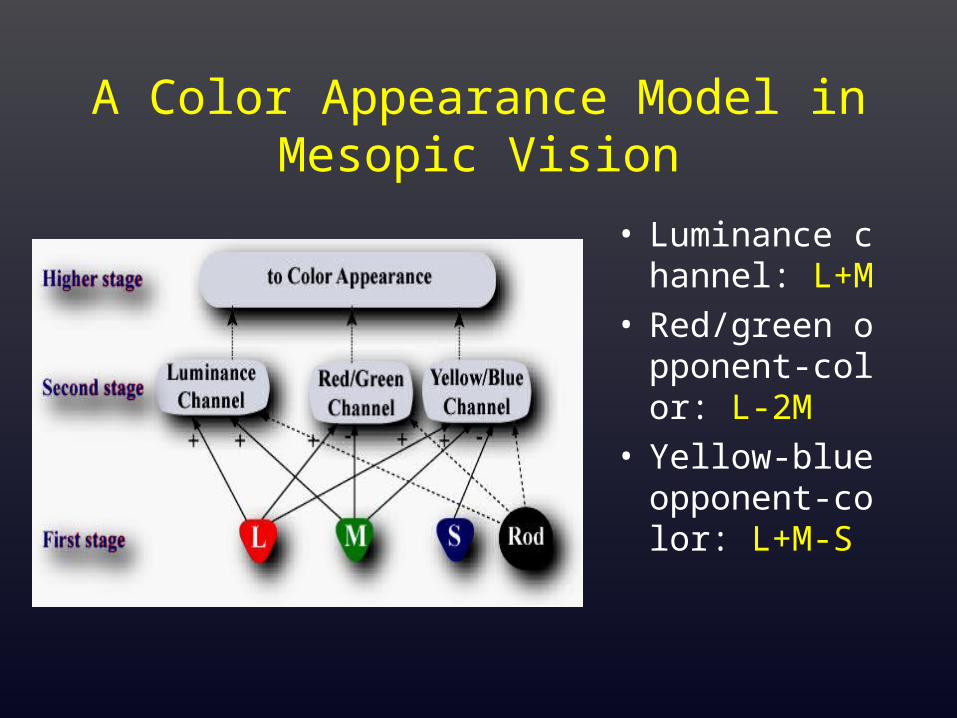
A Color Appearance Model in Mesopic Vision
• Luminance channel: L+M
• Red/green opponent-color: L-2M
• Yellow-blue opponent-color: L+M-S

AA((EE) ) = = ((EE))100 100 ((((LLp+M+Mpp) / () / (LLpp+M+Mpp))ww))++((EE) ) 78.478.4 ((Y ’ / Y ’Y ’ / Y ’ww))
Lp , Mp , Sp: cone outputs at photopic condition
Y’ : scotopic luminance factor
(Lp+Mp)w , Y’w : each output of luminance channels for white (being 100 = Kw)
(E), (E) :Weighting coefficients for functions of illuminance E
Luminance as a function of illuminance

AA((EE) ) = = ((EE))100 100 ((((LLp+M+Mpp) / () / (LLpp+M+Mpp))ww))++((EE)) 78.478.4 ((Y ’ / Y ’Y ’ / Y ’ww))
Change of cone- and rod-signal as a function of illuminance

Outputs of r/g and y/b channels at illuminance level of E
r/g(E) = r/g(E) = l(E)l(E)(L(Lpp-2M-2Mpp) + ) + (E)(E) Y ’ Y ’
y/b(E) = y/b(E) = m(E)m(E)(L(Lpp+M+Mpp-S-Spp) + ) + (E)(E) Y ’ Y ’
Lp , Mp , Sp: cone outputs at photopic condition
Y’ : scotopic luminance factor
l (E), (E) and m (E), (E) :Weighting coefficients for functions of illuminance E
Red/green- and yellow/blue opponent channel as a function of illuminance

Comparison between Experimental Results and Prediction: Hue and Chroma
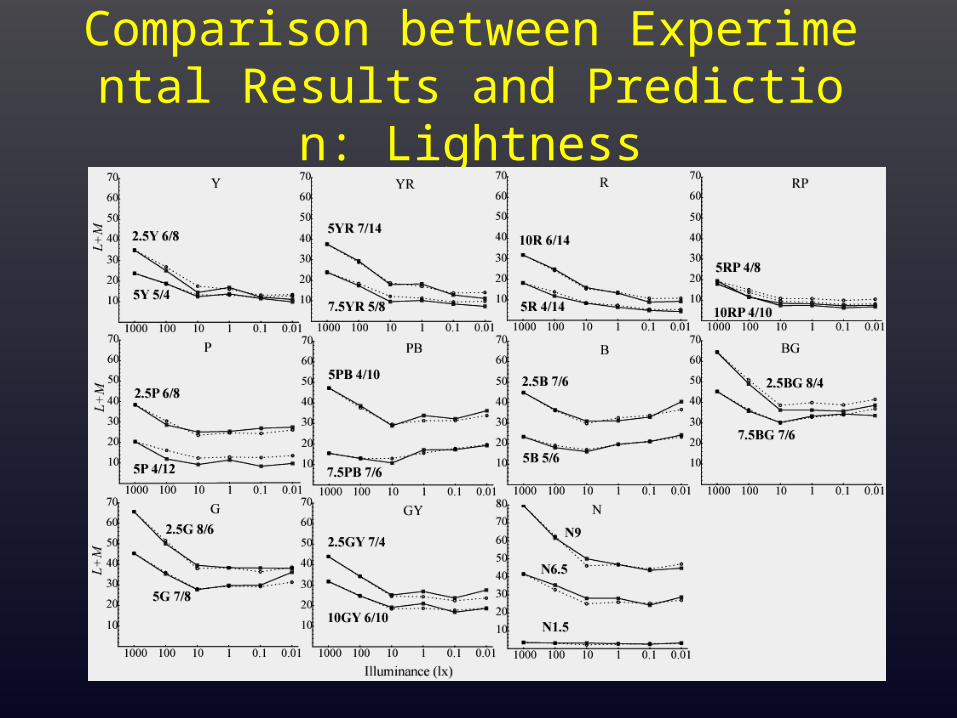
Comparison between Experimental Results and Prediction: Lightness

A Color Appearance Model in Mesopic Vision
• Chromatic components decrease with decreasing illuminance.
• Hue shifts are predicted by introducing a different process for red/green and yellow/blue opponent-color channel.

Performance of a model
• Average E*ab in mesopic range is around 3.

Imaging System for Mesopic Vision

Imaging System for Mesopic Vision

Camera model
RGB
Xp
Yp’Zp
Yp
X
Y’ZY
Predicted Value Measured Value
Minimize error
To obtain XYZ and Y’ from Digital Camera RGB

Color Sample ・・・ Macbeth Color Checker and GretagMacbeth ColorCheker
Digital Camera・・・ Canon,EOS1-Ds・ Image size 4064×2704 pixels・ Quantization RGB 12 bits
Calibration of Camera

R3
G3
B3
R2GR2B・・・BRRGB1
Xp
Yp
Zp
Yp’
a1 b1 c1 ・・・・・・・・ r1 s1 t1
a2 b2 c2 ・・・・・・・・ r2 s2 t2
a3 b3 c3 ・・・・・・・・ r3 s3 t3
a4 b4 c4 ・・・・・・・・ r4 s4 t4
=
Coefficients a, b,,,t are obtained bythe pseudo-inverse method.
Camera Model

Average color difference ⊿ E*ab = 2.23Maximum color difference E⊿ ab = 9.03
Original
Macbeth Color Checker
Predicted by a Camera
Macbeth Color Checker
Camera performance as a colorimeter

Coefficient of Correlation
Slope
0.998
1.000
:
:
Measured value
Predicted value
Prediction of scotopic luminance Y’ by camera RGB
0 20 40 60 80 1000
20
40
60
80
100
Y'p
Y'

Original 100(lx)
0.01(lx)0.1(lx)1(lx)
10(lx)
Examples of mesopic color image