Embed Size (px)
Citation preview

Advanced boreholeimaging independentof mud type
UBI
Applications■ Borehole imaging
and interpretation
■ Structural dip analysis
■ Fracture identification and analysis
■ Borehole stability evaluation
■ Borehole radius and cementvolume calculations
■ Automatic hole-shape analysis
Benefits■ Provides precise, nonsubjective
borehole inspection answersfor critical decisions
■ Reduces rig time; logging speedcan be optimized for resolutionrequired
Features■ 100% azimuthal coverage
■ Rotating transducer
■ Operable in heavy water- and oil-base muds
■ New-generation hardware
■ Clear and easy-to-understandreal-time wellsite presentations
■ Downhole fluid propertiesmeasurement
■ Dynamic image normalizationand color scaling
■ Variable azimuthal and verticalsampling
■ Improved transit time detectiontechnique
■ Improved image resolution
UBI Ultrasonic Borehole ImagerA new-generation acoustic boreholeteleviewer based on ultrasonic imag-ing technology, the UBI* UltrasonicBorehole Imager enables the analysisof fractures, stress and borehole sta-bility studies, and enables structuralinterpretations that are uninfluencedby mud type. Through advanced borehole imaging and stress analysis applications, borehole stability andbreakout information can be derivedfrom the accurate borehole cross sec-tion as measured by the UBI tool. Foropenhole measurements—and for cas-ing internal geometry measurementsin which casing resonance is notneeded—the UBI tool’s transducerresults in high-resolution images.
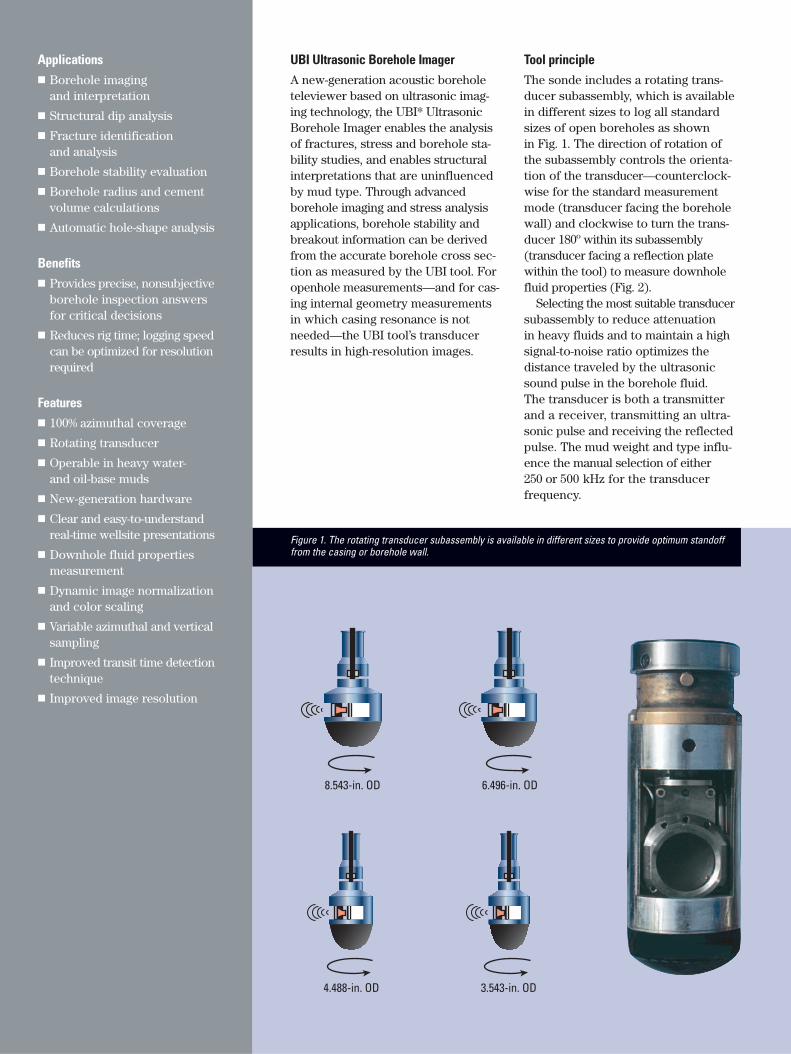
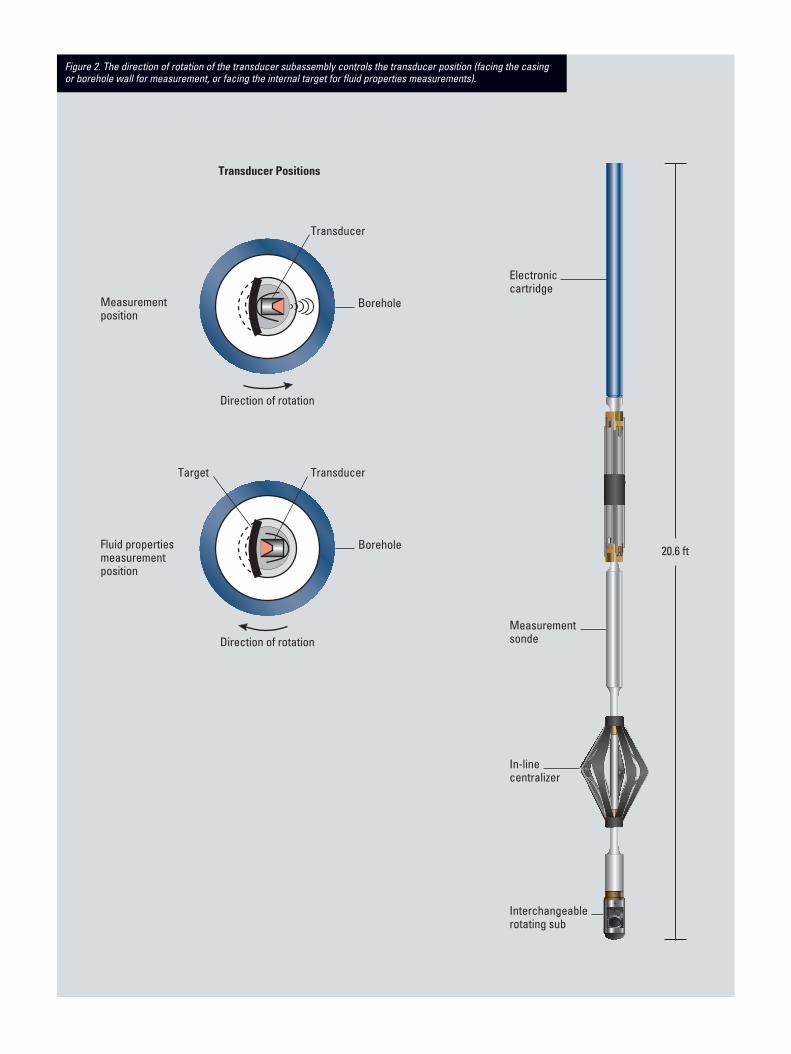
Tool principleThe sonde includes a rotating trans-ducer subassembly, which is availablein different sizes to log all standardsizes of open boreholes as shown in Fig. 1. The direction of rotation ofthe subassembly controls the orienta-tion of the transducer—counterclock-wise for the standard measurementmode (transducer facing the boreholewall) and clockwise to turn the trans-ducer 180º within its subassembly(transducer facing a reflection platewithin the tool) to measure downholefluid properties (Fig. 2).
Selecting the most suitable transducersubassembly to reduce attenuation in heavy fluids and to maintain a highsignal-to-noise ratio optimizes the distance traveled by the ultrasonicsound pulse in the borehole fluid. The transducer is both a transmitterand a receiver, transmitting an ultra-sonic pulse and receiving the reflectedpulse. The mud weight and type influ-ence the manual selection of either 250 or 500 kHz for the transducer frequency.
8.543-in. OD 6.496-in. OD
4.488-in. OD 3.543-in. OD
Figure 1. The rotating transducer subassembly is available in different sizes to provide optimum standofffrom the casing or borehole wall.
Borehole
Transducer
Direction of rotation
Borehole
Transducer
Direction of rotation
Target
Fluid propertiesmeasurementposition
Measurementposition
Transducer Positions
20.6 ft
Measurement sonde
Electronic cartridge
In-line centralizer
Interchangeablerotating sub
Figure 2. The direction of rotation of the transducer subassembly controls the transducer position (facing the casing or borehole wall for measurement, or facing the internal target for fluid properties measurements).
Tool measurementThe UBI tool accurately measuresboth amplitude and transit time.The processing technique providesimproved accuracy, avoids cycle skipsand reduces echo losses. The tooloperates on two frequencies (250 or500 kHz); the higher frequency yieldshigher image resolution, while thelower frequency provides a robustmeasurement in highly dispersive muds.The image resolution mode is selectedin correspondence to the logging envi-ronment—such as mud type and den-sity—and the resolution requirements.The standard resolution at an operatingfrequency of 250 kHz is already con-sidered very high; the higher resolution,obtained at a slower logging speed,offers the next level of quality.
The tool is relatively insensitiveto eccentralization up to 1⁄4 in. Even in highly deviated wells, the UBI central-ization system is reliable, enabling the tool to provide clear images.
Image presentationsA typical UBI presentation consists of an amplitude image on the left anda borehole radius image on the right,on a 1:40 depth scale. Dynamic normal-ization, usually over a 1-m interval, is applied to both images to highlightthe features of the borehole. Dark colorsrepresent low amplitude and large radii,indicating borehole rugosity, enlarge-ments and attenuative material. Twoscales—on the far left for amplitudeand on the far right for radii—depictthe relationship between the dynamiccolor scale and absolute value. Threeadditional curves indicate the minimum,average and maximum values of themeasurement around the borehole.These curves are used to rapidlyidentify intervals with boreholeenlargements.
Images can be oriented with respectto north or with respect to the highside of the borehole in the case of a deviated well. If oriented with respectto the high side of the hole, any casingdamage caused by pipe friction appearsat the center of the image and is there-fore easily identified.
Cross-sectional displays
Cross-sectional displays at specificdepths are essential for interpretingborehole deformation. The interpreta-tion program fits a circle through thecross-sectional diagram to highlightplaces where deformation occurs.
A diagnostic listing is produced tohelp identify hole deformation causedby keyhole, breakout or shear sliding.Pseudo-three-dimensional plots can begenerated to give a perspective view ofthe borehole from the top looking down.
Spiral plots
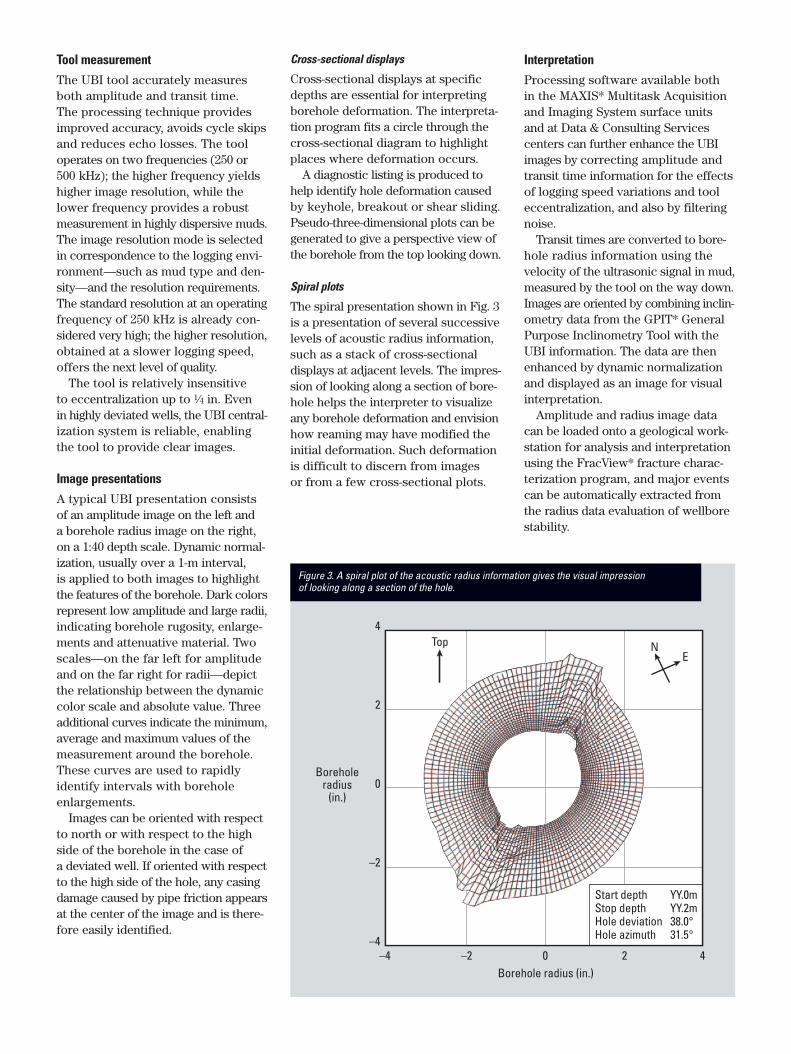
The spiral presentation shown in Fig. 3is a presentation of several successivelevels of acoustic radius information,such as a stack of cross-sectional displays at adjacent levels. The impres-sion of looking along a section of bore-hole helps the interpreter to visualizeany borehole deformation and envisionhow reaming may have modified theinitial deformation. Such deformationis difficult to discern from imagesor from a few cross-sectional plots.
InterpretationProcessing software available both in the MAXIS* Multitask Acquisitionand Imaging System surface unitsand at Data & Consulting Servicescenters can further enhance the UBIimages by correcting amplitude andtransit time information for the effectsof logging speed variations and tooleccentralization, and also by filteringnoise.
Transit times are converted to bore-hole radius information using thevelocity of the ultrasonic signal in mud,measured by the tool on the way down.Images are oriented by combining inclin-ometry data from the GPIT* GeneralPurpose Inclinometry Tool with theUBI information. The data are thenenhanced by dynamic normalizationand displayed as an image for visualinterpretation.
Amplitude and radius image datacan be loaded onto a geological work-station for analysis and interpretationusing the FracView* fracture charac-terization program, and major eventscan be automatically extracted fromthe radius data evaluation of wellborestability.
4
2
0
–2
–4
Boreholeradius
(in.)
Borehole radius (in.)–4 –2 0 2 4
Top NE
Start depth YY.0mStop depth YY.2mHole deviation 38.0°Hole azimuth 31.5°
Figure 3. A spiral plot of the acoustic radius information gives the visual impression of looking along a section of the hole.
Comparison with electrical images
Schlumberger services such as theFMI* Fullbore Formation MicroImager,OBMI* Oil-Base MicroImager and ARI*Azimuthal Resistivity Imager performimaging through an array of high-reso-lution measurements of the formationresistivity. Typical formations showeasily measurable variation in resistivityat even the slightest change in lithology.Therefore, these tools are ideal fordiscerning bedding and structural dip.As the measurements of these toolsare made at a finite radial depth in the formation, the effects of boreholesurface rugosity are minimized. Thesetools can also discern fractures fromthe surrounding matrix by the resistivitydifferences caused by fluid or mineralsthat fill the aperture.
The UBI tool measures attributes ofan ultrasonic wave reflected at the bore-hole wall. The impedance ratio betweenthe formation and the mud has a slighteffect on the amplitude of the reflectedsignal; however, rugosity of the bore-hole wall has a much greater effectand dominates the reflection amplitude.UBI images are therefore stronglysensitive to surface variations in theborehole wall but not to variations in lithology. Formation changes arenormally seen on UBI images only if corresponding borehole surfaceeffects, such as changes in rugosityor hole diameter are present.
The resolution of any ultrasonicimaging tool is inadequate to detect“pure” fractures unless they are verywide. However, since the drillingprocess tends to chip and break theformation at the edge of a fracture,the UBI tool can often discern fracturesby associated surface rugosity.
Drilling-induced fractures normallyopen only after the drill bit has passed,so their edges are better preservedthan the edges of natural fracturesthat existed when the interval wasdrilled, and the fracture is less likelyto be visible on acoustic images.
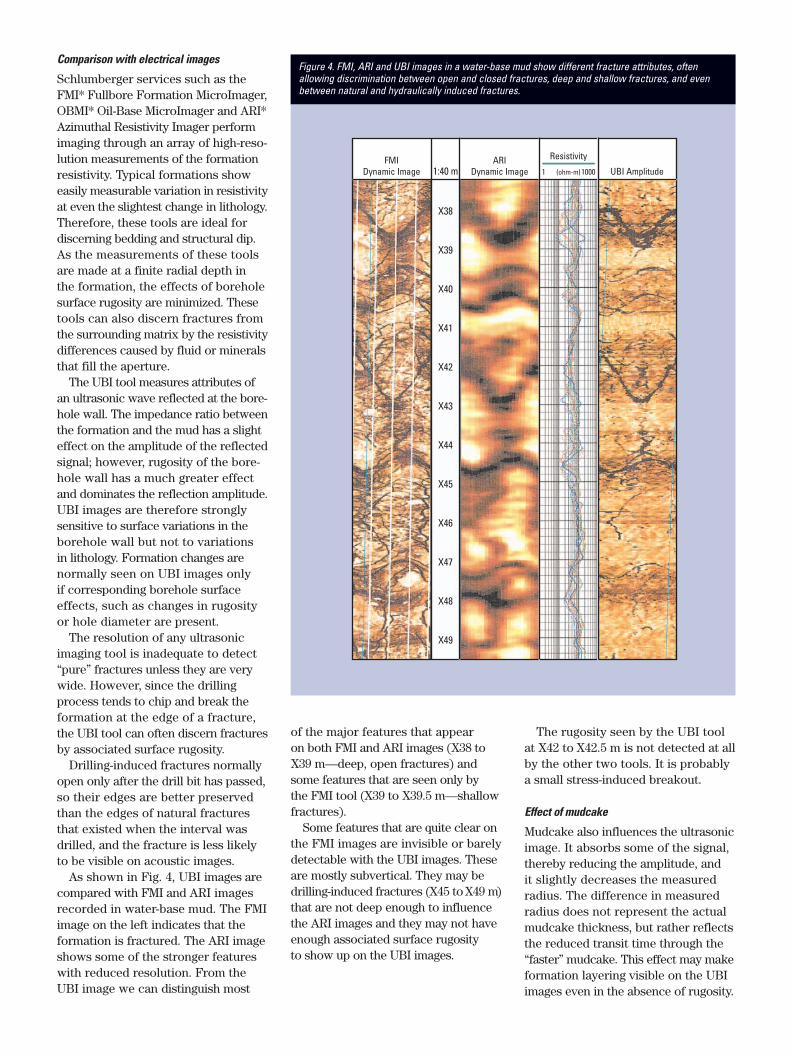
As shown in Fig. 4, UBI images arecompared with FMI and ARI imagesrecorded in water-base mud. The FMIimage on the left indicates that theformation is fractured. The ARI imageshows some of the stronger featureswith reduced resolution. From theUBI image we can distinguish most
of the major features that appearon both FMI and ARI images (X38 to X39 m—deep, open fractures) andsome features that are seen only by the FMI tool (X39 to X39.5 m—shallowfractures).
Some features that are quite clear onthe FMI images are invisible or barelydetectable with the UBI images. Theseare mostly subvertical. They may bedrilling-induced fractures (X45 toX49 m)that are not deep enough to influencethe ARI images and they may not haveenough associated surface rugosity to show up on the UBI images.
The rugosity seen by the UBI toolat X42 to X42.5 m is not detected at allby the other two tools. It is probablya small stress-induced breakout.
Effect of mudcake
Mudcake also influences the ultrasonicimage. It absorbs some of the signal,thereby reducing the amplitude, andit slightly decreases the measuredradius. The difference in measuredradius does not represent the actualmudcake thickness, but rather reflectsthe reduced transit time through the“faster” mudcake. This effect may makeformation layering visible on the UBIimages even in the absence of rugosity.
FMIDynamic Image 1:40 m
ARI Dynamic Image
Resistivity
(ohm-m)10001 UBI Amplitude
X38
X39
X40
X41
X42
X43
X44
X45
X46
X47
X48
X49
Figure 4. FMI, ARI and UBI images in a water-base mud show different fracture attributes, often allowing discrimination between open and closed fractures, deep and shallow fractures, and evenbetween natural and hydraulically induced fractures.
ApplicationsThe UBI tool was originally developedfrom the USI* UltraSonic Imager toprovide imaging capabilities in noncon-ductive oil-base muds and to providean acoustic imaging alternative to FMImicroresistivity images. Experiencewith high-quality UBI images hasrevealed some exciting new applicationssuch as borehole stability determinationand stress analysis.
Fracture detection
Because openhole borehole televiewerdata are often acquired for use in frac-ture evaluation, the resolution of theUBI tool makes it suitable for thisapplication.
At times, shear sliding along a frac-ture plane can be detected with thehelp of UBI radius measurements and cross-sectional plots, which providestrong evidence of both unbalancedtectonic stress and open fractures.
Improving fracture analysis in oil-base muds
For structural dip and for stratigraphicanalysis in oil-base mud systems, theOBMI tool is preferred. However, whilethe OBMI image is very useful fordetecting fractures, enhanced fracturecharacterization can be achieved byadding a UBI image to the program.As a result of the electrically resistivenature of oil-base mud, an open frac-ture and a cemented fracture typicallyappear the same in an OBMI image.The UBI tool responds only to anopen fracture and therefore confirmswhether a fracture visible in the OBMIimage is open or closed.
The OBMI tool is also less sensitivethan the UBI tool to fractures that aresteeply dipping with respect to the bore-hole. Additionally, the 100% circumfer-ential coverage provided by the UBI toolhelps to ensure that no open fracturesare missed during analysis.
Borehole stability and stress analysis
Borehole stability problems can leadto stuck pipe, lost time and perhapsloss of part of the well, greatlyincreasing drilling costs. The UBIradius and cross-sectional analysesgive an accurate report of the shapeof the borehole, allowing a clear,detailed analysis of the problem.
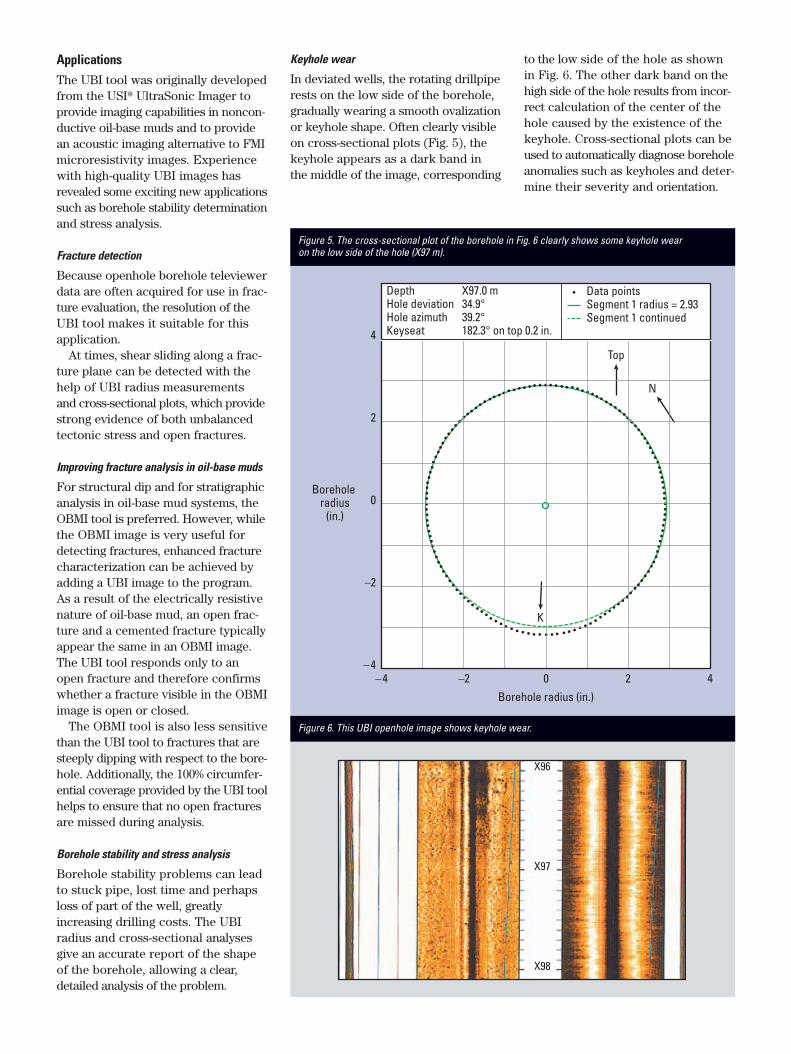
Keyhole wear
In deviated wells, the rotating drillpiperests on the low side of the borehole,gradually wearing a smooth ovalizationor keyhole shape. Often clearly visibleon cross-sectional plots (Fig. 5), thekeyhole appears as a dark band inthe middle of the image, corresponding
to the low side of the hole as shownin Fig. 6. The other dark band on thehigh side of the hole results from incor-rect calculation of the center of thehole caused by the existence of thekeyhole. Cross-sectional plots can beused to automatically diagnose boreholeanomalies such as keyholes and deter-mine their severity and orientation.
K
N
Top
Borehole radius
(in.)
Borehole radius (in.)
4
2
0
–2
–4
Depth X97.0 mHole deviation 34.9° Hole azimuth 39.2°Keyseat 182.3° on top 0.2 in.
Data pointsSegment 1 radius = 2.93 Segment 1 continued
0–2–4 2 4
X96
X97
X98
Figure 6. This UBI openhole image shows keyhole wear.
Figure 5. The cross-sectional plot of the borehole in Fig. 6 clearly shows some keyhole wear on the low side of the hole (X97 m).
Keyhole wear inside a borehole canbecome a drilling hazard when the sizeof the enlargement is sufficient to accom-modate the drillpipe or drill collars butnot the stabilizers or the bit, and it cancause the drillstring to become stuckwhile tripping out of hole.
BreakoutsHorizontal stresses in the formationare rarely uniform. They are nearlyalways compressive and are usuallygreater in one horizontal directionthan another because of tectonic forcesand faulting.
Drilling a well in a formation withnonuniform horizontal forces removesa cylinder of material that was previ-ously helping to support these compres-sive forces. Without this support, theformation near the borehole is subjectto additional stresses.
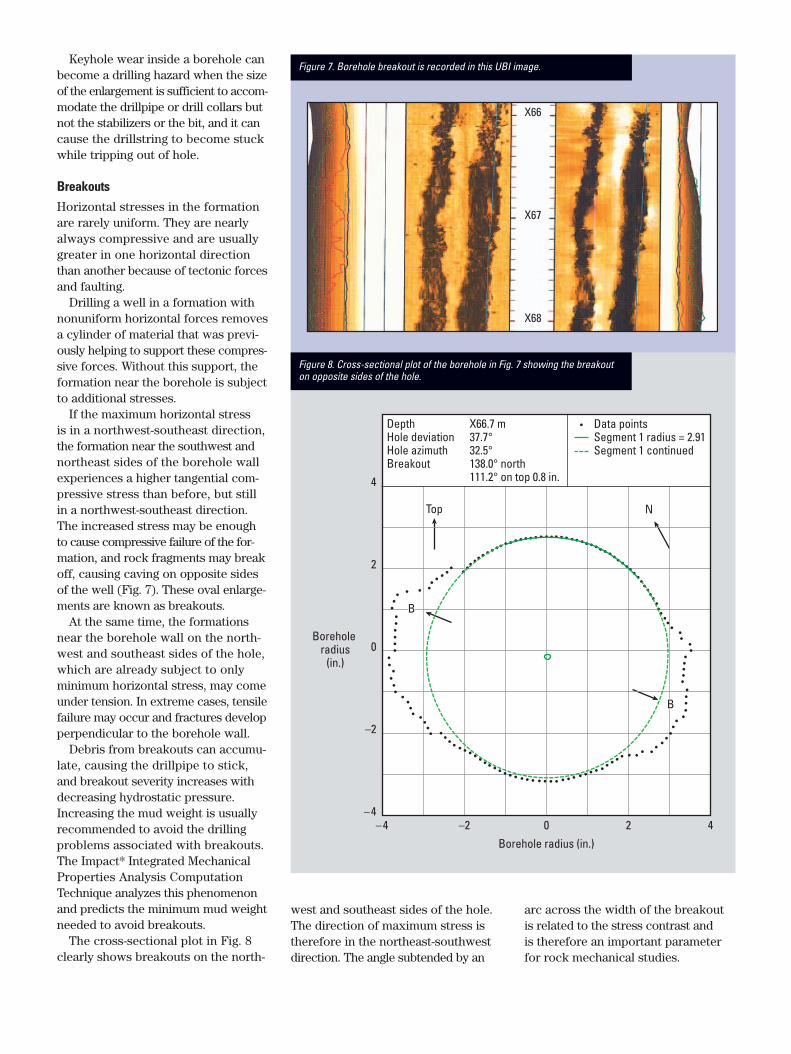
If the maximum horizontal stress is in a northwest-southeast direction,the formation near the southwest andnortheast sides of the borehole wallexperiences a higher tangential com-pressive stress than before, but stillin a northwest-southeast direction.The increased stress may be enoughto cause compressive failure of the for-mation, and rock fragments may breakoff, causing caving on opposite sidesof the well (Fig. 7). These oval enlarge-ments are known as breakouts.
At the same time, the formationsnear the borehole wall on the north-west and southeast sides of the hole,which are already subject to only minimum horizontal stress, may comeunder tension. In extreme cases, tensilefailure may occur and fractures developperpendicular to the borehole wall.
Debris from breakouts can accumu-late, causing the drillpipe to stick, and breakout severity increases withdecreasing hydrostatic pressure.Increasing the mud weight is usuallyrecommended to avoid the drillingproblems associated with breakouts.The Impact* Integrated MechanicalProperties Analysis ComputationTechnique analyzes this phenomenonand predicts the minimum mud weightneeded to avoid breakouts.
The cross-sectional plot in Fig. 8clearly shows breakouts on the north-
west and southeast sides of the hole.The direction of maximum stress istherefore in the northeast-southwestdirection. The angle subtended by an
arc across the width of the breakoutis related to the stress contrast andis therefore an important parameterfor rock mechanical studies.
X66
X67
X68
NTop
Borehole radius
(in.)
Borehole radius (in.)
4
2
0
–2
–40–2–4 2 4
Depth X66.7 mHole deviation 37.7° Hole azimuth 32.5° Breakout 138.0° north 111.2° on top 0.8 in.
Data pointsSegment 1 radius = 2.91 Segment 1 continued
B
B
Figure 7. Borehole breakout is recorded in this UBI image.
Figure 8. Cross-sectional plot of the borehole in Fig. 7 showing the breakouton opposite sides of the hole.
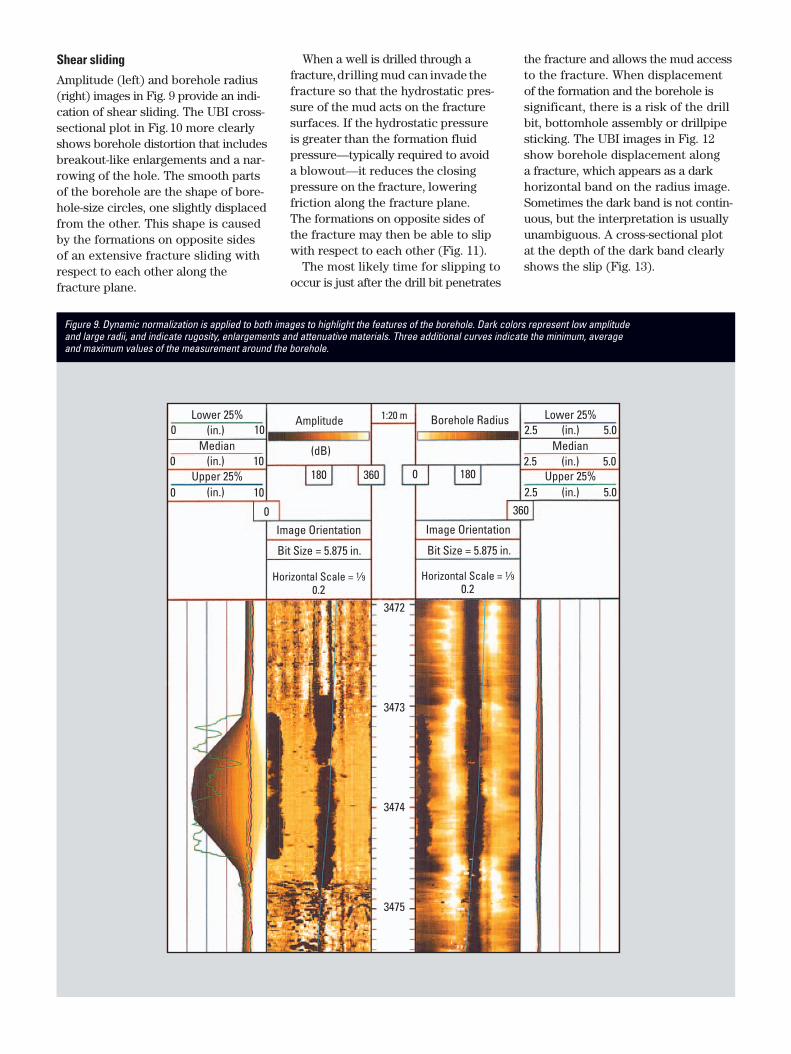
Shear slidingAmplitude (left) and borehole radius(right) images in Fig. 9 provide an indi-cation of shear sliding. The UBI cross-sectional plot in Fig.10 more clearlyshows borehole distortion that includesbreakout-like enlargements and a nar-rowing of the hole. The smooth partsof the borehole are the shape of bore-hole-size circles, one slightly displacedfrom the other. This shape is causedby the formations on opposite sidesof an extensive fracture sliding withrespect to each other along the fracture plane.
When a well is drilled through a fracture,drilling mud can invade thefracture so that the hydrostatic pres-sure of the mud acts on the fracturesurfaces. If the hydrostatic pressureis greater than the formation fluidpressure—typically required to avoida blowout—it reduces the closingpressure on the fracture, lowering friction along the fracture plane.The formations on opposite sides ofthe fracture may then be able to slipwith respect to each other (Fig. 11).
The most likely time for slipping tooccur is just after the drill bit penetrates
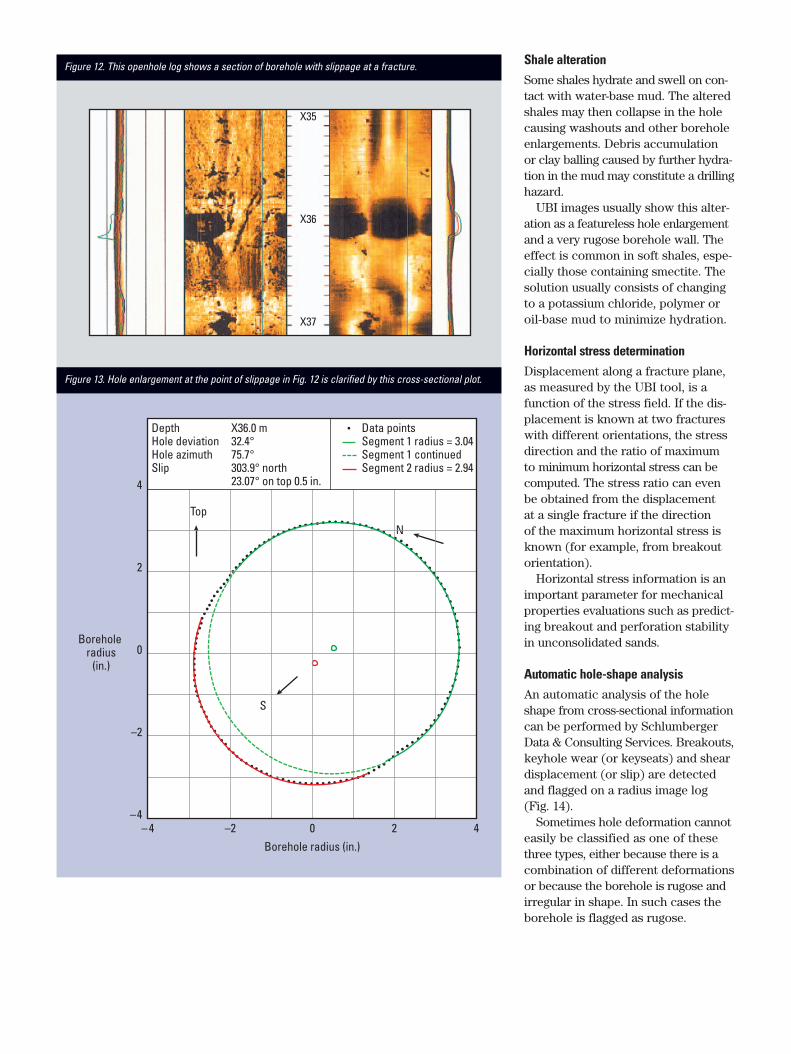
the fracture and allows the mud accessto the fracture. When displacementof the formation and the borehole issignificant, there is a risk of the drillbit, bottomhole assembly or drillpipesticking. The UBI images in Fig. 12show borehole displacement along a fracture, which appears as a darkhorizontal band on the radius image.Sometimes the dark band is not contin-uous, but the interpretation is usuallyunambiguous. A cross-sectional plotat the depth of the dark band clearlyshows the slip (Fig. 13).
Lower 25%
Upper 25%
0 10
0 10
0 10
Median
Lower 25%
Upper 25%
2.5 5.0
2.5 5.0
2.5 5.0
Median(in.)
(in.)
(in.)
0
Amplitude
180 360 0 180
360
Image Orientation
Bit Size = 5.875 in.
Horizontal Scale = 1⁄9 0.2
Image Orientation
Bit Size = 5.875 in.
Horizontal Scale = 1⁄9 0.2
1:20 m Borehole Radius
3472
3473
3474
3475
(in.)
(in.)
(in.)
(dB)
Figure 9. Dynamic normalization is applied to both images to highlight the features of the borehole. Dark colors represent low amplitude and large radii, and indicate rugosity, enlargements and attenuative materials. Three additional curves indicate the minimum, average and maximum values of the measurement around the borehole.
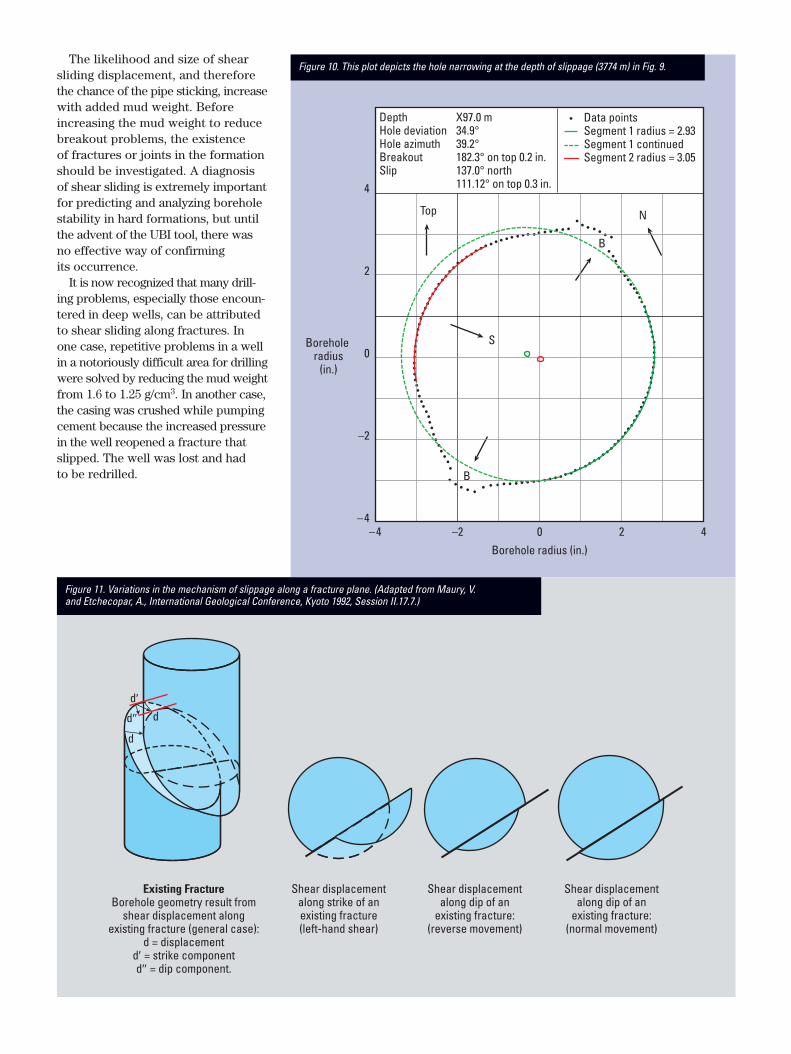
The likelihood and size of shearsliding displacement, and thereforethe chance of the pipe sticking, increasewith added mud weight. Beforeincreasing the mud weight to reducebreakout problems, the existenceof fractures or joints in the formationshould be investigated. A diagnosis of shear sliding is extremely importantfor predicting and analyzing boreholestability in hard formations, but untilthe advent of the UBI tool, there wasno effective way of confirming its occurrence.
It is now recognized that many drill-ing problems, especially those encoun-tered in deep wells, can be attributedto shear sliding along fractures. In one case, repetitive problems in a wellin a notoriously difficult area for drillingwere solved by reducing the mud weightfrom 1.6 to 1.25 g/cm3. In another case,the casing was crushed while pumpingcement because the increased pressurein the well reopened a fracture thatslipped. The well was lost and had to be redrilled. B
B
S
NTop
Borehole radius
(in.)
Borehole radius (in.)
4
2
0
–2
–40–2–4 2 4
Depth X97.0 mHole deviation 34.9° Hole azimuth 39.2°Breakout 182.3° on top 0.2 in.Slip 137.0° north 111.12° on top 0.3 in.
Data pointsSegment 1 radius = 2.93 Segment 1 continuedSegment 2 radius = 3.05
Figure 10. This plot depicts the hole narrowing at the depth of slippage (3774 m) in Fig. 9.
Existing FractureBorehole geometry result from
shear displacement along existing fracture (general case):
d = displacementd′ = strike componentd′′ = dip component.
Shear displacementalong strike of anexisting fracture(left-hand shear)
Shear displacementalong dip of an
existing fracture:(reverse movement)
Shear displacementalong dip of an
existing fracture:(normal movement)
d′
d′′ d
d
Figure 11. Variations in the mechanism of slippage along a fracture plane. (Adapted from Maury, V. and Etchecopar, A., International Geological Conference, Kyoto 1992, Session II.17.7.)
Shale alterationSome shales hydrate and swell on con-tact with water-base mud. The alteredshales may then collapse in the holecausing washouts and other boreholeenlargements. Debris accumulation or clay balling caused by further hydra-tion in the mud may constitute a drillinghazard.
UBI images usually show this alter-ation as a featureless hole enlargementand a very rugose borehole wall. Theeffect is common in soft shales, espe-cially those containing smectite. Thesolution usually consists of changingto a potassium chloride, polymer oroil-base mud to minimize hydration.
Horizontal stress determinationDisplacement along a fracture plane,as measured by the UBI tool, is afunction of the stress field. If the dis-placement is known at two fractureswith different orientations, the stressdirection and the ratio of maximum to minimum horizontal stress can becomputed. The stress ratio can evenbe obtained from the displacement at a single fracture if the direction of the maximum horizontal stress isknown (for example, from breakoutorientation).
Horizontal stress information is animportant parameter for mechanicalproperties evaluations such as predict-ing breakout and perforation stabilityin unconsolidated sands.
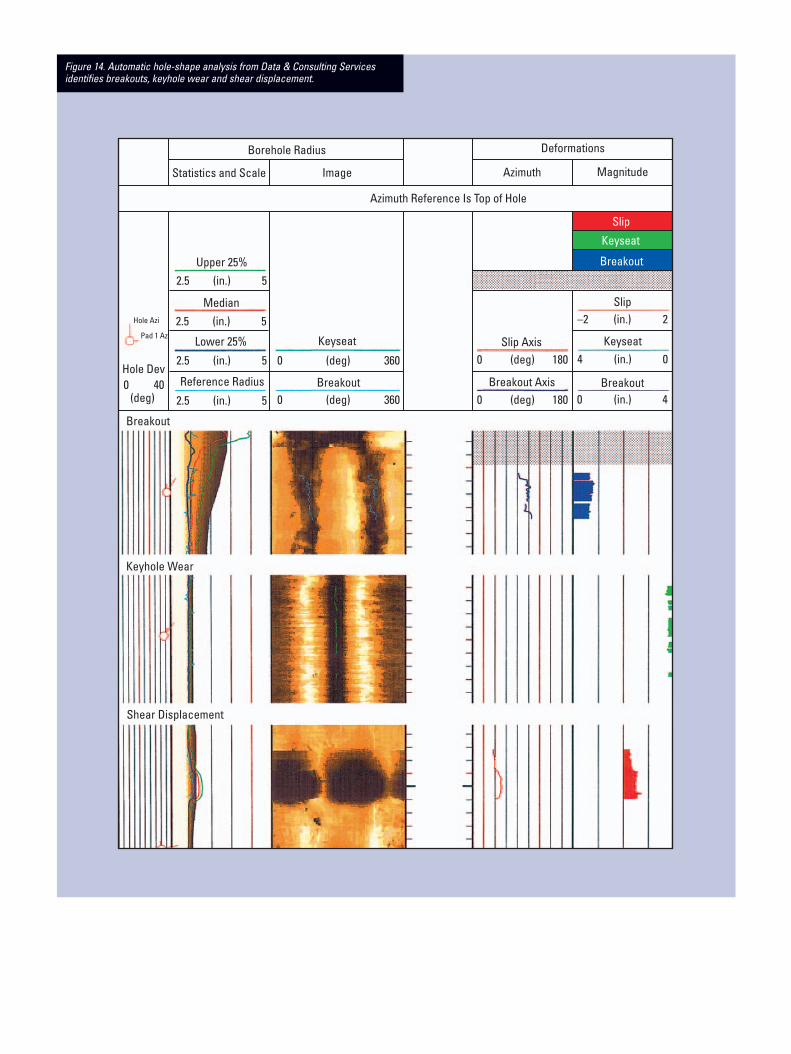
Automatic hole-shape analysisAn automatic analysis of the holeshape from cross-sectional informationcan be performed by SchlumbergerData & Consulting Services. Breakouts,keyhole wear (or keyseats) and sheardisplacement (or slip) are detectedand flagged on a radius image log(Fig. 14).
Sometimes hole deformation cannoteasily be classified as one of thesethree types, either because there is acombination of different deformationsor because the borehole is rugose andirregular in shape. In such cases theborehole is flagged as rugose.
X35
X36
X37
Depth X36.0 mHole deviation 32.4° Hole azimuth 75.7° Slip 303.9° north 23.07° on top 0.5 in.
Data pointsSegment 1 radius = 3.04Segment 1 continuedSegment 2 radius = 2.94
S
N
Top
Borehole radius
(in.)
Borehole radius (in.)
4
2
0
–2
–40–2– 4 2 4
Figure 13. Hole enlargement at the point of slippage in Fig. 12 is clarified by this cross-sectional plot.
Figure 12. This openhole log shows a section of borehole with slippage at a fracture.
Hole Azi
Pad 1 Az
Hole Dev0 40
(deg)
Borehole Radius
Statistics and Scale Image
Upper 25%
Median
Reference Radius
2.5 (in.) 5
–2 (in.) 2
4 (in.) 0
0 (in.) 4
2.5 (in.) 5
2.5 (in.) 5
2.5 (in.) 5
0 (deg) 360
0 (deg) 360
0 (deg) 180
0 (deg) 180
Keyseat
Breakout
Azimuth Reference Is Top of Hole
Deformations
Azimuth Magnitude
Keyseat
Breakout
Slip
Slip Axis
Breakout Axis
Slip
Keyseat
Breakout
Breakout
Keyhole Wear
Shear Displacement
Lower 25%
Figure 14. Automatic hole-shape analysis from Data & Consulting Servicesidentifies breakouts, keyhole wear and shear displacement.

SMP-5871 ©Schlumberger
June 2002 *Mark of Schlumberger
www.connect.slb.com