Embed Size (px)
Citation preview

Imaging in the Diagnosis and Management of MS
Introduction and Objectives
Introduction • Widespread use of magnetic resonance imaging (MRI) has revolutionized how people with neurologic
complaints are evaluated. Yet, because the first symptoms of MS are seldom unique to that illness, the diagnostic Journey for MS can be long. MS is a diagnosis of exclusion, determined by ruling out a range of other illnesses, often using MRI. Even after an MS diagnosis has been determined, MRI can assist clinicians in objectively measuring disease severity, estimating patient prognosis, and possibly assessing response to treatment. Understanding the physical principles that make MRI possible will help you to understand how the various MRI methods can be used to diagnose and manage MS patients.
Objectives• Describe the general role medical imaging plays in diagnosing and managing neurology patients• Understand the physical principles underlying MRI• Discuss the specific role of MRI for people with MS
2
Table of Contents
Chapter 1: Diagnosing MS• Typical Signs and Symptoms of MS• Differential Diagnosis for People With
MS-like Symptoms
Chapter 2: The Importance of Imaging in the Management of People With MS• Characterizing MS Prognosis• Assessing MS Disease Activity• Documenting MS Treatment Efficacy
3
Chapter 3: Clinical Utility of Magnetic Resonance Imaging (MRI)• Overview of MRI• T1-Weighted (T1W) MRI• Contrast-Enhanced (CE) T1-Weighted MRI
(Gd+ T1W)• T2-Weighted (T2W) MRI• T2 Fluid Attenuated Inversion Recovery Imaging
(FLAIR)• Spinal Cord Imaging• Other MRI Measures
Chapter 4: Non-MRI Methods for Diagnosing MS• Cerebrospinal Fluid (CSF) Analysis• Evoked Potentials and Laboratory Testing

Chapter 1
Diagnosing MS© iStock.com/adiekoetter

Typical Signs and Symptoms of MS
Common presenting symptoms of MS include1:• Vision problems• Optic neuritis, or inflammation of the optic nerve• Internuclear ophthalmoplegia, an eye movement disorder• Lhermitte’s sign, an electric shock-like sensation radiating downward from the neck• Sensory abnormalities, including numbness or tingling• Pyramidal tract signs including weakness, spasticity, partial paralysis, and
abnormal reflexes1,2
• Cerebellar deficits, including ataxia and tremors• Bladder dysfunction
1. Birnbaum G. Making a diagnosis of multiple sclerosis. In: Multiple Sclerosis: Clinician's Guide to Diagnosis and Treatment. New York, NY: Oxford University Press, Inc; 2009:35-58.2. Rolak LA. Diagnosis of multiple sclerosis. In: Giesser BS, ed. Primer on Multiple Sclerosis. New York, NY: Oxford University Press, Inc; 2011:81-90.
5
Differential Diagnosis for People With MS-like Symptoms
Rolak LA. Diagnosis of multiple sclerosis. In: Giesser BS, ed. Primer on Multiple Sclerosis. New York, NY: Oxford University Press, Inc; 2011:81-90.
6
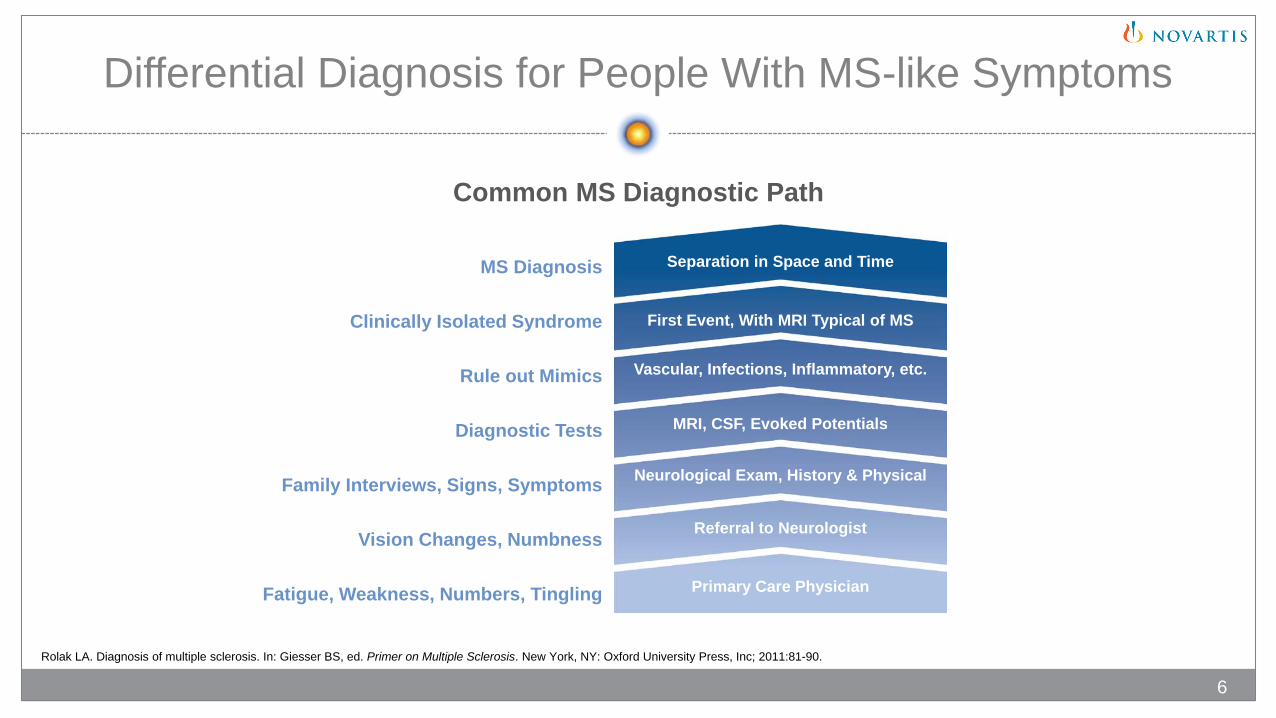
Common MS Diagnostic Path
MS Diagnosis
Clinically Isolated Syndrome
Rule out Mimics
Diagnostic Tests
Family Interviews, Signs, Symptoms
Vision Changes, Numbness
Fatigue, Weakness, Numbers, Tingling
Separation in Space and Time
First Event, With MRI Typical of MS
Vascular, Infections, Inflammatory, etc.
MRI, CSF, Evoked Potentials
Neurological Exam, History & Physical
Referral to Neurologist
Primary Care Physician
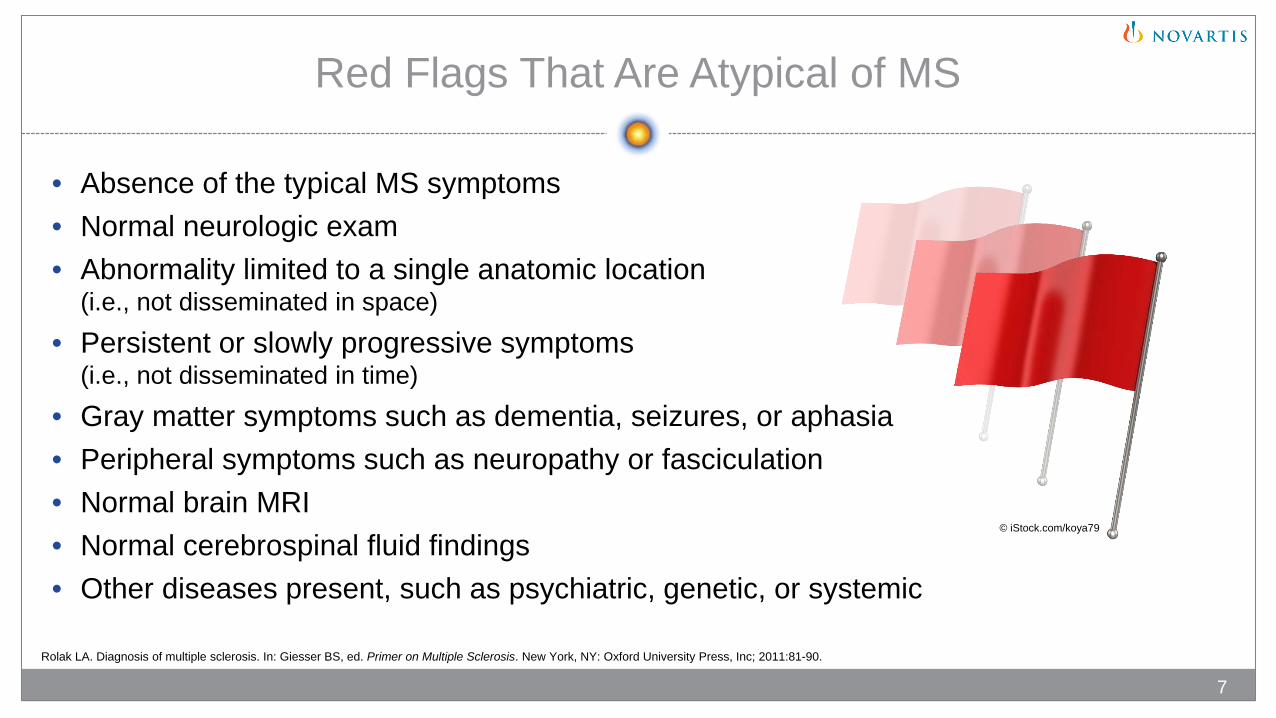
• Absence of the typical MS symptoms• Normal neurologic exam• Abnormality limited to a single anatomic location
(i.e., not disseminated in space)• Persistent or slowly progressive symptoms
(i.e., not disseminated in time)• Gray matter symptoms such as dementia, seizures, or aphasia• Peripheral symptoms such as neuropathy or fasciculation• Normal brain MRI• Normal cerebrospinal fluid findings• Other diseases present, such as psychiatric, genetic, or systemic
Red Flags That Are Atypical of MS
Rolak LA. Diagnosis of multiple sclerosis. In: Giesser BS, ed. Primer on Multiple Sclerosis. New York, NY: Oxford University Press, Inc; 2011:81-90.
7
© iStock.com/koya79
Differential Diagnoses
• Autoimmune and inflammatory conditions• Genetic diseases• Infectious diseases• Metabolic deficiencies
A wide range of other illnesses must be considered and ruled out before an MS diagnosis is confirmed
Rolak LA. Diagnosis of multiple sclerosis. In: Giesser BS, ed. Primer on Multiple Sclerosis. New York, NY: Oxford University Press, Inc; 2011:81-90.
8
Differential Diagnoses (cont)
• Oncologic illnesses• Psychiatric disorders• Vascular conditions
Rolak LA. Diagnosis of multiple sclerosis. In: Giesser BS, ed. Primer on Multiple Sclerosis. New York, NY: Oxford University Press, Inc; 2011:81-90.
9
A wide range of other illnesses must be considered and ruled out before an MS diagnosis is confirmed

The Importance of Imaging in the Management of People With MS
© iStock.com/londoneye
Chapter 2
Characterizing MS Prognosis
MS prognosis can be characterized by considering six (6) key factors:1. Age at onset
2. Symptoms at onset
3. MRI findings at onset of first attack and time of onset of clinically definite MS
4. Interval between first and second attacks
5. Attack frequency in the first 2 years
6. Completeness of recovery from initial attack
Grazioli E, et al. Temporal and clinical course of multiple sclerosis. In: Giesser BS, ed. Primer on Multiple Sclerosis. New York, NY: Oxford University Press, Inc; 2011:141-148.
11

Characterizing MS Prognosis (cont)
The Optic Neuritis Treatment Trial, a study involving a cohort of patients initially presenting with optic neuritis, found 15-year cumulative probability of developing to CDMS1:• 25% in people with no MRI lesions • 72% in people with one or more MRI lesions
The Queen Square Group, a study involving a cohort of patients with clinically isolated syndrome (CIS), monitored the 20-year CIS to CDMS conversion rate based on the number of T2 lesions visible on MRI at initial presentation and found conversion rates as follows2:• 21% in people with zero (0) lesions• 82% in people with 1-3 lesions• 85% in people with 4-9 lesions• 81% in people with >10 lesions
The Queen Square Group also identified a correlation between number of T2 lesions visible on MRI at baseline and disability, as measured by EDSS at 20 years2
1. The Optic Neuritis Study Group. Arch Neurol. 2008;65(6):727-732. 2. Fisniku LK, et al. Brain. 2008;131(pt 3):808-817.
CDMS, clinically definite multiple sclerosis; EDSS, Expanded Disability Status Scale; MRI, magnetic resonance imaging.
12
Assessing MS Disease Activity
• Currently there are no established standards/protocols for correlating MRI results to disease and/or disability progression1
• MS lesions visible on gadolinium-enhancing (Gd+) T1-weighted images may be considered a predictor for the occurrence of MS relapses1
• The results of MRI scans provide a quantitative measure of disease activity in relapsing-remitting MS by demonstrating lesions indicative of a breakdown of the blood-brain barrier, and total lesion burden2
• There is debate in the scientific community about how MRI results correlate to clinical symptoms2
1. Sicotte NL. Neuroimaging in multiple sclerosis. In: Giesser BS, ed. Primer on Multiple Sclerosis. New York, NY: Oxford University Press, Inc; 2011:91-113.2. Daumer M, et al. Neurology. 2009;72(8):705-711.
13

Documenting MS Treatment Efficacy
• A 2009 meta-analysis of randomized, placebo-controlled, clinical trials of RRMS found a strong correlation between the effect of treatment on relapses and on MRI activity (new or enlarging T2-hyperintense lesions, gadolinium-enhancing lesions, or a combination of the two)1
o A separate analysis identified a significant but slightly weaker correlation between treatment effects on MRI and on EDSS worsening2
• MRI is generally utilized as a primary outcome measure in phase II studies to measure disease activity3
• In phase III MS clinical trials, MRI is generally relegated to secondary outcome measures due to the uncertainty of the relationship between conventional MRI and clinical evolution of MS3
• In clinical practice there are no validated standards for neurologists to follow to monitor response to therapy in their patients with MS3
• A clinical determination would need to be made when identifying a suboptimal response, with MRI playing a potentially confirmatory role3
1. Sormani MP, et al. Ann Neurol. 2009;65(3):268-275. 2. Sormani MP, et al. Neurology. 2010;75(4):302-309. 3. Filippi M, Rocca MA. Radiology. 2011;259(3):659-681.
14

Clinical Utility of MRI
Chapter 3
Overview of MRI
• The use of strong magnetic fields with applied radiofrequency (rf) energy and gradients to form detailed soft-tissue images is the basis of MRI
• MRI technology obtains signals from protons (hydrogen) found in fat and water, the main components of the braino When protons are in the strong magnetic field of an MRI machine, proton spins will align with the
magnetic field of the MRI scannero When energy (brief rf pulses) is applied to the tissues by the MRI machine, the spinning protons are
displaced in a uniform direction o As the spinning protons dephase and realign with the magnetic field, they produce rf energy that is
reconstructed into images• MRI technology provides advantages over other imaging modalities, including:
o The ability to obtain multiple images without the risk of exposure to radiationo The ability to create high-resolution images in any orientation (eg, axial, sagittal, coronal)o The ability to create multiple tissue contrasts
Sicotte NL. Neuroimaging in multiple sclerosis. In: Giesser BS, ed. Primer on Multiple Sclerosis. New York, NY: Oxford University Press, Inc; 2011:91-113.
16
Magnetic Field Strength
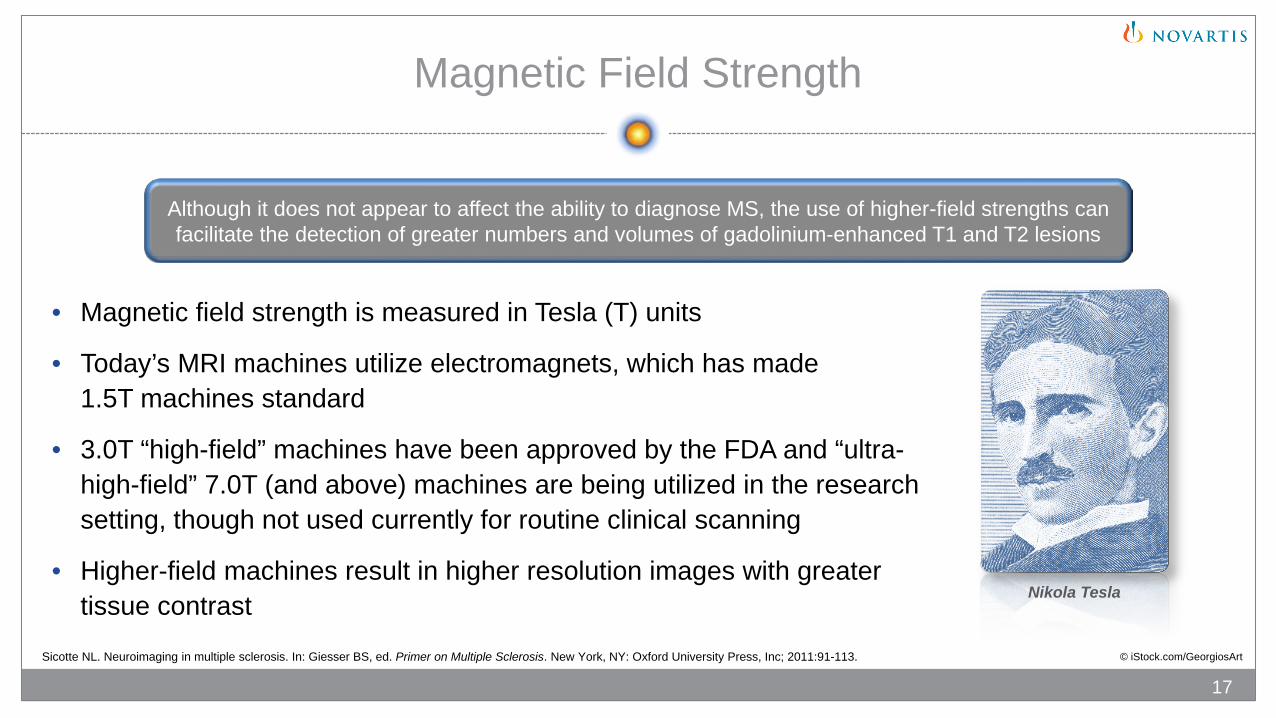
• Magnetic field strength is measured in Tesla (T) units
• Today’s MRI machines utilize electromagnets, which has made 1.5T machines standard
• 3.0T “high-field” machines have been approved by the FDA and “ultra-high-field” 7.0T (and above) machines are being utilized in the research setting, though not used currently for routine clinical scanning
• Higher-field machines result in higher resolution images with greater tissue contrast
Although it does not appear to affect the ability to diagnose MS, the use of higher-field strengths can facilitate the detection of greater numbers and volumes of gadolinium-enhanced T1 and T2 lesions
Nikola Tesla
Sicotte NL. Neuroimaging in multiple sclerosis. In: Giesser BS, ed. Primer on Multiple Sclerosis. New York, NY: Oxford University Press, Inc; 2011:91-113.
17
© iStock.com/GeorgiosArt
Orientation
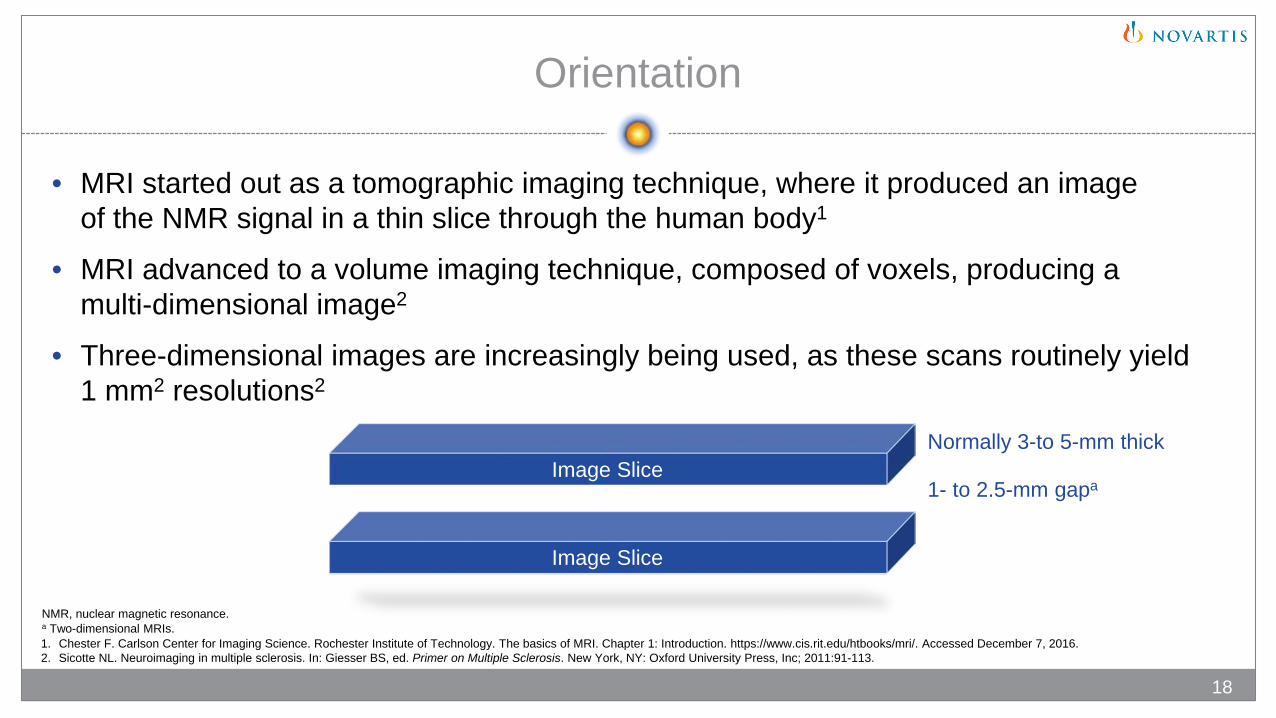
• MRI started out as a tomographic imaging technique, where it produced an image of the NMR signal in a thin slice through the human body1
• MRI advanced to a volume imaging technique, composed of voxels, producing a multi-dimensional image2
• Three-dimensional images are increasingly being used, as these scans routinely yield 1 mm2 resolutions2
Image SliceNormally 3-to 5-mm thick
1- to 2.5-mm gapa
Image Slice
NMR, nuclear magnetic resonance.a Two-dimensional MRIs.1. Chester F. Carlson Center for Imaging Science. Rochester Institute of Technology. The basics of MRI. Chapter 1: Introduction. https://www.cis.rit.edu/htbooks/mri/. Accessed December 7, 2016. 2. Sicotte NL. Neuroimaging in multiple sclerosis. In: Giesser BS, ed. Primer on Multiple Sclerosis. New York, NY: Oxford University Press, Inc; 2011:91-113.
18
Axial View MRI
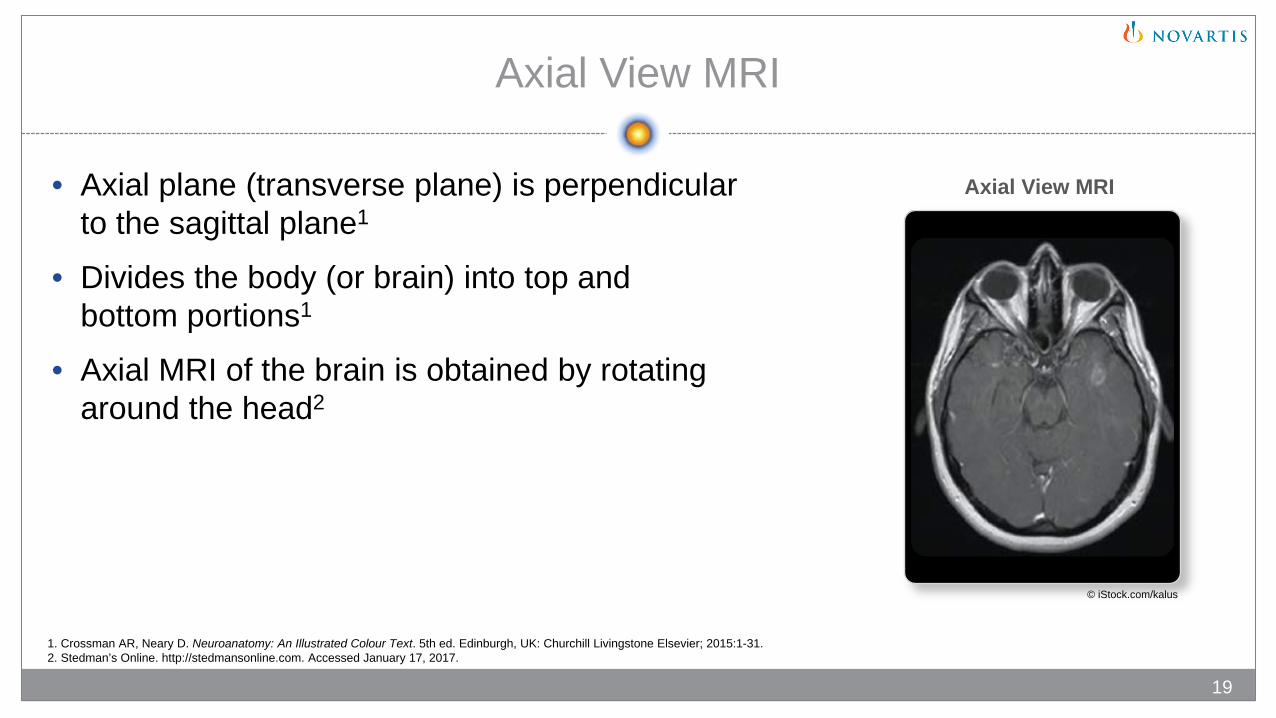
• Axial plane (transverse plane) is perpendicular to the sagittal plane1
• Divides the body (or brain) into top and bottom portions1
• Axial MRI of the brain is obtained by rotating around the head2
19
1. Crossman AR, Neary D. Neuroanatomy: An Illustrated Colour Text. 5th ed. Edinburgh, UK: Churchill Livingstone Elsevier; 2015:1-31. 2. Stedman’s Online. http://stedmansonline.com. Accessed January 17, 2017.
Axial View MRI
© iStock.com/kalus
Sagittal View MRI
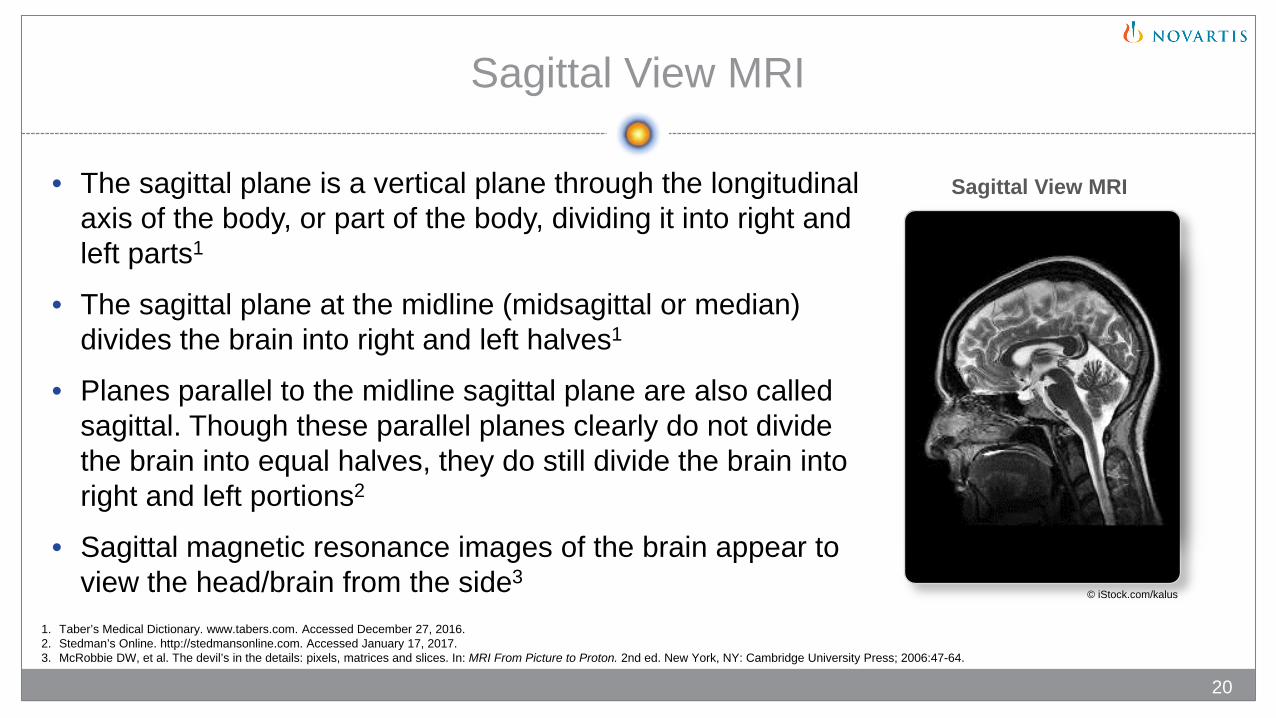
• The sagittal plane is a vertical plane through the longitudinal axis of the body, or part of the body, dividing it into right and left parts1
• The sagittal plane at the midline (midsagittal or median) divides the brain into right and left halves1
• Planes parallel to the midline sagittal plane are also called sagittal. Though these parallel planes clearly do not divide the brain into equal halves, they do still divide the brain into right and left portions2
• Sagittal magnetic resonance images of the brain appear to view the head/brain from the side3
1. Taber’s Medical Dictionary. www.tabers.com. Accessed December 27, 2016. 2. Stedman’s Online. http://stedmansonline.com. Accessed January 17, 2017. 3. McRobbie DW, et al. The devil’s in the details: pixels, matrices and slices. In: MRI From Picture to Proton. 2nd ed. New York, NY: Cambridge University Press; 2006:47-64.
20
Sagittal View MRI
© iStock.com/kalus
Coronal View MRI
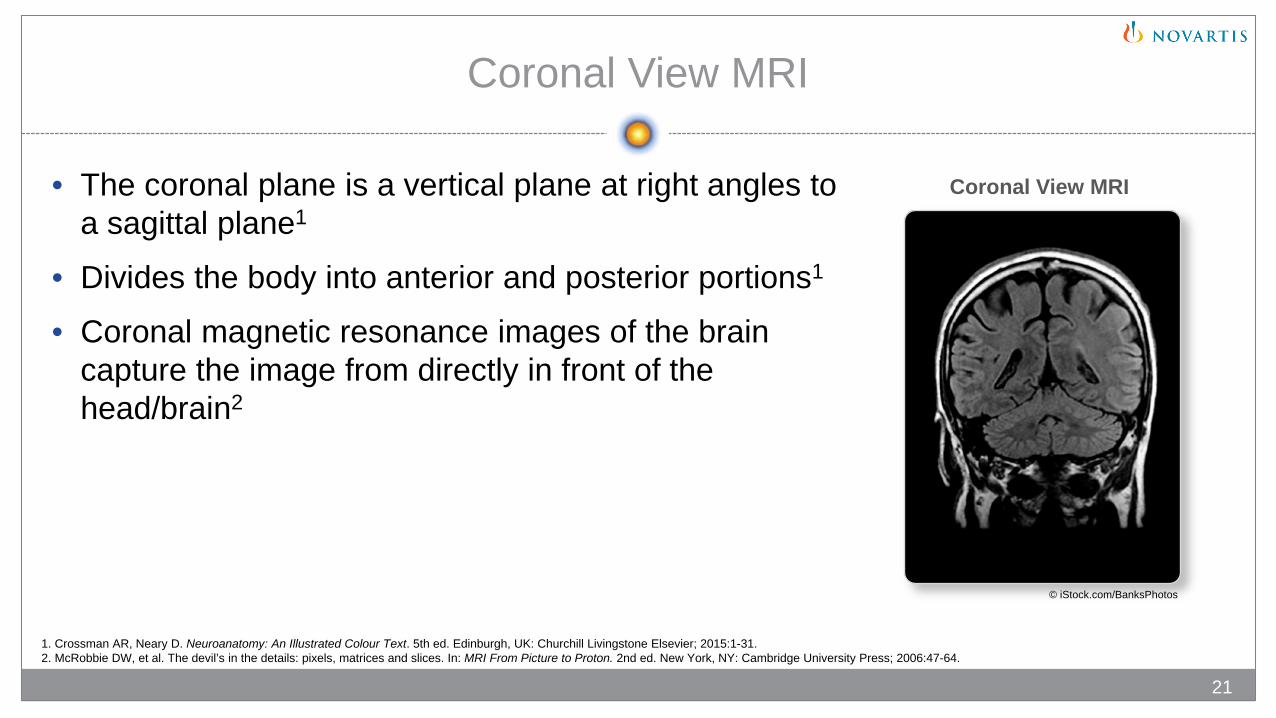
• The coronal plane is a vertical plane at right angles to a sagittal plane1
• Divides the body into anterior and posterior portions1
• Coronal magnetic resonance images of the brain capture the image from directly in front of the head/brain2
21
1. Crossman AR, Neary D. Neuroanatomy: An Illustrated Colour Text. 5th ed. Edinburgh, UK: Churchill Livingstone Elsevier; 2015:1-31. 2. McRobbie DW, et al. The devil’s in the details: pixels, matrices and slices. In: MRI From Picture to Proton. 2nd ed. New York, NY: Cambridge University Press; 2006:47-64.
Coronal View MRI
© iStock.com/BanksPhotos
Navigating Locations in the Brain
22
Crossman AR, Neary D. Neuroanatomy: An Illustrated Colour Text. 5th ed. Edinburgh, UK: Churchill Livingstone Elsevier; 2015:1-31.
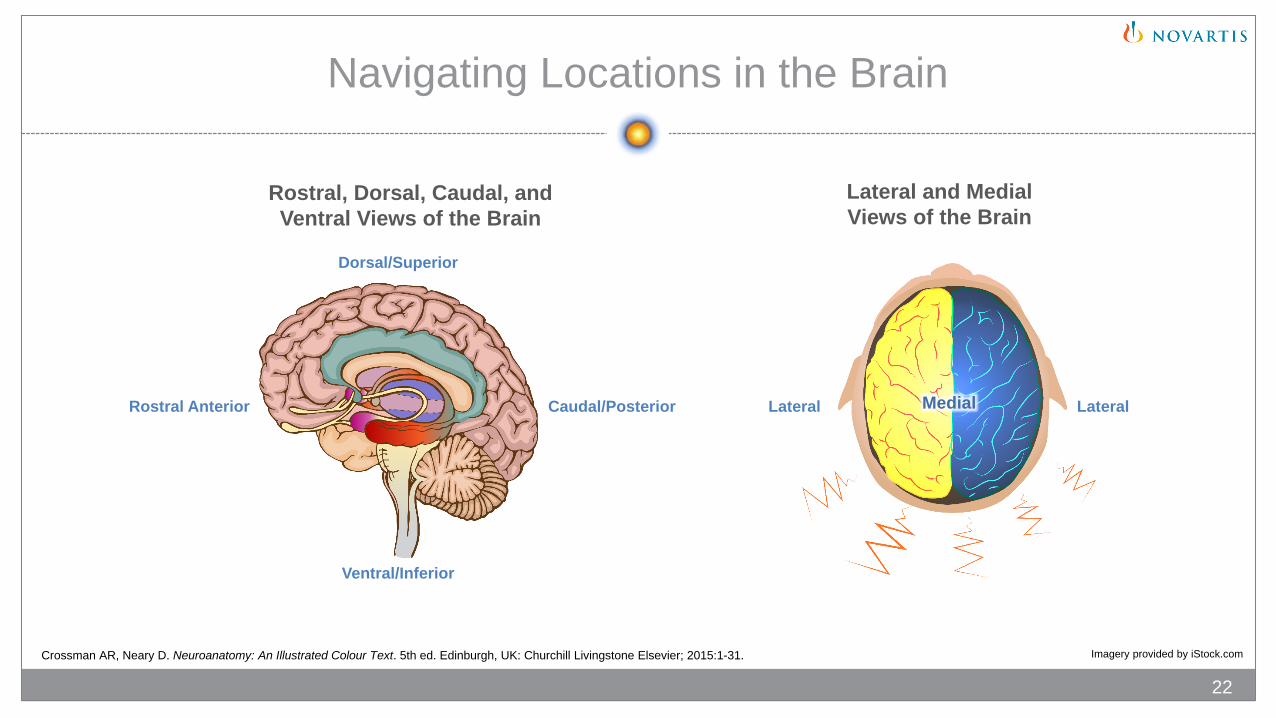
Rostral, Dorsal, Caudal, and Ventral Views of the Brain
Dorsal/Superior
Caudal/Posterior
Ventral/Inferior
Rostral Anterior Lateral Medial Lateral
Lateral and Medial Views of the Brain
Imagery provided by iStock.com
T1-Weighted (T1W) MRI
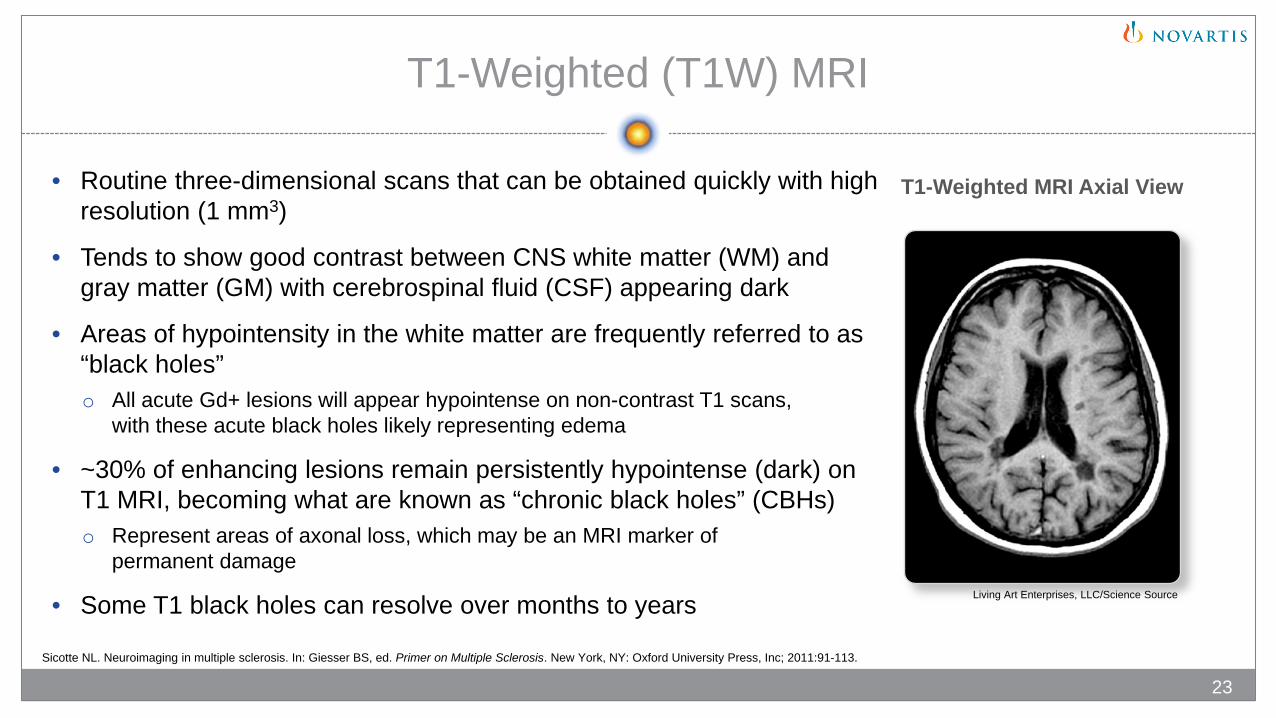
• Routine three-dimensional scans that can be obtained quickly with high resolution (1 mm3)
• Tends to show good contrast between CNS white matter (WM) and gray matter (GM) with cerebrospinal fluid (CSF) appearing dark
• Areas of hypointensity in the white matter are frequently referred to as “black holes”o All acute Gd+ lesions will appear hypointense on non-contrast T1 scans,
with these acute black holes likely representing edema
• ~30% of enhancing lesions remain persistently hypointense (dark) on T1 MRI, becoming what are known as “chronic black holes” (CBHs)o Represent areas of axonal loss, which may be an MRI marker of
permanent damage
• Some T1 black holes can resolve over months to years
Sicotte NL. Neuroimaging in multiple sclerosis. In: Giesser BS, ed. Primer on Multiple Sclerosis. New York, NY: Oxford University Press, Inc; 2011:91-113.
23
T1-Weighted MRI Axial View
Living Art Enterprises, LLC/Science Source

Contrast-Enhanced (CE) T1-Weighted MRI (Gd+ T1W)
• Conducted after the intravenous administration of a contrast agent known as gadolinium (Gd)
• Areas where gadolinium is present appear bright• Gd+ lesions represent areas of acute inflammation
associated with blood-brain barrier (BBB) breakdown• Enhancement of these lesions usually resolves within
4 to 6 weeks• Associated with an increased risk of relapse• New enhancing lesions may appear 7 to 10 times more
frequently than clinical relapses occur• Used as a primary outcome measure in phase II clinical trials
of potential MS treatments
24Sicotte NL. Neuroimaging in multiple sclerosis. In: Giesser BS, ed. Primer on Multiple Sclerosis. New York, NY: Oxford University Press, Inc; 2011:91-113.
Contrast-Enhanced T1-Weighted MRI Axial View
Republished with permission of AJNR Am J Neuroradiol, from Ge Y, 27, 6 © 2006; permission conveyed through Copyright Clearance Center, Inc.
T2-Weighted (T2W) MRI
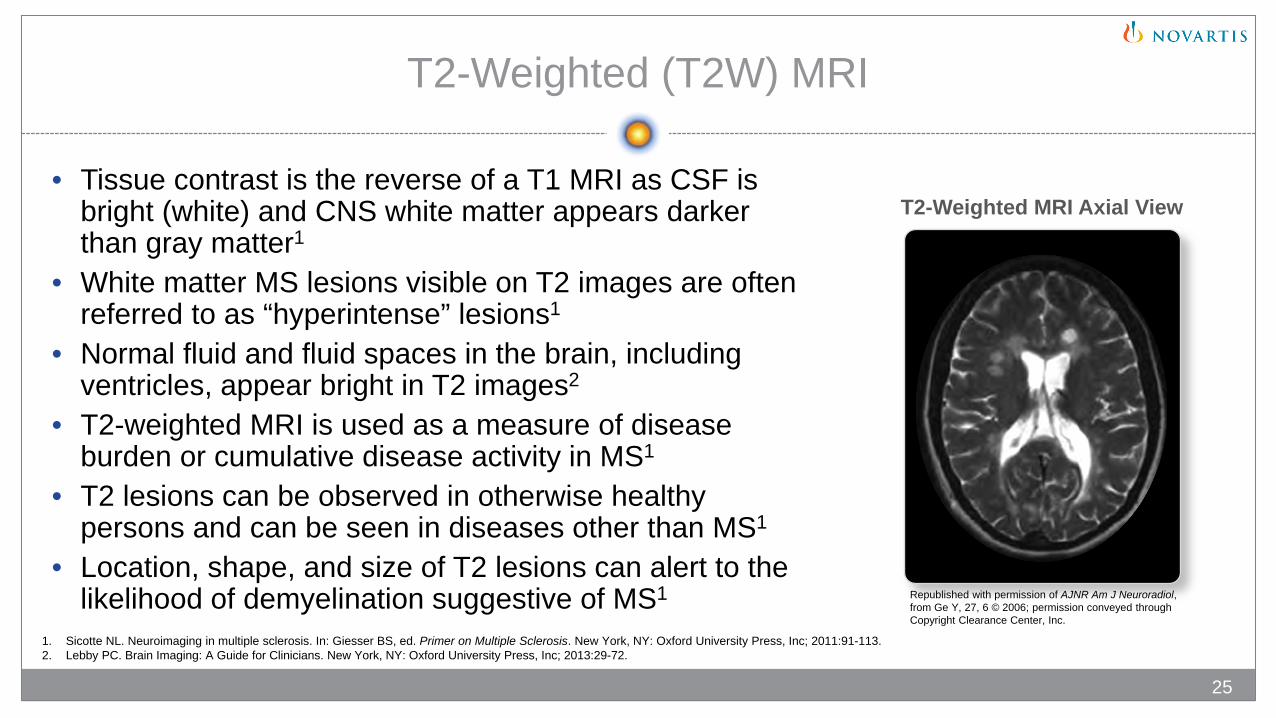
• Tissue contrast is the reverse of a T1 MRI as CSF is bright (white) and CNS white matter appears darker than gray matter1
• White matter MS lesions visible on T2 images are often referred to as “hyperintense” lesions1
• Normal fluid and fluid spaces in the brain, including ventricles, appear bright in T2 images2
• T2-weighted MRI is used as a measure of disease burden or cumulative disease activity in MS1
• T2 lesions can be observed in otherwise healthy persons and can be seen in diseases other than MS1
• Location, shape, and size of T2 lesions can alert to the likelihood of demyelination suggestive of MS1
25
1. Sicotte NL. Neuroimaging in multiple sclerosis. In: Giesser BS, ed. Primer on Multiple Sclerosis. New York, NY: Oxford University Press, Inc; 2011:91-113. 2. Lebby PC. Brain Imaging: A Guide for Clinicians. New York, NY: Oxford University Press, Inc; 2013:29-72.
T2-Weighted MRI Axial View
Republished with permission of AJNR Am J Neuroradiol, from Ge Y, 27, 6 © 2006; permission conveyed through Copyright Clearance Center, Inc.
T2 Fluid Attenuated Inversion Recovery Imaging (FLAIR)
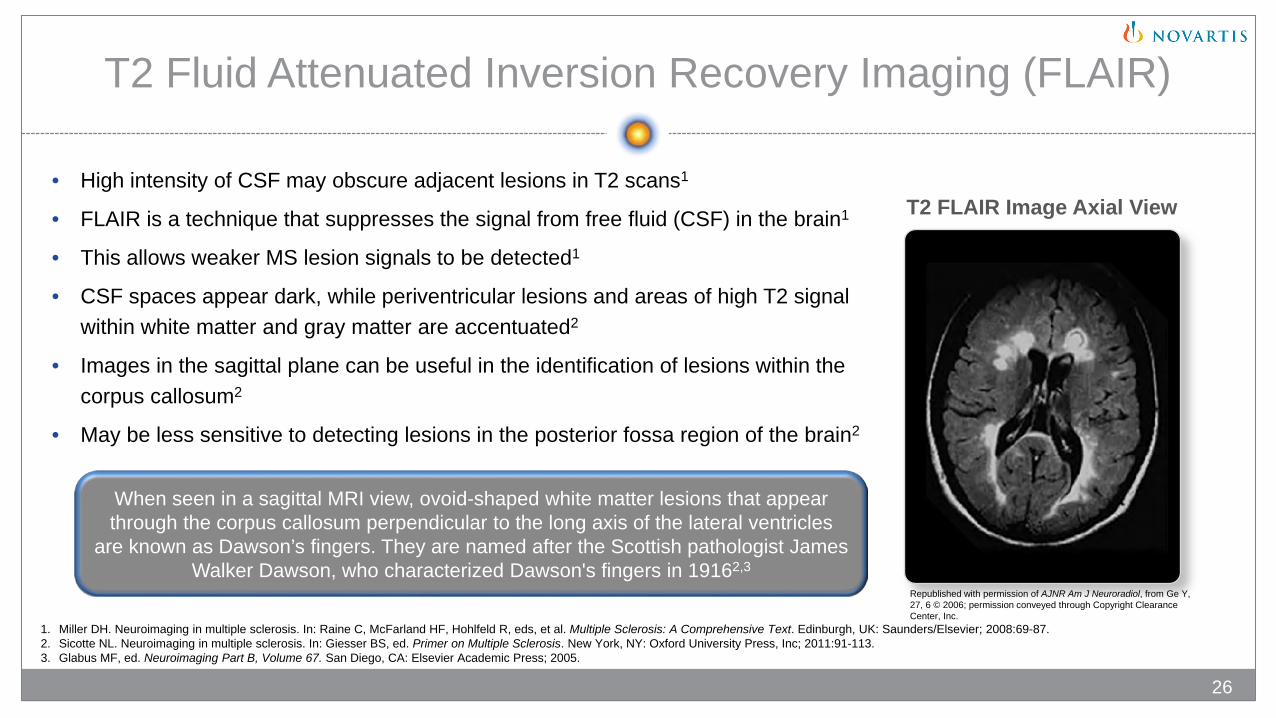
• High intensity of CSF may obscure adjacent lesions in T2 scans1
• FLAIR is a technique that suppresses the signal from free fluid (CSF) in the brain1
• This allows weaker MS lesion signals to be detected1
• CSF spaces appear dark, while periventricular lesions and areas of high T2 signal within white matter and gray matter are accentuated2
• Images in the sagittal plane can be useful in the identification of lesions within the corpus callosum2
• May be less sensitive to detecting lesions in the posterior fossa region of the brain2
When seen in a sagittal MRI view, ovoid-shaped white matter lesions that appear through the corpus callosum perpendicular to the long axis of the lateral ventricles
are known as Dawson’s fingers. They are named after the Scottish pathologist James Walker Dawson, who characterized Dawson's fingers in 19162,3
1. Miller DH. Neuroimaging in multiple sclerosis. In: Raine C, McFarland HF, Hohlfeld R, eds, et al. Multiple Sclerosis: A Comprehensive Text. Edinburgh, UK: Saunders/Elsevier; 2008:69-87.2. Sicotte NL. Neuroimaging in multiple sclerosis. In: Giesser BS, ed. Primer on Multiple Sclerosis. New York, NY: Oxford University Press, Inc; 2011:91-113.3. Glabus MF, ed. Neuroimaging Part B, Volume 67. San Diego, CA: Elsevier Academic Press; 2005.
26
T2 FLAIR Image Axial View
Republished with permission of AJNR Am J Neuroradiol, from Ge Y, 27, 6 © 2006; permission conveyed through Copyright Clearance Center, Inc.
Spinal Cord Imaging
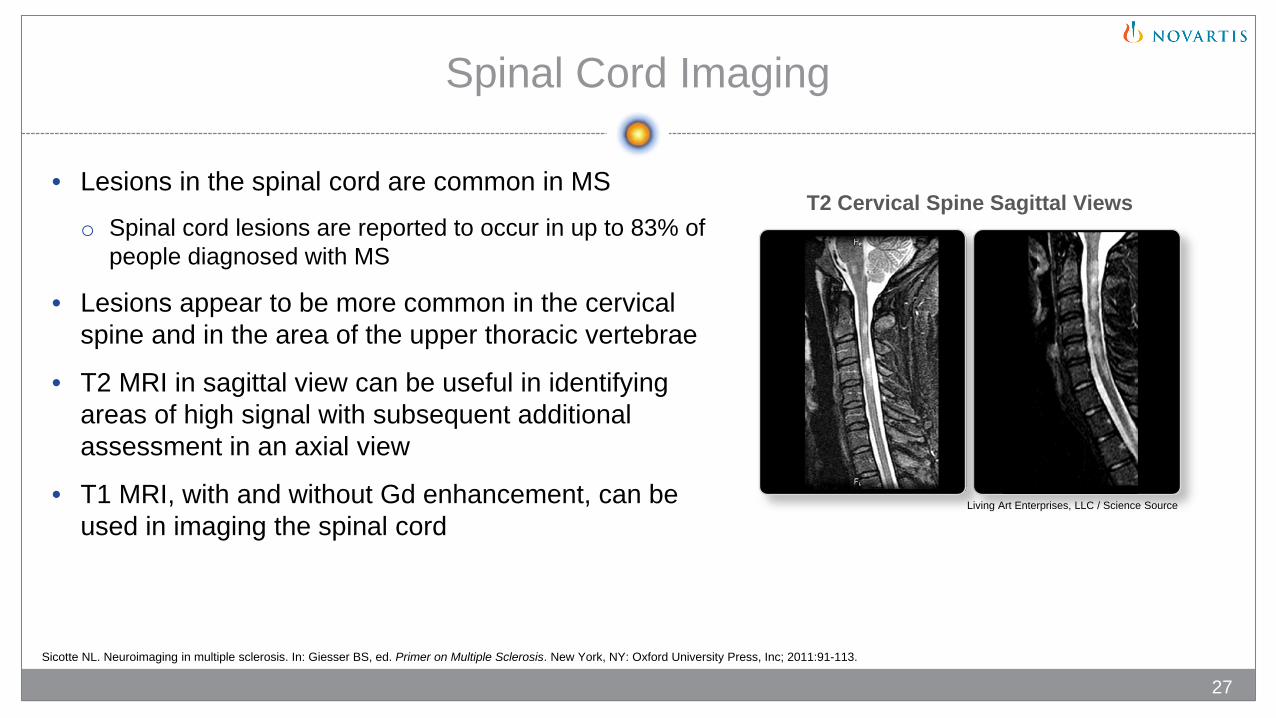
• Lesions in the spinal cord are common in MSo Spinal cord lesions are reported to occur in up to 83% of
people diagnosed with MS
• Lesions appear to be more common in the cervical spine and in the area of the upper thoracic vertebrae
• T2 MRI in sagittal view can be useful in identifying areas of high signal with subsequent additional assessment in an axial view
• T1 MRI, with and without Gd enhancement, can be used in imaging the spinal cord
Sicotte NL. Neuroimaging in multiple sclerosis. In: Giesser BS, ed. Primer on Multiple Sclerosis. New York, NY: Oxford University Press, Inc; 2011:91-113.
27
T2 Cervical Spine Sagittal Views
Living Art Enterprises, LLC / Science Source
Other MRI Measures
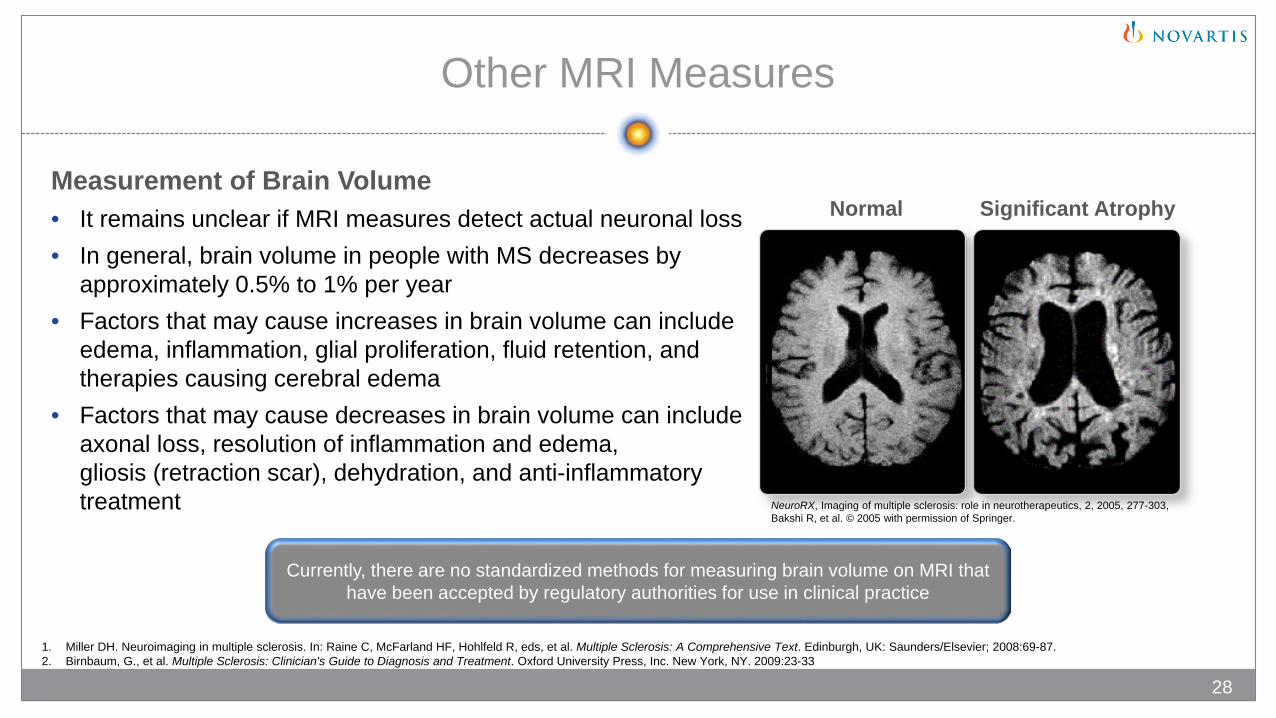
Measurement of Brain Volume• It remains unclear if MRI measures detect actual neuronal loss• In general, brain volume in people with MS decreases by
approximately 0.5% to 1% per year• Factors that may cause increases in brain volume can include
edema, inflammation, glial proliferation, fluid retention, and therapies causing cerebral edema
• Factors that may cause decreases in brain volume can include axonal loss, resolution of inflammation and edema, gliosis (retraction scar), dehydration, and anti-inflammatory treatment
Normal Significant Atrophy
Currently, there are no standardized methods for measuring brain volume on MRI that have been accepted by regulatory authorities for use in clinical practice
1. Miller DH. Neuroimaging in multiple sclerosis. In: Raine C, McFarland HF, Hohlfeld R, eds, et al. Multiple Sclerosis: A Comprehensive Text. Edinburgh, UK: Saunders/Elsevier; 2008:69-87.2. Birnbaum, G., et al. Multiple Sclerosis: Clinician's Guide to Diagnosis and Treatment. Oxford University Press, Inc. New York, NY. 2009:23-33
28
NeuroRX, Imaging of multiple sclerosis: role in neurotherapeutics, 2, 2005, 277-303, Bakshi R, et al. © 2005 with permission of Springer.

Non-MRI Methods for
Diagnosing MS© iStock.com/Maridav
Chapter 4
Cerebrospinal Fluid (CSF) Analysis
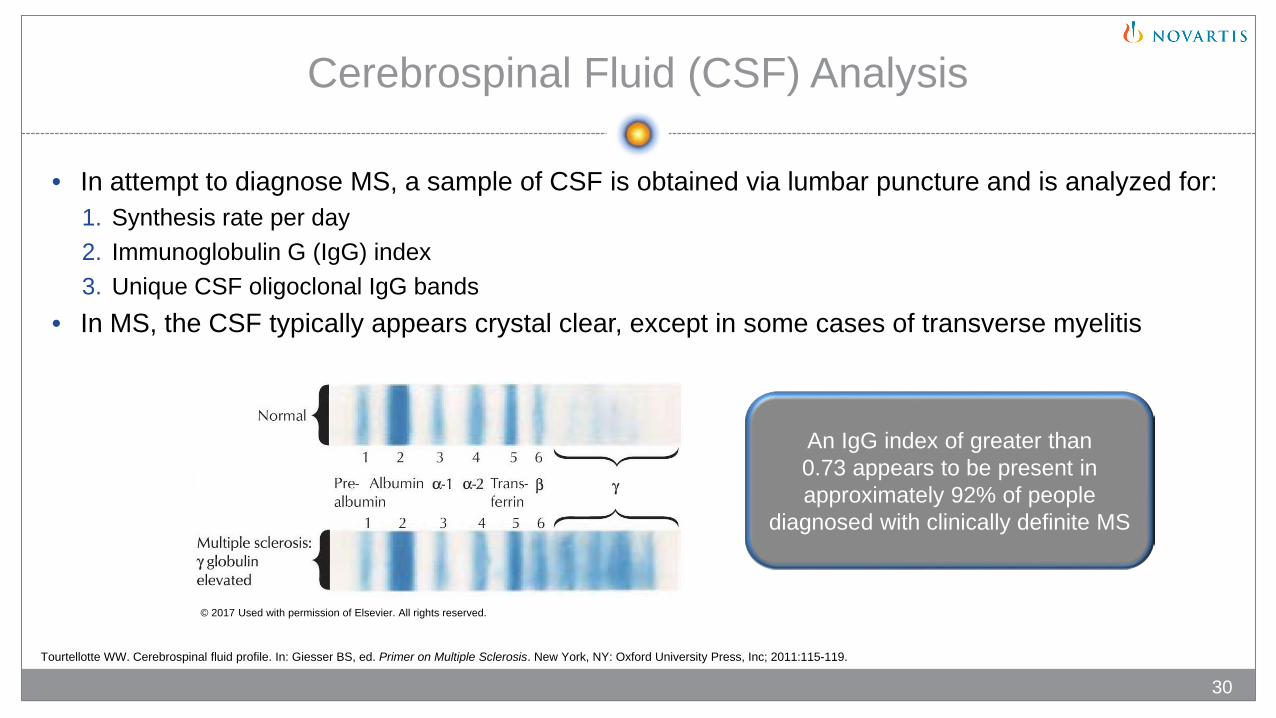
• In attempt to diagnose MS, a sample of CSF is obtained via lumbar puncture and is analyzed for: 1. Synthesis rate per day 2. Immunoglobulin G (IgG) index3. Unique CSF oligoclonal IgG bands
• In MS, the CSF typically appears crystal clear, except in some cases of transverse myelitis
An IgG index of greater than 0.73 appears to be present in approximately 92% of people
diagnosed with clinically definite MS
© 2017 Used with permission of Elsevier. All rights reserved.
Tourtellotte WW. Cerebrospinal fluid profile. In: Giesser BS, ed. Primer on Multiple Sclerosis. New York, NY: Oxford University Press, Inc; 2011:115-119.
30
© iStock.com/spanteldotru
31
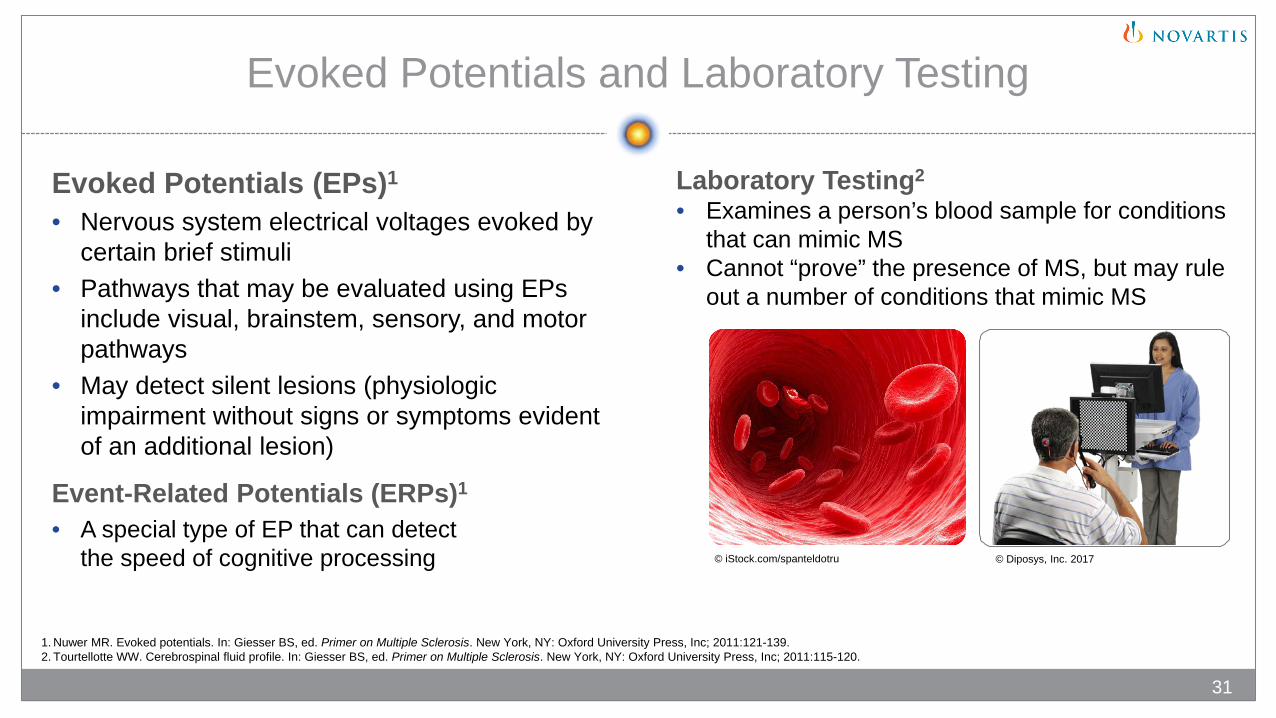
Evoked Potentials and Laboratory Testing
Evoked Potentials (EPs)1
• Nervous system electrical voltages evoked by certain brief stimuli
• Pathways that may be evaluated using EPs include visual, brainstem, sensory, and motor pathways
• May detect silent lesions (physiologic impairment without signs or symptoms evident of an additional lesion)
Event-Related Potentials (ERPs)1
• A special type of EP that can detect the speed of cognitive processing
Laboratory Testing2
• Examines a person’s blood sample for conditions that can mimic MS
• Cannot “prove” the presence of MS, but may rule out a number of conditions that mimic MS
1. Nuwer MR. Evoked potentials. In: Giesser BS, ed. Primer on Multiple Sclerosis. New York, NY: Oxford University Press, Inc; 2011:121-139.2. Tourtellotte WW. Cerebrospinal fluid profile. In: Giesser BS, ed. Primer on Multiple Sclerosis. New York, NY: Oxford University Press, Inc; 2011:115-120.
© Diposys, Inc. 2017

Novartis Pharmaceuticals Corporation East Hanover, New Jersey 07936-1080 © 2017 Novartis 5/17 XMG-1339451