Embed Size (px)
Citation preview
NeuroImage 53 (2010) 196–205
Contents lists available at ScienceDirect
NeuroImage
j ourna l homepage: www.e lsev ie r.com/ locate /yn img
Imaging haemodynamic changes related to seizures: Comparison of EEG-basedgeneral linear model, independent component analysis of fMRI and intracranial EEG
R.C. Thornton a,1, R. Rodionov a,1, H. Laufs a, S. Vulliemoz a, A. Vaudano a, D. Carmichael a, S. Cannadathu a,M. Guye b, A. McEvoy a, S. Lhatoo d, F. Bartolomei b, P. Chauvel b, B. Diehl a, F. De Martino e, R.D.C. Elwes c,M.C. Walker a, J.S. Duncan a, L. Lemieux a,⁎a Dept of Clinical and Experimental Epilepsy, UCL Institute of Neurology, London WC1N 3BG, National Society for Epilepsy MRI Unit, Chalfont St Peter, Buckinghamshire SL9 0RJ, UKb CHU Timone, Service de Neurophysiologie Clinique, Marseille, F-13000, France and INSERM, U751, Marseille F-13000, Francec Department of Clinical Neurophysiology, Kings College Hospital, London, UKd Department of Neurology, North Bristol NHS Trust, Frenchay, Bristol, UKe Department of Cognitive Neurosciences, Faculty of Psychology, University of Maastricht, Maastricht, The Netherlands
⁎ Corresponding author.E-mail address: [email protected] (L. Lemieux)
1 These two authors contributed equally.
1053-8119/$ – see front matter © 2010 Elsevier Inc. Adoi:10.1016/j.neuroimage.2010.05.064
a b s t r a c t
a r t i c l e i n f oArticle history:
Received 25 January 2010Revised 29 April 2010Accepted 24 May 2010Available online 4 June 2010Background: Simultaneous EEG-fMRI can reveal haemodynamic changes associated with epileptic activitywhich may contribute to understanding seizure onset and propagation.Methods: Nine of 83 patients with focal epilepsy undergoing pre-surgical evaluation had seizures duringEEG-fMRI and analysed using three approaches, two based on the general linear model (GLM) and one usingindependent component analysis (ICA):
1. EEGs were divided into up to three phases: early ictal EEG change, clinical seizure onset and late ictal EEGchange and convolved with a canonical haemodynamic response function (HRF) (canonical GLM analysis).
2. Seizures lasting three scans or longer were additionally modelled using a Fourier basis set across the entireevent (Fourier GLM analysis).
3. Independent component analysis (ICA) was applied to the fMRI data to identify ictal BOLD patternswithout EEG.The results were compared with intracranial EEG.
Results: The canonical GLM analysis revealed significant BOLD signal changes associated with seizures on EEGin 7/9 patients, concordant with the seizure onset zone in 4/7. The Fourier GLM analysis revealed changes inBOLD signal corresponding with the results of the canonical analysis in two patients. ICA revealedcomponents spatially concordant with the seizure onset zone in all patients (8/9 confirmed by intracranialEEG).Conclusion: Ictal EEG-fMRI visualises plausible seizure related haemodynamic changes. The GLM approach toanalysing EEG-fMRI data reveals localised BOLD changes concordant with the ictal onset zone when scalpEEG reflects seizure onset. ICA provides additional information when scalp EEG does not accurately reflectseizures and may give insight into ictal haemodynamics.
© 2010 Elsevier Inc. All rights reserved.
Introduction
EEG-fMRI shows blood oxygen level dependent (BOLD) signalchanges occurring with interictal epileptiform discharges (IEDs),which are concordant with the irritative zone in 60–70% of cases inwhom IEDare recorded (AlAsmi et al., 2003; Benar et al., 2006; Lazeyraset al., 2000; Salek-Haddadi et al., 2006; Seeck et al., 1998). fMRI studiesof seizures are less common, but case reports and small series have
.
ll rights reserved.
shown ictal BOLD signal change both with (Donaire et al., 2009;Kobayashi et al., 2006; Salek-Haddadi et al., 2002; Tyvaert et al., 2008)and without (Detre et al., 1995; Federico et al., 2005) concurrent EEG.
In most EEG-fMRI studies of ictal activity, seizures have beenrepresented as a single block across their duration convolved with anHRF (Kobayashi et al., 2006; Tyvaert et al., 2008) referring to the EEGfor onset and offset times. In principle this single-block scalp EEGderived fMRI model is limited as:
1) Seizure onset is not always accurately detected by scalp EEG andmay be delayed (Binnie and Stefan, 1999).
2) A single block may not accurately represent dynamic processessuch as seizures (Niedermeyer, 1999).
197R.C. Thornton et al. / NeuroImage 53 (2010) 196–205
Furthermore, while the canonical HRF appears to be a suitablemodel in normal physiological conditions (Friston et al., 1995) and forIED-related BOLD signal changes (Lemieux et al., 2008), this has notbeen demonstrated for seizures. Flexible modelling methods havebeen used, such as those based on Fourier basis sets (Salek-Haddadiet al., 2006) or series of short blocks (Donaire et al., 2009; Tyvaertet al., 2009) addressing the potential complexity of ictal BOLD signalchanges but they do not address the issue of how best to model thesechanges based on the available scalp EEG.
Given that ictal EEG does not always reflect seizure onset (Binnieand Stefan, 1999) providing localising information in 13–92% ofpatients (Blume, 2001; Foldvary et al., 2001; Lee et al., 2005), datadriven analysis of fMRI (i.e. without modelling the EEG) may behelpful. Early ictal fMRI studies without EEG, found an increase inBOLD signal at, or in advance of seizure onset compared to baseline,within the presumed seizure onset zone (Detre et al., 1995; Federicoet al., 2005). Mathematically rigorous signal processing methodssuch as independent component analysis (ICA) applied to simulatedand interictal data, have demonstrated BOLD changes concordantwith the results of traditional EEG-derived fMRI modelling techni-ques (Levan and Gotman, 2008; Rodionov et al., 2007) opening a newavenue for the investigation of seizure-related fMRI changes (Levanet al., 2010).
The main objective of the current study was to explore the BOLDsignals related to epileptic seizures in a series of consecutive patientsawaiting intracranial EEG as part of their pre-surgical evaluation. Wechose to address the limitations of a single-block design GLM, by usingtwo, more flexible modelling approaches:
1. Partition of the seizures into three EEG-defined blocks eachconvolved with a canonical HRF.
2. Convolution with a Fourier basis set across the entire event for longseizures.
Table 1Clinical data.
Epilepsysyndrome
Semiology IEDs in scanner Ictal EEG in scanner
1 L FLE R foot paraesthesia,R hand and foot jerks
Bilat runs of sharptheta, maxamplitude in F3
1 event (50 s long):high amplitude sharprhythmic theta
2 R FLE L head and eye deviation,vocalization
Bi-F spike wavedischarge(Max: F4-C4)
Continuous bi-F rhythspike-wave dischargemax F4-C4
3 L FLE Loss of awareness,R upper limb jerking
L and R F sharpwaves and spikes
5 events (21, 32, 21, 2Rapid discharges L F (rhythmic bilateral slo
4 R FLE L sided jerks, face and arm R F theta (max C4) 4 events (111, 163, 14R F delta, rapid bilater(max F4-P4).
5 R PLE L foot sensory disturbance,L head version, vocalization
R F slowing(max F4)
2 events (28, 19 s lonactivity at F4-C4, rhytslowing max at F4-C4
6 R T-Pepilepsy
Blinking, rapid lossof awareness,vocalization
R P spikes andpolyspikes (T8-P8)
3 events (15, 12, 66 sR parietal fast, bilaterarhythmic discharge
7 R OLE Visual hallucination(colours), blinking, oralautomatisms
L T spikes (max F7).Bilateral post theta
1 event (87 s long): Bfollowed by rhythmic
8 R FLE L foot and arm clonic jerks R F spikes Multiple clinical ictalrelated to EEG
9 L TLE Ictal motor manifestation(inferred from myogenicartefact on EEG)
None 1 event (33 s long): FL then R T
Abbreviations: R=right, L=left, IZ=irritative zone, SOZ=seizure onset zone, T=TemporaPLE=parietal lobe epilepsy, FLE=frontal lobe epilepsy, Inf=inferior, Sup=superior, EEG=SMA=supplementary motor area.The ictal event durations are the sum of durations of early, clinical and late ictal phases.
Weused ICA combinedwith a component classifier (DeMartino et al,2007) to identify seizure related BOLD signal changes without referenceto the EEG.
The findings of the three analyses were comparedwith intracranialEEG data.
Materials and methods
Patients
Eighty-three patients with refractory focal epilepsy undergoingpre-surgical evaluation including intracranial EEG (icEEG) at fourcentres (National Hospital for Neurology and Neurosurgery, London,UK, Kings College Hospital, London, UK, Frenchay Hospital, NorthBristol NHS Trust, UK and Hopital de la Timone, Marseille, France)were studied. All procedures were subject to local Research andDevelopment directorate guidelines and National Research EthicsCommittee Approval in the UK and France.
Nine of the 83 patients had seizures during EEG-fMRI acquisition(determined by patient report, clinical observation and EEG). Eight ofnine had subsequent intracranial EEG recording to localise the seizureonset zone; in the remaining patient the procedure was abandonedowing to intra-operative complications.
Patients underwent scalp video-EEG telemetry, clinical andpsychological assessment along with 3T structural MRI according tothe standard Epilepsy Protocol used at the National Hospital forNeurology and Neurosurgery. Clinical data are summarised in Table 1.
EEG-fMRI acquisition
EEG channels (32 or 64) were recorded using a commercial MR-compatible system (BrainAmp MR and Vision Analyzer, Brain ProductsGMbH, Gilching, Germany) and ECG was recorded with a single lead.
StructuralMRI
Intracranial EEG Head movementsN1 mm, #/min/average/max
waves,FCD, L Sup Fgyrus
SOZ=IZ: L Sup Fgyrus
–
mics
R F atrophy SOZ=IZ: R pre-Fcortex, ACC, R SMA
2/1.44/1.5/1.58
5, 59 s long):max F3),wing
Left frontalgliosis (posttraumatic)
N/A 15/1.0/2.9/6.1
7, 165 s long):al spread
R F-T lesion:unclearaetiology
R Inf F Gyrus and SupT Gyrus
–
g): 30 Hzhmic
Normal SOZ=IZ: R post-centralgyrus
7/1.1/2.6/8.0
long):l
FCD inf R T,P and Olobes
SOZ: R Inf T and P –
link artefactbilateral delta
FCD R P andO lobes
SOZ: R O –
events not Normal SOZ: R medial F and P 3/1.7/3.9/5.6
ast activity: L T atrophy SOZ: L mesial T and T pole.Involvement of left lateralfrontal lobe
5/1.0/1.5/2.7
l, F=Frontal, O=Occipital, P=Parietal, Bi-F=Bifrontal, TLE=temporal lobe epilepsy,electroencephalogram, FCD=Focal cortical dysplasia, ACC=anterior cingulate cortex,
198 R.C. Thornton et al. / NeuroImage 53 (2010) 196–205
Two 20-min sessions of resting state EEG-fMRI were recorded. A third20-min session was recorded if tolerated. Each consisted of 404 T2*-weighted single-shot gradient-echo echo-planar images (EPI; TE/TR30/3000 ms, flip angle 90: 43 2.5 mm interleaved slices, FOV:24×24 cm2, matrix: 64×64) acquired continuously on a 3 T SignaExciteHDXMRI scanner (General Electric,Milwaukee,WI,USA). Furtherdetails are given elsewhere (Vulliemoz et al., 2009).
EEG pre-processing
MRI acquisition and pulse related artefact were removed offlinefrom the EEG trace recorded during scanning (Allen et al., 1998, 2000)using a commercial EEG processing package (Brain Analyzer, BrainProducts, Munich, Germany) and IED and seizures were coded by atleast two independent observers. Seizures were divided into threephases, each defined by an onset time and duration as follows:
• Early ictal phase, defined as the earliest observable change on EEG.This phase was not identified in patients in whom clinical featuresevolved simultaneously or in advance of EEG change.
• Clinical ictal phase, defined as the onset of myogenic artefact and/or clinical manifestation of the seizure.
• Late ictal phase, defined by onset of high amplitude low frequencychange following the seizure onset on EEG.
We identified three distinct phases in 5/9 patients (#1, 3, 4, 5, 9) andtwo phases in two patients (# 6, 7). A single phase was identifiable inpatient 2. In patient 8 the seizure could not bemodelled from the EEG asthe clinical events had no EEG correlate (see Table 2).
fMRI pre-processing and GLM analysis
After discarding the first four image volumes (T1 saturationeffects), the EPI time series were realigned, and spatially smoothedwith a cubic Gaussian Kernel of 8 mm full width at half maximum.fMRI time-series data were then analysed using a GLM to determinethe presence of regional IED-related BOLD changes.
Motion-related effects were included in the GLM as 24 regressors(six scan realignment parameters and a Volterra expansion of these;Friston et al., 1996). No dataset was discarded because of motion. Anadditional set of confound regressors was included to account forpulse-related signal changes (Liston et al., 2006).
Table 2GLM analyses.
Case Ictal phases usedfor modelling
Ictal canonical GLM
Early ictal EEG Clinical ictal EEG
1 Early/clinical/late R F Orb (+) R F Orb (+)
2 Complete seizures N/A N/A
3 Early/clinical/late L sup F gyrus (+) L middle F gyrus (−)
4 Early/clinical/late R Occ; bil mesial F (*),bi-phasic (neg–pos)
Bil mesial and lat F (+)
5 Early/clinical/late Diffuse, Maximal R mesialP (+)
Diffuse, Maximal R mesialP (−)
6 Clinical/late N/A R mesial pre-F cortex (+)7 Early/late Bil Occ; L more significant,
bi-phasic (neg–pos)NULL
8 Not modelled N/A N/A9 Early/clinical/late NULL NULL
All results were statistically significant after correction for multiple voxel comparisons (pbAbbreviations: R=right, L=left, FLE=frontal lobe epilepsy, TLE=Temporal lobe epiDMN=default mode network, Occ=occipital, Orb=orbital, sup=superior, inf=infercorresponding event observed on the EEG and (b) GLM using Fourier basis set was not used inis labelled as + (pos) and (−) (neg) for positive and negative BOLD signal changes in the
To characterise head movements for each dataset, inter-scanmotion data derived from the SPM scan-realignment process weresummarised as the minimum, maximum, average inter-scan dis-placement and the number of events in which head movementexceeded 1 mm (Table 1).
Two EEG-based modelling approaches were used:
Canonical HRFFor each seizure type, up to three phases (described above)
were included in the model as separate conditions to identifypatterns of BOLD change associated with each phase. Eachphase was represented by a block from onset to offset andconvolved with the canonical haemodynamic response functionand its temporal and dispersion derivatives, resulting in a totalof three separate regressors for each phase. In addition, BOLDsignal changes associated with IEDs were modelled (Salek-Haddadi et al., 2006). Two F contrasts were specified to assesssignificant BOLD changes:
1. Across all phases, allowing comparison with the results ofFourier basis set analysis.
2. Specific to each phase.
Effects were considered significant at a threshold of p=0.05 (Family-wise Error (FWE) correction for multiple comparisons).The direction of the BOLD changes for any given cluster wasdetermined by plotting the fitted response at the voxel withmaximal t-score within the cluster and observing the event-relatedBOLD response.Fourier Basis Set
In those cases (#1, 3, 4, 7 and 9) in whom seizures were longenough (longer than 3TR=9 s), we attempted to model inter-regional variations in the temporal evolution of the BOLD signalduring the seizure, using a model capable of capturing signalchanges of arbitrary shape arising consistently across events. Weused a Fourier basis set over a time window corresponding tothe longest period common to all seizures within a patient. Thenumber of Fourier basis functions was chosen according to theevent duration so that the model's temporal resolution wasconstant across cases and events, determined by the term withthe shortest wavelength which was set at 2TR (6 s). Events thatcould not be modelled using Fourier regressors, for example
Ictal Fourier basis set
Late ictal EEG All phases combined
L mid-T (−) L sup F gyrus (+) L sup F gyrus, L and Rinf T border, Th
N/A R F Orb, R mesial F (+),Th, DMN (−)
N/A
L Occ, Biphasic (− then +) L sup F gyrus; L post T,Th (−)
L inf F gyrus and L Par
R pre-central gyrus (−) R middle frontal gyrus,triphasic (pos–neg–pos)
NULL
Diffuse, Maximal R mesialP (+)
Diffuse, Maximal R mesialP (+)
N/A
NULL R mesial pre-F cortex (+) N/AN/A Bil Occ; L more significant,
bi-phasic (neg–pos)R T; L Occ
N/A N/A N/ANULL NULL NULL
0.05); except (*) pb0.001, uncorrected.lepsy, PLE=parietal lobe epilepsy, OLE=occipital lobe epilepsy, post=posterior,ior, T=Temporal, Th=Thalamus. N/A not applicable for the reasons that (a) nothese cases. NULL=no BOLD signal clusters on the SPM. The sign of the BOLD response
canonical GLM analysis. N/A=not applicable.
Table 4Concordance of GLM and ICA results with electro-clinical localisation.
Case(# events)
Canonical GLM FourierGLM
No of ICsspatiallyconcordantwith SOZ
All phases Early Clinical Late
1 (1) C+ D D D C+ 12 (N20) C n/a n/a n/a n/a 23 (5) C C C D C 1 (†)4 (4) D C (*) C D NULL 15 (2) C+ C+ C+ C+ n/a 26 (3) D n/a D NULL n/a 1 (†)7 (1) D* D* NULL n/a D* 18 (**) n/a n/a n/a n/a n/a 19 (1) NULL NULL NULL NULL NULL 1 (†)
(*): only significant at pb0.001, uncorrected. (†): not amongst the BOLD or EPIcomponents. (**): clinical event had no scalp EEG correlate. C=concordant with seizureonset zone on intracranial EEG. C+=clusters concordant with seizure onset zone, butadditional clusters were discordant. D=discordant with the seizure onset zone.
199R.C. Thornton et al. / NeuroImage 53 (2010) 196–205
those in which seizure length varied (see case 3), were includedin the model using the canonical HRF approach (above). A Fcontrast was used to assess ictal BOLD changes corresponding toany linear combination of the Fourier basis set functions,considered significant at pb0.05 (FWE) resulting in an SPM{F}map, which was compared with that obtained for the canonicalHRF model.For both the Canonical HRF and Fourier Basis Set approaches, theestimated time courses of event-related BOLD signal change wereplotted for the most significant cluster and the cluster nearest tothe seizure onset zone.
Comparison of the GLM results with intracranial dataIn case 3, comparison was only possible with non-invasive data.
In the other cases, patient-specific T1-weighted MRI scans were co-registered and fused with a post-operative CT with the sub-duralgrid or depth electrodes in situ (Engel, 2001). These fused imageswere co-registered with the SPM{F} to identify regions of BOLDsignal change in relation to the intracranial EEG. The degree ofconcordance of the GLM results was assessed based on the entirestatistical maps: these were classified as follows:
• Concordant (C), when all significant BOLD clusters were concor-dant with the site of seizure onset identified on intracranial EEG,provided that the area of maximal signal change was in the samegyrus and within 2 cm of the intracranial EEG electrode markingseizure onset , allowing for inaccuracies of co-registration andintra-operative brain shift (Nimsky et al., 2000)
• Concordant plus (C+) when the BOLD cluster containing theglobal statistical maximum was concordant but additional,discordant clusters were revealed
• Discordant (D), when no cluster was concordant.• NULL, when no significant activation was revealed (Table 4).
Independent component analysis (ICA)
Spatial ICA (Formisano et al., 2004; McKeown et al., 2003) asimplemented in Brain Voyager QX software (Brain Innovation,Maastricht, Netherlands) was performed on fMRI data to revealBOLD patterns specific to the seizure onset zone and to study the timecourse of the BOLD signal change.
In summary, the technique constrains the analysis to grey matterand uses a fixed point ICA algorithm to separate signals generatedby different sources (FastICA, Hyvärinen, 1999). Each fMRI datasetwas decomposed on 80 spatially independent components (IC)following our previous demonstration that BOLD classified compo-nents were stable at this level of decomposition (Rodionov et al.,2007). ICs were overlaid on each patient's T1-weighted image inTalairach space.
Table 3Results of ICA analysis.
Case Number ofBOLD IC
Number ofEPI IC
Number and classificationof ictal IC
Spatially similar toSOZ on icEEG?
1 13 25 1: BOLD Yes2 9 36 2: BOLD Yes3 3 20 1: motion N/A4 3 15 1: BOLD+motion Yes5 14 14 2: BOLD Yes6 11 33 1: SDN Yes7 3 36 1: EPI Yes8 3 22 1: BOLD Yes9 3 17 1: tHFN Yes
Abbreviations: SOZ=seizure onset zone; BOLD= blood oxygen level dependent signal;SDN=spatially distributed noise.
Classification of independent componentsAutomatic IC classification sorted the components into: (DeMartino
et al., 2007): (1) ‘BOLD’, including components which reflect normalphysiological resting and task related brain states (Mantini et al., 2007;Raichle et al., 2001; Schmithorst and Brown, 2004); (2) EPI-suscepti-bility artefacts; (3)motion artefacts; (4) physiological noise; (5)noise athigh spatial frequency; and (6) noise at temporal high frequency. Weobserved motion highly correlated with seizures in two patients (4 and7), resulting in components with features of N1 of the above types, andundertook a further decomposition into 160 components to attempt toseparate these components.
The classifier (Rodionov et al., 2007; De Martino et al., 2007) wasdesigned to be inclusive with respect to BOLD components to reducethe probability of misclassification of a BOLD-related IC. Componentsclassified as BOLD or EPI low-frequency drift artefact were inspectedby an observer blinded to the clinical data, and divided into. Threefurther subtypes according to their spatial pattern as follows:
1. Misclassified as BOLD (i.e. the spatial and temporal patternsuggested that the component should have been classified as noise).
2. Stereotypical of normal neuronal activity identified as known‘resting state networks’ (Beckmann and Smith, 2004; Mantini etal., 2007), visual, auditory, motor, sensory.
3. ‘Potentially epileptic’ (those exhibiting BOLD features, which donot fit 1 or 2).
Identification of ictal componentsThe fused images showing the intracranial electrodes were
transformed to Talairach Space and the ‘potentially epileptic’components identified using ICA were overlaid and reviewed toidentify ‘ictal components’, based on their spatial relationship to theseizure onset zone defined on icEEG. When no ictal IC was identified
Table 5Correlation between independent time course and EEG model used in GLM.
Case Early ictal phase Total model(all phases combined)
R P R P
1 0.170 0.000 0.230 0.0002 n/a n/a 0.141 0.0023 −0.474 0.000 −0.333 0.0004 −0.009 0.857 −0.077 0.1265 −0.123 0.014 −0.284 0.0006 −0.029 0.435 −0.083 0.3247 0.148 0.005 0.144 0.0048 n/a n/a n/a n/a9 −0.044 0.563 −0.325 0.000
R=correlation coefficient. P=probability. Figures are rounded to nearest 0.001. n/a=not applicable, where the stated model did not apply to this dataset (see main text).
201R.C. Thornton et al. / NeuroImage 53 (2010) 196–205
among these, ICs in the other classes (motion, noise) were reviewed(potential ictal ‘non-BOLD’ ICs).
Correlation of GLM with IC time coursesWe compared the EEG time course (as input to the GLM) with the
signal time course of ‘ictal components’ by calculating the correlationcoefficient between the EEG time course extracted from the fMRImodel following convolution with the canonical HRF and therespective ictal IC time course. We calculated the correlation betweenboth the ‘early ictal’ phase and the ‘total model’ across all phases (themost closely related to the seizure onset zone), and a representativeictal IC for each case.
Results
Nine of 83 patients had seizures during EEG-fMRI. Four had frontallobe epilepsy, two had temporal lobe epilepsy, one had parietal lobeepilepsy, one had occipital lobe epilepsy and one had a less well-defined posterior epilepsy. Between 1 and 5 seizures per patient wererecorded during EEG-fMRI. Clinical data are summarized in Table 1.The GLM and ICA analysis results are summarised below and inTables 2–5. Two representative cases are described (see Figs. 1 and 2).See supplementary web material for examples of the scalp EEG.
General Linear Model
See Table 2.
Canonical HRFSignificant BOLD signal changes were found in 7/9 cases using the
canonical GLM. In four cases (cases #1, 2, 3, 5), BOLD localisationacross all ictal phases was concordant with the seizure onset zone. Infive cases (#1, 3, 4, 5, 7), there were significant BOLD changes linkedto the early ictal EEG phase, which were concordant in three cases(#3–5). In 5/7 cases (#1, 3, 4, 5, 6), there were significant BOLD signalchanges linked to the clinical phase of the seizure, concordant withseizure onset zone in two of these (#3 and 5). In 4/7 cases (#1, 3, 4, 5)significant BOLD changes were observed in relation to the late ictalphase, one of which (#5) was concordant with the seizure onset zone.In two cases (#1 and 3), BOLD localisation was discordant for one orall individual phases but concordant when all phases were consideredtogether. In case 5, the region of IED-related BOLD signal change wasvery widespread, but the most significant region was concordant withthe onset and propagation of the seizure. In case #8, the ictal eventscould not be modelled in a GLM as the patient's seizures did notcorrelate with EEG change.
Fourier basis setThe Fourier basis set analysis showed significant BOLD signal
changes in three of the five cases analysed (#1, 3 and 7); and thedegree of concordance was the same as for the canonical HRF analysis.
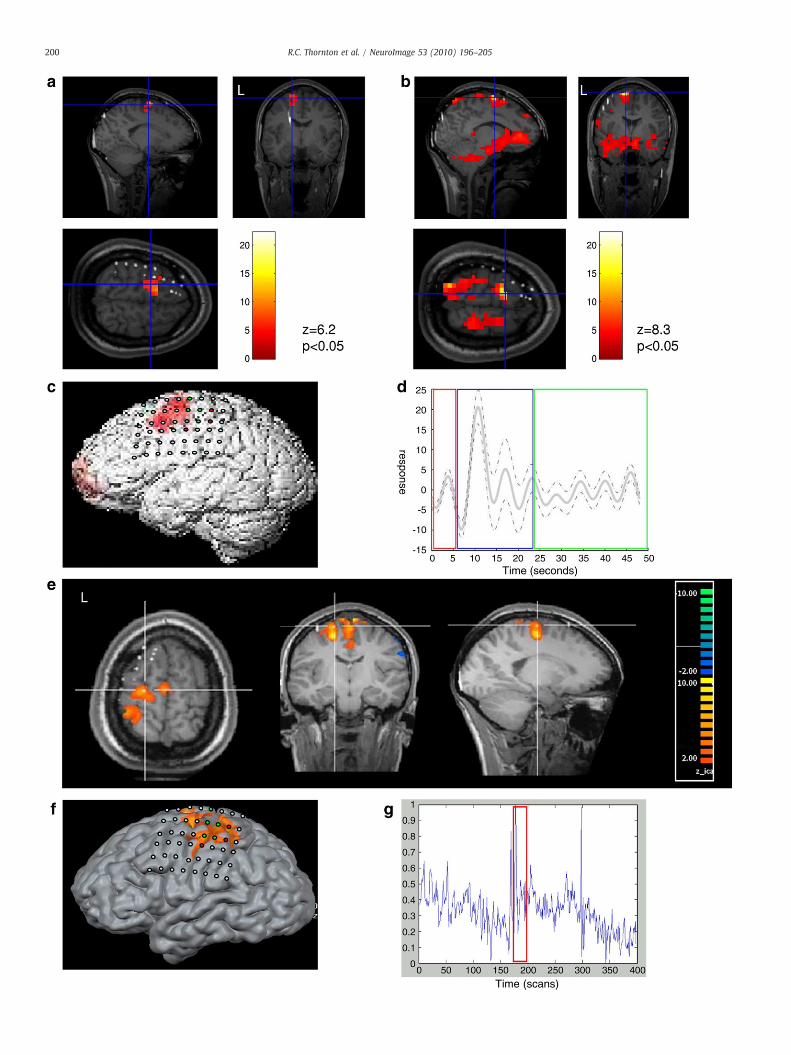
Fig. 1. Case 1: A 20-year-old female with left superior frontal gyrus focal cortical dysplasia. A sirhythmic theta in both fronto-temporal leads (early ictal phase),myogenic artefact (clinical phaover the left frontal and parietal lobes and 6-contact depth electrode recorded from the regionofcortex extending to involve the motor hand area. a) Results of canonical HRF GLM analysis oveacross all phases revealedmaximal BOLD changes in the left superior frontal gyrus and pre-centborders. Individual phase related BOLD signal changes seen on the SPM {F} were remote from tfusedwith a CT containing sub-dural electrodes: the seizure-related BOLD patternwas similar tothe canonical GLM seen in (a) overlaid on a surface rendering of the T1 weighted MRI illustratelectrodes positions from fused T1-CT images in individual were co-registeredwith the T1weigthe course of the seizure (red, blue and green boxes delineate early, clinical and late ictal phamaximal amplitude 11 s after electrographic onset (5 s after clinical onset). e)Results of ICA overclassified as ictal, with the largest cluster concordant with the seizure onset zone and additionacourse of the ICwas significantly correlatedwith the ‘early ictal’model (r=0.170, p=0.000), thwith the late ictal model (r=0.08, p=0.13). f) Time course of the component illustrated incomponent illustrated in (e) overlaid on a surface rendering of the T1-weighted MRI illustratelectrode positions from the fused T1-CT image were co-registered with the T1 weighted imag
In case 1, the global maximumwas concordant with the seizure onsetzone. In case #3, the most significant BOLD cluster was remote fromthe seizure onset but a smaller and less significant cluster wasconcordant with the structural lesion and presumed seizure onset. Incase #7, the results were discordant. The temporal pattern of the BOLDsignal revealed by the Fourier analysis varied between regions byshape and temporal delay of the high amplitude responses (see Fig. 1).
Independent component analysis
Table 3 summarizes the ICA results.The mean numbers of IC classified as BOLD and EPI per 20 min EEG-
fMRI run were 7 (range 3–14) and 24 (range 14–36) respectively. Overboth runs a mean of six ICs were characteristic of normal physiologicalactivity (Beckmann and Smith, 2004; Laufs et al., 2003) and a mean offour BOLD IC per data set identified as ‘potential epileptic components’.
Between one and two ICs spatially concordant with the seizureonset zone and classified as BOLD or EPI were observed in 5/9 cases.An IC spatially concordant with the seizure onset zone and classifiedas mixed BOLD/motion was observed in one case. In the remainingcases, at least one IC not classified as BOLD or EPI were observedspatially concordant with the seizure onset zone. In 8/9 cases,localisation was confirmed on intracranial data.
Correlation of GLM and IC time coursesSee Table 5 for a summary of the results. In five cases (#1, 2, 3, 5
and 7), the early ictal phase and/or total model (i.e. the {SPM-F}across all phases) was significantly (pb0.001) correlated withidentified ‘ictal’ or ‘potentially ictal non-BOLD’ components. TheGLM model was most highly (rN0.2, pb0.001) correlated in cases #1,3 and 5. In the remaining cases no phase of the EEG time course wassignificantly correlated with any ictal component. The ‘late phase’ and‘clinical phase’ of the EEG were not significantly correlated with anyictal component in all but one (case #5) cases.
Discussion
Using three different methods of ictal EEG-fMRI analysis wedemonstrated:
• When the scalp EEG indicated the seizure onset, GLMs based onboth the canonical HRF and Fourier basis set revealed patterns ofictal BOLD signal change concordant with the seizure onset zoneon intracranial EEG.
• Although the yield of EEG-basedGLManalysiswas high, therewerea number of cases in whom the EEG did not reflect the temporalevolutionof seizures (#4, 6, 8 and9) and these didnot demonstrateconcordant BOLD signal change, illustrating the limitations ofrelying on a scalp-EEG derived model in ictal fMRI data.
• ICA identified spatially independent components, concordant withthe seizure onset zone in all cases.
ngle motor seizure of 48-s duration was recorded during EEG-fMRI. Ictal EEG consisted ofse), and high amplitude delta (late ictal phase). Intracranial EEG (48 contact sub-dural gridcortical dysplasia in the superior frontal gyrus) showed seizure onsetwithin thedysplasticrlaid on T1-weighted MRI fused with a CT containing sub-dural electrodes: the F contrastral gyrus (pb0.05 FWE corrected), with further significant clusters at the inferior temporalhe seizure onset. b) Results of Fourier basis set GLM analysis overlaid on T1-weightedMRIthat obtained for the canonical HRF across all phases butwasmore extensive. c) Results ofing the relationship of the BOLD signal change to the sub-dural electrodes. The sub-duralhted image presented here for illustration. d) Time course of the BOLD signal change overses respectively).The time course for the cluster containing the global maximum reachedlaidonT1-weightedMRI fusedwith aCT containing sub-dural electrodes: one BOLD ICwasl, smaller clusters in the ipsilateral temporal lobe and contra-lateral frontal lobe. The timee clinical (r=0.21, p=0.000) and the totalmodel (r=0.230,p=0.000), but not correlatede) over the whole recording with the seizure indicated by the red box. g) Independenting the relationship of the ictal onset zone and the component of interest. The sub-durale presented here for illustration.
203R.C. Thornton et al. / NeuroImage 53 (2010) 196–205
• When the scalp EEG accurately reflected seizure onset, the indepen-dent components were temporally correlated with the EEG model.
• Automatic classification identified BOLD or EPI componentsconcordant with the seizure onset zone defined by intracranialEEG in 6/9 cases.
Methodological considerations
EEG-based GLMThe canonical GLM strategy assumes that BOLD signal changes
follow a block-like time course at any voxel with a delay imposed bythe canonical HRF (Friston et al., 1995). This has been used to revealBOLD changes related to IED (Salek-Haddadi et al., 2006). Our three-phase model, based on the observation that in many cases ictal EEGstarts from baseline, evolves in amplitude and frequency as theepileptic network is recruited and terminates with post-ictal slowing(Niedermeyer, 1999) allows for the evolution of haemodynamicchanges between phases. Although this is not a perfect representationof the underlying neuronal activity (Binnie and Stefan, 1999), wesuggest that this provides a more physiologically informed modelthan either representing seizures as one continuous block or a seriesof short epochs of uniform length (Donaire et al., 2009; Tyvaert et al.,2009). The degree of concordance observed using this strategy wasgreatest for the early ictal phase and for the combined phases, than foreither the clinical or late ictal phases, which is unsurprising given thatseizure activity begins in one region and propagates to local andremotely connected cerebral areas.
The discrepancy between phase specific concordance and theconcordance across all phases observed in two cases (#1 and 4)demonstrates that the SPM{F} for the combined map is based on theweighted sum of the individual effects, addressing the question “atwhich voxels do any linear combination (i.e. weighted sum) of theindividual phases correlate with the signal?” in contrast to the phasespecific SPM{F} which addresses the question “at which voxels doesthe block representing the phase correlate with the signal?”. Giventhat our concordance criteria are based on the entire map and theglobal maximum, it is possible that a strong specific phase-relatedeffect at one location does not match the combined effect of the threephases at another location.
The use of the Fourier basis set of regressors allows for wideinter-regional variation in time course reflecting the complexity ofictal haemodynamics. We restricted this approach to the longestictal epoch N3TR common to each patient, to detect consistent,meaningful evolving patterns, given the temporal resolution of thetechnique.
In cases with multiple seizures our approach was designed toidentify consistent patterns across events within each subject givenconsistent electrophysiological features across repeated seizures(Wendling et al., 1996), which increases statistical power.
Independent component analysisICA is limited by the large number of components generated,
resulting in low specificity, which was addressed by the use of an
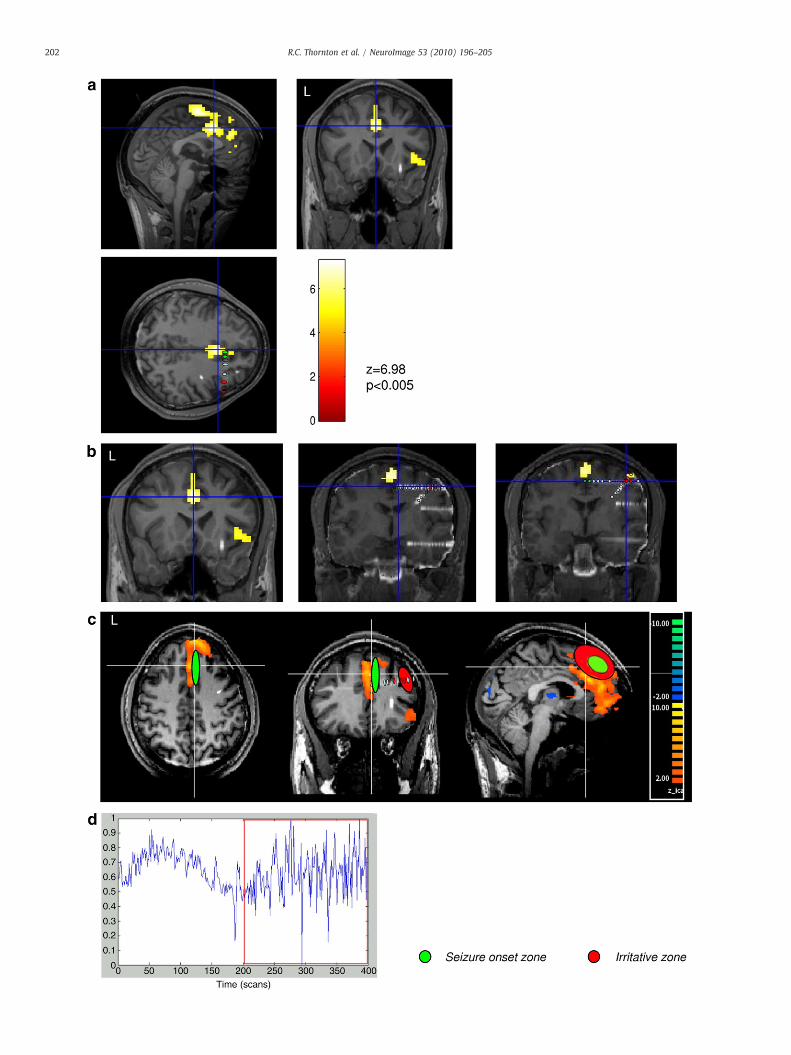
Fig. 2. Case 2: A 24-year-old male with right frontal cortical atrophy. Electrographic seizupredominant bi-frontal spike/wave discharges. Intracranial EEG: eight depth electrodes inelectrodes (medial/lateral contacts): #1: orbito-frontal antero-medial/orbito-frontal later(pars opercularis); #4: insula/fronto-opercular (pars orbicularis); # 5: supplementary mhemisphere: anterior cingulate gyrus/dorso-lateral prefrontal. Two oblique electrodes: #8dorso-lateral-premotor. Seizure onset was observed in the mesial contacts of electrode 1 andinvolving the supplementary motor area (electrode 5). a) Results of Canonical HRF GLM analychanges correlated with continuous spike-wave discharges were maximal in areas concordz=6.98 pb0.05, FWE (family wise error corrected for multiple comparisons). b) Results of CEEG. Contacts involved in seizure onset marked in green. Contacts in the irritative zone maweighted MRI fused with CT with intracranial electrodes, green ellipse indicates seizure onslower frequency and higher amplitude of the BOLD signal, observed during the ictal epochs (mmodel (r=0.141, p=0.002).
automatic component classification scheme (De Martino et al., 2007)to reduce the number of candidate ‘epileptic components’. In this studywe considered the temporal characteristics of interictal and ictalevents and therefore included components classified as EPI artefacts,to account for potential low-frequency ictal BOLD signal changes(Federico et al., 2005; Tyvaert et al., 2008) and inspected all ICsspatially concordant with the seizure onset zone. This method differsfrom the approach of fitting an HRF to component time courses (Levanet al., 2010).
In 4/9patients (#3, 4, 6 and 9) ‘ictal components’were not identifiedwithin the BOLD/EPI class, so wemade a secondary decomposition into160 components. In two patients (cases #4 and 7) in whom the EEG-fMRI recordings were contaminated by motion highly correlated withseizures, this resulted in the identification of further componentsclassified as mixed BOLD and motion which were spatially concordantwith the seizure onset zone. This demonstrates potential for ICA inanalysing datasets contaminated by constant low amplitude motion,which causes difficulty in conventional fMRI data.
We expected to find ‘BOLD’ components with a spatial patterninvolving sub-cortical structures (Federico et al., 2005; Levan et al.,2010; Tyvaert et al., 2008), but none were observed. This may bebecause the classifier was trained for the cortex and sub-corticalcomponents are generally smaller in size, so the degree ofclustering on which ICA depends may not be comparable(Formisano, 2009).
Motion
The observed motion varied between 0 and 8 mm (see Table 1).There was no apparent relationship between the amount of motionand degree of concordance of the GLM maps. The pattern of BOLDsignal clusters observed on the combined phase SPM(F) was nottypical of motion effects. In case #5 there was widespread BOLD signalchange maximal at the seizure onset zone, which we hypothesise wasdue to focal seizure related effects added to spatially uniform motionrelated effects, consistent with previous reports of ‘widespreadintense BOLD signal change’ in ictal fMRI (Kobayashi et al., 2006;Salek-Haddadi et al., 2002).
Neurophysiological significance
GLMAll four cases (#1, 2, 3 and 5) who had significant BOLD signal
change concordant with the seizure onset zone had neocorticalepilepsy and the earliest scalp EEG change was easily identified. In thethree cases in whom icEEG was obtained the icEEG seizure onset wasaccurately reflected by the scalp EEG.
The lower degree of concordance than in previously publishedstudies (Tyvaert et al., 2008) may reflect the fact that we analysedconsecutive data sets in a cohort undergoing intracranial EEG, inwhom scalp EEG was often not localising, restricting its value as amarker of neuronal activity on which to model fMRI data.
res were recorded during scanning consisting of prolonged continuous runs of rightthe right hemisphere and one in the left, each with 15 contacts. Seven orthogonal
al; #2: anterior cingulate gyrus/dorso-lateral prefrontal; #3: insula/fronto-opercularotor area/dorsal premotor cortex; #6: amygdala/middle temporal gyrus; #7: left: right orbito-frontal postero-medial/fronto-polar; #9: right dorsomedian thalamus/8 in mesial pre-frontal cortex concordant with the less significant BOLD cluster, rapidlysis overlaid on T1 weightedMRI fused with CTwith intracranial electrodes: BOLD signalant with the seizure onset zone with additional right lateral frontal clusters. SPM{T},anonical HRF GLM analysis showing relationship of BOLD signal change to intracranialrked in red. c) Results of ICA: Independent BOLD classified component overlaid on T1et zone from icEEG. d) Time-course of the independent component shown in (c). Notearked by red boxes). The time course of the ICwas significantly correlatedwith the EEG
204 R.C. Thornton et al. / NeuroImage 53 (2010) 196–205
The lack of concordant ictal related BOLD signal in specific casescan be explained by region specific signal to noise ratio (case #9) orinsensitivity of the scalp EEG to seizure onset (#4, 6 and 7). In case #3a BOLD signal cluster posterior to the presumed site of seizure onset(left middle frontal gyrus and left superior temporal gyrus) wasconcordant with a left fronto-temporal IC which exhibited haemody-namic activity time-locked to ictal events on EEG. This cluster mostlikely represented propagation of the seizure, revealed by Fouriermodel. Similarly in case #7 the most significant cluster correspondedto a region of rapid seizure propagation on icEEG.
Clinical and late ictal phasesBOLD signal change concordant with seizure onset was observed
mostly in relation to early ictal change or the whole seizure, althoughpatterns suggestive of seizure propagation were observed in cases 3and 6. We did not observe this in other cases as we compared eachseizure phase with the baseline, rather than comparing BOLD signalchange across phases (Donaire et al., 2009; Tyvaert et al., 2009).
BOLD decreasesIctal-related BOLD decreases were observed, usually remote from
the seizure onset zone or in regions reflecting the so-called DefaultMode Network (DMN) (Raichle et al., 2001). BOLD decreases havepreviously been reported in the DMN related to IEDs in temporal lobeepilepsy (Laufs et al., 2006) and generalised epilepsy (Archer et al.,2003; Hamandi et al., 2006) and are thought to reflect suspension of theresting state related to epileptic activity. Cases #1, 2 and 5 had mesialneo-cortical seizures with rapid EEG propagation, and BOLD decreasesin the thalamus or basal ganglia. This is in keeping with involvement ofthese structures in seizures (Moeller et al., 2008; Steriade et al., 1991;Vaudano et al., 2009). BOLD decreases were observed in relation to thelate ictal phase in three cases, suggesting a cerebral perfusion/metabolicdemandmismatch resulting in sustained tissue hypoxia adjacent to theseizure focus despite hyperoxygenation following the ‘initial dip’withinthe focus (Zhao et al., 2009).
ICAWe identified ICs spatially concordant with the seizure onset zone
in all cases. We hypothesise that the observed discrepancies betweenictal IC and GLM derived maps result from the following:
1. Spatial smoothing was applied to data processed with the GLM,but not ICA.
2. The two approaches are fundamentally different; GLM is restrictedby the occurrence of EEG events whereas ICA results from theseparation of signals.
Our findings of ICs spatially concordant with the seizure onsetzone, complement a recent study in which spatially concordant ICswere identified in patients in whom a GLM analysis had previouslyrevealed seizure-related changes (Levan et al., 2010). We haveextended the ICA approach by applying it to all cases regardless ofthe GLM approach and used the gold standard of icEEG for validationrather than the HRF. There was no consistent temporal relationshipbetween seizures and component time courses, but in most caseswhere the time course of the EEG and IC were correlated the patientshad neocortical epilepsy and the scalp EEG accurately reflected theseizure recorded on icEEG. In case #7, although the GLM result wasdiscordant with the SOZ, there was rapid seizure propagation to theregion of BOLD signal change, which may explain the temporalcorrelation observed between the ictal component and the ‘discor-dant’ GLM result. This is supported by the observation that thetemporal resolution of fMRI means that areas of IED and ictal onsetand propagationmay be seen in the same SPM (Vulliemoz et al., 2009;Tyvaert et al., 2009).
In cases in whom the ictal ICs were not significantly correlatedwith the seizure model, the seizure onset recorded on icEEG was
always in regions not well reflected on the scalp (insular cortex,basal temporal, mesial frontal and mesial temporal) resulting in thescalp EEG-based model being sub-optimal (Federico et al., 2005;Suh et al., 2006; Van Quyen et al., 2001; Zhao et al., 2007). Inaddition, neurovascular coupling may vary in ictal events (Zhao etal., 2009; Salek-Haddadi et al., 2006). Inferences on the nature ofthe discrepancies between EEG onset and fMRI change beyondthose accounted for by variation in HRF (Donaire et al., 2009;Tyvaert et al., 2009) are limited in the absence of an accuratemeasure of the event (e.g. simultaneous icEEG).
Clinical relevance
EEG-fMRI can provide additional information about the haemo-dynamics of the ictal onset zone in patients undergoing pre-surgicalevaluation even in the presence of large amount of head motion. Thetechnique is unrestricted by the limited sampling and invasive natureof intracranial EEG (Engel et al., 1990), allowing seizure-relatedhaemodynamic changes to be observed throughout the brain. ICA wasable to demonstrate spatially independent patterns concordant withseizure onset at a sub-lobar level in the majority of patients.
Although this suggests a possible role for ICA of fMRI in planningicEEG, the practicality of this approach is highly dependent on thenumber of components identified as potentially epileptic. The fact thatthe observed IC time courses only partially reflected the ictal changeson scalp EEG suggests that this non-invasive methodology can be asource of additional information, but also highlights uncertaintyregarding the nature of the components, which requires furtherinvestigation. Thismay require refinement of the component classifierin particular addressing its specificity for ictal data. In addition to this,work should now focus on combining the EEG-informed and data-driven approaches to ictal fMRI to glean maximum information fromthis unique and rich data.
Conclusions
The analysis and interpretation of fMRI data acquired duringseizures with concurrent EEG requires careful consideration in view ofthe limited ability of scalp EEG to model seizures and our limitedknowledge of ictal haemodynamics. EEG-based models are successfulin revealing significant BOLD changes in some cases, but the numberof seizures captured and the location of the seizure onset zone have asignificant impact on the results. When a GLM is not helpful, ICA canprovide valuable information regarding the seizure onset zone,revealing complex patterns of signal change extending well beyondthe events as seen on scalp EEG, raising new questions regarding thehaemodynamics of seizures.
Acknowledgments
This work was undertaken at UCLH/UCL who received aproportion of funding from the Department of Health's NIHRBiomedical Research Centres funding scheme and supported by agrant from the UK Medical Research Council no. G0301067. We aregrateful to the Big Lottery Fund, Wolfson Trust and National Societyfor Epilepsy for supporting the NSE MRI scanner.
HL was supported by the Deutsche Forschungsgemeinschaft (LA1452/3-1) and the Bundesministerium für Bildung und Forschun. SVwassupported by the “Fonds de Perfectionnement” of the University Hospitalof Geneva, Switzerland. JD receives funding from the Wellcome Trust(067176) and theMedical ResearchCouncil (G9805089) and theNationalSociety for Epilepsy. We thank Philippa Bartlett, Jane Burdett, ElaineWilliamsandUmairChaudhary forhelpwith scanningandall thepatientswho participated in the study. Thanks to Professor Elia Formisano PhD, ofMaastricht University, for his support.
205R.C. Thornton et al. / NeuroImage 53 (2010) 196–205
Appendix A. Supplementary data
Supplementary data associated with this article can be found, inthe online version, at doi:10.1016/j.neuroimage.2010.05.064.
References
Al Asmi, A., Benar, C.G., Gross, D.W., Khani, Y.A., Andermann, F., Pike, B., Dubeau, F.,Gotman, J., 2003. fMRI activation in continuous and spike-triggered EEG-fMRIstudies of epileptic spikes. Epilepsia 44, 1328–1339.
Allen, P.J., Polizzi, G., Krakow, K., Fish, D.R., Lemieux, L., 1998. Identification of EEGevents in the MR scanner: the problem of pulse artifact and a method for itssubtraction. NeuroImage 8, 229–239.
Allen, P.J., Josephs, O., Turner, R., 2000. A method for removing imaging artifact fromcontinuous EEG recorded during functional MRI. NeuroImage 12, 230–239.
Archer, J.S., Abbott, D.F., Waites, A.B., Jackson, G.D., 2003. fMRI “deactivation” of theposterior cingulate during generalized spike and wave. NeuroImage 20, 1915–1922.
Beckmann, C.F., Smith, S.M., 2004. Probabilistic independent component analysis forfunctional magnetic resonance imaging. IEEE Trans. Med. Imaging 23, 137–152.
Benar, C.G., Grova, C., Kobayashi, E., Bagshaw, A.P., Aghakhani, Y., Dubeau, F., Gotman, J.,2006. EEG-fMRI of epileptic spikes: concordance with EEG source localization andintracranial EEG. NeuroImage 30, 1161–1170.
Binnie, C.D., Stefan, H., 1999. Modern electroencephalography: its role in epilepsymanagement. Clin. Neurophysiol. 110, 1671–1697.
Blume, W.T., 2001. Current trends in electroencephalography. Curr. Opin. Neurol. 14,193–197.
De Martino, F., Gentile, F., Esposito, F., Balsi, M., Di Salle, F., Goebel, R., Formisano, E.,2007. Classification of fMRI independent components using IC-fingerprints andsupport vector machine classifiers. NeuroImage 34, 177–194.
Detre, J.A., Sirven, J.I., Alsop, D.C., O'Connor, M.J., French, J.A., 1995. Localization ofsubclinical ictal activity by functional magnetic resonance imaging: correlationwith invasive monitoring. Ann. Neurol. 38, 618–624.
Donaire, A., Bargallo, N., Falcon, C., Maestro, I., Carreno,M., Setoain, J., Rumia, J., Fernandez,S., Pintor, L., Boget, T., 2009. Identifying the structures involved in seizure generationusing sequential analysis of ictal-fMRI data. NeuroImage 47, 173–183.
Engel, J., 2001. A proposed diagnostic scheme for people with epileptic seizures andwith epilepsy: report of the ILAE Task Force on Classification and Terminology.Epilepsia 42, 796–803.
Engel Jr., J., Henry, T.R., Risinger, M.W., Mazziotta, J.C., Sutherling, W.W., Levesque, M.F.,Phelps, M.E., 1990. Presurgical evaluation for partial epilepsy: relative contribu-tions of chronic depth-electrode recordings versus FDG-PET and scalp-sphenoidalictal EEG. Neurology 40, 1670.
Federico, P., Abbott, D.F., Briellmann, R.S., Harvey, A.S., Jackson, G.D., 2005. FunctionalMRI of the pre-ictal state. Brain 128, 1811–1817.
Foldvary, N., Klem, G., Hammel, J., Bingaman, W., Najm, I., Luders, H., 2001. Thelocalizing value of ictal EEG in focal epilepsy. Neurology 57, 2022–2028.
Formisano, E., 2009. Personal Communication.Formisano, E., Esposito, F., Di Salle, F., Goebel, R., 2004. Cortex-based independent
component analysis of fMRI time series. Magn. Reson. Imaging 22, 1493–1504.Friston, K.J., Frith, C.D., Frackowiak, R.S.J., Turner, R., 1995. Characterizing dynamic brain
responses with fMRI: a multivariate approach. NeuroImage 2, 166–172.Friston, K.J., Williams, S., Howard, R., Frackowiak, R.S., Turner, R., 1996. Movement-
related effects in fMRI time-series. Magn. Reson. Med. 35, 346–355.Hamandi, K., Salek-Haddadi, A., Laufs, H., Liston, A., Friston, K., Fish, D.R., Duncan, J.S.,
Lemieux, L., 2006. EEG-fMRI of idiopathic and secondarily generalized epilepsies.NeuroImage 31, 1700–1710.
Kobayashi, E., Hawco, C.S., Grova, C., Dubeau, F., Gotman, J., 2006.Widespread and intenseBOLD changes during brief focal electrographic seizures. Neurology 66, 1049–1055.
Laufs, H., Krakow, K., Sterzer, P., Eger, E., Beyerle, A., Salek-Haddadi, A., Kleinschmidt, A.,2003. Electroencephalographic signatures of attentional and cognitive defaultmodes in spontaneous brain activity fluctuations at rest. Proc. Natl. Acad. Sci. U. S. A.100, 11053–11058.
Laufs, H., Hamandi, K., Salek-Haddadi, A., Kleinschmidt, A.K., Duncan, J.S., Lemieux, L.,2006. Temporal lobe interictal epileptic discharges affect cerebral activity in“default mode” brain regions. Hum. Brain Mapp.
Lazeyras, F., Blanke, O., Perrig, S., Zimine, I., Golay, X., Delavelle, J., Michel, C.M., deTribolet, N., Villemure, J.G., Seeck, M., 2000. EEG-triggered functional MRI inpatients with pharmacoresistant epilepsy. J. Magn. Reson. Imaging 12, 177–185.
Lee, S.K., Lee, S.Y., Kim, K.K., Hong, K.S., Lee, D.S., Chung, C.K., 2005. Surgical outcome andprognostic factors of cryptogenic neocortical epilepsy. Ann. Neurol. 58, 525–532.
Lemieux, L., Laufs, H., Carmichael, D., Paul, J.S., Walker, M.C., Duncan, J.S., 2008.Noncanonical spike-related BOLD responses in focal epilepsy. Hum. BrainMapp. 29,329–345.
Levan, P., Gotman, J., 2008. Independent component analysis as a model-free approachfor the detection of BOLD changes related to epileptic spikes: a simulation study.Hum. Brain Mapp. 7, 2021–2031.
Levan, P., Tyvaert, L., Moeller, F., Gotman, J., 2010. Independent component analysisreveals dynamic ictal BOLD responses in EEG-fMRI data from focal epilepsypatients. NeuroImage 49, 366–378.
Liston, A.D., Lund, T.E., Salek-Haddadi, A., Hamandi, K., Friston, K.J., Lemieux, L., 2006.Modelling cardiac signal as a confound in EEG-fMRI and its application in focalepilepsy studies. NeuroImage 30, 827–834.
Mantini, D., Perrucci, M.G., Del Gratta, C., Romani, G.L., Corbetta, M., 2007. Electrophys-iological signatures of resting state networks in the human brain. Proc. Natl. Acad. Sci.104, 13170–13175.
McKeown, M.J., Hansen, L.K., Sejnowsk, T.J., 2003. Independent component analysisof functional MRI: what is signal and what is noise? Curr. Opin. Neurobiol. 13,620–629.
Moeller, F., Siebner, H.R., Wolff, S., Muhle, H., Boor, R., Granert, O., Jansen, O., Stephani,U., Siniatchkin, M., 2008. Changes in activity of striato-thalamo-cortical networkprecede generalized spike wave discharges. NeuroImage 39, 1839–1849.
Niedermeyer, E., 1999. Abnormal EEG patterns: epileptic and paroxysmal, In:Niedermeyer, E., Lopes da Silva, F.H. (Eds.), Electroencephalography: BasicPrinciples, Clinical Applications and Related Fields, 4 ed. Lippincott Williams andWilkins, Baltimore, pp. 235–260.
Nimsky, C., Ganslandt, O., Cerny, S., Hastreiter, P., Greiner, G., Fahlbusch, R., 2000.Quantification of, visualization of, and compensation for brain shift usingintraoperative magnetic resonance imaging. Neurosurgery 47, 1070–1079.
Raichle, M.E., MacLeod, A.M., Snyder, A.Z., Powers, W.J., Gusnard, D.A., Shulman, G.L.,2001. Inaugural article: a default mode of brain function. Proc. Natl. Acad. Sci. 98,676–682.
Rodionov, R., De Martino, F., Laufs, H., Carmichael, D.W., Formisano, E., Walker, M.,Duncan, J.S., Lemieux, L., 2007. Independent component analysis of interictal fMRIin focal epilepsy: comparison with general linear model-based EEG-correlatedfMRI. NeuroImage 38, 488–500.
Salek-Haddadi, A., Merschhemke, M., Lemieux, L., Fish, D.R., 2002. Simultaneous EEG-correlated ictal fMRI. NeuroImage 16, 32–40.
Salek-Haddadi, A., Diehl, B., Hamandi, K., Merschhemke, M., Liston, A., Friston, K.,Duncan, J.S., Fish, D.R., Lemieux, L., 2006. Hemodynamic correlates of epileptiformdischarges: an EEG-fMRI study of 63 patients with focal epilepsy. Brain Res. 1088,148–166.
Schmithorst, V.J., Brown, R.D., 2004. Empirical validation of the triple-code model ofnumerical processing for complex math operations using functional MRI and groupIndependent Component Analysis of the mental addition and subtraction offractions. NeuroImage 22, 1414–1420.
Seeck, M., Lazeyras, F., Michel, C.M., Blanke, O., Gericke, C.A., Ives, J., Delavelle, J., Golay,X., Haenggeli, C.A., de Tribolet, N., Landis, T., 1998. Non-invasive epileptic focuslocalization using EEG-triggered functional MRI and electromagnetic tomography.Electroencephalogr. Clin. Neurophysiol. 106, 508–512.
Steriade, M., Dossi, R.C., Nunez, A., 1991. Network modulation of a slow intrinsicoscillation of cat thalamocortical neurons implicated in sleep delta waves:cortically induced synchronization and brainstem cholinergic suppression. J.Neurosci. 11, 3200–3217.
Suh, M., Ma, H., Zhao, M., Sharif, S., Schwartz, T.H., 2006. Neurovascular coupling andoximetry during epileptic events. Mol. Neurobiol. 33, 181–197.
Tyvaert, L., Hawco, C., Kobayashi, E., Levan, P., Dubeau, F., Gotman, J., 2008. Differentstructures involved during ictal and interictal epileptic activity in malformations ofcortical development: an EEG-fMRI study. Brain 131, 2042–2060.
Tyvaert, L., Levan, P., Dubeau, F., Gotman, J., 2009. Noninvasive dynamic imaging ofseizures in epileptic patients. Hum. Brain Mapp. 12, 3993–4011.
Van Quyen, M., Martinerie, J., Navarro, V., Boon, P., D'Havθ, M., Adam, C., Renault, B.,Varela, F., Baulac, M., 2001. Anticipation of epileptic seizures from standard EEGrecordings. Lancet 357, 183–188.
Vaudano, A.E., Laufs, H., Kiebel, S.J., Carmichael, D.W., Hamandi, K., Guye, M., Thornton,R., Rodionov, R., Friston, K.J., Duncan, J.S., Lemieux, L., 2009. Causal hierarchy withinthe thalamo-cortical network in spike and wave discharges. PLoS ONE 4, e6475.
Vulliemoz, S., Thornton, R., Rodionov, R., Carmichael, D.W., Guye, M., Lhatoo, S., McEvoy,A.W., Spinelli, L., Michel, C.M., Duncan, J.S., Lemieux, L., 2009. The spatio-temporalmapping of epileptic networks: combination of EEG-fMRI and EEG source imaging.NeuroImage 46, 834–843.
Wendling, F., Bellanger, J.J., Badier, J.M., Coatrieux, J.L., 1996. Extraction of spatio-temporal signatures from depth EEG seizure signals based on objective matching inwarped vectorial observations. IEEE Trans. Biomed. Eng. 43, 990–1000.
Zhao, M., Suh, M., Ma, H., Perry, C., Geneslaw, A., Schwartz, T.H., 2007. Focal increases inperfusion and decreases in hemoglobin oxygenation precede seizure onset inspontaneous human epilepsy. Epilepsia 48, 2059–2067.
Zhao, M., Ma, H., Suh, M., Schwartz, T.H., 2009. Spatiotemporal dynamics of perfusionand oximetry during ictal discharges in the rat neocortex. J. Neurosci. 29,2814–2823.

![WONOEP appraisal: Imaging biomarkers in epilepsy...recent advances in identifying the irritative zone (e.g., scalp and intracranial electroencephalography–functional MRI [EEG-fMRI])](https://img.pdfslide.us/doc/110x75/6055314f35bedc66711e5aef/wonoep-appraisal-imaging-biomarkers-in-epilepsy-recent-advances-in-identifying.jpg)
![Visualization of intracranial EEG data · visualization [4]. Before the description of visualization methods, some ideas about the signal are given. 2.1 Characteristics of EEG Data](https://img.pdfslide.us/doc/110x75/5fda3913f2bf4848cc0e8236/visualization-of-intracranial-eeg-visualization-4-before-the-description-of-visualization.jpg)


![NoninvasiveApproachtoFocalCorticalDysplasias: Clinical,EEG ...2]_Paper_Seifer.pdf · 2 Epilepsy Research and Treatment gold-standard method to define the EZ is the intracranial recording,](https://img.pdfslide.us/doc/110x75/5f7600506226d836fe601362/noninvasiveapproachtofocalcorticaldysplasias-clinicaleeg-2paper-2-epilepsy.jpg)