Embed Size (px)
Citation preview

Solutions, products and news from Matrox Imaging
The Vision Squad Files:Use MIL’s GMF masks
Anatomy of a smart camera:Matrox Iris GTIMAGING
INSIGHT Case Study : The separation of salt and earth
Vol. 10 No. 1
The Smart Camera Renaissance

ContentsIMAGING INSIGHT Vol. 10 No. 1
VP’s Commentary . . . . . . . . . . . . . . . . . . . . . . . . . . . . . . . . . . . . 03
Vice President of Sales & Marketing François Bertrand focuses on the
light at the end of the economic tunnel
Featured Product: Matrox Iris GT . . . . . . . . . . . . . . . . . . . 04
Experience the smart camera renaissance
Product News: Matrox Supersight . . . . . . . . . . . . . . . . . . 06
Meet the biggest brother in the Matrox 4Sight family
Case Study: Salt Sorter by Winn Hardin . . . . . . . . . . . 07
Linescan camera-based machine-vision system images
falling salt and enables contaminant removal
Case Study: Novartis . . . . . . . . . . . . . . . . . . . . . . . . . . . . . . . . 10
Automated microscopy system uses MIL to detect chromosomal
abnormalities in cells
The Vision Squad Files . . . . . . . . . . . . . . . . . . . . . . . . . . . . . . 13
How to effectively use MIL GMF masks
Trade Show Calendar
IFSEC
Birmingham, UK
May 11-14, 2009
Visit Matrox Imaging on the road!For tickets or more info, contact Joanna Puccio: jpuccio@matrox .com .
07
10
2009 International Robots, Vision & Motion Control Show and ConferenceChicago, USAJune 9-11, 2009
04
06

03
During a recent visit, a customer commented to us: “in our market, this is a very long winter” . Unfortunately, for a certain segment of our customer base, this is a reality; the economy is in a state of hibernation, and it’s on the news every day .
In a recession, there are tough choices to make . Matrox Imaging’s strategy is to protect its existing customer base and engage in targeted marketing and product initiatives to prepare for the upturn, when it does come .
That brings us to our Matrox Iris GT smart camera and Design Assistant software . This product bundle helps us to expand our customer base, to reach out to customers beyond the traditional OEM developer .
Matrox Iris GT is built for automation experts who need to integrate vision . On the outside, the Matrox Iris GT has a rugged, dust proof, washable casing with IP67 rating, and lockable and waterproof M12 connectors, and even a VGA output . We’ve made it easy for the camera to communicate with automation devices though Ethernet/IP™ and Modbus® over TCP/IP . On the inside, we’ve got the Intel® Atom . The intelligence lies in the Design Assistant interactive camera configuration environment . The flow chart-based interface is intuitive and makes vision accessible to anyone who wants to solve a machine vision problem without complex programming tools . Design Assistant’s functionality is based on our field-proven Matrox Imaging Library (MIL) . What’s more, we are offering the Matrox Iris GT and Design Assistant bundle at a very attractive price point .
Ironically, economic downtime often allows companies to redefine themselves and look at simpler and/or speedier ways to achieve their business goals . These times can become good opportunities to experiment; we believe the Matrox Iris GT makes experimentation a sound investment .
Let’s get ready for spring!
IMAGING INSIGHT Vol. 10 No. 1
François BertrandVice President, Sales & Marketing
The winter’s tale
From the VP’s Desk
Corporate headquarters:Canada and U .S .A . Matrox Electronic Systems Ltd .1055 St . Regis Blvd .Dorval, QC H9P 2T4CanadaTel: +1 (514) 685-2630 Fax: +1 (514) 822-6273
GermanyMatrox Electronic Systems GmbH Inselkammerstr . 8 D-82008 Unterhaching Germany Tel: +49 (0) 89 / 62170 0 Fax: +49 (0) 89 / 614 97 43
Offices:Europe, Middle East & AfricaMatrox VITE LimitedChaplin HouseWidewater PlaceMoorhall RoadHarefieldMiddlesex United Kingdom, UB9 6NSTel: +44 (0) 1895 827300Fax: +44 (0) 1895 827301
IMAGINGINSIGHT
Want to subs cribe? Go to:
matrox .com/imaging/news_events/newsletter/
Publisher: Matrox ImagingEditor: Sarah SookmanArt Director: Roland JolyMarketing Communications: Catherine Overbury, Manager
Reproduction in whole or in part, without the prior written permission of Matrox Imaging, is prohibited . For more information on articles published in this issue, or to share your comments, please contact the editor:
Tel: 1-514-685-7230 ext. 2753 Fax: 1-514-822-6273Email: [email protected]
Commentary

Experience the smart camera renaissance with Matrox Iris GT . Our 2nd generation smart camera is more efficient, 20% smaller, and three times faster than its predecessor!
04
Featured Product: Matrox Iris GT
IMAGING INSIGHT Vol. 10 No. 1
Anatomy of asmart cameraMatrox Iris GT
Eye
Two sensor options (more in development)•640 x 480 @ 100fps 1/3” monochrome CCD•1280 x 960 @ 20fps 1/3” monochrome CCD•Direct intensity and strobe control of third-party •LED light sources1
Language
Video output for image and operator interface •10/100/1000 Ethernet port•USB 2 .0 port• 2,3
RS-232 serial port•Support for Ethernet/IP• ™ and Modbus® over TCP/IP communications to directly interact with automation devices (PLCs, robots, etc .)Trigger input and conventional Strobe output•Discrete I/Os including rotary encoder support• 2

05
Featured Product: Matrox Iris GT
IMAGING INSIGHT Vol. 10 No. 1
1 Support for select Advanced Illumination models .2 Support available through a future software update .3 USB port intended for keyboard/mouse/touch-screen only .
Intelligence Matrox Design Assistant interactive development software
An interface where machine vision applications are created •by constructing a flowchart instead of writing traditional program codeImage processing and analysis functions are based on the •algorithms from the Matrox Imaging LibraryCreate flowchart steps to calibrate, enhance and transform •images, locate objects, extract and measure features, read character strings, and decode and verify identification marksDesign a graphical operator interface for the application•
Shell
Rugged, dust-proof, immersion-resistant casing with •IP67 ratingLockable and waterproof M12 connectors•
Power source
Powerful embedded Intel• ® Atom architecture processor45 nm Ultra Low Power (ULP) CPU at 1 .6GHz •

06
It’s big . It’s powerful . It can process billions of pixels per second . There’s a new high-performance computing (HPC) platform on the horizon . We’re so excited about it, we unveiled this new blue box at Vision 2008 in Stuttgart before its official release . 2009 promises to be the year of the Matrox Supersight, and Imaging Insight had a chat with Product Manager Dwayne Crawford about it .
Imaging Insight: What exactly is the Matrox Supersight?
Dwayne Crawford: Matrox Supersight is a high-performance computing platform for OEMs . We like to think of it as the big brother to the 4Sight family that we have been shipping for over 10 years now . What’s different about the Matrox Supersight is that it combines CPU, GPU and FPGA technologies into one or many computing clusters .
II: So it’s an industrial computer . How does it differ from a high-performance PC?
DC: The Matrox Supersight creates massive parallelism, enables large pipelines and removes I/O bottlenecks with PCIe x16 (Gen 2) interconnects between the processing nodes . By mapping the interconnects through an advanced PCIe switched fabric, nodes can be grouped into compute clusters that seamlessly share data without burdening other nodes within the system . The Matrox Supersight offers unprecedented processing performance in part because it’s so configurable . As CPU, GPU and FPGA technologies evolve, how the application is balanced between them will change . With the Matrox Supersight and MIL the developer can easily “re-cluster” the compute elements to ensure the application is optimally balanced between these technologies .
II: What were the reasons for the Matrox Supersight’s development?
DC: We constantly see high-performance imaging applications that are subject to hardware limitations . I/O limitations such as bottlenecks within blade servers and external cable connects between 1U pizza boxes pose a major challenge to creating effective parallelism . Furthermore, in order to support acceleration hardware such as FPGAs
and GPUs, physical slots with sufficient bandwidth, power and cooling are required – and they are not always available in blade and pizza box environments . It’s possible to accelerate image processing to its maximum with the judicious application of multiple GPUs, CPUs and FPGAs all working together . The Supersight hosts all these devices yet circumvents the I/O, space, power and cooling limitations of current processing platforms .
II: What are the other benefits of the Supersight?
DC: Consumer PCs are built and sold for the short term, typically around 12 to 14 months . OEMs make significant investments in development and need products that are available for the long term . Matrox provides 5 to 7 years of availability for its products; we help OEMs get the maximum return on their investment and avoid costly and constant re-validation of new platforms . Furthermore, companies in the medical and pharmaceutical industries face strict governmental regulation to ensure public safety . Unforeseen changes can freeze production, and in a worst case scenario, even result in product recalls . Because change is unavoidable, all Matrox Imaging hardware products, not just the Matrox Supersight, benefit from our managed life cycle programs . We can manage products for long-term fit, form and function . We can also offer the option of strict revision control that includes prior change notification, risk analysis and acceptance sign-off .
II: Will the Matrox Imaging Library (MIL) support the Supersight platform?
DC: Absolutely . Naturally our hardware and software are optimized for each other – that’s another benefit . OEMs who work with a single supplier spend far more time adding value to their product – they focus on developing their application without the struggles of software and hardware compatibility issues . Matrox validates both hardware and software changes to prevent unexpected incompatibility in the field .
IMAGING INSIGHT Vol. 10 No. 1
Product News: Matrox Supersight
Matrox Supersight
Set your sights on high-performance computing

Case Study: dataschalt
Dataschalt’s DataSort system can find and remove stones from a cascade of falling salt crystals in real time using a single 2000-pixel linescan camera.
By Winn Hardin
Salt SorterLinescan camera-based machine-vision system imagesfalling salt and enables contaminant removal
07IMAGING INSIGHT Vol. 10 No. 1
RHEWUM has built screening machines and vibrating feeders since the 1950s . To keep its customers ahead of the productivity curve, RHEWUM decided it needed to incorporate an automated sorting system to its screening systems—in particular, using machine vision to sort rocks and other contaminants from salt as it falls from a chute to a collection bin .
Hitting a stationary target is relatively easy; however, directing an air jet to hit a falling stone as it cascades along with a sheet of salt crystals from a chute to a bin is not an easy task . RHEWUM turned to industrial electronics and food sorting specialist dataschalt Group to build a system capable of detecting falling contaminants in real time and interfacing with RHEWUM’s OEM screening equipment to blow the contaminants out of the product stream .
Dataschalt accomplished the task by integrating machine-vision components from Matrox Imaging and Basler Vision Technologies into a system capable of sorting salt crystals in real time at a rate of up to 120 tons per hour .
Speeding the sortUntil recently, microprocessors and other computational elements were not powerful enough to sort contaminants from hundreds of salt crystals falling through space . To use air to blow falling contaminants from cascading salt crystals, the vision system needed to be able to classify each crystal based on size, shape, and location, and then provide a bank of air jets with the specific location of the contaminant as it is falling from feeder chute to collection chute . A PMC I/O card inside the PC host then triggers the appropriate air jets, which blow the contaminant into a defect bin .
“Because we are sorting products when they are falling we need to reduce the time between object scan and object rejection,” explains Kai Schwarz, automation engineer at dataschalt . “This is necessary because the behavior of a single falling object within the product stream is actually nondeterministic, but if the time between scan and shot is small we can assume that the object has moved linearly and will be able to hit it with the air blast . The air blast will always hit
‘good’ product as well but this is accepted . This would be easier with a conveyor belt but you wouldn’t be able to sort the same amount of product . So we were looking for a very fast real-time [image-processing] platform with the capability to process blobs .”
Schwarz says that a sorting machine already existed that processes pixel by pixel completely in hardware with a processing time faster than 4 ms, but this platform was not able to process blobs and therefore had limitations . Dataschalt evaluated the Tsunami embedded computing board from SBS Technologies (now GE Fanuc), but the Odyssey Xpro+ platform from Matrox had the advantage that it comes with the Matrox Imaging Library (MIL), which solved nearly all of the image algorithm problems and enabled dataschalt to concentrate on the process itself .
“The Odyssey provides the possibility to program the PowerPC on the card itself,” adds Schwarz . “So we had a really fast processor with real-time capabilities that gets the image information directly [from the camera] via the [board’s] internal bus .” The board had a limited number of I/O channels to control the valve battery and so Matrox developed a solution by using their carrier board and a third-party PCM I/O with 64 I/O channels . Schwarz says, “These channels were enough for our valve control hardware—our DataSort Sorting Application (DSA), which consist of a transmitter unit, a receiver unit, and an optical fiber connection . The valve triggers are now written from the Xpro+ via the PCI-X bus to the PMC-IO-Card and we have no bandwidth problem .”
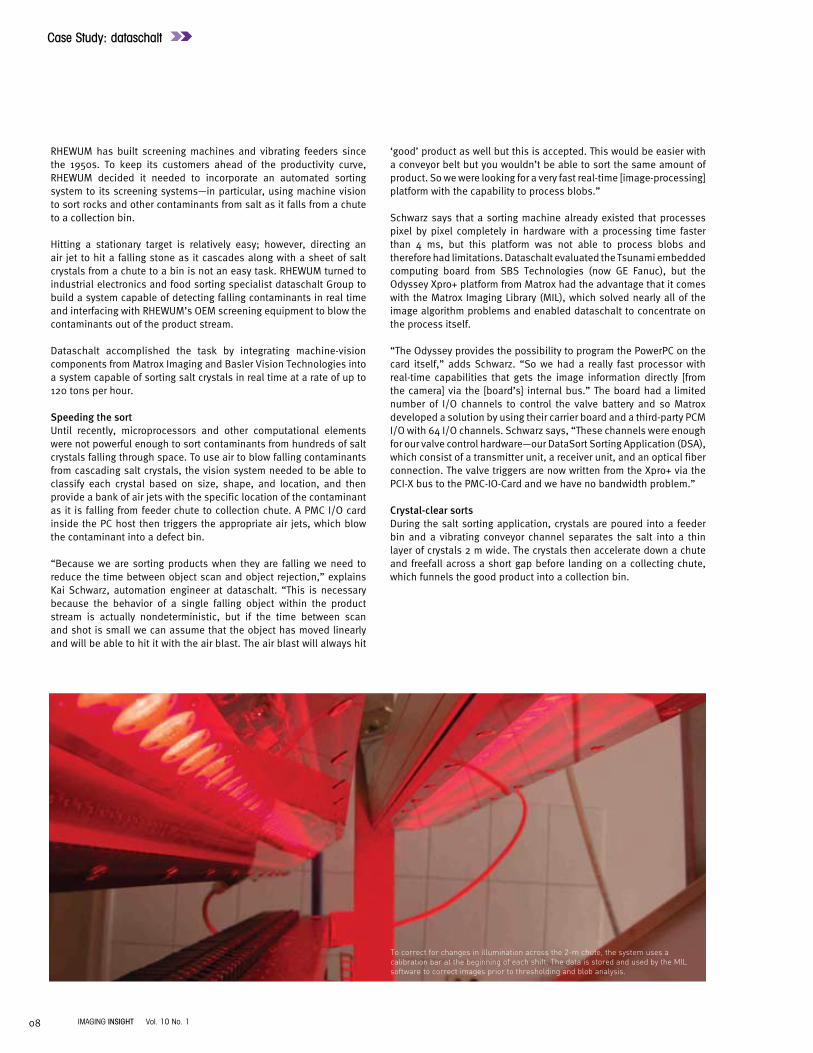
Crystal-clear sortsDuring the salt sorting application, crystals are poured into a feeder bin and a vibrating conveyor channel separates the salt into a thin layer of crystals 2 m wide . The crystals then accelerate down a chute and freefall across a short gap before landing on a collecting chute, which funnels the good product into a collection bin .
Case Study: dataschalt
To correct for changes in illumination across the 2-m chute, the system uses a calibration bar at the beginning of each shift. The data is stored and used by the MIL software to correct images prior to thresholding and blob analysis.
08 IMAGING INSIGHT Vol. 10 No. 1

Mounted on either side of the salt crystals are banks of white LED lights to illuminate the crystals as they fall . On one side of the crystal cascade is a bank of air valves that can be turned on and off independently by the PC based on information from the MIL software running on the Xpro+ image-processing board .
To begin the sort, the operator sets a calibration bar within the Basler Vision L103KM-2K Camera Link linescan camera . This allows the MIL software to correct for changes in illumination across the 2-m-wide chute . dataschalt chose the L103 because of its relatively high pixel resolution and fast acquisition speeds . The clock runs at 18 .7 kHz, compared to 9 kHz for the L101 camera, which is important when trying to image falling product in real time and with high spatial resolution from a linescan camera . The camera clock and frame data passed to the MIL software also act as the synchronization signal for triggering the air jets to blow out contaminants from the salt crystal stream .
As salt crystals begin to fall in front of the camera, each line along with its time stamp is passed to the MIL software . The Xpro+ board features an ASIC to accelerate certain image-processing algorithm convolutions running on the nearby G4 Power-PC processor; a FPGA handles filtering, normalization, and similar repetitive tasks based on the specific inspection routine .
The board collects line images in local buffer memory, checking each pixel for intensity variations that indicate the pixel is either a background pixel, salt pixel, or—if darker— indicative of a stone or contaminant . Once contaminant-level pixels are identified, the MIL software runs a blob analysis to determine whether the contaminant is large enough to warrant rejection by the air jets .
“The stones are darker than the salt,” explains dataschalt’s Schwarz . “Often they are included within the salt pieces . So we examine a blob and count the amount of dark or ‘bad’ classified pixels . The user defines beforehand the percentage of bad pixels that are allowed per piece .” The salt pieces are sometimes large (approximately 10 × 10 cm), so often it is not enough to shoot only the bad pixels [from an
embedded stone] but it is essential to recognize the complete piece and turn on enough valves to reject it . Furthermore, it is possible to sort the pieces by size .
Once the MIL software determines that a contaminant has exceeded the allowable size, the horizontal location information and time stamps for the defect are passed across the compact PCI bus inside the host PC, through the carrier board to the Acromag PMC464 I/O board . Using its 64 I/O channels, the PMC card then sends that location information to the dataschalt DSA electronic control system, which fires specific valves in the bank of 255 air jets that stretch across the sort stream . The jets blow the defective crystal or contaminant out of the stream and into a defect bin .
Adding color to the mixWhile the salt-sorting application only required monochrome images to differentiate white salt crystals from darker stones, many food-processing applications require more data to pick good product from bad . For these applications, dataschalt uses the same processing hardware with a color camera . To accommodate the additional data while maintaining high-speed processing, Schwarz says he uses principle component analysis (PCA) techniques to remove one dimension in the RGB color space that holds the least amount of data, essentially compressing the 3-D color space into 2-D .
The throughput of the DataSort depends on particle size, the material’s bulk density, and the width of the machine . Currently, the sorting capacity can be up to 120 t/h at a machine width of 1200 mm .
“We are very happy with the fast-working, high-tech solution we have received from dataschalt,” says Sigurd Schuetz, managing director of RHEWUM . “It enables us to provide a reliable and cost-efficient sorting technology to our customers, who greatly benefit from this combination of dataschalt and RHEWUM technological knowledge .”
This article originally appeared in the January 2009 issue of Vision Systems Design . Used with permission .
09
Case Study: dataschalt
IMAGING INSIGHT Vol. 10 No. 1
The MIL software compiles a complete image of a falling stone from individual line images and then uses the location across the linear array, plus the time stamps from each line associated with the stone, to provide location information to the dataschalt DSA system, which controls the bank of 255 air jets.

10
Case Study: Novartis
IMAGING INSIGHT Vol. 10 No. 1
Automated microscopy system uses MIL to detect chromosomal abnormalities in cells
It’s inthe genes
The comet assay quantifies the DNA damage in a cell. The DNA particles migrating in an electric field are stained with propidium-iodide. The comet assay locates suitable nuclei and analyzes these “comet tails” using parameters such as tail length, intensity, tail moment etc. The number and brightness of particles directly correlates to the level of DNA damage.
The drug discovery process not only develops new drugs that cure, control, or prevent disease . This process must also include rigorous testing for severe side effects . This is particularly true for drugs that are intended for long-term or even lifetime use, such as anti-rejection drugs for transplant patients .
Long before human trials can proceed, drugs must be tested for their efficacy and safety . The Preclinical Safety unit at Novartis (Basel, Switzerland) has the responsibility of determining adverse side effects of all new molecular entities (drugs) in vitro (i .e ., in cultured cells) and in vivo (animal testing) . Besides other toxicological studies, the researchers perform genetic toxicology assays (tests) to assess the genotoxic potential of new drug candidates . Drug effects on mammalian cells are studied, using chromosomal abnormalities (besides other cellular and nuclear endpoints) to assess the compound’s potential hazards . When such abnormalities occur, it means that the drug in question has interacted with the cell’s genome . Dr . Wilfried Frieauff, Laboratory Manager of the Preclinical Safety unit says that when a statistically and biologically significant increase in these events are observed, there’s a potential for the drug candidate to induce cancer .
Frieauff manages the labs, and he is responsible for the image analysis platform – its development, system maintenance, and support . The Preclinical Safety unit runs hundreds of tests annually on literally millions of cells . Given the numbers, it’s no surprise that the analysis process is one that benefits from automation .
At the end of the 1980s, Frieauff’s lab began to use Leitz MIAS image analyzers for that purpose . But by the late 1990s, Dr . Frieauff realized that the systems were seriously outdated . “It was a stand-alone system that could not be part of a network . Replacement parts were no longer available,” he explains . These early image analysis systems had a maximum capacity of processing only 16 slides in a row . “Sometimes we would load the slides on Friday, and the system would finish and sit idling until Monday morning .” More importantly, Frieauff expected the future would bring more image analysis development projects and he “realized that it was time to totally re-engineer and modernize our image analysis .”
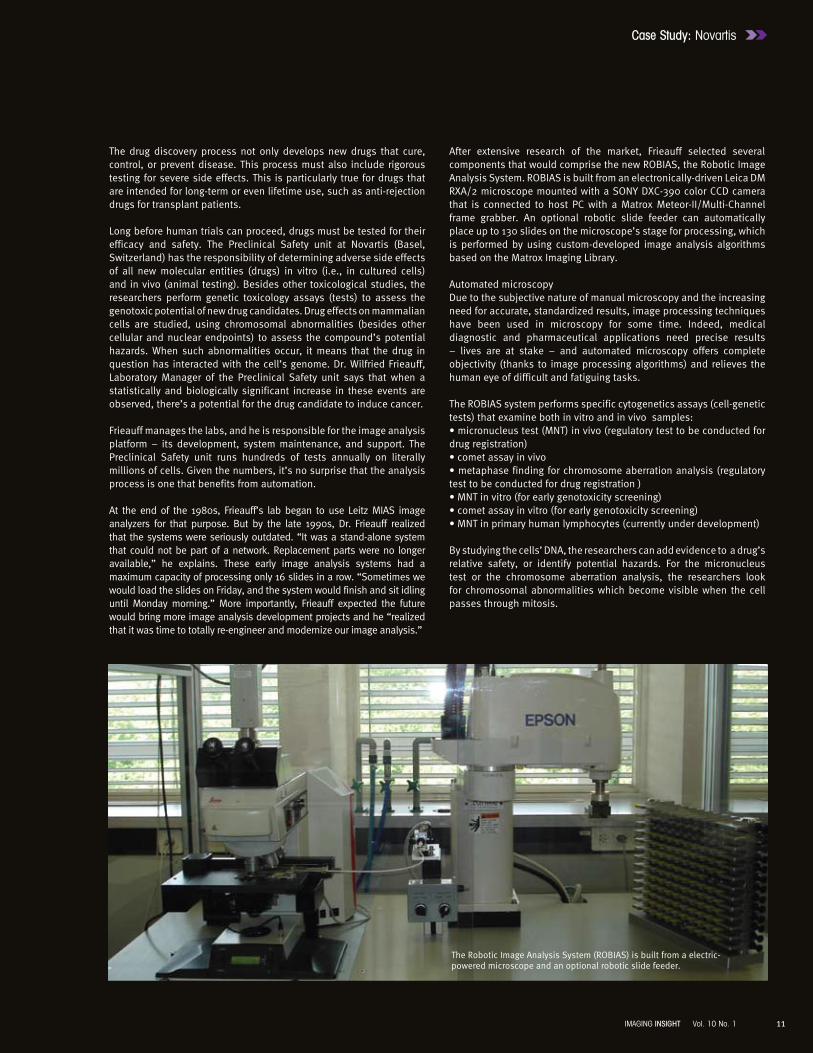
After extensive research of the market, Frieauff selected several components that would comprise the new ROBIAS, the Robotic Image Analysis System . ROBIAS is built from an electronically-driven Leica DM RXA/2 microscope mounted with a SONY DXC-390 color CCD camera that is connected to host PC with a Matrox Meteor-II/Multi-Channel frame grabber . An optional robotic slide feeder can automatically place up to 130 slides on the microscope’s stage for processing, which is performed by using custom-developed image analysis algorithms based on the Matrox Imaging Library .
Automated microscopyDue to the subjective nature of manual microscopy and the increasing need for accurate, standardized results, image processing techniques have been used in microscopy for some time . Indeed, medical diagnostic and pharmaceutical applications need precise results – lives are at stake – and automated microscopy offers complete objectivity (thanks to image processing algorithms) and relieves the human eye of difficult and fatiguing tasks .
The ROBIAS system performs specific cytogenetics assays (cell-genetic tests) that examine both in vitro and in vivo samples: •micronucleustest(MNT)invivo(regulatorytesttobeconductedfordrug registration)•cometassayinvivo•metaphase finding forchromosomeaberrationanalysis (regulatorytest to be conducted for drug registration )•MNTinvitro(forearlygenotoxicityscreening)•cometassayinvitro(forearlygenotoxicityscreening)•MNTinprimaryhumanlymphocytes(currentlyunderdevelopment)
By studying the cells’ DNA, the researchers can add evidence to a drug’s relative safety, or identify potential hazards . For the micronucleus test or the chromosome aberration analysis, the researchers look for chromosomal abnormalities which become visible when the cell passes through mitosis .
It’s inthe genes
Case Study: Novartis
The Robotic Image Analysis System (ROBIAS) is built from a electric-powered microscope and an optional robotic slide feeder .
11IMAGING INSIGHT Vol. 10 No. 1

12
Case Study: Novartis
IMAGING INSIGHT Vol. 10 No. 1
As an example, a micronucleus reflects a genotoxic insult because it originates from a chromosome strand break due to the compound interaction with the nuclear material . Direct DNA lesions are assessed using the comet assay where DNA particles migrating in an electric field, are stained with a fluorescent dye and can be measured to assess the overall DNA damage following the compound administration .Summarizing genetic toxicology’s mission - if the drug does not damage a cell’s DNA, an important hurdle is passed for being a good candidate for later Phase 1 clinical trials .
M is for morphologyMIL markedly supports the researchers to extract the vital information they seek . After “discovering” MIL in 1999, Frieauff found that it was “the most flexible and ready-to-use tool library which fully supported mathematical morphology functions, as well as advanced blob analysis, both very important for biological image analysis .” These functions comprise the “core” of Frieauff’s software . With more than 20 years of experience in image analysis development, Frieauff had already built some powerful software tools based on low-level imaging functions . MIL’s functional interface simplified the overall software development . “For my applications,” he explains, “automated segmentation of biological structures, that is, cells containing nuclei or other cellular patterns, is crucial . Thus, I developed automated segmentation functions for various specific applications in industrial toxicology .”
The “various specific applications” of which Frieauff speaks is one of the unique features of ROBIAS . “You may find diverse systems covering individual solutions,” he says, “but not one system covering all these tox[ological] assays on one platform . That was the main idea behind ROBIAS .”
Currently, five ROBIAS units are deployed in Novartis locations, plus an additional two systems without the robotic slide feeder . These days
Frieauff manages the laboratory’s toxicology assays and oversees all aspects of ROBIAS . Always in the midst of new application development, he is currently investigating sophisticated details of the MIL’s Edge Finder module . He is also working through the process of patenting ROBIAS . His determination has certainly paid off . In fact, in 2007 Frieauff received the Novartis VIVA Leading Scientist award . “I was extremely proud,” recalls Frieauff, “the award reflects the importance of the ROBIAS system and the development of fully automatic image analysis applications for various units within Novartis Pharma research and development .”
References:Sookman, Sarah . “In Living Color Microscopy tool uses MIL to automate color-based cell analysis” Imaging Insight 5 .3 (2003): 4-5 .
Metaphase is the stage of mitosis where the chromosomes migrate to the center of the cell before it divides. This metaphase test is the basis for chromosome aberration analysis. This image shows the “collection” of chromosomes of a dividing cell.
In this micronucleus test, two cells show micronuclei, evidence that the drug compound interacted with the cell’s genetic material.

The Vision Squad Files: MIL GMF masks
13
Using MIL Geometric Model Finder masks
IMAGING INSIGHT Vol. 10 No. 1
Pattern recognition is used to locate an object in an image. For that reason, it is one of the most widely used operations in the machine vision industry. While the normalized grayscale correlation (NGC) technique uses a pixel-by-pixel comparison, the MIL Geometric Model Finder (GMF) uses a technique based on the geometric features of an object. GMF is not only more flexible, but also more tolerant of lighting variations, model occlusion and variations in scale and angle. One way to get even better results with GMF is to apply masks to the search model. This Vision Squad article describes how to use the various masking capabilities of GMF so that the tool can be used to its full potential.
The
VISIONSQUAD
The
VISIONSQUAD
The

Flat region maskThe flat region mask (M_FLAT_REGIONS) is used to mask the model edges only. Note that the corresponding target edges that fall in the masked area still contribute to the target coverage when using a flat region mask.
In Target A, both the model and target coverage score 100% since all edges of the model are found in the target and vice-versa. In Target B the model coverage is 100% because the remaining edges in the final model are found in the target; however, the target coverage decreases to 80% because of the extra edges (Figure 4).
14
The Vision Squad Files: MIL GMF masks
IMAGING INSIGHT Vol. 10 No. 1
Determining model and target coverageThe model coverage quantifies the model’s edges found in the occurrence or target. Model coverage of 100% means a perfect match, where every edge element in the model image has found a corresponding edge element in the target. Missing or occluded edges in the target decrease the model coverage. In Figure 1, 80% of the model’s edges are found in the first occurrence and 50% in the second.
The target coverage quantifies the percentage of the target occurrence’s edges present in the model. This means that edges that are found in the occurrence but not in the model are considered extra edges. Therefore, they reduce the target coverage. In Figure 2 (below) the target coverage is 100% in the first occurrence because all of the target edges correspond to edge elements in the model. In the second occurrence, the target coverage is lower because only 60% of the target edge elements correspond to the model’s edge elements.
Model edge map
Model edge map
Edge map + Mask
Missing edges Occluded edges
80% 50%
Missing edges Extra edges
100% 60%
Final edge map
Target edge map
Model coverage
Model coverage
Target coverage
Target coverage
Model coverage
Target coverage
Model coverage
Target coverage
Target A
Target B
Edge map + Mask
Final edge map
Target A
100%100%
100%80%
Model coverage Target coverage
100%100%
100%100%
Target B
Enhanced model Target A Target B
Model Target A
100% << 100% Model coverage
100%
Target B
< 100% but still very high Model coverage
Target edge map
Model weight Positive Negative
Positive Negative None Target contribution
Model edge map
Model edge map
Edge map + Mask
Missing edges Occluded edges
80% 50%
Missing edges Extra edges
100% 60%
Final edge map
Target edge map
Model coverage
Model coverage
Target coverage
Target coverage
Model coverage
Target coverage
Model coverage
Target coverage
Target A
Target B
Edge map + Mask
Final edge map
Target A
100%100%
100%80%
Model coverage Target coverage
100%100%
100%100%
Target B
Enhanced model Target A Target B
Model Target A
100% << 100% Model coverage
100%
Target B
< 100% but still very high Model coverage
Target edge map
Model weight Positive Negative
Positive Negative None Target contribution
Figure 1. Figure 2.
MasksMasks are applied to models for two reasons: either to remove any irrelevant, inconsistent or featureless areas of the model, or to modify the relative contribution of model edges to the model coverage. The GMF module provides three types of masks that have different effects on model coverage: don’t care, flat region and weighted.
Don’t care maskThe don’t care mask (M_DONT_CARES) masks any irrelevant regions in the model and the corresponding region in the target. Masked edges in the model do not contribute to the model coverage, and any edges in the target’s corresponding region will not contribute to the target coverage (Figure 3).
In Target A, both the model and target coverage score 100% since all edges of the model are found in the target and vice-versa. In Target B, the model coverage is 100% because all edges of the model are found in the target; the target coverage is also 100% because the two circles fall within the corresponding region masked by the don’t care mask.
Model edge map
Model edge map
Edge map + Mask
Missing edges Occluded edges
80% 50%
Missing edges Extra edges
100% 60%
Final edge map
Target edge map
Model coverage
Model coverage
Target coverage
Target coverage
Model coverage
Target coverage
Model coverage
Target coverage
Target A
Target B
Edge map + Mask
Final edge map
Target A
100%100%
100%80%
Model coverage Target coverage
100%100%
100%100%
Target B
Enhanced model Target A Target B
Model Target A
100% << 100% Model coverage
100%
Target B
< 100% but still very high Model coverage
Target edge map
Model weight Positive Negative
Positive Negative None Target contribution
Model edge map
Model edge map
Edge map + Mask
Missing edges Occluded edges
80% 50%
Missing edges Extra edges
100% 60%
Final edge map
Target edge map
Model coverage
Model coverage
Target coverage
Target coverage
Model coverage
Target coverage
Model coverage
Target coverage
Target A
Target B
Edge map + Mask
Final edge map
Target A
100%100%
100%80%
Model coverage Target coverage
100%100%
100%100%
Target B
Enhanced model Target A Target B
Model Target A
100% << 100% Model coverage
100%
Target B
< 100% but still very high Model coverage
Target edge map
Model weight Positive Negative
Positive Negative None Target contribution
Figure 3.
Figure 4.
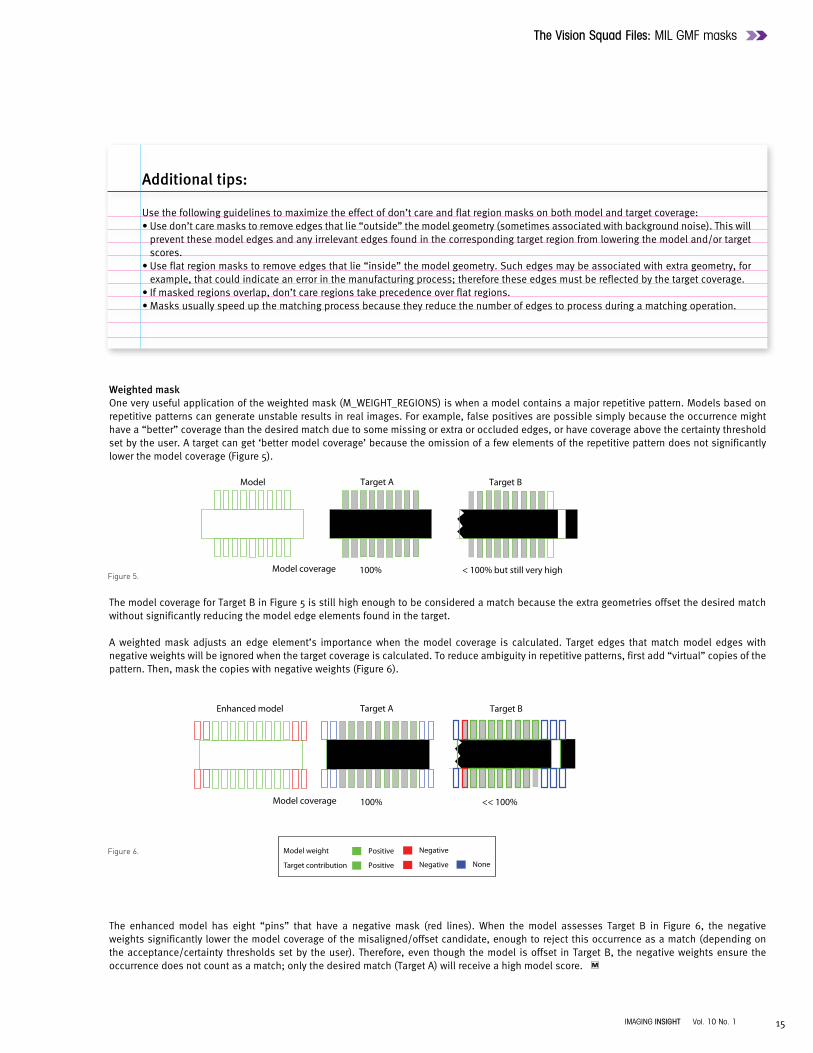
Weighted maskOne very useful application of the weighted mask (M_WEIGHT_REGIONS) is when a model contains a major repetitive pattern . Models based on repetitive patterns can generate unstable results in real images . For example, false positives are possible simply because the occurrence might have a “better” coverage than the desired match due to some missing or extra or occluded edges, or have coverage above the certainty threshold set by the user . A target can get ‘better model coverage’ because the omission of a few elements of the repetitive pattern does not significantly lower the model coverage (Figure 5) .
The model coverage for Target B in Figure 5 is still high enough to be considered a match because the extra geometries offset the desired match without significantly reducing the model edge elements found in the target .
A weighted mask adjusts an edge element’s importance when the model coverage is calculated . Target edges that match model edges with negative weights will be ignored when the target coverage is calculated . To reduce ambiguity in repetitive patterns, first add “virtual” copies of the pattern . Then, mask the copies with negative weights (Figure 6) .
The enhanced model has eight “pins” that have a negative mask (red lines) . When the model assesses Target B in Figure 6, the negative weights significantly lower the model coverage of the misaligned/offset candidate, enough to reject this occurrence as a match (depending on the acceptance/certainty thresholds set by the user) . Therefore, even though the model is offset in Target B, the negative weights ensure the occurrence does not count as a match; only the desired match (Target A) will receive a high model score .
15
The Vision Squad Files: MIL GMF masks
Use the following guidelines to maximize the effect of don’t care and flat region masks on both model and target coverage: •Usedon’tcaremaskstoremoveedgesthatlie“outside”themodelgeometry(sometimesassociatedwithbackgroundnoise).Thiswill
prevent these model edges and any irrelevant edges found in the corresponding target region from lowering the model and/or target scores .
•Useflatregionmaskstoremoveedgesthatlie“inside”themodelgeometry.Suchedgesmaybeassociatedwithextrageometry,forexample, that could indicate an error in the manufacturing process; therefore these edges must be reflected by the target coverage .
•Ifmaskedregionsoverlap,don’tcareregionstakeprecedenceoverflatregions.•Masksusuallyspeedupthematchingprocessbecausetheyreducethenumberofedgestoprocessduringamatchingoperation.
Additional tips:
IMAGING INSIGHT Vol. 10 No. 1
Model edge map
Model edge map
Edge map + Mask
Missing edges Occluded edges
80% 50%
Missing edges Extra edges
100% 60%
Final edge map
Target edge map
Model coverage
Model coverage
Target coverage
Target coverage
Model coverage
Model coverage
Model coverage
Target coverage
Target A
Target B
Edge map + Mask
Final edge map
Target A
100%100%
100%80%
Model coverage Target coverage
100%100%
100%100%
Target B
Enhanced model Target A Target B
Model Target A
100% << 100% Model coverage
100%
Target B
< 100% but still very high Model coverage
Target edge map
Model weight Positive Negative
Positive Negative None Target contribution
Model edge map
Model edge map
Edge map + Mask
Missing edges Occluded edges
80% 50%
Missing edges Extra edges
100% 60%
Final edge map
Target edge map
Model coverage
Model coverage
Target coverage
Target coverage
Model coverage
Model coverage
Model coverage
Target coverage
Target A
Target B
Edge map + Mask
Final edge map
Target A
100%100%
100%80%
Model coverage Target coverage
100%100%
100%100%
Target B
Enhanced model Target A Target B
Model Target A
100% << 100% Model coverage
100%
Target B
< 100% but still very high Model coverage
Target edge map
Model weight Positive Negative
Positive Negative None Target contribution
Figure 5.
Figure 6.

©M
atro
x Im
agin
g P
rint
ed in
Can
ada
$IE-
5458
-B