Embed Size (px)
DESCRIPTION
Image Segmentation wiki
Citation preview

Model of a segmented femur. Itshows the outer surface (red), thesurface between compact bone andspongy bone (green) and the surfaceof the bone marrow (blue).
Image segmentationFrom Wikipedia, the free encyclopediaIn computer vision, image segmentation is the process of partitioning adigital image into multiple segments (sets of pixels, also known assuperpixels). The goal of segmentation is to simplify and/or change therepresentation of an image into something that is more meaningful andeasier to analyze.[1][2] Image segmentation is typically used to locateobjects and boundaries (lines, curves, etc.) in images. More precisely,image segmentation is the process of assigning a label to every pixel inan image such that pixels with the same label share certaincharacteristics.The result of image segmentation is a set of segments that collectivelycover the entire image, or a set of contours extracted from the image (seeedge detection). Each of the pixels in a region are similar with respect tosome characteristic or computed property, such as color, intensity, ortexture. Adjacent regions are significantly different with respect to thesame characteristic(s).[1] When applied to a stack of images, typical inmedical imaging, the resulting contours after image segmentation can beused to create 3D reconstructions with the help of interpolationalgorithms like Marching cubes.
Contents1 Applications2 Thresholding3 Clustering methods4 Compression-based methods5 Histogram-based methods6 Edge detection7 Dual clustering method8 Region-growing methods9 Partial differential equation-based methods
9.1 Parametric methods9.2 Level set methods9.3 Fast marching methods
10 Variational methods11 Graph partitioning methods
11.1 Markov Random Fields11.1.1 Supervised Image Segmentation using MRF
and MAP11.1.2 Optimization algorithms
11.1.2.1 Iterated Conditional Modes/GradientDescent
Image segmentation - Wikipedia, the free encyclopedia https://en.wikipedia.org/wiki/Image_segmentation
1 of 18 4/18/2016 1:47 PM

11.1.2.2 Simulated Annealing(SA)11.1.2.3 Alternative Algorithms
11.1.3 Unsupervised Image Segmentation usingMRF and Expectation Maximization
11.1.4 Disadvantages of MAP and EM based imagesegmentation
11.1.5 Implementations of MRF based Imagesegmentation
12 Watershed transformation13 Model based segmentation14 Multi-scale segmentation
14.1 One-dimensional hierarchical signal segmentation14.2 Image segmentation and primal sketch
15 Semi-automatic segmentation16 Trainable segmentation17 Other methods18 Segmentation benchmarking19 See also20 Notes21 References22 External links
ApplicationsSome of the practical applications of image segmentation are:
Content-based image retrievalMachine visionMedical imaging[3][4]
Locate tumors and other pathologies[5][6]Measure tissue volumesDiagnosis, study of anatomical structureSurgery planningVirtual surgery simulationIntra-surgery navigation
Object detection[7]Pedestrian detectionFace detectionBrake light detectionLocate objects in satellite images (roads, forests, crops, etc.)
Recognition TasksFace recognitionFingerprint recognitionIris recognition
Traffic control systemsVideo surveillance
Image segmentation - Wikipedia, the free encyclopedia https://en.wikipedia.org/wiki/Image_segmentation
2 of 18 4/18/2016 1:47 PM

Several general-purpose algorithms and techniques have been developed for image segmentation. To be useful,these techniques must typically be combined with a domain's specific knowledge in order to effectively solvethe domain's segmentation problems.
ThresholdingThe simplest method of image segmentation is called the thresholding method. This method is based on aclip-level (or a threshold value) to turn a gray-scale image into a binary image. There is also a balancedhistogram thresholding.The key of this method is to select the threshold value (or values when multiple-levels are selected). Severalpopular methods are used in industry including the maximum entropy method, Otsu's method (maximumvariance), and k-means clustering.Recently, methods have been developed for thresholding computed tomography (CT) images. The key idea isthat, unlike Otsu's method, the thresholds are derived from the radiographs instead of the (reconstructed)image[8] .[9]
New methods suggested the usage of multi-dimensional fuzzy rule-based non-linear thresholds. In these worksdecision over each pixel's membership to a segment is based on multi-dimensional rules derived from fuzzylogic and evolutionary algorithms based on image lighting environment and application.[10]
Clustering methodsThe K-means algorithm is an iterative technique that is used to partition an image into K clusters.[11] The basicalgorithm is
Pick K cluster centers, either randomly or based on some heuristic1. Assign each pixel in the image to the cluster that minimizes the distance between the pixel and the clustercenter
2. Re-compute the cluster centers by averaging all of the pixels in the cluster3. Repeat steps 2 and 3 until convergence is attained (i.e. no pixels change clusters)4.
In this case, distance is the squared or absolute difference between a pixel and a cluster center. The difference istypically based on pixel color, intensity, texture, and location, or a weighted combination of these factors. K canbe selected manually, randomly, or by a heuristic. This algorithm is guaranteed to converge, but it may notreturn the optimal solution. The quality of the solution depends on the initial set of clusters and the value of K.
Compression-based methodsCompression based methods postulate that the optimal segmentation is the one that minimizes, over all possiblesegmentations, the coding length of the data.[12][13] The connection between these two concepts is thatsegmentation tries to find patterns in an image and any regularity in the image can be used to compress it. Themethod describes each segment by its texture and boundary shape. Each of these components is modeled by aprobability distribution function and its coding length is computed as follows:
The boundary encoding leverages the fact that regions in natural images tend to have a smooth contour.This prior is used by Huffman coding to encode the difference chain code of the contours in an image.
1.
Image segmentation - Wikipedia, the free encyclopedia https://en.wikipedia.org/wiki/Image_segmentation
3 of 18 4/18/2016 1:47 PM

Source image.
Image after running k-means with k = 16. Note thata common technique to improve performance forlarge images is to downsample the image, computethe clusters, and then reassign the values to thelarger image if necessary.
Thus, the smoother a boundary is, the shorter codinglength it attains.Texture is encoded by lossy compression in a waysimilar to minimum description length (MDL)principle, but here the length of the data given themodel is approximated by the number of samplestimes the entropy of the model. The texture in eachregion is modeled by a multivariate normaldistribution whose entropy has closed formexpression. An interesting property of this model isthat the estimated entropy bounds the true entropy ofthe data from above. This is because among alldistributions with a given mean and covariance,normal distribution has the largest entropy. Thus, thetrue coding length cannot be more than what thealgorithm tries to minimize.
2.
For any given segmentation of an image, this scheme yieldsthe number of bits required to encode that image based onthe given segmentation. Thus, among all possiblesegmentations of an image, the goal is to find thesegmentation which produces the shortest coding length.This can be achieved by a simple agglomerative clusteringmethod. The distortion in the lossy compression determinesthe coarseness of the segmentation and its optimal valuemay differ for each image. This parameter can be estimatedheuristically from the contrast of textures in an image. Forexample, when the textures in an image are similar, such asin camouflage images, stronger sensitivity and thus lowerquantization is required.
Histogram-based methodsHistogram-based methods are very efficient compared to other image segmentation methods because theytypically require only one pass through the pixels. In this technique, a histogram is computed from all of thepixels in the image, and the peaks and valleys in the histogram are used to locate the clusters in the image.[1]Color or intensity can be used as the measure.A refinement of this technique is to recursively apply the histogram-seeking method to clusters in the image inorder to divide them into smaller clusters. This operation is repeated with smaller and smaller clusters until nomore clusters are formed.[1][14]
One disadvantage of the histogram-seeking method is that it may be difficult to identify significant peaks andvalleys in the image.Histogram-based approaches can also be quickly adapted to apply to multiple frames, while maintaining theirsingle pass efficiency. The histogram can be done in multiple fashions when multiple frames are considered.The same approach that is taken with one frame can be applied to multiple, and after the results are merged,peaks and valleys that were previously difficult to identify are more likely to be distinguishable. The histogram
Image segmentation - Wikipedia, the free encyclopedia https://en.wikipedia.org/wiki/Image_segmentation
4 of 18 4/18/2016 1:47 PM
can also be applied on a per-pixel basis where the resulting information is used to determine the most frequentcolor for the pixel location. This approach segments based on active objects and a static environment, resultingin a different type of segmentation useful in Video tracking.
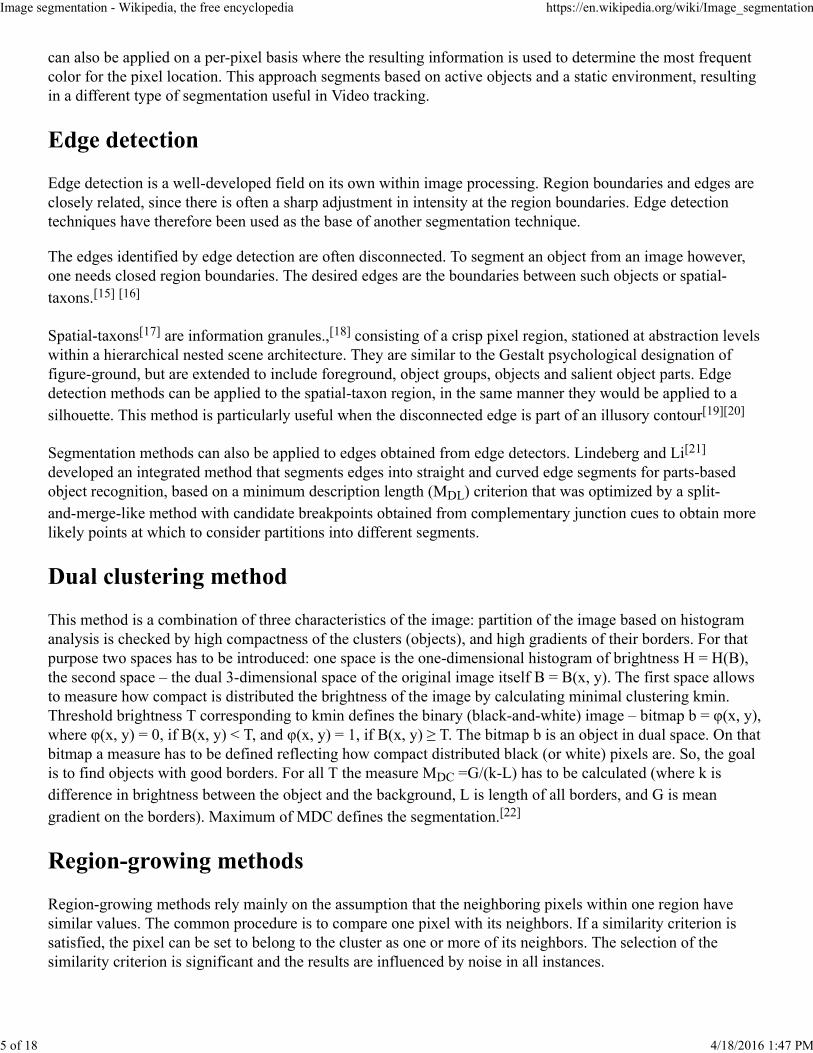
Edge detectionEdge detection is a well-developed field on its own within image processing. Region boundaries and edges areclosely related, since there is often a sharp adjustment in intensity at the region boundaries. Edge detectiontechniques have therefore been used as the base of another segmentation technique.The edges identified by edge detection are often disconnected. To segment an object from an image however,one needs closed region boundaries. The desired edges are the boundaries between such objects or spatial-taxons.[15] [16]
Spatial-taxons[17] are information granules.,[18] consisting of a crisp pixel region, stationed at abstraction levelswithin a hierarchical nested scene architecture. They are similar to the Gestalt psychological designation offigure-ground, but are extended to include foreground, object groups, objects and salient object parts. Edgedetection methods can be applied to the spatial-taxon region, in the same manner they would be applied to asilhouette. This method is particularly useful when the disconnected edge is part of an illusory contour[19][20]
Segmentation methods can also be applied to edges obtained from edge detectors. Lindeberg and Li[21]developed an integrated method that segments edges into straight and curved edge segments for parts-basedobject recognition, based on a minimum description length (MDL) criterion that was optimized by a split-and-merge-like method with candidate breakpoints obtained from complementary junction cues to obtain morelikely points at which to consider partitions into different segments.
Dual clustering methodThis method is a combination of three characteristics of the image: partition of the image based on histogramanalysis is checked by high compactness of the clusters (objects), and high gradients of their borders. For thatpurpose two spaces has to be introduced: one space is the one-dimensional histogram of brightness H = H(B),the second space – the dual 3-dimensional space of the original image itself B = B(x, y). The first space allowsto measure how compact is distributed the brightness of the image by calculating minimal clustering kmin.Threshold brightness T corresponding to kmin defines the binary (black-and-white) image – bitmap b = φ(x, y),where φ(x, y) = 0, if B(x, y) < T, and φ(x, y) = 1, if B(x, y) ≥ T. The bitmap b is an object in dual space. On thatbitmap a measure has to be defined reflecting how compact distributed black (or white) pixels are. So, the goalis to find objects with good borders. For all T the measure MDC =G/(k-L) has to be calculated (where k isdifference in brightness between the object and the background, L is length of all borders, and G is meangradient on the borders). Maximum of MDC defines the segmentation.[22]
Region-growing methodsRegion-growing methods rely mainly on the assumption that the neighboring pixels within one region havesimilar values. The common procedure is to compare one pixel with its neighbors. If a similarity criterion issatisfied, the pixel can be set to belong to the cluster as one or more of its neighbors. The selection of thesimilarity criterion is significant and the results are influenced by noise in all instances.
Image segmentation - Wikipedia, the free encyclopedia https://en.wikipedia.org/wiki/Image_segmentation
5 of 18 4/18/2016 1:47 PM

The method of Statistical Region Merging[23] (SRM) starts by building the graph of pixels using4-connectedness with edges weighted by the absolute value of the intensity difference. Initially each pixel formsa single pixel region. SRM then sorts those edges in a priority queue and decide whether or not to merge thecurrent regions belonging to the edge pixels using a statistical predicate.One region-growing method is the seeded region growing method. This method takes a set of seeds as inputalong with the image. The seeds mark each of the objects to be segmented. The regions are iteratively grown bycomparison of all unallocated neighboring pixels to the regions. The difference between a pixel's intensity valueand the region's mean, , is used as a measure of similarity. The pixel with the smallest difference measured inthis way is assigned to the respective region. This process continues until all pixels are assigned to a region.Because seeded region growing requires seeds as additional input, the segmentation results are dependent on thechoice of seeds, and noise in the image can cause the seeds to be poorly placed.Another region-growing method is the unseeded region growing method. It is a modified algorithm that doesnot require explicit seeds. It starts with a single region —the pixel chosen here does not markedly influencethe final segmentation. At each iteration it considers the neighboring pixels in the same way as seeded regiongrowing. It differs from seeded region growing in that if the minimum is less than a predefined threshold then it is added to the respective region . If not, then the pixel is considered different from all current regions
and a new region is created with this pixel.One variant of this technique, proposed by Haralick and Shapiro (1985),[1] is based on pixel intensities. Themean and scatter of the region and the intensity of the candidate pixel are used to compute a test statistic. If thetest statistic is sufficiently small, the pixel is added to the region, and the region’s mean and scatter arerecomputed. Otherwise, the pixel is rejected, and is used to form a new region.A special region-growing method is called -connected segmentation (see also lambda-connectedness). It isbased on pixel intensities and neighborhood-linking paths. A degree of connectivity (connectedness) iscalculated based on a path that is formed by pixels. For a certain value of , two pixels are called -connected ifthere is a path linking those two pixels and the connectedness of this path is at least . -connectedness is anequivalence relation.[24]
Split-and-merge segmentation is based on a quadtree partition of an image. It is sometimes called quadtreesegmentation.This method starts at the root of the tree that represents the whole image. If it is found non-uniform (nothomogeneous), then it is split into four child squares (the splitting process), and so on. If, in contrast, four childsquares are homogeneous, they are merged as several connected components (the merging process). The node inthe tree is a segmented node. This process continues recursively until no further splits or merges are possible.[25][26] When a special data structure is involved in the implementation of the algorithm of the method, its timecomplexity can reach , an optimal algorithm of the method.[27]
Partial differential equation-based methodsUsing a partial differential equation (PDE)-based method and solving the PDE equation by a numerical scheme,one can segment the image.[28] Curve propagation is a popular technique in this category, with numerousapplications to object extraction, object tracking, stereo reconstruction, etc. The central idea is to evolve aninitial curve towards the lowest potential of a cost function, where its definition reflects the task to be addressed.As for most inverse problems, the minimization of the cost functional is non-trivial and imposes certainsmoothness constraints on the solution, which in the present case can be expressed as geometrical constraints on
Image segmentation - Wikipedia, the free encyclopedia https://en.wikipedia.org/wiki/Image_segmentation
6 of 18 4/18/2016 1:47 PM

the evolving curve.Parametric methodsLagrangian techniques are based on parameterizing the contour according to some sampling strategy and thenevolve each element according to image and internal terms. Such techniques are fast and efficient, however theoriginal "purely parametric" formulation (due to Kass, Witkin and Terzopoulos in 1987 and known as "snakes"),is generally criticized for its limitations regarding the choice of sampling strategy, the internal geometricproperties of the curve, topology changes (curve splitting and merging), addressing problems in higherdimensions, etc.. Nowadays, efficient "discretized" formulations have been developed to address theselimitations while maintaining high efficiency. In both cases, energy minimization is generally conducted using asteepest-gradient descent, whereby derivatives are computed using, e.g., finite differences.Level set methodsThe level set method was initially proposed to track moving interfaces by Osher and Sethian in 1988 and hasspread across various imaging domains in the late 90s. It can be used to efficiently address the problem ofcurve/surface/etc. propagation in an implicit manner. The central idea is to represent the evolving contour usinga signed function whose zero corresponds to the actual contour. Then, according to the motion equation of thecontour, one can easily derive a similar flow for the implicit surface that when applied to the zero level willreflect the propagation of the contour. The level set method affords numerous advantages: it is implicit, isparameter-free, provides a direct way to estimate the geometric properties of the evolving structure, allows forchange of topology, and is intrinsic. It can be used to define an optimization framework, as proposed by Zhao,Merriman and Osher in 1996. One can conclude that it is a very convenient framework for addressing numerousapplications of computer vision and medical image analysis.[29] Research into various level set data structureshas led to very efficient implementations of this method.Fast marching methodsThe fast marching method has been used in image segmentation,[30] and this model has been improved(permitting a both positive and negative speed propagation speed) in an approach called the generalized fastmarching method.[31]
Variational methodsThe goal of variational methods is to find a segmentation which is optimal with respect to a specific energyfunctional. The functionals consist of a data fitting term and a regularizing terms. A classical representative isthe Potts model defined for an image by
A minimizer is a piecewise constant image which has an optimal tradeoff between the squared L2 distanceto the given image and the total length of its jump set. The jump set of defines a segmentation. Therelative weight of the energies is tuned by the parameter . The binary variant of the Potts model, i.e., ifthe range of is restricted to two values, is often called Chan-Vese model.[32] An important generalization isthe Mumford-Shah model [33] given by
Image segmentation - Wikipedia, the free encyclopedia https://en.wikipedia.org/wiki/Image_segmentation
7 of 18 4/18/2016 1:47 PM

The functional value is the sum of the total length of the segmentation curve , the smoothness of theapproximation , and its distance to the original image . The weight of the smoothness penalty is adjusted by
. The Potts model is often called piecewise constant Mumford-Shah model as it can be seen as thedegenerate case . The optimization problems are known to be NP-hard in general but near-minimizingstrategies work well in practice. Classical algorithms are graduated non-convexity and Ambrosio-Tortorelliapproximation.
Graph partitioning methodsGraph partitioning methods are an effective tools for image segmentation since they model the impact of pixelneighborhoods on a given cluster of pixels or pixel, under the assumption of homogeneity in images. In thesemethods, the image is modeled as a weighted, undirected graph. Usually a pixel or a group of pixels areassociated with nodes and edge weights define the (dis)similarity between the neighborhood pixels. The graph(image) is then partitioned according to a criterion designed to model "good" clusters. Each partition of thenodes (pixels) output from these algorithms are considered an object segment in the image. Some popularalgorithms of this category are normalized cuts,[34] random walker,[35] minimum cut,[36] isoperimetricpartitioning,[37] minimum spanning tree-based segmentation,[38] and segmentation-based object categorization.Markov Random FieldsThe application of Markov random fields (MRF) for images was suggested in early 1984 by Geman andGeman.[39] Their strong mathematical foundation and ability to provide a global optima even when defined onlocal features proved to be the foundation for novel research in the domain of image analysis, de-noising andsegmentation. MRFs are completely characterized by their prior probability distributions, marginal probabilitydistributions, cliques, smoothing constraint as well as criterion for updating values. The criterion for imagesegmentation using MRFs is restated as finding the labelling scheme which has maximum probability for agiven set of features. The broad categories of image segmentation using MRFs are supervised and unsupervisedsegmentation.Supervised Image Segmentation using MRF and MAPIn terms of image segmentation, the function that MRFs seek to maximize is the probability of identifying alabelling scheme given a particular set of features are detected in the image. This is a restatement of theMaximum a posteriori estimation method.
Image segmentation - Wikipedia, the free encyclopedia https://en.wikipedia.org/wiki/Image_segmentation
8 of 18 4/18/2016 1:47 PM

MRF neighborhood for achosen pixel
The generic algorithm for image segmentation using MAP is given below:1. Define the neighborhood of each feature (random variable in MRF terms). Generally this includes 1st order or 2nd order neighbors.2. Set initial probabilities i for each feature as 0 or 1, where i is the set containing features extracted for pixel and define an initial set of clusters.3. Using the training data compute the mean ( li) and variance ( li) for each label. This is termed as class statistics.4. Compute the marginal distribution for the given labeling scheme i i using Bayes' theorem and the class statistics calculated earlier. A Gaussian model is used for the marginal distribution.
5. Calculate the probability of each class label given the neighborhood defined previously.Clique potentials are used to model the social impact in labeling.
6. Iterate over new prior probabilities and redefine clusters such that these probabilities are maximized. This is done using a variety of optimization algorithms described below.7. Stop when probability is maximized and labeling scheme does not change. The calculations can be implemented in log likelihood terms as well.
Optimization algorithmsEach optimization algorithm is an adaptation of models from a variety of fields and they are set apart by theirunique cost functions. The common trait of cost functions is to penalize change in pixel value as well asdifference in pixel label when compared to labels of neighboring pixels.Iterated Conditional Modes/Gradient Descent
The ICM algorithm tries to reconstruct the ideal labeling scheme by changing the values of each pixel over eachiteration and evaluating the energy of the new labeling scheme using the cost function given below,
i initial i q N(i) i q(i) .where is the penalty for change in pixel label and is the penalty for difference in label between neighboringpixels and chosen pixel. Here is neighborhood of pixel i and is the Kronecker delta function. A majorissue with ICM is that, similar to gradient descent, it has a tendency to rest over local maxima and thus notobtain a globally optimal labeling scheme.Simulated Annealing(SA)
Derived as an analogue of annealing in metallurgy, SA uses change in pixel label over iterations and estimates
Image segmentation - Wikipedia, the free encyclopedia https://en.wikipedia.org/wiki/Image_segmentation
9 of 18 4/18/2016 1:47 PM

the difference in energy of each newly formed graph to the initial data. If the newly formed graph is moreprofitable, in terms of low energy cost, given by:
new old
the algorithm selects the newly formed graph. Simulated annealing requires the input of temperature scheduleswhich directly affects the speed of convergence of the system, as well as energy threshold for minimization tooccur.Alternative Algorithms
A range of other methods exist for solving simple as well as higher order MRFs. They include Maximization ofPosterior Marginal, Multi-scale MAP estimation,[40] Multiple Resolution segmentation[41] and more. Apartfrom likelihood estimates, graph-cut using maximum flow[42] and other highly constrained graph basedmethods[43][44] exist for solving MRFs.Unsupervised Image Segmentation using MRF and Expectation MaximizationA subset of unsupervised machine learning, the Expectation–maximization algorithm is utilized to iterativelyestimate the a posterior probabilities and distributions of labeling when no training data is available and noestimate of segmentation model can be formed. A general approach is to use histograms to represent thefeatures of an image and proceed as outlined briefly in the 3-step algorithm mentioned below,1. A random estimate of the model parameters (same as in supervised learning) is utilized.2. E-Step: Estimate class statistics based on the random segmentation model defined. Using these, compute theconditional probability of belonging to a label given the feature set is calculated using naive Bayes' theorem.
Here is the set of all possible labels.
3. M-Step: The established relevance of a given feature set to a labeling scheme is now used to compute the apriori estimate of a given label in the second part of the algorithm. Since the actual number of total labels isunknown (from a training data set), a hidden estimate of the number of labels given by the user is utilized incomputations.
where is the set of all possible features.
Image segmentation - Wikipedia, the free encyclopedia https://en.wikipedia.org/wiki/Image_segmentation
10 of 18 4/18/2016 1:47 PM

Segmentation of color image usingHMRF-EM model
Disadvantages of MAP and EM based image segmentation1. Exact MAP estimates cannot be easily computed.2. Approximate MAP estimates are computationally expensive to calculate.3. Extension to multi-class labeling degrades performance and increases storage required.4. Reliable estimation of parameters for EM is required for global optima to be achieved.5. Based on method of optimization, segmentation may cluster to local minima.Implementations of MRF based Image segmentation1. HMRF-EM (http://www.mathworks.com/matlabcentral/fileexchange/37530-hmrf-em-image) Implementationof EM algorithm based image segmentation.2. Zoltan Kato’s (https://www.inf.u-szeged.hu/~kato/software/mrfdemo.html) implementation of supervisedimage segmentation using MRFs.[45][46]
3. Purdue University’s (https://engineering.purdue.edu/~bouman/grad-labs/MAP-Segmentation/)implementation of Discrete MRF and their application to segmentation.4. Gaussian Mixture Model based HMRF (http://www.mathworks.com/matlabcentral/fileexchange/39553-gmm-hmrf) segmentation in MATLAB.5. CMU’s (http://www.cs.cmu.edu/~mohitg/segmentation.htm) implementation of multiple graph cut basedsegmentation algorithms.
Watershed transformationThe watershed transformation considers the gradient magnitude of an image as a topographic surface. Pixelshaving the highest gradient magnitude intensities (GMIs) correspond to watershed lines, which represent theregion boundaries. Water placed on any pixel enclosed by a common watershed line flows downhill to acommon local intensity minimum (LIM). Pixels draining to a common minimum form a catch basin, whichrepresents a segment.
Model based segmentationThe central assumption of such an approach is that structures of interest/organs have a repetitive form of
Image segmentation - Wikipedia, the free encyclopedia https://en.wikipedia.org/wiki/Image_segmentation
11 of 18 4/18/2016 1:47 PM

geometry. Therefore, one can seek for a probabilistic model towards explaining the variation of the shape of theorgan and then when segmenting an image impose constraints using this model as prior. Such a task involves (i)registration of the training examples to a common pose, (ii) probabilistic representation of the variation of theregistered samples, and (iii) statistical inference between the model and the image. State of the art methods inthe literature for knowledge-based segmentation involve active shape and appearance models, active contoursand deformable templates and level-set based methods.
Multi-scale segmentationImage segmentations are computed at multiple scales in scale space and sometimes propagated from coarse tofine scales; see scale-space segmentation.Segmentation criteria can be arbitrarily complex and may take into account global as well as local criteria. Acommon requirement is that each region must be connected in some sense.One-dimensional hierarchical signal segmentationWitkin's seminal work[47][48] in scale space included the notion that a one-dimensional signal could beunambiguously segmented into regions, with one scale parameter controlling the scale of segmentation.A key observation is that the zero-crossings of the second derivatives (minima and maxima of the firstderivative or slope) of multi-scale-smoothed versions of a signal form a nesting tree, which defines hierarchicalrelations between segments at different scales. Specifically, slope extrema at coarse scales can be traced back tocorresponding features at fine scales. When a slope maximum and slope minimum annihilate each other at alarger scale, the three segments that they separated merge into one segment, thus defining the hierarchy ofsegments.Image segmentation and primal sketchThere have been numerous research works in this area, out of which a few have now reached a state where theycan be applied either with interactive manual intervention (usually with application to medical imaging) or fullyautomatically. The following is a brief overview of some of the main research ideas that current approaches arebased upon.The nesting structure that Witkin described is, however, specific for one-dimensional signals and does nottrivially transfer to higher-dimensional images. Nevertheless, this general idea has inspired several other authorsto investigate coarse-to-fine schemes for image segmentation. Koenderink[49] proposed to study howiso-intensity contours evolve over scales and this approach was investigated in more detail by Lifshitz andPizer.[50] Unfortunately, however, the intensity of image features changes over scales, which implies that it ishard to trace coarse-scale image features to finer scales using iso-intensity information.Lindeberg[51][52] studied the problem of linking local extrema and saddle points over scales, and proposed animage representation called the scale-space primal sketch which makes explicit the relations between structuresat different scales, and also makes explicit which image features are stable over large ranges of scale includinglocally appropriate scales for those. Bergholm proposed to detect edges at coarse scales in scale-space and thentrace them back to finer scales with manual choice of both the coarse detection scale and the fine localizationscale.Gauch and Pizer[53] studied the complementary problem of ridges and valleys at multiple scales and developed
Image segmentation - Wikipedia, the free encyclopedia https://en.wikipedia.org/wiki/Image_segmentation
12 of 18 4/18/2016 1:47 PM

a tool for interactive image segmentation based on multi-scale watersheds. The use of multi-scale watershedwith application to the gradient map has also been investigated by Olsen and Nielsen[54] and been carried overto clinical use by Dam[55] Vincken et al.[56] proposed a hyperstack for defining probabilistic relations betweenimage structures at different scales. The use of stable image structures over scales has been furthered byAhuja[57][58] and his co-workers into a fully automated system. A fully automatic brain segmentation algorithmbased on closely related ideas of multi-scale watersheds has been presented by Undeman and Lindeberg[59] andbeen extensively tested in brain databases.These ideas for multi-scale image segmentation by linking image structures over scales have also been pickedup by Florack and Kuijper.[60] Bijaoui and Rué[61] associate structures detected in scale-space above aminimum noise threshold into an object tree which spans multiple scales and corresponds to a kind of feature inthe original signal. Extracted features are accurately reconstructed using an iterative conjugate gradient matrixmethod.
Semi-automatic segmentationIn one kind of segmentation, the user outlines the region of interest with the mouse clicks and algorithms areapplied so that the path that best fits the edge of the image is shown.Techniques like SIOX, Livewire, Intelligent Scissors or IT-SNAPS are used in this kind of segmentation. In analternative kind of semi-automatic segmentation, the algorithms return a spatial-taxon (i.e. foreground, object-group, object or object-part) selected by the user or designated via prior probabilities.[62][63]
Trainable segmentationMost segmentation methods are based only on color information of pixels in the image. Humans use much moreknowledge than this when doing image segmentation, but implementing this knowledge would costconsiderable computation time and would require a huge domain-knowledge database, which is currently notavailable. In addition to traditional segmentation methods, there are trainable segmentation methods which canmodel some of this knowledge.Neural Network segmentation relies on processing small areas of an image using an artificial neural network[64]or a set of neural networks. After such processing the decision-making mechanism marks the areas of an imageaccordingly to the category recognized by the neural network. A type of network designed especially for this isthe Kohonen map.Pulse-coupled neural networks (PCNNs) are neural models proposed by modeling a cat’s visual cortex anddeveloped for high-performance biomimetic image processing. In 1989, Eckhorn introduced a neural model toemulate the mechanism of a cat’s visual cortex. The Eckhorn model provided a simple and effective tool forstudying the visual cortex of small mammals, and was soon recognized as having significant applicationpotential in image processing. In 1994, the Eckhorn model was adapted to be an image processing algorithm byJohnson, who termed this algorithm Pulse-Coupled Neural Network. Over the past decade, PCNNs have beenutilized for a variety of image processing applications, including: image segmentation, feature generation, faceextraction, motion detection, region growing, noise reduction, and so on. A PCNN is a two-dimensional neuralnetwork. Each neuron in the network corresponds to one pixel in an input image, receiving its correspondingpixel’s color information (e.g. intensity) as an external stimulus. Each neuron also connects with its neighboringneurons, receiving local stimuli from them. The external and local stimuli are combined in an internal activationsystem, which accumulates the stimuli until it exceeds a dynamic threshold, resulting in a pulse output. Through
Image segmentation - Wikipedia, the free encyclopedia https://en.wikipedia.org/wiki/Image_segmentation
13 of 18 4/18/2016 1:47 PM

iterative computation, PCNN neurons produce temporal series of pulse outputs. The temporal series of pulseoutputs contain information of input images and can be utilized for various image processing applications, suchas image segmentation and feature generation. Compared with conventional image processing means, PCNNshave several significant merits, including robustness against noise, independence of geometric variations ininput patterns, capability of bridging minor intensity variations in input patterns, etc.Open-source implementations of trainable segmentation:
Trainable Segmentation (in Java) (http://fiji.sc/wiki/index.php/Trainable_Weka_Segmentation)IMMI (http://www.burgsys.com/image-processing-software-free.php)
Other methodsThere are many other methods of segmentation like multispectral segmentation or connectivity-basedsegmentation based on DTI images.[65]
Segmentation benchmarkingSeveral segmentation benchmarks are available for comparing the performance of segmentation methods withthe state-of-the-art segmentation methods on standardized sets:
Prague On-line Texture Segmentation Benchmark (http://mosaic.utia.cas.cz)[66]The Berkeley Segmentation Dataset and Benchmark (http://www.eecs.berkeley.edu/Research/Projects/CS/vision/bsds/)[67]
See alsoComputer visionImage-based meshingRange image segmentationVector quantizationImage quantizationColor quantization
NotesLinda G. Shapiro and George C. Stockman (2001):“Computer Vision”, pp 279-325, New Jersey,Prentice-Hall, ISBN 0-13-030796-3
1.
Barghout, Lauren, and Lawrence W. Lee. "Perceptualinformation processing system." Paravue Inc. U.S.Patent Application 10/618,543, filed July 11, 2003.
2.
Pham, Dzung L.; Xu, Chenyang; Prince, Jerry L.(2000). "Current Methods in Medical ImageSegmentation". Annual Review of BiomedicalEngineering 2: 315–337.doi:10.1146/annurev.bioeng.2.1.315.PMID 11701515.
3.
Forghani, M.; Forouzanfar, M.; Teshnehlab, M.(2010). "Parameter optimization of improved fuzzyc-means clustering algorithm for brain MR imagesegmentation". Engineering Applications of ArtificialIntelligence 23 (2): 160–168.
4.
W. Wu, A. Y. C. Chen, L. Zhao and J. J. Corso(2014): "Brain Tumor detection and segmentation in aCRF framework with pixel-pairwise affinity andsuper pixel-level features", International Journal ofComputer Aided Radiology and Surgery, pp. 241-253,Vol. 9.
5.
Image segmentation - Wikipedia, the free encyclopedia https://en.wikipedia.org/wiki/Image_segmentation
14 of 18 4/18/2016 1:47 PM

E. B. George and M. Karnan (2012): "MR Brainimage segmentation using Bacteria ForagingOptimization Algorithm", International Journal ofEngineering and Technology, Vol. 4.
6.
J. A. Delmerico, P. David and J. J. Corso (2011):"Building façade detection, segmentation andparameter estimation for mobile robot localizationand guidance", International Conference onIntelligent Robots and Systems, pp. 1632-1639.
7.
Batenburg, K J.; Sijbers, J. "Adaptive thresholding oftomograms by projection distance minimization".Pattern Recognition 42 (10): 2297–2305.doi:10.1016/j.patcog.2008.11.027.
8.
K J. Batenburg, and J. Sijbers, "Optimal ThresholdSelection for Tomogram Segmentation by ProjectionDistance Minimization", IEEE Transactions onMedical Imaging, vol. 28, no. 5, pp. 676-686, June,2009 PDF (http://www.visielab.ua.ac.be/publications/optimal-threshold-selection-tomogram-segmentation-projection-distance-minimization)
9.
A. Kashanipour, N Milani, A. Kashanipour, H.Eghrary," Robust Color Classification Using FuzzyRule-Based Particle Swarm Optimization", IEEECongress on Image and Signal Processing, vol. 2, pp.110-114 , May, 2008 [1] (http://ieeexplore.ieee.org/xpl/login.jsp?tp=&arnumber=4566278&url=http%3A%2F%2Fieeexplore.ieee.org%2Fxpls%2Fabs_all.jsp%3Farnumber%3D4566278)
10.
Barghout, Lauren, and Jacob Sheynin. "Real-worldscene perception and perceptual organization:Lessons from Computer Vision." Journal of Vision13.9 (2013): 709-709.
11.
Hossein Mobahi, Shankar Rao, Allen Yang, ShankarSastry and Yi Ma. (2011). "Segmentation of NaturalImages by Texture and Boundary Compression"(PDF). International Journal of Computer Vision(IJCV) 95: 86–98.
12.
Shankar Rao, Hossein Mobahi, Allen Yang, ShankarSastry and Yi Ma Natural Image Segmentation withAdaptive Texture and Boundary Encoding(http://perception.csl.illinois.edu/coding/papers/RaoS2009-ACCV.pdf), Proceedings of the AsianConference on Computer Vision (ACCV) 2009, H.Zha, R.-i. Taniguchi, and S. Maybank (Eds.), Part I,LNCS 5994, pp. 135--146, Springer.
13.
Ohlander, Ron; Price, Keith; Reddy, D. Raj (1978)."Picture Segmentation Using a Recursive RegionSplitting Method". Computer Graphics and ImageProcessing 8 (3): 313–333.doi:10.1016/0146-664X(78)90060-6.
14.
R. Kimmel and A.M. Bruckstein.http://www.cs.technion.ac.il/~ron/PAPERS/Paragios_chapter2003.pdf, International Journal ofComputer Vision 2003; 53(3):225-243.
15.
R. Kimmel, http://www.cs.technion.ac.il/~ron/PAPERS/laplacian_ijcv2003.pdf, chapter inGeometric Level Set Methods in Imaging, Vision andGraphics, (S. Osher, N. Paragios, Eds.), SpringerVerlag, 2003. ISBN 0387954880
16.
Barghout, Lauren. Visual Taxometric approach ImageSegmentation using Fuzzy-Spatial Taxon Cut YieldsContextually Relevant Regions. Communications inComputer and Information Science (CCIS). Springer-Verlag. 2014
17.
Witold Pedrycz (Editor), Andrzej Skowron(Co-Editor), Vladik Kreinovich (Co-Editor).Handbook of Granular Computing. Wiley 2008
18.
Barghout, Lauren (2014). Vision. Global ConceptualContext Changes Local Contrast Processing (Ph.D.Dissertation 2003). Updated to include ComputerVision Techniques. Scholars' Press. ISBN978-3-639-70962-9.
19.
Barghout, Lauren, and Lawrence Lee. "Perceptualinformation processing system." Google Patents
20. Lindeberg, T.; Li, M.-X. (1997). "Segmentation andclassification of edges using minimum descriptionlength approximation and complementary junctioncues". Computer Vision and Image Understanding 67(1): 88–98.
21.
(http://gth.krammerbuch.at/sites/default/files/articles/AHAH%20callback/01_Guberman_KORR.pdf)Shelia Guberman, VadimV. Maximov, Alex Pashintsev Gestalt and ImageUnderstanding. GESTALT THEORY 2012, Vol. 34,No.2, 143-166.
22.
R. Nock and F. Nielsen, Statistical Region Merging,IEEE Transactions on Pattern Analysis and MachineIntelligence, Vol 26, No 11, pp 1452-1458, 2004.
23.
L. Chen, H. D. Cheng, and J. Zhang, Fuzzy subfiberand its application to seismic lithology classification,Information Sciences: Applications, Vol 1, No 2, pp77-95, 1994.
24.
S.L. Horowitz and T. Pavlidis, Picture Segmentationby a Directed Split and Merge Procedure, Proc. ICPR,1974, Denmark, pp.424-433.
25.
S.L. Horowitz and T. Pavlidis, Picture Segmentationby a Tree Traversal Algorithm, Journal of the ACM,23 (1976), pp. 368-388.
26.
L. Chen, The lambda-connected segmentation and theoptimal algorithm for split-and-merge segmentation(http://www.spclab.com/research/lambda/lambdaConn91.pdf), Chinese J. Computers,14(1991), pp 321-331
27.
V. Caselles, R. Kimmel, and G. Sapiro. Geodesicactive contours. International Journal of ComputerVision, 22(1):61-79, 1997.http://www.cs.technion.ac.il/~ron/PAPERS/CasKimSap_IJCV1997.pdf
28.
Image segmentation - Wikipedia, the free encyclopedia https://en.wikipedia.org/wiki/Image_segmentation
15 of 18 4/18/2016 1:47 PM

S. Osher and N. Paragios. Geometric Level SetMethods in Imaging Vision and Graphics(http://www.mas.ecp.fr/vision/Personnel/nikos/osher-paragios/), Springer Verlag, ISBN 0-387-95488-0,2003.
29.
James A. Sethian. "Segmentation in MedicalImaging". Retrieved 15 January 2012.
30. Forcade, Nicolas; Le Guyader, Carole; Gout,Christian (July 2008), "Generalized fast marchingmethod: applications to image segmentation",Numerical Algorithms 48 (1-3): 189–211,doi:10.1007/s11075-008-9183-x
31.
Chan, T.F.; Vese, L. (2001). "Active contours withoutedges". IEEE Transactions on Image Processing 10(2): 266–277. doi:10.1109/83.902291.
32.
David Mumford and Jayant Shah (1989): Optimalapproximations by piecewise smooth functions andassociated variational problems, Communications onPure and Applied Mathematics, pp 577-685, Vol. 42,No. 5
33.
Jianbo Shi and Jitendra Malik (2000): "NormalizedCuts and Image Segmentation"(http://www.cs.cmu.edu/~jshi/papers/pami_ncut.pdf),IEEE Transactions on pattern analysis and machineintelligence, pp 888-905, Vol. 22, No. 8
34.
Leo Grady (2006): "Random Walks for ImageSegmentation" (http://www.cns.bu.edu/~lgrady/grady2006random.pdf), IEEE Transactions onPattern Analysis and Machine Intelligence, pp.1768–1783, Vol. 28, No. 11
35.
Z. Wu and R. Leahy (1993): "An optimal graphtheoretic approach to data clustering: Theory and itsapplication to image segmentation" (ftp://sipi.usc.edu/pub/leahy/pdfs/MAP93.pdf), IEEE Transactions onPattern Analysis and Machine Intelligence, pp.1101–1113, Vol. 15, No. 11
36.
Leo Grady and Eric L. Schwartz (2006):"Isoperimetric Graph Partitioning for ImageSegmentation" (http://www.cns.bu.edu/~lgrady/grady2006isoperimetric.pdf), IEEE Transactions onPattern Analysis and Machine Intelligence, pp.469–475, Vol. 28, No. 3
37.
C. T. Zahn (1971): "Graph-theoretical methods fordetecting and describing gestalt clusters"(http://web.cse.msu.edu/~cse802/Papers/zahn.pdf),IEEE Transactions on Computers, pp. 68–86, Vol. 20,No. 1
38.
S. Geman and D. Geman (1984): "Stochasticrelaxation, Gibbs Distributions and BayesianRestoration of Images", IEEE Transactions on PatternAnalysis and Machine Intelligence, pp. 721-741, Vol.6, No.6.
39.
A. Bouman and M. Shapiro (2002): "A multiscaleRandom field model for Bayesian imagesegmentation", IEEE Transactions on ImageProcessing, pp. 162-177, Vol. 3.
40.
J. Liu and Y. H. Yang (1994): "Multiresolution colorimage segmentation", IEEE Transactions on PatternAnalysis and Machine Intelligence, pp. 689-700, Vol.16.
41.
S. Vicente, V. Kolmogrov and C. Rother (2008):"Graph cut based image segmentation withconnectivity priors", CVPR
42.
Corso, Z. Tu, and A. Yuille (2008): "MRF Labellingwith Graph-Shifts Algorithm", Proceedings ofInternational workshop on combinatorial ImageAnalysis
43.
B. J. Frey and D. MacKayan (1997): "A Revolution:Belief propagation in Graphs with Cycles",Proceedings of Neural Information ProcessingSystems (NIPS)
44.
Z. Kato, J. Zerubia and M. Berthod (1992): "SatelliteImage classification using modified metropolisdynamic", Proceedings of International Conferenceon Acoustics, Speech and Signal Processing, pp.573-576, Vol. 3.
45.
Z. Kato, "Modelisations markoviennesmultiresolutions en vision par ordinateur", Thesis1994.
46.
Witkin, A. P. "Scale-space filtering", Proc. 8th Int.Joint Conf. Art. Intell., Karlsruhe,Germany,1019–1022, 1983.
47.
A. Witkin, "Scale-space filtering: A new approach tomulti-scale description," in Proc. IEEE Int. Conf.Acoust., Speech, Signal Processing (ICASSP), vol. 9,San Diego, CA, Mar. 1984, pp. 150–153.
48.
Koenderink, Jan "The structure of images",Biological Cybernetics, 50:363–370, 1984
49. Lifshitz, L. and Pizer, S.: A multiresolutionhierarchical approach to image segmentation based onintensity extrema, IEEE Transactions on PatternAnalysis and Machine Intelligence, 12:6, 529–540,1990. (http://portal.acm.org/citation.cfm?id=80964&dl=GUIDE&coll=GUIDE)
50.
Lindeberg, T.: Detecting salient blob-like imagestructures and their scales with a scale-space primalsketch: A method for focus-of-attention, InternationalJournal of Computer Vision, 11(3), 283–318, 1993.(http://www.nada.kth.se/~tony/abstracts/Lin92-IJCV.html)
51.
Lindeberg, Tony, Scale-Space Theory in ComputerVision, Kluwer Academic Publishers, 1994(http://www.nada.kth.se/~tony/book.html), ISBN0-7923-9418-6
52.
Image segmentation - Wikipedia, the free encyclopedia https://en.wikipedia.org/wiki/Image_segmentation
16 of 18 4/18/2016 1:47 PM

Gauch, J. and Pizer, S.: Multiresolution analysis ofridges and valleys in grey-scale images, IEEETransactions on Pattern Analysis and MachineIntelligence, 15:6 (June 1993), pages: 635–646, 1993.(http://portal.acm.org/citation.cfm?coll=GUIDE&dl=GUIDE&id=628490)
53.
Olsen, O. and Nielsen, M.: Multi-scale gradientmagnitude watershed segmentation, Proc. of ICIAP97, Florence, Italy, Lecture Notes in ComputerScience, pages 6–13. Springer Verlag, September1997.
54.
Dam, E., Johansen, P., Olsen, O. Thomsen,, A.Darvann, T. , Dobrzenieck, A., Hermann, N., Kitai,N., Kreiborg, S., Larsen, P., Nielsen, M.: "Interactivemulti-scale segmentation in clinical use" in EuropeanCongress of Radiology 2000.
55.
Vincken, K., Koster, A. and Viergever, M.:Probabilistic multiscale image segmentation(https://dx.doi.org/10.1109/34.574787), IEEETransactions on Pattern Analysis and MachineIntelligence, 19:2, pp. 109–120, 1997.]
56.
M. Tabb and N. Ahuja, Unsupervised multiscaleimage segmentation by integrated edge and regiondetection, IEEE Transactions on Image Processing,Vol. 6, No. 5, 642–655, 1997.(http://vision.ai.uiuc.edu/~msingh/segmen/seg/MSS.html)
57.
E. Akbas and N. Ahuja, "From ramp discontinuitiesto segmentation tree" (http://www.springerlink.com/content/44627w1458284738/)
58.
C. Undeman and T. Lindeberg (2003) "FullyAutomatic Segmentation of MRI Brain Images usingProbabilistic Anisotropic Diffusion and Multi-ScaleWatersheds", Proc. Scale-Space'03, Isle of Skye,Scotland, Springer Lecture Notes in ComputerScience, volume 2695, pages 641--656.(http://www.csc.kth.se/cvap/abstracts/cvap285.html)
59.
Florack, L. and Kuijper, A.: The topological structureof scale-space images, Journal of MathematicalImaging and Vision, 12:1, 65–79, 2000.
60.
Bijaoui, A., Rué, F.: 1995, A Multiscale VisionModel, Signal Processing 46, 345 (http://dx.doi.org/10.1016/0165-1684(95)00093-4)
61.
Barghout, Lauren. Visual Taxometric Approach toImage Segmentation using Fuzzy-Spatial Taxon CutYields Contextually Relevant Regions. IPMU 2014,Part II. A. Laurent et al (Eds.) CCIS 443, pp 163-173.Springer International Publishing Switzerland
62.
Barghout, Lauren (2014). Vision: How GlobalPerceptual Context Changes Local ContrastProcessing (Ph.D. Dissertation 2003). Updated toinclude Computer Vision Techniques. Scholars Press.ISBN 978-3-639-70962-9.
63.
Mahinda Pathegama & Ö Göl (2004): "Edge-endpixel extraction for edge-based image segmentation",Transactions on Engineering, Computing andTechnology, vol. 2, pp 213–216, ISSN 1305-5313
64.
Menke, RA, Jbabdi, S, Miller, KL, Matthews, PM andZarei, M.: Connectivity-based segmentation of thesubstantia nigra in human and its implications inParkinson's disease (https://dx.doi.org/10.1016/j.neuroimage.2010.05.086), Neuroimage, 52:4, pp.1175–80, 2010.]
65.
Haindl, M. – Mikeš, S. Texture SegmentationBenchmark (http://dx.doi.org/10.1109/ICPR.2008.4761118), Proc. of the 19th Int.Conference on Pattern Recognition. IEEE ComputerSociety, 2008, pp. 1–4 ISBN 978-1-4244-2174-9ISSN 1051-4651
66.
D.Martin; C. Fowlkes; D. Tal; J. Malik (July 2001)."A Database of Human Segmented Natural Imagesand its Application to Evaluating SegmentationAlgorithms and Measuring Ecological Statistics".Proc. 8th Int'l Conf. Computer Vision. pp. 416–423.
67.
References3D Entropy Based Image Segmentation (http://web.archive.org/web/20080314011622/http://instrumentation.hit.bg:80/Papers/2008-02-02%203D%20Multistage%20Entropy.htm)Frucci, Maria; Sanniti di Baja, Gabriella (2008). "From Segmentation to Binarization of Gray-level Images". Journalof Pattern Recognition Research 3 (1): 1–13. doi:10.13176/11.54.
External linksSome sample code that performs basic segmentation (http://csc.fsksm.utm.my/syed/projects/image-processing.html), by Syed Zainudeen. University Technology of Malaysia.Generalized Fast Marching method (http://rd.springer.com/article/10.1007/s11075-008-9183-x) byForcadel et al. [2008] for applications in image segmentation.Image Processing Research Group (http://www.iprg.co.in) An Online Open Image Processing Research
Image segmentation - Wikipedia, the free encyclopedia https://en.wikipedia.org/wiki/Image_segmentation
17 of 18 4/18/2016 1:47 PM

Community.Segmentation methods in image processing and analysis (https://www.mathworks.com/discovery/image-segmentation.html)More image segmentation methods with detailed algorithms (http://disp.ee.ntu.edu.tw/meeting/%E6%98%B1%E7%BF%94/Segmentation%20tutorial.pdf) by Yu-Hsiang Wang (王昱翔), National TaiwanUniversity, Taipei, Taiwan, ROC
Retrieved from "https://en.wikipedia.org/w/index.php?title=Image_segmentation&oldid=709497296"Categories: Image segmentation
This page was last modified on 11 March 2016, at 07:49.Text is available under the Creative Commons Attribution-ShareAlike License; additional terms mayapply. By using this site, you agree to the Terms of Use and Privacy Policy. Wikipedia® is a registeredtrademark of the Wikimedia Foundation, Inc., a non-profit organization.
Image segmentation - Wikipedia, the free encyclopedia https://en.wikipedia.org/wiki/Image_segmentation
18 of 18 4/18/2016 1:47 PM