Embed Size (px)
Citation preview

The Islamic University of Gaza
Graduate Studies Deanship
Faculty of Engineering
Computer Engineering Department
Image Retrieval Based on Content Using Color Feature
By
Ahmed Jamal Afifi
Supervisor
Dr. Wesam M. Ashour
A Thesis Submitted in Partial Fulfillment of the Requirements for the
Degree of Master in Computer Engineering
م 2011 -ھـ 1432

II
Acknowledgement First, I thank Allah who inspired me and gave me favors to complete this thesis. My
heartiest gratitude to my beloved family: my martyr father, my mother, my wife, my
children Mohammed and Sarah, and my brothers and sisters; whom without I would have
never been able to accomplish this work.
I am heartily thankful to my advisor, Dr. Wesam Ashour, whose continuous
encouragement, insightful criticism, and endless support from the initial to the final level
enabled me to deliver this final work.
Finally, I offer my regards and blessings to all of those who supported me in any
respect during the completion of the thesis.
Ahmed J. Afifi

III
Table of Contents
ACKNOWLEDGEMENT ................................................................................................... II
LIST OF FIGURES ............................................................................................................. V
LIST OF ABBREVIATIONS .......................................................................................... VII
IMAGE RETRIEVAL BASED ON CONTENT USING COLOR FEATURE ........ VIII
ABSTRACT ..................................................................................................................... VIII
IX .......................................................................................................................... ملخص الرسالة
CHAPTER 1 - INTRODUCTION ....................................................................................... 1
1.1 THE GROWTH OF DIGITAL IMAGING ................................................................................ 1 1.2 THE NEED OF IMAGE DATA MANAGEMENT ...................................................................... 1 1.3 INFORMATION RETRIEVAL PROBLEMS ............................................................................ 2 1.4 WHAT IS CONTENT BASED IMAGE RETRIEVAL (CBIR) .................................................. 2 1.5 THE IMPORTANCE OF CONTENT BASED IMAGE RETRIEVAL............................................ 5 1.6 PRACTICAL APPLICATION ............................................................................................... 6 1.7 MOTIVATION OF THIS WORK .......................................................................................... 7 1.8 OUTLINE OF THIS THESIS ............................................................................................... 9
CHAPTER 2 - REVIEW OF RELATED WORKS ......................................................... 11
2.1 INTRODUCTION ............................................................................................................. 11 2.2 GENERAL PURPOSE SYSTEMS ....................................................................................... 12
2.2.1 QBIC ..................................................................................................................... 12 2.2.2 NETRA ................................................................................................................. 13 2.2.3 KIWI ..................................................................................................................... 13 2.2.4 ImageMiner .......................................................................................................... 14 2.2.5 Photobook ............................................................................................................. 14
2.3 COLOR BASED APPROACHES ........................................................................................ 14
CHAPTER 3 - RANKLET TRANSFORM ...................................................................... 19
3.1 INTRODUCTION ............................................................................................................. 19 3.2 BASIC IMAGE CONCEPTS .............................................................................................. 19 3.3 RANKLET TRANSFORM ................................................................................................. 20
3.3.1 Non-Parametric Statistics ..................................................................................... 21 3.3.1.1 Rank Transform ............................................................................................. 21 3.3.1.2 Wilcoxon Test ................................................................................................ 22 3.3.1.3 Mann Whitney Test ....................................................................................... 23
3.3.2 Orientation Selectivity .......................................................................................... 24 3.3.2.1 Ranklet Coefficients ...................................................................................... 25
IV
3.3.3 The Multi-Resolution ........................................................................................... 27
CHAPTER 4 - FUNDAMENTALS OF IMAGE RETRIEVAL .................................... 29
4.1 INTRODUCTION ............................................................................................................. 29 4.2 FEATURE EXTRACTION ................................................................................................. 30
4.2.1 Color ..................................................................................................................... 30 4.2.1.1 Color Fundamentals ....................................................................................... 31
4.2.2 Texture .................................................................................................................. 37 4.2.3 Shape .................................................................................................................... 41
4.3 SIMILARITY MEASURES ................................................................................................ 42 4.4 INDEXING SCHEMA ....................................................................................................... 43
CHAPTER 5 - IMAGE RETRIEVAL BASED ON CONTENT .................................... 45
5.1 COLOR FEATURE EXTRACTION ..................................................................................... 45 5.2 K-MEANS FOR DATABASE CLUSTERING ....................................................................... 46 5.3 THE PROPOSED CBIR SYSTEM ..................................................................................... 50
CHAPTER 6 - SYSTEM RESULTS AND EVALUATION ........................................... 55
6.1 INTRODUCTION ............................................................................................................. 55 6.2 WANG DATABASE ...................................................................................................... 55 6.3 IMPLEMENTATION ENVIRONMENT ................................................................................ 56 6.4 PERFORMANCE EVALUATION METRICS FOR CBIR SYSTEMS ....................................... 57 6.5 THE PROPOSED SYSTEM EVALUATION .......................................................................... 58 6.6 COMPARISON OF THE PROPOSED SYSTEM WITH OTHER SYSTEMS ................................ 66
CHAPTER 7 - CONCLUSION AND FUTURE WORK ................................................ 69
7.1 CONCLUSION ................................................................................................................ 69 7.2 LIMITATIONS ................................................................................................................ 70 7.3 RECOMMENDATIONS AND FUTURE WORKS .................................................................. 70
REFERENCES .................................................................................................................... 72

V
List of Figures
FIGURE 3.1: RANKLET TRANSFORM ORIENTATION-SELECTIVE ANALYSIS. ............................. 25
FIGURE 3.2: RANKLET TRANSFORM APPLIED TO SOME SYNTHETIC IMAGES. .......................... 26
FIGURE 3.3: MULTI-RESOLUTION RANKLET TRANSFORM AT DIFFERENT RESOLUTIONS. ....... 28
FIGURE 4.1: COLOR SPECTRUM SEEN BY PASSING WHITE LIGHT THROUGH A PRISM. .............. 31
FIGURE 4.2: RGB COLOR SPACE. .......................................................................................... 33
FIGURE 4.3: AN RGB IMAGE AND ITS COMPONENTS. ............................................................. 35
FIGURE 4.4: SAMPLE IMAGE AND ITS COLOR HISTOGRAMS. .................................................. 37
FIGURE 4.5: EXAMPLES OF SIMPLE AND COMPLEX TEXTURE IMAGES. .................................. 38
FIGURE 4.6: HOW TO CREATE GLCM. ................................................................................... 40
FIGURE 5.1: THE PREPROCESSING STEP. ................................................................................. 51
FIGURE 6.1: ONE EXAMPLE IMAGE FROM EACH OF THE 10 CLASSES OF THE WANG
DATABASE. ..................................................................................................................... 55
FIGURE 6.2: BEACH QUERY, THE TOP 10 RETRIEVED IMAGES. .............................................. 60
FIGURE 6.3: BUILDING QUERY, THE TOP 10 RETRIEVED IMAGES. ......................................... 60
FIGURE 6.4: HORSE QUERY, THE TOP 10 RETRIEVED IMAGES. .............................................. 61
FIGURE 6.5: FLOWER QUERY, THE TOP 10 RETRIEVED IMAGES. ........................................... 62
FIGURE 6.6: ELEPHANT QUERY, THE TOP 10 RETRIEVED IMAGES. ........................................ 63
FIGURE 6.7: THE AVERAGE PRECISION/RECALL CHART OF THE PROPOSED SYSTEM............. 64
FIGURE 6.8: COMPARISON OF PRECISION OF THE PROPOSED SYSTEM APPLIED WITH
CLUSTERING AND WITHOUT CLUSTERING. ..................................................................... 65
FIGURE 6.9: COMPARISON OF PRECISION OF THE PROPOSED SYSTEM WITH PREVIOUSLY
EXISTED SYSTEMS. ......................................................................................................... 68

VI
LIST OF TABLES
TABLE 5.1: THE K-MEANS ALGORITHM ................................................................................. 49
TABLE 5.2: THE PROPOSED CBIR ALGORITHM ...................................................................... 54
TABLE 6.1: COMPARISON OF PRECISION OF THE PROPOSED SYSTEM WITH PREVIOUSLY
EXISTED SYSTEMS. ......................................................................................................... 67

VII
List of Abbreviations
AMORE : Advanced Multimedia Oriented Retrieval Engine (A World Wide Web Image Retrieval Engine)
CBIR : Content Based Image Retrieval
CCM : Color Co-occurrence Matrix
CHKM : Color Histogram for K-Means
CIE : International Commission of Illumination
CMY : Cyan, Magenta, and Yellow Color Space
CSH : Color Shape Histogram
DBPSP : Different Between Pixels of Scan Pattern
GCH : Global Color Histogram
GLCM : Gray Level Co-occurrence Matrix
HSV : Hue, Saturation, and Value Color Space
KIWI : Key-point Indexing Web Interface
LCH : Local Color Histogram
MARS : Multimedia Analysis and Retrieval System
MIT : Massachusetts Institute of Technology
QBIC : Query By Image Content
RGB : Red, Green, and Blue Color Space
SSE : Sum of Squared-Error
SVM : Support Vector Machine
VIR : Visual Information Retrieval
WBIIS : Wavelet-Based Image Indexing and Searching

VIII
Image Retrieval Based on Content Using Color Feature By
Ahmed Jamal Afifi
Abstract In various application domains such as education, crime prevention, commerce, and
biomedicine, the volume of digital data is increasing rapidly. The problem appears when
retrieving the information from the storage media. Content-based image retrieval systems
aim to retrieve images from large image databases similar to the query image based on the
similarity between image features.
In this thesis we present a CBIR system that uses the color feature as a visual
feature to represent the images. We use the images from the WANG database that is widely
used for CBIR performance evaluation. The database contains color images, so we use the
RGB color space to represent the images. We use the Ranklet Transform to make the image
invariant to rotation and any image enhancement operations. This is a preprocessing step
performed on every image. For the resulting ranklet images we extract the color feature by
calculating the color moments. The color moments are invariant to rotation and scaling.
This is a benefit of our system. To speed up the retrieval time, images are clustered
according to their features using k-means clustering algorithm.
Finally, we compared with other existing systems that use the same features to
represent the images. We show the outperforming of our system against the other systems.

IX
باستخدام میزة اللونالمحتوى استرجاع الصورة استنادا إلى
مقدم من
أحمد جمال عفیفي
ملخص الرسالةالطب والتجارة و الجریمةمنع و التعلیم مثل المختلفة التطبیق مجاالتفي یزداد حجم البیانات الرقمیة
سترجاع الصور استنادا یهدف نظام ا، وسائط التخزین المعلومات من استرجاع ندع المشكلةظهر ، بشكل سریع الحیوي
یستند التشابه بین الصور إلى مالمح ، قواعد البیانات والتي تشابه الصورة المدخلة من صورالاسترداد إلى إلى المحتوى
الصورة نفسها.
باستخدام میزة اللون كمیزة لوصف إلى المحتوىسترجاع الصور استنادا في هذة األطروحة نقدم نظاما ال
تحتوي قاعدة ، النظامالبیانات وانغ للصور والتي تستخدم كثیرا لتقییم أداء مثل هذا ةعدالقد قمنا باستخدام ق، الصورة
نظام لقد قمنا باستخدام ،لتمثیل الصور RGBلذلك سنستخدم نظام ،على مجموعة من الصور الملونة البیانات هذه
یتم استخدام ،هذه خطوة تحضیریة یتم تنفیذها على جمیع الصور ،التحویل الرتیبة لجعل الصورة غیر متأثرة للدوران
ولتقلیل الوقت في عملیة ،)Color Momentsلحساب بعض القیم اإلحصائیة ( یةالصور الناتجة من الخطوة التحضیر
k-meansالصور تبعا لممیزاتها. قمنا باستخدام الخوارزمیة یتم تصنیف ،استرجاع الصور نقوم بعملیة تصنیفیة للصورة
لتصنیف الصور الموجودة في قاعدة البیانات.
ة النتائج التي حصلنا علیها من نظامنا المقترح بأنظمة استرجاع للصور أخرى تعمل بنفس نأخیرا قمنا بمقار
أظهرت النتائج تفوق نظامنا. ،آلیة عمل نظامنا

1
Chapter 1 - Introduction
1.1 The growth of digital imaging Imaging has played an important role in our life. Our ancestors used the walls of
their caves to paint some pictures telling us some information about their life. With the
beginning of the twenty century, imaging has grown with an unparalleled way in all our
walks of life. Now, images play an important role in many fields such as medicine,
journalism, education and entertainment. By the revolution of computers, a wide range of
techniques helps us for image capturing, processing, storage, and transmitting. The
emergence of the World-Wide Web enables users to access data from any place and
provides the exploitation of digital images in any fields [1].
Naturally, when the amount of data becomes larger and larger, it will be useless
unless there are effective methods to access. Problems with effective search and navigation
through the data can be solved by information retrieval.
1.2 The need of image data management Until now, information collected all over the world about any branch of science is
increasing day by day. This information is categorized and stored on computers. To retrieve
any information, we have to search for it among all the information collected and stored in
that computer. Nowadays, using the internet to search for any information is easy.
Unfortunately, the search engine will retrieve millions of results related to the search topic.
Therefore, smart and fast techniques of search are needed to facilitate the search and
retrieve issue.
In fact, storing and managing images are not as easy as we consider. Some methods
of cataloguing and indexing are needed. The main problem arises when storing images is

2
the difficulty of locating the desired image in large and varied collections of images.
Searching for an image by text such as a name or description is not good enough in a large
database. While it is desirable to search for an image in a small database by browsing, more
effective retrieval techniques are needed with databases containing thousands of items.
These methods save time and facilitate getting the required image [1].
1.3 Information retrieval Problems From the past and until now, images from different fields are stored in groups as
image databases. For each field, thousands of images have some common features. If we
want to search for a certain image, the primitive methods, like search by text or image
description, are not accurate and time consuming. These images are used in all fields such
as medical, engineering, educational, sports, criminal, and many of them. For example,
images in medical fields such as X- rays are used for diagnoses and research purpose. For
criminal field, face recognition is used for retrieving the suspicious people. As we
mentioned before, to search for an image in a huge image database, it is not efficient to use
text or image descriptors. To overcome this problem, a new technique called content based
image retrieval is used to search and retrieve an image from the database [2].
1.4 What is Content Based Image Retrieval (CBIR) Content Based Image Retrieval (CBIR) is the retrieval of images based on their
visual features such as color, texture, and shape [3]. The first use of the concept content
based image retrieval was by Kato to describe his experiments for retrieving images from a
database using color and shape features. After that this term (CBIR) has been used widely
for the process of retrieving images from a large collection of images based on features
(color, shape, and texture) that is the signature of the image.

3
CBIR systems have become a reliable tool for many image database applications.
There are several advantages of CBIR techniques over other simple image retrieval
approaches such as text-based retrieval techniques. CBIR provided solution for many types
of image information management systems such as medical imagery, criminology, and
satellite imagery.
CBIR differs from classical information retrieval in that image databases are
essentially unstructured, since digitized images consist purely of arrays of pixel intensities,
with no inherent meaning. One of the key issues with any kind of image processing is the
need to extract useful information from the raw data (such as recognizing the presence of
particular shapes or textures) before any kind of reasoning about the image’s contents is
possible [4].
Research and development issues in CBIR cover a range of topics, many shared
with mainstream image processing and information retrieval. Some of the most important
issues are [1]:
• Understanding image users’ needs and information-seeking behavior.
• Identification of suitable ways of describing image content.
• Extracting such features from raw images.
• Providing compact storage for large image databases.
• Matching query and stored images in a way that reflects human similarity
judgments.
• Efficiently accessing stored images by content.
• Providing usable human interfaces to CBIR systems.

4
CBIR are used in many fields like image processing and computer vision. It is not a
subset of these fields as some say. It differs from these fields at the techniques used for
image retrieval with some desired characteristics from large databases. However, image
processing covers a wider field such as image enhancement, compression, restoration, and
transmission. For example, if the police forces want to recognize some faces for suspects,
they may compare the image individually with each single image in the database to verify
the identity. In this case, only two images are matched. If they use the database to be
searched to find the most closely matching images, this is CBIR.
A typical CBIR uses the contents of an image to represent and access. CBIR
systems extract features (color, texture, and shape) from images in the database based on
the value of the image pixels. These features are smaller than the image size and stored in a
database called feature database. Thus the feature database contains an abstraction
(compact form) of the images in the image database; each image is represented by a
compact representation of its contents (color, texture, shape and spatial information) in the
form of a fixed length real-valued multi-component feature vectors or signature. This is
called off-line feature extraction [5].
When the user submits a query image to the CBIR system, the system automatically
extracts the features of the query image in the same way as it does for the image database.
The distance (similarity) between the feature vector of the query image and the feature
vectors stored in the feature database are computed. The system will sort and retrieve the
best similar images according to their similarity values. This is called on-line image
retrieval [5].

5
The main advantage of using CBIR system is that the system uses image features
instead of using the image itself. So, CBIR is cheap, fast and efficient over image search
methods.
1.5 The Importance of Content Based Image Retrieval To search for an image, we use some text or a keyword that describes the image to
retrieve it. This method is not good for image retrieving, because in that case, every image
must have a powerful complete description and then must match the words we use to
search. Unfortunately, we have huge image databases, and it is illogical to describe every
image in the database with a good complete description and when we retrieve the images,
the system will often miss some images and will retrieve images that don't relate to what
we need. From this point, we want to find a new technique and use it to retrieve images
depending on its content not its description [2].
To solve the problem of searching for an image using text, we will use the content
of the image to search and retrieve it. CBIR is a technique to search and retrieve images. A
content-based retrieval system processes the information contained in image data and
creates an abstraction of its content in terms of visual attributes. These attributes are color,
shape, and texture. Any query operations deal with this abstraction rather than with the
image itself. Thus, every image inserted into the database is analyzed, and a compact
representation of its content is stored in a feature vector, or signature [5].
To retrieve an image, the query image must compare with other images in the
database for similarity. Similarity comparison uses the image representation.
Representation of an image includes extracting some features. Features extracted from an
image can be color, texture, or shape. The similarity is to calculate the difference between

6
the images' features. For this point, CBIR has several advantages comparing with other
approaches such we have mentioned such as text-based retrieval.
1.6 Practical Application CBIR concepts have been used widely in many real applications. Most of our fields
need image processing and retrieving such as medical, architectural, criminal, and in the
web. For the medical field, CBIR is used for diagnosis by identifying similar past cases. In
critical buildings, this technique is used for finger print or retina scanning for privileges.
The most important application that uses CBIR is the web. Many web applications provide
searching and retrieving images based on their contents. In general, retrieving images based
on their content becomes serious and important techniques in most of the human
applications [1]. Potentially fruitful areas include:
• Crime Prevention Nowadays, police forces keep large archives of evidence for past suspects,
including facial photographs and fingerprints. When a crime is happened, they take the
evidence from the scene of the crime and compare it with the records in their archives.
They use CBIR systems to get their results. The most import thing when designing these
systems is the ability to search an entire database to find the closest matching records
instead of matching against only a single stored record.
• Medical Diagnosis Modern medicine depends on diagnostic methods such as radiology, histopathology,
and computerized tomography. These diagnostic methods have resulted in a large number
of important medical images that most hospitals stored. Now, there is a great interest to use
of CBIR methods to aid diagnosis by identifying similar past cases.
7
• Home Entertainment Most home entertainment is images such as holiday images, festivals and videos
such as favorite programs and movies. CBIR methods can be used for image management.
Now, number of large organizations devotes large development effort to design simple
software for retrieval with affordable price.
• Web Searching One of the most CBIR applications is the web searching. Uses face problems when
they search for certain images by some image description. Many search engines use the
text-based search and for many times the results are not stratified by the user. Some
content-based search engines are developed so that the user submits the query image and
the search engine retrieve the most similar images. Some content-based search engines
provide a relevance feedback facility to refine search results. Numerous commercial and
experimental CBIR systems are now available, and many web search engines are now
equipped with CBIR facilities, as for example Alta Vista, Yahoo and Google.
1.7 Motivation of This Work Research in CBIR is a hot topic nowadays. It is important to realize that image
retrieval does not entail solving the general image understanding problems. The retrieval
system presents similar images. The user should define what the similarity between images
has to be. For example, segmentation and complete feature descriptors may not be
necessary for image similarity. So, when we want to develop an efficient algorithm for
CBIR, some problems have to be solved. The first problem is to select the image features
that will represent the image. Naturally, images endowed with information and features that
can be used for image retrieval. Some of the features can be visual features (color, texture,

8
shape) and some can be the human description of the image like impressions and emotions.
The second problem is the computational steps to extract features of an image and to deal
with large image databases. We have to keep in our mind that large image databases are
used for testing and retrieving.
This thesis aims to provide an efficient content based image retrieval system. It is
expected to overcome the problem of image feature selection to represent the image and to
reduce the computation load. The major contributions of this thesis can be summarized as
follows:
1. Most CBIR systems use gray-scale images. If the image database or the query
image is a color image, they convert it to gray-scale image. However, when some
systems use the color of the image as its feature, they derive the histogram from the
color space of the image. In this work, the color moments will be used for extracting
the image features because the distribution of color in an image can be interpreted
as a probability distribution. Probability distributions are characterized by a number
of unique moments. So, the moments of the color image can be used as features to
identify that image based on color.
2. To make the system invariant to noise, image transformation (contrast
enhancement, gamma correction, and histogram equalization) and pixels values, a
preprocessing step will be done for the query image. Ranklet Transform makes the
image invariant to noise and image transformation. In previous work, Ranklet
Transform was used for gray-scale images to extract texture features. In our work,
Ranklet Transform will be used for colored images to extract color features. The
9
image will be in RGB color space. Ranklet Transform will be performed on each
layer of the image to extract the features.
3. When CBIR system is ready for testing, the query image is compared with every
target image in the database to find the best matching images. This is a linear search
method, which will take long times if the database is large. In fact, this is not
necessary to repeat the comparison between the query image and the database every
time. Each image database contains number of classes that each image belongs to
one class. The system can select some images from different classes and use them to
be compared with the query image. This can be done by divide the database into
categories. A clustering algorithm, definitely the k-means, is used to cluster the
database into classes. Images with similar features are clustered to one class. This step
is done one time. Each class will be associated with class ID. To retrieve images
similar to the query image, the system will compute the distance between the query
image and the centroid image of each class. The smallest distance (most similar)
will determine to which the image belongs. The class with the smallest distance is
returned and the images in this class will be compared with the query image. The
most matching images will be retrieved. This method saves time and computation
load.
1.8 Outline of This Thesis This thesis is divided into seven chapters. Chapter 2 reviews some related work,
especially about the research issues. Ranklet Transform and its main role as a preprocessing
step are discussed in Chapter 3. We also discuss how we can use Ranklet Transform on
colored images. In Chapter 4, we discuss some background for CBIR principle, image
features such as color, texture, and shape and how can be extracted. We introduce some

10
image similarity measures, image indexing, and finally we focus one color features. In
Chapter 5, we introduce the proposed system for CBIR and talk about some methods for
image indexing and clustering. System implementation, simulation results, and evaluation
are discussed in Chapter 6 in details. Chapter 7 summarizes our proposed system and
contributions. Some recommendations and future work are also suggested there.
11
Chapter 2 - Review of Related Works
2.1 Introduction CBIR describes the process of finding images from a large data collection that
match to a given query image. One highly problem when designing CBIR system is to
make a system general-purpose. This problem appears because of the size of the database,
the difficulty of understanding images by users and computers, the difficulty of system
evaluation, and results retrieval. Many general-purpose systems have been developed.
QBIC [6], VIR [7], and AMORE [8] are examples of commercial general purpose systems.
Recently, academic systems have been developed such as MIT Photobook [9]. Berkeley
Blobworld [10], Columbia Visualseek and Webseek [11], Netra [12], and Stanford WBIIS
[13] are some of the recent well known systems.
When a user intends to access a large image database, a linear browsing is not
practical for finding the target image. Depending on the query format, image retrieval
algorithms are divided into two categories: keyword-based approaches and content-based
methods. In keyword-based approach, images are indexed using a keyword stored for the
image describing the image content. Keyword-based retrieval is not standardized because
different users describe images using different keywords. Using this approach, humans are
required to personally describe every image in the database, so for a large image database
the technique is cumbersome, expensive and labor-intensive.
In content-based methods, the content of the image is used for search and retrieve
images. This method was introduced to overcome the problem of keyword-based approach
and support effective searching and browsing of large digital image libraries based on
automatically derived image features.

12
All CBIR systems view the query image and the target images as a collection of
features. These features, or image signatures, characterize the content of the image. The
advantages of using image features instead of the original image pixels appear in image
representation and comparison for retrieving. When we use the image features for
matching, we almost do compression for the image and use the most important content of
the image. This also bridges the gaps between the semantic meaning of the image and the
pixel representation.
In general, features fall into two categories. The first category is global features.
Global features include color and texture histograms and color layout of the whole image.
The second category is local features. Local features include color, texture, and shape
features for subimages, segmented regions, and interest points. These features extracted
from images are then used for image matching and retrieving. The formulation of the
similarity measure varies greatly. The similarity measure quantifies the resemblance in
contents between a pair of images.
2.2 General Purpose Systems Several general-purpose systems have been developed for content based
information and image retrieval. For each system, we will focus on the features are used to
extract information from the image and matching between the query image and the
database. We will mention some of them below:
2.2.1 QBIC QBIC (Query by Image Content) system was the first commercial system for CBIR
developed by IBM Almaden Research Center, San Jose in 1995. This system uses color,
texture, shape, and sketches for image representation. The QBIC system allows queries on

13
large image and video databases based on example images, user-constructed sketches and
drawings, color and texture patterns, and camera and object motion. The color features are
the average of the image color histograms in different color space (RGB, YIQ, Lab, and
Munsell). The texture features are the modified version of coarseness, contrast, and the
directionality features proposed by Tamura. The shape features used to extract the image
features are the area, circularity, eccentricity, and some invariant moments.
2.2.2 NETRA NETRA [12] system has been developed by Department of Electrical and Computer
Engineering at University of California, Santa Barbara in 1997. It uses three feature vectors
to represent the image. The first vector is computed from color histogram to represent the
image color feature. The second vector is the normalized mean and standard deviation,
derived from the Gabor Wavelet Transform of the image, to represent the image texture
feature. The third vector is the curvature function of the contour to represent the shape
feature. Similarity matching is done by the Euclidean distance.
2.2.3 KIWI KIWI (Key-point Indexing Web Interface) [14] has been developed in France by
INSA Lyon in 2001. This system extracts the key points in the query image rather than the
entire image using some wavelet-based salient point detector. Color histograms, are
computed from each color component (R, G, and B), and the shape descriptors, computed
from Gabor Filter, are used as image features. Euclidean distance is used for similarity
matching.

14
2.2.4 ImageMiner ImageMiner [15] has been developed by Technologie-Zentrum Informatik at
Univerity of Bremen in Germany in 1997. It uses color, texture, and shape to describe the
image. Color histogram is used to describe image color features. Grey level co-occurrence
matrix is used for texture feature. Image contour size, centroids, and boundary coordinates
are used for shape features. For similarity, special module is developed within the system.
2.2.5 Photobook Photobook [9, 16] was developed by Vision and Modeling Group at MIT Media
Lab in 1997. It implements three different methods for image representation according to
image content type (face, 2D shape, and texture). Photobook consists of three sub-books.
There are the Appearance Photobook, Shape Photobook and Texture Photobook, which can
extract the face, shape and texture, respectively. To query an image, users can select one of
image features that the system supports or a combination of different features besides a
text-based description.
2.3 Color Based Approaches One of the most straightforward visual features of an image is the color because
human eye is sensitive to colors. Color features are the basic characteristic of the content of
images. Using color features, human can recognize most images and objects included in the
image. Images added to the database have to analyze first. Images can be represented by
color histograms that show the proportion of pixels of each color within the image. The
most common form of the histogram is obtained by splitting the range of the data into
equally sized bins. The numbers of pixels that have the same color value is computed for
each bin. Therefore, it is common to use color features for image retrieval.

15
Several methods for retrieving images on the basis of color similarity have been
proposed, but most are variations on the same basic idea. Each image added to the database
is analyzed to compute its feature. Two traditional approaches have been used. Global
Color Histogram (GCH) is used for representing images by their histograms and the
similarity between two images will be determined by the distance between their color
histogram. This approach does not represent the image adequately. Furthermore, this
approach is sensitive to intensity variations, color distortions, and cropping. Local Color
Histograms (LCH) divide images into blocks and obtain the histogram for each block
individually. So, an image will be represented by these histograms. To compare between
two images, each block from one image will be compared with another block from the
second image in the same location. The distance between these two images will be the sum
of all distances. This approach represents the image more deeply and enables the
comparison between image regions.
In 1996, Stricker and Dimai [17] proposed CBIR system that partitioned the image
into five overlapped blocks and computed the Color Moments for each block. The
computation was done using the HSV color space for each channel. These weights are to
make the effect of one moment in a certain color channel less or greater that other moments
in the same color channel. The reason to include weights in the formula is to make the
effect of pixels close to the boarder less than the pixels close to the center of a certain
block.
In 2000, Stehling et al [18] developed a method based on color histograms. He used
a variable number of histograms called color-shape histograms (CSHs) instead of using a
fixed number of cells or a single histogram. This variable histogram depends on the actual
16
number of image colors. This method is used to represent the spatial distribution of the
color for each image cell and non-existing color will not be presented.
In 2006, Mahdy, Shaaban, and Abd El-Rahim [19] proposed to extract the features
from the image using its color histogram. The image is segmented into four blocks and
converted from RGB color space to CIE XYZ color space then to LUV color space. The
histogram is then calculated from the last color space for each of the four blocks. A
histogram similarity measure is used to compare images.
In 2009, Lin, Chen, and Chan [20] proposed a smart method for image retrieval.
Three image features and a feature selection technique are used for that. The first and the
second image features are for color and texture features that are respectively called color
co-occurrence matrix (CCM) and difference between pixels of scan pattern (DBPSP). The
third image feature is for color distribution called color histogram for k-mean (CHKM).
The feature selection technique is used to select the most optimal features for maximizing
the detection rate and simplifying the computation of image retrieval. The three image
features are not affected by image displacement and rotation and also able to resist noise-
induced variations.
In 2002, Shin and Chen [21] proposed the partition-based color-spatial method. The
query image is divided into 100 blocks and for each block the three color moments are
computed for each color layer. The mean vector of each block is considered as the primitive
of the image. This method is not suitable for image databases containing large images.
However, Chan and Chen [22] proposed a similar method of considering the mean value of
the color component at each block. They divided the image into 3 x 3 blocks instead of 100

17
blocks. The mean value is computed for each block color layer (R, G, and B) separately.
Although this method reduces the effect of noise and variations in size, it is affected by the
shift of objects in the image.
In 2008, another system is proposed by Mustaffa, Ahmad, Rahmat, and Mahmod
based on color-spatial features [23]. Images in the database used for evaluation are set to
the same size (192 x 128), image format (JPEG), and color space (RGB). These constraints
needed for the application and during the retrieval time. Through feature extraction, the
color features are extracted using the Dominant Color Region Segmentation that maps the
color in the image with the 25 color categories that can be found in the image. The region’s
location feature is extracted using the Improved Sub-Block method. The extracted features
are used to create the index table for all possible for that image.
Some proposed systems combined color and texture features to improve the system
performance. In 2004, D. Zhang [24] computed color and texture features from the image
database. So, for each image, color and textures features are computed. When a query
image is submitted, the color and texture features are computed. Firstly, the images in the
database are ranked according to the color features. The top ranked images from color
features are reranked according to the texture features.
In 2010, Kekre and Mishra [25] presented a new algorithm for digital search and
retrieval. They used Fast Fourier Transform for each image color components (R, G, and
B). The frequency plane for each component is divided into 12 sectors. The real and the
imaginary parts for each sector are computed and their average is taken as one parameter
for the feature vector that will represent the image.

18
In March 2011, Sharma, Rawat, and Singh [26] proposed an efficient CBIR using
color histogram processing. The proposed method used color moments and color
histograms. They computed the color moments from the images. The color features are
used for matching between the query image and images in the database. They also
computed the color histograms from the color components of the query image and compare
them with a number of top ranked images from the first step.
As a summary, dealing with color images and extracting features have some
drawbacks. First, color images have large dimensions, and the computations are quite time
consuming. Second, color images are sensitive to noise interference as illumination.
Furthermore, most CBIR systems cannot handle rotation and translation. Our contribution
is to overcome most of the previous problems. We propose a color-based retrieval system
for comparing similarities between images. Our proposed system will reduce the
computation of the distance to find the similarity between images. We will address the
issue of indexing for the image database we will use. The system will be able to overcome
the translation and rotation.
19
Chapter 3 - Ranklet Transform
3.1 Introduction Fourier Transform has been the mainstay of signal transform. Fourier Transform
converts a signal from the time-domain into the frequency-domain to measure the
frequency components of the signal. For CBIR, Fourier Transform was used to extract
texture features from high frequency components of the image. Unfortunately, Fourier
Transform failed to capture the information about objects locations in an image and could
not provide local image features. After its revolution, Wavelet Transform was used for
image processing methods due to its efficiency and effectiveness in dealing with most
important image processing tasks such as image analysis and compression. The main
difference between Fourier Transform and Wavelet Transform is how to represent the
signals to be analyzed. Fourier Transform represents the signal as weighted sum of the
sinusoidal trigonometric functions. On the other hand, Wavelet Transform uses completely
supported functions of limited duration in time and frequency domains [28].
3.2 Basic Image Concepts Images can be thought as a two-dimensional function, f(x, y), with x and y are
spatial coordinates and the value at the coordinate (x, y) is called the intensity. In an image,
if x, y, and the intensity values are all finite and discrete quantities, we call the image a
digital image. One of the most important steps in digital image processing is the image
enhancement. Image enhancement is the process of manipulating an image to make the
results more suitable than the original image for applications. Image enhancement methods
are so varied and use so many different image processing approaches. For this reason,
there is no general theory of image enhancement. Human is the ultimate judge of how well
a specific method works. Systems that acquire images generate images with continuous
20
voltage waveform. In order to digitize them, they have to be sampled in both coordinates
and intensity. Digitizing the coordinate values is called sampling. Digitizing the intensity
values is called quantization. Sampling and quantization allow representing images as
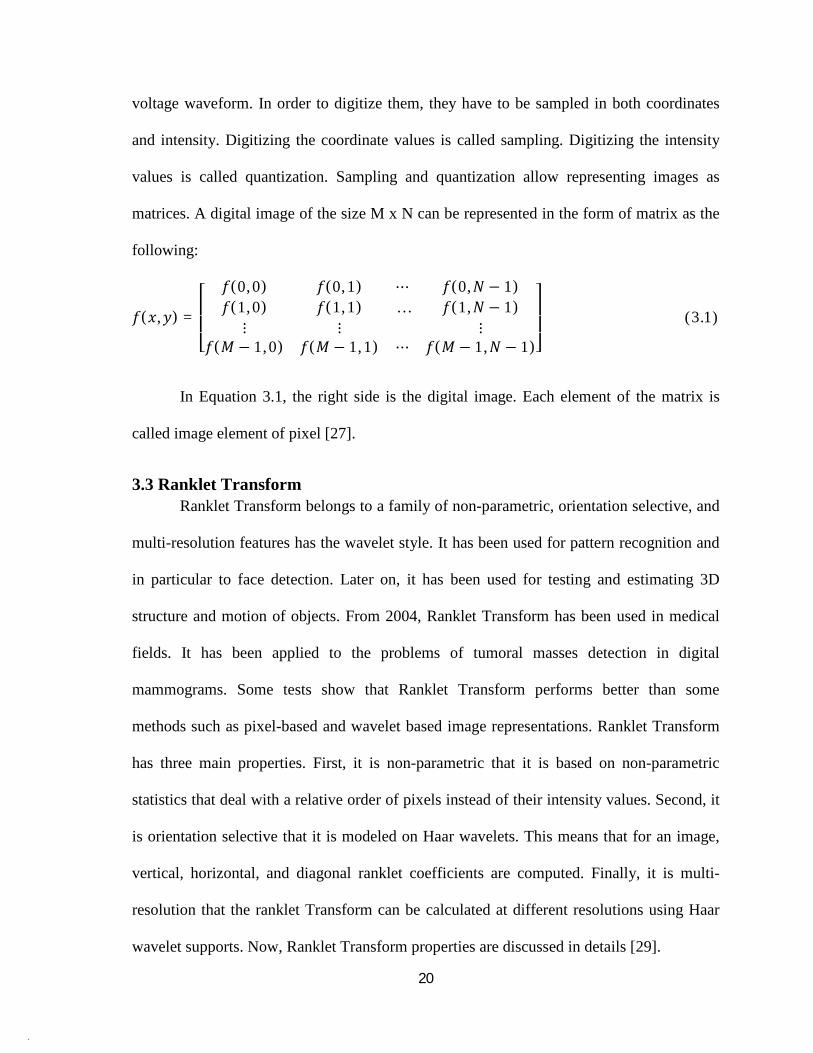
matrices. A digital image of the size M x N can be represented in the form of matrix as the
following:
( , ) = ⎣⎢⎢⎡ (0, 0) (0, 1) ⋯ (0, − 1) (1, 0) (1, 1) … (1, − 1)⋮ ⋮ ⋮ ( − 1, 0) ( − 1, 1) ⋯ ( − 1, − 1)⎦⎥⎥
⎤ (3.1)
In Equation 3.1, the right side is the digital image. Each element of the matrix is
called image element of pixel [27].
3.3 Ranklet Transform Ranklet Transform belongs to a family of non-parametric, orientation selective, and
multi-resolution features has the wavelet style. It has been used for pattern recognition and
in particular to face detection. Later on, it has been used for testing and estimating 3D
structure and motion of objects. From 2004, Ranklet Transform has been used in medical
fields. It has been applied to the problems of tumoral masses detection in digital
mammograms. Some tests show that Ranklet Transform performs better than some
methods such as pixel-based and wavelet based image representations. Ranklet Transform
has three main properties. First, it is non-parametric that it is based on non-parametric
statistics that deal with a relative order of pixels instead of their intensity values. Second, it
is orientation selective that it is modeled on Haar wavelets. This means that for an image,
vertical, horizontal, and diagonal ranklet coefficients are computed. Finally, it is multi-
resolution that the ranklet Transform can be calculated at different resolutions using Haar
wavelet supports. Now, Ranklet Transform properties are discussed in details [29].

21
3.3.1 Non-Parametric Statistics The expression non-parametric denotes statistical methods that are distribution free
from the data of a given probability distribution. Non-parametric methods are useful when
the applications are interested in ranking rather than numerical interpretation. The
robustness of non-parametric methods makes scientists to apply them in several learning
methods such as Support Vector Machine (SVM) [30].
Rank statistics are widely used in medical search for treatment or drug tests. In
order to test a new innovated drug, participants suffering from the same disorder are
divided into groups namely Treatment and Control. Randomly, the Treatment group
receives the new drug and the Control group is given a placebo with letting them know who
is having what in order to reduce the psychological effects. After that, the participants are
ranked according to their severity of their condition; most severe is ranked first. The new
drug will be considered if the Treatment group participants rank high. This example is
related to the idea for the Ranklet Transform. To complete, some statistical methods have
to be illustrated [30].
3.3.1.1 Rank Transform Suppose a set of P1, P2, …, PN pixels and we want to perform a rank transform [31]
on the set. We refer to the rank transform with the symbol π. The rank transform will order
the elements in the set in an ascending order and substitute each pixel value with its rank
among all other pixels. For example, if we have the matrix S of size 4 x 4:
= 55 99 25 15326 75 92 20021 64 88 154101 190 199 222

22
If we apply the rank transform on S we get:
( ) = 4 9 2 113 6 8 151 5 7 1210 13 14 16
If any two pixels have the same value, a mid-rank transform is used to assign each
group of pixels with equal values the average of ranks they occupy. For example, the
matrix S has some elements with the same values:
= 55 99 153 92 20021 154101 190 199 222
The mid-rank transform will substitute each group with equal values that is the
average of the ranks they occupy. Element 25 occupies the ranks 2 and 3. The average rank
will be 2.5 ((2 + 3) / 2). After applying the mid-rank transform on S we get:
( ) = 4 9 . 11 . 8 151 1210 13 14 16
3.3.1.2 Wilcoxon Test The Rank Transform and Wilcoxon Test [30] are related. Consider a set of N pixels
that divides into two sub-sets. The first sub-set is called Treatment (T) that contains m
pixels and the second sub-set is called Control (C) that contains n pixels, so that m + n = N.
We have to test whether the T set is significantly higher or lower than the C set. We first
rank the elements in each sub-set (T and C). Let WS be the Wilcoxon statistic defined by:
= ∑ ℎ = = 0, ∈ 1, ∈ (3.2)

23
From Equation 3.2, we are just interested in the sum of ranks for the set T. We say
that a set T is higher than a set C if WS is greater than critical value τ, in other words if > . 3.3.1.3 Mann Whitney Test
Mann Whitney Test is a non-parametric statistical hypothesis test for assessing
whether two independent samples of observations have equally large values. Mann
Whitney test [30] was introduced because it has an immediate interpretation in terms of
pixels comparison. Mann Whitney test (WXY) is computed by the following equation:
= − ( + 1)2 (3.3)
Equation 3.3 is equal to the number of pixel pairs (pm, pn) with pm ϵ T and pn ϵ C,
such that the intensity value of pm is higher than the intensity value of pn. The value of WXY
ranges from 0 to the number of pairs (pm, pn) ϵ T × C, namely m × n. Notice that to
compute the value of WXY, it takes a huge computational time approximately O(N2). To
reduce this computational time, the value is obtained by the rank transform that ranks the
pixels and sum the ranks of the Treatment set T.
An example will make all previous equations more clear. Consider a set of pixel
values such that S = {20, 5, 4, 9, 7, 1, 13, 10, 19, 15, 11}. Let the set T = {5, 9, 1, 10, 15}
and the set C = {20, 4, 7, 13, 19, 11}. So, N = 11, m = 5, and n = 6. Then, we have to rank
the elements in the set S in ascending order and mark them to the either set T or set C.
Sample T C T C T T C C T C C Value 1 4 5 7 9 10 11 13 15 19 20 Rank 1 2 3 4 5 6 7 8 9 10 11

24
From the table, we sum the ranks of elements belong to the set T using Wilcoxon Test WS
(Equation 3.2).
WS = 1 + 3 + 5 + 6 + 9 = 24.
From Equation 3.3, we compute the Mann Whitney Test WXY.
WXY = 24 – [5(5 + 1) / 2] = 9
After that, the value of Mann Whitney Test will be used to compute the Ranklet
coefficient that will be in the range [-1, +1].
3.3.2 Orientation Selectivity We have discussed the non-parametric property of the Ranklet Transform that is
derived from the Rank Transform and non-parametric statistic methods such as the Mann
Whitney Test. The second property of Ranklet Transform is orientation selective. This
property is derived from the fact that it is modeled based on bi-dimensional Haar wavelets
[32]. Haar wavelets supports divide a 2D set into two equally sub-sets. They divide the set
in different orientation. Suppose an image containing N pixels. To compute the Mann
Whitney Test, the N pixels is divided into two sub-sets T and C of size m = n = N/2. Thus,
half of pixels are assigned to the set T and the second half of pixels are assigned to the set
C. As we said, we can divide the set into different orientations. We are basically interested
in dividing the set in vertical, horizontal, and diagonal orientation. This is similar to the
Haar wavelet supports that divide the set into vertical Haar (hV), horizontal Haar (hH), and
diagonal Haar (hD). Figure 3.1 [29] illustrates the three Haar wavelet supports that any two
sub-sets can be described using them.

25
-1
(CV)
+1
(TV)
+1 (TH)
+1
(TD)
-1
(CD)
-1 (CH) -1
(CD)
+1
(TD)
Vertical (hV) Horizontal (hH) Diagonal (hD) Figure 3.1: Ranklet Transform orientation-selective analysis.
An important note is that the arbitrariness distribution of the two sub-sets T and C is
the basic in order to be able to choose the two sub-sets based on the Haar wavelet supports.
In other words, the arbitrariness with which we choose the sub-sets is the orientation
selective property of the Ranklet Transform.
3.3.2.1 Ranklet Coefficients Once we have introduced the Haar wavelet supports, the definition of the Ranklet
Transform is straightforward. For an image constituted by a set of N pixels, we first derive
the Haar wavelet supports in the three orientations (vertical, horizontal, and diagonal). For
each orientation we divide the set into sub-sets T and C. We compute the rank transform
and then the Mann Whitney Test for each orientation. The Ranklet coefficient Rj then can
be computed by the following equation:
= 2⁄ − 1 ℎ = , , (3.4)
Notice that is computed for each vertical, horizontal, and diagonal Haar
wavelet supports by splitting the N pixels into sub-sets Tj and Cj. Ranklet coefficients have
a geometric interpretation. Figure 3.2 shows a synthetic image that has a vertical edge with

26
the darker side on the left (left part), where CV is located, and the brighter side on the right,
where TV is located [33]. The Ranklet coefficient will be close to +1 if many pixels in TV
have higher intensity values than the pixels in CV. Conversely, the Ranklet coefficient will
be close to the value -1 if the dark and bright sides are reversed. The same idea can be
drawn for the other Ranklet coefficients in alternative orientation (horizontal and diagonal).
As we mentioned before, to compute the Ranklet coefficient, we have to compute
the rank transform and the Mann Whitney Test to get the WXY. The computation of the
Ranklet coefficient using the Mann Whitney Test clarifies the non-parametric property of
the Ranklet Transform. From the Haar wavelet supports, we can get different orientations
for the image, namely vertical, horizontal, and diagonal. Putting the image in different
orientations by means of Haar wavelet supports clarifies the orientation selective property
of the Ranklet Transform.
Figure 3.2: Ranklet Transform applied to some synthetic images.

27
3.3.3 The Multi-Resolution Because the Ranklet Transform is modeled on the Haar wavelet, this leads to extend
the multi-resolution property to the Ranklet Transform [33]. Ranklet coefficients can be
computed at different resolutions by stretching and shifting the Haar wavelet supports. For
example, suppose that we have to perform the Ranklet Transform on an image of size 8 x 8.
The Ranklet Transform will be performed at different resolutions as {8, 4, and 2}. Figure
3.3 [33] shows the image with size 8 x 8 and the Haar wavelet supports with pixels 8 x 8, 4
x 4, and 2 x 2 to perform the Ranklet Transform. We also consider that the vertical and
horizontal shifts of the Haar wavelet supports along the horizontal and vertical dimensions
are of 1 pixel. After performing the Ranklet Transform, we find that the image will be
composed by 1 triplet RV,H,D of Ranklet coefficients derived from the Ranklet Transform at
resolution 8, 25 triplets at resolution 4, and 49 triplets at resolution 2.
In general, we can calculate the number of triplets (the size of the generated vertical,
horizontal, and diagonal Ranklet Images) that can be generated after performing the
Ranklet Transform on an image of size I x I at a resolution S x S using Equation 3.5:
= ( + 1 − ) (3.5)
As a summary, when we perform Ranklet Transform on an image, it results a set of
three Ranklet images (vertical, horizontal, and diagonal) for each resolution. Ranklet
coefficients are calculated using some non-parametric statistical methods based on the
relative order of pixels instead of their intensity values. We have shown the Ranklet
Transform has the property of orientation selectivity derived from the Haar wavelet that
generates images in three orientations. Multi-Resolution property makes the Ranklet

28
Transform to deal with different resolutions by stretching and shifting the Haar wavelet
supports.
Figure 3.3: Multi-Resolution Ranklet Transform at different resolutions.
In our CBIR proposed system, we will use the Ranklet Transform as a
preprocessing step. After performing the Ranklet Transform on the image, three ranklet
images are generated with different orientations. This makes the image invariant to rotation.

29
Chapter 4 - Fundamentals of Image Retrieval
4.1 Introduction The main idea behind CBIR systems is to allow users to find images that are
visually similar to the query image. Similar may have different meanings. Some users may
be interested in some image regions. Others are interested in some shapes and the color of
them. Therefore, different needs mean different methods for similarity. To allow different
methods for similarity, different image descriptors are needed. Image descriptors may
account for different properties of images. Image descriptors mean image features. A
feature means anything that is localized, meaningful and detectable. If we talk about image
features, we mean objects in that image such as corners, lines, shapes, textures, and
motions. Features extracted from an image describe and define the content of that image.
Intuitively, the most direct method to compare two images is to compare the pixels
in one image to the corresponding pixels in the other image. Clearly, this method is not
feasible, because images may have different size that applications cannot determine which
pixels from one image correspond to which pixels in the other image. Another reason is the
computational complexity. When a system wants to match two images by comparing pixel
by pixel, it will take a long time. This is just for two images. Nowadays, we talk about
thousands of images stored in databases that are used for image retrieving. Comparing
images using their pixels is time consuming. More powerful method is to use image
features instead of using the original pixel values because of the significant simplification
of image representation, and the easy way to compare images using their features.
A wide variety of features had been considered for image retrieval. Color, texture,
and shape are some image features that can be used to describe an image. However, no

30
particular feature is most suitable for retrieving all types of images. Color images need
color features that are most suitable to describe them. Images containing visual patterns,
surface properties, and scene need texture features to describe them. In reality, no one
particular feature can describe an image completely. Many images have to be described by
more than one feature. For example, color and texture features are best features to describe
natural scenes.
Features extracted from the image are used for computing the similarity between
images. Some measurement methods are used to calculate the similarity between images. In
this chapter, we will define image features, explaining their properties. We introduce some
methods for similarity measures.
4.2 Feature Extraction Feature extraction means obtaining useful information that can describe the image
with its content. We mean by image features the characteristic properties. For example, the
image of a forest can be described by its green color and some texture of trees. Objects in
the image can be considered as shapes that can be a feature for the image. To describe an
image, we have to consider its main features. Selecting image features is an important step
so that it can represent the content of the image very well. Color, texture, and shape are
some features considered for content image description. In this section, we will introduce
the three main features.
4.2.1 Color Color is the sensation caused by the light as it interacts with our eyes and brain.
Color features are the fundamental characteristics of the content of images. Human eyes are
sensitive to colors, and color features enable human to distinguish between objects in the

31
images. Colors are used in image processing because they provide powerful descriptors that
can be used to identify and extract objects from a scene. Color features provide sometimes
powerful information about images, and they are very useful for image retrieval.
4.2.1.1 Color Fundamentals In 1666, Sir Isaac Newton discovered that a beam of sunlight consists of a
continuous spectrum of colors when that beam passes through a glass prism. The colors are
violet, indigo, blue, green, yellow, orange, and red (Figure 4.1 [27]).
Figure 4.1: Color spectrum seen by passing white light through a prism.
To facilitate the specification of colors in some standard, color spaces (also called
color models or color systems) are proposed. A color space is a specification of a
coordinate system and a subspace within the system where each color is represented by a
single point. Today, most color spaces in use are oriented toward hardware (such as for
color monitors and printers) or toward software for applications where color manipulation
is the target. In most digital image processing, RGB (red, green, blue) color space is used in
practice for color monitors and CMY (cyan, magenta, yellow) color space is used for color
printing. In our work, we are focusing on the RGB color space [27].
32
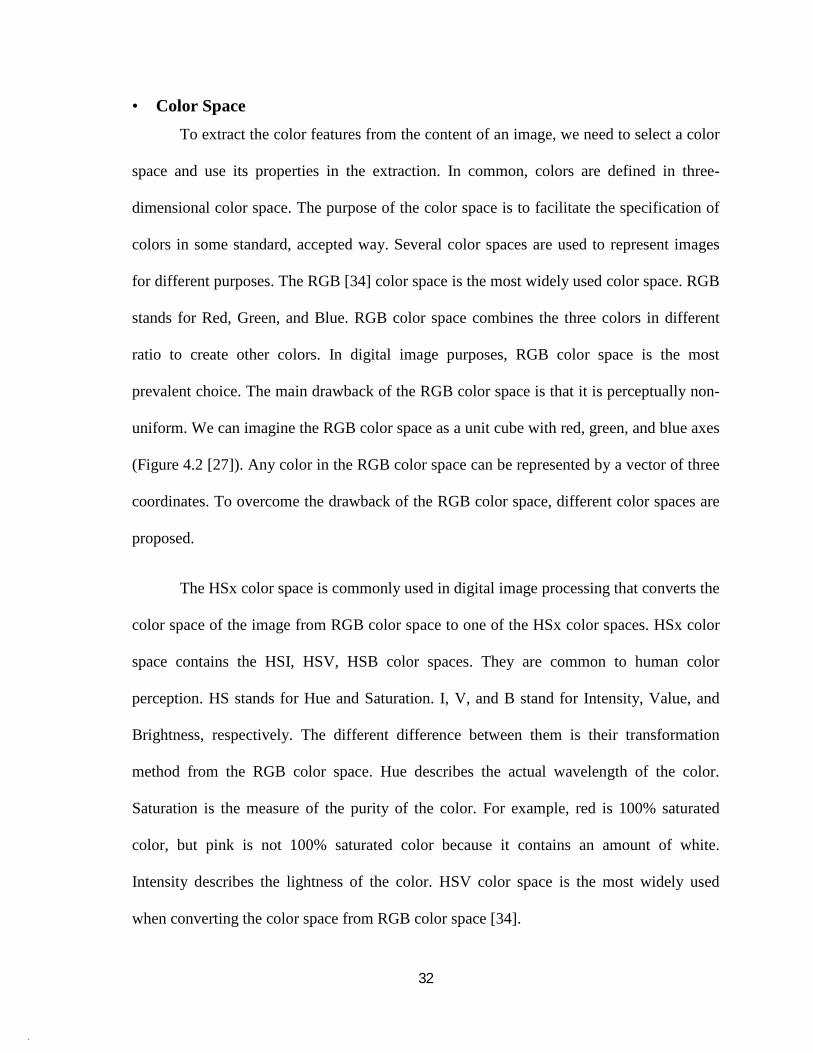
• Color Space To extract the color features from the content of an image, we need to select a color
space and use its properties in the extraction. In common, colors are defined in three-
dimensional color space. The purpose of the color space is to facilitate the specification of
colors in some standard, accepted way. Several color spaces are used to represent images
for different purposes. The RGB [34] color space is the most widely used color space. RGB
stands for Red, Green, and Blue. RGB color space combines the three colors in different
ratio to create other colors. In digital image purposes, RGB color space is the most
prevalent choice. The main drawback of the RGB color space is that it is perceptually non-
uniform. We can imagine the RGB color space as a unit cube with red, green, and blue axes
(Figure 4.2 [27]). Any color in the RGB color space can be represented by a vector of three
coordinates. To overcome the drawback of the RGB color space, different color spaces are
proposed.
The HSx color space is commonly used in digital image processing that converts the
color space of the image from RGB color space to one of the HSx color spaces. HSx color
space contains the HSI, HSV, HSB color spaces. They are common to human color
perception. HS stands for Hue and Saturation. I, V, and B stand for Intensity, Value, and
Brightness, respectively. The different difference between them is their transformation
method from the RGB color space. Hue describes the actual wavelength of the color.
Saturation is the measure of the purity of the color. For example, red is 100% saturated
color, but pink is not 100% saturated color because it contains an amount of white.
Intensity describes the lightness of the color. HSV color space is the most widely used
when converting the color space from RGB color space [34].

33
Figure 4.2: RGB Color Space.
Other color spaces are YUV and YIQ. They were developed for television
broadcasting. The Y channel represents the luminance of the pixel and is the only channel
used in the black and white television. The other channels (U, V, I, and Q) are the
chromatic components. The CIE L*u*v and CIE L*a*b color spaces are both perceptually
uniform systems and device-independent, which provide easy use of similarity metrics for
comparing color [35].
To complete extracting color features from an image and after choosing the proper
color space, we have to choose some effective color descriptors to represent the color of the
image contents. Color histograms, color moments, and color texture are some of the color
descriptors that have been developed for color image representation. Next, we introduce the
RGB color space and color histograms in details.

34
• The RGB Color Model RGB color model is the most common color model in use. The primary colors are
red, green, and blue. Figure 4.2 shows the color subspace of interest [27]. From the figure,
the RGB model is based on a Cartesian coordinate system. The three coordinates of the
system are the primary colors of the model. The color black is at the origin of the plane,
and the color white is at the farthest corner from black. The different colors in this model
are on or inside the cube, and are defined by vectors extending from the origin.
Images represented in the RGB color model consist of three component images, one
for each primary color. When a monitor displays the image, the three images are combined
to produce the original image. The number of bits used to represent each pixel is called the
pixel depth. For example, if we represent each primary color in the RGB model by 8 bits,
then each pixel in an RGB color image is represented using 24 bits (8 bits for each primary
color). In general, the total number of colors in a 24-bit RGB image is (28)3 that is equal to
16,777,216 colors. Figure 4.3 shows an RGB image and its three components.

35
The original Image
Red Component Green Component Blue Component
Figure 4.3: An RGB Image and its components.
• Color histograms As mentioned, the most widely used features to describe the image are color
features. Many CBIR systems use color histograms as a color feature to represent the
image. A color histogram is a graphical representation that shows the distribution of colors
in an image. For digital images, a color histogram represents bars that the height of each
bar represents the number of pixels in the image that have the same color. The x-axis of the
histogram represents the number of colors being used in the image, while the y-axis
represents the number of pixels. For each color, the height of a vertical line represents the
number of pixels of that color. [27].
In color histograms, it is common to normalize the histograms. Normalizing
histograms is to reduce the number of bins by taking colors that are similar to each other
and putting them in the same bin. Reducing the number of colors will decrease the
36
possibility that similar colors are assigned to different bins, but it will increase the
possibility that distinct colors may be assigned to the same bins. This step will decrease the
information can be gained from the image about its content. On the other hand, the storage
media and the time of calculating histograms and the distance between color histograms
will be saved. Therefore, there is a trade-off between the number of bins in the histogram
and the information gained from the histogram. The trade-off is also between the
processing time, storage space, and the accuracy of the results.
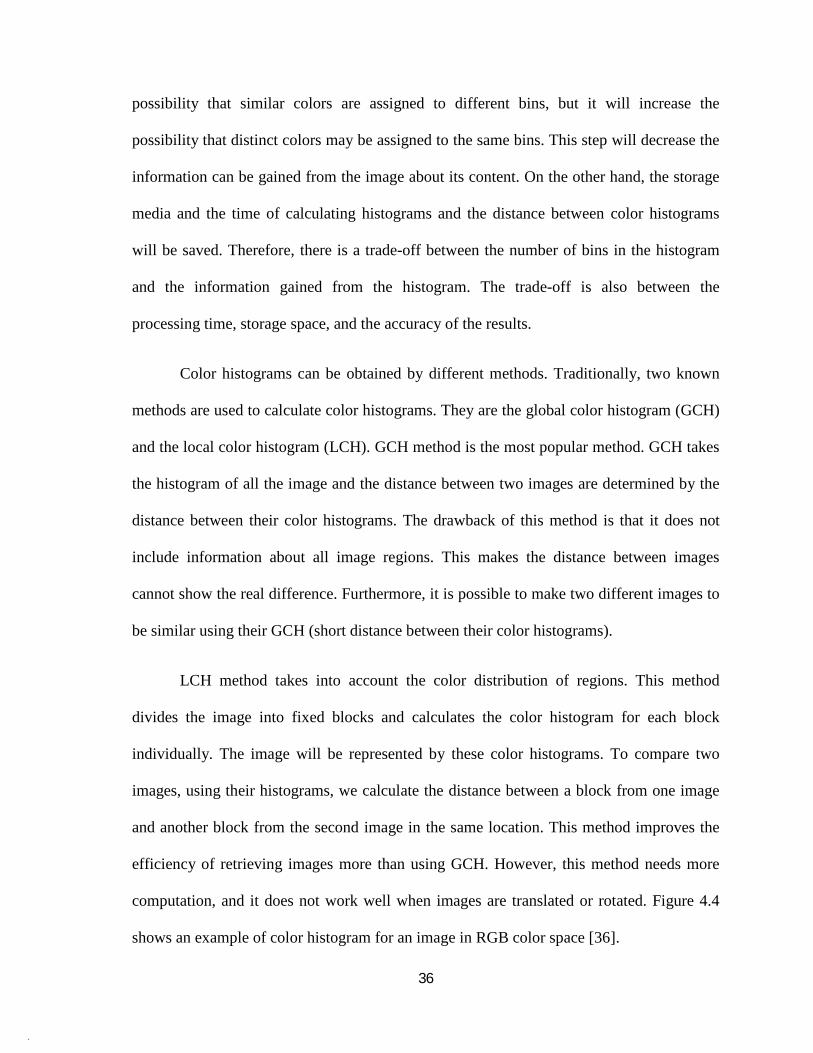
Color histograms can be obtained by different methods. Traditionally, two known
methods are used to calculate color histograms. They are the global color histogram (GCH)
and the local color histogram (LCH). GCH method is the most popular method. GCH takes
the histogram of all the image and the distance between two images are determined by the
distance between their color histograms. The drawback of this method is that it does not
include information about all image regions. This makes the distance between images
cannot show the real difference. Furthermore, it is possible to make two different images to
be similar using their GCH (short distance between their color histograms).
LCH method takes into account the color distribution of regions. This method
divides the image into fixed blocks and calculates the color histogram for each block
individually. The image will be represented by these color histograms. To compare two
images, using their histograms, we calculate the distance between a block from one image
and another block from the second image in the same location. This method improves the
efficiency of retrieving images more than using GCH. However, this method needs more
computation, and it does not work well when images are translated or rotated. Figure 4.4
shows an example of color histogram for an image in RGB color space [36].

37
Figure 4.4: Sample Image and Its Color Histograms.
4.2.2 Texture Quantifying texture content of an image is the most important method to image
region description. No formal definition for texture, but we can say that it provides the
measures of properties such as smoothness, coarseness, and regularity. Furthermore, texture
can be thought as repeated patterns of pixels over a spatial domain. If the texture has
exposed to some noise, the patterns and their repetition in the texture can be random and
unstructured. Some scenes in our world have complex texture (Figure 4.5 [40]). The

38
various brightness intensities give rise to a blend of different human perception of texture.
Figure 4.5: Examples of Simple and Complex Texture Images.
Many applications in image processing and computer vision depend on texture
images. They use them for recognition of image regions and extracting image shapes using
texture properties, recognition of texture boundaries using texture properties, and
generation of texture images from texture models.
Since there is no accepted mathematical definition for texture, many different
methods are proposed for computing texture. Among these methods, no single method
Simple Texture Complex Texture

39
works best with all types of texture. Some common methods are used for texture feature
extraction such as statistical, model-based, and transform-based methods.
Model-based methods try to generate a model for the process that generates the
texture. To create a model, part of image model parameters are assumed according to some
hypotheses, and other model parameters are estimated so that the model works in the best
way. Currently, there are popular models as Markov models, fractals, and the multi-
resolution autoregressive features.
Transform-based models use the frequency content of the image to determine
texture features. These methods aim to represent images in mathematical models. For
example, Fourier transform is used to describe the global frequency content of the image. It
converts the signal into sine waves of various frequencies. Multi-resolution transforms such
as wavelet and Gabor use a window function to transform a signal to a shifted and scaled
version of the original signal [37].
• Statistical Methods One of the simplest methods for describing texture is the statistical methods.
Statistical methods analyse the spatial distribution of the gray values by computing local
features at each point in the image, and deriving a set of statistical distribution of the local
features. Co-occurrence matrix representation and statistical moments are the most
common methods used for texture representation.
It is important to take into account the relative position of pixels with respect to
each other. One way to incorporate this information into texture analysis is to consider the
distribution of intensities and the relative positions of pixels in an image. This can be

40
achieved by the Gary-level Co-occurrence Matrix (GLCM). It measures the relative
frequencies of occurrence of gray level contributions among pairs of pixels with a specific
spatial relationship. It is a two-dimensional joint probability matrix between pairs of pixels.
It is popular in texture representation and used in many applications as recognizing fabric
defects. A set of descriptors is derived for characterizing the GLCM such as energy,
entropy, maximum probability, correlation, and invariant different moments.
Figure 4.6 shows an example of how to construct the gray-level co-occurrence
matrix [27, 38]. Image I is a gray scale image of size 4 x 5. To create the gray-level co-
occurrence matrix, we have to create a square matrix and its dimension is equal to the
largest pixel value in the image. In the GLCM, element (1, 1) contains the value 1 because
there is only one instance in the image where two, horizontally adjacent pixels have the
values 1 and 1. Element (1, 2) contains the value 2 because there are two instances in the
image where two, horizontally adjacent pixels have the values 1 and 2. We repeat this for
every two adjacent pixels and count the number of times this pair of values are appeared in
the image.
Figure 4.6: How to create GLCM.

41
4.2.3 Shape Shape is one of the common image features that used to represent the image. Shape
of an object is the characteristic surface configuration as represented by the outline or the
contour. Human can recognize the surrounding environment through recognizing the
shapes. Shapes are used in CBIR systems to identify region of interest in images. Basically,
representing a region involves two choices. One choice is to represent the region in terms
of its external characteristics (its boundary). The other choice is to represent the region in
terms of its internal characteristics (the pixels comprising the region). If we focus on the
shape characteristics, the external representation is chosen. Otherwise, the internal
representation is chosen to characterize the regional properties. They are related to region-
based and boundary-based methods. In some situations, it may be necessary to use both
representations [27].
There are several boundary-based shape descriptors. Area, perimeter, compactness,
and eccentricity are some of these descriptors. Complex boundaries are represented using
Fourier descriptors, chain codes, and statistical methods.
Region-based methods take all pixels into account to represent the shape. Moment
descriptors are most common used to extract features from shapes. They combine
information gained from the entire pixels with information extracted from the boundary
points. Therefore, they provide some global properties rather than the boundary or contour
properties [27].
In our work, we are not interested in shape features. Our work depends mainly on
color features. We will use color moments in our work to represent image features. In our
future work, we will take into account the shape features to represent image regions.

42
4.3 Similarity Measures One fundamental step in CBIR system is the similarity measures. Similarity
between two images is to find the distance between them. The distance between two images
can be calculated using feature vectors that are extracted from the images. Therefore, the
retrieval result is not a single image, but many images will be retrieved similar to the query
image. Different similarity measures have been proposed based on the empirical estimates
of the distribution of features, so the kind of features extracted from the image and the
arrangement of these features in a vector will determine the kind of similarity measures to
be used. Different similarity measures will affect the retrieval performance of image
retrieval significantly. Some of similarity measures are introduced next [5].
• Minkowski-Form Distance Minkowski distance is one of the most popular similarity measures used in CBIR. If
we have two images and the feature vectors of them are A and B, then the distance between
the two images is calculated by Equation 4.1:
( , ) = |( − )| (4.1)
In equation 4.1, N is the dimension of the feature vector. A special form from
equation 4.1 is when k = 2. The new form is called Euclidian Distance that is widely used
to measure the similarity between images. Many systems use the Euclidean Distance such
as Netra, MARS, and Blobworld. The distance between two images with N-dimensional
feature vectors using Euclidean Distance is shown in Equation 4.2.:
( , ) = |( − )| (4.2)

43
For some kind of features such as color histograms, similarity measures like
Euclidean Distance may not be ideal to measure the similarity between images [5].
Similarity between color images with histogram features is proposed by Swain and Ballard.
Let I and J are two images and fi(I) is the number of pixels in pin i of the image I, then the
histogram intersection is defined by Equation 4.3:
( , ) = ∑ min ( ), ( ) ∑ ( ) (4.3)
4.4 Indexing Schema Our world contains many digital images of different categories. Images are stored in
digital libraries or databases. As we said before, searching for a certain image is a difficult
task, because the databases contain huge number of images. Using some text descriptions to
describe images and store them is not a meaningful method. This is because no one has the
same description for the same image, and the description may be not powerful that it
describes the image correctly. To overcome these problems, indexing method is needed.
Indexing schema is important in CBIR systems. Indexing methods are proposed to
accelerate searching and retrieving steps. Indexing methods categorize images in the
database to groups. Each group contains similar images. This can be a preprocessing step
for CBIR system. Features extracted from images in the database are used for indexing. A
number of methods have been proposed for indexing. R*-tree is a popular multi-
dimensional indexing method [5, 39].
In our work we will use k-means algorithm as a clustering algorithm for indexing.
K-means algorithm will be used to cluster the database into clusters. With these clusters,
the search step will be performed by means of nearest neighbor search. When the user

44
submits a query image, it will be compared with each cluster’s centroid. According to the
similarity with the query image, the clusters will be ranked. The query image will be
compared with the images in the top ranked cluster. This method will reduce the number of
comparisons. Number of comparisons depends only on the number of clusters and the
number of images in the top ranked cluster.

45
Chapter 5 - Image Retrieval Based On Content In this chapter, we introduce our proposed CBIR system. In our proposed system,
we will extract some color features to represent the image and use these features to
compare between the images.
5.1 Color Feature Extraction The color composition of an image can be viewed as a color distribution in the
sense of the probability theory. The discrete probability distribution can be viewed as a
histogram. The color histogram is one of the most well-known color features used for
image feature extraction. It denotes the joint probability of the intensities of the image. The
quantization step for color histogram is necessary, but it is hard to find an optimal
quantization. Furthermore, if we find an optimal quantization for the histogram, it may
produce unwanted quantization effects.
From the probability theory, a probability distribution can be uniquely characterized
by its moments. Thus, if we interpret the color distribution of an image as a probability
distribution, moments can be used to characterize the color distribution. In our work, the
moments of the color distribution are the features extracted from the images, and we will
use them to describe the image and for image matching and retrieval [41].
The first order (mean), the second (standard deviation) and the third order
(skewness) color moments have been proved to be efficient and effective in representing
color distributions of images. If the value of the i-th color channel at the j-th image pixel is
pij, then the color moments are as the following:

46
Moment 1: Mean
= 1 (5.1)
Moment 2: Standard Deviation
= 1 − (5.2)
Moment 3: Skewness
= 1 − (5.3)
For color image, color moments are very compact representation features compared
with other color features since only 9 (3 values for each layer) numerical values are used to
represent the color content of each image channel.
5.2 K-Means for Database Clustering Time is one of the most important factors to CBIR. It mainly depends on the
number of images in the database. Many systems use every image in the database to be
compared with the query image to find the top matching images. This method is highly
computationally inefficient when the database contains large number of images. However,
it is a benefit to use all images in the database for similarity matching, so that the results
will be good enough. To overcome this problem, image clustering or categorization has
often been treated as a preprocessing step to speed-up image retrieval in large databases and
to improve the accuracy. Clustering algorithms are used as a preprocessing step to cluster
the database into N different categories [42].

47
A cluster is a group of objects that are similar to each other within the same group
and are dissimilar to the objects in other groups. Clustering has been widely used in
different applications, including pattern recognition, data analysis, machine learning, and
image processing. K-means is one of the simplest clustering algorithms.
In k-means algorithm, the clustering results are measured by the sum of within-
cluster distances between every vector and its cluster centroid. This criterion ensures that
the clusters generated are tight. K-means algorithm takes k, the number of clusters to be
generated, as the input parameter and partitions a set of N objects into k clusters so that the
resulting intracluster similarity is high but the intercluster similarity is low. If the number of
clusters is not specified, a simple method is done. The algorithm initializes the number of
clusters to a certain number less than the total number of the dataset. The algorithm
increases that number gradually until the average distance between a vector and its cluster
centroid is below a given threshold [43, 37].
The k-means algorithm works as the following. The number of clusters, k, is
entered as an input parameter. The algorithm randomly selects k of the objects, each of
which initially represents a cluster centroid. For each of the remaining objects, an object is
assigned to the cluster to which it is most similar. Similarity between the cluster centroid
and the object is determined by a distance. For example, if we use the Euclidean Distance
to measure the similarity and the result is smaller than a threshold, this means that this
object belongs to the cluster. It then computes the new mean for each cluster. This process
is iterated until the criterion function converges. The criterion function used for
convergence is the sum of squared-error (SSE). The SSE is defined by:

48
= | − | (5.4) ∈
In equation 5.4, E is the sum of squared error for all objects in the database, p is
feature vector representing the image and mi is the mean of cluster ci. This criterion
attempts to make the resulting k clusters as separate as possible.
The algorithm tries to determine the k clusters that minimize the squared error
function. It will work well when the clusters are compact and well separated from one
another. This algorithm is relatively scalable and efficient in processing large data sets, but
it often terminates at a local optimum. The k-means algorithm is given in Table 5.1 [43].
We use the k-means algorithm to classify the feature vectors of the input images.
We select the k-means algorithm because it is suitable to cluster large amount of data. Each
feature vector is treated as an object having a location in space. The cluster generates in
which objects within this cluster are close to each other and far from objects in other
clusters as possible. Selecting the distance measure is an important step in clustering. The
distance measure determines the similarity of two images.
To begin clustering, k objects are selected randomly to initialize the centroids of the
clusters. The centroid for each cluster is a point to which the sum of distances from all
objects in that cluster is minimized. The clusters are generated by calculating the distance
between the centroid and the objects for each cluster.
In our proposed CBIR system, we will prepare the database as a preprocessing step.
First, features are extracted from the images in the database. Using k-means, the feature
vectors are then used to generate the clusters so that all images in the database are

49
classified. When a query image is submitted, the features are extracted. Instead of
comparing the query image with all images in the database, a similarity distance is
calculated between the query image and each centroid of all clusters. The smallest distance
means that the query image belongs to that cluster. After that, the similarity distance is
calculated between the query image and the images only in that cluster to retrieve the top
most similar images. This will improve the speed and will make the retrieval processing
much faster.
Table 5.1: The k-means Algorithm
Purpose: The k-means algorithm for partitioning based on the mean value of the objects in
the cluster.
Input: A database of N objects, number of clusters k.
Output: A set of k clusters.
Method:
1. Arbitrarily choose k objects as the initial cluster centers.
2. (Re)Assign each object to the cluster to which the object is the most similar based
on the mean value of objects in the cluster.
3. Update the cluster means, i.e., calculate the mean value of the objects for each
cluster.
4. Repeat steps 2 and 3 until no changes.

50
5.3 The proposed CBIR System In this section we are introducing our proposed system for CBIR. In our system, we
will use images represented in the RGB color space. Although the RGB color space is
perceptually non-uniform and device-dependent, it is widely used for representing color
images. We do not worry about that because the image will have a preprocessing step.
Also, images in the database to be used for system testing and evaluation seem to be
captured and treated by the same way (the same capturing device and environmental
conditions). WANG database [44] is widely used for CBIR, and we will use it for our
system. Ranklet Transform is used as a preprocessing step. The advantage of using Ranklet
Transform is that it generates three images with different orientation that are vertical,
horizontal, and diagonal images. Because we use RGB color image, we perform the
Ranklet Transform for each image layer (the red, green, and blue layers). The Ranklet
Transform generates three images for each layer, three ranklet images for the red layer,
three ranklet images for the green layer, and three ranklet images for the blue layer. This
step is shown in Figure 5.1.
Figure 5.1 shows the preprocessing step. The original image is an RGB image that
contains the three layers or components. Ranklet Transform is applied for each image layer.
For each image layer, three ranklet images are generated in three different orientations.
They are the vertical, the horizontal, and the diagonal ranklet images. So, for each input
image we have nine images that have different information. We have to exploit these
images to extract features that represent the original image, and can be used for similarity
and retrieval. The preprocessing step will be applied for every image in the database so that
it will be ready for the next step that is extracting the features.

51
After applying the Ranklet Transform for the image, we have to extract its features
that represent the image. In our system, we select the color feature that represents the
image, to be extracted. Color moments are widely used to represent the color images, and
we will use them to extract the features from the images. We have nine images generated
from the preprocessing step. We calculate the three color moments for each image using
equation 5.1 for the mean, 5.2 for the standard deviation, and 5.3 for the skewness. After
calculating the three values, we concatenate them in one vector called image feature vector.
This vector has 27 values that represent the image, and we use it to measure the similarity
between the images.
Figure 5.1: The preprocessing step.
We calculate the feature vector for every image in the database. We use the k-means
clustering algorithm to cluster the images into different categories. This step will decrease
the time of retrieval. When the user submits an image, it will not be compared with each
image in the database. Instead, the feature vector of the image will be compared with the
centroid of each category by computing the distance between them. The smallest distance
The Original Image
R
G
B
Ranklet Transform
D H V
D H V
D H V

52
means that the input image is similar to the category holds that centroid. The input image
then is compared with the images in that category and system will retrieve the most similar
images to the input image.
Because we deal with image components instead of a single image, we will use a
similarity function that gives some weights for some image components. Equation 5.5 will
be used to measure the similarity between two images, which is [41]:
( , ) = − + − + − (5.5) In equation 5.5:
H and I are the two images to be compared,
i is the current image component index that is 1= R, 2 = G, and 3 = B,
r is the number of image layers that is 3,
, are the means of the two images in the ith component,
, are the standard deviations of the two images in the ith component,
, are the skewness of the two images in the ith component, and
wi is the weight for each moment.
In equation 5.5, dmom value is a similarity function and not a metric because we deal
with multidimensional images (images have 3 layers). Using this equation for similarity
measurement, it is possible to lead to false positive results. For image retrieval system, this
drawback is negligible. Fortunately, this function proved that it is more robust that other

53
methods or metrics used for similarity measures. The most important parameter in the
equation is the weight value wi. This parameter is user defined. In our proposed system, we
deal with three moments and three image layers. Some moments have some preferences
than the others. We use the weight parameter to give preferences to different features of an
image. For example, the mean is the most important moment and the other two moments
are derived from it. We want to give it the highest priority so that it is the main feature.
Also we can give any image layer the preference so that it is the main image layer. In the
implementation phase, we will tune the weights until we get the best results. This is like the
training for the system. We find that the best results are when wi1 = 2, wi2 = 1, and wi3 = 1.
After the system is ready for testing, the user just has to submit the query image and the
system will retrieve images similar to the query image.
The retrieved images will be ranked and the user will specify the number of images
to appear. The proposed algorithm is stated in Table 5.2.
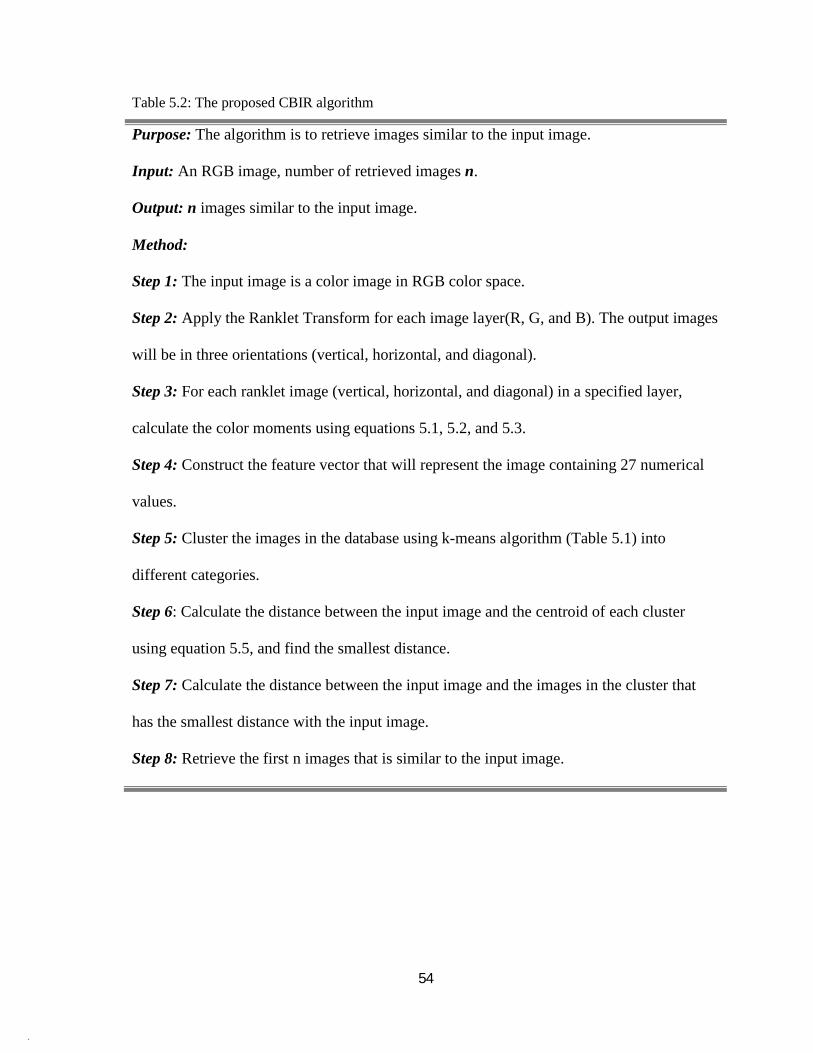
54
Table 5.2: The proposed CBIR algorithm
Purpose: The algorithm is to retrieve images similar to the input image.
Input: An RGB image, number of retrieved images n.
Output: n images similar to the input image.
Method:
Step 1: The input image is a color image in RGB color space.
Step 2: Apply the Ranklet Transform for each image layer(R, G, and B). The output images
will be in three orientations (vertical, horizontal, and diagonal).
Step 3: For each ranklet image (vertical, horizontal, and diagonal) in a specified layer,
calculate the color moments using equations 5.1, 5.2, and 5.3.
Step 4: Construct the feature vector that will represent the image containing 27 numerical
values.
Step 5: Cluster the images in the database using k-means algorithm (Table 5.1) into
different categories.
Step 6: Calculate the distance between the input image and the centroid of each cluster
using equation 5.5, and find the smallest distance.
Step 7: Calculate the distance between the input image and the images in the cluster that
has the smallest distance with the input image.
Step 8: Retrieve the first n images that is similar to the input image.

55
Chapter 6 - System Results and Evaluation
6.1 Introduction In this chapter, we will present the evaluation of our proposed system that was
introduced in the previous chapter. We introduce the database we select to test our system,
and we will compare our system results with other already existing CBIR systems that most
of them use the same image database.
6.2 WANG Database WANG database [44] is an image database that the images are manually selected
from the Corel database. In WANG database, the images are divided into 10 classes. Each
class contains 100 images. It is widely used for testing CBIR systems. Classification of the
images in the database into 10 classes makes the evaluation of the system easy. Figure 6.1
shows one example image for each class.
Africans Beaches Buildings Buses Dinosaurs
Elephants Flowers Horses Mountains Foods
Figure 6.1: One example image from each of the 10 classes of the WANG database.

56
This database was created by the group of Professor James Wang from the
Pennsylvania State University. This database is free and available to download. It was used
extensively to test many CBIR systems. This popularity is because the size of the database
and the availability of class information allows for performance evaluation. Since this
database is a subset of the Corel database, the images are of size 384 × 256 or 256 × 384
pixels as well.
As we said before, we choose this database for many reasons. Many CBIR systems
use this database, so we can easily compare our results with these systems. This database
contains large images in different classes (100 images per class). Diversity in the images
helps us to get more results and enhance our system. Also, we can explain the results we
get according to the database that the number of images we get from testing and compare
them with the images in the database. The most interesting point is that the images are
familiar to human, and they are very friendly to us.
6.3 Implementation Environment Our proposed system is implemented using Matlab image processing program of
version 7.8.0.347 (R2009a). We use a platform of Intel Core 2 Due Processing power of
2.13 GHz CPU with 3 GB RAM during the implementation. From the 1000 images, we
randomly select 300 images from the database. From each class we randomly select 30
images. The selected images went through the implemented system to extract the features
and stored them. The extracted features are used for classification using the k-means
clustering algorithm. This step is made offline for the 300 images selected from the
database. The database now is ready for testing and evaluating our CBIR proposed system.

57
6.4 Performance Evaluation Metrics for CBIR Systems When we want to evaluate a CBIR system, we may face some problems. One major
problem we face for CBIR system performance evaluation is that neither a standard
database nor a unique performance measure is available. There are many image databases
that are used to represent results for CBIR system. So, no standard image databases are
available for CBIR systems. Therefore, it is impossible to compare the performance of
different systems using different image databases. Furthermore, the early CBIR systems
were restricted their results. They presented one or more example queries, which are used
to give a positive impression about the efficiency of the system. This is neither a
quantitative nor an objective measure that can be used for system performance evaluation.
In CBIR, the most commonly used performance measures are Precision and Recall.
Precision is defined as the ratio of the number of retrieved relevant images to the total
number of retrieved images [45]. We denote to the precision by P. The equation of
precision is:
= (6.1)
Recall is defined as the ratio of the number of retrieved relevant images to the total
number of relevant images in the database [45]. We denote to the recall by R. The equation
of recall is:
= ℎ (6.2)
In CBIR, if the precision score is 1.0, this means that every image retrieved by a
search is relevant, but we do not know if the search retrieves all the images relevant to the

58
query. If the recall score is 1.0, this means that all relevant images are retrieved by the
search, be we do not know the number of irrelevant images were also retrieved.
In classification task, a precision of score 1.0 for a class X means that every object
labeled as belonging to class X does indeed belong to class X, but we do not know the
number of objects from class X that were not labeled correctly. Also, a recall of score 1.0
for a class X means that every object from class X was labeled as belonging to X, but we do
not know the number of objects were also labeled as belonging to class X incorrectly. There
is a trade-off between precision and recall. In search engine, for example, the user prefers to
increase the number of results relevant to the query by retrieving more documents. This
will increase the recall. On the other hand, the results will have quite large number of
irrelevant documents retrieved. This will decrease the precision [46].
In general, when we want to evaluate the performance of a CBIR system, we use
both the two metrics. The precision/recall graph is widely used. It provides meaningful
results when the database is known and has been used in some earlier systems. Because we
know every image in the database and also know the relevant images for each image, we
can use any image from the database to be the query.
6.5 The proposed System Evaluation This section is the most important section in the thesis. Here, we test our proposed
system and show the results. We explain the results, comment on them, and compare our
system with other existing systems.
In order to check retrieval effectiveness of the proposed system, we have to test it
by selecting some images randomly and retrieve some images. Also, we have to calculate

59
the two performance evaluation metrics that are Precision and Recall. Finally, we compare
our proposed system with other existing systems and show the efficiency of the proposed
system. To test the system, we select 300 different images from WANG database and from
different classes (30 images from each class). For initial test to our proposed system, we
select four images from different classes randomly and retrieve 10 images similar to the
query image.
The first test is selecting a random image from the Beaches class. We submit the
image to the system and retrieve the top 10 images that are similar to the query image.
As can be seen from Figure 6.2, we select the query image from the Beaches class
randomly and retrieve the most top 10 images that are similar to the query image. All
images retrieved by the system are relevant to the query image. Notice that the retrieved
images are belonging to the same class of the query image, and all the images are similar in
the color feature. So, the system retrieves them correctly.
Figure 6.3 shows another query image and its result. This is the second test for the
system. We select an image randomly from the Buildings class and retrieve 10 images
similar to the query image. Again, all images from the results are belonging to the same
class of the query image. Also, the images retrieved have similar color to the query image.
Almost images in the same class are similar to each other in their color, and our proposed
system depends mainly on the color feature.

60
Figure 6.2: Beach Query, The Top 10 Retrieved Images.
If we look to Figure 6.3 deeply, we notice that the last image retrieved by the
system has an object with different color (the yellow flower). Although the image contains
flowers with a strange color from other images, the system retrieves it and assigns it to the
Building class. This is true because the major color for the image is similar to the query
image, so the system retrieves it.
Figure 6.3: Building Query, The Top 10 Retrieved Images.

61
We also select a random image from the Horses class. We submit the image and
retrieve 10 images similar to the query image. Figure 6.4 shows the result of retrieving
images similar to the query image. As we can see from Figure 6.4, all the images are
similar to the query image and belong to the same class.
Figure 6.4: Horse Query, The Top 10 Retrieved Images.
The last test is for the Flowers class. We select the query image randomly and
retrieve 10 images similar to the query image. Figure 6.5 shows the result. From Figure 6.5,
we notice that all retrieved images are similar to the query image and have the same class.
Furthermore, we have some flower images in the database with color is not red; the system
does not retrieve them. The reason is that our system is mainly depends on the color feature
and when retrieving images, it just interests in the color feature and retrieve images similar
to each other in their color.
From the above testing, we can notice that the system works well and it retrieves
good results over the randomly selected images as queries. This gives us a good impression
that the system will also retrieve good results for most of the other images in the database if
we use them to retrieve images.

62
Figure 6.5: Flower Query, The Top 10 Retrieved Images.
One limitation of the system is that it only uses the color feature to represent the
image. During some testing, we notice that some retrieved images are similar to the query
image in the color, but they do not belong to the same class. This makes the retrieval task
incorrect. For example, if we submit a query image and the dominant color is gray, then the
system will retrieve images similar to the query image and maybe also retrieve some
images that contain gray color as a dominant color in it.
Figure 6.6 shows the limitation we have explained before. As we can see in the
figure, the query image belongs to the Elephants class. The system retrieves the images
similar to the query image. Some images do indeed belong to the Elephants class, but the
other images are not. The system retrieves the incorrect images because they are similar to
the query image in their color. In Figure 6.6, the incorrect images are from the Building
class. These images are similar to the query image if we use the color feature to represent
images. This leads the system to retrieve some incorrect images. So, in some cases, the
system may retrieve some incorrect images.

63
Figure 6.6: Elephant Query, The Top 10 Retrieved Images.
In general, the performance evaluation of the system is satisfactory and we will
present the performance metrics in the next section to evaluate the system. Also, we will
compare our system with other existing CBIR systems and shows that our proposed system
outperforms other CBIR existing system although it uses just the color feature to represent
the image.
One traditional graph that describes the performance of the system is the Precision-
Recall graph. It provides a meaningful result when the database is known and has been
used be some earlier systems. To evaluate our proposed system, we use the Precision-
Recall graph. We select 30 images randomly from each class in the database to use them as
queries to calculate the precision and recall. For each image, the precision of the retrieval
result is obtained by increasing the number of retrieved images. Figure 6.7 shows the
Precision-Recall graph.

64
Figure 6.7: The Average Precision/Recall Chart of The Proposed System.
Form Figure 6.7, we notice that the system has good precision results over the
different values of recall. The maximum average precision of 0.93 at recall value of 0.05,
and the precision value decreases to 0.47 at 0.28 of recall. For example, if a user submit a
query image and he want just 10 relevant images from 100 images retrieved by the system,
the graph shows us that the user will get 70 relevant images to the query image instead of
10 images. In other words, for an average recall value of 10%, we have an average
precision 70%. This means that we intent to get 10% of the relevant images in the database
and we will get 70% of the retrieved images that are relevant to the query image. This
clarifies that our system works well.
We have improved the efficiency of our proposed system by clustering the image
database using k-means clustering algorithm (Table 5.1). We perform the clustering
algorithm on the database as an offline step, and then we use the clusters to retrieve images
relevant to the query image. This is done by calculating the distance between the query
0
0.1
0.2
0.3
0.4
0.5
0.6
0.7
0.8
0.9
1
0 0.1 0.2 0.3 0.4
Aver
age
Prec
isio
n
Average Recall
The Proposed System

65
image and the centroid of each cluster. The smallest distance between the query image and
a centroid means that the query image is relevant to the centroid’s cluster. Then, we
calculate the distance between the query image and the images in that cluster to retrieve the
most similar images. To apply this, we chose some images randomly from each class as
queries and applied them twice. In the first time, we use the k-means algorithm to cluster
the database before image retrieval. In the second time, we retrieve images without
clustering the database as a preprocessing step. The average precision for each class for the
top 30 relevant images is shown in Figure 6.8.
Figure 6.8: Comparison of Precision of The Proposed System Applied With Clustering and Without Clustering.
From Figure 6.8, we note that the system works well when using the k-means
clustering algorithm and the results are better without using the clustering algorithm.
Furthermore, we test the time that the system takes to retrieve the relevant images. We
again apply the query images twice; one with clustering before retrieving and the second
without clustering. We notice that the system takes less time when using the k-means
0
0.1
0.2
0.3
0.4
0.5
0.6
0.7
0.8
Ave
rage
Pre
cisio
n
The Classes
with k-means
without k-means

66
clustering algorithm that without using it. If we look carefully on Figure 6.8, we can note
that the precision of classes Dinosaurs and Foods without using k-means is better that the
precision when using the k-means. This is because some images from each class are
incorrectly clustered. However, the difference between the two precisions is small and
negligible.
Applying a clustering algorithm on image database as a preprocessing step before
the retrieving step reduces the time consuming for retrieving images. The clustering step
avoids the system the computation complexity. The system does not need to search the
entire database to retrieve relevant images.
6.6 Comparison of the Proposed System with Other Systems In this section, we present some earlier CBIR systems’ results and compare them
with our proposed system. The existing systems we chose for comparison use color features
to represent images, and they also use the WANG database to evaluate their proposed
systems. To evaluate our proposed system, we use each image in our database to be a query
image and submit it to the system. We calculate the Precisions for each query in all classes.
Then for each class we take the average of all calculated Precisions as shown in Table 6.1.
The result of this study is compared against the performance of Jhanwar et al.’s
method [47], Hung and Dai’s method [48], CTDCBIRS [49], and SCBIRS [20].
Table 6.1 shows that our proposed system performs significantly better than other
systems for all classes except for classes 4, 8, and 9 which are Buses, Horses, and
Mountains respectively. The reason behind this limitation is that the dominant color of the
images in these classes is red, green, and blue respectively, and from the results we get , the

67
system retrieves images have with mixed colors and the dominant color of any image is not
one of the basic colors of the RGB color space.
Figure 6.9 shows the comparison of the proposed system with other systems. We
represent the precision value of each system for each class using the value from Table 6.1
by a vertical bar. We can see that our proposed system outperforms other existing systems,
over most classes, that use the color features to represent the images and also they use the
same database for evaluation.
Table 6.1: Comparison of Precision of the Proposed System with Previously Existed Systems.
Semantic Group Jhanwar et
al.
Hung and
Dai’s CTDCIRS SCBIRS
Proposed
System
Africans 0.4525 0.4240 0.5620 0.6830 0.7143
Beaches 0.3975 0.4455 0.5360 0.5400 0.8560
Buildings 0.3735 0.4105 0.6100 0.5615 0.8341
Buses 0.7410 0.8515 0.8930 0.8880 0.8571
Dinosaurs 0.9145 0.5865 0.9840 0.9925 0.9975
Elephants 0.3040 0.4255 0.5780 0.6580 0.7143
Flowers 0.8515 0.8975 0.8990 0.8910 0.9374
Horses 0.5680 0.5890 0.7800 0.8025 0.5714
Mountains 0.2925 0.2680 0.5120 0.5215 0.4286
Foods 0.3695 0.4265 0.6940 0.7325 0.9752

68
As a conclusion, the results show that our proposed system works well comparing
with other existing systems. The limitation we have mentioned is because we are using one
feature to represent the image.
Figure 6.9: Comparison of Precision of The Proposed System with Previously Existed Systems.
0
0.2
0.4
0.6
0.8
1
1.2
Jhanwar et al.
Hung and Dai’s
CTDCIRS
SCBIRS
Proposed System

69
Chapter 7 - Conclusion and Future Work In this Chapter, we will present a summary of our work, talking about the
contributions we have achieved and a conclusion for the work. We also present some
recommendation and future works.
7.1 Conclusion Nowadays, content-based image retrieval is a hot topic research. Many researches
have been done to develop some algorithms that solve some problems and achieve the
accuracy when retrieving images and distinguishing between them. Many proposed
algorithms use images to extract features and use their features for similarity matching.
However, most of the algorithms use the gray scales images. In our work, we use the color
image to extract the color feature and use it for similarity matching. We do this because
most images in our world are color images. So, color feature is one of the most features that
can be taken into account when developing a CBIR system.
In our work, we used WANG database that is widely used for CBIR. This database
contains 1000 images divided into 10 classes where 100 images for each class. Images in
the database are friendly and used for evaluating many CBIR systems. We used it to
evaluate the performance of our system by calculating the Precision and Recall metrics. We
used the RGB color space to represent the images. We used the Ranklet Transform to be as
a preprocessing step. This preprocessing step is important to prepare the image for the next
step. In the preprocessing step, we make the image invariant to rotation and image
enhancements. For example, if the query image is rotated or enhanced by any image
enhancement methods, the proposed system will be invariant and retrieve images correctly.
This step gives our proposed system satisfactory results. We used the color feature to
represent the images in the database. We calculated the moments for the image to be the

70
descriptor of the image. Color moments are easy to calculate and they do not add any
overhead on the system in the computation. We also compared our proposed system with
other existing CBIR systems that use the same database we have used for system
evaluation. The comparison shows that our system outperforms the other systems and the
results are satisfactory.
7.2 Limitations One limitation in our work is that the color feature is not enough to represent the
image and use it for similarity matching. From the results, we notice that some retrieved
images are not similar to the query image (see Figure 6.6). The proposed system matches
the images if the dominant color is similar. We can overcome this limitation by using more
than one feature to represent the image. In the next section, we state some ideas to enhance
the system.
7.3 Recommendations and Future Works The recommendation and the future work appear from the limitations and the
difficulties when we develop our system. The recommendations and the future works are as
the following:
• To represent an image, more than one feature is needed. Our system uses the color
feature. We recommend the combination of the texture, shape, and spatial features
with the color feature to represent the image. This will give good results. (to
overcome our system limitation).
• To further improve the retrieval results, segmentation is a method to extract regions
and objects from the image. The segmented regions are used for similarity matching.

71
• To enhance the results, the system has to take the feedback from the user. The user
checks the results and comments on them by some way. Then, the system
recalculates the results with the advantage of the feedback.

72
References
[1] J. Eakins and M. Graham, “Content-based Image Retrieval,” A report to the JISC technology applications programme, Institute for image database research, University of Northumbria at Newcastle, October 1999.
[2] H. Tamura, and N. Yokoya, “Image Database Systems: A Survey,” Pattern Recognition, vol. 17, no 1, pp.29–49, Sep. 1984.
[3] B. Jerome, V. Regine, and S. Georges, “A Signature based on Delaunay Graph and Co-occurrence Matrix,” Laboratoire Informatique et Systematique, Universiyt of Paris, Paris, France, July 2002.
[4] Digital Systems & Media Computing Laboratory, “Content-Based Image Retrieval,” Hellenic Open University (HOU), GREECE, 2009. Available at http://dsmc.eap.gr/en/cbir.php
[5] F. Long, H. Zhang, H. Dagan, and D. Feng, “Fundamentals of content based image retrieval,” in D. Feng, W. Siu, H. Zhang (Eds.): “Multimedia Information Retrieval and Management. Technological Fundamentals and Applications,” Multimedia Signal Processing Book, Chapter 1, Springer-Verlag, Berlin Heidelberg New York, 2003, pp.1-26.
[6] M. Flickner, H. Sawhney, W. Niblack, J. Ashley, Q. Huang, B. Dom, M. Gorkani, J. Hafner, D. Lee, D. Petkovic, and P. Yanker, “Query by image and video content: The QBIC system,” IEEE Computer, vol. 28, no 9, pp.23-32, Sep. 1995.
[7] A. Gupta, and R. Jain, “Visual information retrieval,” Comm. Assoc. Comp. Mach., vol. 40, no. 5, pp. 70–79, May. 1997.
[8] S. Mukherjea, K. Hirata, and Y. Hara, “AMORE: A World Wide Web Image Retrieval Engine,” Proc. World Wide Web, vol. 2, no. 3, pp. 115-132, June. 1999.
[9] A. Pentland, R. Picard, and S. Sclaroff, “Photobook: Content based manipulation of image databases,” International Journal of Computer Vision, vol.18, no 3, pp.233–254, June 1997.
[10] C. Carson, M. Thomas, S. Belongie, J.M. Hellerstein, and J. Malik, “Blobworld: A System for Region-Based Image Indexing and Retrieval,” Proc. Visual Information Systems, pp. 509-516, June 1999.
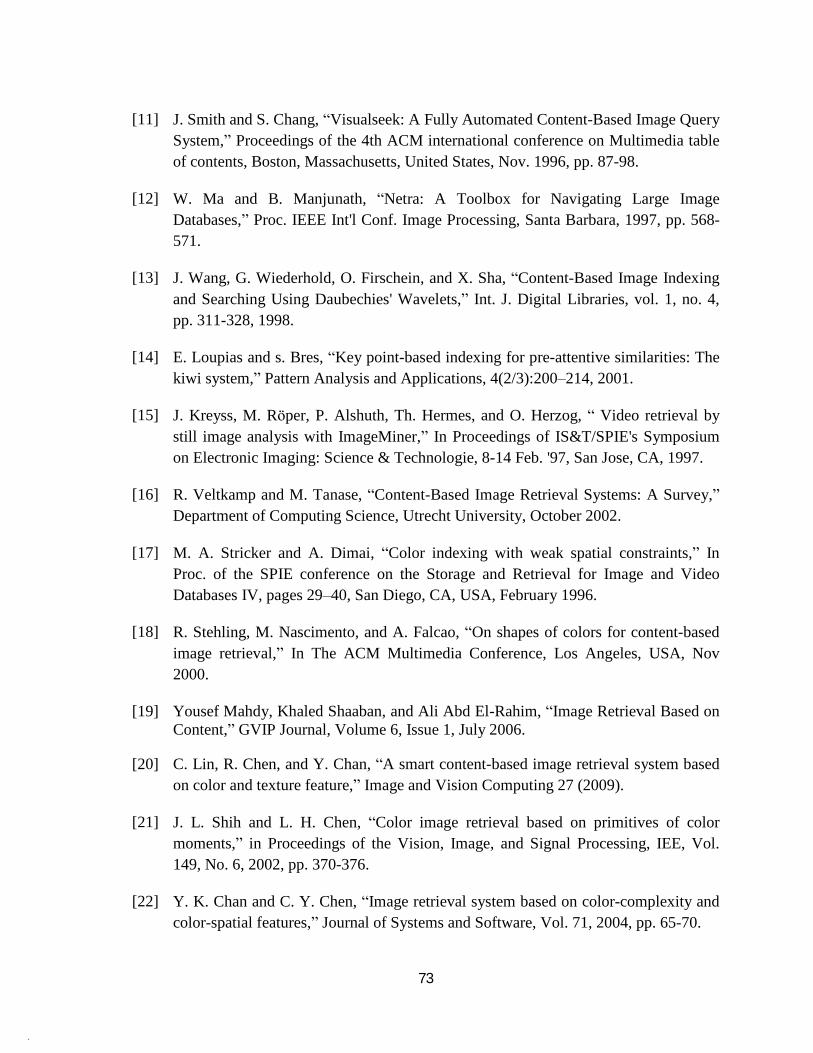
73
[11] J. Smith and S. Chang, “Visualseek: A Fully Automated Content-Based Image Query System,” Proceedings of the 4th ACM international conference on Multimedia table of contents, Boston, Massachusetts, United States, Nov. 1996, pp. 87-98.
[12] W. Ma and B. Manjunath, “Netra: A Toolbox for Navigating Large Image Databases,” Proc. IEEE Int'l Conf. Image Processing, Santa Barbara, 1997, pp. 568- 571.
[13] J. Wang, G. Wiederhold, O. Firschein, and X. Sha, “Content-Based Image Indexing and Searching Using Daubechies' Wavelets,” Int. J. Digital Libraries, vol. 1, no. 4, pp. 311-328, 1998.
[14] E. Loupias and s. Bres, “Key point-based indexing for pre-attentive similarities: The kiwi system,” Pattern Analysis and Applications, 4(2/3):200–214, 2001.
[15] J. Kreyss, M. Röper, P. Alshuth, Th. Hermes, and O. Herzog, “ Video retrieval by still image analysis with ImageMiner,” In Proceedings of IS&T/SPIE's Symposium on Electronic Imaging: Science & Technologie, 8-14 Feb. '97, San Jose, CA, 1997.
[16] R. Veltkamp and M. Tanase, “Content-Based Image Retrieval Systems: A Survey,” Department of Computing Science, Utrecht University, October 2002.
[17] M. A. Stricker and A. Dimai, “Color indexing with weak spatial constraints,” In Proc. of the SPIE conference on the Storage and Retrieval for Image and Video Databases IV, pages 29–40, San Diego, CA, USA, February 1996.
[18] R. Stehling, M. Nascimento, and A. Falcao, “On shapes of colors for content-based image retrieval,” In The ACM Multimedia Conference, Los Angeles, USA, Nov 2000.
[19] Yousef Mahdy, Khaled Shaaban, and Ali Abd El-Rahim, “Image Retrieval Based on Content,” GVIP Journal, Volume 6, Issue 1, July 2006.
[20] C. Lin, R. Chen, and Y. Chan, “A smart content-based image retrieval system based on color and texture feature,” Image and Vision Computing 27 (2009).
[21] J. L. Shih and L. H. Chen, “Color image retrieval based on primitives of color moments,” in Proceedings of the Vision, Image, and Signal Processing, IEE, Vol. 149, No. 6, 2002, pp. 370-376.
[22] Y. K. Chan and C. Y. Chen, “Image retrieval system based on color-complexity and color-spatial features,” Journal of Systems and Software, Vol. 71, 2004, pp. 65-70.

74
[23] M. Mustaffa, F. Ahmad, R. Rahmat, and R. Mahmod, “Content-Based Image Retrieval Based on Color-Spatial Features,” Malaysian Journal of Computer Science, Vol. 21(1), 2008.
[24] D. Zhang, “Improving Image Retrieval Performance by Using Both Color and Texture Features,” In Proc. of IEEE 3rd International Conference on Image and Graphics (ICIG04), Hong Kong, China, Dec.18-20, 2004, pp.172-175.
[25] H. Kekre, and D. Mishra “CBIR using Upper Six FFT Sectors of Color Images for Feature Vector Generation,” International Journal of Engineering and Technology Vol.2 (2), 2010, 49-54.
[26] N. Sharma, P. Rawa, and J. Singh, “Efficient CBIR Using Color Histogram Processing,” Signal & Image Processing : An International Journal(SIPIJ) Vol.2, No.1, March 2011.
[27] R. Gonzales, R. E. Woods, “Digital Image Processing,” 3rd Ed., New Jersey, Prentice Hall, 2008.
[28] M. Porat and Y. Zeevi., “The generalized Gabor scheme of image representation in biological and machine vision,” IEEE Trans. on Pattern Analysis and Machine Intelligence, vol. 10, no.4, pp. 452-468, July 1988.
[29] F. Smeraldi, “Ranklets: Orientation selective non-parametric features applied to face detection,” in 16th International Conference on Pattern Recognition, 2002, pp. 379-382.
[30] E. L. Lehmann, “Nonparametrics: Statistical methods based on ranks,” Holden-Day, 1995.
[31] R. Zabih and J. Woodfill, “Non-parametric local transform for computing visual correspondence,” In Proceedings of the Third European Conference on Computer Vision, Springer-Verlag New York, 1994.
[32] I. Daubechies, “Ten Lectures in Wavelets,” Society for industrial and applied mathematics, Philadelphia, USA, 1992.
[33] M. Masotti, “A ranklet-based image representation for mass classification in digital mammograms,” Medical Physics, 33(10):3951–3961, 2006.

75
[34] T. Shih, J. Huang, C. Wang, J. Hung, and C. Kao, “An Intelligent Content-based Image Retrieval System Based on Color, Shape and Spatial Relations,” Proc. Natl. Sci. Counc. ROC (A) Vol. 25, No. 4, 2001. pp. 232-243
[35] Y. Deng, B .Manjunath, C. Kenney, M. Moore, and Y. Shin, “An efficient color representation for image retrieval,” IEEE Trans. Image Processing, 10(1):140-147, Jan. 2001.
[36] J. Fuertes, M. Lucena, N. Perez, and J. Martinez, “A Scheme of Color Image Retrieval from Databases,” Pattern Recognition Letters, vol. 22, pp.323–337, June 2001.
[37] R. Datta, J. Li, and J. Wang, “Content-based image retrieval - approaches and trends of the new age,” ACM Computing Surveys, vol. 40, no. 2, Article 5, pp. 1-60, April 2008.
[38] R. Haralick, K. Shanmugam, and I. Dinstein. “Texture Features for Image Classification,” IEEE Trans. on Systems, Man and Cybernetics, SMC, vol.3, no 6, pp. 610–621, Nov. 1973.
[39] S. Thenmozhi, S. Balasubramanie, J. Venkatesh, and C. Sureshkumar, “Content Based Image Retrieval using K-Means Cluster Algorithm,” International Journal of Research and Reviews in Information Sciences Vol. 1, No. 1, March 2011.
[40] R. Salamah, “Efficient Content Based Image Retrieval,” Master dissertation, Computer Engineering Department, Islamic University of Gaza, Palestine 2010.
[41] M. Stricker and M. Orengo, “Similarity of color images,” In In SPIE Conference on Storage and Retrieval for Image and Video Databases III, volume 2420, pages 381392, Feb. 1995.
[42] V. Murthy, E. Vamsidhar, J. Kumar, and P. Sankara, “Content Based Image Retrieval using Hierarchical and K-Means Clustering Techniques,” International Journal of Engineering Science and Technology, Vol. 2(3), 2010.
[43] P. Jeyanthi and V. Jawahar Senthil Kumar, “Image Classification by K-means Clustering.” Advances in Computational Sciences and Technology ISSN 0973-6107 Volume 3 Number 1 (2010) pp. 1–8.
[44] J.Z. Wang, “Wang Database,” [Online], Available at: http://wang.ist.psu.edu/, last visited August 12th 2010.

76
[45] Y. Liu, D. Zhang, G. Lu, and W. Ma, “A survey of content based image retrieval with high-level semantics,” Journal of Pattern Recognition, vol. 40, pp. 262–282, Nov. 2007.
[46] Wikipedia, “Precision and Recall,” last modified on 26 May 2011, Available at: http://en.wikipedia.org/wiki/Precision_and_recall
[47] N. Jhanwar, S. Chaudhurib, G. Seetharamanc, B. Zavidovique, “Content based image retrieval using motif co-occurrence matrix,” Image and Vision Computing 22 (2004) 1211–1220.
[48] P.W. Huang, S.K. Dai, “Image retrieval by texture similarity,” Pattern Recognition 36 (3) (2003) 665–679.
[49] M. Babu Rao, B. Prabhakara Rao, and A. Govardhan, “CTDCIRS: Content based Image Retrieval System based on Dominant Color and Texture Features,” International Journal of Computer Applications (0975 – 8887), Volume 18– No.6, March 2011.


![Content Based Image Retrieval using Query by Approximate … · Retrieval (KBIR), Semantic Based Image Retrieval (SBIR) and Content Based Image Retrieval (CBIR) [1]. The KBIR methods](https://img.pdfslide.us/doc/110x75/604cc727f7fc662d1d5e1fe3/content-based-image-retrieval-using-query-by-approximate-retrieval-kbir-semantic.jpg)