Embed Size (px)
Citation preview
Image Region Entropy: A Measure of “Visualness”of Web Images Associated with One Concept
Keiji Yanai
Department of Computer Science,The University of Electro-Communications
1-5-1 Chofugaoka, Chofu-shi,Tokyo, 182-8585 JAPAN
Kobus Barnard
Computer Science Department,University of Arizona
Tucson, AZ, 85721 USA
ABSTRACTWe propose a new method to measure “visualness” of con-cepts, that is, what extent concepts have visual character-istics. To know which concept has visually discriminativepower is important for image annotation, especially auto-matic image annotation by image recognition system, sincenot all concepts are related to visual contents. Our methodperforms probabilistic region selection for images which arelabeled as concept “X” or “non-X”, and computes an en-tropy measure which represents “visualness” of concepts. Inthe experiments, we collected about forty thousand imagesfrom the World-Wide Web using the Google Image Searchfor 150 concepts. We examined which concepts are suitablefor annotation of image contents.
Categories and Subject DescriptorsI.4 [Image Processing and Computer Vision]: Miscel-laneous
General TermsAlgorithms, Experimentation, Measurement
Keywordsimage annotation, probabilistic image selection, Web imagemining
1. INTRODUCTIONThere are many words to annotate images with. Not
all words are appropriate for image annotation, since somewords are not related to visual properties of images. Forexample, “animal” and “vehicle”. They are not tied withthe visual properties represented in their images directly,
Permission to make digital or hard copies of all or part of this work forpersonal or classroom use is granted without fee provided that copies arenot made or distributed for profit or commercial advantage and that copiesbear this notice and the full citation on the first page. To copy otherwise, torepublish, to post on servers or to redistribute to lists, requires prior specificpermission and/or a fee.MM’05, November 6–11, 2005, Singapore.Copyright 2005 ACM 1-59593-044-2/05/0011 ...$5.00.
because there are many kinds of animals and vehicles whichhave various appearance in the real world.
In this paper, we propose a new method to measure “visu-alness” of concepts using Web images, that is, what extentconcepts have visual characteristics. To know which con-cept has visually discriminative power is important for im-age annotation task, especially automatic image annotationby generic image recognition systems, since not all conceptsare related to visual contents. Such systems should firstrecognize the concepts which have visual properties.
Recently there has been much work related to semanticimage classification [6, 8, 5] and annotation of words to im-ages [7, 1, 4]. Our work is most related to a recently de-veloped approach to learn the labeling of regions from im-ages with associated text, but without the correspondencebetween words and image regions [3, 1].
So far, most of the work related to image annotation or im-age classification has either ignored the suitability of the vo-cabulary, or selected concepts and words by hand. The pop-ularity of sunset images in this domain reflects such choices,often made implicitly. We propose that increasing the scaleof the endeavor will be substantively helped with automatedmethods for selecting a vocabulary which has visual corre-lates.
As an example of how this can be helpful, we are currentlystudying how to incorporate adjectives into our image anno-tation models [3, 1]. Adjectives bound to nouns have greatpotential to reduce correspondence ambiguity. For exam-ple, if a training image is labeled as “red ball”, and “red” isknown, but “ball” is not, the “red” item in the image willbe weighted more heavily as a theory on what the “ball”is. However, although there are many adjectives, not all ofadjectives are appropriate to use for image annotation task.Some adjectives have only a little or no relations to visualproperties presented in images. For example, adjectives re-lated to color such as “blue” and “green” are apparentlygood for annotation, while “hard” and “soft” are not likelyadequate since it seems to be difficult to be distinguishedfrom only visual properties. A measure of “visualness” ofconcepts can help select adjectives we should use.
Our method performs probabilistic region selection forregions that can be linked with concept “X” from imageswhich are labeled as “X” or “non-X”, and then we computea measure of the entropy of the selected regions based on aGaussian mixture model for regions. Intuitively, if such an
419
entropy is low, then the concept in question can be linkedwith region features. Alternatively, if the entropy is morelike that of random regions, then the concept has some othermeaning which is not captured by our features.
To estimate “visualness” of concepts, we can use preci-sion and recall diagram. However, to compute precision andrecall, we need a ground truth set, namely, labeled images.In general, no labeled images are available for general “X”,while “image region entropy” do not need labeled images orannotation of images by human at all. In that sense, “imageregion entropy” is a very useful measure to examine manykinds of concepts and compare their “visualness”.
To investigate these ideas, we collected forty thousandimages from the World-Wide Web using the Google Imagesearch for 150 adjectives. We examined which adjectives aresuitable for annotation of image contents.
The rest of the paper is as follows. In Section 2, we de-scribe the method to select regions which are likely relatedto a given concept, and compute “visualness” of concepts.In Section 3, we explain the experimental results in termsof probabilistic region selection and “image region entropy”for 150 adjectives. In Section 4, we conclude this paper.
2. METHOD TO COMPUTE THE IMAGEENTROPY
To get “image region entropy” associated to a certain con-cept, we need to gather images related to the concept. Al-though it is not easy to gather many images related to oneconcept by hand, World-Wide Web has made it much eas-ier. We can gather many images associated to a certainconcept using Web image search engines such as Google Im-age Search and Ditto. We can gather various images evenwithin one concept from the Web. Raw results from theWeb image search engines, however, usually include irrele-vant images. Moreover, in general, images usually includebackgrounds as well as objects associated with a concept. Sowe need to eliminate irrelevant images and pick up only theregions strongly associated with the concept in order to cal-culate the image entropy correctly. We use only the regionsexpected to be highly related to the concepts to computethe image entropy.
Our method to find regions related to a certain conceptis an iterative algorithm similar to the expectation maxi-mization (EM) algorithm applied to missing value problems.Initially, we do not know which region is associated with aconcept “X”, since an image with an “X” label just meansthe image contain “X” regions. In fact, with the imagesgathered from the Web, even an image with an “X” labelsometimes contain no “X” regions at all. So at first we haveto find regions which are likely associated with “X”. To find“X” regions, we also need a model for “X” regions. Here weadopt a probabilistic generative model, namely a mixture ofGaussian, fitted using the EM algorithm.
In short, we need to know a model for “X” and whichregions are associated with “X” simultaneously. However,each one depends on each other, so that we proceed itera-tively. Once we know which regions corresponds to “X”, wecan compute the entropy of “X” regions relative to a differ-ent mixture of Gaussian, this one being a generic one fittedusing the regions for a large number of images.
The algorithm we propose here is as follows:
(1) Prepare several hundred “X” images which are asso-
ciated with “X” and several hundred “non-X” imageswhich are unrelated to “X”. (“X” corresponds to a cer-tain concept.)
(2) Carry out region segmentation for all the “X” and “non-X” images and extract image features from each regionof each image.
(3) Select n “X” regions and n “non-X” regions randomlyfrom the regions which come from “X” and “non-X”images, respectively. (In the experiment, we set 200 ton.)
(4) Applying the EM algorithm to the image features of re-gions which are selected as both “X” and “non-X”, com-pute the Gaussian mixture model for the distribution ofboth “X” and “non-X”.
(5) Find the components of the Gaussian mixture whichcontributes “X” regions greatly. They are regarded as“X” components and the rest are “non-X” components.They are the generative models of “X” regions and “non-X” regions, respectively.
(6) Based on “X” components and “non-X” components,compute P (X|ri) for all the regions which come from“X” images, where ri is the i-th region.
(7) Compute the entropy of the image features of all theregions weighted by P (X|ri) with respect to a genericmodel for image regions obtained by the EM in advance.This “image region entropy” corresponds to “visualness”of the concept.
(8) Select the top n regions regarding P (X|ri) as “X” re-gions and the top n/2 regions regarding P (nonX|ri) as“non-X” regions. Add n/2 regions randomly selectedfrom “non-X” images to “non-X” regions.
(9) Repeat from (4) to (8) for 10 times.
In the following subsection, we explain the details of eachstep of the algorithm described above.
2.1 Segmentation and Feature ExtractionImages from the Web are much different from image databases
to which keywords are attached by hand, so they includemany irrelevant images which are unrelated to the concept.To treat with this, we use a probabilistic method to detectregions associated with concepts.
For the images gathered from the Web as “X” images, wecarry out the region segmentation. In the experiment, weuse JSEG [2]. After segmentation, we extract image featuresfrom each region whose size is larger than a certain thresh-old. As image features, we prepare three kinds of features:color, texture and shape features, which include the averageRGB value and their variance, the average response to thedifference of 4 different combination of 2 Gaussian filters,region size, location, the first moment and the area dividedby the square of the outer boundary length.
2.2 Detecting Regions Associated with “X”To obtain P (X|ri), which represents the probability of
how much the region is associated with the concept “X”,and some parameters of the Gaussian mixture model, whichrepresents a generative model of “X” regions, at the sametime, we propose an iterative algorithm.
At first, we select “X” regions and “non-X” regions atrandom. Using EM, we obtain the Gaussian mixture modelfor both the image region features of “X” and “non-X”, andassign components of the mixture model according to the
420
following formula.
pXj =
nXX
i=1
P (cj |rXi , X) (1)
=
nXX
i=1
P (X|cj , rXi )P (cj) (2)
where cj is the j-th component of the mixture model, nX isthe number of “X” regions, and rX
i is the i-th “X” region.The top m components in terms of pX
j are regarded asthe model of “X” and the rest are the model of “non-X”.With these models of “X” and “non-X”, we can computeP (X|ri) for all the regions which come from “X” images.Assume that p1(X|ri) is the output of the model of “X”and p2(nonX|ri) is the output of the model of “non-X”,given ri, we can obtain P (X|ri) as follows:
P (X|ri) =p1(X|ri)
p1(X|ri) + p2(nonX|ri)(3)
For the next iteration, we select the top n regions regardingP (X|ri) as “X” regions and the top n/2 regions regardingP (nonX|ri) as “non-X” regions. Add n/2 regions randomlyselected from “non-X” images to “non-X” regions. In thisway, we mix newly estimated “non-X” regions and randomlyselected regions from “non-X” images after the second iter-ation. We adopt mixing rather than using only newly esti-mated “non-X” regions empirically based on the results ofthe preliminary experiments. After computing the entropy,we repeat estimation of the model of “X” and “non-X”, andcomputation of P (X|ri).
2.3 Computing the Entropy of ConceptsWe estimate the entropy of the image features of all the
regions weighted by P (X|xi) with respect to a generic modelfor image regions obtained by the EM in advance. It is“image region entropy”, which corresponds to “visualness”of the concept. To represent a generic model, we use theGaussian mixture model (GMM).
We need to obtain a generic base in advance by the EMfor computing the entropy. To get a generic base, we usedabout fifty thousand regions randomly picked up from theimages gathered from the Web. The EM always includesrandomness in the initial setting, so we prepare k patternsof generic bases, compute the entropy k times and averagethem.
The average probability of image features of “X” weightedby P (X|xi) with respect to the j-th component of the l-thgeneric base represented by the GMM is given by
P (X|cj , l) =wj,l
PNXi=1 P (fX,i; θj,l)P (X|ri)
PNXi=1 P (X|ri)
(4)
where fX,i is the image feature of the i-th region of “X”,P (fX,i; θj,l) is the generative probability of fX,i from thej-th component, wj,l is the weight of the j-th component ofthe l-th base, and NX is the number of all the regions whichcome from “X” images,
The entropy for “X” is given by
E(X) =1
k
kX
l=1
NbaseX
j=1
−P (X|cj , l) log2 P (X|cj , l) (5)
where Nbase is the number of the components of the base.
In the experiment, we set 250 and 5 to Nbase and k, respec-tively.
3. EXPERIMENTSAs test images associated with concepts, we used the im-
ages gathered from the Web by providing 150 adjectives forGoogle Image search. We picked up top 150 frequent ad-jectives from adjective keywords attached to the HemeraPhoto-Object collection, which is a commercial image col-lection like the Corel Image collection. We obtained about250 Web images for each adjective. Totally we obtainedabout forty thousand images associated with the adjectives.As the parameters, we set m as 1, and the number of theGaussian mixture is set as 15. The reason why we used justone components to represent “X” is that adjectives are ex-pected to be associated with visual properties more directlythan nouns such as lion and animal.
Figure 1 shows “yellow” images after one iteration. Inthe figure, the regions with high probability P (yellow|ri)are labeled as “yellow”, while the regions with high proba-bility P (non yellow|ri) are labeled as “non yellow”. Figure2 shows “yellow” images after five iterations. This indicatesthe iterative region selection worked well in case of “yellow”.
Table 1 shows the 15 top adjectives and their image en-tropy. In this case, the entropy of “dark” is the lowest, so inthis sense “dark” is the most “visual” adjective among the150 adjectives under the condition we set in this experiment.Figure 3 shows part of “dark” images. Most of the region la-beled with “dark” are uniform black ones. Regarding otherhighly-ranked adjectives, “senior” and “beautiful” includesmany human faces, and most of “visual” are not photos butgraphical images such as screen shots of Windows or VisualC.
We show the ranking of color adjectives in the lower partof Table 1. They are relatively ranked in the upper ranking,although images from the Web included many irrelevant im-ages. This shows the effectiveness of the probabilistic regionselection method we proposed. At first, we expected thatall of them were ranked in the nearly top, but they weren’t.This is because all the images we used are collected from theWeb automatically, and the test image sets always includesome irrelevant images. So we could not obtain ideal resultsin this experiment. Note that the ranking varies if the con-dition of the experiment such as some parameters, imagefeatures and image search engine to gather Web images arechanged.
Table 2 shows the 15 bottom adjectives. In case of “re-ligious” shown in Figure 4, which is ranked in the 145-th,the region selection did not work well and the entropy gotrelatively larger, since the image features of the regions in-cluded in “religious” images have no prominent tendency.So we can say that “religious” has no or only a few visualproperties.
4. CONCLUSIONSIn this paper, we described a new method to select regions
associated with a certain concept from the regions of the im-ages related to the concept and to compute “image regionentropy” of the concept, which represents “visualness” ofconcepts. The experiments showed that the method to se-lect regions was effective and mostly “image region entropy”indicated “visualness” of concepts.
421
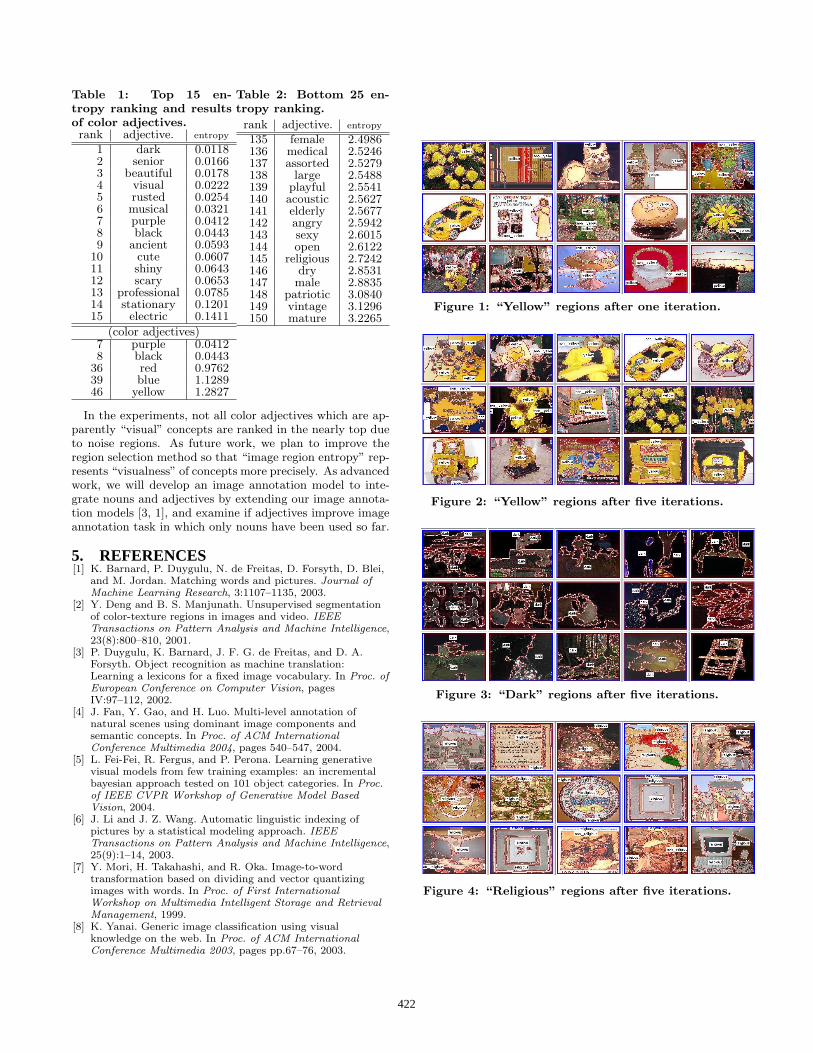
Table 1: Top 15 en-tropy ranking and resultsof color adjectives.rank adjective. entropy
1 dark 0.01182 senior 0.01663 beautiful 0.01784 visual 0.02225 rusted 0.02546 musical 0.03217 purple 0.04128 black 0.04439 ancient 0.0593
10 cute 0.060711 shiny 0.064312 scary 0.065313 professional 0.078514 stationary 0.120115 electric 0.1411
(color adjectives)7 purple 0.04128 black 0.0443
36 red 0.976239 blue 1.128946 yellow 1.2827
Table 2: Bottom 25 en-tropy ranking.
rank adjective. entropy
135 female 2.4986136 medical 2.5246137 assorted 2.5279138 large 2.5488139 playful 2.5541140 acoustic 2.5627141 elderly 2.5677142 angry 2.5942143 sexy 2.6015144 open 2.6122145 religious 2.7242146 dry 2.8531147 male 2.8835148 patriotic 3.0840149 vintage 3.1296150 mature 3.2265
In the experiments, not all color adjectives which are ap-parently “visual” concepts are ranked in the nearly top dueto noise regions. As future work, we plan to improve theregion selection method so that “image region entropy” rep-resents “visualness” of concepts more precisely. As advancedwork, we will develop an image annotation model to inte-grate nouns and adjectives by extending our image annota-tion models [3, 1], and examine if adjectives improve imageannotation task in which only nouns have been used so far.
5. REFERENCES[1] K. Barnard, P. Duygulu, N. de Freitas, D. Forsyth, D. Blei,
and M. Jordan. Matching words and pictures. Journal ofMachine Learning Research, 3:1107–1135, 2003.
[2] Y. Deng and B. S. Manjunath. Unsupervised segmentationof color-texture regions in images and video. IEEETransactions on Pattern Analysis and Machine Intelligence,23(8):800–810, 2001.
[3] P. Duygulu, K. Barnard, J. F. G. de Freitas, and D. A.Forsyth. Object recognition as machine translation:Learning a lexicons for a fixed image vocabulary. In Proc. ofEuropean Conference on Computer Vision, pagesIV:97–112, 2002.
[4] J. Fan, Y. Gao, and H. Luo. Multi-level annotation ofnatural scenes using dominant image components andsemantic concepts. In Proc. of ACM InternationalConference Multimedia 2004, pages 540–547, 2004.
[5] L. Fei-Fei, R. Fergus, and P. Perona. Learning generativevisual models from few training examples: an incrementalbayesian approach tested on 101 object categories. In Proc.of IEEE CVPR Workshop of Generative Model BasedVision, 2004.
[6] J. Li and J. Z. Wang. Automatic linguistic indexing ofpictures by a statistical modeling approach. IEEETransactions on Pattern Analysis and Machine Intelligence,25(9):1–14, 2003.
[7] Y. Mori, H. Takahashi, and R. Oka. Image-to-wordtransformation based on dividing and vector quantizingimages with words. In Proc. of First InternationalWorkshop on Multimedia Intelligent Storage and RetrievalManagement, 1999.
[8] K. Yanai. Generic image classification using visualknowledge on the web. In Proc. of ACM InternationalConference Multimedia 2003, pages pp.67–76, 2003.
Figure 1: “Yellow” regions after one iteration.
Figure 2: “Yellow” regions after five iterations.
Figure 3: “Dark” regions after five iterations.
Figure 4: “Religious” regions after five iterations.
422