Embed Size (px)
Citation preview
Research ArticleImage Recognition of Crop Diseases and Insect Pests Based onDeep Learning
Mingyuan Xin 1 and Yong Wang2
1School of Computer and Information Engineering, Heihe University, Heihe, China2Institute of International Education, Heihe University, Heihe, China
Correspondence should be addressed to Mingyuan Xin; [email protected]
Received 12 January 2021; Revised 4 March 2021; Accepted 5 April 2021; Published 28 April 2021
Academic Editor: Wenqing Wu
Copyright © 2021 Mingyuan Xin and Yong Wang. This is an open access article distributed under the Creative CommonsAttribution License, which permits unrestricted use, distribution, and reproduction in any medium, provided the original workis properly cited.
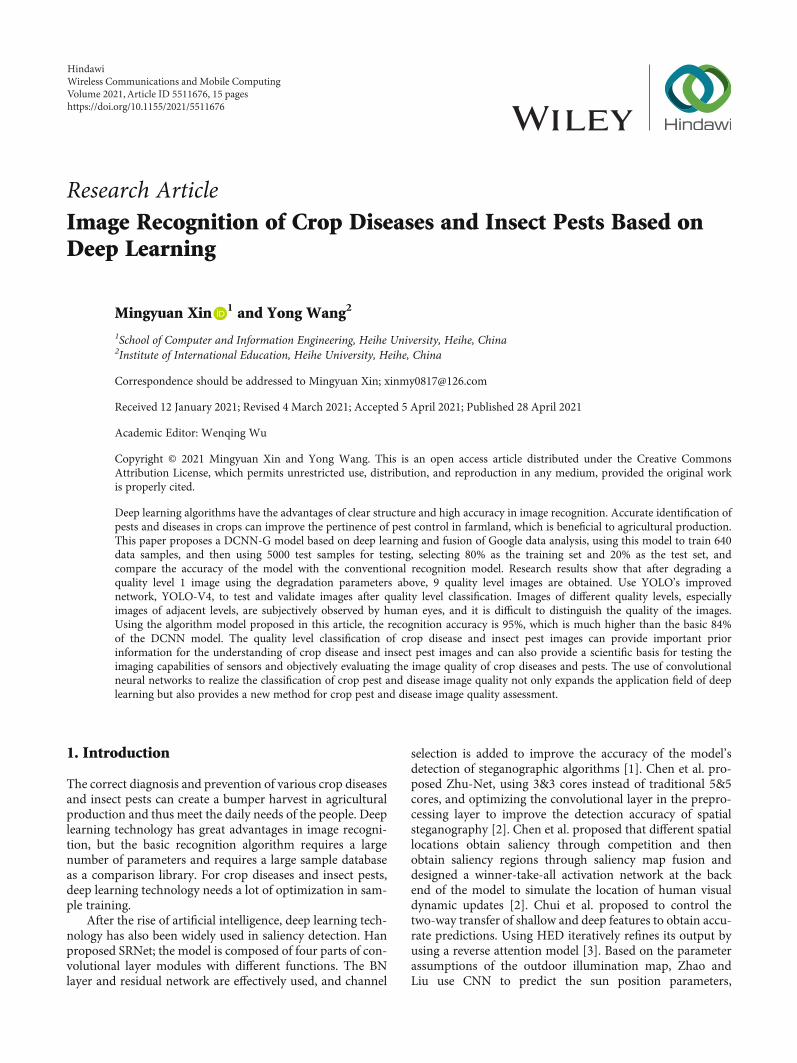
Deep learning algorithms have the advantages of clear structure and high accuracy in image recognition. Accurate identification ofpests and diseases in crops can improve the pertinence of pest control in farmland, which is beneficial to agricultural production.This paper proposes a DCNN-G model based on deep learning and fusion of Google data analysis, using this model to train 640data samples, and then using 5000 test samples for testing, selecting 80% as the training set and 20% as the test set, andcompare the accuracy of the model with the conventional recognition model. Research results show that after degrading aquality level 1 image using the degradation parameters above, 9 quality level images are obtained. Use YOLO’s improvednetwork, YOLO-V4, to test and validate images after quality level classification. Images of different quality levels, especiallyimages of adjacent levels, are subjectively observed by human eyes, and it is difficult to distinguish the quality of the images.Using the algorithm model proposed in this article, the recognition accuracy is 95%, which is much higher than the basic 84%of the DCNN model. The quality level classification of crop disease and insect pest images can provide important priorinformation for the understanding of crop disease and insect pest images and can also provide a scientific basis for testing theimaging capabilities of sensors and objectively evaluating the image quality of crop diseases and pests. The use of convolutionalneural networks to realize the classification of crop pest and disease image quality not only expands the application field of deeplearning but also provides a new method for crop pest and disease image quality assessment.
1. Introduction
The correct diagnosis and prevention of various crop diseasesand insect pests can create a bumper harvest in agriculturalproduction and thus meet the daily needs of the people. Deeplearning technology has great advantages in image recogni-tion, but the basic recognition algorithm requires a largenumber of parameters and requires a large sample databaseas a comparison library. For crop diseases and insect pests,deep learning technology needs a lot of optimization in sam-ple training.
After the rise of artificial intelligence, deep learning tech-nology has also been widely used in saliency detection. Hanproposed SRNet; the model is composed of four parts of con-volutional layer modules with different functions. The BNlayer and residual network are effectively used, and channel
selection is added to improve the accuracy of the model’sdetection of steganographic algorithms [1]. Chen et al. pro-posed Zhu-Net, using 3&3 cores instead of traditional 5&5cores, and optimizing the convolutional layer in the prepro-cessing layer to improve the detection accuracy of spatialsteganography [2]. Chen et al. proposed that different spatiallocations obtain saliency through competition and thenobtain saliency regions through saliency map fusion anddesigned a winner-take-all activation network at the backend of the model to simulate the location of human visualdynamic updates [2]. Chui et al. proposed to control thetwo-way transfer of shallow and deep features to obtain accu-rate predictions. Using HED iteratively refines its output byusing a reverse attention model [3]. Based on the parameterassumptions of the outdoor illumination map, Zhao andLiu use CNN to predict the sun position parameters,
HindawiWireless Communications and Mobile ComputingVolume 2021, Article ID 5511676, 15 pageshttps://doi.org/10.1155/2021/5511676
atmospheric condition parameters, and camera parametersin the input image and then use the predicted parametersto synthesize the corresponding HDR environmental illumi-nation map [4].
Zhao et al. add the residual items of local illuminationon the basis of global illumination and restore the globalillumination information and local illumination informa-tion through cascaded CNN through staged predictionand obtain more detailed illumination information [5].Wu and An predict the pixel-level attention map throughthe context attention network and combine it with the U-Net network structure to detect the saliency area [6]. Zhaiet al. proposed a saliency detection model BASNet basedon boundary perception. This model integrates BCE,SSIM, and IoU three loss functions to guide the networkto pay more attention to boundary quality, accurately seg-ment saliency regions, and make the boundaries ofsaliency regions more clear [7]. Miao et al. use the skylightmodel to predict good outdoor lighting information withonly a few parameters and realize the rerendering applica-tion of virtual object insertion [8]. Tao et al. use CNN tocomplete the prediction of outdoor HDR environmentallighting images. The method used can correctly estimatethe illuminators in the scene, but the lack of illuminatorsin the scene can lead to incorrect predictions [9].Although these methods have improved the standard ofsaliency detection, there is still much room for improve-ment in the quality of fine structure segments and theaccuracy of the boundary. The illumination informationpredicted by the above method is very detailed but con-tains a large number of parameters. For this reason, thispaper proposes a deep network model fused with Googledata analysis.
Based on the existing objective quality evaluation andquality level classification of crop pests and diseases, thispaper uses the classification function of deep learning to con-struct a deep convolutional neural network model for theclassification of crop pest and disease image quality. Themodel realizes the classification of crop disease and insectpest images with multiple quality levels, which is moredetailed and accurate than the comparison literature method.The images after the quality level classification are tested andverified by the improved network YOLO-V3 of YOLO (youonly look once), and the detection accuracy is significantlyimproved.
2. Image Recognition of Deep LearningConvolutional Network
2.1. Three-Dimensional Image Recognition Technology. Atpresent, a small number of studies have established projec-tion models with different aspect ratios and sizes in advanceand then use radar to sense the depth information of the sur-rounding environment of the object, select the projectionmodel that best fits the current scene, and project the 3Dobjects close to itself to the wall of the model. In space ratherthan on a two-dimensional plane, the display distortion ofthree-dimensional objects is reduced [10]. However, thismethod can only roughly estimate the surrounding environ-
ment of the object. When there are multiple three-dimensional objects in the environment, it cannot optimizethe display of each three-dimensional object [11]. Combiningthe radar information and the binocular ranging principle,after jointly estimating the accurate three-dimensional infor-mation of the environment, a specific projection model con-forming to the current scene is established and then projected[12]. This method can more accurately solve the display dis-tortion problem of each large three-dimensional object, butthe real-time performance is reduced due to the need todynamically change the shape of the projection model, andthe projection model with a special shape may also cause pro-jection distortion to other scenes [13]. In the above twomethods, the variable projection model is used to solve theproblem of projection distortion, and the radar sensor is usedto measure the depth of field, which not only causes theincrease in system cost but also complicates the processingprocess [14]. Through analysis, it can be seen that thethree-dimensional objects that workers are most concernedabout in the process of field work are only other crops andpedestrians (the two are collectively referred to as objects ofinterest below), so this article combines the characteristicsof the application scene and proposes an enhanced three-dimensional method. The synthesis method of panoramicimages, combined with object detection and coordinateascending and inverse mapping, renders the prepreparedthree-dimensional model of the object of interest on the esti-mated position, thereby solving the above problem [15].
With the widespread application of deep learning inthe field of digital image processing, the use of deep con-volutional neural network (DCNN) methods to restoreand reconstruct digital images, feature extraction, targetdetection, and semantic segmentation has become themainstream research direction of many scholars [16]. Dig-ital image processing based on DCNN employs a data-driven learning and training mode, and the accuracy andeffectiveness of the processing are highly dependent onthe quality and category of the training set images [17].For crop disease and insect pest images, due to the impactof the imaging environment, it is difficult to ensure thatthe acquired image data sets are at the same quality level.This will not only affect the processing effects of crop dis-ease and insect pest images of other quality levels but alsoaffect the processing of the overall business system effect[18]. The root cause of such problems is the imbalanceof data quality [19]. The problem of data imbalance is alsoan important issue that deep learning algorithms payattention to [20]. Aiming at the problem of unbalanceddata quality, the existing methods generally deal with theproblem of massively expanding the image data set,increasing the training time and the number of iterations[21]. This method finally obtains only an average valueof the processing effect and does not improve the overalleffect; the other way is to restore or superresolve the imageof crop diseases and insect pests and then perform top-level processing after improving the image quality,although it has a certain effect. However, the reconstruc-tion effect will still be affected by the amount of imagedata of heterogeneous crop diseases and insect pests [22].
2 Wireless Communications and Mobile Computing
2.2. Image Quality Classification Model of Crop Diseases andInsect Pests. The classification of image quality levels belongsto the category of objective image quality evaluation and is acomplicated scientific problem [23]. Automatic evaluationusing NIIRS standards is mainly accomplished through thefollowing quality equations:
Hnb = 〠k
j=2〠j−1
h=1Gjh pjsh + phsj
� �Djh,
Djh =djh − Pjh
djh + Pjh,
RER jh =ð∞0dFj yð Þ
ðy0y − xð ÞdFh xð Þ,
ð1Þ
where D represents the coefficient of the equation; there aredifferent assignment versions: RER (relative edge response)represents the relative edge response; G (Convolved Gain)represents the noise gain of the imaging system postproces-sing; H (Edge Overshoot) represents the edge after the sys-tem postprocessing overshoot factor [24]. Since it is difficultfor general researchers to obtain GSD-related parameters ofcrop disease and insect pest images, the calculation of RERalso requires the image to have appropriate edge shape char-acteristics, and the calculation method of SNR is not unique.The image quality equation is used to quality crop diseaseand insect pest images. Hierarchical classification has greatlimitations:
f xð Þ = 1Nh
〠N
i=1k
Xi − xh
� �,
k xð Þ = 1ffiffiffiffiffiffi2π
p exp −x2
2
� �,
ht = tanh wcxt + uc rtΘht−1ð Þ + bcð Þ,ht = ztΘht−1 + 1 − ztð ÞΘht:
ð2Þ
There are relatively few research results on the use ofdeep learning to achieve image quality classification.From the perspective of blind image restoration, the liter-ature divides close-up images into two simple types, clearand blurred, due to the lack of batch normalization (BN)layer, greatly reducing the generalization ability of thenetwork:
σt =
ffiffiffiffiffiffiffiffiffiffiffiffiffiffiffiffiffiffiffiffiffiffiffiffiffiffiffiffiffiffiffiffiffiffiffiffiffiffiffiffi1/n∑n
i=1 FIit − FIitð Þ2q
FIit,
u j∣ið Þ =wijAi,
sj =〠i
ci ju j∣ið Þ:
ð3Þ
From the perspective of quality evaluation, a multitaskquality grade prediction DCNN method is proposed. Thismethod uses NIIRS as the subjective quality label, con-
structs a quality grade classification and regression net-work, and realizes 10 quality grade classifications. Thefeature extraction network structure of this method isdeep, and the calculation efficiency is too low for theproblem of coarse quality level classification; due to thelack of random loss of connections, it is also prone tooverfitting:
ln FIitFIit − 1
� �= α + β ln FIit − 1 + vi +It: ð4Þ
At the same time, there are considerable errors anddifficulties in the calculation of subjective quality labels.The image quality classification of crop diseases andinsect pests is a qualitative study of images, which is atypical mathematical classification problem. The feed-forward convolutional neural network structure based onsupervised learning has a powerful classification function,which is very suitable for quality level classification usingthis type of network structure:
cij =ebi j
∑kebik,
r = α
1 − β,
θ = −1T
ln 1 + βð Þ,
τ = ln 2ð Þθ
:
ð5Þ
2.3. Basic Convolutional Neural Network Structure forImage Quality Classification. Our goal is to train a classi-fier through DCNN to classify images of crop diseasesand insect pests into different levels according to theirquality. The classification network takes the image ofcrop diseases and insect pests as input and outputs alabel value representing the quality level of the image.Therefore, the entire network is a frame from large tosmall, from coarse to fine. Since the quality of the imageof crop diseases and insect pests is not necessarily relatedto the size of the image, the input image can be takeninto a relatively fixed size. First, the input sample imageis preprocessed by zero score standardization. The pur-pose is to adjust the pixel value distribution of crop pestimages to a nearly normal distribution and improve theability to activate network training. Secondly, in orderto alleviate the overfitting problem and reduce additionalconnection parameters, multiple BN layers are added tothe middle layer, and the global average pooling layer isreplaced with a fully connected layer commonly used inclassifiers. In order to maintain the detailed characteristicsof the image from large to small, the maximum pooling(MaxPooling) method is used for data scale compression;in order to improve the convergence speed while avoidingthe disappearance of the gradient, a linear correction isadded after the convolution (convolution, Conv) layer
3Wireless Communications and Mobile Computing
unit ReLU function:
ln FIitFIit − 1
� �= α + β ln FIit − 1 + ϕXit − 1 + vi + τt ,
kt1 i½ � =〠j
cos w1i ,w2
j
� �,
BCRMjh =∑
hj
Z=1∑nhr=1 yji − yhr
������
njnh uj + uh� ,
DCNNt = 〠k
j=2〠j−1
h=1Gjh pjsh + phsj
� �Djh 1 −Djh
� :
ð6Þ
The above formula shows the DCNN architecture ofquality classification, in which K is the number ofBCRM, and BCRM is the abbreviation of BN layer, Convlayer, ReLU layer, and max-pooling layer. After conver-sion, it can be expressed by the following formula:
Gjj =1/2uj∑
nj
i=1∑nj
r=1 yji − yjr���
���n2j
,
Gw = 〠k
j=1Gjjpjsj:
ð7Þ
Convolution neural networks need to choose anappropriate loss function to transform the convolutionparameter acquisition problem into an optimization prob-lem. The label of data classification problem is oftenunderstood as a probability value, so its loss function ismainly set for this probability value. The most commonloss function is the cross-entropy function, which hasthe advantage of faster weight update than the varianceloss function. Assuming that X represents the inputimage and the network parameters to be trained, theDCNN quality classification network can be understoodas a probability function for predicting the X qualityindex:
djh =ð∞0dFh yð Þ
ðy0y − xð ÞdFj yð Þ,
G =Gw + Gnb +Gt:
ð8Þ
In the formula, G is the number of samples in eachbatch, and the optimal classification level value of thesegment quality level classification network is preset.Once it exceeds the preset level value, the convergencespeed will be slow and the classification accuracy willbe low.
2.4. Multistage Quality Classification. Multisegment hierar-chical classification is to use a shallow convolutional neuralnetwork, through adjusting the label, similar to the shape ofthe pyramid, from coarse to fine layer by layer classification,
can achieve fixed network depth, but not fixed number oflevels of quality classification. Since any integer greater than1 can be regarded as a linear combination of positive integersless than 1, any level of quality classification can be achievedby using a 2-level, 3-level, and 4-level quality classificationnetwork with less feature extraction layer. During the train-ing process, the input for each segment of the network isthe original training data and only a simple classification net-work is used to achieve the classification. In the process oftesting, we need to use the judgment method to select theappropriate network structure path to achieve classification,but the judgment method is a convolutional network. Theadvantage of multistage network structure quality level clas-sification is that the classification level can be set freely, thenetwork structure is fixed, and the classification is realizedlayer by layer through internal circulation, so the trainingprocess is relatively simple.
The generalized camera internal parameters include thecamera internal parameter matrix and the camera distortionparameters, which reflect the internal optical structure of thecamera and are related to the characteristics of the cameraitself. They are mainly responsible for the mapping processfrom the camera coordinate system to the pixel coordinatesystem. They are the mapping process from three-dimensional to two-dimensional, and also the conversionprocess from the physical length unit to the pixel length unit.The transformation of internal parameters of insect camera isas follows:
G =∑k
j=1∑kh=1∑
nj
t=1∑nhr=1 yij − yhr
������
2n2u , ð9Þ
where the subscript g is the camera coordinate system, Kis the distortion parameter of the insect camera, and H is thecoordinate point in the pixel coordinate system, which is gen-erally half of the image length and width. Based on the aboveconversion principle, with the help of camera calibrationchessboard, the internal parameter, external parametermatrix, and distortion parameters of four insect camerasare calibrated, respectively. The mapping projection modelestablishes a virtual object surrounding the environment,and the points on it are taken as the points in the world coor-dinate system. Through the above mapping relationship, thecorresponding pixel coordinates (i.e., the points in the fourimages) are obtained, and the RGB information of the corre-sponding image points is rendered on the projection modelto complete the synthesis of the basic three-dimensional pan-oramic image. Using this kind of projection model, the roadsurface can be projected to the model ground and the three-dimensional objects such as crops can be projected to themodel wall in most cases, so as to ensure the correct projec-tion relationship of the objects and avoid distortion.
It is difficult to optimize these two kinds of distortions atthe same time simply by changing the size of the projectionmodel. When the projection model is enlarged, the line bend-ing distortion can be alleviated, but more crops, pedestrians,and other three-dimensional objects will fall into the groundarea of the projection model, thus aggravating the object
4 Wireless Communications and Mobile Computing
stretching distortion; on the contrary, although reducing theprojection model can ensure the accuracy of most three-dimensional objects projected on the wall, it can not guaran-tee the straightness of the ground line. And in the process ofdynamic adjustment of the model, the display screen is proneto jump, which affects the display effect.
3. Image Recognition Design of Crop Diseasesand Insect Pests
3.1. Objects. In this paper, a DCNN-G model based ondeep learning and Google data analysis is proposed. 640data samples are trained by this model, and then, 5000 testsamples are tested. The accuracy of this model is com-pared with the conventional recognition model. The 5000images are cut into 256 pixel × 256 pixel images, and 80%of the training set and 20% of the data are selected asthe test set. After one image of quality level 1 is degradedby using the above degradation parameters, nine qualitylevel images are obtained. The images classified by qualitylevel are tested by using the improved network YOLO-V4of YOLO (you only look once).
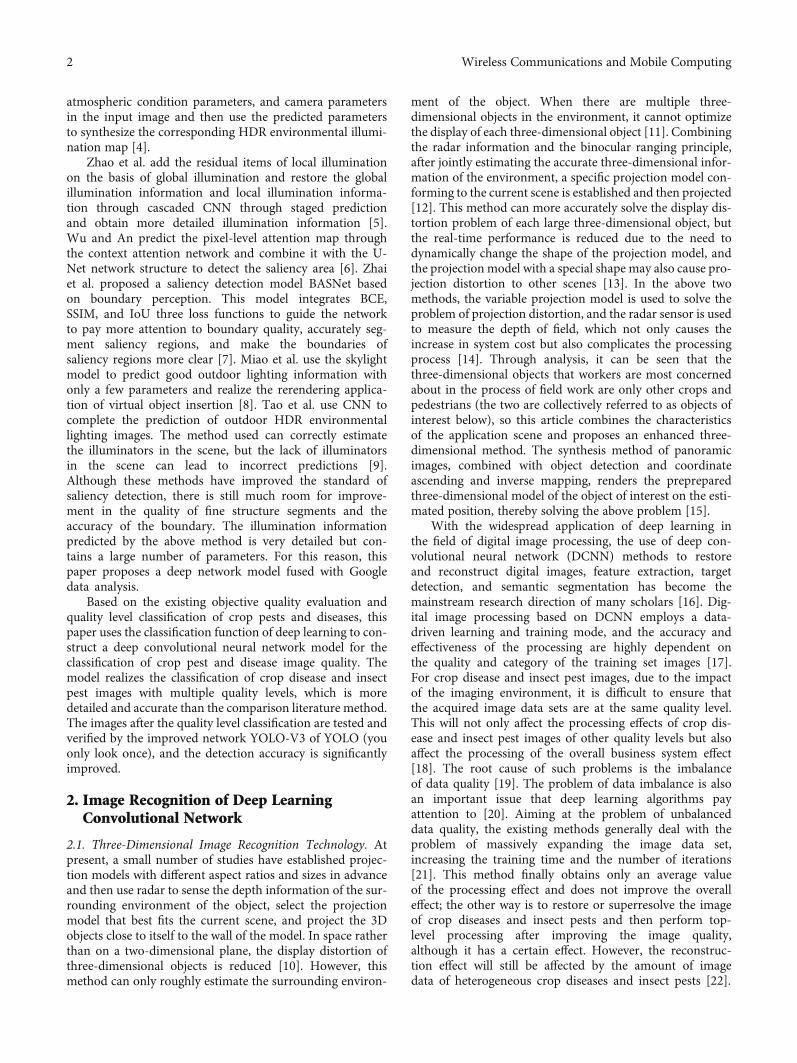
3.2. Steps. A high-performance computing platform (TSMCserver) and nvidi card are used for model training. The train-ing parameters were set as batch size of 32, learning rate of0.001, and turn of 1500. Use Adam network optimizer toupdate the weight parameters. The model training needsabout 23,400 s, and the image preprocessing uses theMATLAB r2018b platform and Python 3.7. The classificationresults of SMCNL, EFFL, MEMA-I, and MEMA-T in the testdata set containing 640 data samples are compared. It is dif-ficult to distinguish the quality of images with different qual-ity levels, especially those with adjacent levels, by subjective
observation with human eyes. The results show that bothone segment and multiple segments can achieve a 10-gradeimage quality classification of crop diseases and pests. Forthe three models designed by the one-stage quality classifica-tion method, accuracy, recall, and precision of n-type are sig-nificantly improved compared with S-type, and theevaluation index of n-type is basically unchanged comparedwith C-type. The Gaussian blur and Gaussian noise of differ-ent scales added to the original data are artificially degraded,and they are marked as 2-10 levels, respectively, with a totalof 5000 images. The 5000 images are then cut into 256 pixel× 256 pixel images, and 80% of the training set and 20% ofthe data are selected as the test set.
(1) Image preprocessing
Color normalization in the process of staining and scan-ning of aortic wall tissue samples, due to the different labora-tory conditions of staining, parameter settings of a digitalscanner, and illumination, the color differences of digital pestimages are often caused. Color normalization can not onlyensure the color consistency of the image but also preservethe biological information in the pest image, so as to improvethe classification performance of the model. A normalizationmethod based on staining separation is used to reduce thecolor difference of histopathological images, and the struc-ture information in the images is saved as much as possibleby generating the staining density map.
(2) 3D panorama of crop enhanced image
The adaptive projection model method is easy to take onething into account and lose the other when solving the distor-tion problem. In view of the problem of display distortionand the shortage of current solutions, this paper proposes
0
1
2
3
4
5
6
7
8
Bold text Goo Ent Aug Tran L2
Func
tiona
l per
form
ance
Influencing factors
�e four evaluation indicators of MEMA-T classification
Validation set
Test setSMCNL Training set
EFFL
MEMA-I
Figure 1: The four evaluation indicators of MEMA-T classification.
5Wireless Communications and Mobile Computing
an enhanced 3D panoramic image synthesis method. Withthe help of the YOLO detection network and the coordinatedimension elevation inverse mapping method proposed inthis paper, the 3D objects around the agricultural objectsare represented in the way of virtual synthesis withoutdynamically changing the projection model. This paper willfocus on how to detect the object of interest and estimateits accurate world space position through the image. Thesteps are as follows: firstly, the original image captured byfour cameras is taken as the input of the object detectionnetwork, and all the interested objects are identified andselected; secondly, the object’s position in the world coordi-nate system is estimated by using the object’s pixel coordi-nates through the coordinate dimension ascending inversemapping method proposed in this paper; and then, after aseries of data processing for the estimated position, theaccurate object is obtained. Finally, the general model ofcrops and pedestrians built in advance is placed and ren-dered on the estimated position, which will overlay and dis-play the three-dimensional objects that are wronglymapped on the ground. This method can reduce the linebending distortion as much as possible while solving theobject stretching distortion and make the display more nat-ural while providing accurate object position information.
4. Image Recognition and Analysis of CropDiseases and Pests Based on Deep Learning
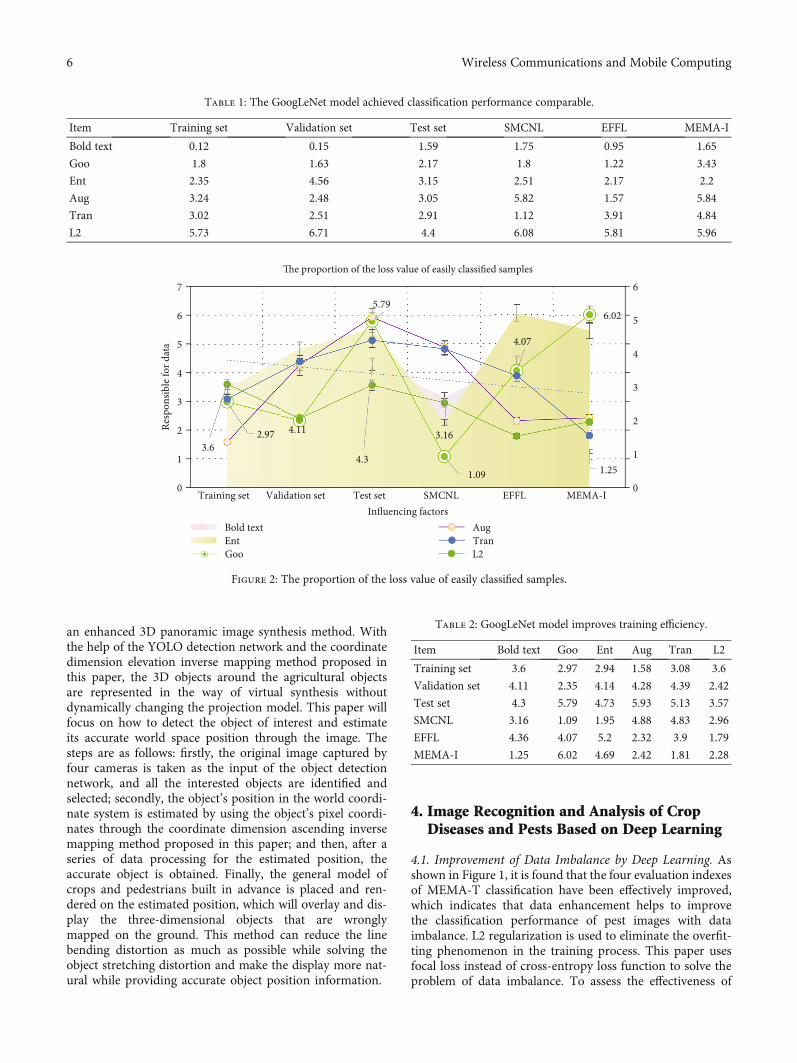
4.1. Improvement of Data Imbalance by Deep Learning. Asshown in Figure 1, it is found that the four evaluation indexesof MEMA-T classification have been effectively improved,which indicates that data enhancement helps to improvethe classification performance of pest images with dataimbalance. L2 regularization is used to eliminate the overfit-ting phenomenon in the training process. This paper usesfocal loss instead of cross-entropy loss function to solve theproblem of data imbalance. To assess the effectiveness of
Table 1: The GoogLeNet model achieved classification performance comparable.
Item Training set Validation set Test set SMCNL EFFL MEMA-I
Bold text 0.12 0.15 1.59 1.75 0.95 1.65
Goo 1.8 1.63 2.17 1.8 1.22 3.43
Ent 2.35 4.56 3.15 2.51 2.17 2.2
Aug 3.24 2.48 3.05 5.82 1.57 5.84
Tran 3.02 2.51 2.91 1.12 3.91 4.84
L2 5.73 6.71 4.4 6.08 5.81 5.96
3.64.11
4.3
3.16
1.25
2.97
5.79
1.09
4.07
6.02
0
1
2
3
4
5
6
0
1
2
3
4
5
6
7
Training set Validation set Test set SMCNL EFFL MEMA-I
Resp
onsib
le fo
r dat
a
Influencing factors
�e proportion of the loss value of easily classified samples
Bold textEntGoo
AugTranL2
Figure 2: The proportion of the loss value of easily classified samples.
Table 2: GoogLeNet model improves training efficiency.
Item Bold text Goo Ent Aug Tran L2
Training set 3.6 2.97 2.94 1.58 3.08 3.6
Validation set 4.11 2.35 4.14 4.28 4.39 2.42
Test set 4.3 5.79 4.73 5.93 5.13 3.57
SMCNL 3.16 1.09 1.95 4.88 4.83 2.96
EFFL 4.36 4.07 5.2 2.32 3.9 1.79
MEMA-I 1.25 6.02 4.69 2.42 1.81 2.28
6 Wireless Communications and Mobile Computing
the different methods in the model, we used the mean classi-fication accuracy of the four types of lesions, the training set,the validation set, and the test set, as metrics.
The simplified GoogLeNet model achieves the same clas-sification performance as the original model, as shown inTable 1. Among them, bold text, Goo, Ent, Aug, Tran, L2,and FOC represent the best performance, respectively. Thesimplified GoogLeNet model has cross-entropy loss function,data enhancement, transfer learning, L2 regularization, andfocal loss function. Both data enhancement and transferlearning can improve the classification performance of the
model, and the combination of the two methods can obtainhigher classification accuracy than using them alone. Theuse of L2 regularization can restrain overfitting to a certainextent and enhance the stability of model fitting function.
As shown in Figure 2, focal loss can further improve themulticlassification performance by reducing the proportionof loss values of easy to classify samples and forcing trainingfor difficult to classify samples. In the pathological data ofthis paper, MEMA-I and MEMA-T are two similar types oflesions, which are difficult to distinguish. Compared withthe original GoogLeNet model, the classification accuracy
2.97
2.35
5.79
1.09
4.07
6.02
0
1
2
3
4
5
6
7
0
1
2
3
4
5
6
7
8
Blur Noise Test set SMCNL EFFL MEMA-I
Dev
iatio
n
Erro
r eng
inee
ring
Measurement results
Gaussian blur and Gaussian noise at different scales
ArtificialDegenerateParameter
AugTranBCRM
Figure 3: Gaussian blur and Gaussian noise at different scales.
Table 3: Use image information entropy as standard.
Item Artificial Degenerate Parameter Aug Tran BCRM
Gaussian blur 3.6 2.97 2.94 1.58 3.08 3.6
Gaussian noise 4.11 2.35 4.14 4.28 4.39 2.42
Test set 4.3 5.79 4.73 5.93 5.13 3.57
SMCNL 3.16 1.09 1.95 4.88 4.83 2.96
EFFL 4.36 4.07 5.2 2.32 3.9 1.79
MEMA-I 1.25 6.02 4.69 2.42 1.81 2.28
Table 4: For multistage quality classification.
Item ResNet MnasNet SMCNL EFFL MEMA-I AlexNet GoogLeNet
MD 0.62 1.56 0.12 0.15 1.59 1.75 0.95
EFFL 1.03 1.04 1.8 1.63 2.17 1.8 1.22
MEMA-I 3.06 4.38 2.35 4.56 3.15 2.51 2.17
MEMA-T 5.18 3 3.24 2.48 3.05 5.82 1.57
VGG16 2.16 3.77 3.02 2.51 2.91 1.12 3.91
AlexNet 5.25 5.02 5.73 6.71 4.4 6.08 5.81
7Wireless Communications and Mobile Computing
5.72
1.23
4.04
6.86
3.94
3.79
1.45
4.25
6.02
3.53
4.98
6.75
0 10 20 30 40 50 60 70 80 90 100
Test set
SMCNL
EFFL
MEMA-I
MEMA-T
Political
Operating status (%)
Com
mun
icat
ion
mod
ule
Projection model used for basic 3D panoramic image
�ree-dimensionalDistortionGround
WallProjection modelDegenerate
Figure 4: Projection model used for basic 3D panoramic image.
Table 5: The parameter combination is set according to the results of previous work.
Item Test set SMCNL EFFL MEMA-I MEMA-T Political
Three-dimensional 3.61 2.09 3.44 1.5 3.36 3.92
Distortion 5.72 1.23 4.04 6.86 3.94 3.79
Ground 1.45 4.25 6.02 3.53 4.98 6.75
Wall 1.87 2.54 4.12 6.62 4.31 4.7
Projection model 1.68 2.89 3.85 5 1.62 5.55
Degenerate 2.7 1.83 6.5 5.12 5.01 3.05
2.514.11
2.444.3
1.32
5.383.17
2.863.83
3.91
4.15
1.652.99
5.795.01
3.3
1.73
1.72
2.77
3.484.9
3.24
5.08 2.77
0
2
4
6
8
10
12
14
16
18
SMCNL EFFL MEMA-I MEMA-T VGG16 AlexNet
Mod
el v
alue
s
Test model
Test data set of data samples
ResNetMnasNet
SMCNLEFFL
Figure 5: Test data set of data samples.
8 Wireless Communications and Mobile Computing
1.56
1.04
4.38
3
3.77
5.02
1.751.8
2.51
5.82
1.12
6.08
0
1
2
�e r
ange
of i
ndic
ator
s ple
ase
3
4
5
6
7
8
MD EFFL MEMA-I MEMA-T VGG16 AlexNet3D model
GoogleNet is better than the comparison model
ResNetSMCNL
MnasNetEFFL
Figure 6: GoogLeNet is better than the comparison model.
Table 6: Residual learning to improve the classification performance of the model.
Item ResNet MnasNet SMCNL EFFL MEMA-I MEMA-T
SMCNL 2.51 3.17 2.99 2.77 2.78 3.12
EFFL 4.11 2.86 5.79 3.48 5.47 2.53
MEMA-I 2.44 3.83 5.01 4.9 5.73 5.32
MEMA-T 4.3 3.91 3.3 3.24 4.5 2.34
VGG16 1.32 4.15 1.73 5.08 1.47 1.88
AlexNet 5.38 1.65 1.72 2.77 2.22 6.43
0.32
2.032.61
3.85
1.05
4.93
1.18
2.514.11
2.44
4.3
1.32
0
1
2
3
4
5
6
7
SMCNL EFFL MEMA-I MEMA-T VGG16 AlexNet
Ope
ratin
g pl
atfo
rm in
dica
toer
s
Normal operating performance
Classic deep learning methods for target detection
ResNet
Deep learningMnasNet
Figure 7: Classic deep learning methods for target detection.
9Wireless Communications and Mobile Computing
of simplified GoogLeNet for MEMA-I and MEMA-T isimproved by about 4%.
As shown in Table 2, the simplified GoogLeNet modelis used to improve the training efficiency, and the dataenhancement, migration learning, and L2 regularizationare effectively used to further improve the network perfor-mance. Focal loss is used to solve the problem of imagedata imbalances in mesomorphic diseases and pests. Theexperimental results show that the simplified GoogLeNetmodel is superior to the commonly used deep learningmodel in MD classification performance. This study pro-vides a new idea for deep learning technology to classifynoninflammatory aortic media lesions based on pestimages. In the future work, we will get more and morekinds of pest images to further improve the generalizationability of the model.
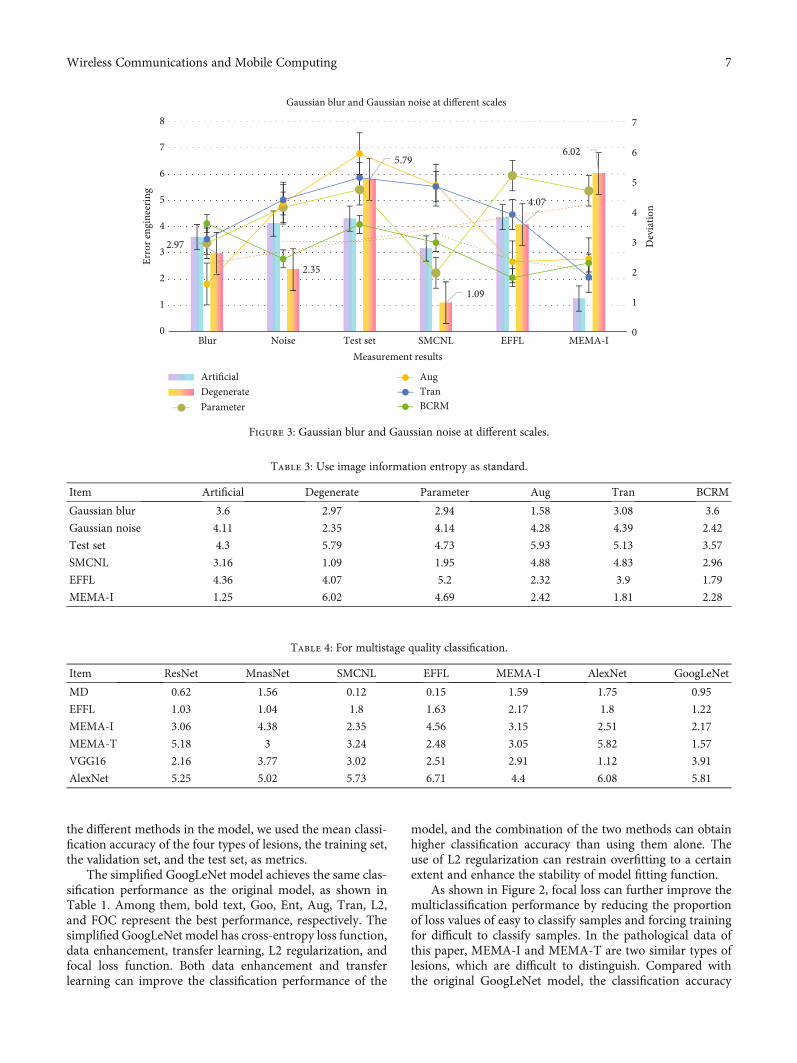
The Gaussian blur and Gaussian noise of different scalesadded to the original data are artificially degraded, which are,respectively, marked as 2-10 levels, with a total of 5000pieces. The artificial degradation parameters are shown inFigure 3. The 5000 images are then cut into 256 pixel × 256pixel images, and 80% of the training set and 20% of the dataare selected as the test set. After one image of quality level 1 isdegraded by using the above degradation parameters, ninequality level images are obtained. It is difficult to distinguishthe quality of images with different quality levels, especiallythe images with adjacent levels, by subjective observationwith human eyes. Using the algorithm model proposed inthis paper, the recognition accuracy is 95%, which is muchhigher than 84% of the basic DCNN model.
Because the imaging parameters of the above images cannot be obtained, the NIIRS quality equation can not be usedfor classification. The image information entropy is used asthe standard for classification and evaluation. It is also diffi-cult to distinguish the quality level of 30 images selected fromthe test set with the quality level labels of 1, 5, and 10 throughthe value of information entropy and curve, as shown inTable 3.
In the DCNN architecture of quality classification, thereare three kinds of network models. The first one is called nor-mal type (referred to as n-type). There are three BCRM layersin the middle of the network; the second one is called simpletype (referred to as S-type). Compared with n-type, there isonly one BCRM layer in the middle of the network. The thirdtype is called complex type (C-type for short). Comparedwith n-type, there are five BCRM layers in the middle ofthe network. For the multistage quality classification, the 2-fork structure is adopted in all layers, and the n-type networkstructure is adopted in all layers. The input image size of cropdiseases and insect pests is 256 × 256, the number of itera-tions is set to 200, and the network parameters are shownin Table 4.
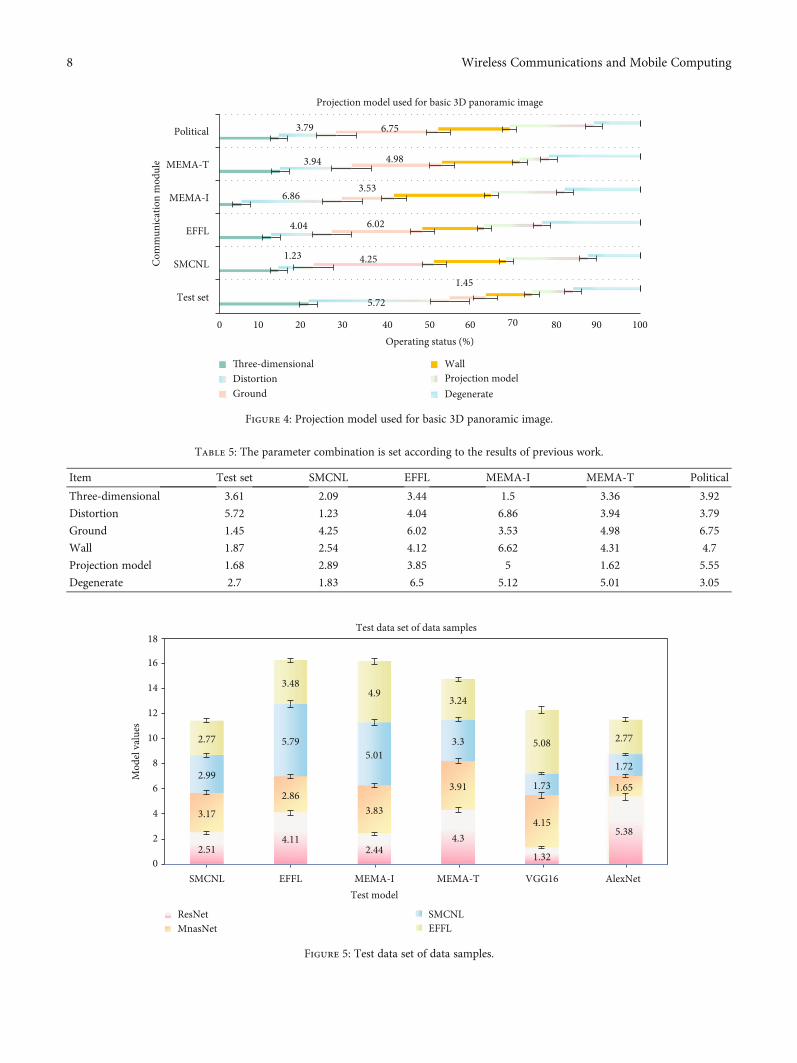
4.2. Image Recognition Effect Analysis of Training DCNN-G.As shown in Figure 4, because the projection model usedin the basic three-dimensional panoramic image is estab-lished in advance according to experience, it is impossibleto adapt to all scenes, so when the real three-dimensionalenvironment of the crop does not match the projection
model created by the simulation, the display will bedistorted.
As shown in Table 5, the best training effect can beobtained by manually adjusting the parameters of L2 regular-ization (λ = 0:001). Two key parameters involved in focal lossare α = 0:25 and γ = 2. The parameter combination is setaccording to the results of previous work to ensure the bestclassification performance of the model.
As shown in Figure 5, the classification results ofSMCNL, EFFL, MEMA-I, and MEMA-T in the test data setcontain 640 data samples, in which the bold text representsthe best result. Two samples of SMCNL and EFFL were mis-classified into other types. The model has good recognitionand resolution ability for SMCNL and EFFL. Compared withSMCNL and EFFL, MEMA-I and MEMA-T have more mis-classification samples, especially about 16% of them are iden-tified as MEMA-I. The reason is that the two types of lesionsshow similar pathological features. In addition, due to theserious imbalance of data, MEMA-T data samples are less,resulting in poor classification results.
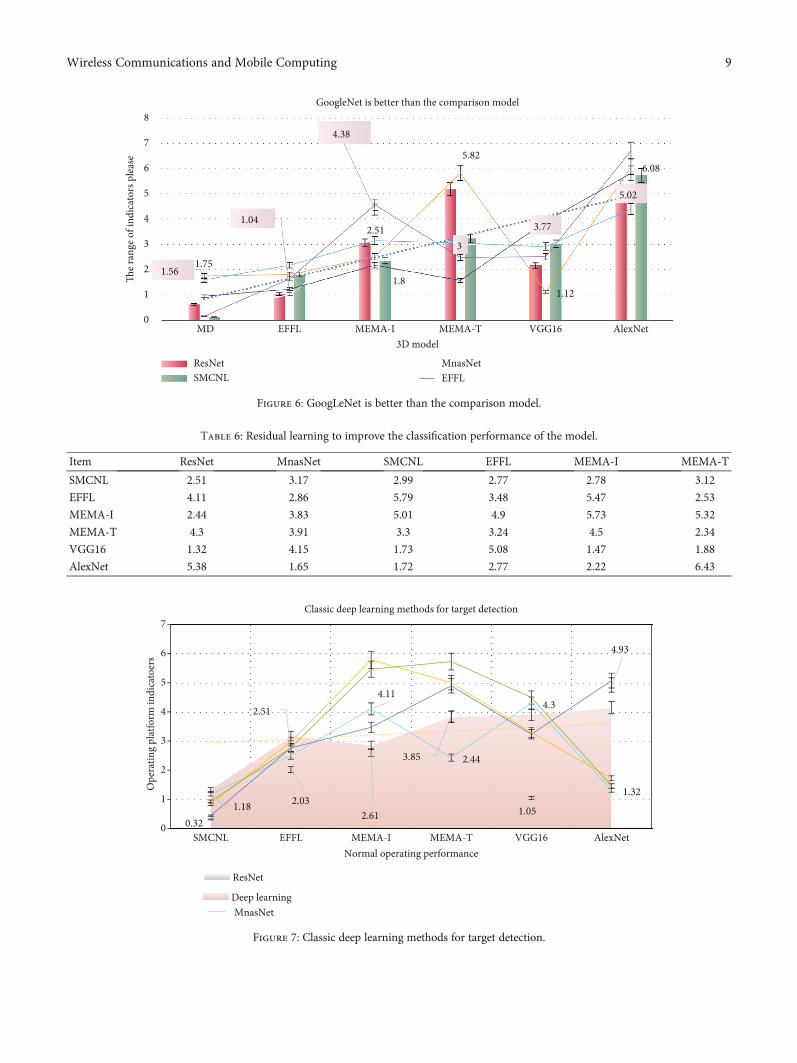
As shown in Figure 6, all models adopt the same dataenhancement, migration learning, L2 regularization, andfocal loss. Through observation, it is found that theimproved GoogLeNet is better than the comparison modelin MD classification performance. EFFL got the bestresults among all the classification indexes. MEMA-Iachieves the best results in accuracy, accuracy, and Fvalue. SMCNL has the highest accuracy and precision.Due to the imbalance of data and the small number ofMEMA-T samples in the test data set, the MEMA-T clas-sification results are inadequate.
As shown in Table 6, the ResNet model also performswell. It has an 18 layer network structure, which is close tothe network depth of the GoogLeNet model used in thispaper. In addition, it introduces residual learning to improvethe classification performance of the model. However, due tothe large difference of lesion size among different lesion typesof MD, GoogLeNet introduces convolution kernels of differ-ent sizes, which can better extract the context information ofMD, so its performance is better than ResNet. Comparedwith other networks, the performance of AlexNet is poor.The main reason is that AlexNet is a shallow network withan eight-layer network structure, which reduces the accuracyof MD classification tasks due to its limited ability to capture
Table 7: Method is limited to certain types of resolution data.
Item ResNet MnasNetDeep
learningRemotesensing
CropPests anddiseases
SMCNL 0.32 1.18 1.35 0.84 0.45 0.94
EFFL 2.03 2.51 3.17 2.99 2.77 2.78
MEMA-I
2.61 4.11 2.86 5.79 3.48 5.47
MEMA-T
3.85 2.44 3.83 5.01 4.9 5.73
VGG16 1.05 4.3 3.91 3.3 3.24 4.5
AlexNet 4.93 1.32 4.15 1.73 5.08 1.47
10 Wireless Communications and Mobile Computing
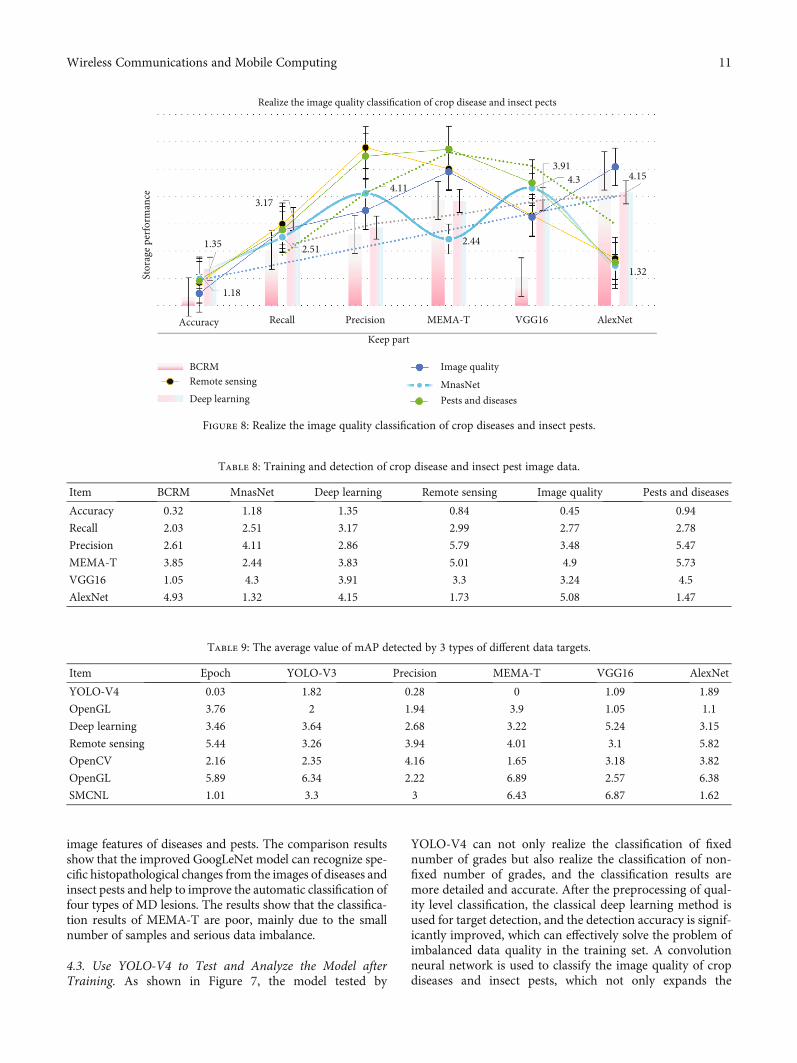
image features of diseases and pests. The comparison resultsshow that the improved GoogLeNet model can recognize spe-cific histopathological changes from the images of diseases andinsect pests and help to improve the automatic classification offour types of MD lesions. The results show that the classifica-tion results of MEMA-T are poor, mainly due to the smallnumber of samples and serious data imbalance.
4.3. Use YOLO-V4 to Test and Analyze the Model afterTraining. As shown in Figure 7, the model tested by
YOLO-V4 can not only realize the classification of fixednumber of grades but also realize the classification of non-fixed number of grades, and the classification results aremore detailed and accurate. After the preprocessing of qual-ity level classification, the classical deep learning method isused for target detection, and the detection accuracy is signif-icantly improved, which can effectively solve the problem ofimbalanced data quality in the training set. A convolutionneural network is used to classify the image quality of cropdiseases and insect pests, which not only expands the
1.35
3.17
3.914.15
1.18
2.51
4.11
2.44
4.3
1.32
Accuracy Recall Precision MEMA-T VGG16 AlexNet
Stor
age p
erfo
rman
ce
Keep part
Realize the image quality classification of crop disease and insect pects
BCRM
Deep learningRemote sensing MnasNet
Image quality
Pests and diseases
Figure 8: Realize the image quality classification of crop diseases and insect pests.
Table 8: Training and detection of crop disease and insect pest image data.
Item BCRM MnasNet Deep learning Remote sensing Image quality Pests and diseases
Accuracy 0.32 1.18 1.35 0.84 0.45 0.94
Recall 2.03 2.51 3.17 2.99 2.77 2.78
Precision 2.61 4.11 2.86 5.79 3.48 5.47
MEMA-T 3.85 2.44 3.83 5.01 4.9 5.73
VGG16 1.05 4.3 3.91 3.3 3.24 4.5
AlexNet 4.93 1.32 4.15 1.73 5.08 1.47
Table 9: The average value of mAP detected by 3 types of different data targets.
Item Epoch YOLO-V3 Precision MEMA-T VGG16 AlexNet
YOLO-V4 0.03 1.82 0.28 0 1.09 1.89
OpenGL 3.76 2 1.94 3.9 1.05 1.1
Deep learning 3.46 3.64 2.68 3.22 5.24 3.15
Remote sensing 5.44 3.26 3.94 4.01 3.1 5.82
OpenCV 2.16 2.35 4.16 1.65 3.18 3.82
OpenGL 5.89 6.34 2.22 6.89 2.57 6.38
SMCNL 1.01 3.3 3 6.43 6.87 1.62
11Wireless Communications and Mobile Computing
application field of deep learning but also provides a newmethod for image quality evaluation of crop diseases andinsect pests.
As shown in Table 7, many image processing methods ofcrop diseases and insect pests are based on the same imagequality level, such as crop disease and insect pest image reg-istration, landmark detection, and target recognition; gener-ally, different data sources, different spatial resolution, anddifferent spectral resolution data are distinguished, and dif-ferent technical means are used for processing, and evensome methods are used. The method is limited to some kindof resolution data. Another example is image restoration;many methods are known that the image is degraded under
the premise of restoration processing. This makes peoplehave to design different methods or adjust the correspondingparameters for different quality levels of images in order toobtain the corresponding processing effect, which is obvi-ously inconsistent with the technical requirements of thefully automated intelligent era. The quality classification ofcrop disease and insect pest images can not only provideimportant prior information for understanding crop diseaseand insect pest images but also provide scientific basis fortesting the imaging ability of sensors and objectively evaluat-ing the image quality of crop diseases and insect pests.
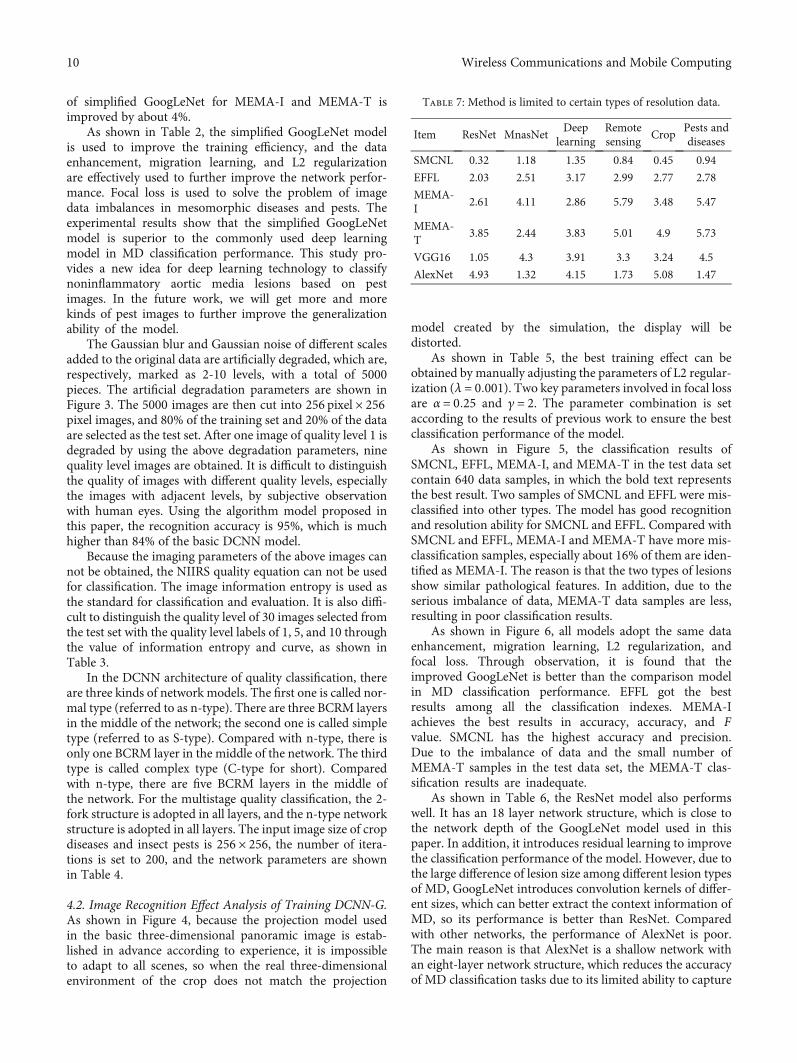
As shown in Figure 8, both one segment and multiseg-ment can well achieve 10 levels of image quality classification
Epoch YOLO-V3 Precision MEMA-T VGG16 AlexNet
Link
stat
us
Heterogeneous performance
�e display effect of the basic 3D panoramic imaging system
YOLO-V4OpenCV
OpenGLRemote sensingOpenGL
Deep learning
Figure 9: The display effect of the basic 3D panoramic imaging system.
0 1 2 3 4 5 6 7 8
YOLO-V4
OpenGL
Deep learning
Remote sensing
OpenCV
OpenGL
SMCNL
Local performance
Het
erog
eneo
us lo
cal
Make three-dimensional objects display correctly
PrecisionYOLO-V3Epoch
AlexNetVGG16MEMA-T
Figure 10: Make three-dimensional objects display correctly.
12 Wireless Communications and Mobile Computing
of crop diseases and insect pests. For the three models of one-stage quality classification, accuracy, recall, and precision ofn-type are significantly improved compared with S-type,and the evaluation indexes of n-type are basically unchangedcompared with C-type, which indicates that BCRM has animpact on the results, and it also means that n-type can fullymeet the application requirements for 10 quality classifica-tion. For the multistage quality level classification, it alsoachieves the effect of one-stage classification and does notneed to estimate the number of BCRM. Each stage adoptsthe n-type classification structure of 10 quality levels, whichcan fully ensure the accuracy of two quality levels in eachstage and further reduce the error accumulation. However,the training time and detection time are relatively long,which is the reason, that closely related to the number ofparameters and the complexity of intermediate computation.
The original 610 image data of agricultural crop diseasesand pests are directly trained and detected, as shown inTable 8. Quality classification refers to training and testingaccording to different quality classes. That is, the trainingset and the test set belong to the same quality class. The num-ber ratio of the training set data and test set data is 4 : 1, andthe test set data is not in the training set. Because the similarquality level has little influence on the target detection, theimages of crop diseases and insect pests of levels 1-4, levels5-8, and levels 9-10 are classified into the same quality classin the experiment, and the final map value is the averagevalue of map of these three types of different data targetdetection, and the results are shown in Table 9.
As shown in Figure 9, the display effect in the same per-spective and scene is compared when the method is used andnot used. It shows the display effect of the basic three-dimensional panoramic image system. When the pests anddiseases are in the ground area of the projection model, thesystem will cause projection distortion to these objects, sothat the workers can not accurately obtain the position infor-mation of the objects around the objects, or even can not see
the objects clearly. Using the enhanced three-dimensionalpanoramic image synthesis method in this paper, the imagesof diseases and pests are clearly presented in the scenethrough the three-dimensional model, which can greatlyfacilitate workers to observe.
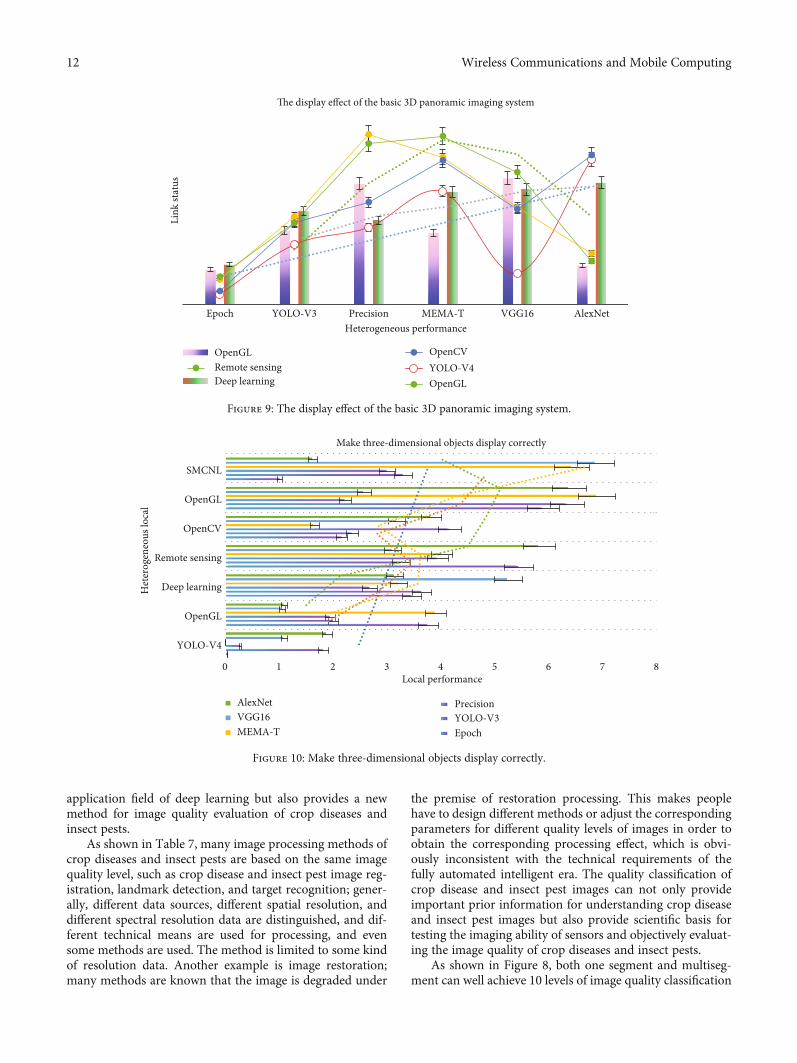
As shown in Figure 10, compared with the existing solu-tions, this method does not need to reduce the projectionmodel to make the three-dimensional object display cor-rectly, so it can maximize the ground part of the model, soit can better weaken the line bending distortion, that is, tomaintain the flatness of the road as far as possible.
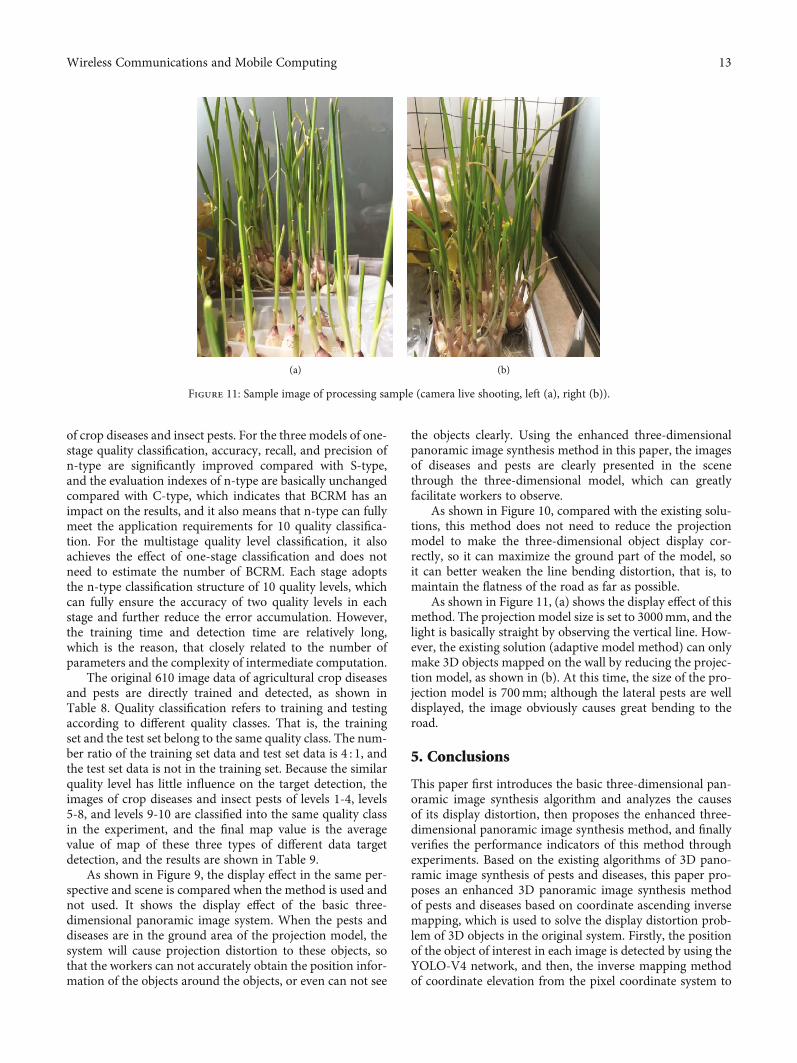
As shown in Figure 11, (a) shows the display effect of thismethod. The projection model size is set to 3000mm, and thelight is basically straight by observing the vertical line. How-ever, the existing solution (adaptive model method) can onlymake 3D objects mapped on the wall by reducing the projec-tion model, as shown in (b). At this time, the size of the pro-jection model is 700mm; although the lateral pests are welldisplayed, the image obviously causes great bending to theroad.
5. Conclusions
This paper first introduces the basic three-dimensional pan-oramic image synthesis algorithm and analyzes the causesof its display distortion, then proposes the enhanced three-dimensional panoramic image synthesis method, and finallyverifies the performance indicators of this method throughexperiments. Based on the existing algorithms of 3D pano-ramic image synthesis of pests and diseases, this paper pro-poses an enhanced 3D panoramic image synthesis methodof pests and diseases based on coordinate ascending inversemapping, which is used to solve the display distortion prob-lem of 3D objects in the original system. Firstly, the positionof the object of interest in each image is detected by using theYOLO-V4 network, and then, the inverse mapping methodof coordinate elevation from the pixel coordinate system to
(a) (b)
Figure 11: Sample image of processing sample (camera live shooting, left (a), right (b)).
13Wireless Communications and Mobile Computing
the world coordinate system is derived by using the insectcamera calibration parameters combined with the supple-mentary conditions, so as to preliminarily estimate the posi-tion of the object of interest in the world coordinate system.Then, by merging and filtering the estimated positions, youget the final estimated position, place the preset model inthe corresponding position, and render it to complete thehighlighting. Compared with the existing solutions, thismethod has many advantages, such as low cost, less compu-tation, and good display effect. At the same time, the genera-tion speed meets the real-time requirements, and the positionestimation also meets the accuracy requirements. It can fur-ther improve the display quality and use value of panoramicimages of diseases and pests. In the future, the experimentcan be extended to real pests to test the display performanceof the system on real roads.
Due to the need to display the surrounding conditionsof diseases and pests in real time in the process of fieldwork, it is required that the screen should not appearthe phenomenon of jam, so it puts forward high require-ments for the real-time performance of the image genera-tion method in this paper, so the real-time performance ofthis method will be verified first. Then, the accuracy ofobject detection and position estimation in this methodis quantitatively tested. The scene generation is dividedinto two parts: using OpenCV to generate the ground partand using OpenGL to render the scene part. WhenOpenCV is used to generate the ground point by point,the LUT look-up table method is used in the former.The calculation of the mapping relationship is completedand saved when the program is initialized, and onlylook-up table is needed in real-time rendering, thus reduc-ing the processing time of a single frame.
Compared with the existing solutions, this method hasmany advantages, which can intuitively and prominently dis-play the position of other crops and pedestrians around theobject. When the object of interest is displayed, it will notcause projection distortion to other scenes, and the overallview is comfortable. In addition, this model does not needother depth sensors. Because a fixed projection model canbe used, LUT can be used to ensure real-time performance.The algorithm in this paper can keep the straightness of theground lines to the maximum in the display. In conclusion,this method has a high application value.
Data Availability
No data were used to support this study.
Conflicts of Interest
The authors declare that they have no conflicts of interest.
Acknowledgments
This work was supported by the Heilongjiang Province Nat-ural Science Foundation of China: LH2020F039.
References
[1] T. Han, “Design and application of multicolor image identifi-cation in soil pollution component detection,” Arabian Jour-nal of Geosciences, vol. 13, no. 18, 2020.
[2] B. Chen, H. Li, W. Luo, and J. Huang, “Image processingoperations identification via convolutional neural network,”SCIENCE CHINA Information Sciences, vol. 63, no. 3,2020.
[3] T.-K. Chui, J. Tan, Y. Li, and H. A. Raynor, “Validating anautomated image identification process of a passive image-assisted dietary assessment method: proof of concept,” PublicHealth Nutrition, vol. 23, no. 15, pp. 2700–2710, 2020.
[4] Z. Zhao and N. Liu, “the recognition and localization of insu-lators adopting SURF and IFS based on correlation coeffi-cient,” Optik, vol. 125, no. 20, pp. 6049–6052, 2020.
[5] Z. Zhao, N. Liu, and L. Wang, “Localization of multiple insu-lators by orientation angle detection and binary shape priorknowledge,” IEEE Transactions on Dielectrics and ElectricalInsulation, vol. 22, no. 6, pp. 3421–3428, 2019.
[6] Q. Wu and J. An, “an active contour model based on texturedistribution for extracting inhomo geneous insulators fromaerial images,” IEEE Transactions on Geoscience & RemoteSensing, vol. 52, no. 6, pp. 3613–3626, 2019.
[7] Y. Zhai, R. Chen, Q. Yang, X. Li, and Z. Zhao, “Insulatorfault detection based on spatial morphological features ofaerial images,” IEEE Access, vol. 122, no. 6, pp. 35316–35326, 2019.
[8] X. Miao, X. Liu, J. Chen, S. Zhuang, J. Fan, and H. Jiang, “Insu-lator detection in aerial images for transmission line inspectionusing single shot multibox detector,” IEEE Access, vol. 125,no. 7, pp. 9945–9956, 2019.
[9] X. Tao, D. Zhang, Z. Wang, X. Liu, H. Zhang, and D. Xu,“Detection of power line insulator defects using aerial imagesanalyzed with convolutional neural networks,” IEEE Transac-tions on Systems Man & Cybernetics Systems, vol. 50, no. 4,pp. 1486–1498, 2018.
[10] Y.W. Tian, I. Cheng, and X. Q.Wang, Feature vectors determi-nation for pest detection on apples based on hyperspectral imag-ing, Transactions of the Chinese Society of Agricultural, 2014.
[11] Engineering (Transactions of the CSAE), vol. 30, no. 12,pp. 132–139, 2019.
[12] R. P. Haff, S. Saranwong, W. Thanapase, A. Janhiran,S. Kasemsumran, and S. Kawano, “Automatic image analysisand spot classification for detection of fruit fly infestation inhyperspectral images of mangoes,” Postharvest Biology andTechnology, vol. 86, no. 1, pp. 23–28, 2013.
[13] D. E. Purcell, M. G. O'Shea, R. A. Johnson, and S. Kokot,“Near-infrared spectroscopy for the prediction of disease rat-ings for leaf gall in sugarcane clones,” Applied Spectroscopy,vol. 63, no. 4, pp. 450–457, 2009.
[14] R. Teixeira, J. I. R. Fernandéz, J. Pereira, and L. B. Monteiro,“Identification of grapholita molesta (Busk) (Lepidoptera:Tortricidae) biotypes using infrared spectroscopy,” Neotropi-cal Entomology, vol. 44, no. 2, pp. 129–133, 2019.
[15] L. Z. Cheng, X. C. Zhu, and L. L. Gao, “Hyperspectral estima-tion of phosphorus content for apple leaves based on the ran-dom forest model,” Journal of Fruit Science, vol. 33, no. 10,pp. 1219–1229, 2019.
[16] S. J. Liu, Y. W. Tian, and D. Feng, “Nondestructive detectionmethod of hyperspectral imaging for apple disease,” Journal
14 Wireless Communications and Mobile Computing
of Shenyang Agricultural University, vol. 47, no. 5, pp. 634–640, 2016.
[17] R. Van Beers, B. Aernouts, L. L. Gutiérrez et al., “Optimalillumination-detection distance and detector size for predict-ing Braeburn apple maturity from Vis/NIR laser reflectancemeasurements,” Food and Bioprocess Technology, vol. 8,no. 10, pp. 2123–2136, 2019.
[18] X. L. Wang, “Extraction and modeling of physical and chemi-cal properties of fruit trees flowers and leaves based on spectralanalysis technique,” Beijing Forestry University,2017WU Fei,LU Xinyan, SONG Jun. Learning of multimodal representationswith random walks on the click graph, IEEE Trans. Image Pro-cess, vol. 25, no. 2, pp. 630–642, 2019.
[19] L. U. Xiaoqiang, W. A. N. G. Binqiang, and Z. H. E. N. G.Xiangtao, “Exploring models and data for remote sensingimage caption generation,” IEEE Transactions on Geoscienceand Remote Sensing, vol. 56, no. 4, pp. 2183–2195, 2018.
[20] N. MERKLE, S. AUER, R. MULLER, and P. REINARTZ,“Exploring the potential of conditional adversarial networksfor optical and SAR image matching,” IEEE Journal of SelectedTopics in Applied Earth Observations and Remote Sensing,vol. 11, no. 6, pp. 1811–1820, 2018.
[21] J. T. Barron and J. Malik, “Shape, illumination, and reflectancefrom shading,” IEEE Transactions on Pattern Analysis andMachine Intelligence, vol. 37, no. 8, pp. 1670–1687, 2019.
[22] Y. LeCun, Y. Bengio, and G. Hinton, “Deep learning,” Nature,vol. 521, no. 7553, pp. 436–444, 2018.
[23] X. Li, Y. Dong, P. Peers, and X. Tong, “Modeling surfaceappearance from a single photograph using self-augmentedconvolutional neural networks,” ACM Transactions onGraphics (TOG), vol. 36, no. 4, pp. 1–11, 2017.
[24] D. Guarnera, G. C. Guarnera, A. Ghosh, C. Denk, andM. Glencross, “BRDF representation and acquisition[C]//computer graphics,” Forum, vol. 35, no. 2, pp. 625–650,2019.
15Wireless Communications and Mobile Computing