Embed Size (px)
Citation preview
Image Processing using Graphs
Filip Malmberg
Background
In recent years, graphs have emerged as a unified representation forimage analysis and processing. In this course, we will give an overviewof recent developments in this field.
How and why do we represent images as graphs?
Graph-based methods for:
SegmentationFilteringClassification and clustering

What will we learn in this course?
“Having a drivers license does not mean that you know how to drive a car.It means that you can drive well enough to start practicing on your own.”
–Bosse, My driving teacher.
My ambition is that after taking this course, you should be able to studygraph-based image processing on your own!

About the course
http://www.cb.uu.se/~filip/ImageProcessingUsingGraphs/
11 Lectures. (non-mandatory)
Examination in the form of an individual project.

Teachers
Filip Malmberg, UU
Alexandre Falcao, Institute of Computing, State University ofCampinas, Brazil
Erik Wernersson, UU

Project work
Each participant should also select a topic for her individual project.The project can be applied or theoretical.
When you have decided on a topic, discuss this with Filip to ensurethat the scope is appropriate.
Your work should be presented as a written report (∼ 4 pages).
Submit your report to me (Filip) no later than June 1.
The final reports will be published on the course webpage.

What is an image?
“We will sometimes regard a picture as being a real-valued, non-negativefunction of two real variables; the value of this function at a point will becalled the gray-level of the picture at the point.”
Rosenfeld, Picture Processing by Computer, ACM Computing Surveys,1969.

What is a digital image?
Storing the (continuous) image in a computer requires digitization, e.g.
Sampling (recording image values at a finite set of sampling points).
Quantization (discretizing the continuous function values).
Typically, sampling points are located on a Cartesian grid.

Generalized images
This basic model can be generalized in several ways:
Generalized image modalities (e.g., multispectral images)
Generalized image domains (e.g. video, volume images)
Generalized sampling point distributions (e.g. non-Cartesian grids)
The methods we develop in image analysis should (ideally) be able tohandle this.
Why graph-based?
Discrete and mathematically simple representation that lends itselfwell to the development of efficient and provably correct methods.
A minimalistic image representation – flexibility in representingdifferent types of images.
A lot of work has been done on graph theory in other applications,We can re-use existing algorithms and theorems developed for otherfields in image analysis!

Euler and the seven bridges of KonigsbergWikipedia: “The city of Konigsberg in Prussia (now Kaliningrad, Russia)was set on both sides of the Pregel River, and included two large islandswhich were connected to each other and the mainland by seven bridges.The problem was to find a walk through the city that would cross eachbridge once and only once.”
Figure 1: Konigsberg in 1652.

Euler and the seven bridges of KonigsbergIn 1735, Euler published the paper “Solutio problematis ad geometriamsitus pertinentis“ (“The solution of a problem relating to the geometry ofposition”), showing that the problem had no solution. This is regarded asthe first paper in graph theory.
Figure 2: The seven bridges of Konigsberg, as drawn by Leonhard Euler.

Graphs, basic definition
A graph is a pair G = (V ,E ), where
V is a set.E consists of pairs of elements in V .
The elements of V are called the vertices of G .
The elements of E are called the edges of G .
Graphs basic definition
An edge spanning two vertices v and w is denoted ev ,w .
If ev ,w ∈ E , we say that v and w are adjacent.
The set of vertices adjacent to v is denoted N (v).

Example
A
B
C D
Figure 3: A drawing of an undirected graph with four vertices {A,B,C ,D} andfour edges {eA,B , eA,C , eB,C , eC ,D}.

Example
A
B
C D
Figure 4: The set N (A) = {B,C} of vertices adjacent to A.
Images as graphs
Graph based image processing methods typically operate on pixeladjacency graphs, i.e., graphs whose vertex set is the set of imageelements, and whose edge set is given by an adjacency relation on theimage elements.
Commonly, the edge set is defined as all vertices v ,w such that
d(v ,w) ≤ ρ . (1)
This is called the Euclidean adjacency relation.
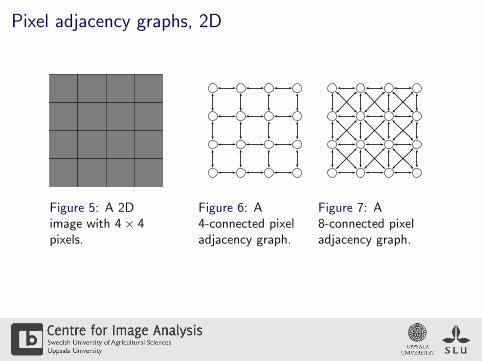
Pixel adjacency graphs, 2D
Figure 5: A 2Dimage with 4× 4pixels.
Figure 6: A4-connected pixeladjacency graph.
Figure 7: A8-connected pixeladjacency graph.

Pixel adjacency graphs, 3D
Figure 8: A volumeimage with3× 3× 3 voxels.
Figure 9: A6-connected voxeladjacency graph.
Figure 10: A26-connected voxeladjacency graph.

Foveal sampling“Space-variant sampling of visual input is ubiquitous in the highervertebrate brain, because a large input space may be processed with highpeak precision without requiring an unacceptably large brain mass.” [1]
Figure 11: Some ducks. (Image from Grady 2004)

Foveal sampling
Figure 12: Left: Retinal topography of a Kangaroo. Right: Re-sampled image.(Images from Grady 2004)

Region adjacency graphs
Figure 13: An image divided into superpixels

Multi-scale image representation
Resolution pyramids can be used to perform image analysis on multiplescales. Rather than treating the layers of this pyramid independently, wecan represent the entire pyramid as a graph.
Figure 14: A pyramid graph (Grady 2004).

Directed and undirected graphs
The pairs of vertices in E may be ordered or unordered.
In the former case, we say that G is directed.In the latter case, we say that G is undirected.
In this course, we will mainly consider undirected graphs.

Paths
A path is an ordered sequence of vertices where each vertex isadjacent to the previous one.
A path is simple if it has no repeated vertices.
A cycle is a path where the start vertex is the same as the end vertex.
A cycle is simple if it has no repeated vertices other than theendpoints.
Commonly, simplicity of paths and cycles is implied, i.e., the word“simple” is ommited.

Example, Path
A B C
D E F
G H I
Figure 15: A path π = 〈A,D,E ,H, I ,F ,E 〉.
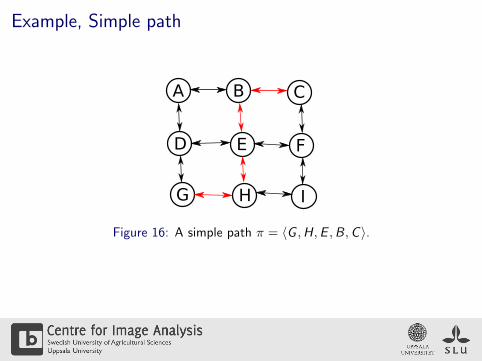
Example, Simple path
A B C
D E F
G H I
Figure 16: A simple path π = 〈G ,H,E ,B,C 〉.

Example, Cycle
A B C
D E F
G H I
Figure 17: A cycle π = 〈A,B,E ,F ,E ,D,A〉.
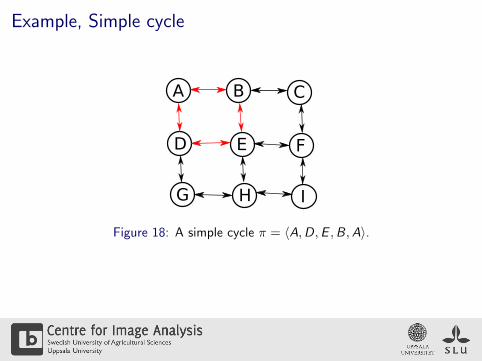
Example, Simple cycle
A B C
D E F
G H I
Figure 18: A simple cycle π = 〈A,D,E ,B,A〉.

Paths and connectedness
Two vertices v and w are linked if there exists a path that starts at vand ends at w . We use the notation v ∼ w
G. We can also say that w
is reachable from v .
If all vertices in a graph are linked, then the graph is connected.

Subgraphs and connected components
If G and H are graphs such that V (H) ⊆ V (G ) and E (H) ⊆ E (G ),then H is a subgraph of G .
A subgraph H of G is said to be induced if, for any pair of verticesv ,w ∈ H it holds that ev ,w ∈ E (H) iff ev ,W ∈ E (G ).
If H is a (induced) connected subgraph of G and v 6∼ wG
for all
vertices v ∈ H and w /∈ H, then H is a connected component of G .

Example, connected components
Figure 19: A graph with three connected components.

Graph segmentation
To segment an image represented as a graph, we want to partitionthe graph into a number of separate connected components.
The partitioning can be described either as a vertex labeling or as agraph cut.
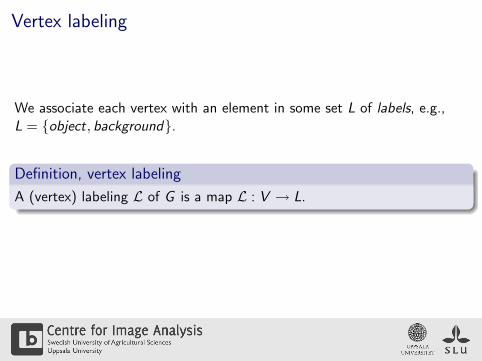
Vertex labeling
We associate each vertex with an element in some set L of labels, e.g.,L = {object, background}.
Definition, vertex labeling
A (vertex) labeling L of G is a map L : V → L.
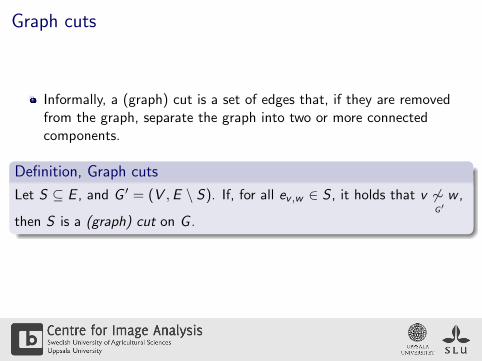
Graph cuts
Informally, a (graph) cut is a set of edges that, if they are removedfrom the graph, separate the graph into two or more connectedcomponents.
Definition, Graph cuts
Let S ⊆ E , and G ′ = (V ,E \ S). If, for all ev ,w ∈ S , it holds that v 6∼ wG ′
,
then S is a (graph) cut on G .

Example, cuts
Figure 20: A set of edge (red) that do not form a cut.

Example, cuts
Figure 21: A set of edge (red) that do not form a cut.

Example, cuts
Figure 22: A set of edge (red) that form a cut.

A quick exercise
Let G = (V ,E ). Is E a cut on G?
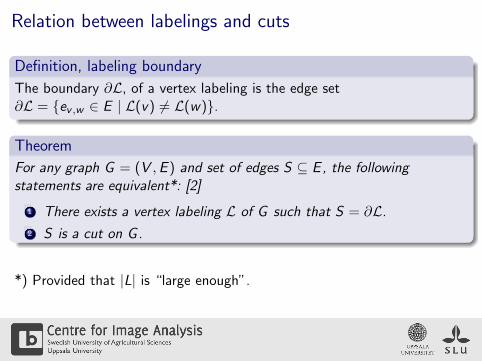
Relation between labelings and cuts
Definition, labeling boundary
The boundary ∂L, of a vertex labeling is the edge set∂L = {ev ,w ∈ E | L(v) 6= L(w)}.
Theorem
For any graph G = (V ,E ) and set of edges S ⊆ E, the followingstatements are equivalent*: [2]
1 There exists a vertex labeling L of G such that S = ∂L.
2 S is a cut on G.
*) Provided that |L| is “large enough”.
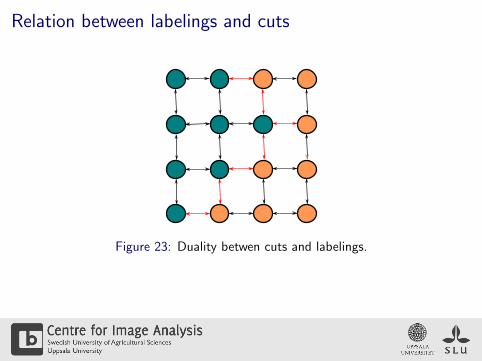
Relation between labelings and cuts
Figure 23: Duality betwen cuts and labelings.

Summary
Basic graph theory
Directed and undirected graphsPaths and connectednessSubgraphs and connected components
Images as graphs
Pixel adjacency graphs in 2D and 3DAlternative graph constructions
Graph partitioning
Vertex labeling and graph cuts

Next lecture
Interactive image segmentation
Intro to combinatorial optimization

ReferencesL. Grady.
Space-Variant Machine Vision — A Graph Theoretic Approach.
PhD thesis, Boston University, 2004.
F. Malmberg, J. Lindblad, N. Sladoje, and I. Nystrom.
A graph-based framework for sub-pixel image segmentation.
Theoretical Computer Science, 2010.
doi: 10.1016/j.tcs.2010.11.030.