Embed Size (px)
Citation preview
xy
z
Image Processing for Data Acquisition andMachine Learning of Helicopter Flight Dynamics
Dan Tappan and Matt HemplemanDepartment of Computer Science, Eastern Washington University, Cheney, WA, USA
Abstract - Learning to fly a full-sized helicopter is acomplex iterative process of mapping interdependent causesto effects via inputs to outputs in real time in a wildlydynamic, messy, and unforgiving environment. This workpresents a prototype system for noninvasively acquiringotherwise inaccessible data from the controls, instruments,and flight dynamics of a Robinson R22 helicopter with anarray of cameras and sensors and then processing theseimages with OpenCV-based solutions into correspondingnumerical form for later use in a machine-learning project.It describes a hardware and software architecture for safelyand successfully calibrating the system, running a breadthand depth of representative experiments, and qualitativelyand quantitatively presenting and validating the results.
Keywords: feature extraction, data acquisition, machinelearning, aviation
1 Introduction
Autonomous aircraft, especially consumer drones, havebecome an $11 billion yearly industry [9]. Machines canlearn to fly well for many mainstream purposes now, butmost approaches are disconnected from the way humanpilots learn to fly [6]. The computational models providelittle insight into the learning processes of either group. Abetter understanding would advance the field of artificialintelligence and intelligent systems. It could also extend thiscapability to other environments where machine learningmight be advantageous.
This paper addresses the first two objectives of a largerproject: (1) to build an acquisition system for recordingflight data from a full-sized helicopter; (2) to collect datafrom basic flight maneuvers as representative teachingexamples of how to perform them; (3) to investigate dataprocessing and fusion techniques to merge data fromnumerous repetitions of maneuvers done to account forvariation and errors; (4) to build a rudimentary softwareflight-dynamics model based on the nature of the collecteddata; and (5) to investigate machine-learning techniques toallow the system to learn and explain how to perform thesame actions as the human pilot (Tappan).
The key element is to acquire real-world data from aRobinson R22 two-place helicopter, which is the world’smost popular trainer [15]. Its wide range of capabilities andrelatively low operating cost make it convenient for suchactivities. However, its primitive instrumentation provides
no capability to log flight data directly. This limitation issignificant because the machine-learning project must havethe same awareness that a human pilot has, namely visualperception of the outside world and an understanding of theinternal state of the helicopter by visually observing itsinstrumentation. Outfitting the helicopter with a complexarray of sensors, as is common in other work, wouldundoubtedly be more effective, but a human pilot does notlearn to fly based on such unnatural stimuli [4].
Two aspects of this proof-of-concept solution are consideredhere: the architecture for visual data acquisition, and anOpenCV-based postprocessing system for converting thesedata into usable numerical form [13]. The primaryrequirements address safety and practicality (in no order):no interference (physical or electrical) with the helicopter;no attachments at all outside, and no substantive onesinside; ease of setup and tear down; minimal wiring; thefewest number of cameras in the least obtrusive places; andno distraction for the pilot. Section 3 covers the technicalrequirements.
2 Background
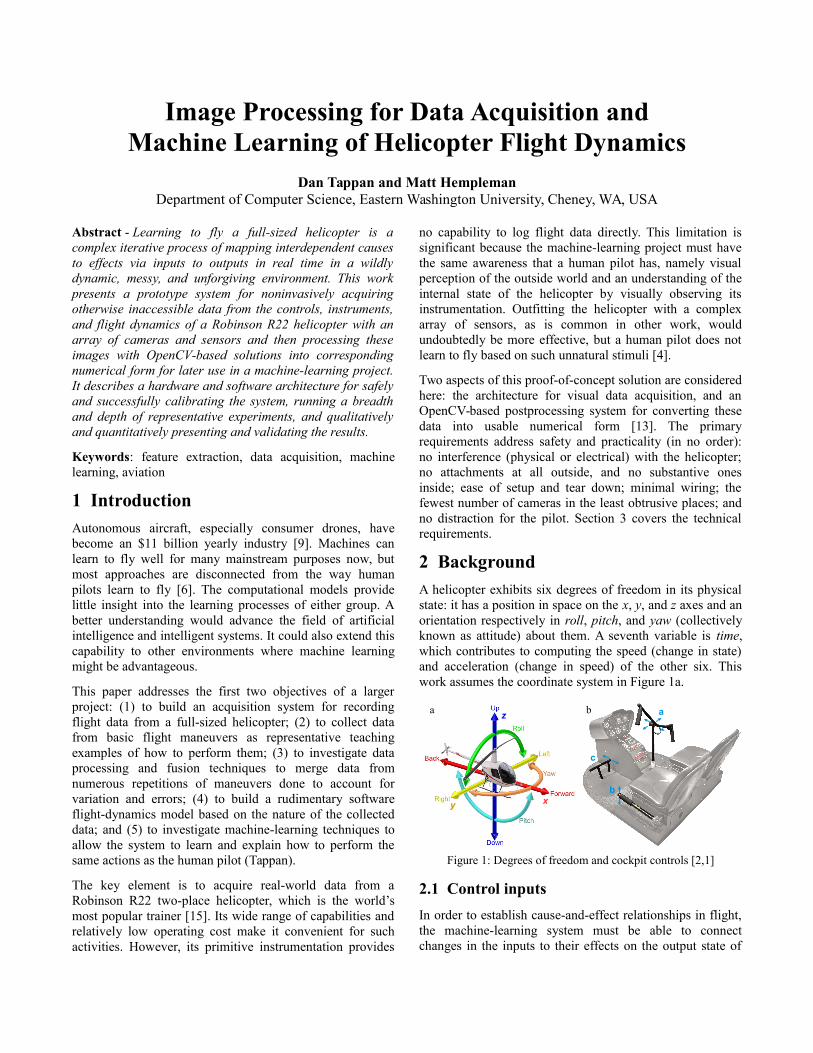
A helicopter exhibits six degrees of freedom in its physicalstate: it has a position in space on the x, y, and z axes and anorientation respectively in roll, pitch, and yaw (collectivelyknown as attitude) about them. A seventh variable is time,which contributes to computing the speed (change in state)and acceleration (change in speed) of the other six. Thiswork assumes the coordinate system in Figure 1a.
a b
Figure 1: Degrees of freedom and cockpit controls [2,1]
2.1 Control inputs
In order to establish cause-and-effect relationships in flight,the machine-learning system must be able to connectchanges in the inputs to their effects on the output state of
a
b
c
the helicopter. To this end, the first part of image acquisitionmonitors the primary flight controls available to the pilot.Most aircraft have dual controls available to both pilotssimultaneously, which is essential in a training environment.This work assumes only one pilot, sitting on the right.
The cyclic pitch control (usually called the “cyclic”) is inprinciple a joystick for the right hand with two degrees offreedom (x and y) such that forward/backward movementaffects pitch, and sideways movement affects roll. However,the actual arrangement in Figure 1b (a), known as a T-bar,places the pivot in the middle of the cockpit. The downsideis that the position of the pilot’s hand cannot be directlytracked to determine the corresponding inputs because theteetering nature of the bar allows vertical movement ofroughly 30 centimeters without any actual changes to theinput. Section 6.4 covers this issue further.
The collective pitch control (the “collective”) in Figure 1b(b) is a lever with a vertical arc of travel that changes theamount of thrust from the main rotor to affect the z position(altitude), and through more complex interactions, the x andy positions. While its range of motion is more regular thanthat of the cyclic, it is mostly obscured by the seats and thepilot’s left arm. On the end of the lever is the throttle, whichis like a motorcycle twist grip. In some helicopters, the pilotmanages this input manually, which would requirecorresponding data acquisition, but the R22 normallyoperates in automatic mode.
Finally, the antitorque pedals (the “pedals”) in Figure 1b (c)travel in a forward/backward arc to change the amount ofthrust from the tail rotor to affect yaw. The pedals are linkedin opposition, so pushing one forward moves the otherbackward correspondingly. Only one needs to be tracked.
2.2 Augmented outputs
Through complex flight dynamics far beyond the scope ofthis paper, every input affects the state of the helicopter inmultiple interdependent ways. Unlike an airplane, which isalways in motion in flight and must generally face itsdirection of travel, a helicopter is practically unlimited in itsmaneuverability. This capability offers great flexibility inuse, but it has a significant downside for automated dataacquisition because most of the fine state awareness isacquired visually by the pilot looking out the window. Atleast in small helicopters, instrumentation is sparse.
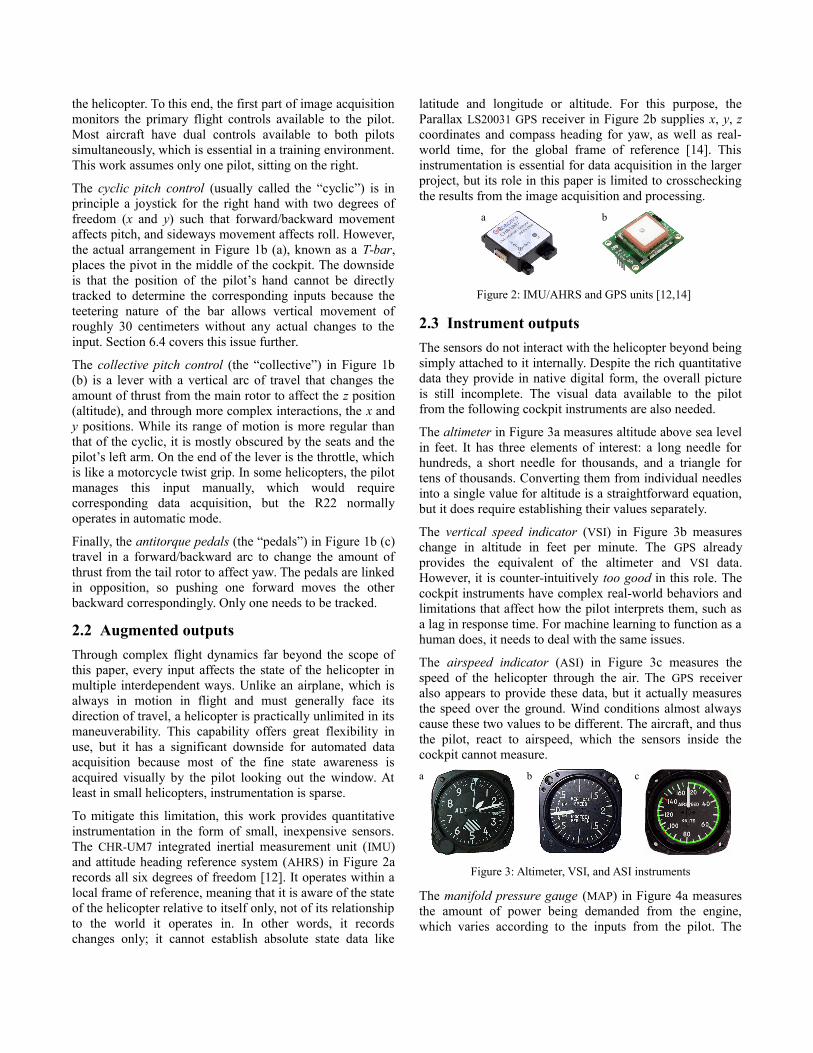
To mitigate this limitation, this work provides quantitativeinstrumentation in the form of small, inexpensive sensors.The CHR-UM7 integrated inertial measurement unit (IMU)and attitude heading reference system (AHRS) in Figure 2arecords all six degrees of freedom [12]. It operates within alocal frame of reference, meaning that it is aware of the stateof the helicopter relative to itself only, not of its relationshipto the world it operates in. In other words, it recordschanges only; it cannot establish absolute state data like
latitude and longitude or altitude. For this purpose, theParallax LS20031 GPS receiver in Figure 2b supplies x, y, zcoordinates and compass heading for yaw, as well as real-world time, for the global frame of reference [14]. Thisinstrumentation is essential for data acquisition in the largerproject, but its role in this paper is limited to crosscheckingthe results from the image acquisition and processing.
a b
Figure 2: IMU/AHRS and GPS units [12,14]
2.3 Instrument outputs
The sensors do not interact with the helicopter beyond beingsimply attached to it internally. Despite the rich quantitativedata they provide in native digital form, the overall pictureis still incomplete. The visual data available to the pilotfrom the following cockpit instruments are also needed.
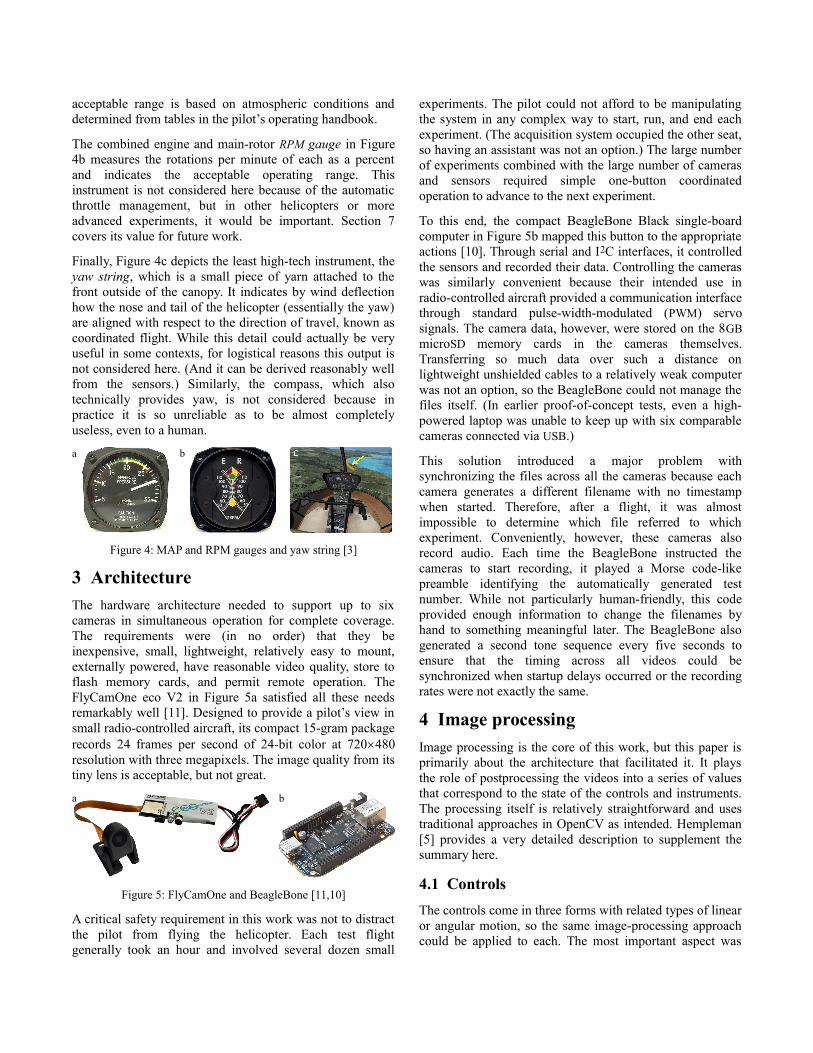
The altimeter in Figure 3a measures altitude above sea levelin feet. It has three elements of interest: a long needle forhundreds, a short needle for thousands, and a triangle fortens of thousands. Converting them from individual needlesinto a single value for altitude is a straightforward equation,but it does require establishing their values separately.
The vertical speed indicator (VSI) in Figure 3b measureschange in altitude in feet per minute. The GPS alreadyprovides the equivalent of the altimeter and VSI data.However, it is counter-intuitively too good in this role. Thecockpit instruments have complex real-world behaviors andlimitations that affect how the pilot interprets them, such asa lag in response time. For machine learning to function as ahuman does, it needs to deal with the same issues.
The airspeed indicator (ASI) in Figure 3c measures thespeed of the helicopter through the air. The GPS receiveralso appears to provide these data, but it actually measuresthe speed over the ground. Wind conditions almost alwayscause these two values to be different. The aircraft, and thusthe pilot, react to airspeed, which the sensors inside thecockpit cannot measure.
a b c
Figure 3: Altimeter, VSI, and ASI instruments
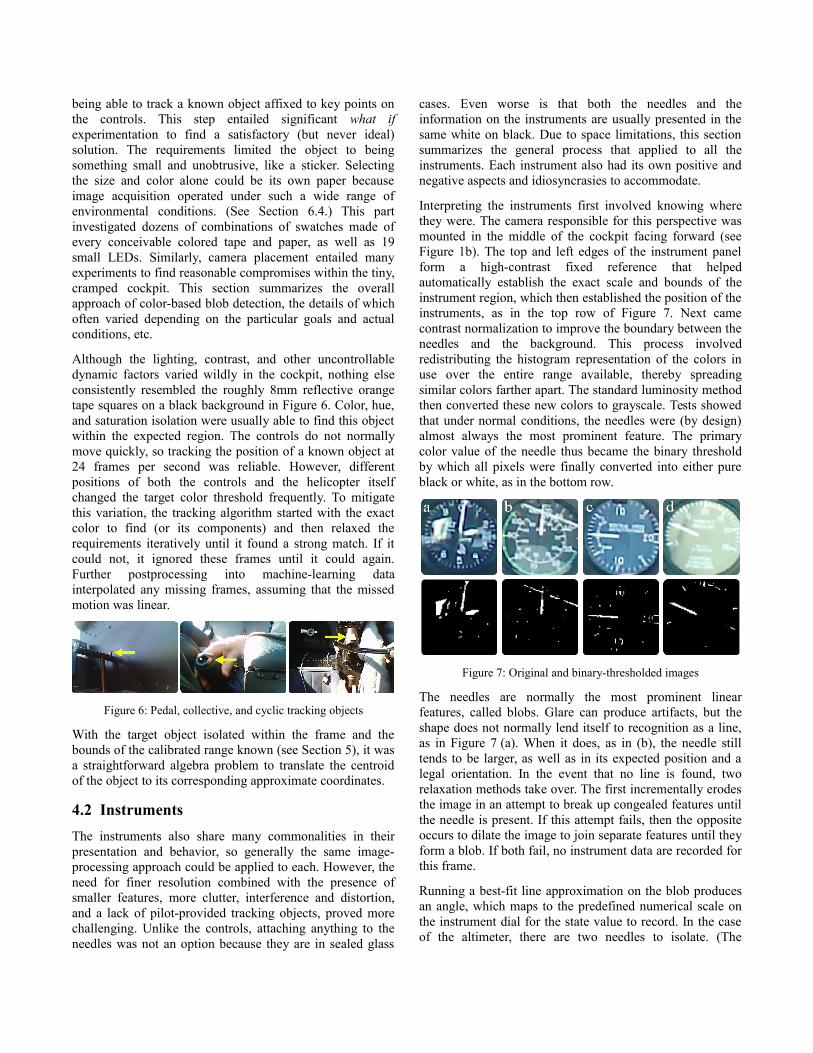
The manifold pressure gauge (MAP) in Figure 4a measuresthe amount of power being demanded from the engine,which varies according to the inputs from the pilot. The
acceptable range is based on atmospheric conditions anddetermined from tables in the pilot’s operating handbook.
The combined engine and main-rotor RPM gauge in Figure4b measures the rotations per minute of each as a percentand indicates the acceptable operating range. Thisinstrument is not considered here because of the automaticthrottle management, but in other helicopters or moreadvanced experiments, it would be important. Section 7covers its value for future work.
Finally, Figure 4c depicts the least high-tech instrument, theyaw string, which is a small piece of yarn attached to thefront outside of the canopy. It indicates by wind deflectionhow the nose and tail of the helicopter (essentially the yaw)are aligned with respect to the direction of travel, known ascoordinated flight. While this detail could actually be veryuseful in some contexts, for logistical reasons this output isnot considered here. (And it can be derived reasonably wellfrom the sensors.) Similarly, the compass, which alsotechnically provides yaw, is not considered because inpractice it is so unreliable as to be almost completelyuseless, even to a human.
a b
Figure 4: MAP and RPM gauges and yaw string [3]
3 Architecture
The hardware architecture needed to support up to sixcameras in simultaneous operation for complete coverage.The requirements were (in no order) that they beinexpensive, small, lightweight, relatively easy to mount,externally powered, have reasonable video quality, store toflash memory cards, and permit remote operation. TheFlyCamOne eco V2 in Figure 5a satisfied all these needsremarkably well [11]. Designed to provide a pilot’s view insmall radio-controlled aircraft, its compact 15-gram packagerecords 24 frames per second of 24-bit color at 720480resolution with three megapixels. The image quality from itstiny lens is acceptable, but not great.
a b
Figure 5: FlyCamOne and BeagleBone [11,10]
A critical safety requirement in this work was not to distractthe pilot from flying the helicopter. Each test flightgenerally took an hour and involved several dozen small
experiments. The pilot could not afford to be manipulatingthe system in any complex way to start, run, and end eachexperiment. (The acquisition system occupied the other seat,so having an assistant was not an option.) The large numberof experiments combined with the large number of camerasand sensors required simple one-button coordinatedoperation to advance to the next experiment.
To this end, the compact BeagleBone Black single-boardcomputer in Figure 5b mapped this button to the appropriateactions [10]. Through serial and I2C interfaces, it controlledthe sensors and recorded their data. Controlling the cameraswas similarly convenient because their intended use inradio-controlled aircraft provided a communication interfacethrough standard pulse-width-modulated (PWM) servosignals. The camera data, however, were stored on the 8GBmicroSD memory cards in the cameras themselves.Transferring so much data over such a distance onlightweight unshielded cables to a relatively weak computerwas not an option, so the BeagleBone could not manage thefiles itself. (In earlier proof-of-concept tests, even a high-powered laptop was unable to keep up with six comparablecameras connected via USB.)
This solution introduced a major problem withsynchronizing the files across all the cameras because eachcamera generates a different filename with no timestampwhen started. Therefore, after a flight, it was almostimpossible to determine which file referred to whichexperiment. Conveniently, however, these cameras alsorecord audio. Each time the BeagleBone instructed thecameras to start recording, it played a Morse code-likepreamble identifying the automatically generated testnumber. While not particularly human-friendly, this codeprovided enough information to change the filenames byhand to something meaningful later. The BeagleBone alsogenerated a second tone sequence every five seconds toensure that the timing across all videos could besynchronized when startup delays occurred or the recordingrates were not exactly the same.
4 Image processing
Image processing is the core of this work, but this paper isprimarily about the architecture that facilitated it. It playsthe role of postprocessing the videos into a series of valuesthat correspond to the state of the controls and instruments.The processing itself is relatively straightforward and usestraditional approaches in OpenCV as intended. Hempleman[5] provides a very detailed description to supplement thesummary here.
4.1 Controls
The controls come in three forms with related types of linearor angular motion, so the same image-processing approachcould be applied to each. The most important aspect was
being able to track a known object affixed to key points onthe controls. This step entailed significant what ifexperimentation to find a satisfactory (but never ideal)solution. The requirements limited the object to beingsomething small and unobtrusive, like a sticker. Selectingthe size and color alone could be its own paper becauseimage acquisition operated under such a wide range ofenvironmental conditions. (See Section 6.4.) This partinvestigated dozens of combinations of swatches made ofevery conceivable colored tape and paper, as well as 19small LEDs. Similarly, camera placement entailed manyexperiments to find reasonable compromises within the tiny,cramped cockpit. This section summarizes the overallapproach of color-based blob detection, the details of whichoften varied depending on the particular goals and actualconditions, etc.
Although the lighting, contrast, and other uncontrollabledynamic factors varied wildly in the cockpit, nothing elseconsistently resembled the roughly 8mm reflective orangetape squares on a black background in Figure 6. Color, hue,and saturation isolation were usually able to find this objectwithin the expected region. The controls do not normallymove quickly, so tracking the position of a known object at24 frames per second was reliable. However, differentpositions of both the controls and the helicopter itselfchanged the target color threshold frequently. To mitigatethis variation, the tracking algorithm started with the exactcolor to find (or its components) and then relaxed therequirements iteratively until it found a strong match. If itcould not, it ignored these frames until it could again.Further postprocessing into machine-learning datainterpolated any missing frames, assuming that the missedmotion was linear.
Figure 6: Pedal, collective, and cyclic tracking objects
With the target object isolated within the frame and thebounds of the calibrated range known (see Section 5), it wasa straightforward algebra problem to translate the centroidof the object to its corresponding approximate coordinates.
4.2 Instruments
The instruments also share many commonalities in theirpresentation and behavior, so generally the same image-processing approach could be applied to each. However, theneed for finer resolution combined with the presence ofsmaller features, more clutter, interference and distortion,and a lack of pilot-provided tracking objects, proved morechallenging. Unlike the controls, attaching anything to theneedles was not an option because they are in sealed glass
cases. Even worse is that both the needles and theinformation on the instruments are usually presented in thesame white on black. Due to space limitations, this sectionsummarizes the general process that applied to all theinstruments. Each instrument also had its own positive andnegative aspects and idiosyncrasies to accommodate.
Interpreting the instruments first involved knowing wherethey were. The camera responsible for this perspective wasmounted in the middle of the cockpit facing forward (seeFigure 1b). The top and left edges of the instrument panelform a high-contrast fixed reference that helpedautomatically establish the exact scale and bounds of theinstrument region, which then established the position of theinstruments, as in the top row of Figure 7. Next camecontrast normalization to improve the boundary between theneedles and the background. This process involvedredistributing the histogram representation of the colors inuse over the entire range available, thereby spreadingsimilar colors farther apart. The standard luminosity methodthen converted these new colors to grayscale. Tests showedthat under normal conditions, the needles were (by design)almost always the most prominent feature. The primarycolor value of the needle thus became the binary thresholdby which all pixels were finally converted into either pureblack or white, as in the bottom row.
Figure 7: Original and binary-thresholded images
The needles are normally the most prominent linearfeatures, called blobs. Glare can produce artifacts, but theshape does not normally lend itself to recognition as a line,as in Figure 7 (a). When it does, as in (b), the needle stilltends to be larger, as well as in its expected position and alegal orientation. In the event that no line is found, tworelaxation methods take over. The first incrementally erodesthe image in an attempt to break up congealed features untilthe needle is present. If this attempt fails, then the oppositeoccurs to dilate the image to join separate features until theyform a blob. If both fail, no instrument data are recorded forthis frame.
Running a best-fit line approximation on the blob producesan angle, which maps to the predefined numerical scale onthe instrument dial for the state value to record. In the caseof the altimeter, there are two needles to isolate. (The
triangle for tens of thousands of feet was not consideredbecause no flight tests took place so high.) When theneedles are far enough apart to differentiate, the process isidentical. When they are fused, however, the centroid of thissuperblob still suffices. Later cleanup for machine learningcould interpolate from the last known separate values, but inpractice, this occlusion (which also happens to pilots) is notan issue. The altimeter is not precise enough anyway.
5 Calibration and experiments
For reliable, repeatable measurements of the controls andinstruments, each in-flight testing session required an initialcalibration stage to ensure that the same states mappedacceptably close to the same values. In fact, calibration wasactually necessary before and after each session to verifythat no changes occurred from vibration. This calibrationqualified as experiments in its own right because itpermitted comparison of the actual values to the expected.
5.1 Static experiments
It is extremely difficult to establish a set of ground-truthstates during real flight maneuvers because the dynamicoperating environment is so messy; i.e., the expected valuesare not precisely known. The sensors provided somecapability for cross-checking, but their coverage waslimited. To establish best-case baseline performance, theinitial tests were static on a non-operating helicopter.
5.1.1 Controls
The pedals travel along a known arc with three naturalcalibration points: full forward, full backward, and half way,which is straightforward to determine because both pedalsare adjacent. Similarly, the collective has full down and uppositions. A vertical calibration jig with known anglesprinted on a poster board established intermediate points.The cyclic, however, was troublesome. Its range of two-dimensional motion is over a large horizontal plane whoselimits exceeded the field of view of any single camera. Datacollection in flight was not affected because the cyclic rarelyreaches these limits; however, calibration did need them, orat least an equivalent. To this end, a similar jig with arectangular internal cutout established the known limits forthe center post, which also established the neutral centerposition. However, positioning the jig itself was trickybecause there are few convenient fixed reference points inthe cramped cockpit. This process looked ridiculous becauseit involved aligning small stick-on bubble levels and a lot ofcontortion, but it was actually effective.
5.1.2 Instruments
Static calibration of the instruments was far more limitedbecause there is almost no access to their needles. Only thealtimeter has a knob that changes the internal value, but its
range is limited to a thousand feet or so. Instead, thesimplest approach proved most effective: color printouts ofthe instruments to scale with known needle positions tapedover the actual instruments. While this approach did notaccount for the visual disturbances covered in the nextsection, calibration would be inappropriate under suchsuboptimal conditions anyway.
5.2 Dynamic experiments
The dynamic experiments involved a breadth and depth ofrepresentative flight maneuvers. The purpose was to test thedata acquisition system, not to collect actual data formachine learning. It was therefore not necessary todemonstrate more than one acceptable representativeexemplar of each. Data for machine learning actuallyrequires many such samples for filtering, smoothing,averaging, fusion, complex statistical analyses, etc. beyondthe scope here.
The first set involved airborne maneuvers. They exhibitedrelatively large changes in the inputs and instruments:
• straight and level at a constant speed, accelerating, and decelerating
• straight with a shallow climb at a fixed climb rate• straight with a steep climb• straight with a shallow descent at a fixed speed• straight with a steep descent• straight with shallow sinusoidal climbs and descents• right turn level• right turn with a shallow climb• right turn with a steep climb at a fixed speed• right turn with a shallow descent• right turn with steep descent at a fixed descent rate• a left rectangular runway traffic pattern: taking off,
climbing, leveling off, descending, and landing
The second set was near the ground with small changes:
• stationary hover• pivot turn: stationary while rotating about the z axis• square, circle, and figure 8: always facing forward, and
always facing the center of the shape
6 Results and discussion
Evaluating results in terms of the agreement between actualand expected values is difficult when the former are messyand the latter are not definitively known. There wassignificant variation in the experiments caused by pilot errorand uncontrollable conditions like wind, as well asmeasurement errors in the sensors themselves. This paperfocuses on the raw image acquisition, not on their complexpostprocessing into cleaner form, so the discussion of theresults is mostly subjective. To mitigate biases, however,there were several complementary approaches.
6.1 Qualitative internal validation
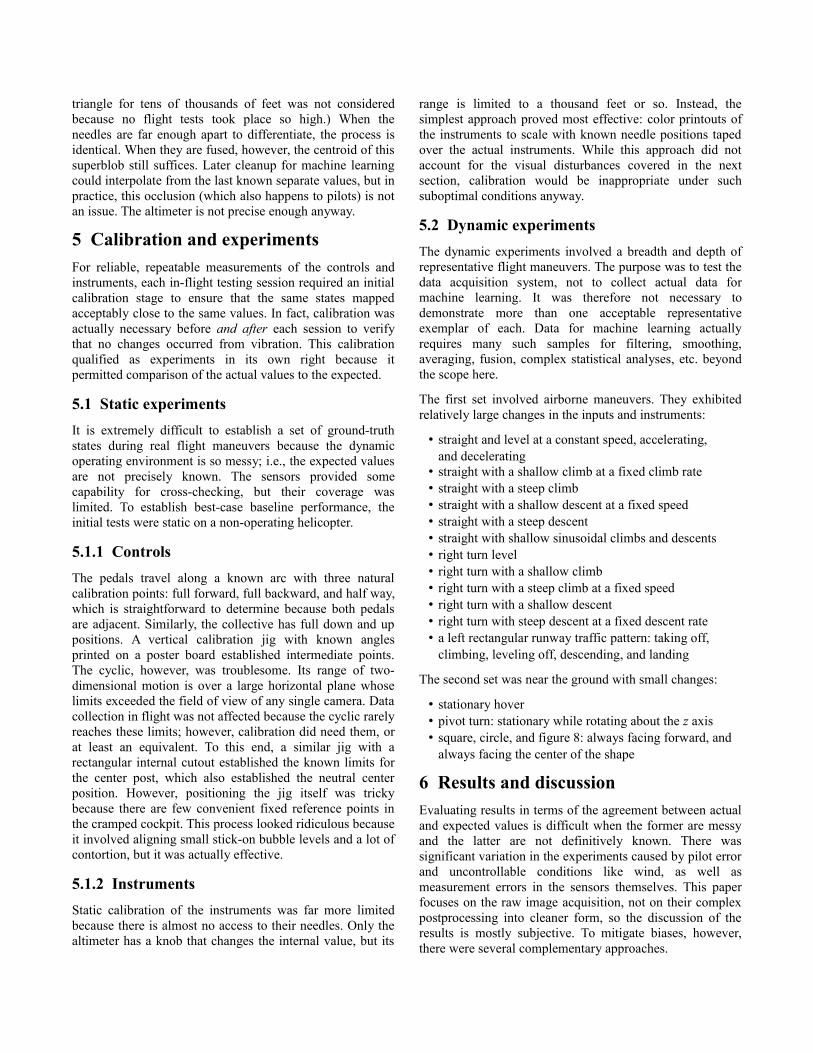
Qualitative validation involved the pilot reviewing theresults of each test in a form that consolidated the inputs andoutputs into a meaningful representation. The instrumentpanel in Figure 8 shows the results derived from the imageprocessing and the sensors [7]. Validation in this form isbased on whether the instrument view internally from thepilot’s local perspective in the virtual cockpit was consistentwith performing the maneuvers correctly. Here the low-leveldata combine with the high-level knowledge and wisdom ofthe experienced human pilot to make informedinterpretations and evaluations.
Figure 8: Virtual instrument panel and control indicator
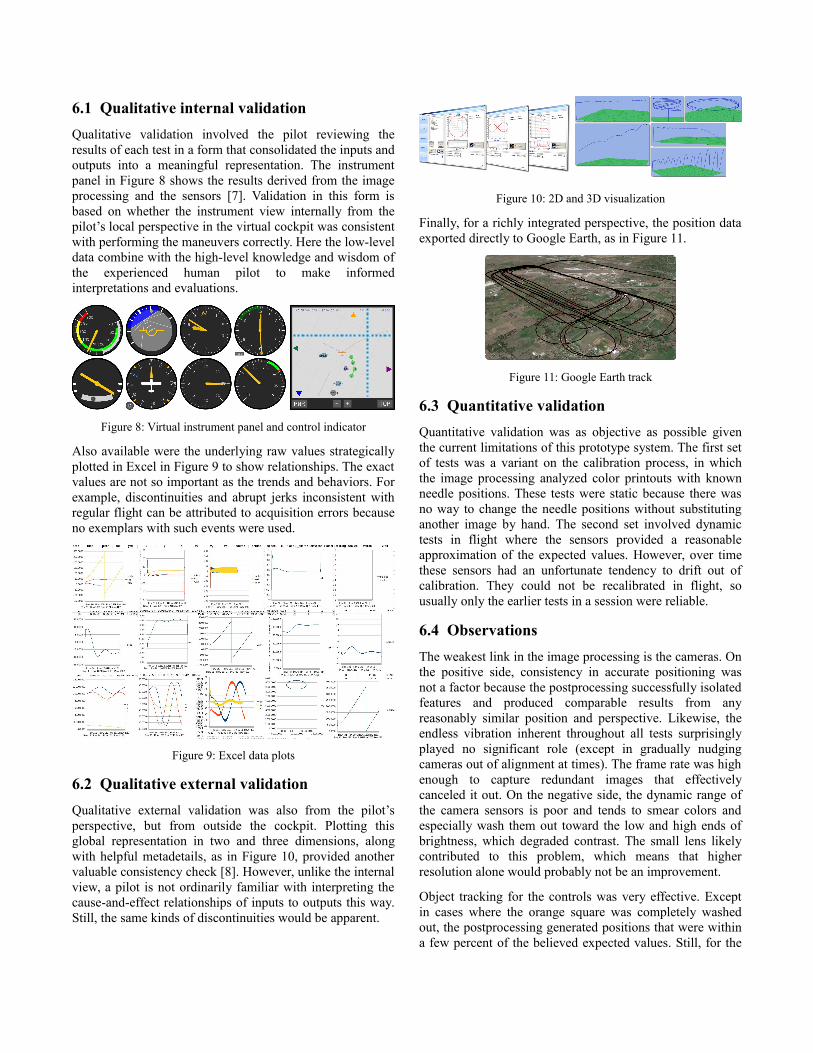
Also available were the underlying raw values strategicallyplotted in Excel in Figure 9 to show relationships. The exactvalues are not so important as the trends and behaviors. Forexample, discontinuities and abrupt jerks inconsistent withregular flight can be attributed to acquisition errors becauseno exemplars with such events were used.
Figure 9: Excel data plots
6.2 Qualitative external validation
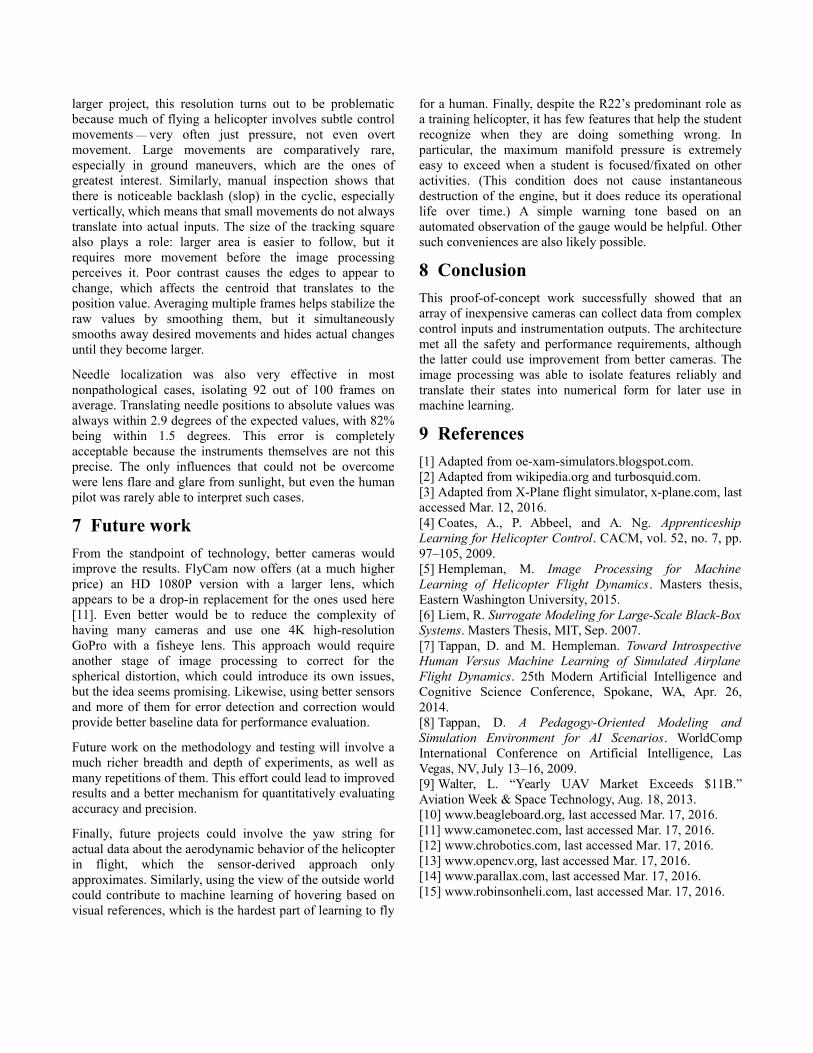
Qualitative external validation was also from the pilot’sperspective, but from outside the cockpit. Plotting thisglobal representation in two and three dimensions, alongwith helpful metadetails, as in Figure 10, provided anothervaluable consistency check [8]. However, unlike the internalview, a pilot is not ordinarily familiar with interpreting thecause-and-effect relationships of inputs to outputs this way.Still, the same kinds of discontinuities would be apparent.
Figure 10: 2D and 3D visualization
Finally, for a richly integrated perspective, the position dataexported directly to Google Earth, as in Figure 11.
Figure 11: Google Earth track
6.3 Quantitative validation
Quantitative validation was as objective as possible giventhe current limitations of this prototype system. The first setof tests was a variant on the calibration process, in whichthe image processing analyzed color printouts with knownneedle positions. These tests were static because there wasno way to change the needle positions without substitutinganother image by hand. The second set involved dynamictests in flight where the sensors provided a reasonableapproximation of the expected values. However, over timethese sensors had an unfortunate tendency to drift out ofcalibration. They could not be recalibrated in flight, sousually only the earlier tests in a session were reliable.
6.4 Observations
The weakest link in the image processing is the cameras. Onthe positive side, consistency in accurate positioning wasnot a factor because the postprocessing successfully isolatedfeatures and produced comparable results from anyreasonably similar position and perspective. Likewise, theendless vibration inherent throughout all tests surprisinglyplayed no significant role (except in gradually nudgingcameras out of alignment at times). The frame rate was highenough to capture redundant images that effectivelycanceled it out. On the negative side, the dynamic range ofthe camera sensors is poor and tends to smear colors andespecially wash them out toward the low and high ends ofbrightness, which degraded contrast. The small lens likelycontributed to this problem, which means that higherresolution alone would probably not be an improvement.
Object tracking for the controls was very effective. Exceptin cases where the orange square was completely washedout, the postprocessing generated positions that were withina few percent of the believed expected values. Still, for the
larger project, this resolution turns out to be problematicbecause much of flying a helicopter involves subtle controlmovements — very often just pressure, not even overtmovement. Large movements are comparatively rare,especially in ground maneuvers, which are the ones ofgreatest interest. Similarly, manual inspection shows thatthere is noticeable backlash (slop) in the cyclic, especiallyvertically, which means that small movements do not alwaystranslate into actual inputs. The size of the tracking squarealso plays a role: larger area is easier to follow, but itrequires more movement before the image processingperceives it. Poor contrast causes the edges to appear tochange, which affects the centroid that translates to theposition value. Averaging multiple frames helps stabilize theraw values by smoothing them, but it simultaneouslysmooths away desired movements and hides actual changesuntil they become larger.
Needle localization was also very effective in mostnonpathological cases, isolating 92 out of 100 frames onaverage. Translating needle positions to absolute values wasalways within 2.9 degrees of the expected values, with 82%being within 1.5 degrees. This error is completelyacceptable because the instruments themselves are not thisprecise. The only influences that could not be overcomewere lens flare and glare from sunlight, but even the humanpilot was rarely able to interpret such cases.
7 Future work
From the standpoint of technology, better cameras wouldimprove the results. FlyCam now offers (at a much higherprice) an HD 1080P version with a larger lens, whichappears to be a drop-in replacement for the ones used here[11]. Even better would be to reduce the complexity ofhaving many cameras and use one 4K high-resolutionGoPro with a fisheye lens. This approach would requireanother stage of image processing to correct for thespherical distortion, which could introduce its own issues,but the idea seems promising. Likewise, using better sensorsand more of them for error detection and correction wouldprovide better baseline data for performance evaluation.
Future work on the methodology and testing will involve amuch richer breadth and depth of experiments, as well asmany repetitions of them. This effort could lead to improvedresults and a better mechanism for quantitatively evaluatingaccuracy and precision.
Finally, future projects could involve the yaw string foractual data about the aerodynamic behavior of the helicopterin flight, which the sensor-derived approach onlyapproximates. Similarly, using the view of the outside worldcould contribute to machine learning of hovering based onvisual references, which is the hardest part of learning to fly
for a human. Finally, despite the R22’s predominant role asa training helicopter, it has few features that help the studentrecognize when they are doing something wrong. Inparticular, the maximum manifold pressure is extremelyeasy to exceed when a student is focused/fixated on otheractivities. (This condition does not cause instantaneousdestruction of the engine, but it does reduce its operationallife over time.) A simple warning tone based on anautomated observation of the gauge would be helpful. Othersuch conveniences are also likely possible.
8 Conclusion
This proof-of-concept work successfully showed that anarray of inexpensive cameras can collect data from complexcontrol inputs and instrumentation outputs. The architecturemet all the safety and performance requirements, althoughthe latter could use improvement from better cameras. Theimage processing was able to isolate features reliably andtranslate their states into numerical form for later use inmachine learning.
9 References
[1] Adapted from oe-xam-simulators.blogspot.com.[2] Adapted from wikipedia.org and turbosquid.com.[3] Adapted from X-Plane flight simulator, x-plane.com, lastaccessed Mar. 12, 2016.[4] Coates, A., P. Abbeel, and A. Ng. ApprenticeshipLearning for Helicopter Control. CACM, vol. 52, no. 7, pp.97–105, 2009.[5] Hempleman, M. Image Processing for MachineLearning of Helicopter Flight Dynamics. Masters thesis,Eastern Washington University, 2015.[6] Liem, R. Surrogate Modeling for Large-Scale Black-BoxSystems. Masters Thesis, MIT, Sep. 2007.[7] Tappan, D. and M. Hempleman. Toward IntrospectiveHuman Versus Machine Learning of Simulated AirplaneFlight Dynamics. 25th Modern Artificial Intelligence andCognitive Science Conference, Spokane, WA, Apr. 26,2014.[8] Tappan, D. A Pedagogy-Oriented Modeling andSimulation Environment for AI Scenarios. WorldCompInternational Conference on Artificial Intelligence, LasVegas, NV, July 13–16, 2009.[9] Walter, L. “Yearly UAV Market Exceeds $11B.”Aviation Week & Space Technology, Aug. 18, 2013.[10] www.beagleboard.org, last accessed Mar. 17, 2016.[11] www.camonetec.com, last accessed Mar. 17, 2016.[12] www.chrobotics.com, last accessed Mar. 17, 2016.[13] www.opencv.org, last accessed Mar. 17, 2016.[14] www.parallax.com, last accessed Mar. 17, 2016.[15] www.robinsonheli.com, last accessed Mar. 17, 2016.