Embed Size (px)
Citation preview
Night Vision and
Electronic Sensors Directorate
AD-A283 917 AMSEL-NV-TR-O 112
Image Intensifier SystemResolution Based on Laboratory
Measured Parameters
by TirRaymond J. Stefanik T C
August 1994
Distribution unlimited; approved for public release.
> ~ 94- 27216
R BAR
FORT BELVOIR, VIRGINIA 22060-5806
L C~9~
Destroy this report when it is no longer needed.Do not return it to the originator.
The citation in this report of trade names ofcommercially available products does notconstitute official endorsement or approval of theuse of such products.
Form ApprovedREPORT DOCUMENTATION PAGE I OMB No. 0704-018
Ptac btamng Wfdt fo hr e ction Of Niarmais otwalied to aiwag. I hou pw repmor, vidng lif e m. lot is for lef tucuc e, sw&oahg ofng data mircis ga•h •g and mainaroV Ohw data nwoand oow•Itru 4rid uananng Ih. cd4;im o1 .•1wmral Snd •u~ rl egafdrg Ihe bade,, emamt ot any •w •. h. nde I• mirotmulian. wid~dmg a•ggtbmts 1ow r.&ang he baden. to Wa4umgton
HiatduUitss Seret. Du • O In of ratan Opoaswrs e"d Reputs, 1215 Jefferson Das I4ghway. Sils 1204. AkMgion, VA Z2M-4302. and to Iwo Offic o Manaemnt and uge f• R muon Rooqet (0704-018a.Washogta. DC 2=03
1. AGENCY USE ONLY (Leave blank) 2. REPORT DATE 3. REPORT TYPE AND DATES COVERED
August 1994 Final June 1980 to April 1993
4. TITLE AND SUBTITLE 5. FUNDING NUMBERS
Image Intensifier System Resolution Based on Laboratory Measured Parameters (U)
6. AUTHOR(S)
Raymond J. Stefanik
7. PERFORMING ORGANIZATION NAME(S) AND ADORESS(ES) 8. PERFORMING ORGANIZATION
USA CECOM Night Vision and Electronic Sensors Directorate REPORT NUMBER
Lasers and Photonics Division (AMSEL-RD-NV-LPD) AMSEL-NV-TR-01 12Fort Belvoir, VA 22060-5806
9. SPONSORINGIMONITORING AGENCY NAME(S) AND ADDRESS(ES) 10. SPONSORINGIMONITORINGAGENCY REPORT NUMBER
11. SUPPLEMENTARY NOTES
POC: Raymond Stefanik, 703-704-1307
12a DISTRIBUTION/AVAILABILITY STATEMENT 12b. DISTRIBUTION CODE
Distribution unlimited; approved for public release.
13. ABSTRACT (AMaknum 200 words)
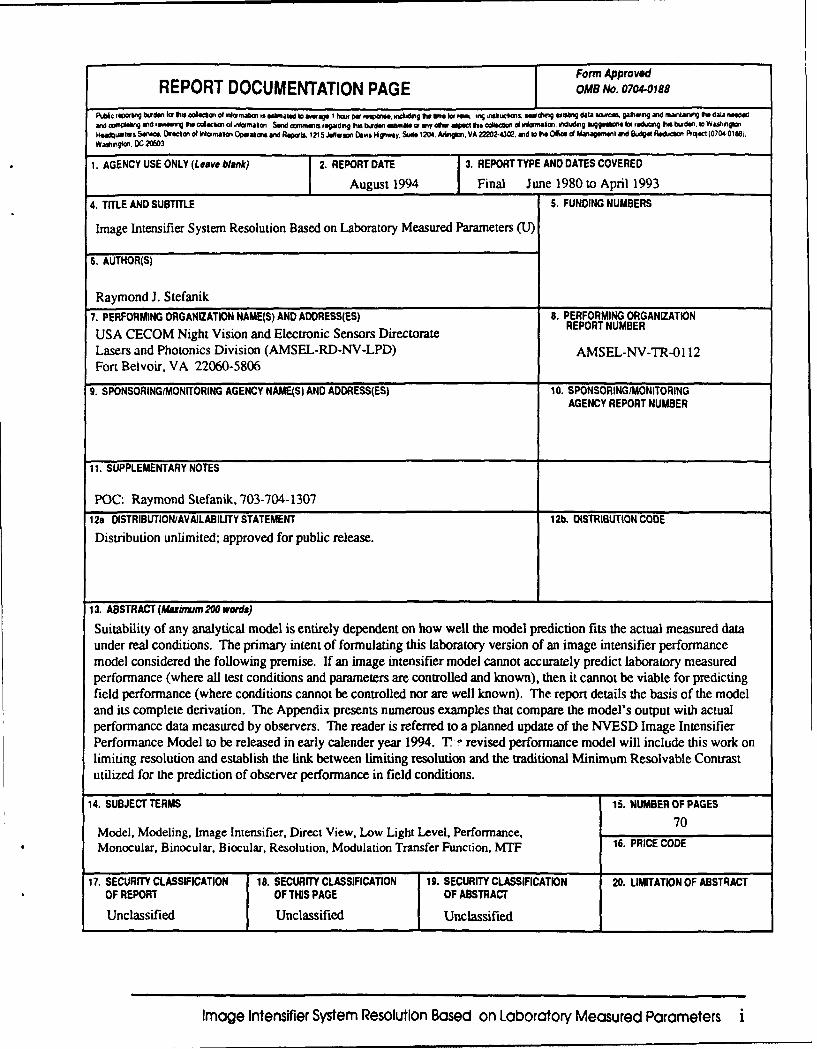
Suitability of any analytical model is entirely dependent on how well the model prediction fits the actual measured dataunder real conditions. The primary intent of formulating this laboratory version of an image intensifier performancemodel considered the following premise. If an image intensifier model cannot accurately predict laboratory measuredperformance (where all test conditions and parameters are controlled and known), then it cannot be viable for predictingfield performance (where conditions cannot be controlled nor are well known). The report details the basis of the modeland its complete derivation. The Appendix presents numerous examples that compare the model's output with actualperformance data measured by observers. The reader is referred to a planned update of the NVESD Image IntensifierPerformance Model to be released in early calender year 1994. T" revised performance model will include this work onlimiting resolution and establish the link between limiting resolution and the traditional Minimum Resolvable Contrastutilized for the prediction of observer performance in field conditions.
14. SUBJECT TERMS 15. NUMBER OF PAGES
70Model, Modeling, Image Intensifier, Direct View, Low Light Level, Performance,Monocular, Binocular, Biocular, Resolution, Modulation Transfer Function, MTF 16. PRICE CODE
17. SECURITY CLASSIFICATION 18. SECURITY CLASSIFICATION 19. SECURITY CLASSIFICATION 20. LIMITATION OF ABSTRACTOF REPORT OF THIS PAGE OF ABSTRACT
Unclassified Unclassified Unclassified
Image Intensifier System Resolution Based on Laboratory Measured Parameters i
Report Number 0112
Image intensifier SystemResolution Based on Laboratory
Measured Parameters
Prepared by
Raymond J. Stefanik
Night Vision and Electronic Sensors DirectorateFort Belvoir, Virginia 22060-5806
August 1994
Distribution unlimited; approved for public release.
Image Intensifier System Resolution Based on Laboratory Measured Parameters ii
Table of Contents
Page
Basis for the Model .............................................................................................. I
EBI Contribution .................................................................................................. 4
MTF Contribution ............................................................................................... 5
Periodic Square Wave Analysis ........................................................................... 5
Singular Positive Bar Target Analysis ................................................................ 6
Singular Negative Bar Target Analysis .............................................................. 7
Tri-Bar Target Analysis (white on black) ............................................................ 8
Tri-Bar Target Analysis (black on white) ............................................................ 9
Output Target Brightness ..................................................................................... 10
Periodic Square Wave Gain Reduction ............................................................... 10
Singular Positive Bar Target Gain Reduction ........................................................... 11
Singular Negative Bar Target Gain Reduction ..................................................... 11
Tri-Bar Target (white on black) Gain Reduction ...................................................... 11
Tri-Bar Target (black on white) Gain Reduction ................................................ 12
Total System Performance .................................................................................. 13
Human Eye Performance Limitation .................................................................... 13
Gain Saturation Effect On Output Brightness .................................................... 19
Monocular, Binocular, and Biocular Systems ..................................................... 21
Model Flow Chart Summary ............................................................................... 22
Special Considerations ........................................................................................ 26
References ........................................................................................................... 29
Symbology ........................................................................................................... 30
Appendix A Examples ..................................................................................... A-i
Figures ti on lo,1. MTF of the Eye's Refraction Optics ............................................................ 14 GRAI2. MTFofthe Foveal Retina ................................................................................... 15 •AB 03. Total MTF of the Eye .......................................................................................... 16 C'-oed4. Pupil Diameter vs Scene Luminance ............................................................ 16 tcat -
Availability Oqd"
Avail azWd/r
lost SpeoIaL
Image Intensifier System Resolution Based on Laboratory Measured Parameters v
Preface
H aving been educated as an electronics engineer, the confusions surrounding thephysical characterization of optics and electro-optics has been quite a challenge to put
into perspective. Whereas electronic circuit modeling is a well-matured discipline, electro-optics modeling is still stumbling through theory and equations to determine what thehuman eye "sees" with devices that aid the visual sense. Suitability of any analyticalmodel, whether it be an electronic circuit or an optical system, is primarily dependent onhow well the model prediction fits the actual measured data under real conditions.Unfortunately, the converse to this premise is usually ignored: How well is the measureddata interpreted by and incorporated into the analytical model? Those of you who probeinto this dissertation should recognize this latter concern, for it is common to haveexperienced, as you may have, many solutions to problems where two wrongs yield acorrect solution.
The origin of this model began about 13 years ago when a paper by E. A. Richards, dated1967, caught my attention: "Fundamental Limitations in the Low Light-LevelPerformance of Direct-View Image-Intensifier Systems." At that time, having beenintimately involved in image intensification for a decade, and recognizing a need forcorrelating intensifier parameters with lab-measured system performance, the temptation totry Richards' formulation was compelling. Over the years the various parameters thatdictate the intensifier system performance were added to this foundation. The sequence ofthis report follows the slow and sporadic evolution of the model over that period. Mostrecently the aspect of one/two eye systems (monocular, binocular, and biocular) wasformulated, which presents a theoretical approach for expressing the way the braininterprets the image(s) from one or both eyes. It should not be surprising for you who areelectronic engineers to recognize a circuit analogy in this formulation: with two imagingdevices cascaded, two quantities add (as resistors in series); and with two imaging devicesin parallel, there is a product over sum of two quantities (as resistors in parallel). It wouldbe most appealing to eventually describe this electro-optic system with an equivalentelectrical circuit counterpart.
Care has been taken to note all assumptions, speculations, and precautions whiledeveloping the model. Of course the initial attempt to adapt Richards' equation wasviewed in a speculative manner until it was found to correlate well with observer data.Comments that either substantiate or disprove these assumptions or speculations arewelcome.
Image Intensifier System Resolution Based on Laboratory Measured Parameters vii
Basis for the Model
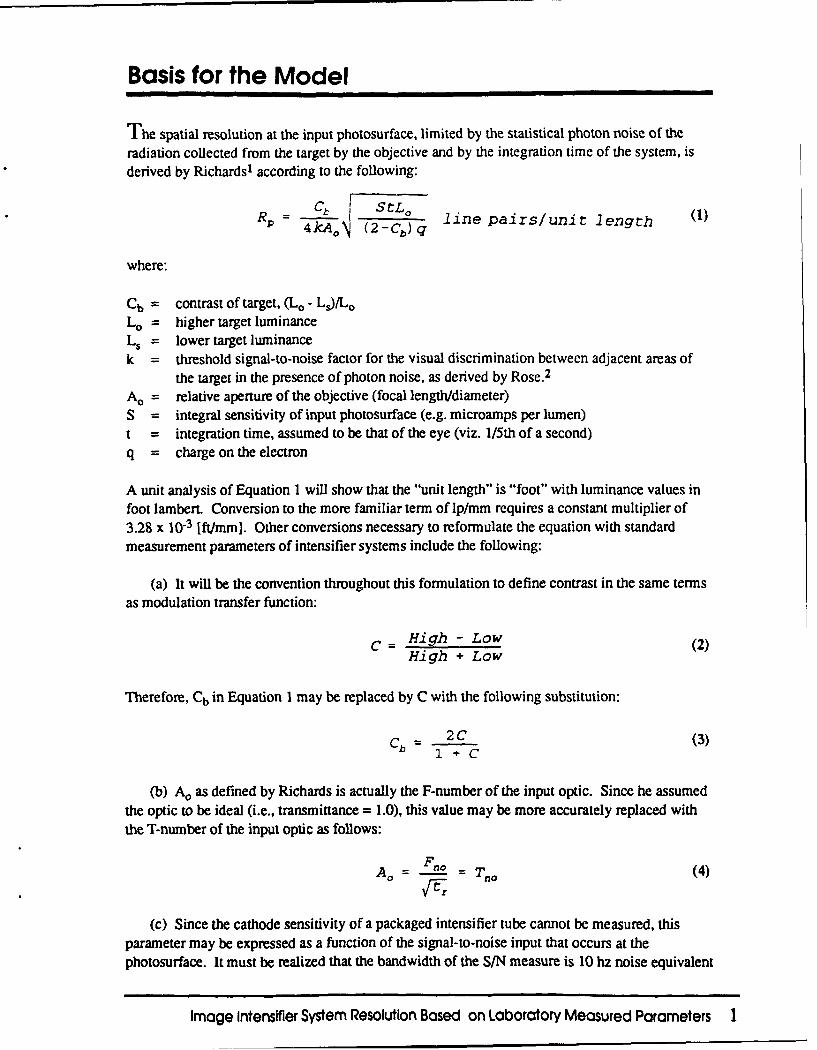
The spatial resolution at the input photosurface, limited by the statistical photon noise of the
radiation collected from the target by the objective and by the integration time of the system, isderived by Richards1 according to the following:
SStL0 line p airs/uni t leng th
4kA0 ( 2 -C))q
where:
Cb = contrast of target, (Lo - LS)/LoLo = higher target luminanceLs = lower target luminancek = threshold signal-to-noise factor for the visual discrimination between adjacent areas of
the target in the presence of photon noise, as derived by Rose. 2
A0 = relative aperture of the objective (focal length/diameter)S = integral sensitivity of input photosurface (e.g. microamps per lumen)t = integration time, assumed to be that of the eye (viz. 1/5th of a second)q = charge on the electron
A unit analysis of Equation I will show that the "unit length" is "foot" with luminance values infoot lambert. Conversion to the more familiar term of lp/mm requires a constant multiplier of3.28 x 10-3 [ft/mm]. Other conversions necessary to reformulate the equation with standardmeasurement parameters of intensifier systems include the following:
(a) It will be the convention throughout this formulation to define contrast in the same termsas modulation transfer function:
C = High - LowHigh Low (2)
Therefore, Cb in Equation I may be replaced by C with the following substitution:
Cb= 2C (3)
(b) A0 as defined by Richards is actually the F-number of the input optic. Since he assumed
the optic to be ideal (i.e., transmittance = 1.0), this value may be more accurately replaced withthe T-number of the input optic as follows:
Ao- = no - Tno (4)VrEZ
(C) Since the cathode sensitivity of a packaged intensifier tube cannot be measured, thisparameter may be expressed as a function of the signal-to-noise input that occurs at thephotosurface. It must be realized that the bandwidth of the S/N measure is 10 hz noise equivalent
Image Intensifier System Resolution Based on Laboratory Measured Parameters
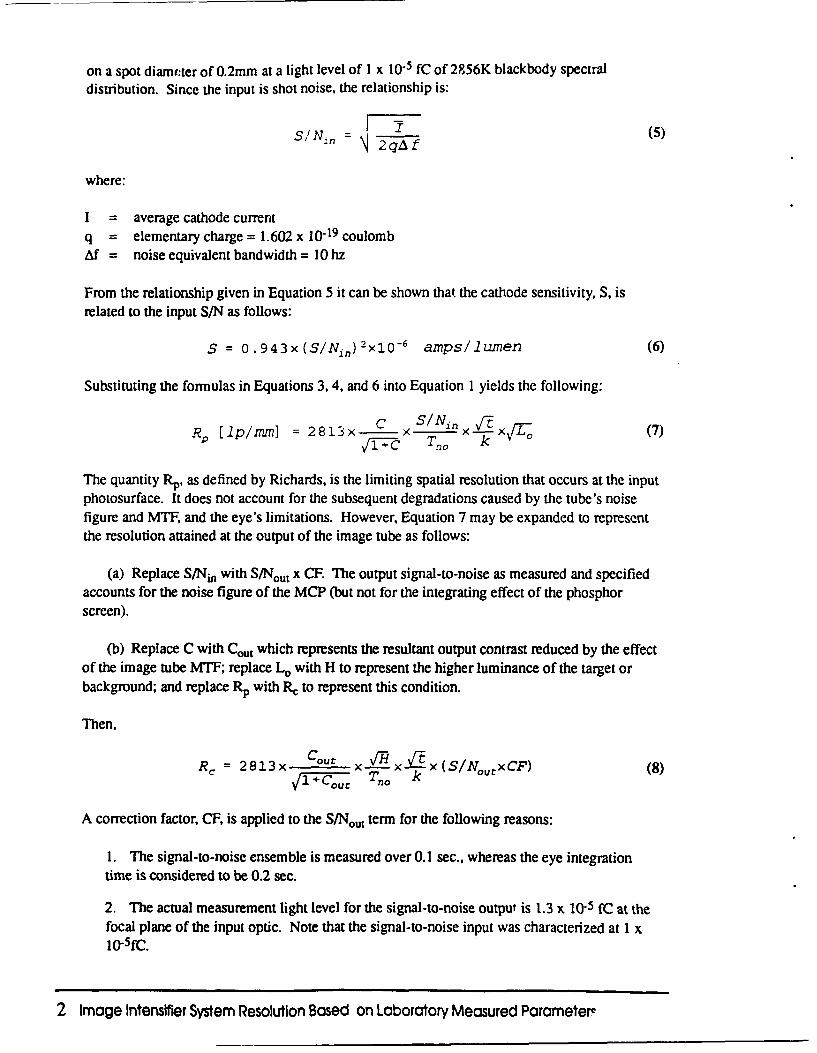
on a spot diam(,ter of 0.2mm at a light level of I x 10-5 fC of 2856K blackbody spectraldistribution. Since the input is shot noise, the relationship is:
_/_;__F __ (5)S/Nn = 2qAf
where:
I = average cathode currentq = elementary charge = 1.602 x 10⁻¹⁹ coulombAf = noise equivalent bandwidth = 10hz
From the relationship given in Equation 5 it can be shown that the cathode sensitivity, S. isrelated to the input S/N as follows:
S = 0.943x(S/Nin ) 2 X1O- 6 amps/lumen (6)
Substituting the formulas in Equations 3, 4. and 6 into Equation I yields the following:
___ / 1 (7)R. tip/ram] =28123x C x x
The quantity RP, as defined by Richards, is the limiting spatial resolution that occurs at the inputphotosurface. It does not account for the subsequent degradations caused by the tube's noisefigure and MTF, and the eye's limitations. However, Equation 7 may be expanded to representthe resolution attained at the output of the image tube as follows:
(a) Replace S/Nin with S/Nout x CF. The output signal-to-noise as measured and specifiedaccounts for the noise figure of the MCP (but not for the integrating effect of the phosphorscreen).
(b) Replace C with Cut which represents the resultant output contrast reduced by the effectof the image tube MTF; replace Lo with H to represent the higher luminance of the target orbackground; and replace Rp with Rc to represent this condition.
Then,
CTut x• (S/N0 utxCF) (8)RC = 2813x x-- _ x SNtCF(8T ko
A correction factor, CF, is applied to the S/Nout term for the following reasons:
1. The signal-to-noise ensemble is measured over 0.1 sec., whereas the eye integrationtime is considered to be 0.2 sec.
2. The actual measurement light level for the signal-to-noise output is 1.3 x 10⁻⁵ fC at thefocal plane of the input optic. Note that the signal-to-noise input was characterized at I x10-5fC.
2 Image Intensifier System Resolution Based on Laboratory Measured Parametere
3. It will be assumed that the resolving area of interest is a square pixel for the target andfor the background dictated by the minimum line width imaged at the cathode. Therefore,since the signal-to-noise is measured with a 0.2mm diameter Spot, the equivalent squarepixel (0.2mm x 0.2mm) would have its signal-to-noise increased by (4/7r)12.
4. Since the signal-to-noise measure removes the integrating effect of the phosphorscreen, its effect must be introduced in order to represent the actual S/N seen by the eye.This quantity is a function of the phosphor type only and has been termed the K-factor(Kf).
Applying these effects together, the correction factor for the measured signal-to-noise is:
CF -0.2 sec 1X10⁻⁵ - X 4 f (9)0. 1 sec \1.3X10⁻⁵ N I
Therefore, CF= 1.4 x Kf where Kf = 1.24 for RCA 1052 phosphor,1.19 for P-20 phosphor, and1.3 for P1/P39 phosphor
Assuming that the threshold signal-to-noise (k) equals 2.0 for 50% probability of detection, thatthe integrating time for the eye (t) is 0.2 sec, and substituting Equation 9 into Equation 8 yieldsthe following:
R =88X Coo xvý SINo x K. (10)Rc= 88!x • x- xS/ KV/f TCouc_ Trio
The solution for output ;esolution as presented in Equation 10 would be difficult to computesince the output contrast is a function of the resolution itself. However, the equation may berearranged with a solution for the high light level input, H, as follows:
H RcTn 2 I+ C( 01 (11)881 S/Nout KJ t
Equation 1I provides an approximate solution for the resolution provided by unity magnificationsystems since EBI is assumed to be zero and the implication of gain and the effects of the eyehave not yet been introduced.
Thus far the signal-to-noise term in the equations has been defined as being measured over a0.2mm spot diameter. It has been determined that it would be more appropriate to define thesignal-to-noise over a constant angular input rather than a linear spot size on the photocathode.Since the measure of S/N01 t is done with an objective having an EFL of 26.8mm, the angularinput is 0.2/26.8 radians. Therefore, system input optics having their effective focal length equalto EFLi would result in a spot diameter equal to 0.2 x EFLi/26.8mm. Since signal-to-noise variesdirectly with the spot diameter, the system signal-to-noise (S/N) would equal the measuredsignal-to-noise times EFLi/26.8:
S/N EFL2 (12)
SINs Sl 26.8
Image Intensifier System Resolution Based on Laboratory Measured Parameters 3
Replacing S/N,,t in Equation I I with SINs in Equation 12 yields:
8 26.8 x RKT). 1 + (13)S=881 x, EF-L->, xSINOut x Kf c (3
EBI Contribution
The effect of EBI will now be introduced. Since EBI is defined as the equivalent background(Lumen/cm2) at the input to the photocathode (at 21 degrees centigrade), the equivalentbrightness (fL) at the target (e) would be as follows:
e 29[ x 4tx x EBI x 2 (T- 21)/TI (14)
where T = ambient temperature (QC)T, = temperature coefficient = 3TC for 2nd Gen
= 4°C for 3rd Gen
EBI effectively reduces the target contrast. Recall from Equation 2 the definition of targetcontrasL The image tube's EBI will incur a reduction of that contrast as follows:
Ce H -L (15)
H+L +2e
or equivalently:
Ce HC (16)H4+ ee(I + C)
The Cout term in Equation 13 is equal to the effective target contrast at the photocathode (Ce)times the contrast transfer of the image tube (Cm). Substituting this for Cout and letting K2 equalthe first term of Equation 13 results in:
H = K 2 +CC (17)(¢cC,) 2
where H = the higher luminance level of either target or background.
Substituting Equation 16 into Equation 17, and reducing the equation yields the following:
H3 H2 K2 (1 +CCm) K2e(l + C) (2 + CCM) + K 2e 2 (I + C)2 (18)(CCV.) 2 (CCM) 2 (CC,) 2
where K = 26.8 x Rc x Tno/(881 x EFLi x S/Nou, x Kf)
4 Image Intensifier System Resolution Based on Laboratory Measured Parameters
The solution of the cubic Equation 18 for H gives the high light luminance level required toresolve a target having RC lp/mm at the photocathode image plane. The system's angularresolution at the input (Ri [cy/mr]) is:
R EL (19)"- 1000
The angular resolution presented to the eye (Rs [cy/mr]) is:
= RC x EFLi (20)1000 x M
where M is the system magnification.
The light level as seen by the eye is approximately the gain of the system (G. [tL/fL]) times H.
MTF Contribution
Attention will now be turned to the contribution of MTF implied by the Cm term in Equations17 and 18. Cm is a function of the modulation transfer function (MTF) of the intensifier tube andthe spatial shape of the target, assumed to be on a uniform background. Spatial shapes ofprimary interest are periodic square waves, tri-bar targets, and singular bar targets.
Periodic Square Wave Analysis
The simplest spatial shape to analyze is the periodic square wave (amplitude = 1) since it isanalytically described by its Fourier components in the double-sided frequency domain:
F(nf) - 1 sin(nit/2) (21)
2 rnr/2
where F(O) = 1/2, and n = nth component at ±nf.
Given a periodic input spatial frequency of f lp/mm at i00% contrast at the input of an imagetube whose MTF is defined as MTF(f), the resultant output high level, HIP(f), and the output lowlevel Ly(f) will be:
H(f) =-1 + 2 MTF(nf) 1 sin(nrn/2) (22)2 n L2 n/2
L (f) 2 E MTF(nf) 1 sin(nn/2) (23)P 2 n 2 nT / 2
Image Intensifier System Resolution Based on Laboratory Measured Parameters 5
The resultant output image contrast, designated as the contrast transfer function CTF(f), will be:
H H(f) - LP(f) sin(=n/2)
CTF(f) = _______ f__) = 2 MTF(nf) (24)F,(f) + Lpf r. nn1/2
where CTF(0) = 1, and n = nt component at nf.
In analytical form Equation 24 can be expressed as follows:
CTF(f) = 4 fTF(f) _ MTF(3f) MfTF(5f) MTF(if) (7 (25)3 7
The output image contrast can now be expressed for the periodic square wave spatial inputcondition whereby the Cm term in Equation 18 is simply equal to CTF(RC), where f=Rc inEquation 25.
Singular Positive Bc Target Analysis
Singular bar targets are described in the frequency domain by the Fourier integral. Let = thepositive pulse width (mm) with unity amplitude, and f = the spatial frequency components(cy/mm). Then the Fourier transform of the single pulse is:
F(f) = ? sin(ltfl) (26)
Given a single pulse of width 'T mm, amplitude = +1 at 100% contrast at the input of an imagetube whose MTF is defined as MTF(f), the resultant output high level, Hs(r), will be:
H5 (t) = fMTIr(f) 2r sin (n fr) df (27)nt f-t0
The output low level, Ls, will be zero. Although the contrast transfer under this condition isunity, the only effect is a reduction of the peak amplitude. Therefore, for the condition of a non-zero low level background, the output contrast can be determined as follows:
Let the input contrast, C, be defined as (H - L)/(H + L) as in Equation 2. Assuming a tube gainof unity, the output low level will be unchanged: ie, Lout = L. However the peak-to-peakamplitude of the pulse will be reduced by Hs(t):
Hout - Lout = (H - L) X H,('0 (28)
or, solving for Hour:
Hot = L + H,(T)x(H - L) (29)
6 Image Intensifier System Resolution Based on Laboratory Measured Parameters
Since the output contrast Cout is defined as (Hout-Lout)/(Hout+Lout), it can be shown that:
C Hs (T) (30)- 1 - c[1 - Hs (T)]
Therefore, for a singular high level pulse, the Cm term in Equation 18 is:
CmH 3 ( r) (31)1 - C[I - Hs(T)]
where Hs(c) is defined by Equation 27, and R, = 1/(2-0.
Singular Negative Bar Target Analysis
The analysis for a low level pulse condition is similar:
Let the input contrast, C, be defined as (H - L)/(H + L) as in Equation 2. Assuming a tube gainof unity, the output high level will be unchanged: ie, Hout = H. However the peak-to-peakamplitude of the pulse will be reduced by Hs('t):
H0 uC - Lout = (H - L) x H,(-r) (32)
or, solving for Lout:
Lout = H- H.('r) (H- L) (33)
Since the output contrast Cout is defined as (Hout-Lout)/(Hout+Lout), it can then be shown that:
= C H3 (-r) (34)I + C[D - Hs(.)]
Therefore, for a singular low level pulse, the Cm term in Equation 18 is:
C. HC -(- r) (35)c 1 + ÷c[I - Hs(T)]
where H,(-t) is defined by Equation 27, and Rc = l/(2,t).
Image Intensifier System Resolution Based on Laboratory Measured Parameters 7
Tri-Bar Target Analysis (white on black)
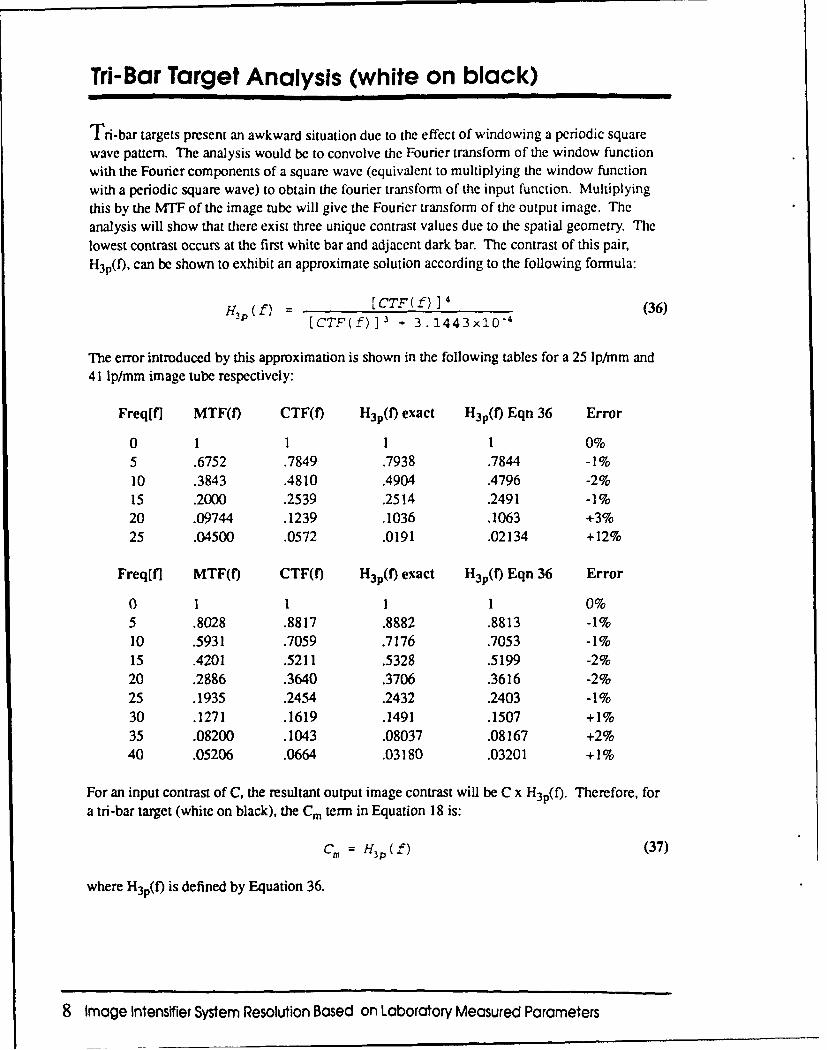
Tri-bar targets present an awkward situation due to the effect of windowing a periodic squarewave pattern. The analysis would be to convolve the Fourier transform of the window functionwith the Fourier components of a square wave (equivalent to multiplying the window functionwith a periodic square wave) to obtain the fourier transform of the input function. Multiplyingthis by the MTF of the image tube will give the Fourier transform of the output image. Theanalysis will show that there exist three unique contrast values due to the spatial geometry. Thelowest contrast occurs at the first white bar and adjacent dark bar. The contrast of this pair,H3p(f), can be shown to exhibit an approximate solution according to the following formula:
H3p (f) = [ CTF(f) ] 4(36)S(f [CTE(f)] 3 L 3. 1443xi0-4
The error introduced by this approximation is shown in the following tables for a 25 lp/mm and41 lp/mm image tube respectively:
Freqtf] MTF(f) CTF(f) H3 p(f) exact H3p(f) Eqn 36 Error
0 1 1 1 1 0%5 .6752 .7849 .7938 .7844 -1%10 .3843 .4810 .4904 .4796 -2%15 .2000 .2539 .2514 .2491 -1%20 .09744 .1239 .1036 .1063 +3%25 .04500 .0572 .0191 .02134 +12%
Freq[fl MTF(f) CTF(f) H3p(f) exact H3p(r) Eqn 36 Error
0 1 1 1 1 0%5 .8028 .8817 .8882 .8813 -1%10 .5931 .7059 .7176 .7053 -1%15 .4201 .5211 .5328 .5199 -2%20 .2886 .3640 .3706 .3616 -2%25 .1935 .2454 .2432 .2403 -1%30 .1271 .1619 .1491 .1507 +1%35 .08200 .1043 .08037 .08167 +2%40 .05206 .0664 .03180 .03201 +1%
For an input contrast of C, the resultant output image contrast will be C x H3p(f). Therefore, fora tri-bar target (white on black), the Cm term in Equation 18 is:
C, = H3p(f) (37)
where H3p(f) is defined by Equation 36.
8 Image Intensifier System Resolution Based on Laboratory Measured Parameters
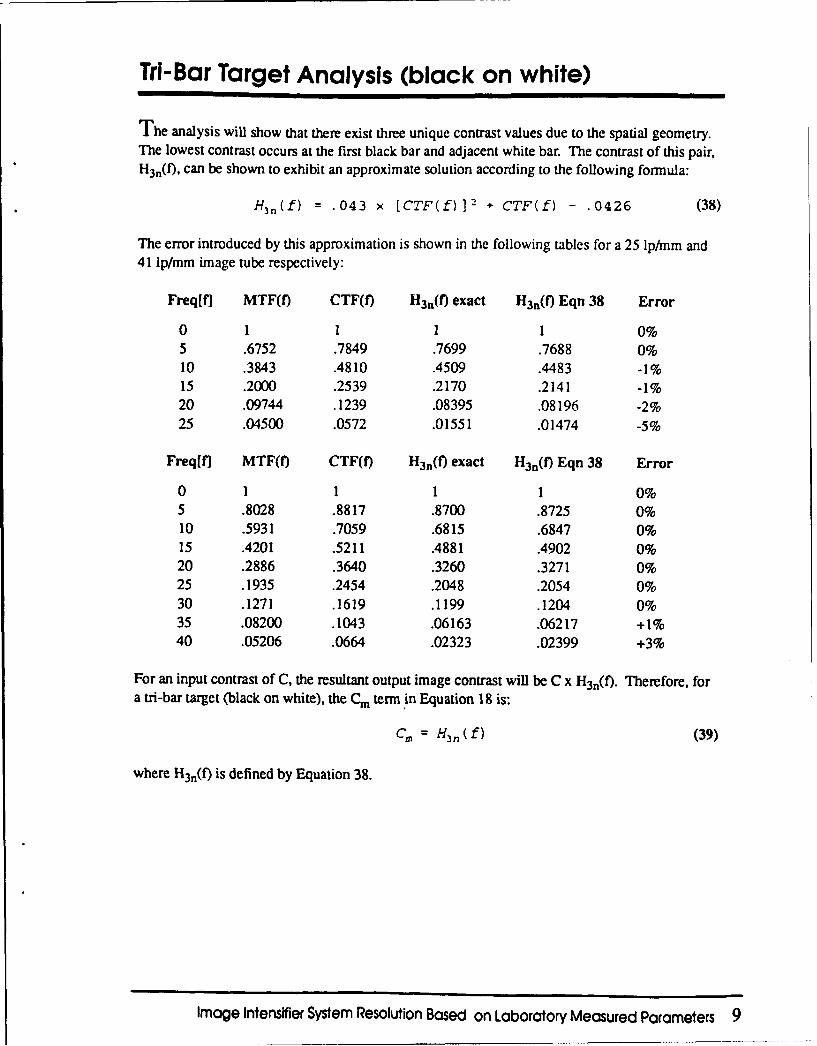
Tri-Bar Target Analysis (black on white)
The analysis will show that there exist three unique contrast values due to the spatial geometry.The lowest contrast occurs at the first black bar and adjacent white bar. The contrast of this pair,H3 (#), can be shown to exhibit an approximate solution according to the following formula:
H3n(f) = .043 x [CTF(f) 12 + CTF(f) - .0426 (38)
The error introduced by this approximation is shown in the following tables for a 25 Ip/rmm and41 lp/mm image tube respectively:
Freq[f] MTF(f) CTF(f) H3n(f) exact H3n(f) Eqn 38 Error
0 1 1 1 1 0%5 .6752 .7849 .7699 .7688 0%10 .3843 .4810 .4509 .4483 -1%15 .2000 .2539 .2170 .2141 -1%20 .09744 .1239 .08395 .08196 -2%25 .04500 .0572 .01551 .01474 -5%
Freq[f] MTF(f) CTF(f) H3a(f) exact H3a(f) Eqn 38 Error
0 1 1 1 1 0%5 .8028 .8817 .8700 .8725 0%10 .5931 .7059 .6815 .6847 0%15 .4201 .5211 .4881 .4902 0%20 .2886 .3640 .3260 .3271 0%25 .1935 .2454 .2048 .2054 0%30 .1271 .1619 .1199 .1204 0%35 .08200 .1043 .06163 .06217 +1%40 .05206 .0664 .02323 .02399 +3%
For an input contrast of C, the resultant output image contrast will be C x H3n(). Therefore, fora tri-bar target (black on white), the Cm term in Equation 18 is:
Cm = H3n (f) (39)
where H3 n(f) is defined by Equation 38.
Image Intensifier System Resolution Based on Laboratory Measured Parameters 9
Output Target Brightness
It is intuitively assumed that the output image brightness from an intensifier tube is the inputbrightness times the gain of the intensifier tube. However, the actual output brightness isdecreased by the effect of the image tube's MTF which incurs a reduction of the peak amplitudeof the input by spreading the incident irradiance across the output. For example, refer toEquation 22 which relates the high level output for a periodic square wave input. For lowfrequencies where the MTF is near unity, the output high level is also unity (assuming an imagetube gain of unity). However, for higher spatial frequencies where the MTF approaches zero, theoutput peak amplitude approaches 1/2.
Computing the output brightness of an image tube is necessary to quantify the brightness levelperceived by the eye in completing this model. The effect of the eye resolution limit versusbrightness is discussed later.
The following discussion centers on the gain reduction factor (Gr) incurred by the image tubespreading the input flux of the image across the output. This quantity is uniquely established foreach of the five spatial shapes discussed previously. The high light output (where EBI = 0) willbe described according to the following:
H.uC = C x H1 (R,) x Gr(Rc) (40)
where:Hout = the high light output at Rc lp/mm, (fL)G = the gain of the image intensifier tube, (fL/fC)Hi(Re) = he high light input at Rc lp/mm, (fC)Gr(Rc) = the gain reduction factor
Periodic Square Wave Gain Reduction
Given that for a unity gain condition, the average (DC component) input light level equals theaverage output light level, it can be shown that:
Hout =H+L -Lout (41)
where H and L refer to the high and low input respectively. The low input and low output can beexpressed in terms of high input and high output as follows:
L = 1 (42)
and
Lout ~ -.U C X CTF(RC) (3LOLt = H~e1 + C x CTF(RC) (43)
10 Image Intensifier System Resolution Based on Laboratory Measured Parameters
Substituting Equations 42 and 43 into 41, and solving for Hout yields the following:
1 + C x CTF(RC) (44)
H -o C
Therefore,
G,(R.) = 1 + C x CTF(R.) (45)
Singular Positive Bar Target Gain Reduction
The gain reduction for this input condition can be derived from Equation 29 by substituting thefollowing quantity for L:
L H(1(46)
Solving Equation 29 with this substitution for Hout yields:
1 - C - 2C Hs(T)Hour H x (47)
Therefore,
G,(Rc) = 1 - C + 2C H,('r) (48)1 +C
Singular Negative Bar Target Gain Reduction
Since the peak amplitude for this input condition is spatially constant, there is no reduction inthe gain. Therefore, the gain reduction factor, Gr(Rc) is simply unity.
Tri-Bar Target (white on Black) Gain Reduction
Because of the complexity in determining the high level of the lower contrast pair of lines in thisgeometry, an approximation for the gain reduction will be used. For the condition of 100%contrast input, the approximation for the gain reduction is:
G. CTF (R,) (49)G 2.45 1.69
Image Intensifier System Resolution Based on Laboratory Measured Parameters 11
For an input contrast condition less than 100% where the low light input is greater than zero,
HouC = L + (H L) xG-. (50)
where:
L = H 1 C (51)1 -C
Substituting Equations 49 and 51 into 50 and reducing yields:
1 + C [1. 1834CTF(R,) -. 18371HoUC =ý H x 1 C (52)
Therefore,
Gr(Rc) I + C [!.1834CTF(Rc) -. 1837) (53)1 -C
Tri-Bar Target (black on white) Gain Reduction
Because of the complexity in determining the high level of the lower contrast pair of lines in thisgeometry, an approximation for the gain reduction will be used. For the condition of 100%contrast input, the approximation for the gain reduction is:
= 1 CTF(Rd) (54)1.8 2.25
For an input contrast condition less than 100% where the low light input is greater than zero,
Hout= " L+ (H- L) xGr 2 (55)
where:
L=H -C (56)1 + C (6
Substituting Equations 54 and 56 into 55 and reducing yields:
1 + C [.88889CTF(Rc) +.11111]Ho0 € H x (57)
Therefore,
G,(R,) = 1 + C [.88889CTF(R,) +.11111] (58)1+C
1 2 Image Intensifier System Resolution Based on Laboratory Measuredl Parameters
This reduction in apparent gain occurs only with the two high peaks between the black bars. Thiseffect is discussed here for analytical purposes and to inform the reader that it was not neglectedin developing the model. However, it is assumed that the gain reduction of this pair of lines is notthe predominant factor in establishing the brightness to the eye; rather it is assumed that thebrightness to the eye is determined by the background brightness of this target type, and not thebrightness of the bars. Therefore, for this condition Gr(R€) is unity since there is no effect of gainreduction on the background level of brightness.
Total System Performance
The modeling equations thus far provide a means to characterize the performance of theintensifier system alone. They do not account for the limitations imposed by coupling a detector,such as the human eye (direct view) or a CCD camera (remote view), to the intensified output.The model thus far, however, may serve as an indicator of relative performance which willpredict the limiting performance that can be attained by the intensifier system itself. Thediscussion which follows will consider the direct view mode of the intensifier system in whichthe effects of human eye perception will be integrated for completing the performance model ofthe complete image intensifier system.
Human Eye Performance Limitation
The performance characteristics of the human eye are a very complex subject which hasundergone a wide variety of studies for many years. It is unfortunate for the purpose of modelingthat the eye is not a constant among individuals. The limiting resolution of the eye is verydynamic and varies with brightness, contrast, dark adaptation time, flicker rate, viewing time,color content, target movement, clutter, spatial and temporal noise, axial location of the targetrelative to the axis of the eye, and many other physiological conditions. Therefore, it should notbe surprising that deviations from the model results may occur since this model considers only anaverage set of characteristics for the eyes. For the purpose of modeling the image intensifiersystem, the following conditions will apply:
"* The target viewed is on the optical axis with the eye's fovea."* The target is stationary."* The target is not irradiated with a pulsed light source.
The primary eye parameters which affect performance are its MTF and sensitivity. IanOverington3 presents MTF of the refraction optics of the eye, MTFo, which is prepared from datain Campbell and Gubisch. 4 The MTF of the optics varies with the eye's pupil diameter and maybe approximated according to the following:
M TF, 0 r (59)
where, fr = the spatial frequency (cy/mm) on the retina
Image Intensifier System Resolution Based on Laboratory Measured Parameters 13
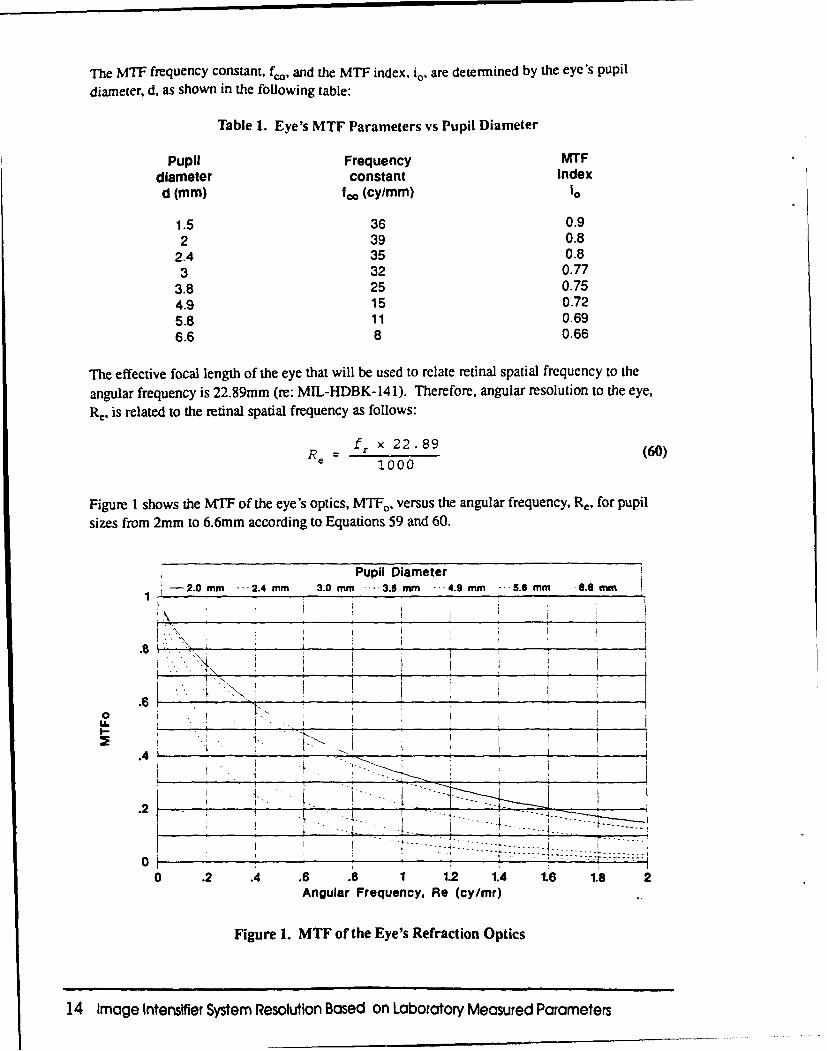
The MTF frequency constant, fco, and the MTF index, i.. are determined by the eye's pupil
diameter, d, as shown in the following table:
Table 1. Eye's MTF Parameters vs Pupil Diameter
Pupil Frequency MTFdiameter constant indexd (mm) lto (cy/mm) 10
1.5 36 0.92 39 0.8
2.4 35 0.83 32 0.77
3.8 25 0.754.9 15 0.725.8 11 0.696.6 8 0.66
The effective focal length of the eye that will be used to relate retinal spatial frequency to the
angular frequency is 22.89mm (re: MIL-HDBK-141). Therefore, angular resolution to the eye,
Re, is related to the retinal spatial frequency as follows:
fR x 22.89 (60)Re = (60)1.000
Figure 1 shows the MTF of the eye's optics, MTFo, versus the angular frequency, Re, for pupil
sizes from 2mm to 6.6mm according to Equations 59 and 60.
Pupil Diameter-2.0 mm --- 2.4 mm 3.0 mm -- 3.0mm 4.9 mm --- 5.8 mm 6.0 mm
1A.
.62 -0 J i I I
I.- _ _ _ _ _. .. . ..- . .. . . _. .. .. .
0 . ........ . .I ~... .
0 .2 .4 .6 .8 1 1.2 1.4 1.6 18 2Angular Frequency, Re (cy/mr)
Figure 1. MTF or the Eye's Refraction Optics
14 Image Intensifier System Resolution Based on Laboratory Measured Parameters
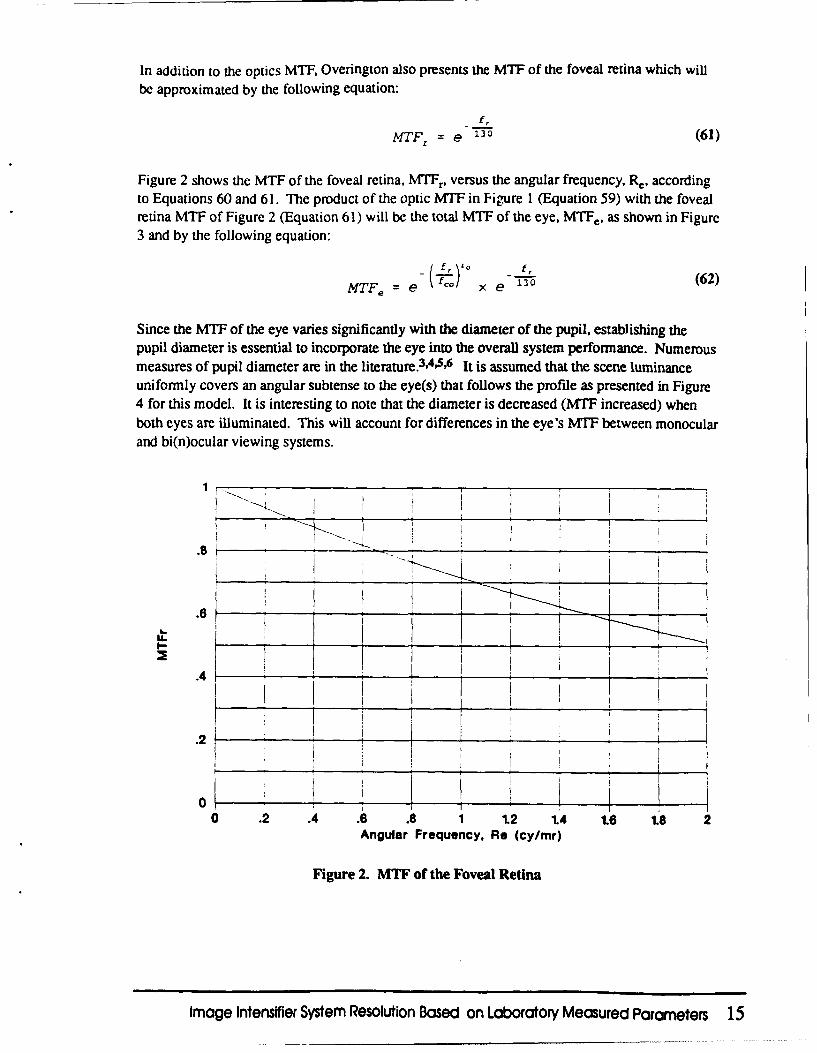
In addition to the optics MTF, Overington also presents the MTF of the foveal retina which willbe approximated by the following equation:
MTFZ = e 130 (61)
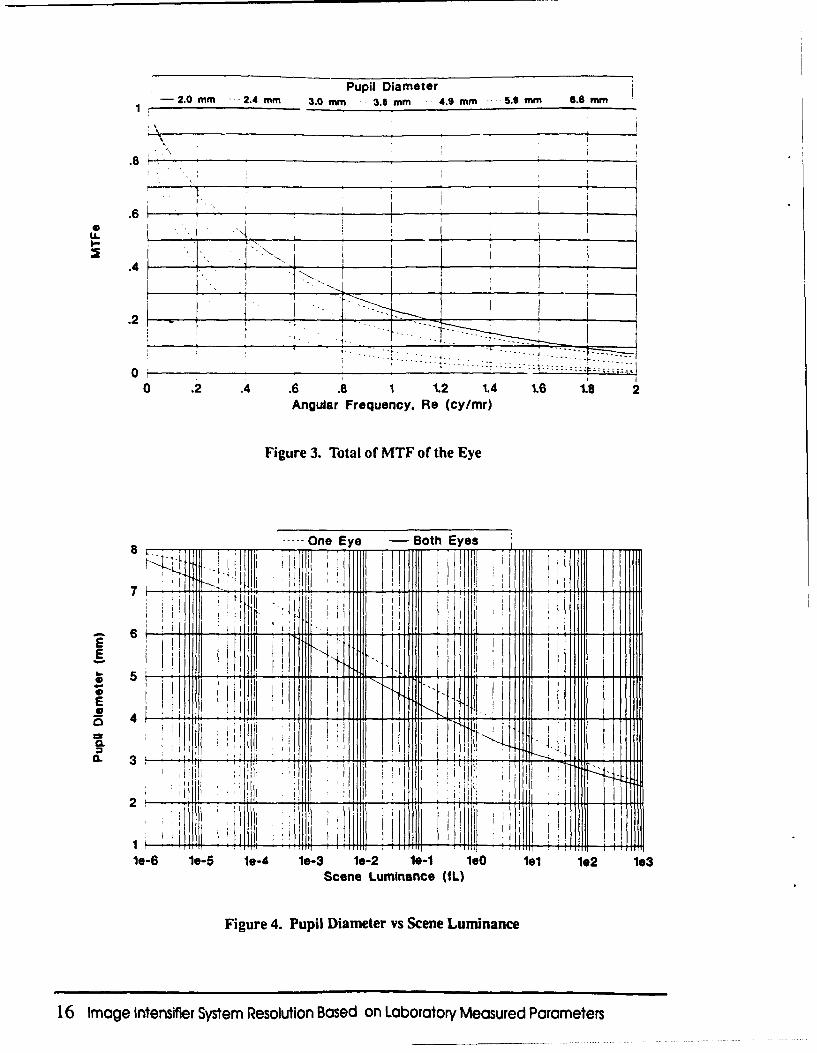
Figure 2 shows the MTF of the foveal retina, MTFr, versus the angular frequency, Re, accordingto Equations 60 and 61. The product of the optic MTF in Figure 1 (Equation 59) with the fovealretina MTF of Figure 2 (Equation 61) will be the total MTF of the eye, MTFe, as shown in Figure3 and by the following equation:
130 = (62)iMTF. = e- × e
Since the MTF of the eye varies significantly with the diameter of the pupil, establishing thepupil diameter is essential to incorporate the eye into the overall system performance. Numerousmeasures of pupil diameter are in the literature.3,4,', 6 It is assumed that the scene luminanceuniformly covers an angular subtense to the eye(s) that follows the profile as presented in Figure4 for this model. It is interesting to note that the diameter is decreased (MTF increased) whenboth eyes are illuminated. This will account for differences in the eye's MITF between monocularand bi(n)ocular viewing systems.
* I I !
h. _ _ _ _ 1 _ _ _ _ __
.4_ _ _ _ II 1
.2 . _ _ ._ 1 1.4 1 1012 . 6 . . . 1. _ .8_
Angular Frequency, Re (cy/mr)
Figure 2. MTF of the Foveal Retina
Image Intensifier System Resolution Based on Laboratory Measured Parameters 15
Pupil Diameteor 49m .-2.0 MM ---2.4 mm 3.0m fr-n3.5 mm 4.m 5.m 6.m
.8
.61
0
Angla Freuecy Re_ ____m
6__ Ir
I ff
IL 3
0e- .2- .e4 1.6 18 12 1 4- 1.6le 1e8 19Angula FreueinncyRe (ylmr)
Figr4 urel 3.aTotal o s MTFcente Eyennc
16ImgeItesiiryse Resluton Eysed on Lbortor EyeasurdPrmtr
It will be assumed that the eye's signal-to-noise is 5.0 as quantified by the same methodology inmeasuring that of image intensifier tubes: 0.2mm spot diameter at 10-5 fC of 2856K blackbodydistribution over a 10hz noise equivalent bandwidth.
If the intensifier model as derived earlier is valid, then it should also be valid for determining theresolution of the eye. Assumina that the eye ha- a negligible dark level (ie, EBI = 0), anappropriate starting point to generate the eye p- xirmance model is with Equation 13, repeatedhere for reference:
H 26.8 x RcT°x 1 + COUC (63)1,881 x EFLI x SN.CX Kj2) C0U
Some of the eye's parameters can readily be recognized:
EFLi = 22.89 mmTno = EFL/d = 22.89/d
It is valid to let the T-number equal the F-number by attributing the loss of the opticstransmittance to the loss in sensitivity or signal-to-noise at the retina. Since an intensifier systemincreases the brighmess to the eye by its gain, Gs, the resultant signal-to-noise of the eye underthis condition will be increased by the square root of G,. Therefore,
SINOut = S/Ne x Gst/2, where S/Ne = 5.0
In addition to these substitutions, the K-factor, Kf, would have to be unity since all signal-to-noise measures are characterized over the same noise equivalent bandwidth of the eye: 10hz.The Re term in Equation 63 relates to the spatial frequency at the fovea, fr, whereas the originaldefinition of Rc was the spatial frequency at the cathode image plane of the intensifier tube.Therefore, replacing Rc with fr, and referencing the retinal spatial frequency to the cathode planeyields the following:
fr - EFL: RC (64)22.89 M
The Cout term in Equation 63 relates to the resultant contrast at the fovea. This may be computedby combining (multiplying) the image tube MTF with that of the eye in Equations 22 to 25, 27 to31, and 32 to 35. Tri-bar target contrast transfer is best approximated by using the CTF(Equation 25) as follows:
SC [TF (_f)HTF.(f,) - F(3f) MTF.(3f r) MTF(5f) MTFe(5fr) ... 1(65)C[- -- - 3 5 .
where,C = the target's contrast
MTF(f) = the MTF of the intensifier tube (may also include that of the intensifiersystem optics)
MTF,(f,) = the MTF of the eye where fr = EFL fI/(22.89 M)
Image Intensifier System Resolution Based on Laboratory Measured Parameters 17
Expressing Equation 65 in an abbreviated format,
COUL = C x ( Cm X Ceye I
With these substitutions Equation 63 can now be reformulated for the eye as follows:
H 8 26.8 x EFL, x R_ 2 1 + C {C, Co (6)8B 8 x 22.-89 x s/1 N x x M x d mC C', cL.,,.}
where He is the required higher luminance level of either target or background amplified inbrightness by Gs for the eye to resolve R, lp/mm as referenced to the intensifier's cathode.
Equation 66 theoretically would represent a complete model for aided vision in which theintensifier system provides only a brightness gain to the eye; the intensifier tube's EBI would bezero, and its signal-to-noise would be infinite. However, because these intensifier parameters arefinite, the required target brightness would have to be greater than He. Recall that the intensifiersystem's high light level solution was represented by Equation 17 and is repeated here forreference:
H, K 2 x - (67)( c.9cM) 2
where the subscript "s" now refers to the intensifier system parameters to distinguish them fromthose of the eye. The resultant direct view model solution for the high light level, H, would bethe sum of H. (Equation 67) and He (Equation 66):
H =K XI CC + K2 x 1 I ye (68)(CCm) 2 (C. { CJC.y.) 2
where,
26.8 x RaT1o (69)881 x EFL1 x SIN... x Kf
26.8 x EFL, x R.881 x 22.89 x S/N, x V x Mxd (70)
and according to Equation 16,
HCH + e(1 + C) (71)
Recall that C, accounts for the effective reduction in target contrast due to the image tube's EBI(see Equation 14), and must now replace the C term in Equation 66. The effort taken to provide aclosed solution for H (see Equation 18) is possible here with the exception of having to iterate theresults that determine the eye's pupil diameter, and subsequently the eye's MTF. SubstitutingEquation 71 into Equation 68 may be reduced to the following form:
18 Image Intensifier System Resolution Based on Laboratory Measured Parameters
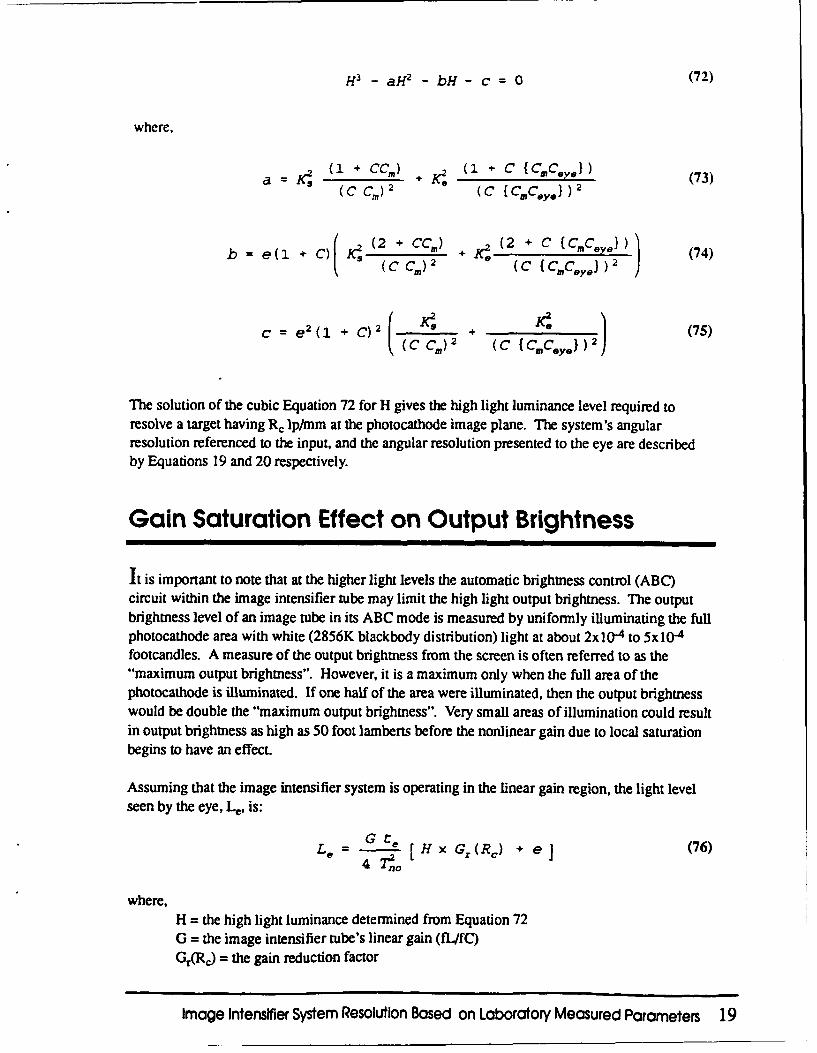
H 3 - aH2 - bH- c = 0 (72)
where,
a (i CC,) 2 K" (1 C [ CmCey.1) (73)( c .) ( { .c,. l} ) 2
b el +C)[K2s (2 + CCm) 2(2 + C [{CICe),O)=C) + K .... (74)1( eec cm) 2 (c{ccy})
(C C,) 2(C ( CmC.. ))2
c =L 2(1 + C)(2 2 )2 I (7S)(C Cm) (C [ COCgy.} )2
The solution of the cubic Equation 72 for H gives the high light luminance level required toresolve a target having Rc lp/mm at the photocathode image plane. The system's angularresolution referenced to the input, and the angular resolution presented to the eye are describedby Equations 19 and 20 respectively.
Gain Saturation Effect on Output Brightness
It is important to note that at the higher light levels the automatic brightness control (ABC)circuit within the image intensifier tube may limit the high light output brightness. The outputbrightness level of an image tube in its ABC mode is measured by uniformly illuminating the fullphotocathode area with white (2856K blackbody distribution) light at about 2x 10⁻⁴ to 5x 10⁻⁴footcandles. A measure of the output brightness from the screen is often referred to as the"maximum output brightness". However, it is a maximum only when the full area of thephotocathode is illuminated. If one half of the area were illuminated, then the output brightnesswould be double the "maximum output brightness". Very small areas of illumination could resultin output brightness as high as 50 foot lambens before the nonlinear gain due to local saturationbegins to have an effect.
Assuming that the image intensifier system is operating in the linear gain region, the light levelseen by the eye, Le, is:
Le = [ H x G,(R,) + e (76)4 7o
where,H = the high light luminance determined from Equation 72G = the image intensifier tube's linear gain (fL/fC)Gr(Rc) = the gain reduction factor
Image Intensifier System Resolution Based on Laboratory Measured Parameters 19
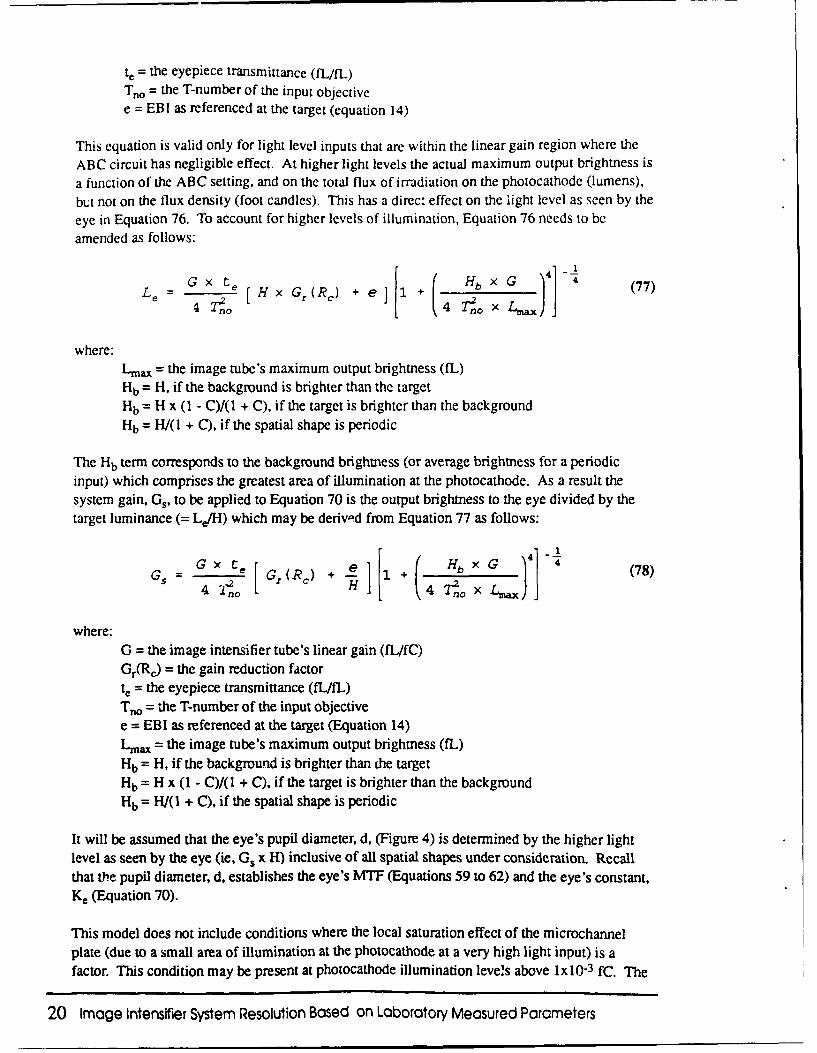
te = the eyepiece transmittance (fL/fL)Tno = the T-number of the input objectivee = EBI as referenced at the target (equation 14)
This equation is valid only for light level inputs that are within the linear gain region where theABC circuit has negligible effect. At higher light levels the actual maximum output brightness is
a function of the ABC setting, and on the total flux of irradiation on the photocathode (lumens),
but not on the flux density (foot candles). This has a direct effect on the light level as seen by the
eye in Equation 76. To account for higher levels of illumination, Equation 76 needs to be
amended as follows:
4 . .11
e -[ H x G (R e) 1 ] 1 + (7J
where:-Max = the image tube's maximum output brightness (fL)
Hb = H, if the background is brighter than the targetHb = H x (I - C)/(1 + C), if the target is brighter than the backgroundHb = H/(I + C), if the spatial shape is periodic
The Hb term corresponds to the background brightness (or average brightness for a periodicinput) which comprises the greatest area of illumination at the photocathode. As a result thesystem gain, G., to be applied to Equation 70 is the output brightness to the eye divided by thetarget luminance (= LI/H) which may be derived from Equation 77 as follows:
G G x t e G, (R,) + + -HbxG (78)2no 74 x Lio X
where:G = the image intensifier tube's linear gain (fL/fC)Gr(Rd) = the gain reduction factorte = the eyepiece transmittance (fL/fL)T1o = the T-number of the input objectivee = EBI as referenced at the target (Equation 14)LMax = the image tube's maximum output brightness (fL)Hb = H, if the background is brighter than the targetHb = H x (I - C)/(I + C). if the target is brighter than the backgroundHb = H/(1 + C), if the spatial shape is periodic
It will be assumed that the eye's pupil diameter, d, (Figure 4) is determined by the higher lightlevel as seen by the eye (ie, G. x H) inclusive of all spatial shapes under consideration. Recall
that the pupil diameter, d, establishes the eye's MTF (Equations 59 to 62) and the eye's constant,Ke (Equation 70).
This model does not include conditions where the local saturation effect of the microchannelplate (due to a small area of illumination at the photocathode at a very high light input) is afactor. This condition may be present at photocathode illumination levels above lx 10-3 fC. The
20 Image Intensifier System Resolution Based on Laboratory Measured Parameters
effect of local saturation is that it not only limits output brightness to a greater degree thanexpressed in Equation 78, but it also reduces the image contrast at the tube's output -- i.e., theimage tube's MTF degrades under this condition.
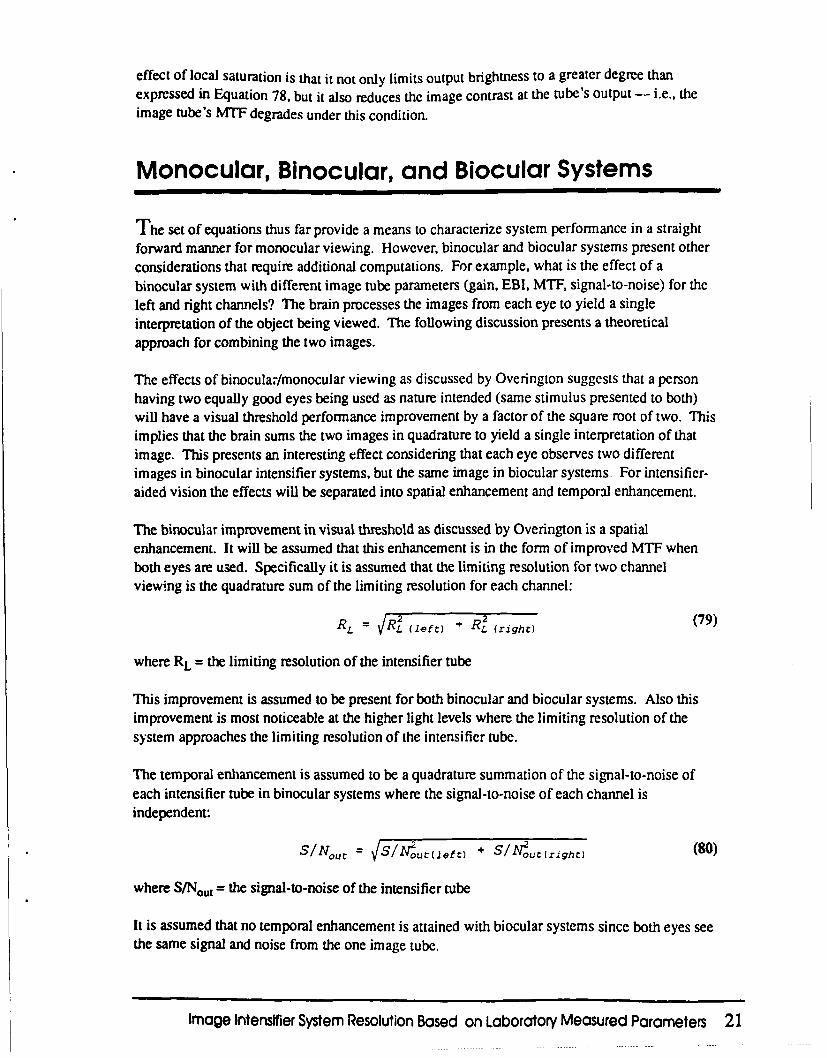
Monocular, Binocular, and Biocular Systems
The set of equations thus far provide a means to characterize system performance in a straightforward manner for monocular viewing. However, binocular and biocular systems present otherconsiderations that require additional computations. For example, what is the effect of abinocular system with different image tube parameters (gain, EBI, MTF, signal-to-noise) for theleft and right channels? The brain processes the images from each eye to yield a singleinterpretation of the object being viewed. The following discussion presents a theoreticalapproach for combining the two images.
The effects of binocular/monocular viewing as discussed by Overington suggests that a personhaving two equally good eyes being used as nature intended (same stimulus presented to both)will have a visual threshold performance improvement by a factor of the square root of two. Thisimplies that the brain sums the two images in quadrature to yield a single interpretation of thatimage. This presents an interesting effect considering that each eye observes two differentimages in binocular intensifier systems, but the same image in biocular systems. For intensifier-aided vision the effects will be separated into spatial enhancement and temporal enhancement.
The binocular improvement in visual threshold as discussed by Overington is a spatialenhancement. It will be assumed that this enhancement is in the form of improved MTF whenboth eyes are used. Specifically it is assumed that the limiting resolution for two channelviewing is the quadrature sum of the limiting resolution for each channel:
RL = R L efC)e• R) (righr) (79)
where RL = the limiting resolution of the intensifier tube
This improvement is assumed to be present for both binocular and biocular systems. Also thisimprovement is most noticeable at the higher light levels where the limiting resolution of thesystem approaches the limiting resolution of the intensifier tube.
The temporal enhancement is assumed to be a quadrature summation of the signal-to-noise ofeach intensifier tube in binocular systems where the signal-to-noise of each channel isindependent:
S/N0 ,t = VS/N7ozur(Jeft) "' S/Nout(right) (80)
where S/Nout = the signal-to-noise of the intensifier tube
It is assumed that no temporal enhancement is attained with biocular systems since both eyes seethe same signal and noise from the one image tube.
Image Intensifier System Resolution Based on Laboratory Measured Parameters 21
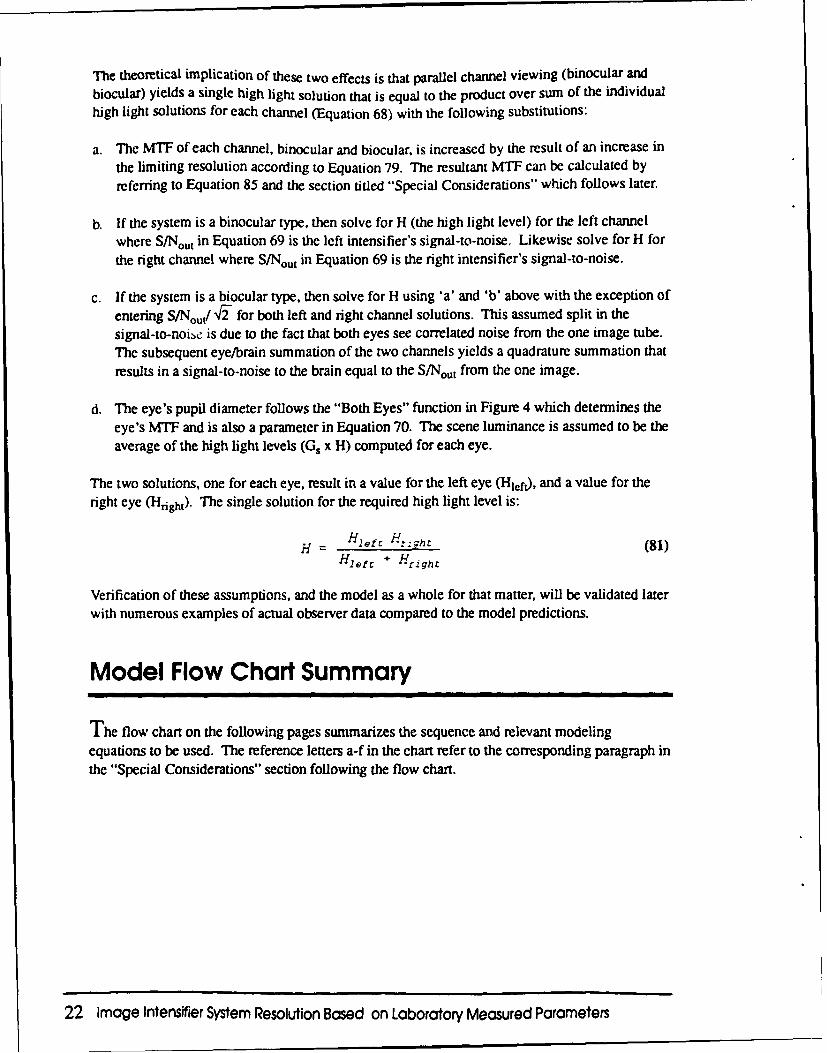
The theoretical implication of these two effects is that parallel channel viewing (binocular and
biocular) yields a single high light solution that is equal to the product over sum of the individualhigh light solutions for each channel (Equation 68) with the following substitutions:
a. The MTF of each channel, binocular and biocular, is increased by the result of an increase in
the limiting resolution according to Equation 79. The resultant MTF can be calculated byreferring to Equation 85 and the section titled "Special Considerations" which follows later.
b. If the system is a binocular type, then solve for H (the high light level) for the left channelwhere S/Nout in Equation 69 is the left intensifier's signal-to-noise, Likewise solve for H for
the right channel where S/Nout in Equation 69 is the right intensifier's signal-to-noise.
c. If the system is a biocular type, then solve for H using 'a' and 'b' above with the exception ofentering S/Nout/,F- for both left and right channel solutions. This assumed split in thesignal-to-nois, is due to the fact that both eyes see correlated noise from the one image tube.The subsequent eye/brain summation of the two channels yields a quadrature summation that
results in a signal-to-noise to the brain equal to the S/Nout from the one image.
d. The eye's pupil diameter follows the "Both Eyes" function in Figure 4 which determines theeye's MTF and is also a parameter in Equation 70. The scene luminance is assumed to be theaverage of the high light levels (Gs x H) computed for each eye.
The two solutions, one for each eye, result in a value for the left eye (Hleft), and a value for theright eye (Hright). The single solution for the required high light level is:
H = Yleft -rght (81)Hiett + Yrighc
Verification of these assumptions, and the model as a whole for that matter, will be validated laterwith numerous examples of actual observer data compared to the model predictions.
Model Flow Chart Summary
The flow chart on the following pages summarizes the sequence and relevant modelingequations to be used. The reference letters a-f in the chart refer to the corresponding paragraph inthe "Special Considerations" section following the flow chart.
22 Image Intensifier System Resolution Based on Laboratory Measured Parameters
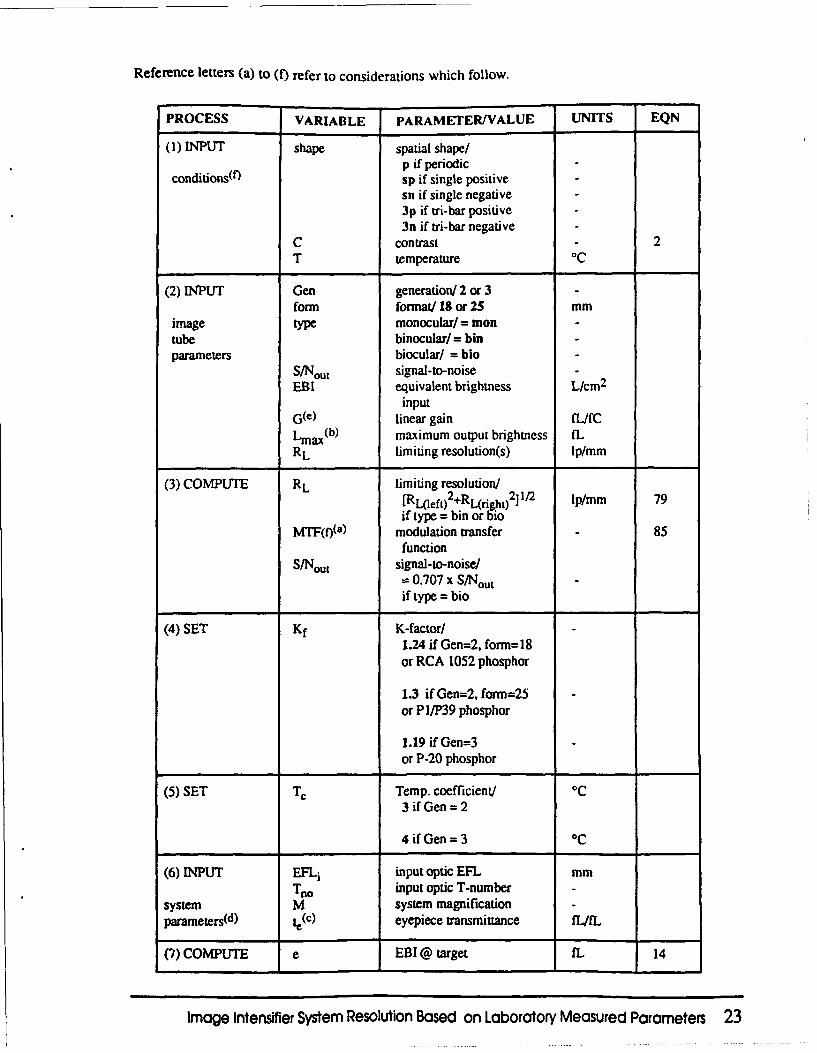
Reference letters (a) to (0 refer to considerations which follow.
PROCESS VARIABLE PARAMETER/VALUE UNITS EQN
(1) INPUT shape spatial shape/p if periodic
conditions(f) sp if single positivesn if single negative3p if tri-bar positive3n if tri-bar negative
C contrast 2T temperature oC
(2) INPUT Gen generation/ 2 or 3form format/18 or 25 mm
image type monocular/ = montube binocular/= binparameters biocular/ = bio
S/Nout signal-to-noiseEBI equivalent brightness L/cm2
input
G(e) linear gain fL/fCLmax(b) maximum output brightness fLRL limiting resolution(s) lp/mm
(3) COMPUTE RL limiting resolution/.L(l~eft) 2+RL(right) 2]1/ 2 lp/mm 79
if type = bin or bioMTF(f)(a) modulation transfer 85
functionS/Nout signal-to-noise/
S0.707 x S/Noutif type = bio
(4) SET Kf K-factor/1.24 if Gen=2, form=18or RCA 1052 phosphor
1.3 if Gen=2, form=25or P1/P39 phosphor
1.19 if Gen=3or P-20 phosphor
(5) SET TC Temp. coefficient/ 0C
3 if Gen = 2
4 if Gen = 3 c
(6) INPUT EFLi input optic EFL mmTro input optic T-number -
system M system magnification -
parameters(d) te(c) eyepiece transmittance fL/fL
(7) COMPUTE e EBI @ target fL 14
Image Intensifier System Resolution Based on Laboratory Measured Parameters 23
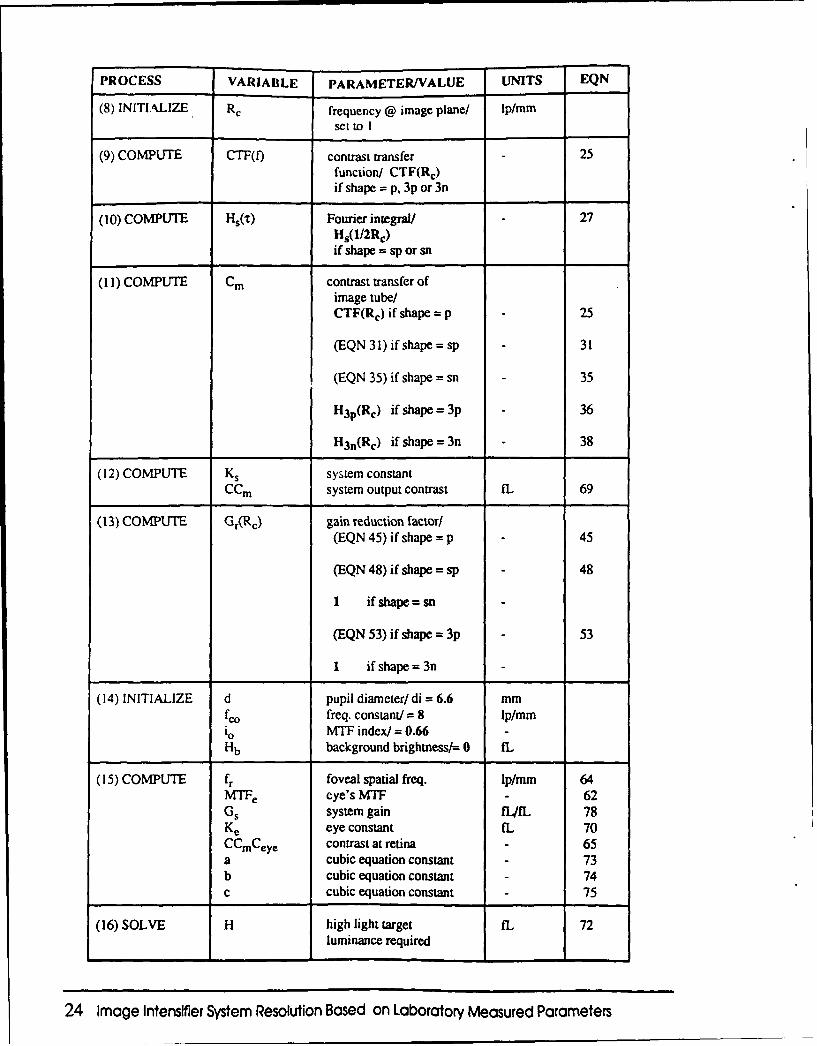
PROCESS VARIABLE PARAMETER/VALUE UNITS EQN
(8) INITI.kLIZE RC frequency @ image plane/ lp/mm
set to I
(9) COMPUTE CTF(f) contrast transfer 25
function/ CTF(Rc)if shape = p, 3p or 3n
(10) COMPUTE Hs(-t) Fourier integral/ 27Hs(1/2Rc)if shape = sp or sn
(II) COMPUTE Cm contrast transfer ofimage tube/CTF(Rc) if shape = p - 25
(EQN 31) if shape = sp - 31
(EQN 35) if shape = sn - 35
H3p(Rc) if shape = 3p 36
H3 n(Rc) if shape = 3n - 38
(12) COMPUTE Ks system constantCCm system output contrast fL 69
(13) COMPUTE Gr(Rc) gain reduction factor/(EQN 45) if shape = p - 45
(EQN 48) if shape = sp - 48
1 if shape = sn -
(EQN 53) if shape = 3p - 53
1 if shape = 3n -
(14) INITIALIZE d pupil diameter/di = 6.6 mmfco freq. constant/ = 8 Ip/mmio MTF index/ = 0.66 -
Hb background brightness/= 0 fL
(15) COMPUTE fr foveal spatial freq. lp/mm 64MTFe eye's MTF 62Gs system gain fL/fL 78Ke eye constant fL 70CCmCeye contrast at retina - 65a cubic equation constant - 73b cubic equation constant - 74c cubic equation constant - 75
(16) SOLVE H high light target tL 72luminance required
24 Image Intensifier System Resolution Based on Laboratory Measured Parameters
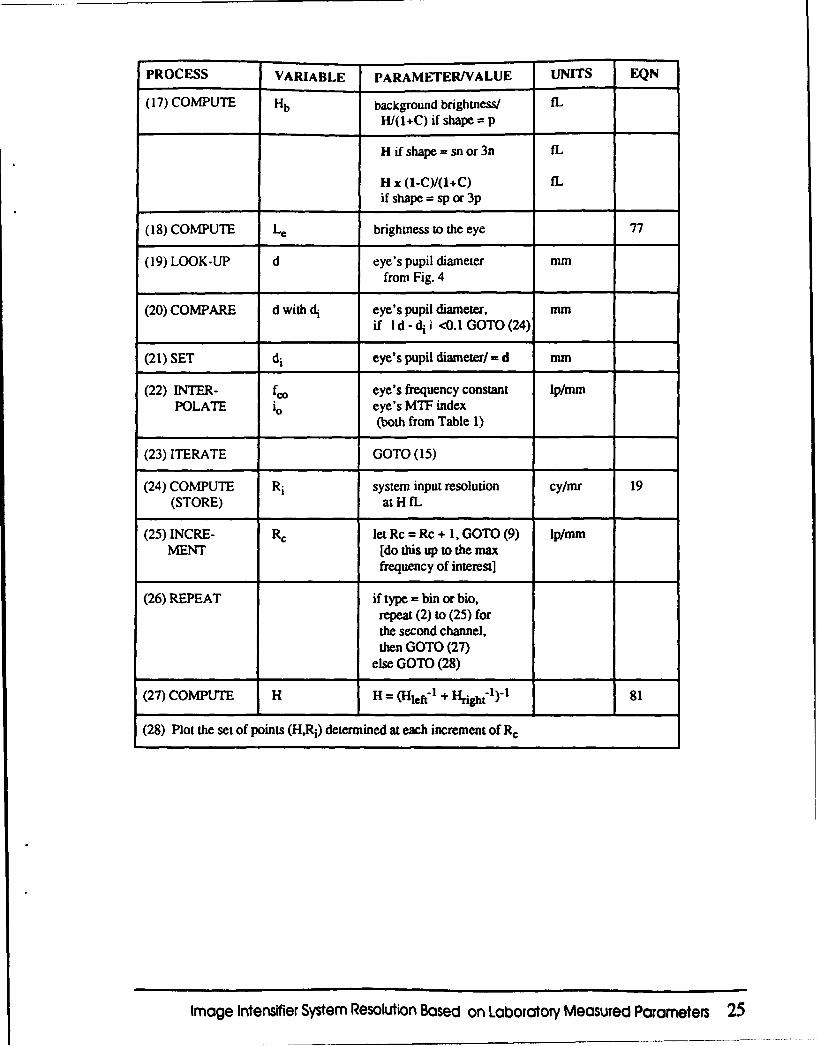
PROCESS VARIABLE PARAMETER/VALUE UNITS EQN
(17) COMPUTE Hb background brightness/ fLH/(I+C) if shape = p
"H if shape = sn or 3n fL
"H x (1-C)/(I+C) fLif shape = sp or 3p
(18) COMPUTE Le brightness to the eye 77
(19) LOOK-UP d eye's pupil diameter mmfrom Fig. 4
(20) COMPARE d with d, eye's pupil diameter, mmif I d - di i <0.1 GOTO (24)
(21) SET di eye's pupil diameter/ = d mm
(22) INTER- fco eye's frequency constant lp/mmPOLATE io eye's MTF index
(both from Table 1)
(23) ITERATE GOTO (15)
(24) COMPUTE Ri system input resolution cy/mr 19(STORE) at H -L
(25) INCRE- Rc let Rc = Rc + 1, GOTO (9) lp/mmMENT [do this up to the max
frequency of interest]
(26) REPEAT if type = bin or bio,repeat (2) to (25) forthe second channel,then GOTO (27)
else GOTO (28)
(27) COMPUTE H H = (Hile& 1 + H-ghtil)"1 81
(28) Plot the set of points (H,Ri) determined at each increment of Rc
Image Intensifier System Resolution Based on Laboratory Measured Parameters 25
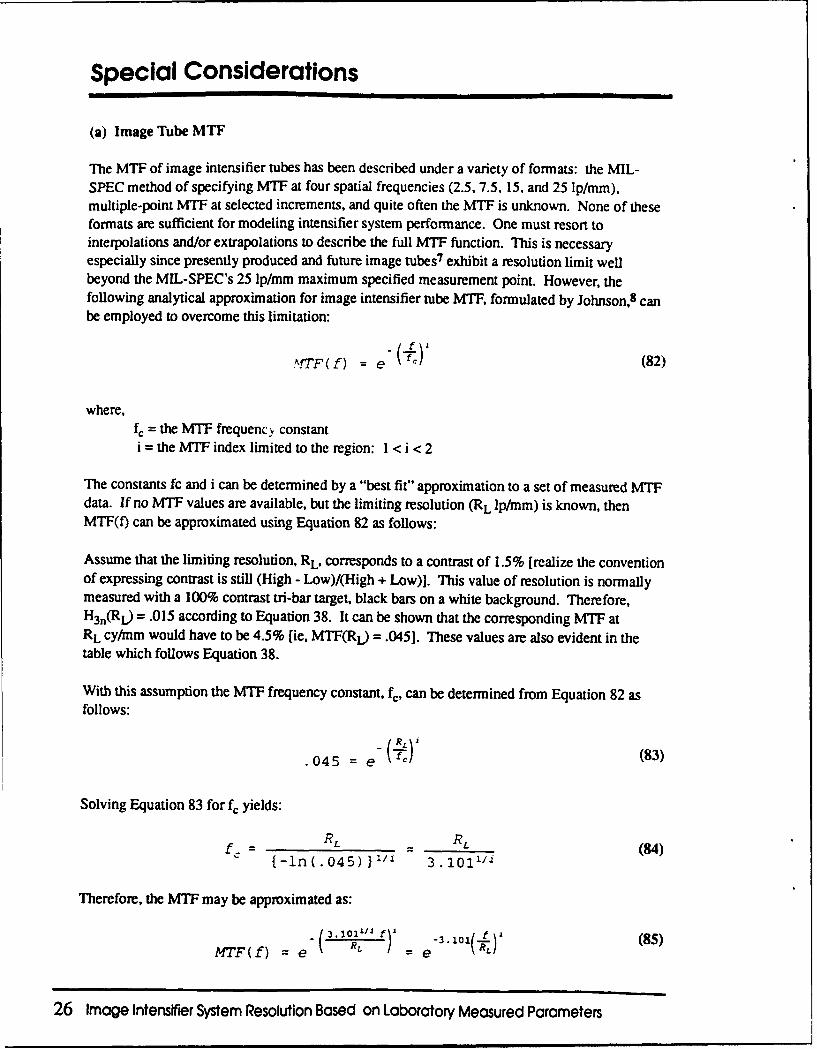
Special Considerations
(a) Image Tube MTF
The MTF of image intensifier tubes has been described under a variety of formats: the MIL-SPEC method of specifying MTF at four spatial frequencies (2.5, 7.5, 15. and 25 lp/mm),multiple-point MTF at selected increments, and quite often the MTF is unknown. None of theseformats are sufficient for modeling intensifier system performance. One must resort tointerpolations and/or extrapolations to describe the full MTF function. This is necessaryespecially since presently produced and future image tubes 7 exhibit a resolution limit wellbeyond the MIL-SPEC's 25 lp/mm maximum specified measurement point. However, thefollowing analytical approximation for image intensifier tube MTF, formulated by Johnson,8 canbe employed to overcome this limitation:
AfTF(f) = e 6 (82)
where,f= the MTF frequency constanti= the MTF index limited to the region: I < i < 2
The constants fc and i can be determined by a "best fit" approximation to a set of measured MTFdata. If no MTF values are available, but the limiting resolution (RL lp/mm) is known, thenMTF(f) can be approximated using Equation 82 as follows:
Assume that the limiting resolution, RL, corresponds to a contrast of 1.5% [realize the conventionof expressing contrast is still (High - Low)/(High + Low)]. This value of resolution is normallymeasured with a 100% contrast tri-bar target, black bars on a white background. Therefore,H3n(RL) = .015 according to Equation 38. It can be shown that the corresponding MTF atRL cy/mnm would have to be 4.5% [ie, MTF(Rt) = .045]. These values are also evident in thetable which follows Equation 38.
With this assumption the MTF frequency constant, fc, can be determined from Equation 82 asfollows:
.045 = e (83)
Solving Equation 83 for fc yields:
f RL RL (84)
{-ln(.045) 11/1 3.1011/i
Therefore, the MTF may be approximated as:
_[3. 1011"/' :I3.10 o .f\ (85)MTF(f) = e R e
26 Image Intensifier System Resolution Based on Laboratory Measured Parameters
where RL = the image tube's limiting resolution, and typically 1.2 < i < 1.5 for image intensifiertubes
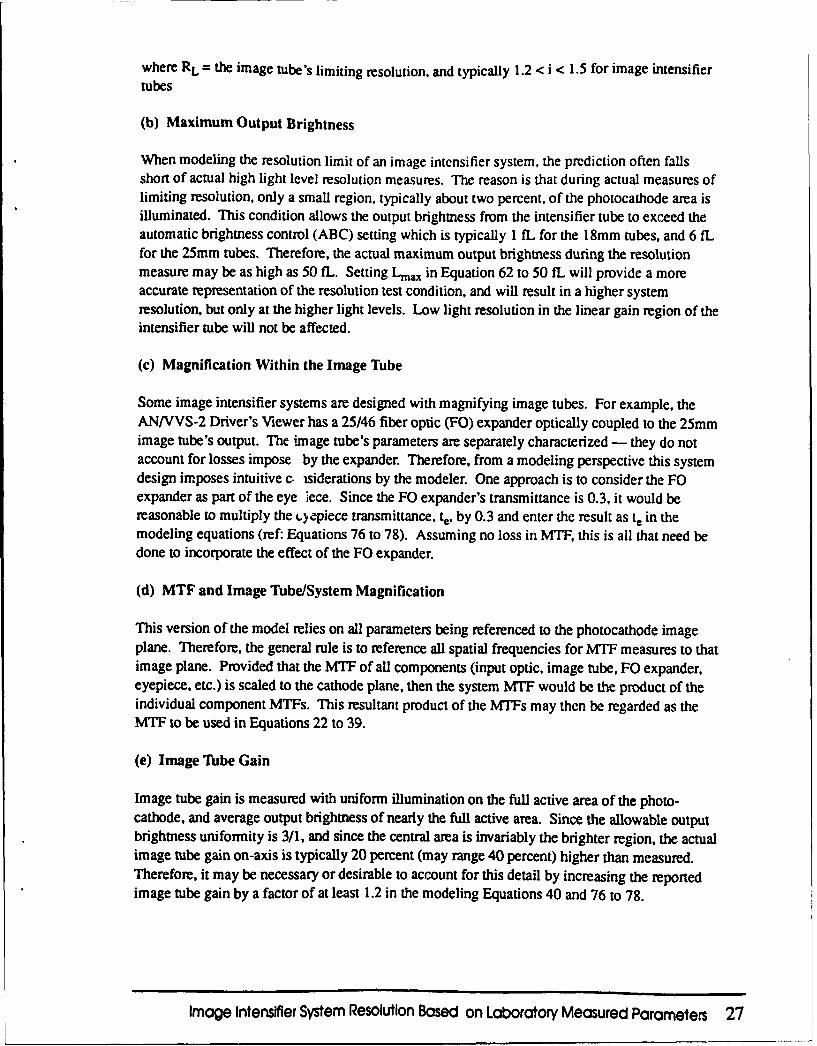
(b) Maximum Output Brightness
When modeling the resolution limit of an image intensifier system, the prediction often fallsshort of actual high light level resolution measures. The reason is that during actual measures oflimiting resolution, only a small region, typically about two percent, of the photocathode area isilluminated. This condition allows the output brightness from the intensifier tube to exceed theautomatic brightness control (ABC) setting which is typically I fL for the 18mm tubes, and 6 fLfor the 25mm tubes. Therefore, the actual maximum output brightness during the resolutionmeasure may be as high as 50 M.. Setting Lmax in Equation 62 to 50 IL will provide a moreaccurate representation of the resolution test condition, and will result in a higher systemresolution, but only at the higher light levels. Low light resolution in the linear gain region of theintensifier tube will not be affected.
(c) Magnification Within the Image Tube
Some image intensifier systems are designed with magnifying image tubes. For example, theANIVVS-2 Driver's Viewer has a 25/46 fiber optic (FO) expander optically coupled to the 25mmimage tube's output. The image tube's parameters are separately characterized - they do notaccount for losses impose by the expander. Therefore, from a modeling perspective this systemdesign imposes intuitive c, isiderations by the modeler. One approach is to consider the FOexpander as part of the eye iece. Since the FO expander's transmittance is 0.3. it would bereasonable to multiply the Lyepiece transmittance, te, by 0.3 and enter the result as te in themodeling equations (ref: Equations 76 to 78). Assuming no loss in MTF, this is all that need bedone to incorporate the effect of the FO expander.
(d) MTF and Image Tube/System Magnification
This version of the model relies on all parameters being referenced to the photocathode imageplane. Therefore, the general rule is to reference all spatial frequencies for M`1T measures to thatimage plane. Provided that the MTF of all components (input optic, image tube, FO expander,eyepiece, etc.) is scaled to the cathode plane, then the system MTF would be the product of theindividual component MTFs. This resultant product of the MTFs may then be regarded as theMTF to be used in Equations 22 to 39.
(e) Image Tube Gain
Image tube gain is measured with uniform illumination on the full active area of the photo-cathode, and average output brightness of nearly the full active area. Since the allowable outputbrightness uniformity is 3/I, and since the central area is invariably the brighter region, the actualimage tube gain on-axis is typically 20 percent (may range 40 percent) higher than measured.Therefore, it may be necessary or desirable to account for this detail by increasing the reportedimage tube gain by a factor of at least 1.2 in the modeling Equations 40 and 76 to 78.
Image Intensifier System Resolution Based on Laboratory Measured Parameters 27
(f Spectral Considerations
Since all image tube parameters are quantified with light sources exhibiting a 2856K blackbodydistribution throughout the spectral region of interest (400rnm to 1000 run), this version of themodel is applicable for only 2856K type sources. The resolution target radiance, therefore, mustpresent this type of spectral shape. This requires that the spectral reflectivity (or transmittance ofback-illuminated targets) be constant throughout the spectral region of interest if the light sourcewere set to 2856K. However, this criteria does not limit the model's applicability to fieldenvironment conditions. Certainly a given set of field conditions (spectral irradiance,atmospheric spectral transmittance and scatter, target and background spectral reflectivity)establish a quantifiable contrast within the spectral band of the intensifier system, andadditionally an equivalent light level having a 2856K blackbody distribution.
The reader is referred to a planned update of the NVESD Image Intensifier Performance Modelto be released in early calendar year 1994. The revised performance model will include this workon limiting resolution and establish the link between limiting resolution and the traditionalMinimum Resolvable Contrast utilized for the prediction of observer performance in fieldconditions.
28 Image Intensifier System Resolution Based on Laboratory Measured Parameters
References
1. Richards, E. A., "Fundamental Limitations in the Low Light-Level Performance of Direct-View Image-Intensifier Systems," Infrared Physics, Pergamon Press Ltd., 1967.
2. Rose, A., "The Sensitivity Performance of the Human Eye on an Absolute Scale:' Journal ofthe Optical Society of America, Volume 38, pgs. 196-208, 1948.
3. Overington, I., "Vision and Acquisition:' Pentech Press Ltd., 1976.
4. Campbell, F. W. and Gubisch, R. W., "Optical Quality of the Human Eye:' J. Physiol., Volume186, 1966.
5. Alpem, M., "Handbook of Optics:' Section 12, "The Eyes and Vision:' McGraw Hill, Inc.,1978.
6. de Groot, S. G. and Gebhard, J. W., "Pupil Size as Determined by Adapting Luminance",Journal of the Optical Society of America, Volume 42, 1952.
7. Johnson, C. B., Patton, S. B., and Bender, E., "High Resolution Microchannel Plate ImageTube Development:' SPIE, Volume 1449, pg. 1, 1991.
8. Johnson, C. B., "Point-Spread Functions, Line-Spread Functions, and Edge-ResponseFunctions Associated with MTFs of the Form exp[-(/W6)n]," Applied Optics. Volume 12, No.5,pg.1031, 1973.
Image Intensifier System Resolution Based on Laboratory Measured Parameters 29
Symbology
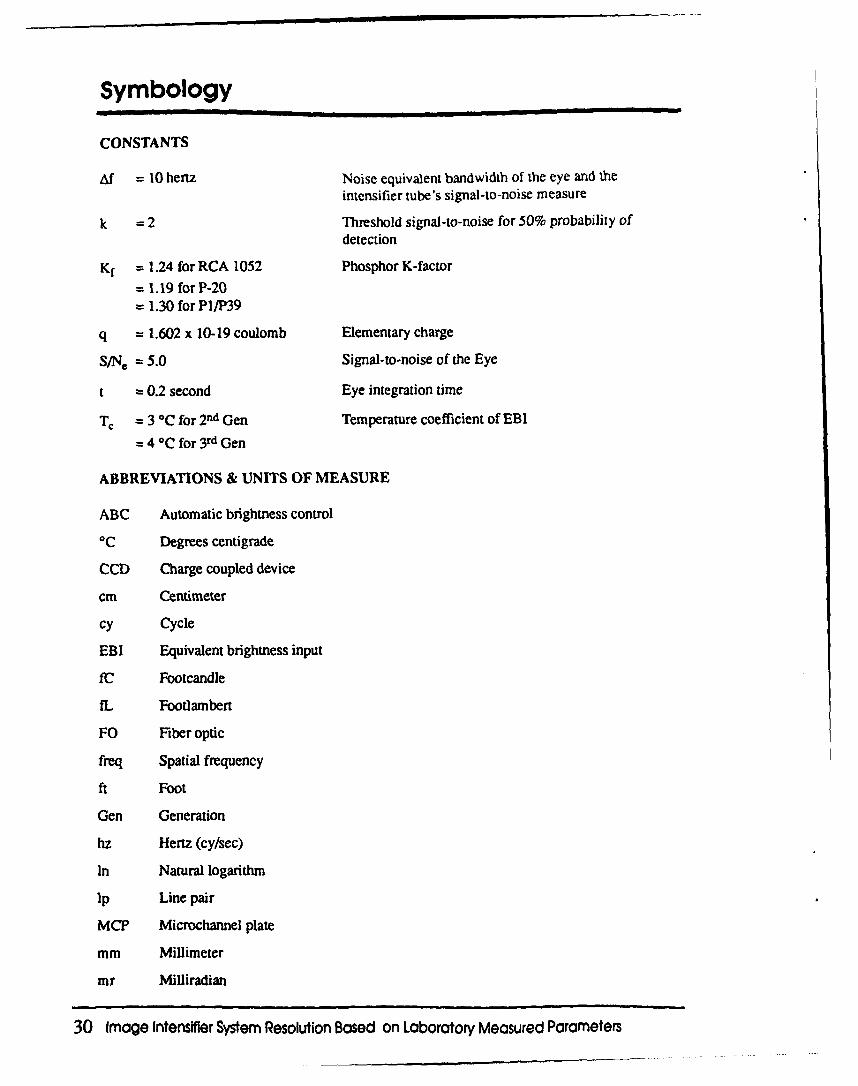
CONSTANTS
Af = 10 hertz Noise equivalent bandwidth of the eye and theintensifier tube's signal-to-noise measure
k = 2 Threshold signal-to-noise for 50% probability ofdetection
Kf = 1.24 for RCA 1052 Phosphor K-factor
= 1.19 for P-20= 1.30 for P1/P39
q = 1.602 x 10⁻¹⁹ coulomb Elementary charge
SIN, = 5.0 Signal-to-noise of the Eye
t = 0.2 second Eye integration time
T, = 3 *C for 2nd Gen Temperature coefficient of EBI
= 4 0C for 3 rd Gen
ABBREVIATIONS & UNITS OF MEASURE
ABC Automatic brightness control
0C Degrees centigrade
CCD Charge coupled device
cm Centimeter
cy Cycle
EBI Equivalent brightness input
fC Footcandle
fL Footlambert
FO Fiber optic
freq Spatial frequency
ft Foot
Gen Generation
hz Hertz (cy/sec)
In Natural logarithm
lp Line pair
MCP Microchannel plate
mm Millimeter
mr Milliradian
30 Image Intensifier System Resolution Based on Laboratory Measured Parameters
MTF Modulation transfer function
sec Second
VARIABLES [units of measure]
Ao Relative aperture of the input objective
C Contrast at the target, (high - low)/(high + low), as viewed by the image intensifiersystem input
Cb Contrast of target, (L, - Ls)/Lo
cc Contrast at the target reduced by the effect of EBI
C~e Eye's contrast transfer
CF Correction factor applied to the measured signal-to-noise value
Cm Image tube's contrast transfer
Cout Image tube's output image contrast
CTF(f) Contrast transfer function
d Pupil diameter of the eye, [mm]
e Equivalent brightness input as referenced at the target due to the image intensifiertube's EBI, [fL]
EBI Equivalent background input of image intensifier tube, [Lumen/cm 2]
EFLi Effective focal length of input optic, [mini
f Sinusoidal spatial frequency, Icy/mmn
F(nf) Fourier series components of a periodic square wave
fc MTF frequency constant, [cy/mm]
f.d MTF frequency constant of eye's optics, [cyhnm]
FnO Input optic F-number
fT Spatial frequency at the eye's retina, [cy/mm]
G Image intensifier tube gain, [fL/fC]
Gr(RC) Gain reduction factor of the image intensifier tube
Grl Approximate gain reduction factor for a 100% contrast tri-bar target, white on black
Gr2 Approximate gain reduction factor for a 100% contrast tri-bar target, black on white
Gs System gain. [fL/fL]
H Higher luminance level of either target or background, [fL]
H3n(f) Approximate contrast transfer of a tri-bar target, black on white
H3p(f) Approximate contrast transfer of a tri-bar target, white on black
Image Intensifier System Resolution Based on Laboratory Measured Parameters 31
Hb Background brightness (or average brightness for periodic spatial targets), [IfL]
He Higher luminance level of target or background for eye to resolve target, [fLl
Hi(R) The high light input at R, lp/mm on the cathode. [fC]
Hout The higher brightness output of either target or background, [fL]
Hp(f) The high light output due to a 100% contrast periodic square wave input at f lp/mm onthe cathode with image intensifier tube gain normalized to 1
Hs Higher luminance level of target or background for intensifier system toresolve target, [fL]
Hs(r) The high light output due to a 100% contrast singular positive bar target input of widtht mm on the cathode with image intensifier tube gain normalized to I
i MTF index
I Average cathode current
io MTF index of eye's optics
K Substitution variable for 26.8 Rc Tn/(881 EFLi S/Nout Kf)
Ke Eye constant = 26.8 EFLi Rd(881 x 22.89 S/Ne Gsit2 M d)
Ks System constant = K
L The lower luminance level of either target or background, [fL]
Le The higher luminance of either target or background as viewed at the intensifiersystem's output, [fL]
Lmax Maximum output brightness of the image tube, [.L]
Lo The higher target luminance as defined by Richards
Lout The lower output luminance of either target or background, [FL]
Lp(f) The low light output due to a 100% contrast periodic square wave input at f lp/mm onthe cathode with image intensifier tube gain normalized to I
Ls The lower target luminance as defined by Richards
M Image intensifier system magnification
MTF(f) Modulation transfer function of image intensifier tube
MTFC Total MTF of the eye
MTFo MTF of the eye's optics
MTFr MTF of the eye's foveal retina
n Integer value of Fourier series component
RC The spatial frequency at the input photosurface of the image tube resolvable at thephosphor screen, [lp/mm]
Re Angular resolution presented to the eye, [cy/mr]
32 Image Intensifier System Resolution Based on Laboratory Measured Parameters
Ri Input angular resolution of intensifier system, [cy/mr]
RL The maximum or limiting spatial resolution of image intensifier tube. lip/mm]
Rp Spatial resolution at the input photosurface, limited by photon noise defined byRichards, lip/unit length]
R5 The angular resolution presented to the eye, Icy/mr]
S Integral sensitivity of photocathode, Imicroamp per lumen]
S/Nin Input signal-to-noise referenced to the photocathode over a 10 hertz noiseequivalent bandwidth
S/No,, The measured high light (lxl0-5 fC) signal-to-noise of the image intensifier tube
S/Ns The intensifier system's signal-to-noise
T Ambient temperature. [*C]
te Intensifier system's eyepiece transmittance, [fL/fL]
Tno Image intensifier system's input optic T-number
t4 Image intensifier system's input optic transmittance
'T Spatial width of singular bar target. [mm]
Image Intensifier System Resolution Based on Laboratory Measured Parameters 33
Apperdix AExamples
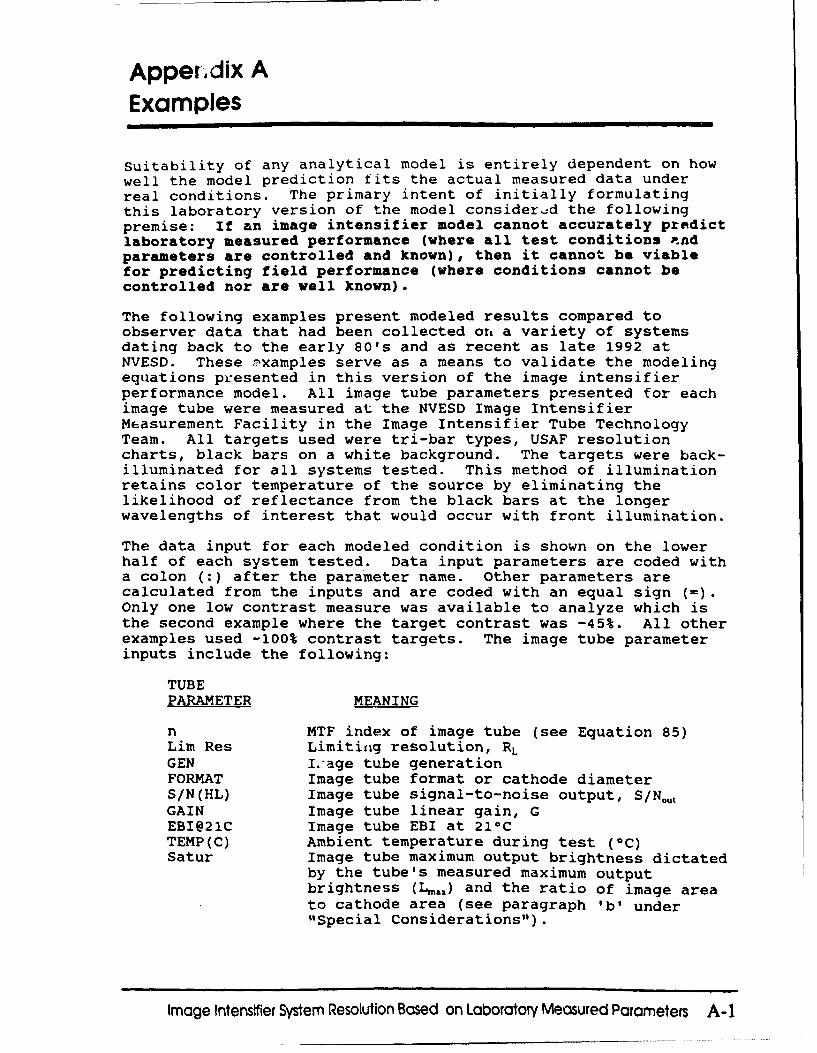
Suitability of any analytical model is entirely dependent on howwell the model prediction fits the actual measured data underreal conditions. The primary intent of initially formulatingthis laboratory version of the model considere-td the followingpremise: If an image intensifier model cannot accurately predictlaboratory measured performance (where all test conditions Pnd
parameters are controlled and known), then it cannot be viablefor predicting field performance (where conditions cannot becontrolled nor are well known).
The following examples present modeled results compared toobserver data that had been collected on a variety of systemsdating back to the early 80's and as recent as late 1992 atNVESD. These 7xamples serve as a means to validate the modelingequations presented in this version of the image intensifierperformance model. All image tube parameters presented for eachimage tube were measured at the NVESD Image IntensifierMeasurement Facility in the Image Intensifier Tube TechnologyTeam. All targets used were tri-bar types, USAF resolutioncharts, black bars on a white background. The targets were back-illuminated for all systems tested. This method of illuminationretains color temperature of the source by eliminating thelikelihood of reflectance from the black bars at the longerwavelengths of interest that would occur with front illumination.
The data input for each modeled condition is shown on the lowerhalf of each system tested. Data input parameters are coded witha colon (:) after the parameter name. Other parameters arecalculated from the inputs and are coded with an equal sign (=).Only one low contrast measure was available to analyze which isthe second example where the target contrast was -45%. All otherexamples used -100% contrast targets. The image tube parameterinputs include the following:
TUBEPARAMETER MEANING
n MTF index of image tube (see Equation 85)Lim Res Limiting resolution, RLGEN Iage tube generationFORMAT Image tube format or cathode diameterS/N(HL) Image tube signal-to-noise output, S/N,,,GAIN Image tube linear gain, GEBI@21C Image tube EBI at 210CTEMP(C) Ambient temperature during test (OC)Satur Image tube maximum output brightness dictated
by the tube's measured maximum outputbrightness (Lmaz) and the ratio of image areato cathode area (see paragraph 'b' under"Special Considerations").
Image Intensifier System Resolution Based on Laboratory Measured Parameters A-i
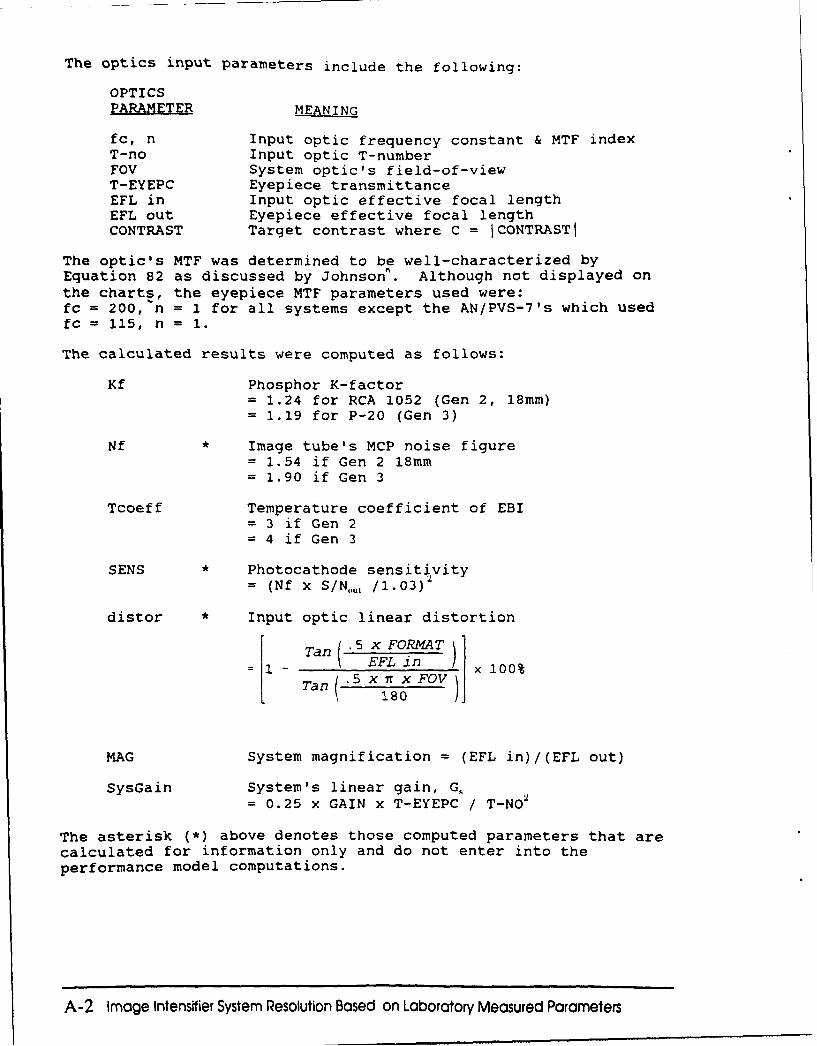
The optics input parameters include the following:
OPTICSPARAMETER MEANING
fc, n Input optic frequency constant & MTF indexT-no Input optic T-numberFOV System optic's field-of-viewT-EYEPC Eyepiece transmittanceEFL in Input optic effective focal lengthEFL out Eyepiece effective focal lengthCONTRAST Target contrast where C = ICONTRASTI
The optic's MTF was determined to be well-characterized byEquation 82 as discussed by Johnsonh. Although not displayed onthe charts, the eyepiece MTF parameters used were:fc = 200, n = 1 for all systems except the AN/PVS-7's which usedfc = 115, n = 1.
The calculated results were computed as follows:
Kf Phosphor K-factor= 1.24 for RCA 1052 (Gen 2, 18mm)= 1.19 for P-20 (Gen 3)
Nf Image tube's MCP noise figure= 1.54 if Gen 2 18mm= 1.90 if Gen 3
Tcoeff Temperature coefficient of EBI= 3 if Gen 2= 4 if Gen 3
SENS Photocathode sensitivity= (Nf x S/Nu, /1.03)2
distor Input optic linear distortion
Tan .5 x FORMAT1- EFL in / 100%
Tan (- 5 x n xFOVTan ( 180
MAG System magnification = (EFL in)/(EFL out)
SysGain System's linear gain, G•,= 0.25 x GAIN x T-EYEPC / T-NO0
The asterisk (*) above denotes those computed parameters that arecalculated for information only and do not enter into theperformance model computations.
A-2 Image Intensifier System Resolution Based on Laboratory Measured Parameters
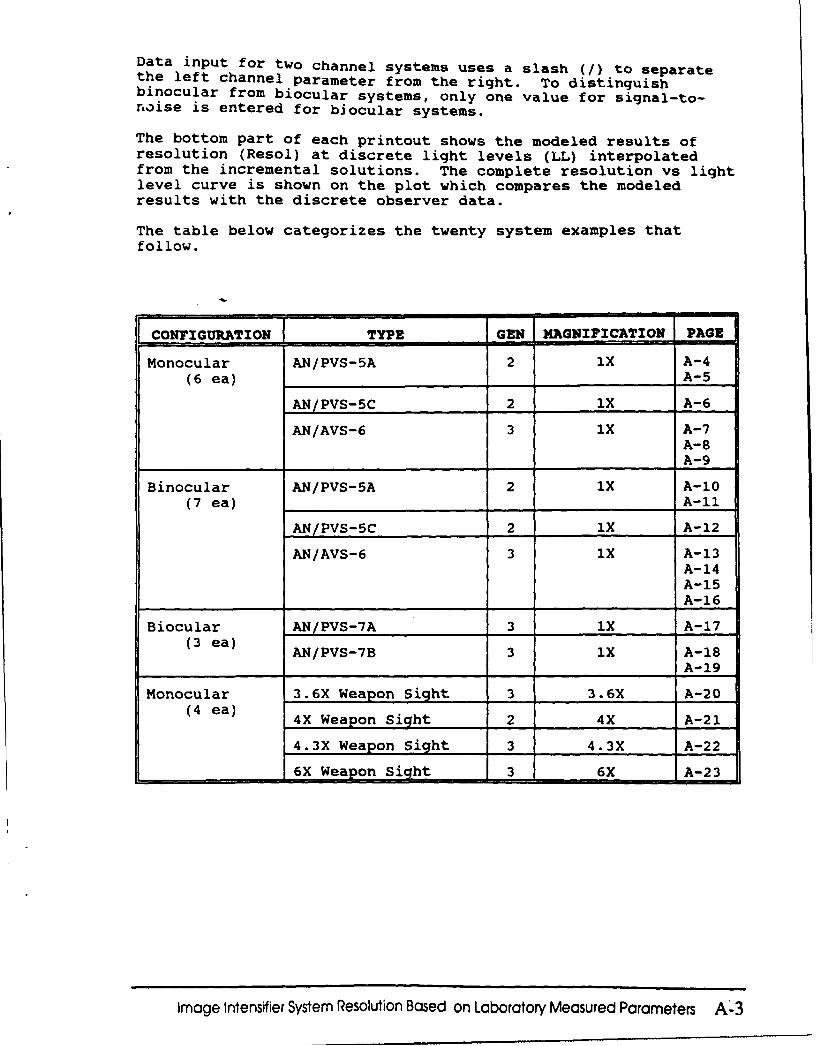
Data input for two channel systems uses a slash (/) to separatethe left channel parameter from the right. To distinguishbinocular from biocular systems, only one value for signal-to-noise is entered for biocular systems.
The bottom part of each printout shows the modeled results ofresolution (Resol) at discrete light levels (LL) interpolatedfrom the incremental solutions. The complete resolution vs lightlevel curve is shown on the plot which compares the modeledresults with the discrete observer data.
The table below categorizes the twenty system examples thatfollow.
CONFIGURATION ITYPE GE MANFCTO -AG
Monocular AN/PVS-5A 2 iX A-4(6 ea) A-5
AN/PVS-5C 2 iX A-6
AN/AVS-6 3 Ix A-7A-8A-9
Binocular AN/PVS-5A 2 IX A-10(7 ea) A-li
AN/PVS-5C 2 iX A-12
AN/AVS-6 3 iX A-13A-14A-15A-16
Biocular AN/PVS-7A 3 IX A-17(3 ea) AN/PVS-7B 3 iX A-18
A-19
Monocular 3.6X Weapon Sight 3 3.6X A-20(4 ea) 4X Weapon Sight 2 4X A-21
4.3X Weapon Sight 3 4.3X A-22
6X Weapon Sight 3 6X A-23
Image intensifier System Resolution Based on Laboratory Measured Parameters A'3
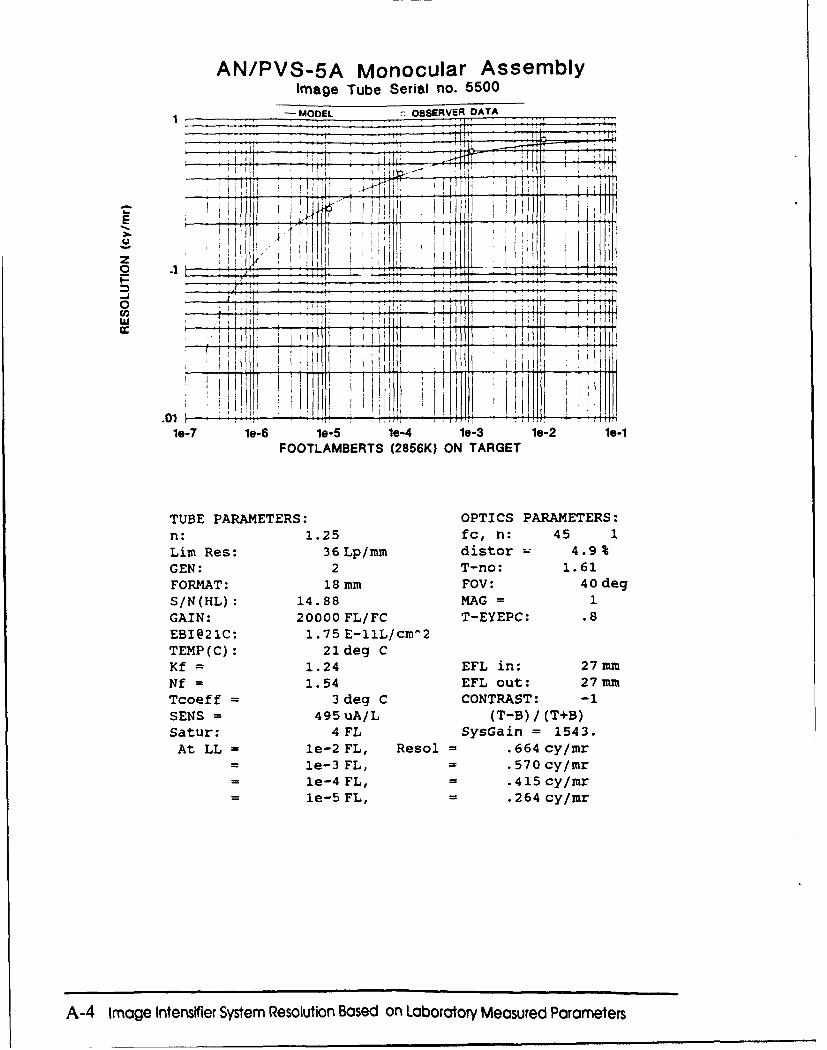
AN/PVS-5A Monocular AssemblyImage Tube Serial no. 5500
1- MODEL OBSERVER DATA
LI I: .. .
S- i~~I I* IEz
0 I
.01.
le-7 le-6 le-5 le-4 le-3 le-2 le-1FOOTLAMBERTS (2856K) ON TARGET
TUBE PARAMETERS: OPTICS PARAMETERS:n: 1.25 fc, n: 45 1Lim Res: 36Lp/mm distor 4.9%GEN: 2 T-no: 1.61FORMAT: 18 mm FOV: 40 degS/N(HL): 14.88 MAG = 1GAIN: 20000 FL/FC T-EYEPC: .8EBI@21C: 1. 75 E-11L/cm^2
TEMP(C): 21 deg CKf = 1.24 EFL in: 27mmNf = 1.54 EFL out: 27mmTcoeff = 3 deg C CONTRAST: -1SENS = 495 uA/L (T-B) /(T+B)Satur: 4 FL SysGain = 1543.At LL = le-2 FL, Resol = .664 cy/mr
= le-3 FL, .570 cy/mr- le-4 FL, .415 cy/mr- le-5 FL, .264 cy/mr
A-4 Image Intensifier System Resolution Based on Laboratory Measured Parameters
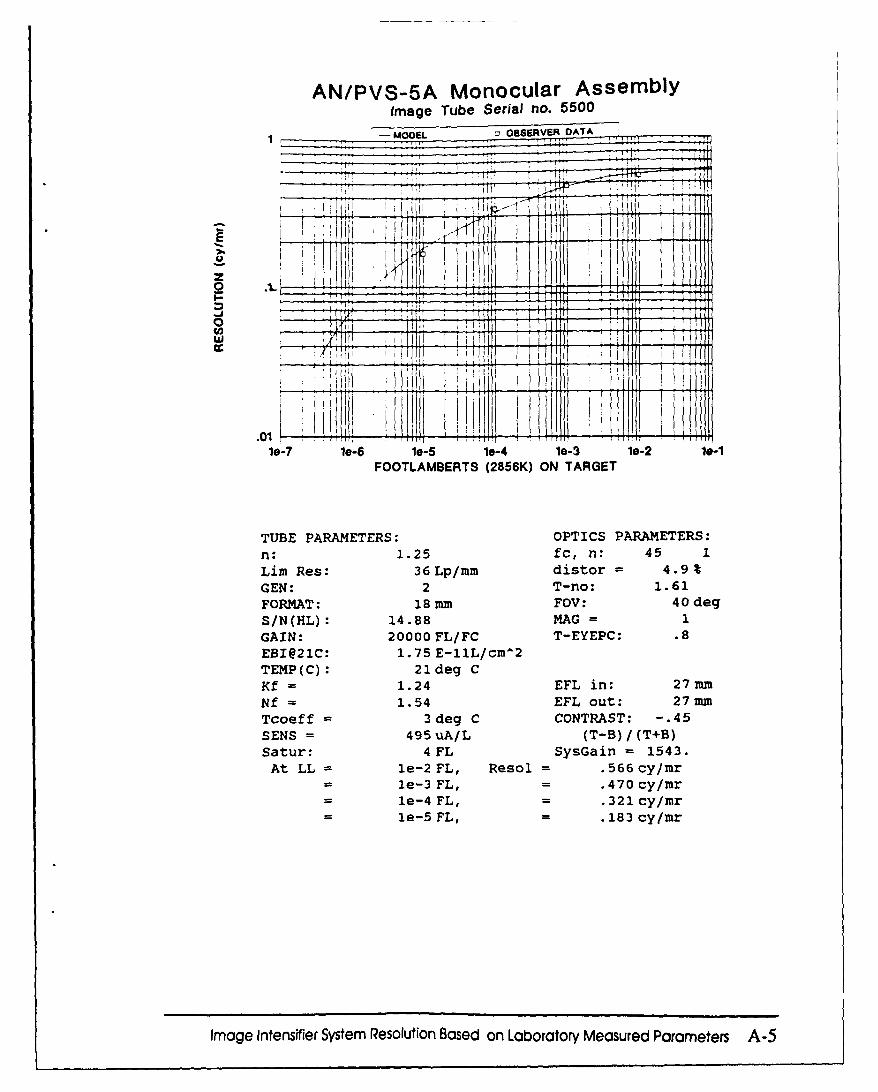
AN/PVS-5A Monocular Assemblyimage Tube Serial no. 5500
SMODEL O6SERVER DATA
E-
0ý1
w
4 1 W . If i
.01le-7 le-6 le-5 1-4 le-3 le-2 10-1
FOOTLAMBERTS (2856K) ON TARGET
TUBE PARAMETERS: OPTICS PARAMETERS:n: 1.25 fc, n: 45 1Lim Res: 36Lp/mm distor = 4.9%GEN: 2 T-no: 1.61FORMAT: 18 mm FOV: 40 degS/N(HL): 14.88 MAG = 1GAIN: 20000 FL/FC T-EYEPC: .8EBI@21C: 1.75 E-11L/cm-2TEMP(C): 21deg CKf = 1.24 EFL in: 27mmNf = 1.54 EFL out: 27mmTcoeff = 3deg C CONTRAST: -. 45SENS = 495uA/L (T-B)/(T+B)Satur: 4 FL SysGain = 1543.
At LL - le-2 FL, Resol = .566cy/mr= le-3 FL, = .470 cy/mr= le-4 FL, = .321 cy/mr= le-5 FL, = .183 cy/mr
Image Intensifier System Resolution Based on Laboratory Measured Parameters A-5
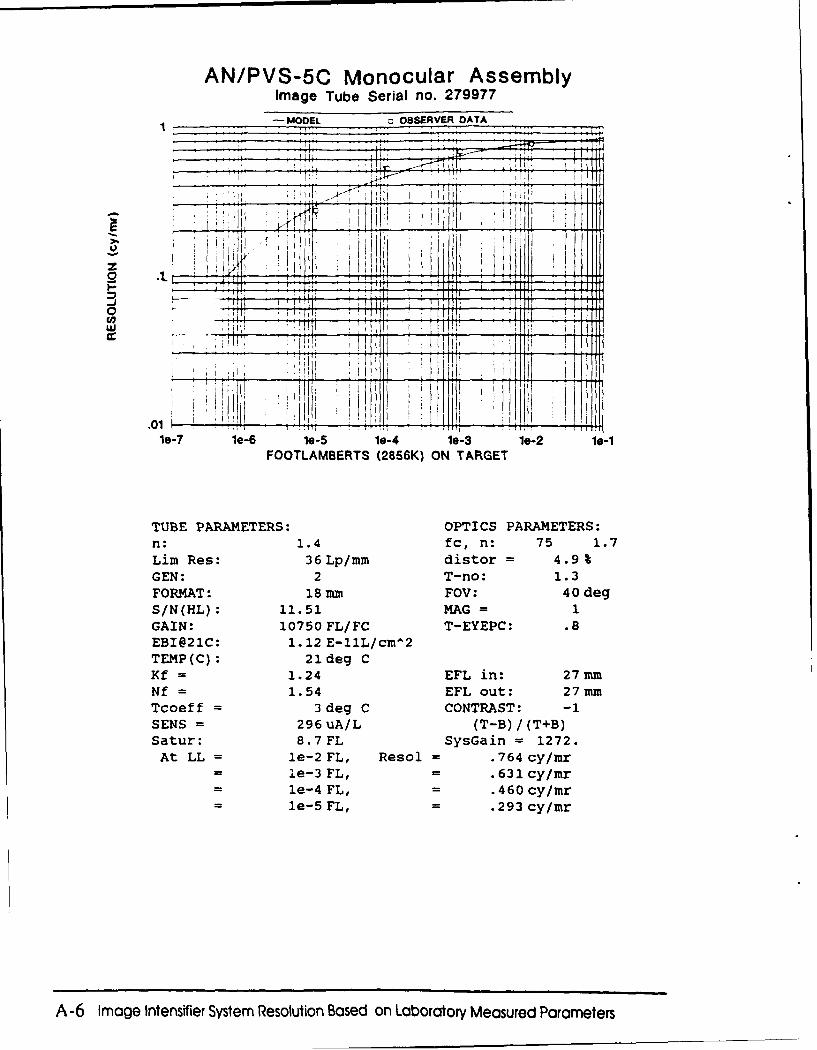
AN/PVS-5C Monocular AssemblyImage Tube Serial no. 279977
-- MODEL OBSERVER DATA
ixi
.011
10-7 le-6 le-5 le-4 le-3 1-2 1,-1FOOTLAMBERTS (2856K) ON TARGET
TUBE PARAMETERS: OPTICS PARAMETERS:n: 1.4 fc, n: 75 1.7Lim Res: 36Lp/mm distor = 4.9%GEN: 2 T-no: 1.3FORMAT: 18 mm FOV: 40 degS/N(HL): 11.51 MAG = 1GAIN: 10750 FL/FC T-EYEPC: .8EBI@21C: 1.12 E-11L/cm^2TEMP(C): 21deg CKf = 1.24 EFL in: 27mmNf = 1.54 EFL out: 27mmTcoeff = 3 deg C CONTRAST: -1SENS = 296uA/L (T-B)/(T+B)Satur: 8.7 FL SysGain = 1272.At LL = le-2 FL, Resol = .764 cy/mr
= le-3 FL, = .631 cy/mr= le-4 FL, = .460 cy/mr= le-5 FL, = .293 cy/mr
A-6 Image Intensifier System Resolution Based on Laboratory Measured Parameters
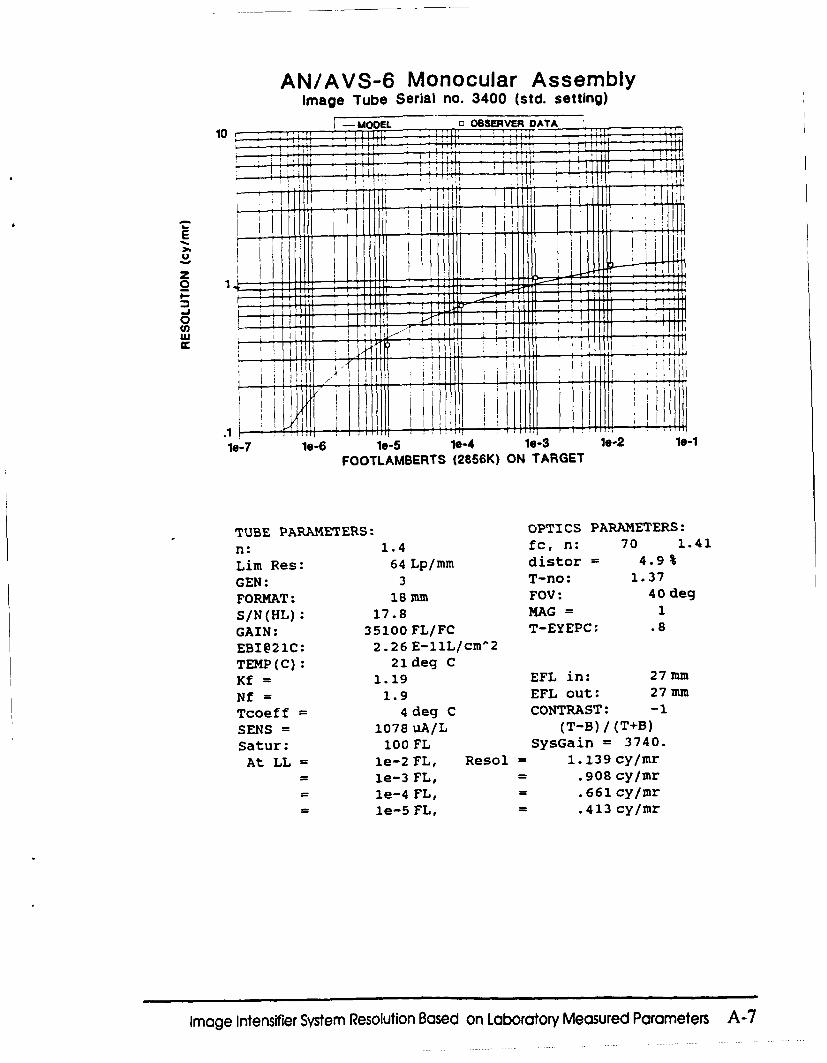
AN/AVS-6 Monocular AssemblyImage Tube Serial no. 3400 (std. setting)
MODELOBSERVER DT
10
, I T I I T
0
"I!I
le-7 le-6 le-5 le-4 le-3 le-2 le-1
FOOTLAMBERTS (2856K) ON TARGET
TUBE PARAMETERS: OPTICS PARAMETERS:
n: 1.4 fc, n: 70 1.41
Lim Res: 64 Lp/mm distor = 4.9%
GEN: 3 T-no: 1.37
FORMAT: 18 mm FOV: 40 deg
S/N(HL): 17.8 MAG = 1
GAIN: 35100 FL/FC T-EYEPC: .8
EBI@21C: 2.26 E-11L/cm^2TEMP(C): 21deg CKf = 1.19 EFL in: 27mm
Nf = 1.9 EFL out: 27mm
Tcoeff = 4 deg C CONTRAST: -1
SENS = 1078 uA/L (T-B)/(T+B)
Satur: 100 FL SysGain = 3740.At LL = le-2 FL, Resol = 1.139cy/mr
- le-3 FL, = .908 cy/mr- le-4 FL, = .661cy/mr- le-5 FL, = .413 cy/mr
Image Intensifier System Resolution Based on Laboratory Measured Parameters A-7
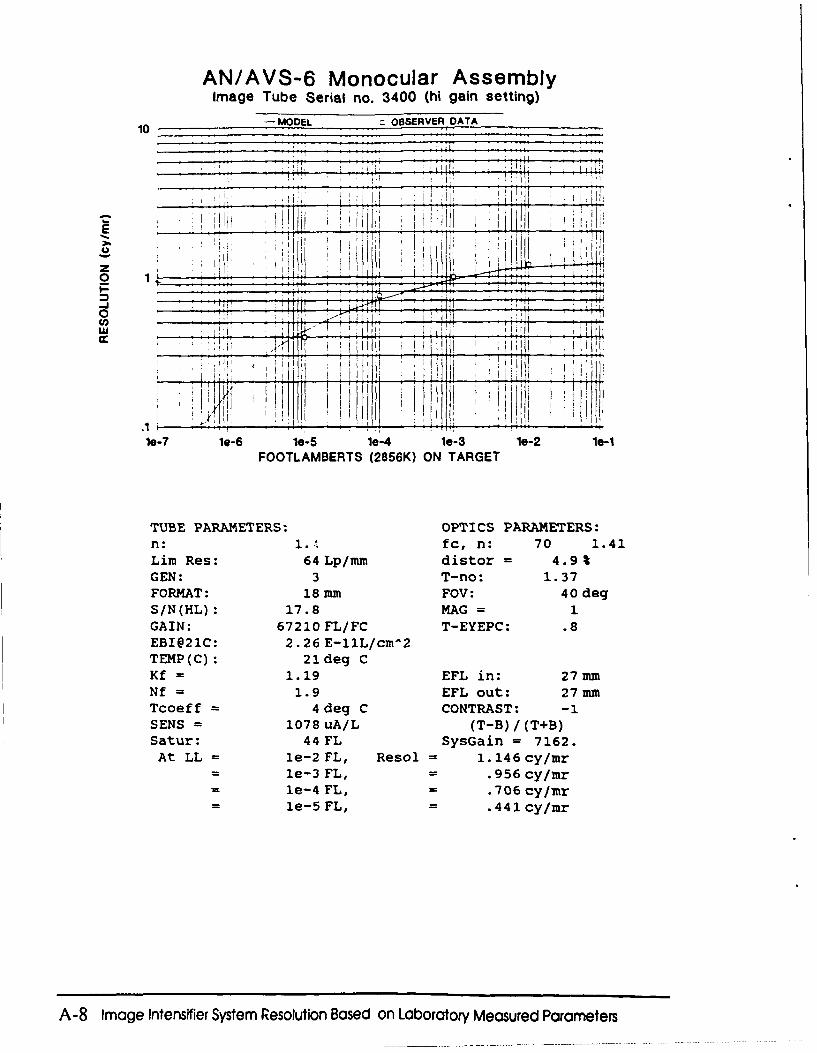
AN/AVS-6 Monocular Assembly
Image Tube Serial no. 3400 (hi gain setting)
1- MOOEL OBSERVER DATA
• ,- -,1'•- --- -- •--
zII
le-7 le-6 le-5 le-4 le-3 le-2 le-1FOOTLAMBERTS (2856K) ON TARGET
TUBE PARAMETERS: OPTICS PARAMETERS :n : 1. A. fc, n: 70 1.41Lim Res: 64 Lp/mm distor = 4.9GEN: 3 T-no: 1.37FORMAT: 18 mm FOV: 40 degS/N(HL): 17.8 MAG = 11
GAIN: 67210 FL/FC T-EYEPC: .8EBI@21C: 2. 26 E-11L/cm-2TEMP(C): 21 deg CKf = 1.19 EFL in: 27 mmNf = 1.9 EFL out: 27 mmTcoeff = 4 deg C CONTRAST: -.SENS = 1078 uA/L (T-B) /(T+B)Satur: 44 FL SysGain = 7162.
At LL = le-2 FL, Resol = 1. 146 cy/mr= 6le-3 FL, = .956 cy/mr=le-4 FL, 1E .706 cy/mr= le-5 FL, = .441 cy/mr
A-8 Image Intensifier System Resolution Based on Laboratory Measured Parameters
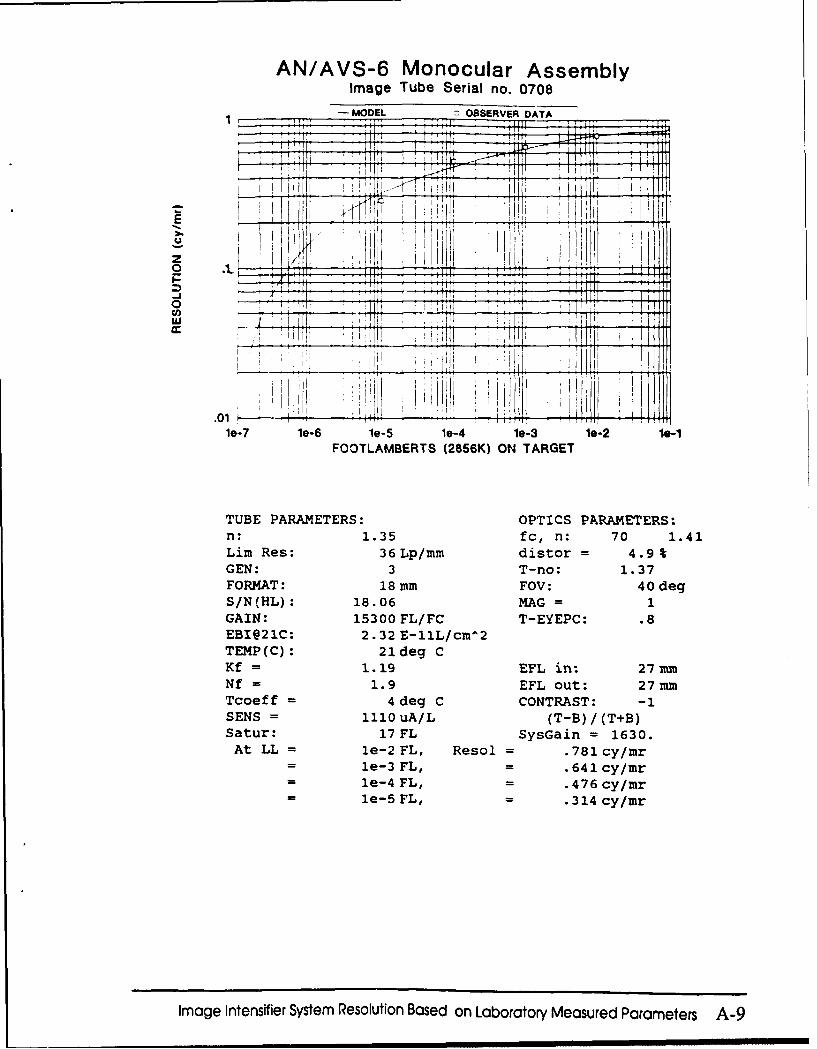
AN/AVS-6 Monocular AssemblyImage Tube Serial no. 0708
MODEL OBSERVER DATAT1
4Jý0I
.011 1
1o-7 10-6 le-5 le-4 le-3 1e-2 1.-1FOOTLAMBERTS (2856K) ON TARGET
TUBE PARAMETERS: OPTICS PARAMETERS:n:1.35 fc, n: 70 1.41
Lim Res: 36 Lp/mm distor = 4.9%GEN: 3 T-no: 1.37FORMAT: 18mm FOV: 40odegS/N(HL): 18.06 MAG =1
GAIN: 15300 FL/FC T-EYEPC: .8EBI@21C: 2.32 E-11L/cm^2TEMP(C): 21ldeg CKf = 1.19 EFL in: 27 mmNf = 1.9 EFL out: 27 mmTcoeff = 4 deg C CONTRAST: -1SENS = 1110 uA/L (T-B)/(T+B)Satur: 17 FL SysGain = 1630.At LL = le-2 FL, Resol = .781 cy/mr
-le-3 FL, - .641 cy/mr-le-4 FL, = .476 cy/mr-le-5 FL, = .314 cy/mr
image Intensifier System Resolution Based on Laboratory Measured Parameters A-9
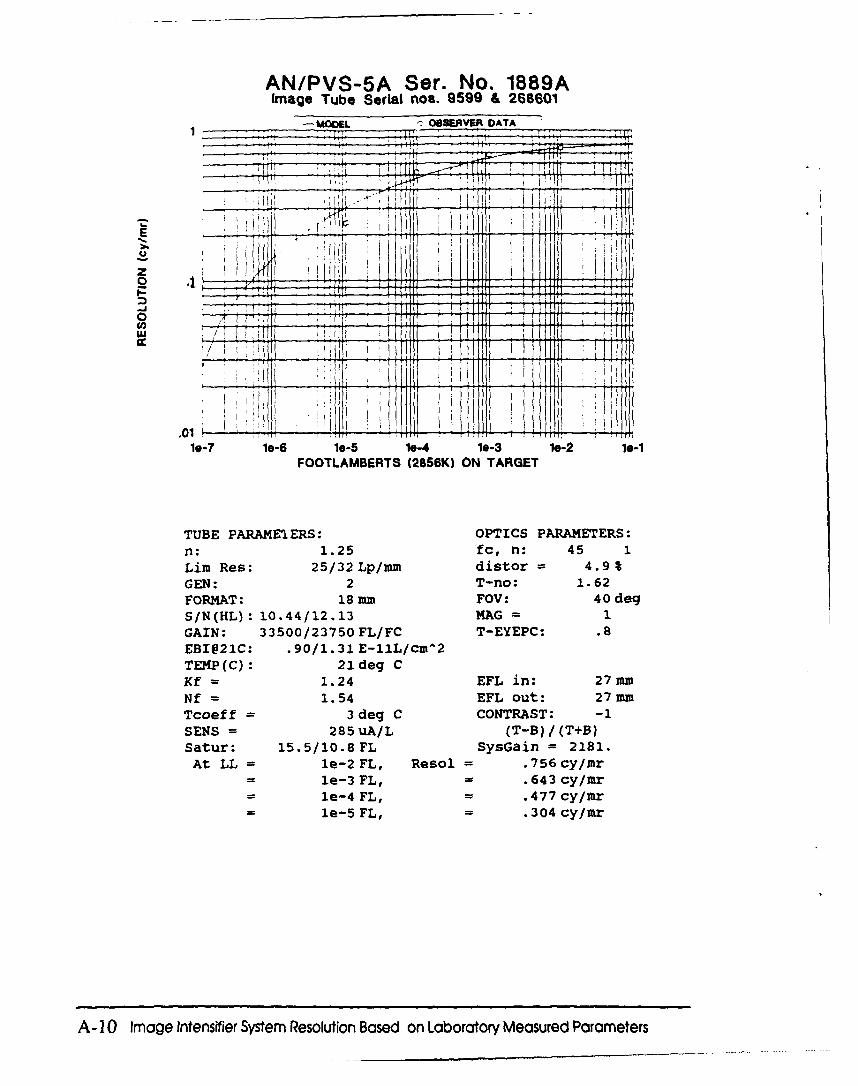
AN/PVS-5A Ser. No. 1889AImage Tube Seriail nos. 9599 & 268601
MODEL OBSERVER DATA
E I;
If * f il I fi l0. ITf___fIllHl
.01 4 2ERT (2856K) ON TARGET
TUBE PARAME1ERS: OPTICS PARAMETERS:ni: 1.25 fc, ni: 45 1
Lim Res: 25/32 Lp/mm distor 4.9%
GEN: 2 T-no: 1.62FORMAT: 18 mm FOV: 40Odeg
SfN(HL): 10.44/12.13 MAG IGAIN: 33500/23750 FL/FC T-EYEPC: .8
EBI@21C: .90/1.31 E-11L/cmA2TE4P (C): 21 deg CKf= 1.24 EFL in: 27 mm
Nf = 1.54 EFL out: 27mm
Tcoeff 3 3deg C CONTRAST: -1SEN'S = 285 UA/L (T-B)/(T+B)Satur: 15.5/10.8 FL SysGain = 2181.At LL =le-2 FL, Resol = .756 cy/mr
le-3 FL, - .643 cy/mrle-4 FL, - .477 cy/mrle-5 FL, - .304 cy/mr
A -10 Image intensifier System Resolution Based on Laboratory Measured Parameters
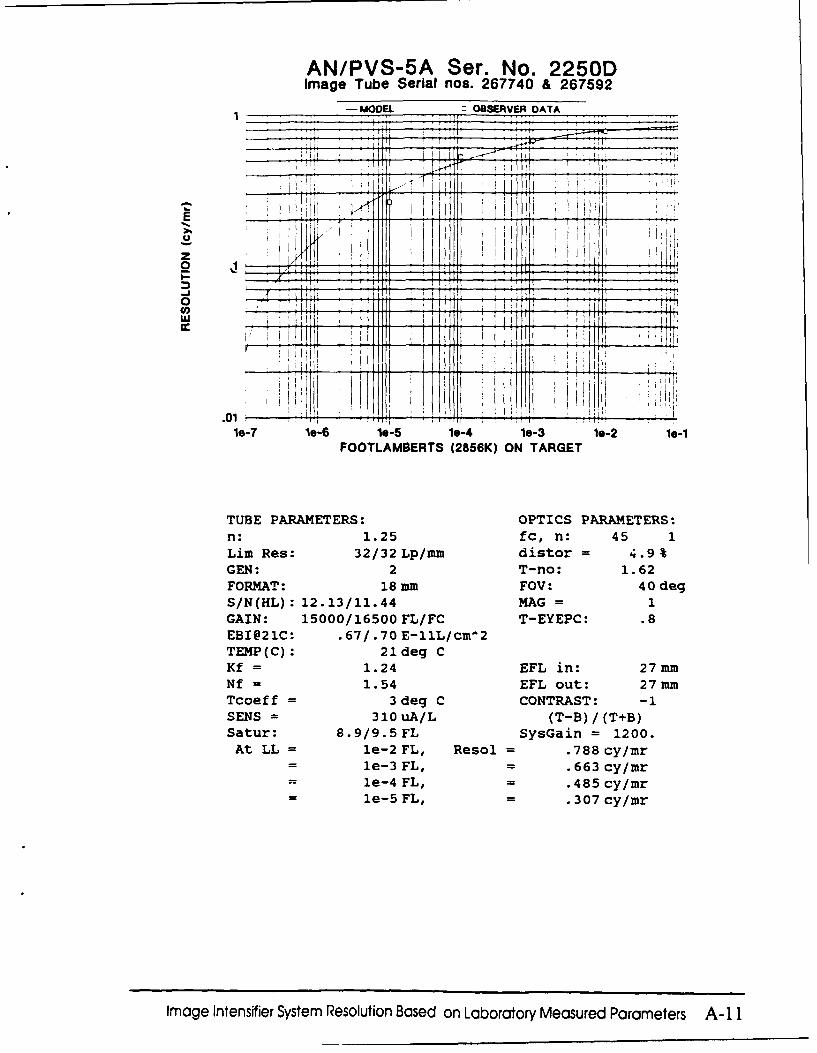
AN/PVS-5A Ser. No. 2250DImage Tube Serial nos. 267740 & 267592
-- MODEL OBSERVE.R DATA
- -------------
.01
le-7 1e-6 1e-5 1e-4 le-3 1e-2 1e-1FOOTLAMSERTS (2856K) ON TARGET
TUBE PARAMETERS: OPTICS PARAMETERS:n: 1.25 fc, n: 45 1
Lim Res: 32/32 Lp/mm distor = 4.9%GEN: 2 T-no: 1.62FORMAT: 18 mm FOV: 40 degS/N(HL) : 12.13/11.44 HAG = 1GAIN: 15000/16500 FL/FC T-EYEPC: .8EBI@21C: .67/.70 E-11L/cm^ 2TEMP(C) : 21 deg CKf = 1.24 EFL in: 27mmNf = 1.54 EFL out: 27 mm,Tcoeff = 3 deg C CONTRAST: -1SENS = 310 uA/L (T-B) /(T+B)Satur: 8.9/9.5 FL SysGain = 1200.At LL = le-2 FL, Resol = .788 cy/mr
le-3 FL, .663 cy/mr
= le-4 FL, = .485 cy/mr= le-5 FL, = .307 cy/mr
Image Intensifier System Resolution Based on Laboratory Measured Parameters A-] I
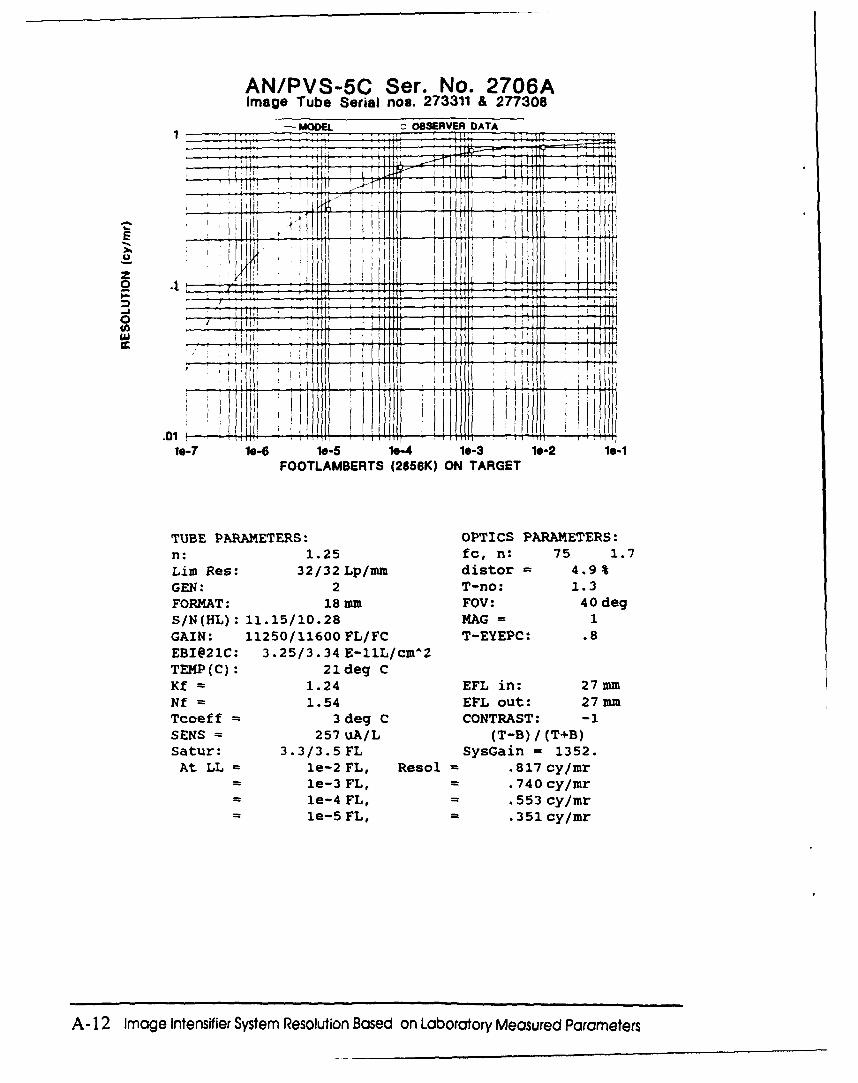
AN/PVS-5C Ser. No. 2706AImage Tube Serial nos. 273311 & 277308
-MODEL c OBSERVER DATA
011
.017 .s4 1e-3 le-2 1.-i
FOOTLAMBERTS (2656K) ON TARGET
TUBE PARAMETERS: OPTICS PARAMETERS:n:1.25 fc, n: 75 1.7
Li~m Res: 32/32 Lp/mm distor 4.9%GEN: 2 T-no: 1.3FORMAT: 18 mm F0V: 40odegS/N(HL): 11.15/10.28 HAG =1
GAIN: 11250/ 11600 FL/FC T-EYEPC: .8
EBI@21C: 3.25/3.34 E-11L/cmA2TEMP(C): 21ldeg CKf =1.24 EFL in: 27 mm,Nf =1.54 EFL out: 27 mmTcoeff =3 deg C CONTRAST: -1SENS =257 uA/L (T-B)/(T+B)Satur: 3.3/3.5 FL SysGain = 1352.At LL = 1e-2 FL, Resol .817 cy/mr
-le-3 FL, - .740 cy/mr-le-4 FL, - .553 cy/mr-le-5 FL, - .351 cy/mr
A-12 Image Intensifier System Resolution Based on Laboratory Measured Parameters
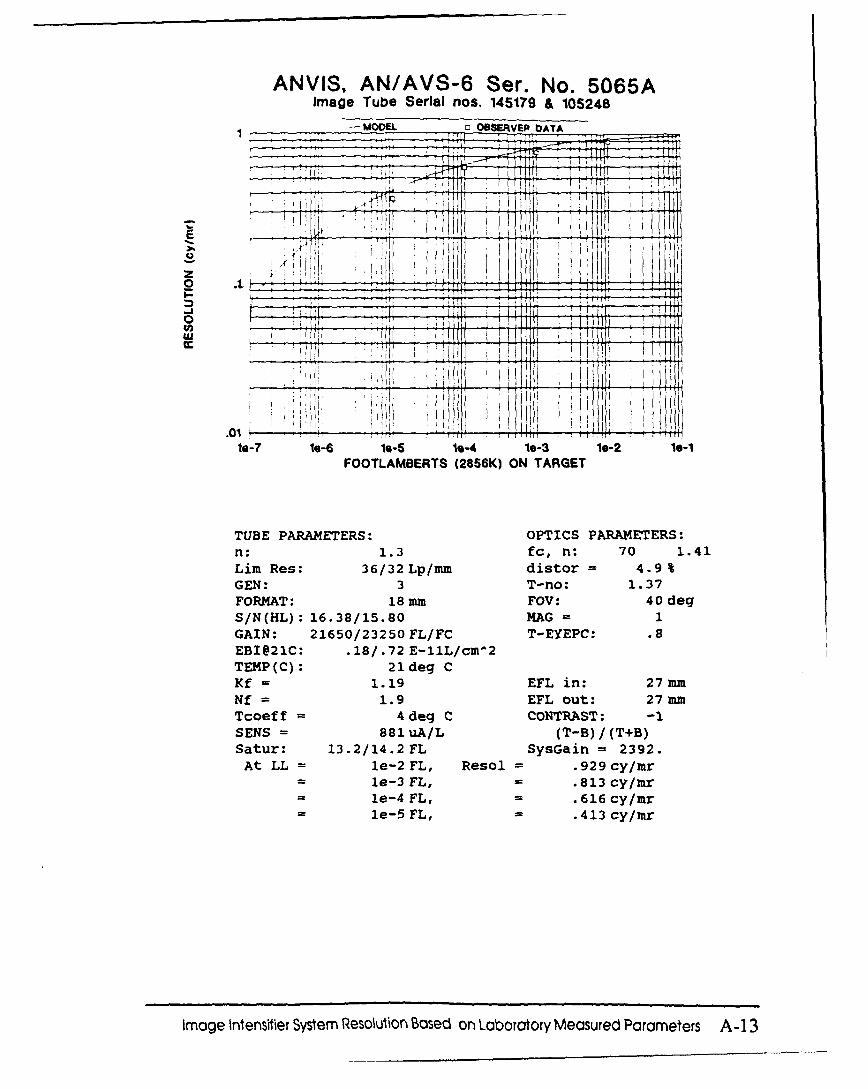
ANVIS, AN/AVS-6 Ser. No. 5065AImage Tube Serial nba. 145179 & 105248
I
,,iI 'p
z Io
o�-�1 I
II
_______________________ 11.01 I � *4B
1.-? Ie-6 1.-5 1.-4 1.-a 10-2 1.-iFOOTLAMBERTS (2856K) ON TARGET
TUBE PARAMETERS: OPTICS PARAMETERS:1.3 fc, n: 70 1.41
Lim Res: 36/32Lp/mm distor = 4.9%GEN: 3 T-no: 1.37FORMAT: 18mm FOV: 4OdegS/N(HL): 16.38/15.80 HAG 1GAIN: 21650/23250FL/FC T-EYEPC: .8EBI@21C: .18/.72 E-11L/cm�2TEMP(C): 2ldeg CKf = 1.19 EFL in: 27mmNt = 1.9 EFL Out: 27mmTcoeff 4deg C CONTRAST: -1SENS = 881uA/L (T-B)/(T+B)Satur: 13.2/14.2 FL SysGairi = 2392.
At LL le-2 FL, Resol = .929cy/mr- le-3FL, - .813cy/mr- le-4FL, - .616cy/lur- le-5FL, - .413cy/mr
Image �ntensif�er System Reso�utiOfl Based on Laboratory Measured Parameters A-I 3
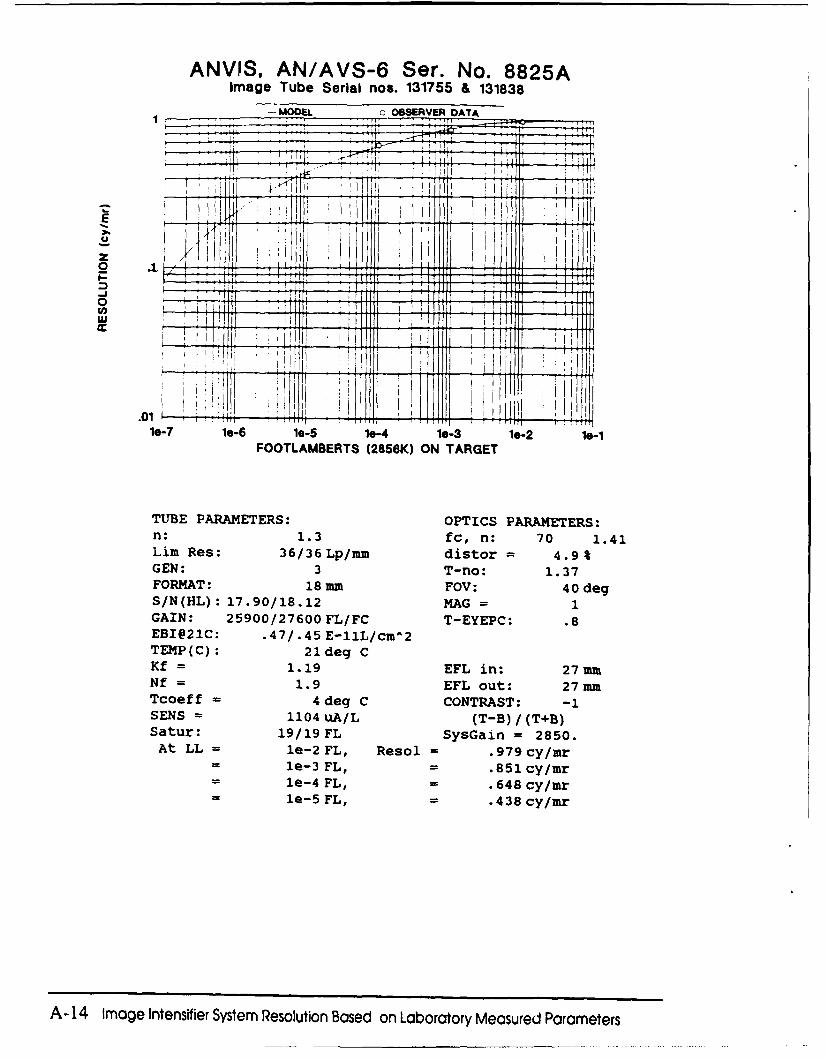
ANVJS, AN/AVS-6 Ser. No. 8825AImage Tube Serial nos. 131755 & 131838
-MODELc OBSERVER DATA
I T
E
Hil
001
10-7 1e-6 10-5 16-4 19-3 10-2 1.-1FOOTLAMBERTS (2856K) ON TARGET
TUBE PARAMETERS: OPTICS PARAMETERS:n:1.3 fc, n: 70 1.41
Lim Res: 36/36 Lp/mm distor = 4.9%GEN: 3 T-no: 1.37FORMAT: 18mm FOV: 40odegS/N(HL): 17.90/18.12 MAG = 1GAIN: 25900/27600 FL/FC T-EYEPC: .8EBI1@21C: .47/. 45 E-11L/cm-2TEMP(C): 21ldeg CKf = 1.19 EFL in: 27 mrNf = 1.9 EFL out: 27 mmTcoeff = 4 deg C CONTRAST: -1SENS =1104 uA/L (T-B) /(T+B)Satur: 19/19 FL SySGain = 2850.At LL = le-2 FL, Resol = .979 cy/mr
-le-3 FL, = .851 cy/ur-le-4 FL, = .648 cy/mr- le-5 FL, = .438 cy/ar
A- 14 Image Intensifier System Resolution Based on Laboratory Measured Parameters
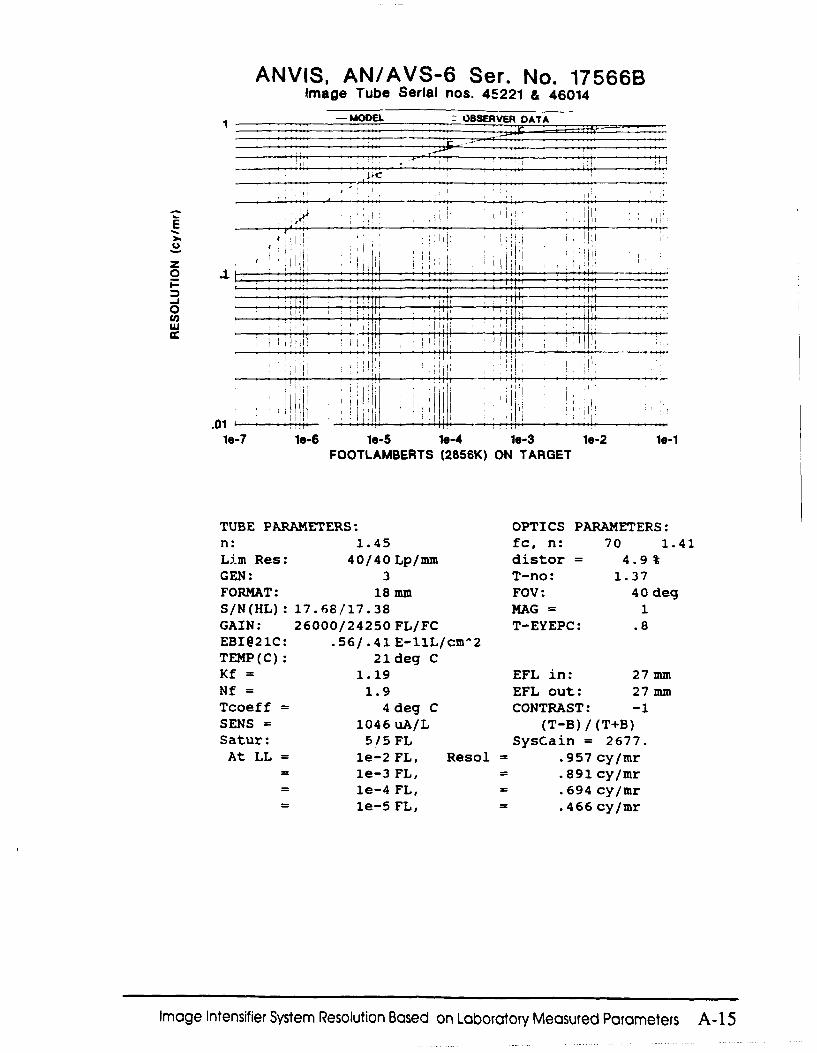
ANVIS, AN/AVS-6 Ser. No. 17566BImage Tube Serial nos. 45221 & 46014
-- -Mom OBSERVER DATA
z0
lr7 1- 1i - , 2 10-1
TUB PAAEES OPTIC PARAMETERS:s:f~i
n: 1.4 ,c n:, 70 1,.41
,. I_ _ _ _ _ _ _ _ _ _
Lim Res: 40/40hLL.. I ______.
1e-7 1e-6 1e-5 1.-4 le-3 1e-2 1.-iFOOTLAMBERTS (2856K) ON TARGET
TUBE PARAMETERS: OPTICS PARAMETERS :n:1.45 fc, n: 70 1.41
Lira Res: 40/40Lp/mm distor = 4.9 %
GEN: 3 T-no: 1.37FORMAT: 18 mm FOV: 40 degS/N(HL): 17.68/17.38 MAG = 1GAIN: 26000/24250 FL/FC T-EYEPC: .8EBI@21C: .56/.41 E-11L/cm^2TEMP(C): 21deg CKf = 1.19 EFL in: 27mmNf = 1.9 EFL out: 27mmTcoeff = 4 deg C CONTRAST: -1SENS = 1046 uA/L (T-B)/(T+B)Satur: 5/5 FL SysCain = 2677.At LL = le-2 FL, Resol = .957cy/mr
= le-3 FL, = .891 cy/mr= le-4 FL, = .694 cy/mr= le-5 FL, .466 cy/mr
Image Intensifier System Resolution Based on Laboratory Measured Parameters A- 15
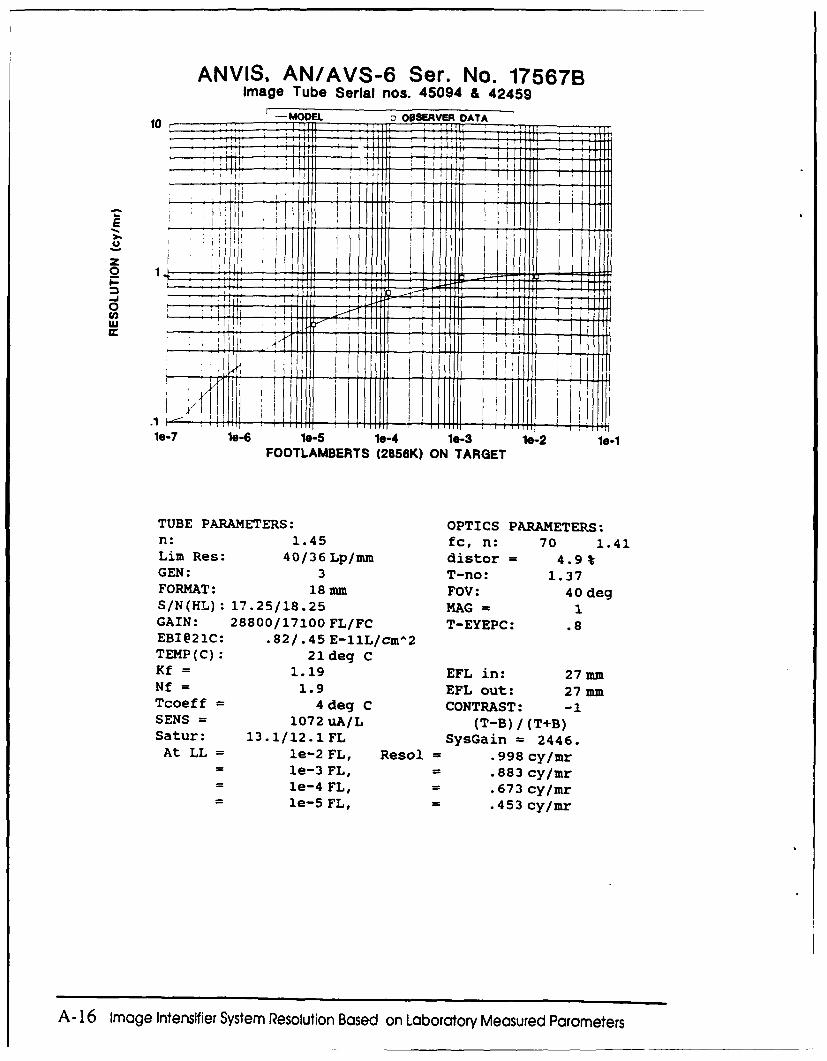
ANVIS, AN/AVS-6 Ser. No. 17567BImage Tube Serlia nos. 45094 & 42459
101TI-SEVRDTT 1 1 I
-J7
n0 1.5fc : 70 14
GeN: l-6 1- 3 e- le-ri 1.3710
FORMAT: 18 mm FOV: 40 degS/N(HL): 17.25/18.25 HAG = 1GAIN: 28800/17100 FLfFC T-EYEPC: .8EBI@21C: .82/.45 E-11L/cuv'2TEMP(C): 21ldeg CKf = 1.19 EFL in: 27 mmNf = 1.9 EFL out: 27 mmTcoeff = 4 deg C CONTRAST: -1SENS = 1072 UA/L (T-B)/(T4B)Satur: 13.1/12.-1Fl, SysGain = 2446.At LL = le-2 FL, Resol = .998 cy/mr
-le-3 FL, = .883 cy/mr- le-4 FL, = .673 cy/mr-le-5 FL, = .453 cy/mr
A- 16 Image Intensifier system Resolution Based on Laboratory measured Parameters
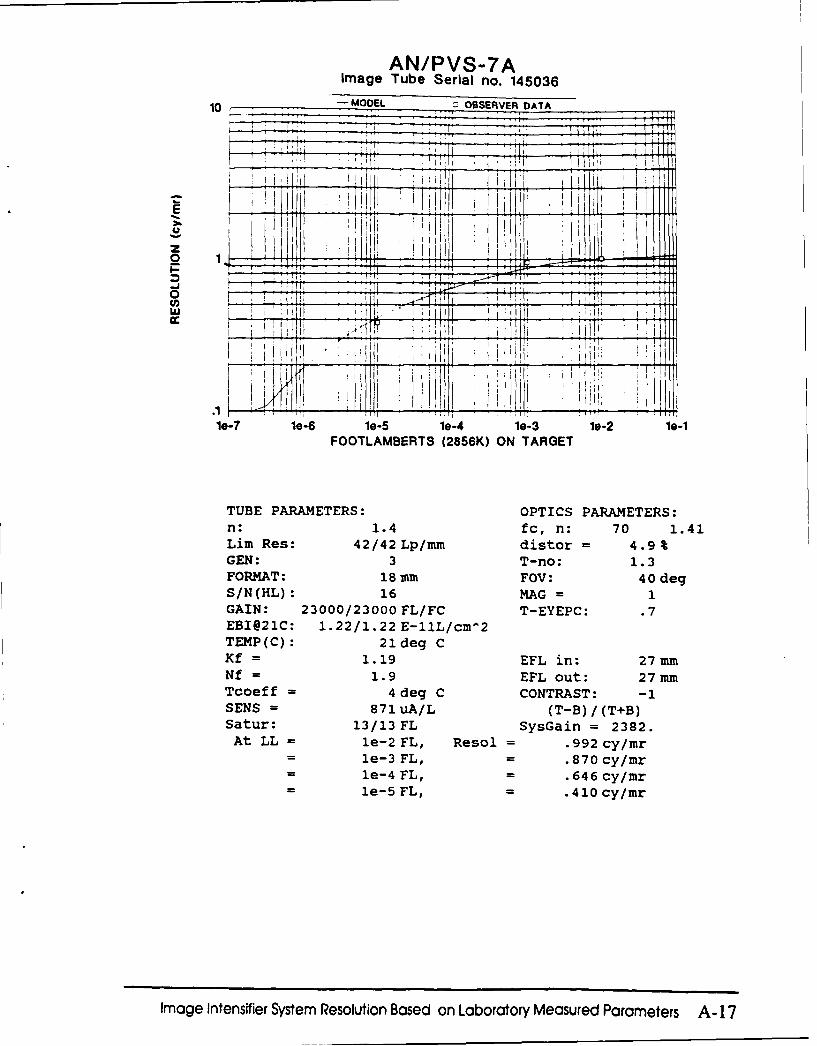
AN/PVS-7AImage Tube Serial no. 145036
10 ,- MODEL : OBSERVER DATA
;~~ I , i,, ir•
__ _ _ ,_ _ ___________' I! i l i !H ill-
2-1 I! I10 r
le-7 le-6 le-5 le-4 le-3 1-2 1e-1FOOTLAMBERTS (2856K) ON TARGET
TUBE PARAMETERS: OPTICS PARAMETERS:n: 1.4 fc, n: 70 1.41Lim Res: 42/42 Lp/mm distor = 4.9%GEN: 3 T-no: 1.3FORMAT: 18 mm FOV: 40 degS/N(HL): 16 MAG = 1GAIN: 23000/23000 FL/FC T-EYEPC: .7EBI@21C: 1.22/1.22 E-1lL/cm^2
TEMP(C): 21deg CKf = 1.19 EFL in: 27mmNf = 1.9 EFL out: 27mmTcoeff = 4 deg C CONTRAST: -1SENS = 871 uA/L (T-B)/(T+B)Satur: 13/13 FL SysGain = 2382.At LL = le-2 FL, Resol = .992 cy/mr
- le-3 FL, - .870 cy/mr= le-4 FL, = .646 cy/mr= le-5 FL, = .410 cy/mr
Image Intensifier System Resolution Based on Laboratory Measured Parameters A- 17
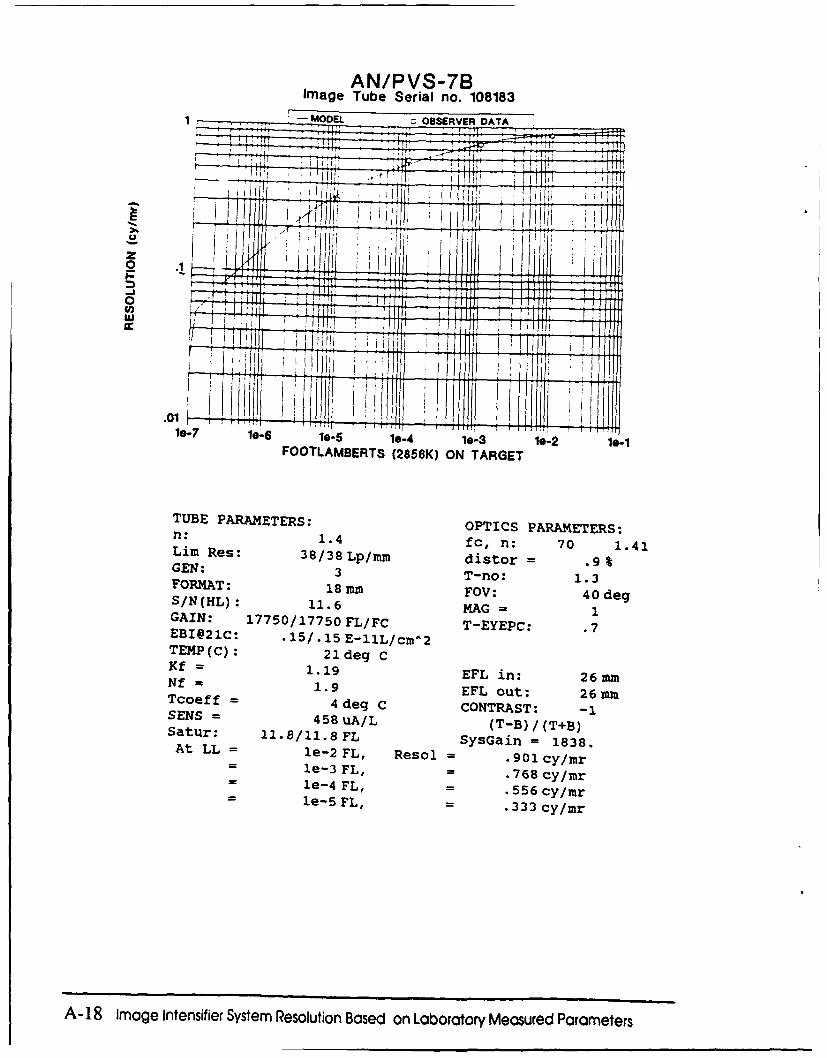
AN/P VS-7BImnage rube Serial no. 1081831 -MODEL zOBSERVER DATA
I T
UJI
w: 1. fc nt7.1 4
S/N(H 10-6 11.-6 10-4 =e31 10-GAIFNTL:BRT 1775016K5 ON/ TARETEC: .
n: 1.49 EFcL in: 70 1.4Lim- Res: EFL8Lm outo: 269mGENS: 5 3A/ (T-no: 1.3S/N(HL: 11.681.8F HAsGa = 18 .
GAIN:e- l7 S/? FLF TE 7E68 .7/EBI@21c: FL 15/.1 E-13L/cm
Kf- 1.19 EFL 3 in: 2mn
18Iag ntesfie ytmRslto ae 1.9 EFLr r Oeaut: d Pa 6metr
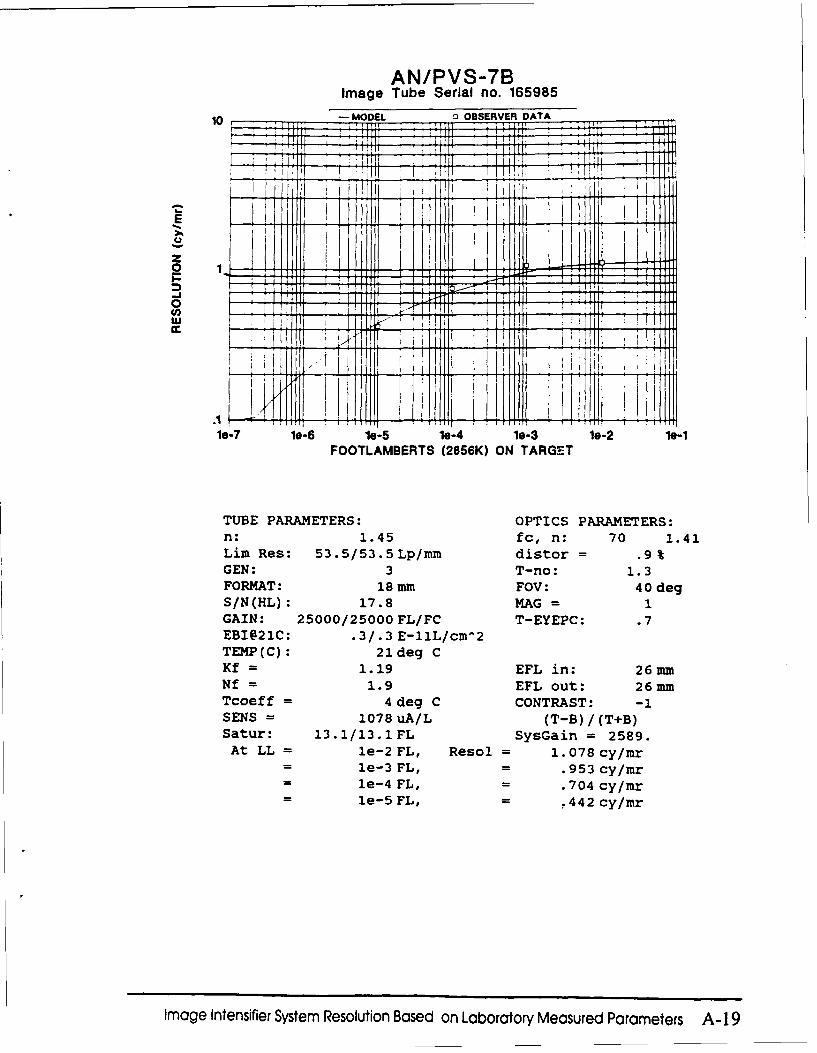
AN/PVS-7BImage Tube Serial no. 165985
10 -MODEL o OBSERVER DATA
z 0
i fil
le-7 le-6 1-5 le-4 le-3 le-2 10-1FOOTLAMBERTS (2856K) ON TARGET
TUBE PARAMETERS: OPTICS PARAMETERS:n: 1.45 fc, n: 70 1.41Lim Res: 53.5/53.5Lp/mm distor = .9%GEN: 3 T-no: 1.3FORMAT: 18 mm FOV: 40 degS/N(HL): 17.8 MAG = 1GAIN: 25000/25000 FL/FC T-EYEPC: .7EBI@21C: .3/.3 E-11L/cm^2TEMP(C): 21deg CKf = 1.19 EFL in: 26mmNf = 1.9 EFL out: 26mmTcoeff = 4 deg C CONTRAST: -1SENS = 1078 uA/L (T-B)/(T+B)Satur: 13.1/13.1 FL SysGain = 2589.At LL = le-2 FL, Resol = 1. 078 cy/mr
- le-3 FL, = .953 cy/mr= le-4 FL, = .704 cy/mr= le-5 FL, = .442 cy/mr
Image Intensifier System Resolution Based on Laboratory Measured Parameters A- 19
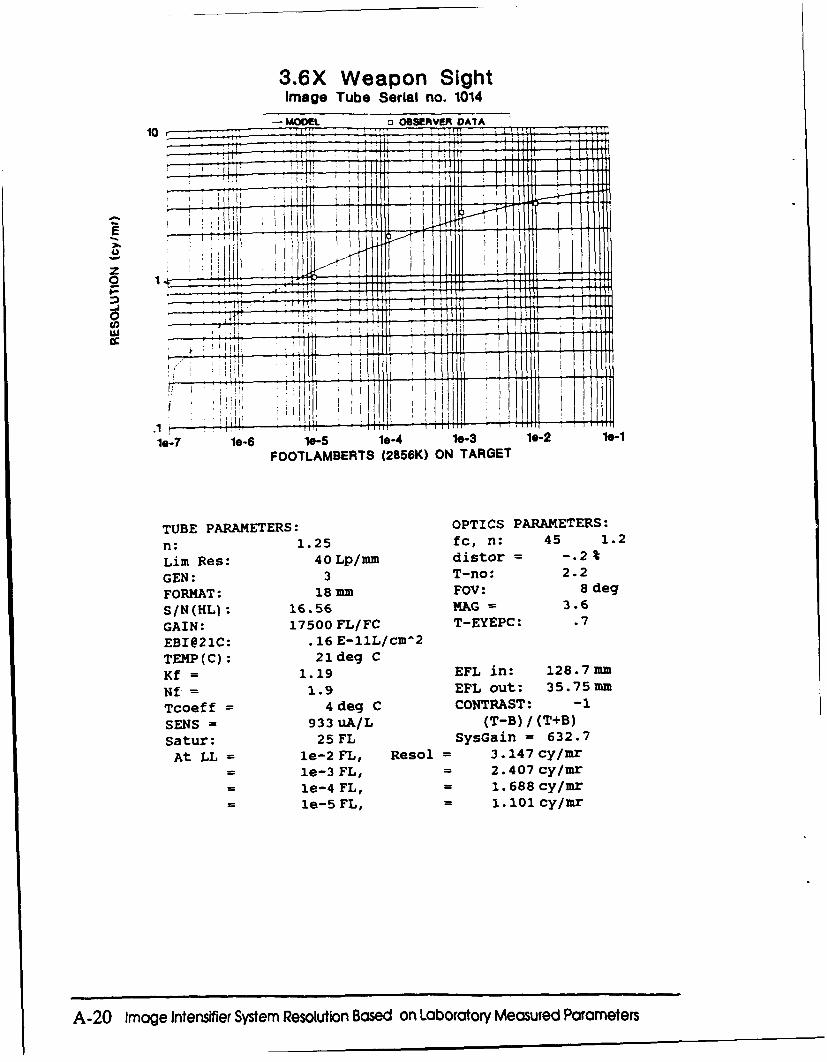
3.6X Weapon SightImage Tube Serial no. 1014
-MODEL OBSERVER DATA
Io I !
...............
E
CD
1.'-7 10-6 10-5 le-4 1.-3 19-2 1.-iFOOTLAMBERTS (2856K) ON TARGET
TUBE PARAMETERS: OPTICS PARAMETERS:n:1.25 fc, n: 45 1.2
Lim Res: 40 Lp/mm distor = -. 2%
GEN: 3 T-no: 2.2
FORMAT: 18 mm FOV: 8Sdeg
S/N(HL):. 16.56 NA1G 3.6
GAIN: 17500 FL/FC T-EYEPC: .7
EBI@21C: .16 E-11L/cm^2TEMP(C): 21ldeg CKf = 1.19 EFL in: 128.7 mm
Nf = 1.9 EFL out: 35.75 mm
Tcoeff = 4 deg C CONTRAST: -1
SENS = 933 uA/L (T-B)/(T+B)
Satur: 25FL SysGain = 632.7
At LL = le-2 FL, Resol = 3.147 cy/mr
-le-3 FL, = 2.407 cy/mr
-le-4 FL, = 1. 688 cy/Imr
-le-5 FL, 1. 101 lcy/mr
A-20 Image Intensifier System Resolution Based on Laboratory Measured Parameters
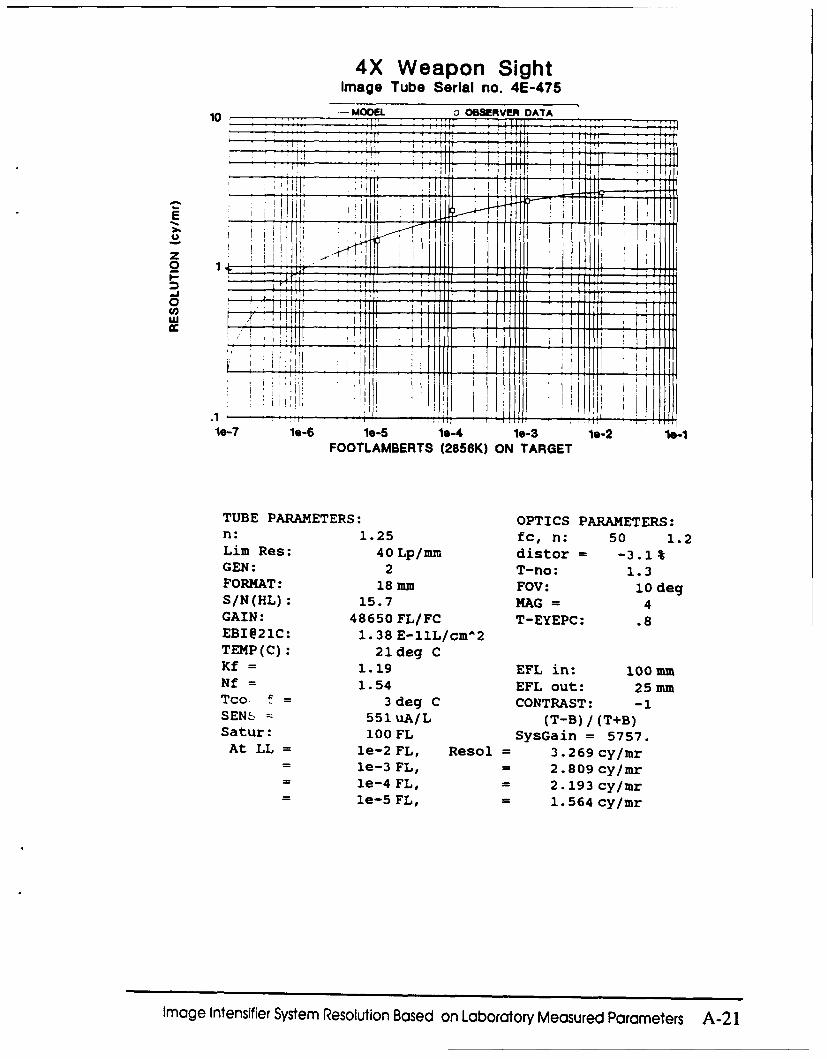
4X Weapon SightImage Tube Serial no. 4E-475
10 -- MO0D E OBSERVER DATA
z
0w
le-7 1e-6 1e-5 1e-4 1e-3 1e-2 1.-1FOOTLAMBERTS (2856K) ON TARGET
TUBE PARAMETERS: OPTICS PARAMETERS:n: 1.25 fc, n: 50 1.2Lim Res: 40Lp/mrm distor = -3.1%GEN: 2 T-no: 1.3FORMAT: 18 mm FOV: 10 degS/N(HL): 15.7 MAG = 4GAIN: 48650 FL/FC T-EYEPC: .8EBI@21C: 1.38 E-11L/cm^2TEMP(C): 21deg CKf = 1.19 EFL in: 100mmNf = 1.54 EFL out: 25mmTco : - 3 deg C CONTRAST: -1SENS 551uA/L (T-B)/(T+B)Satur: 100 FL SysGain = 5757.
At LL = le-2 FL, Resol = 3.269 cy/mr- le-3 FL, = 2.809 cy/mr- le-4 FL, = 2.193 cy/mr= le-5 FL, = 1. 564 cy/mr
Image Intensifier System Resolution Based on Laboratory Measured Parameters A-2 1
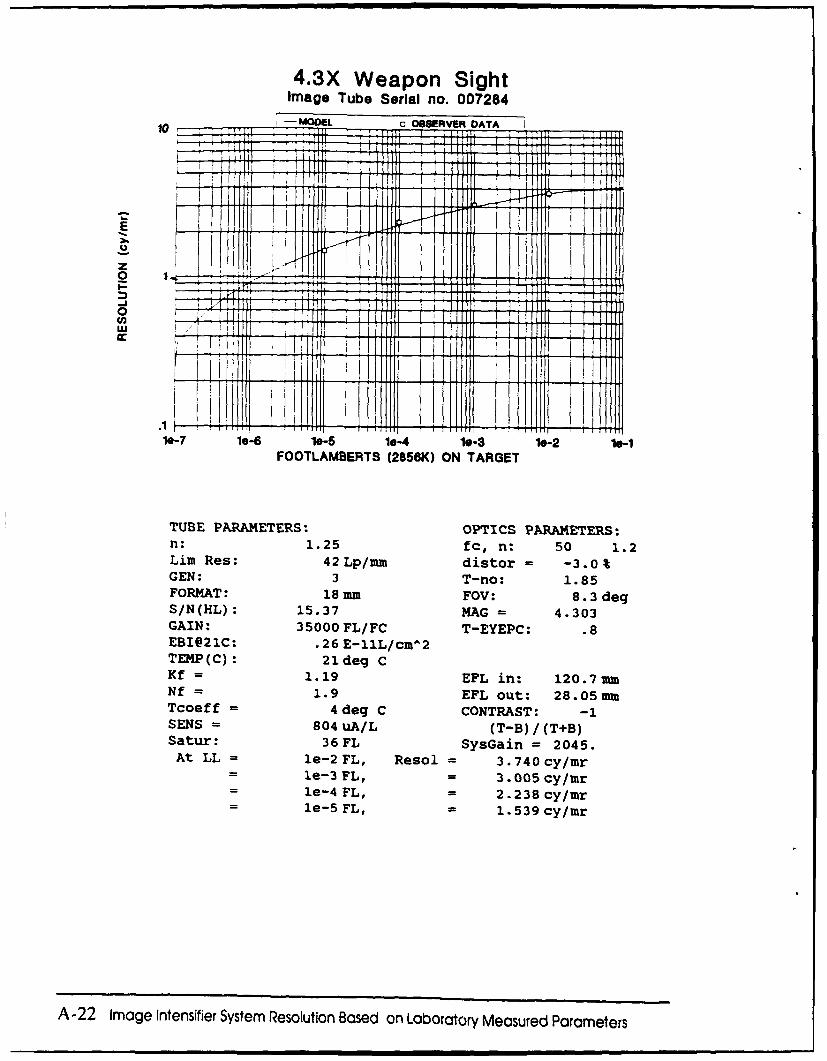
4.3X Weapon SightIm89e Tube Serial no. 007284
10 - OE.c OBSERVER DATA
z
19-7 16-6 10-5 16-4 10-3 lo-2 10-1FOOTLAMBERTS (2858K) ON TARGET
TUBE PARAMETERS: OPTICS PARAMETERS:n: 1.25 fc, n: 50 1.2Lim Res: 42 Lp/mm distor = -3.0%GEN: 3 T-no: 1.85FORMAT: 18 mm FOV: S. 3degS/N(HL): 15.37 MAG = 4.303GAIN: 35000 FL/FC T-EYEPC: .8EBI@21C: .26 E-11L,/cmA2TEHP(C): 21 deg CKf= 1.19 EFL in: 120.7 mm
Nf = 1.9 EFL out: 28.05 mmTcoeff = 4 deg C CONTRAST: -1SENS = 804 uA/L (T-B) /(T+B)Satur: 36 FL SysGain = 2045.At LL = le-2 FL, Resol = 3.740 cy/mr
- 1e-3 FL, = 3.005 cy/mr-le-4 FL, 2 2.238 cy/mr- e-5 FL, 1 -539 cy/mr
A-22 Image Intensifier System Resolution Based on Laboratory Measured Parameters
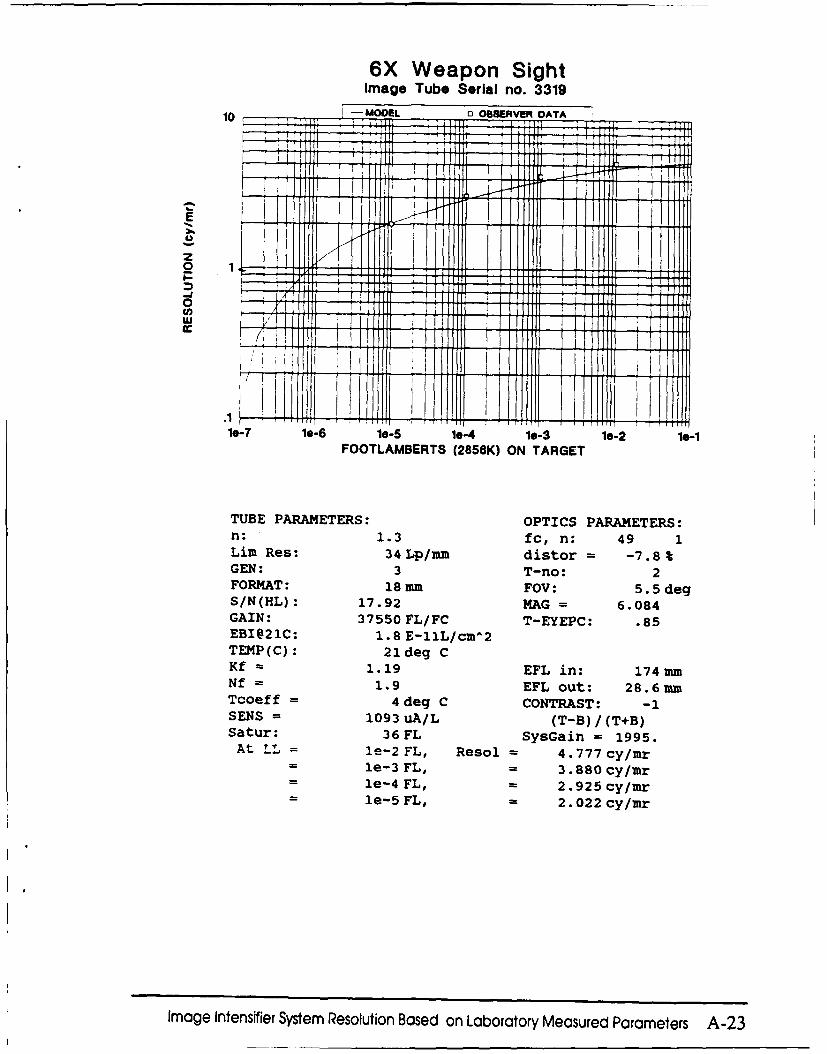
6X Weapon SightImage Tube Serial no. 3319
10 - ODL 013SRVER DATA
z0o Ifl
13I fcil:l4
GEN: e- 1- 13- T9-3o 2e21
FORAT 1.3it fOV: 49 1e
S/N(HL): 17.92 HAG =6.084
GAIN: 37550 FL/FC T-EYEPC: .85EBI§21C: 1.8 E-11L/cm'^2TEMP(C): 21ldeg CKf =1.19 EFL in: 174 mNf = 1.9 EFL out: 28.6 mmTcoeff = 4 deg C CONTRAST: -1SENS = 1093 uA/L (T-B) /(T+B)Satur: 36FL SysGairi = 1995.At LL =le-2 FL, Resol 4.777 cy/mr
-le-3 FL, 3.BB80cy/mr-le-4 FL, 2.925 cyfmr-le-5 FL, 2. 02 2cy/mr
Image Intensifier System Resolution Based on Laboratory Measured Parameters A-23
Distribution for Report No. AMSEL-NV-TR-O1 12
20 Director 1 Harry Diarr,•,- .-aborawryCECOM Center for Night Vision ATrN: Libr -), SLCHD-TL
and Electro-Optics 2800 Powder Mill RoadATTN: AMSEL-RD-NV.LPD Adelphi, MD 20783-1145FL Belvoir. VA 22060-5806
1 Commanding GeneralI Director US Army Test and Evaluation CommandUS Army Materiel Systems Analysis Activity ATTN: AMSTE-CGATTN: AMXSY-D APG. MD 21005-5005APG. MD 21005-5071
1 Commander12 Defense Technical Information Center US Army Infantry Center
ATTN: DTIC-FDA Ft. Benning, GA 31905-5065Cameron Station, Bldg 5Alexandria. VA 22304-6145 1 Commander
Avionics LaboratoryProject Manager Wright-Patterson AFB. OH 45433Night Vision DevicesUS Army Center for Night Vision and 1 PEO. Combat Aviation
Electro-Optics AMTN: AMCPEO-CAFL Belvoir, VA 22060-5806 US Army Aviation Systems Command
4300 Goodfellow BoulevardProgram Executive Officer, Aviation SL Louis, MO 63120-1798AMTN: AMCPEO-AV4300 Goodfellow Boulevard I Institute for Defense AnalysisSt. Louis. MO 63120-1798 ATTN: L. Biberman
1801 Beauregard StreetDirector Alexandria, VA 22311Defense Advanced Research Projects Agency1400 Wilson Boulevard 1 rrTT-EOPDArlington, VA 22209 7365 Plantation Road
Roanoke, VA 240191 Commander
US Naval Ordnance Lab/White Oak Litton Systems. Inc.AMrN: Technical Library Electron Devices DivisionSilver Spring, MD 20910 1215 South 52nd Street
Tempe, AZ 852811 Commander
Naval Electronics Lab Center 1 IntevacATTN: Library Electro-Optical Sensors DivisionSan Diego, CA 92152 601 California Avenue
Palo Alto, CA 94304-08831 Comnmander
Armament Development Center 1 IMO Industries, Inc.ATTN: DLOSL, Tech Library Electro-Optical SystemsEglin AFB. FL 32542 2203 W. Walnut Street
Garland, TX 750421 Director
US Army Human Engineering Lab I AAMRLATTN: SLCHE-D ATTN: Dr. L. TaskAPG. MD 21005 Wright-Patterson AFB, OH 45433
Commander 1 Department of the NavyUS Army Aviation RDE Center Naval Air Development CenterATTN: AMSAV-GTD (T. House) AMrN: L. Brindle4300 Goodfellow Boulevard Warminster. PA 18974Su Louis, MO 63 120-1798 1 Naval Coastal Systems
ATTN: D. Almond, Code 20ECoastal Systems StationPanama City. FL 32407
Distribution- 1


![Ongoing Changes in the Irish Intensifier Systemmartinschweinberger.de/docs/ppt/schweinberger-ppt... · Ongoing Changes in the Irish Intensifier System Author: Martin Schweinberger[.5cm]](https://img.pdfslide.us/doc/110x75/5fc2ae025ca29e04f07422f5/ongoing-changes-in-the-irish-intensifier-syste-ongoing-changes-in-the-irish-intensifier.jpg)