Embed Size (px)
Citation preview
Chapter 7
Image Fusion Based on Shearlets
Miao Qiguang, Shi Cheng and Li Weisheng
Additional information is available at the end of the chapter
http://dx.doi.org/10.5772/56945
1. Introduction
Image decomposition is important to image fusion and affects the information extractionquality, even the whole fusion quality. Wavelet theory has been developed since the begin‐ning of the last century. It was first applied to signal processing in the 1980’s[1], and overthe past decade it has been recognized as having great potential in image processing appli‐cations, as well as in image fusion[2]. Wavelet transforms are more useful than Fouriertransforms, and it is efficient in dealing with one-dimensional point-wise smooth signal[3-5]. However the limitations of the direction make it not perform well for multidimension‐al data. Images contain sharp transition such as edges, and wavelet transforms are not opti‐mally efficient in representing them.
Recently, a theory for multidimensional data called multi-scale geometric analysis (MGA)has been developed. Many MGA tools were proposed, such as ridgelet, curvelet, bandelet,contourlet, etc [6-9]. The new MGA tools provide higher directional sensitivity than wave‐lets. Shearlets, a new approach provided in 2005, possess not only all above properties, butequipped with a rich mathematical structure similar to wavelets, which are associated to amultiresolution analysis. The shearlets form a tight frame at various scales and directions,and are optimally sparse in representing images with edges. Only the curvelets has the simi‐lar properties with shearlets [10-14]. But the construction of curvelets is not built directly inthe discrete domain and it does not provide a multiresolution representation of the geome‐try. The decomposition of shearlets is similar to contourlets, while the contourlet transformconsists of an application of the Laplacian pyramid followed by directional filtering, forshearlets, the directional filtering is replaced by a shear matrix. An important advantage ofthe shearlet transform over the contourlet transform is that there are no restrictions on thedirection numbers. [15-19]
© 2013 Qiguang et al.; licensee InTech. This is a paper distributed under the terms of the Creative CommonsAttribution License (http://creativecommons.org/licenses/by/3.0), which permits unrestricted use,distribution, and reproduction in any medium, provided the original work is properly cited.

In recent years, the theory of the shearlets, which is used in image processing, has been stud‐ied gradually. Now the applications of shearlets are mainly in image denoising, sparse im‐age representation [20] and edge detection [21, 22]. Its applications in image fusion are stillunder exploring.
2. Shearlets [12, 20]
2.1. The theory of Shearlets
In dimension n =2, the affine systems with composite dilations are defined as follows.
/2 2, ,( ) { ( ) | det | (S ) : , , }y y y= = - Î Îj l j
AS j l kA x A A x k j l k¢ ¢ (1)
Where ψ∈ L 2(ℝ2), A, S are both 2×2 invertible matrices, and |detS | =1, the elements ofthis system are called composite wavelet if AAS (ψ) forms a tight frame for L 2(ℝ2).
∑j,l ,k
| < f , ψ j ,l ,k > | 2 = f 2
Let A denote the parabolic scaling matrix and S denote the shear matrix. For each a >0 ands∈ℝ,
A=(a 00 a
),S =(1 s0 1).
The matrices described above have the special roles in shearlet transform. The first matrix
(a 00 a
) controls the ‘scale’ of the shearlets, by applying a fine dilation faction along the two
axes, which ensures that the frequency support of the shearlets becomes increasingly elon‐
gated at finer scales. The second matrix (1 s0 1), on the other hand, is not expansive, and only
controls the orientation of the shearlets. The size of frequency support of the shearlets is il‐lustrated in Fig. 1 for some particular values of a and s.
ψ j ,l ,k for different values of a and s.
In references [12], assume a =4, s =1, where A= A0 is the anisotropic dilation matrix and S =S0
is the shear matrix, which are given by
A0 =(4 00 2), S0 =(1 1
0 1)For ∀ξ =(ξ1, ξ2)∈ ℝ̂2, ξ1≠0, let ψ̂(0)(ξ) be given by
New Advances in Image Fusion114

(0) (0) 21 2 1 1 2
1ˆ ˆ ˆ ˆ( ) ( , ) ( ) ( )xy x y x x y x y
x= = (2)
Where ψ̂1∈C ∞(ℝ) is a wavelet, and suppψ̂1⊂ −1/2, −1/16 ∪ 1/16, 1/2 ; ψ̂2∈C ∞(ℝ), and
suppψ̂2⊂ −1,1 . This implies ψ̂(0)∈C ∞(ℝ), and suppψ̂(0)⊂ −1/2, 1/2 2.
In addition, we assume that
2 21
0ˆ| (2 ) | 1, | | 1/8y w w-
³= ³å j
j(3)
and for ∀ j ≥0
2 12
22
ˆ| (2 ) | 1, | | 1y w w-
=-
- = £åj
j
j
ll (4)
There are several examples of functions ψ1, ψ2 satisfying the properties described above.
Eq. (3) and (4) imply that
(0)2 1 2 1
2 2 2 220 1 1 20
10 02 2
ˆ ˆ ˆ| ( ) | | (2 ) | | (2 ) | 1,xy x y x yx
- -- - -
³ ³=- =-
= - =å å å åj j
j j
j l j j
j jl lA S l (5)
Figure 1. frequency support of the shearlets
Image Fusion Based on Shearletshttp://dx.doi.org/10.5772/56945
115

for any (ξ1, ξ2)∈D0, where D0 ={(ξ1, ξ2)∈ ℝ̂2 : |ξ1 | ≥1/8, |ξ2 | ≤1}, the functions
{ψ̂(0)(ξA0− jS0
−l)} form a tiling of D0. This is illustrated in Fig.2 (a). This property describedabove implies that the collection
3(0) (0) 22
0 0, ,{ ( ) 2 ( ) : 0, 2 2 1, }y y= - ³ - £ £ - Îj
l j j jj l k x S A x k j l k ¢ (6)
is a Parseval frame for L 2(D0)∨={ f ∈ L 2(ℝ2) : supp f̂ ⊂D0}. And from the conditions on thesupport of ψ̂1 and ψ̂2 one can easily observe that the function ψ j ,l ,k have frequency support,
(0)j,k,l
2 1 2 4 2 4 2 1 21 2 1
1ˆsupp {( , ) : [ 2 , 2 ] [2 ,2 ],| 2 | 2 }xy x x x
x- - - - - -Ì Î - - + £j j j j j jlU (7)
That is, each element ψ⌢
j ,l ,k is support on a pair of trapezoids, of approximate size 22 j ×2 j,oriented along lines of slope l2− j.(see Fig.2 (b)).
Figure 2. (a) The tiling of the frequency by the shearlets; (b) The size of the frequency support of a shearlet ψ j ,l ,k .
Similarly we can construct a Parseval frame for L 2(D1)∨, where D1 is the vertical cone,
2 11 1 2 2
2
ˆ{( , ) :| | 1/8,| | 1},xx x xx
= Î ³ £D ¡ (8)
Let
A1 =(2 00 4), S1 =(1 0
1 1)
New Advances in Image Fusion116

and ψ̂(1)(ξ)= ψ̂(1)(ξ1, ξ2)= ψ̂1(ξ2)ψ̂2(ξ1ξ2
), where ψ̂1 and ψ̂2 are defined as (2) and (3), then the
Parseval frame for L 2(D1)∨ is as follows,
3(1) (1) 22
1 1, ,{ ( ) 2 ( ) : 0, 2 2 1, }.y y= - ³ - £ £ - Îj
l j j jj l k x S A x k j l k ¢ (9)
To make this discussion more rigorous, it will be useful to examine this problem from thepoint of view of approximation theory. If F ={ψμ :μ∈ I } is a bas is or, more generally, a tight
frame for L 2(R 2), then an image f can be approximated by the partial sums
, ,m mm
y yÎ
= < >åM
MI
f f (10)
Where IM is the index set of the M largest inner products | < f , ψμ > | . The resulting ap‐proximation error is
22|| || | , | ,mm
e yÏ
= - = åM
M MI
f f f (11)
and this quantity approaches asymptotically zero as M increases.
The approximation error of Fourier approximations is εM ≤CM −1/2, of the Wavelet is
εM ≤CM −1, and the approximation error of Shearlets is εM ≤C(logM )3M −2, which is betterthan Fourier and Wavelet approximations.
2.2. Discrete Shearlets
It will be convenient to describe the collection of shearlets presented above in a way whichis more suitable to derive numerical implementation. For ξ =(ξ1, ξ2)∈ R̂2, j ≥0 and
l = −2 j, ⋯ , 2 j −1, Let
0 1
0 1
2 12 2
1 2
0 2 1, 2 2
1 2
22
1
ˆ ˆ(2 ) ( ) (2 1) ( ) 2
ˆ ˆ( ) (2 ) ( ) (2 -1) ( ) 2 1
ˆ (2 )
x xy c x y c xx xx xx y c x y c xx xxyx
ì- + - + = -ï
ïïï= - + - = -íïï
-ïïî
j j jD D
j j jj l D D
j
l l l
W l l l
l otherwise
(12)
Image Fusion Based on Shearletshttp://dx.doi.org/10.5772/56945
117

and
0 1
0 1
2 12 2
1 2
1 2 1, 2 2
1 2
12
2
ˆ ˆ(2 1) ( ) (2 ) ( ) 2
ˆ ˆ( ) (2 1) ( ) (2 ) ( ) 2 1
ˆ (2 )
x xy c x y c xx xx xx y c x y c xx xxyx
ì- + + - = -ï
ïïï= - - + - = -íïï
-ïïî
j j jD D
j j jj l D D
j
l l l
W l l l
l otherwise
(13)
Where ψ2, D0, D1 are defined in section 2. For −2 j ≤ l ≤2 j −2, each term W j ,l(d )(ξ) is a window
function localized on a pair of trapezoids, as illustrated in fig.1a. When l = −2 j or l =2 j −1, atthe junction of the horizontal cone D0 and the vertical cone, W j ,l
(d )(ξ) is the superposition oftwo such function.
Using this notation, for j ≥0, −2 j + 1≤ l ≤2 j −2, k∈Z 2, d =0, 1, we can write the Fouriertransform of the Shearlets in the compact form
32( ) 2 ( )2
, , ,ˆ ( ) 2 (2 ) ( ) p xy x x x- ---=j ldd
ji A B kd j d
j l k j lV W e (14)
Where V (ξ1, ξ2)= ψ̂1(ξ1)χD0(ξ1, ξ2) + ψ̂1(ξ2)χD1
(ξ1, ξ2).
The Shearlet transform of f ∈ L 2(R 2) can be computed by
2
32( ) 2 ( )2
, , ,ˆ, 2 ( ) (2 ) ( ) p xy x x x x
- ---< >= òj ldd
ji A B kd j d
j l k j lR
f f V W e d (15)
Indeed, one can easily verify that
1 2 1( ) 2
1 2,0 2
| ( , ) | 1x x-
= =-
=å åj
j
dj l
d lW (16)
And form this it follows that
1 2 12 2 2 ( ) 2
1 2 1 2 1 2,0 0 2
ˆ| ( , )| | (2 ,2 ) || ( , ) | 1f x x x x x x-
= ³ =-
+ =åå åj
j
j j dj l
d j lV W (17)
New Advances in Image Fusion118

3. Multi-focus image fusion based on Shearlets
3.1. Algorithm framework of multi-focus image fusion using Shearlets
3.1.1. Image decomposition
Image decomposition based on shearlet transform is composed by two parts, decompositionof multi-direction and multi-scale.
1. Multi-direction decomposition of image using shear matrix S0 or S1.
2. Multi-scale decompose of each direction using wavelet packets decomposition.
In step (1), if the image is decomposed only by S0, or by S1, the number of the directions is2(l + 1) + 1. If the image is decomposed both by S0 and S1, the number of the directions is2(l + 2) + 2. The framework of Image decomposition with shearlets is shown in Fig. 3.
Figure 3. Image decomposition framework with shearlets
3.1.2. Image fusion
Image fusion framework based on shearlets is shown in Fig. 4. The following steps of imagefusion are adopted.
1. The two images taking part in the fusion are geometrically reg is tered to each other.
2. Transform the original images using shearlets. Both horizontal and vertical cones areadopted in this method. The number of the directions is 6. Then the wavelet packets areused in multi-scale decomposition with j =5.
Image Fusion Based on Shearletshttp://dx.doi.org/10.5772/56945
119

3. Fusion rule based on regional absolute value is adopted in this algorithem.
a. The choice of low frequency coefficients.
Low frequency coefficients of the fused image are replaced by the average of low frequencycoefficients of the two source images.
b. The choice of high frequency coefficients.
,( , ) | ( , ) |, ,
£ £= =åX Xi M j N
D i j Y i j X A B (18)
Calculate the absolute value of high frequency coefficients in the neighborhood by Eq.(18)Where M = N =3 is the size of the neighborhood, X denotes the two source images, DX (i, j)is the regional absolute value of X image within 3 neighborhood with the center at (i, j),YX (i, j) means the pixel value at (i, j) from X .
Select the high frequency coefficients from the two source images.
( , ) ( , ) ( , )( , )
( , ) ( , ) ( , )³ì
= í <îA B
A B
A i j D i j D i jF i j
B i j D i j D i j(19)
Where F is the high frequency coefficients of the fused image.
Finally the region consistency check is done based on the fuse-decision map, which is shownin Eq.(20).
1 ( , ) ( , )( , )
0 ( , ) ( , )³ì
= í <îA B
A B
D i j D i jMap i j
D i j D i j(20)
According to Eq.(20), if the certain coefficient in the fused image is to come from source im‐age A, but with the majority of its surrounding neighbors from B, this coefficient will beswitched to come from B.
4. The fused image is gotten using the inverse shearlet transform.
3.2. Simulation experiments
1. Multi-focus image of Bottle
The following group images are selected to prove the validity proposed in this section.
The two source images, Fig.5.(a) and (b), are the multi-focus images, which focus on the dif‐ferent parts. The fusion methods of these experiments are shearlets, contourlets, Haar, Dau‐bechies, PCA and Laplacian Pyramid (LP). Fusion rule mentioned above is used in this
New Advances in Image Fusion120

experiment. The following image quality metrics are used in this experiment: Standard devi‐ation (STD), Difference of entropy (DEN), Overall cross entropy (OCE), Entropy (EN),Sharpness (SP), Peak signal to noise ratio (PSNR), Mean square error (MSE) and Q.
(a) Focus on the left image (b) Focus on the right image (c) Original image
(d) Shearlet (e) Contourlet (f) Haar
(g) PCA (h) Daubechies (i) LP
Fig. 5. Fusion results on experiment images
Table 1. Comparison of multi-focus image fusion Figure 5. Fusion results on experiment images
Figure 4. Image fusion framework based on shearlets
Image Fusion Based on Shearletshttp://dx.doi.org/10.5772/56945
121
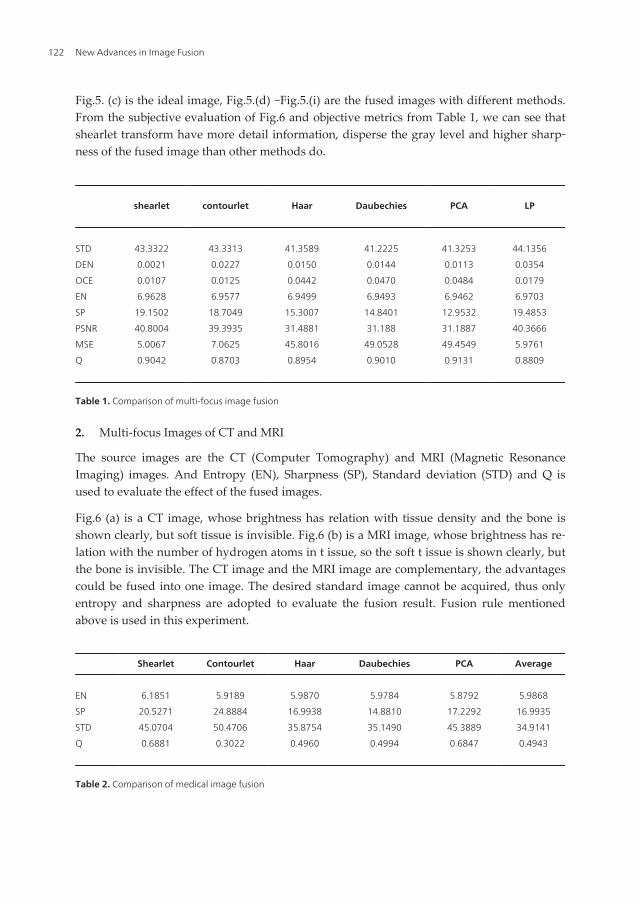
Fig.5. (c) is the ideal image, Fig.5.(d) ~Fig.5.(i) are the fused images with different methods.From the subjective evaluation of Fig.6 and objective metrics from Table 1, we can see thatshearlet transform have more detail information, disperse the gray level and higher sharp‐ness of the fused image than other methods do.
shearlet contourlet Haar Daubechies PCA LP
STD
DEN
OCE
EN
SP
PSNR
MSE
Q
43.3322
0.0021
0.0107
6.9628
19.1502
40.8004
5.0067
0.9042
43.3313
0.0227
0.0125
6.9577
18.7049
39.3935
7.0625
0.8703
41.3589
0.0150
0.0442
6.9499
15.3007
31.4881
45.8016
0.8954
41.2225
0.0144
0.0470
6.9493
14.8401
31.188
49.0528
0.9010
41.3253
0.0113
0.0484
6.9462
12.9532
31.1887
49.4549
0.9131
44.1356
0.0354
0.0179
6.9703
19.4853
40.3666
5.9761
0.8809
Table 1. Comparison of multi-focus image fusion
2. Multi-focus Images of CT and MRI
The source images are the CT (Computer Tomography) and MRI (Magnetic ResonanceImaging) images. And Entropy (EN), Sharpness (SP), Standard deviation (STD) and Q isused to evaluate the effect of the fused images.
Fig.6 (a) is a CT image, whose brightness has relation with tissue density and the bone isshown clearly, but soft tissue is invisible. Fig.6 (b) is a MRI image, whose brightness has re‐lation with the number of hydrogen atoms in t issue, so the soft t issue is shown clearly, butthe bone is invisible. The CT image and the MRI image are complementary, the advantagescould be fused into one image. The desired standard image cannot be acquired, thus onlyentropy and sharpness are adopted to evaluate the fusion result. Fusion rule mentionedabove is used in this experiment.
Shearlet Contourlet Haar Daubechies PCA Average
EN
SP
STD
Q
6.1851
20.5271
45.0704
0.6881
5.9189
24.8884
50.4706
0.3022
5.9870
16.9938
35.8754
0.4960
5.9784
14.8810
35.1490
0.4994
5.8792
17.2292
45.3889
0.6847
5.9868
16.9935
34.9141
0.4943
Table 2. Comparison of medical image fusion
New Advances in Image Fusion122

(a) CT (b) MRI (c) Shearlet
(d) Contourlet (e) Haar (f) Daubechies
(g) PCA (h) Average
Fig. 6. Fusion results on experiment images
Table 2. Comparison of medical image fusion
Shearlet Contourlet Haar Daubechies PCA Average
EN
SP
STD
Q
6.1851
20.5271
45.0704
0.6881
5.9189
24.8884
50.4706
0.3022
5.9870
16.9938
35.8754
0.4960
5.9784
14.8810
35.1490
0.4994
5.8792
17.2292
45.3889
0.6847
5.9868
16.9935
34.9141
0.4943
Figure 6. Fusion results on experiment images
4. Remote sensing image fusion based on Shearlets and PCNN
4.1. Theory of PCNN
PCNN, called the third generation artificial neural network, is feedback network formed bythe connection of lots of neurons, according to the inspiration of biologic v is ual cortex pat‐tern. Every neuron is made up of three sections: receptive section, modulation and pulsegenerator section, which can be described by discrete equation [23-25].
The receptive field receives the input from the other neurons or external environment, andtransmits them in two channels: F -channel and L -channel. In the modulation on field, adda positive offset on signal L j from L -channel; use the result to multiply modulation withsignal F j from F -channel. When the neuron threshold θj ≥U j, the pulse generator is turned
Image Fusion Based on Shearletshttp://dx.doi.org/10.5772/56945
123

off; otherwise, the pulse generator is turned on, and output a pulse. The mathematic modelof PCNN is described below [26-30].
[ ] exp( ) [ 1] [ 1]
[ ] exp( ) [ 1] [ 1]
[ ] [ ](1 [ ])
[ ] 1 [ ] [ ] 0
[ ] exp( ) [ 1] [ 1]q q
a
a
b
q
q a q
ì = - - + - +ï
= - - + -ïï = +íï = >ïï = - - + -î
åå
ij F ij F ijkl kl ij
ij L ij L ijkl kl
ij ij ij
ij ij ij
ij ij ij
F n F n V m Y n S
L n L n V w Y n
U n F n L n
Y n if U n n or otherwise
n n V Y n
(21)
Where αF , αL is the constant time of decay, αθ is the threshold constant time of decay, Vθ isthe threshold amplitude coefficient, VF , VL are the link amplitude coefficients, β is the val‐ue of link strength, and mijkl , wijkl are the link weight matrix.
2
ijw
kjw
ijM
kjM
LY
jkY
∑
∑
L
ijα
L
kjα
F
ijα
F
kjα
jkS
1jkLβ+
01
T
jV
T
jα
jkU
jkθ
jkY
1+
Figure 7. The model of PCNN neuron
2. Corrected references
Reference
[1] S. G. Mallat, Theory for Multiresolution Signal Decomposition: The Wavelet
Representation, IEEE Transaction on Pattern Analysis and Machine Intelligence,
11(1989),pp: 674-693.
[2] A. Krista, Z.Yun, D.Peter, Wavelet Based Image Fusion Techniques — An introduction,
review and comparison, International Society for Photogrammetry and Sensing, 62(2007), pp:
249-263.
[3] J. P. Antoine, P. Carrette, R. Murenzi, B. Piette, Image Analysis with Two Dimensional
Continuous Wavelet Transform. Signal Processing, 31(1993), pp: 241-272.
[4] F. G. Meyer, R. R. Coifman, Brushlets: A Tool for Directional Image Analysis and Image
Compression. Applied and Computational Hamonic Analysis, 4(1997), pp: 147-187.
[5] N. Kingsbury, Complex Wavelets for Shift Invarian Analysis and Filtering of Signals.
Applied and Computational Hamonic Analysis, 10(2001), pp: 234-253.
[6] P. Brémaud , Mathematical principles of signal processing: Fourier and wavelet Analysis,
New York, 2002.
[7] Y. Xiao-Hui, J. Licheng, Fusion Algorithm for Remote Sensing Images Based on
Nonsubsampled Contourlet Transform, Acta Automatica Sinica,34(2008), pp: 274-281.
[8] E. J. Candes, and D. L. Donoho, Continuous curvelet transform. I. Resolution of the
Figure 7. The model of PCNN neuron
4.2. Algorithm framework of remote sensing image fusion using Shearlts and PCNN
When PCNN is used for image processing, it is a single two-dimensional network. The num‐ber of the neurons is equal to the number of pixels. There is a one-to-one correspondencebetween the image pixels and the network neurons.
In this paper, Shearlets and PCNN are used to fuse images. The steps are described below:
1. Decompose the original images A and B respectively into many different directionsf NA, f̂ NA, f NB, f̂ NB (N =1, ..., n) via Shear matrixs (In this chapter, n =3).
New Advances in Image Fusion124
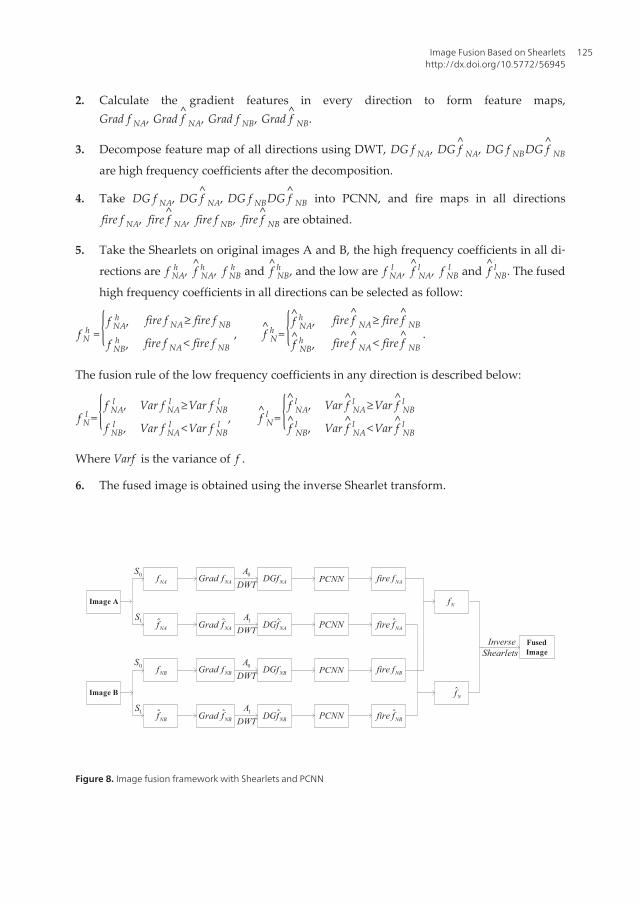
2. Calculate the gradient features in every direction to form feature maps,Grad f NA, Grad f̂ NA, Grad f NB, Grad f̂ NB.
3. Decompose feature map of all directions using DWT, DG f NA, DG f̂ NA, DG f NBDG f̂ NB
are high frequency coefficients after the decomposition.
4. Take DG f NA, DG f̂ NA, DG f NBDG f̂ NB into PCNN, and fire maps in all directions
fire f NA, fire f̂ NA, fire f NB, fire f̂ NB are obtained.
5. Take the Shearlets on original images A and B, the high frequency coefficients in all di‐
rections are f NAh , f̂ NA
h , f NBh and f̂ NB
h , and the low are f NAl , f̂ NA
l , f NBl and f̂ NB
l . The fused
high frequency coefficients in all directions can be selected as follow:
f Nh ={ f NA
h , fire f NA≥ fire f NB
f NBh , fire f NA < fire f NB
, f̂ Nh ={ f̂ NA
h , fire f̂ NA≥ fire f̂ NB
f̂ NBh , fire f̂ NA < fire f̂ NB
.
The fusion rule of the low frequency coefficients in any direction is described below:
f Nl ={ f NA
l , Var f NAl ≥Var f NB
l
f NBl , Var f NA
l <Var f NBl , f̂ N
l ={ f̂ NAl , Var f̂ NA
l ≥Var f̂ NBl
f̂ NBl , Var f̂ NA
l <Var f̂ NBl
Where Varf is the variance of f .
6. The fused image is obtained using the inverse Shearlet transform.
Image A
FusedImage
Image B
0S
0S
1S
1S
NAf
NBf
ˆNAf
ˆNBf
NAGrad f
NBGrad f
ˆNAGrad f
ˆNBGrad f
0A
0A
1A
1A
DWT
DWT
DWT
DWT
NADGf
NBDGf
ˆNADGf
ˆNBDGf
PCNN
PCNN
PCNN
PCNN
NAfire f
NBfire f
ˆNAfire f
ˆNBfire f
Nf
ˆNf
InverseShearlets
Figure 8. Image fusion framework with Shearlets and PCNN
Image Fusion Based on Shearletshttp://dx.doi.org/10.5772/56945
125
4.3. Simulation experiments
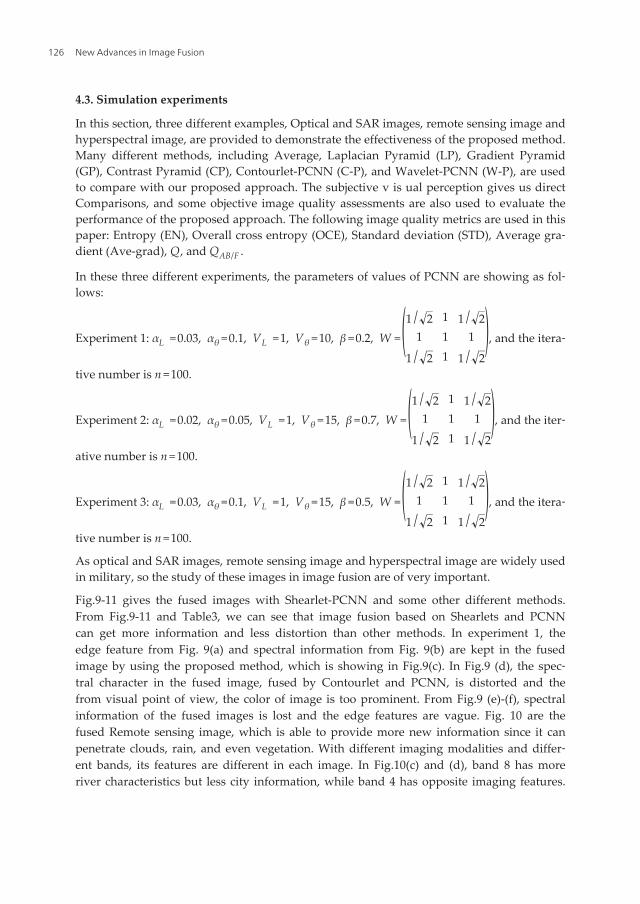
In this section, three different examples, Optical and SAR images, remote sensing image andhyperspectral image, are provided to demonstrate the effectiveness of the proposed method.Many different methods, including Average, Laplacian Pyramid (LP), Gradient Pyramid(GP), Contrast Pyramid (CP), Contourlet-PCNN (C-P), and Wavelet-PCNN (W-P), are usedto compare with our proposed approach. The subjective v is ual perception gives us directComparisons, and some objective image quality assessments are also used to evaluate theperformance of the proposed approach. The following image quality metrics are used in thispaper: Entropy (EN), Overall cross entropy (OCE), Standard deviation (STD), Average gra‐dient (Ave-grad), Q, and QAB/F .
In these three different experiments, the parameters of values of PCNN are showing as fol‐lows:
Experiment 1: αL =0.03, αθ =0.1, VL =1, Vθ =10, β =0.2, W =(1 / 2 1 1 / 21 1 1
1 / 2 1 1 / 2), and the itera‐
tive number is n =100.
Experiment 2: αL =0.02, αθ =0.05, VL =1, Vθ =15, β =0.7, W =(1 / 2 1 1 / 21 1 1
1 / 2 1 1 / 2), and the iter‐
ative number is n =100.
Experiment 3: αL =0.03, αθ =0.1, VL =1, Vθ =15, β =0.5, W =(1 / 2 1 1 / 21 1 1
1 / 2 1 1 / 2), and the itera‐
tive number is n =100.
As optical and SAR images, remote sensing image and hyperspectral image are widely usedin military, so the study of these images in image fusion are of very important.
Fig.9-11 gives the fused images with Shearlet-PCNN and some other different methods.From Fig.9-11 and Table3, we can see that image fusion based on Shearlets and PCNNcan get more information and less distortion than other methods. In experiment 1, theedge feature from Fig. 9(a) and spectral information from Fig. 9(b) are kept in the fusedimage by using the proposed method, which is showing in Fig.9(c). In Fig.9 (d), the spec‐tral character in the fused image, fused by Contourlet and PCNN, is distorted and thefrom visual point of view, the color of image is too prominent. From Fig.9 (e)-(f), spectralinformation of the fused images is lost and the edge features are vague. Fig. 10 are thefused Remote sensing image, which is able to provide more new information since it canpenetrate clouds, rain, and even vegetation. With different imaging modalities and differ‐ent bands, its features are different in each image. In Fig.10(c) and (d), band 8 has moreriver characteristics but less city information, while band 4 has opposite imaging features.
New Advances in Image Fusion126

Fig.10 (c) is the fused image using Shearlets and PCNN. The numerical results in Fig.5and Table 1 show that the fused image based on Shearlets and PCNN keep better riverinformation, and even involve excellent city features. In Fig 10.(d), in the middle of thefused image using Contourlet and PCNN, has obvious splicing effect. Fig.11(c) is thefused Hyperspectral image. Fig.11(a) and (b) are the two original images, The track of theairport is clear in Fig.11(a), however, some planes information are lost. Fig. 11(b) showsthe different information. In the fused image, the track information is more clearly, andaircrafts characters are more obvious. But lines on the runways are not clear enough inthe fused images using other methods. From Table 3 we can see that most metric valuesusing the proposed method are better than other methods do.
can see that most metric values using the proposed method are better than other methods do.
(a) Optical (b) SAR (c) Shearlet—PCNN
(d) C-P (e) W-P (f) CP
(g) Average (h) LP (i) GP
Fig.9 Optical and SAR images fusion results based on Shearlets and PCNN
Figure 9. Optical and SAR images fusion results based on Shearlets and PCNN
Image Fusion Based on Shearletshttp://dx.doi.org/10.5772/56945
127

(a) remote-8 (b) remote-4 (c) Shearlet—PCNN
(d) C-P (e) GP (f) LP
(g) CP (h) W-P (i) Average
Fig.10 Remote sensing image fusion results based on Shearlets and PCNN
Figure 10. Remote sensing image fusion results based on Shearlets and PCNN
New Advances in Image Fusion128

(a) Hyperspectral 1 (b) Hyperspectral 2 (c) Shearlet—PCNN
(d) C-P (e)GP (f) LP
(g) CP (h) W-P (i) Average
Fig.11 Hyperspectral image fusion results based on Shearlets and PCNN
Table 1 Comparison of image quality metrics
Dataset Algorithm /AB FQ Q EN STD Ave‐grad OCE
Experiment 1 Average
LP
GP
CP
C‐P
W‐P
proposed
0.1842
0.3002
0.2412
0.2816
0.3562
0.3753
0.4226
0.2908
0.3017
0.2953
0.2961
0.4523
0.4976
0.5010
6.3620
6.5209
6.3993
6.4759
6.7424
6.6142
6.9961
22.1091
24.8906
22.6744
24.1864
31.2693
25.2683
34.1192
0.0285
0.0478
0.0379
0.0457
0.0665
0.0662
0.0575
3.2870
3.0844
3.2336
3.1292
0.5538
0.5689
0.5410
Figure 11. Hyperspectral image fusion results based on Shearlets and PCNN
Image Fusion Based on Shearletshttp://dx.doi.org/10.5772/56945
129
Dataset Algorithm QAB/F Q EN STD Ave-grad OCE
Experiment 1 Average
LP
GP
CP
C-P
W-P
proposed
0.1842
0.3002
0.2412
0.2816
0.3562
0.3753
0.4226
0.2908
0.3017
0.2953
0.2961
0.4523
0.4976
0.5010
6.3620
6.5209
6.3993
6.4759
6.7424
6.6142
6.9961
22.1091
24.8906
22.6744
24.1864
31.2693
25.2683
34.1192
0.0285
0.0478
0.0379
0.0457
0.0665
0.0662
0.0575
3.2870
3.0844
3.2336
3.1292
0.5538
0.5689
0.5410
Experiment 2 Average
LP
GP
CP
C-P
W-P
proposed
0.4016
0.5219
0.4736
0.5120
0.5658
0.4283
0.6212
0.7581
0.7530
0.7599
0.7475
0.7516
0.7547
0.7775
6.1975
6.9594
6.9024
6.9237
7.3332
6.8543
7.1572
46.1587
49.2283
47.0888
48.9839
54.3504
47.3304
56.2993
0.0236
0.0399
0.0342
0.0392
0.0390
0.0346
0.0381
2.9600
3.3738
3.6190
3.3812
3.0628
3.2436
2.9046
Experiment 3 Average
LP
GP
CP
C-P
W-P
proposed
0.5021
0.6414
0.5720
0.5909
0.5838
0.5319
0.6230
0.7955
0.7728
0.7898
0.7469
0.7435
0.7788
0.7502
6.5011
6.8883
6.5649
6.7499
6.9451
6.5847
7.0791
41.0552
47.4990
41.3974
43.4631
46.5294
41.6623
55.9533
0.0161
0.0274
0.0223
0.0318
0.0262
0.0231
0.0246
1.0939
0.9959
1.0249
0.9834
1.1745
1.5318
0.5246
Table 3. Comparison of image quality metrics
5. Conclusion
The theory of Shearlets is introduced in this chapter. As a novel MGA tool, shearlets offermore advantages over other MGA tools. The main advangtage of shearlets is that it can bestudied within the framework of a generalized Multi-Resolution Analysis and with direc‐tional subdivision schemes generalizing those of traditional wavelets. This is very relevantfor the development of fast algorithmic implementations of the many directional representa‐tion systems proved in the last decade.
In this chapter, we have succeed in demonstrations that shearlets are very competitive for‐multi-focus image and remote sensing image fusion. As a new MGA tool, Shearlet is equip‐ped with a rich mathematical structure similar to wavelet and can capture the informationin any direction. And the edge and orientation information are more sensitive than gray ac‐cording to human visibility. We take full advantage of multidirection of Shearlets and gradi‐ent information to fuse image. Moreover, PCNN is selected as a fusion rule to select thefusion coefficients. Because the character is tics of directional and gradient facilitate motivat‐ing PCNN neurons, the more precise image fusion results are gotten. Several different kinds
New Advances in Image Fusion130

of images, shown in the experiments, prove that the new algorithm we proposed in thischapter is effective.
After development in recent years, the theory of Shearlets is gradually improving. But thetime complexity of Shearlets decomposition has been the focus of the study. Which need fur‐ther study, especially in its theory and applications. We will focus on other image process‐ing methods using shearlets in our future work.
Author details
Miao Qiguang, Shi Cheng and Li Weisheng
References
[1] S. G. Mallat, Theory for Multiresolution Signal Decomposition: The Wavelet Repre‐sentation, IEEE Transaction on Pattern Analysis and Machine Intelligence,11(1989),pp: 674-693.
[2] A. Krista, Z.Yun, D.Peter, Wavelet Based Image Fusion Techniques — An introduc‐tion, review and comparison, International Society for Photogrammetry and Sensing,62(2007), pp: 249-263.
[3] J. P. Antoine, P. Carrette, R. Murenzi, B. Piette, Image Analysis with Two Dimension‐al Continuous Wavelet Transform. Signal Processing, 31(1993), pp: 241-272.
[4] F. G. Meyer, R. R. Coifman, Brushlets: A Tool for Directional Image Analysis and Im‐age Compression. Applied and Computational Hamonic Analysis, 4(1997), pp:147-187.
[5] N. Kingsbury, Complex Wavelets for Shift Invarian Analysis and Filtering of Signals.Applied and Computational Hamonic Analysis, 10(2001), pp: 234-253.
[6] P. Brémaud , Mathematical principles of signal processing: Fourier and waveletAnalysis, New York, 2002.
[7] Y. Xiao-Hui, J. Licheng, Fusion Algorithm for Remote Sensing Images Based on Non‐subsampled Contourlet Transform, Acta Automatica Sinica,34(2008), pp: 274-281.
[8] E. J. Candes, and D. L. Donoho, Continuous curvelet transform. I. Resolution of thewavefront set, Applied Computational Harmonic Analysis, 19 (2005), pp:162-197.
[9] M.N.Do, M.Vetterli, The Contourlet Transform: An Efficient Directional Multiresolu‐tion Image Representation, IEEE Transaction on Image Processing, 14(2005), pp:2091-2106.
Image Fusion Based on Shearletshttp://dx.doi.org/10.5772/56945
131
[10] M. QiGuang, W. BaoShu, Multi-Focus Image Fusion Based on Wavelet Transformand Local Energy, Computer Science, 35(2008), pp: 231-235.
[11] Wang-Q Lin, The Discrete Shearlet Transform: A New Directional Transform andCompactly supported Shearlet Frame, 5(2010), pp:1166-1180.
[12] G. Easley, Demetrio Labate and Wang-Q Lim, Sparse Directional Image Representa‐tions using the Discrete Shearlet Transform, Applied Computational Harmonic Anal‐ysis, 25(2008), pp: 25-46.
[13] G.Kutyniok. and D. Labate, Construction of Regular and Irregular Shearlet Frames,Journal of Wavelet Theory and Applications, 1(2007), pp: 1-10.
[14] G. Kutyniok and Wang-Q Lin, Image Separation Using Wavelets and Shearlets, Lec‐ture Notes in Computer Science, 6920(2012), pp:416-430.
[15] K.Guo and D.Labate, Optimally Sparse Multidimensional Representation usingShearlets, SIAM Journal on Mathematical Analysis, 39(2007), pp: 298-318.
[16] G. Kutyniok and D. Labate, Resolution of the Wavefront Set using Continuous Shear‐lets, Trans. Amer. Math. Soc, 361(2009), pp:2719-2754. Shearlet webpage, http://www.shearlet.org.
[17] K. Guo, W. Lim, D. Labate, G. Weiss, E. Wilson. The theory of wavelets with compo‐site dilations[J]. Harmonic Analysis and Applications. 4(2006), pp:231–249.
[18] K. Guo, W. Lim, D. Labate, G. Weiss, E. Wilson. Wavelets with composite dilationsand their MRA properties[J]. Appl. Comput. Harmon. Anal.,20(2006), pp:231–249.
[19] K. Guo, D. Labate and W. Lim, Edge Analysis and Identification using the Continu‐ous Shearlet Transform, Applied Computational Harmonic Analysis, 27(2009), pp:24-46.
[20] G. Kutyniok and Wang-Q Lin, Image Separation Using Wavelets and Shearlets, Lec‐ture Notes in Computer Science, 6920(2012), pp:416-430.
[21] K. Guo, W. Lim, D. Labate, G. Weiss, E. Wilson. Wavelets with composite dila‐tions[J]. Electron. Res. Announc. Amer. Math. Soc., 10(2004), pp:78–87.
[22] R. Eckhorn, H. J. Reitboeck, M Arndt et al. Feature linking via synchronizationamong distributed assemblies: Simulation of results from cat cortex, Neural Compu‐tation, 2(1990), pp: 293-307.
[23] R. Eckhorn, H. J. Reitboeck, M Arndt et al. Feature linking via Stimulus-Evoked Os‐cillstions: Experimental Results form Cat Visual Cortex and Functional Implicationsform Network Model. In:Proc Int JCNN, Washington D C. 1(1989), pp:723-730.
[24] W. Jin, Z. J. Li, L. S. Wei, H. Zhen, The improvements of BP neural network learningalgorithm, Signal Processing Proceedings ,2000, WCCC-ICSP 2000. 5th InternationalConference on, 3(2000),pp: 1647-1649.
New Advances in Image Fusion132
[25] R. P. Broussard, S. K. Rogers, M. E. Oxley et al, Physiologically motivated image fu‐sion for object detection using a pulse coupled neural network , IEEE Trans. NeuralNetwork,10(1999), pp:554-563.
[26] W. Chen, L.C. Jiao, Adaptive tracking for periodically time-varying and nonlinearlyparameterized systems using multilayer neural networks, IEEE Trans. on NeuralNetworks, 21(2010), pp:345-351.
[27] W. Chen, Z.Q. Zhang, Globally stable adaptive backstepping fuzzy control for out‐put-feedback systems with unknown high-frequency gain sign, Fuzzy Sets and Sys‐tems, 161(2010), pp: 821-836.
[28] X.B.Qu, J.W.Yan, Image Fusion Algorithm Based on Features Motivated Multi-chan‐nel Pulse Coupled Neural Networks, Bioinformatics and Biomedical Engineering,1(2008),pp: 2103-2106.
[29] X.B.Qu, C.W. Hu, J.W.Yan, Image Fusion Algorithm Based On Orientation Informa‐tion Motivated Pulse Coupled Neural Networks, Intelligent Control and Automa‐tion, 1(2008),pp: 2437-2441.
[30] G.R. Easley, D. Labate, and F. Colonna, Shearlet Based Total Variation Diffusion forDenoising, IEEE Trans. Image Process. 18(2009),pp: 260-268.
Image Fusion Based on Shearletshttp://dx.doi.org/10.5772/56945
133


![The Construction of Smooth Parseval Frames of Shearlets · Parseval frame of shearlets provides nearly optimally sparse approximations piecewise C2 functions in L2(R3) [17, 18]. 1.1](https://img.pdfslide.us/doc/110x75/5f8ee2278c22d7652848fd98/the-construction-of-smooth-parseval-frames-of-shearlets-parseval-frame-of-shearlets.jpg)