Embed Size (px)
Citation preview

Page 1 of 35 7/26/13
MB1 ‘IMAGE’ CONTROL SOFTWARE MANUAL
Version: 1.6
Teledyne Odom Hydrographic 1450 Seaboard Avenue
Baton Rouge Louisiana 70810
United States of America
Telephone: +1 (225) 769-3051 Fax: +1 (225) 766-5122
[email protected] www.odomhydrographic.com
Number of pages: 35 Date: 30 August 2013

MB1 User Manual
Page 2 of 35 7/30/13
Revision History
© ODOM HYDROGRAPHIC SYSTEMS, INC. 2013 All rights are reserved. Reproduction in whole or in part is prohibited without the prior written consent of the copyright owner. The information presented in this document does not form part of any quotation or contract, is believed to be accurate and reliable and may be subject to change without notice. The publisher will not accept any liability for any consequence of its use. Publication thereof does not convey nor imply any license under patent- or other industrial or intellectual property rights.
Version Date Author Remarks 0.1 17 May 12 M Redmayne Image Version 0.0.69 1.0 18 May 12 M Redmayne Image Version 1.0.0 1.1 18 Jun 12 M Redmayne Added:
1. Installation of .NET4 2. Description on pinging network devices in CMD window 3. Minor edits
1.2 22 Aug 12 M Redmayne Image Version 1.0.10 1.3 6 Dec 12 M Redmayne Image Version 1.0.32
Included Annex for Hypack Setup 1.4 26 Apr 13 M Redmayne Image Version 1.0.65 1.5 23 May 13 M Redmayne Image Version 1.1.4 1.6 30 Aug 13 J Hoffmann ANNEX F revision, Changed Hypack
2012 to 2013 Image Version 1.1.11

MB1 User Manual
Page 3 of 35 7/30/13
Contents Revision History ............................................................................................................................ 2
1. INTRODUCTION ................................................................................................................... 4
1.1 Warnings and Cautions .................................................................................................. 4
2 CONTROL SOFTWARE INSTALL AND CONFIGURATION................................................. 5
2.1 Set Up Top Side Processing Unit (TSPU) PC ................................................................ 5
2.1.1 Install Software ........................................................................................................ 5
2.1.2 Connect TSPU PC to RTA ...................................................................................... 6
2.2 Software Overview ......................................................................................................... 7
2.2.1 Setup Menu ............................................................................................................. 8
2.2.2 Status Indicators ...................................................................................................... 9
2.3 Configuring the Input Sensors ...................................................................................... 10
2.3.1 Serial Data ............................................................................................................. 10
2.3.2 Network Data ......................................................................................................... 10
2.3.3 Using the MB1 with Two Sonar Heads (Dual Head) ................................................. 11
2.3.4 Using a Single Computer For Image & Data Acquisition .......................................... 11
2.4 Connect to the RTA and Start Pinging ......................................................................... 11
2.4.1 Start Pinging .......................................................................................................... 12
2.4.2 Data Views ............................................................................................................ 13
3 COLLECTING DATA ........................................................................................................... 16
3.1 Operating the Sonar in Real Time ................................................................................ 16
3.1.1 Configure Sonar .................................................................................................... 16
3.2 Logging Data ................................................................................................................ 20
3.2.1 Raw Data ............................................................................................................... 21
3.2.2 TDY Output ........................................................................................................... 21
3.3 Playback of Previously Collected Data ......................................................................... 21
ANNEX A - RTA DATAGRAMS .................................................................................................. 23
ANNEX B - PATCH TESTING THE MB1 .................................................................................... 24
ANNEX C - SETTING UP MB1 WITH HYPACK 2013 ................................................................ 27
ANNEX D - COMMON ACRONYMS USED IN THIS MANUAL .................................................. 30
ANNEX E - THREE DIMENSIONAL SIGN CONVENTION USED FOR MB1 ............................ 31
ANNEX F – UPGRADING THE FIRMWARE WITHIN THE MB1 ................................................ 32

MB1 User Manual
Page 4 of 35 7/30/13
1. INTRODUCTION The MB1 control software is an integral part of the MB1 multibeam echo sounder. Unlike many other multibeam systems, the software performs all of the processing of the raw acoustic data in real time, which allows future upgrades of the system to be completed in software rather than the hardware. It also allows the replaying of the raw data to re-beam form when required. To make learning about the features of MB1 easy to follow, this document is structured as a step-by-step manual. The first manual covers the MB1 as a product, it provides instructions on how to install the hardware, how cables are wired to their connectors and some simple troubleshooting tips. The second manual (this manual) details the control software and how the system can be used operationally. Both manuals should be used together to learn how to use the system.
1.1 Warnings and Cautions Throughout this manual there are several points that may either result in damage and/or loss of the system (Warnings) and other points that may result in improper use of the system (Cautions). These are annotated using the following format. Warning: (Example) Applying DC electrical power greater than 30 Volts to the RTA
may result in damage to the unit. Caution: (Example) Ensure that the cable of the unit is facing aft (toward the rear
of the vessel) during normal operation.

MB1 User Manual
Page 5 of 35 7/30/13
2 CONTROL SOFTWARE INSTALL AND CONFIGURATION
2.1 Set Up Top Side Processing Unit (TSPU) PC Before installing and configuring the control software, the steps of configuration outlined in the MB1 hardware manual should be followed to physically interface the various components together. Once this has been completed, proceed with step 2.1.1.
2.1.1 Install Software At the time of writing, the minimum requirements for the personal computer that will run the control software are as follows: Intel i7 quad core or better, minimum 8GB RAM running Windows 7. Before installing the software, ensure that the operating system is running version 4 of Microsoft .NET. To update this, connect to Microsoft's web page at the following link: http://www.microsoft.com/net And follow the steps to install .NET version 4. Caution: Failure to use a PC with these minimum specifications may cause the
system to operate slowly and/or freeze Note that the faster the performance of the computer that runs the control software, the faster the system will sound, resulting in a greater volume of data and along-track coverage. It is recommended that where possible a desktop PC is used as typically these offer faster processors and greater processor cooling power than laptop computers. To install the software, first uninstall any previous versions from your computer. To complete this, click on Start, Control Panel, 'Programs and Features'. On the 'Uninstall or change a program' window select 'Image' then click 'Uninstall'. When you are ready to install the software, first extract the zip file (if applicable). Then double click the file 'setup.exe'. The following window will appear:
Page 6 of 35 7/26/13
Click 'Next' then select a suitable folder for the software to reside in your operating system. As a default it will select C:\Program Files\Teledyne Odom Hydrographic\Image\. Click 'Next', then on the next screen 'Next'. Once the software has been successfully installed, click 'Close'.
2.1.2 Connect TSPU PC to RTA Once the steps outlined in section 2.1.1 have been followed, connect the RTA to the TSPU PC using the supplied Ethernet cable. One end of the cable should be inserted to the TSPU computer, and the other end into any of the three Ethernet ports on the rear of the RTA. It is important that this connection is direct, and not through a network switch or hub, as this can introduce data collision issues. Once connected, ensure that any firewalls in place to protect the network connection are disabled – this may either slow or prevent data transfer. Then change the IP address of the computer to a fixed 192.168.1.102 by following these steps (for Windows 7): (a) Click Start>Control Panel (b) Double click on ‘Network and Sharing Center’ (c) Click on ‘Change Adapter Settings’ at the top left of the screen

Page 7 of 35 7/26/13
(d) Double click on the network associated with your Ethernet port. (e) On the menu that appears, click on the button marked ‘Properties’ (f) Select ‘Internet Protocol Version 4 (TCP/Ipv4) then click ‘Properties’ (g) Check the radial button ‘Use the following IP address:’ then enter the IP address 192.168.1.102 (h) The Subnet Mask will auto-populate, then click ‘OK’ to close all the open windows.
2.2 Software Overview To run the software, ensure the link light is on and flashing on the front panel of the software, and then either double click on the desktop shortcut or select the 'Image.exe' file from where it was written in step 2.1.1. Caution: When running 'Image', ensure that the computer does not go into 'sleep
mode'. If the computer enters sleep mode whilst acquiring data, it will cease to run and may crash.
The program will then run and the home screen will appear. This is the main screen that will be used throughout the setup and operation of the sounder.

Page 8 of 35 7/26/13
2.2.1 Setup Menu The first step in configuring the software for use is under the Setup Menu. Click this button once to reveal the 3 further sub-menus; Settings, Connect and Help.
2.2.1.1 Settings
This menu enables the different types of output from the sounder, depending on which have been checked within the ‘Output’ tab. The file formats are described in the following table:
File Description Notes TDY Raw Enabled 24 stave raw acoustic data Default is 'on' TDY Proc Enabled Beamformed raw data Default is 'on' TDY Angle-Range Enabled Angles and Ranges of
bathymetric points Default is 'on'
TDY Quality Enabled Bathymetric uncertainty values TBD

Page 9 of 35 7/26/13
TDY Snippets Enabled Snippet data TDY Snippets Sidescan Enabled Sidescan Snippet data Snippet data sent as sidescan
format TDY Sidescan Enabled Sidescan data TDY RTA Raw Serial Enabled Serial data (GPS, SVP, Motion
etc.) Default is 'on'
TDY Full Watercolumn Enabled (File Only)
Full watercolumn data
Once all of the required formats have been checked, click on the 'Save' button to retain these settings.
2.2.1.2 Connect The ‘Connect’ menu is used to set interface settings of the sounder, the RTA and the output ports for the data formats. This menu is used to set up the sounder for use, and is also where the input data is configured from other devices such as motion sensors and positioning systems. This menu is described in more detail in section 2.3 of this manual.
2.2.1.3 Help The help button shows links to the quick start guide, this manual, the contact details of Teledyne Odom and the version number of the control software.
2.2.2 Status Indicators Each sensor that is input to the RTA has a status indicator to the right of the main screen. These will show with a red border when no data is input or if the data input is out of range. When data is received and read correctly by the RTA no surround will be seen. The SV sensor may also have a blue surround from time to time, this indicates that a SV value that is out of the expected range has been passed to the system and the last known 'good' value is used. This

Page 10 of 35 7/26/13
running filter is applied to prevent bubble wash passing through the Digibar V causing erroneous beam forming. When a fixed, user entered, SV is used the surround on the SV is yellow. If the user would rather turn off any of the status indicators, right click on any of them and a pop-up box shows those selected. Uncheck any as required.
2.3 Configuring the Input Sensors In the 'Connect' menu we can set up the software to be aligned with the output baud rate of the other sensors that make up a complete multibeam system. There are two main groups of data that are used by the 'Image' software; Serial Data and Network (Ethernet) Data.
2.3.1 Serial Data Serial Data encompasses all of the data brought into the RTA through the RS232 ports on the rear of the unit and when used, the Digibar V and/or internal GPS sensor. To set up each sensor individually: (a) Select the input format on the left menu (ZDA, GGA etc.). (b) Using the drop down menu, select the Baud rate that the sensor is transmitting to the RTA. (c) The destination for each sensor is fixed, and are as follows:
Port Name Valid Formats from drop down menu
Format
GPS ZDA ZDA GPZDA NMEA GPS GGA GGA GGA NMEA Real time SVP (input through RTA) SVRta SVP AML Heave/Pitch/Roll HPR HPR TSS1 Heading HDG HDT NMEA
(d) Select the data bits for the sensor. Default is 8. (e) Select the format for the ZDA message as per the table above. (f) Select the Parity. Default is None. (g) Select the number of stop bits. Default is '1'. (h) Click the "Set Configuration" button to send these parameters to the RTA. To ensure the data is being passed correctly to the RTA, select the required port, then check the 'Monitor On' box. The data will then be seen in the view box. When using a Teledyne Odom Digibar V real time sound velocity probe that is directly attached to the sonar head, check the box marked "Use internal SVP". As the baud rates are set for this sensor there are no other settings to configure.
2.3.2 Network Data Network Data describes the data passing through the 3 Ethernet ports on the rear of the RTA and between the RTA and each sonar head. The default addresses of each component are as follows:
Component IP Address Sonar Head 1 192.168.1.100 Sonar Head 2 192.168.1.110 RTA 192.168.1.101

Page 11 of 35 7/26/13
MB1 Controller computer primary 192.168.1.102 MB1 Controller computer secondary (for dual head operation) 192.168.1.112 TDY (for output to Data Acquisition PC if used) 192.168.1.4
The sonar heads and RTA have fixed IP addresses, and both the MB1 controller and acquisition computer can be changed, as long as the same IP is set in each computer. To communicate with the data acquisition computer, the TDY TCP port and TCP/IP address must match the values set in the 3rd party software.
The default setting of Image is a UDP port of 56002 and IP output of 192.168.1.4.
2.3.3 Using the MB1 with Two Sonar Heads (Dual Head) When using the MB1 with two sonar heads attached to the RTA, two independent computers will be required - one to run each sonar head. This is configured in Image within the Network menu. First select the check box "Dual Sonars" then identify whether this computer is operating as the Primary unit or the Secondary unit. The Primary computer will control both of the sonars when this button is checked, the secondary computer will simply act as a processing unit for the second sonar head. Secondly check whether the sonars are to ping independently of each other (Interleaved) or both at the same time (Simultaneous). At the time of writing the firmware indicating whether each sonar head is a primary or secondary is encoded within the sonar head's firmware and cannot be changed though Image, this procedure is described in the annex at the end of this manual.
2.3.4 Using a Single Computer For Image & Data Acquisition If the data acquisition software (Hypack, Qinsy etc.) is to be run on the same computer as Image, set the Network Port in step 2.3.2 to 127.0.0.1. This will send the TDY data internally to the acquisition software, allowing a single computer to be used for both Image and Acquisition.
2.4 Connect to the RTA and Start Pinging

Page 12 of 35 7/26/13
Once all of the RTA sensor configurations have been completed in the connect menu, the software can connect to the RTA. To do this, ensure the RTA is powered on and click the 'Connect to RTA' button. Once the RTA is connected, the icon shown below on the right will appear.
Caution: Once connected to the RTA, all of the output formats and connection
network settings (contained within the Setup menu) will be set. To change these settings, disconnect from the RTA then reconnect after changes.
Note: The network addresses of each device can be checked using the command window within Microsoft Windows. To ping a device and be sure it is part of the MB1's network, open the command window and type <ping> followed by the IP address of the device to check. IP addresses can be found in section 2.3.2.
2.4.1 Start Pinging The sounder can now be started by clicking on the button to the right of the 'connect to RTA' button as shown in the picture on the left below. Once the sounder is pinging, the button will show an animation of the same graphic.

Page 13 of 35 7/26/13
2.4.2 Data Views Once the sounder is pinging, the user can select a view from the ‘View’ menu button at the top right of the screen. There are 3 views available (from top of menu to bottom):
2.4.2.1 Wedge View This is the classic sonar view, indicating a plot of the intensities and bathymetric points constrained by the angular swath sector defined by the software.
The view settings may be changed by moving the mouse onto the main display screen, then click the right mouse button. This opens a menu that allows the settings of the view to be changed.
The check boxes at the top of the menu allow the user to turn on or off the bathymetric points, nadir depth scale, backscatter and the 360 degree display mode instead of a wedge. The backscatter color palette may also be changed depending on the user preference. The default palette is RGB1 (blue to red, red showing the strongest return).

Page 14 of 35 7/26/13
The lower 3 boxes allow the display amplitude and gain to be changed and the size of the bathy points to be larger or smaller. These can be altered by either entering a value into the text box or by moving the tab on the slider bar to the right. Note that changing the display amplitude or gain will not affect the bottom detection algorithm of the system, there is no user entered gain applied in the MB1. The buttons at the very bottom of the wedge settings menu also allow the user to position the UTC time and position to any of the 4 corners of the screen. Note: On playback, the software will run much faster with the backscatter turned off. This is particularly useful when replaying raw data to generate .tdy files. Note: The MB1 can 'ping' at up to 60Hz, dependent on the depth of water the system is working in. Due to the graphics limitations of many PCs, the computer display cannot refresh this quickly therefore it may look slower than the actual ping rate of the system.
2.4.2.2 Pseudo-Sidescan View This view shows the sidescan or snippets view of the sea floor as gathered by the multibeam.
The view settings may be changed by moving the mouse onto the display screen, then click the right mouse button. This opens a menu that allows the settings of the view to be changed.

Page 15 of 35 7/26/13
Within this menu, the user may select either a sidescan view or a snippet view, and select the color palette to use depending on preference. The display gain and maximum amplitude scale may be altered by either entering a number in the text box or moving the slider bar to the right.
2.4.2.3 Wedge and Sidescan The wedge and sidescan view shows the wedge display above a smaller sidescan display, allowing the user to see both the sonar return and the sidescan data on the same display.

MB1 User Manual
Page 16 of 35 7/30/13
3 COLLECTING DATA Once the system has been set up as per the steps in Chapter 2, the multibeam is ready to start sounding.
3.1 Operating the Sonar in Real Time To start the sounder, ensure the 'Connect to RTA' button is selected then click on the 'Start/Stop Sonar' button. The default display is the standard wedge display, and providing the connection settings have been followed in chapter 2, the system will show the backscatter with overlaid bathymetric points.
3.1.1 Configure Sonar To change the settings of the sounder in real time, click the 'Configure Sonar' button as seen in the image below.
There are 4 sub menus within this menu:
3.1.1.1 Sonar Menu
Within this menu the Range and Power settings are shown (these are also on the main screen for convenience - changing either will have the same effect). Range is the total time (and hence distance) the sonar will 'listen' for the return ping. The greater the range, the longer the wait time. It is important in multibeam systems to have the range set sufficiently long, as it must be considered that the outer edges of the swath will be clipped if an insufficient range is used. It is normal to see the second return in the backscatter of the wedge display, and as a rule of thumb, it is appropriate to use a range scale of 3 times the nadir depth for a relatively flat sea floor. The range may be selected to adjust automatically by selecting the 'Auto Adjust Range' box, this will change the range based on the nadir depth.

Page 17 of 35 7/26/13
The 'Power' setting is the transmit power of the sonar. It ranges from 0 (system powered on but not transmitting) to 4 (system transmitting at maximum power). The power should be adjusted so that the bathymetric points are representing the seafloor backscatter. Note: As the MB1 uses 24 bit analog to digital conversion, it is advisable in most cases to have the power set higher than most multibeam systems. This is because the system has such a broad range of receive values and therefore it cannot be saturated, and an increased power improves the signal to noise ratio of the return ping. The Pulse Width of the system is the total time of the transmit pulse per 'ping'. A short pulse length gives a more clear backscatter. However as it is a smaller amount of acoustic energy in the water it is easily attenuated in the water column. In most cases, the pulse length is tied to the depth of water, and this can be set by checking the 'Auto Adjust Pulse Width' check box in this menu. The Frequency setting allows the user to change the acoustic frequency the system transmits and receives. The optimal setting of the multibeam is 200kHz, however it can be configured from 170kHz to 220kHz in order to prevent interference with other sources of acoustic interference or to provide a required backscatter picture. The Max Ping Rate can be set in cases where a lower rate of sounding is required, for example when data storage is at a premium. The Auto Range Scale is set to the multiple of the nadir depth to be used when auto range is turned on, i.e.: 2 times nadir, 3 times nadir etc. All of the settings can be changed whilst the sounder is pinging by either entering a numerical value, clicking and dragging the slider marker or by clicking the marker and using the right and left arrow keys.
3.1.1.2 Filter Menu
The filter menu allows the user to filter the backscatter data to prevent the bottom detection on areas where it is not required, and reduce data cleaning time. This can be completed by either range from the sonar, or depth of water. To set filters, change the min or max value by entering the number in the text box, slide the marker on the slider bar or click the marker and use the left and right arrow keys. To enable these values, click the check box next to the type of filtering required (depth or range).

Page 18 of 35 7/26/13
Caution: Setting the filter values outside of the seafloor return will result in no
digitized depths being generated or passed to the acquisition software
3.1.1.3 BeamForm Menu
This menu allows the user to set the system to detect the sea floor and generate digitized depth values. The sea floor can be detected in either beams spaced equiangular or equidistant. Equiangular simply means that each beam is generated at a fixed angle from nadir. For example, 120 beams over 120 degrees will result in a beam angle of 1 degree. This gives a higher sounding density near nadir, and less soundings toward the edges of the swath. Setting the system to equidistant spaces the soundings at equal intervals on the sea floor giving a more even sounding coverage. Caution: If the sonar head has a fixed roll of greater than 30 degrees, Equiangular
beam spacing should be selected. The number of beams is the total number of soundings generated across the swath in a single ping. This can be set anywhere between 24 and 512, depending on the user requirement. Caution: When more than 240 beams are selected, the processing demand on the
control PC will increase and as a result the maximum ping rate may be reduced to compensate.
If the range is set to greater than 90m but less than 150m the number of beams will default to the maximum of 400.
If the range is set to greater than 150m the number of beams will default to the maximum of 185.
In playback of raw data, setting the number of pings to over 250 in data gathered with a range of over 150m will cause the software to crash.
It is recommended that the beams be set to 240 or below for normal operation.

Page 19 of 35 7/26/13
The entire swath can be steered or reduced in size by determining the port and starboard angle in this menu, up to a maximum of 60 degrees either side (120 degrees maximum). This feature is used when surveying areas with a steep slope or areas of particular interest, or when in dual head mode. In dual head mode, it is recommended that the overlap at nadir be limited to 5-10 degrees of overlap. The reason is due to the difference in uncertainty between the outer beam detect of a system and a detect closer to nadir. The outer beams of most flat faced array multibeam systems have a greater uncertainty, and therefore when compared to beams from closer to nadir there may be a discrepancy. This will look like a 'bow tie effect' near nadir:
Sample swath of dual head MB1 data as seen in Caris HIPS, showing 'bow tie effect'
All of the settings can be changed whilst the sounder is pinging by either entering a numerical value, clicking and dragging the slider marker or by clicking the marker and using the right and left arrow keys.
3.1.1.4 Processing Menu
The processing menu allows the user to change the sound velocity input, apply roll correction (beam steering) and apply signal stacking to the system. In most cases the optimal method of using the multibeam is to have a sound velocity probe mounted at the face of the transducer, providing real time sound velocities to allow for beam forming. This may either be a Teledyne Odom Digibar V interfaced to the sonar head, or another system interfaced to the RTA. If either of these are used, ensure the 'Use Constant SV' box is unchecked.

Page 20 of 35 7/26/13
If a real time sound velocity probe is not available then the sound velocity at the head can be entered in this menu, and the user should then select the 'Use constant SV' box. The sound velocity value at the status bar on the right of the screen will then turn yellow to indicate that a constant value is entered. Caution: Not using a real time sound velocity probe at the time of acquisition can
result in poor quality data Signal stacking can be applied here for users that require a more robust dataset with a loss of along-track resolution. This feature takes the acoustic signal of several pings (set in this menu) and combines them when performing the bottom detection evaluation. This is particularly useful in noisy environments such as near dredging apparatus. Caution: Signal stacking should not be used for standard hydrographic data
acquisition, especially in vessels experiencing any roll and/or pitch. This is due to the method of signal stacking and timing the soundings - if stacking is used then a roll and/or pitch artifact will be introduced to the data. When Signal stacking is ON, Roll compensation should be set to OFF. Do not use stacking when range is set to maximum range (250m) and maximum beams (185).
Roll Compensation can be applied by checking the box in this menu. This feature allows the surveyor to steer the receive beams of the sonar, using the roll component of the motion sensor, to always be pointing normal to gravity. This prevents the edges of the swath becoming 'wavy' and the potential for gaps in the dataset from one line to the next. When using roll compensation the system is still forming beams within the total available swath of 120 degrees, therefore it is recommended that when roll compensation is turned on the overall swath width is reduced by the expected roll, for example if roll in the survey area is around 3 degrees, reduce the swath to 55 degrees either side (110 degrees total). This will ensure quality data throughout the recorded swath. Caution: Roll correction does not increase the overall swath width of the system,
therefore it is advisable to reduce the swath width setting within Image when using roll correction to obtain quality data
3.2 Logging Data Data is output through the .tdy format on the second Ethernet port of the RTA, and then interpreted and logged through the 3rd party acquisition software. In many cases this will be the only requirement for data logging. It is also possible to log data files from the Image software for post processing or conversion to another format at a later date. This is achieved through the 'Data Management' menu, seen in the image below.

Page 21 of 35 7/26/13
3.2.1 Raw Data The 24 Channel, raw acoustic data (along with all other data passed through the RTA) is stored in the file format '.raw'. This is typically a large file that may be logged simultaneously as the '.tdy' file and can be used for post processing or playback.
To log the raw file, select the tab marked 'RawFileLogging'. Using the button at the end of the 'Raw Logging Path', select a suitable location where the files will be logged. If required, insert a header and footer for the files (this may be a project or vessel name). Enter a maximum file size if required for data management, then check the box marked 'Log Raw'. When this box is checked and the 'Log Data' button is clicked 'On' the raw files will be generated and written to the specified location.
3.2.2 TDY Output The proprietary '.tdy' format is the file that contains all of the processed beam data (soundings) and data that was passed through the RTA at the time of gathering. This data is the same as the information passed to the data acquisition computer, and may be logged simultaneously.
To log the tdy file, select the tab marked 'TDYOutput'. Using the button at the end of the 'TDY Logging Path', select a suitable location where the files will be logged. If required, insert a header and footer for the files (this may be a project or vessel name). Enter a maximum file size if required for data management, then check the box marked 'Log TDY'. When this box is checked and the 'Log Data' button is clicked 'On' the raw files will be generated and written to the specified location. To output the TDY to the 3rd party data acquisition software, also select the box marked 'TDY Port Enabled'.
3.3 Playback of Previously Collected Data Raw data files may be played back in the Image software much in the same way as if it were being gathered in real time, with the exception that the range, power, pulse width and frequency cannot be changed. The beam forming and generation of the tdy files can be reprocessed (including number of
Page 22 of 35 7/26/13
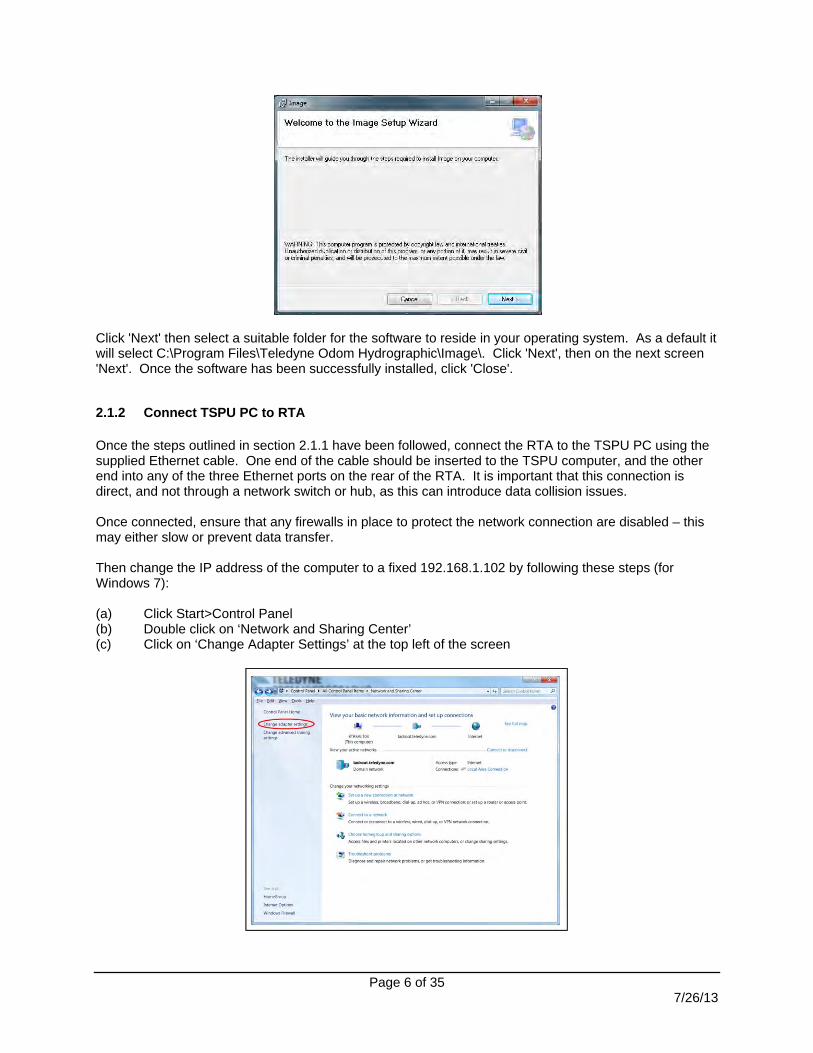
beams, equiangular/equidistant spacing and sound velocity correction) and if the data acquisition PC is also connected it will appear as if the data is being gathered in real time. To play back data files, select the 'Playback' tab of the 'Data Management' menu.
Using the button at the end of the 'Raw File', select where the raw file is located for playback. Select 'Play' to playback the file and 'Stop' to stop playback. It is also possible to loop an individual file by selecting the 'Loop File' check box, and increment by one file by selecting the 'Advance to Next File on Completion' check box. To log output files when replaying data, ensure the 'Log Data' button is turned on, in the same manner as when files are logged when gathering data in real time. Note: When replaying large files, the software will process much faster if the backscatter display is turned off in the main display window.

MB1 User Manual
Page 23 of 35 7/30/13
ANNEX A - RTA DATAGRAMS
Sensor Cable Data Format Recommended Update Rates Notes Sonar 1 Custom wet-mateable Sonar 2 Custom wet-mateable Positioning I/O RS232 (if internal GPS not fitted or used) NEMA ZDA, GGA, VTG ZDA: 1 Hz
GGA: 1-5 Hz VTG: 1-5 Hz
The RTA will accept any sentence beginning with $GP – for optimal use ensure the GPS only outputs 3 messages
Heading I/O RS232 (if internal GPS not fitted or used) NMEA HDG 5 Hz Spare I/O RS232 Various TBC Aux Custom Amphenol Various TBC Heading Aided RS232 NMEA HDG Output at same rate as input GPS Aided RS232 NMEA GGA, VTG Output at same rate as input SVP RS232 AML 1-5 Hz AML format: <space>1477.40<CR><LF> HPR I/O RS232 TSS1 String 40 Hz See format below TSPU PC Ethernet Data Acq PC Ethernet Spare PC Ethernet ADCP?
TSS1 data format

Page 24 of 35 7/26/13
ANNEX B - PATCH TESTING THE MB1 In order for any multibeam system to be employed for precision surveying, the user must complete a series of tests to determine the attitude and reference framework of the sonar in relation to the other sensors on the vessel. The patch test determines the relationship between the sonar and the motion reference unit in Roll, Pitch, Yaw and Latency. There are several ways of performing the patch test, and the guide below is intended as an aide memoir of one method to perform this test. 1 Normal (horizontal) Configuration This configuration is where the sonar is installed with the face of the transducer parallel to the horizon, most commonly when the unit is installed on an over the side type mounting. The following are the methods to evaluate each component of the patch test:

Page 25 of 35 7/26/13
2 Tilt Configuration In certain water depths, it may be advantageous to install the sonar head with a fixed roll offset to one side. This typically increases the swath width on the sea floor, however it must be patch tested slightly differently. The calibration results are the same as the normal configuration and are therefore not repeated in this section.

Page 26 of 35 7/26/13
3 Dual Head Configuration For a dual head system, each tilted sonar head should be treated as an individual head and calibrated as per the tilt configuration above. It is important to remember that in this case each head will have its own heave, pitch and roll values and these should be used in processing. Calibration screenshots courtesy of Caris HIPS

Page 27 of 35 7/26/13
ANNEX C - SETTING UP MB1 WITH HYPACK 2013 1. First determine if the system is to be used with Image on a separate computer or if both Hypack and Image is to be used on a single computer: (a) When a separate computer is to be used for acquisition: Change the IP address of the Hypack Computer to 192.168.1.4 (for a description of how to do this, see section 2.1.2 of this manual). Subnet mask remains 255.255.255.0. (b) When the same computer is to be used for both Hypack and Image: Set the IP address in image to 127.0.0.1 (see section 2.3.3) 2. Open Hypack. Click on 'Hypack Hardware'. The Hypack configuration should have two devices; GPS NMEA-0183 and HYSWEEP Interface. (a) GPS NMEA-0183 Ensure the functions 'Position' and 'Speed' are checked. Change the 'Connect' drop down menu to 'Network Port' and enter UDP, Server, Port: 56004. Once complete the window should be the same as the following:
Once this is complete, click on the 'Setup..' button. Click on the 'Advanced' tab then select the 'User modified NMEA Messages" check 'RTA (Odom)', then click 'OK'.

Page 28 of 35 7/26/13
(b) HYSWEEP Hardware Ensure the functions 'Depth', 'Heading' and 'Heave' are checked. Leave the 'Connect' drop down as 'None'. Save and close the Hypack hardware menu. 3. Click on the menu item 'HYSWEEP' then 'HYSWEEP Hardware'. Under the 'Manufacturer/Model' tab add the devices 'Hypack Navigation' and 'Odom MB1'. With 'Odom MB1' highlighted, click on the 'Setup..' button. Ensure the check box 'Use RTA Interface' is selected. Click 'OK'.
At this point the data input from the Image software to Hysweep can be checked. Under the 'HYSWEEP Hardware Setup' menu, click on the tab 'Network Test' and enter the IP address in the box marked 'Remote IP Address', and in the box marked 'Port' enter 56002. Click on 'UDP Connect' and the data stream can be seen in the box below this button.

Page 29 of 35 7/26/13
Screenshots courtesy of Hypack
Page 30 of 35 7/26/13
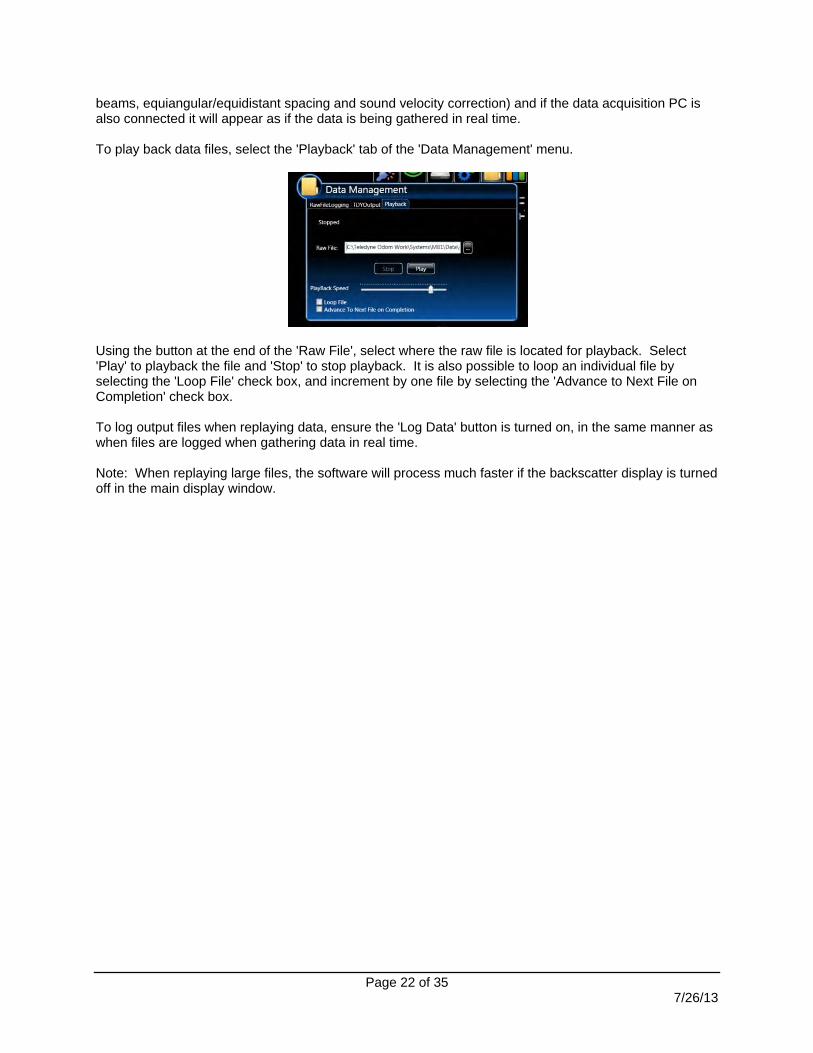
ANNEX D - COMMON ACRONYMS USED IN THIS MANUAL 1PPS One Pulse Per Second (same as PPS) A/C Alternating Current AML Data format type for real time sound velocity BNC Bayonet Neill-Concelman (type of connector) DC Direct Current dGPS Differential Global Positioning System GGA NMEA position data string GPS Global Positioning System HPR Heave Pitch Roll (motion data) I/O Input/Output LED Light Emitting Diode NMEA National Marine Electronics Association PC Personal Computer Ping A sonar transmit pulse PPS Pulse Per Second RS232 Type of serial data connector RTA Real Time Appliance SVP Sound Velocity Profiler, or Sound Velocity Profile TSPU Top Side Processing Unit (Computer used to control the multibeam) TSS1 Data format type for motion data VTG NMEA velocity data string ZDA NMEA timing data string

Page 31 of 35 7/26/13
ANNEX E - THREE DIMENSIONAL SIGN CONVENTION USED FOR MB1

Page 32 of 35 7/26/13
ANNEX F – UPGRADING THE FIRMWARE WITHIN THE MB1
Introduction It may be necessary, on occasion, for the firmware of the MB1 to be updated. The firmware is small pieces of code that are embedded in both the RTA and the MB1 sonar head, and performs critical functions of the system. This Annex describes the process of upgrading the firmware for the system. The MB1 has the following components with Firmware which might require updating:
The FPGA and ZestET1 are the same for both the Head and the RTA. The User Flash files are different for the MB1 and RTA.
Files To Be Uploaded At the time of writing, the current firmware files for each component are as follows: Sonar Head RTA Version
(as seen in Updater) FPGA (Comms FPGA)
Mb1_zestfpga_V0110.bit 110
ZestET1 (Ethernet Engine)
GigExpedite1.42.bin 1.42-1.41
User Flash File (User Settings) ZestET1_FlashFile_ForHEAD1.mem ZestET1_FlashFile_ForRTA.mem
DSP Mb1_dspfpga_v0275.bin N/A 275
Table 1: Current Firmware versions for MB1
Upload Procedure - Access the Firmware 1. Gather the MB1 sonar head, RTA, a computer that will be used for the update, an Ethernet cable and the sonar cable. Ensure that a reliable power source is available for the system and computer throughout the update. 2. Obtain the new firmware files to be uploaded, along with the installation files. These should be provided by Teledyne Odom Hydrographic, and consist of 3 installer files and then the above firmware files. The installer files are as follows:
RTA Sonar Head
FPGA
(Comms FPGA)
ZestET1
(Ethernet Engine)
User Flash
(User settings)
DSP
(DSP FPGA)
FPGA
(Comms FPGA)
ZestET1
(Ethernet Engine)
User Flash
(User settings)

Page 33 of 35 7/26/13
CPanel.exe DSPFrimware.dll Upload.exe
Place these files in a folder on the computer that will be used to perform the update to the firmware (C:\MB1\ ). 3. Set the IP address of the computer which will be used for programming and which will be connected to the MB1 to 192.168.1.102. This is the same IP address used when operating the MB1. 4. Connect the Head to the RTA using the sonar cable and the computer to the RTA with an Ethernet cable. Power up the RTA. 5. After the RTA has initialized (40 seconds) start the upload program by double clicking on the file marked "Upload.exe". The firmware uploader window will then open, showing the main interface. Under the 'COMM IP' box at the top left, click on the button marked 'Refresh'. 6. In the 'COMM IP' box you should see 2 devices on the network - IP 192.168.1.101 is the RTA and 192.168.1.100 is the Head. You are now ready to update the firmware for the system.
Upload Procedure - Upload the Firmware for the Sonar Head 1. The Upload program has two tabs, Program Head and Program RTA. Select the ‘Program Head’ tab and highlight IP address 192.168.1.100 (head) under the COMM IP header by clicking on it.

Page 34 of 35 7/26/13
2. Under the RTA IP header highlight IP address 192.168.1.101 (RTA) by clicking on it. Select the ‘RTA Present’ check box.. 3. Select the ‘Read All’ button to read the current versions of software that are in the Head.
4. Click on the button marked 'Browse' next to the location of the file marked 'New Image File For ZestET1'. Browse through your files to find the file listed in Table 1 above that corresponds to the FPGA. 5. Repeat step 4 for the User Flash File and DSP. 6. Click on the Update All button at the bottom right of the window. The update will take approximately 5-6 minutes. Follow the instructions from the program when prompted to power down the RTA. Wait 40 seconds before clicking on the OK button to continue. 7. The Ethernet engine needs to be upgraded (ZestET1) separately from the other modules. If required this needs to be updated separately to the other Firmware files. Browse to the correct file then click Update on the ZestET1 row. This typically takes 3-4 minutes to complete.
Updating the Zest firmware

Page 35 of 35 7/26/13
Upload Procedure - Upload the Firmware for the RTA 1. The Upload program has two tabs, Program Head and Program RTA. Select the ‘Program RTA’ tab and highlight IP address 192.168.1.101 (RTA) by clicking on it.
2. Select the ‘Read All’ button to read the current versions of software that are in the RTA. 3. Click on the button marked 'Browse' next to the location of the file marked 'New Image File For ZestET1'. Browse through your files to find the file listed in Table 1 above that corresponds to the FPGA. 4. Repeat step 3 for the User Flash File. 5. Click on the Update All button at the bottom right of the window. The update will take approximately 5-6 minutes. Follow the instructions from the program when prompted to power down the RTA. Wait 40 seconds before clicking on the OK button to continue. 6. The Ethernet engine needs to be upgraded (ZestET1) separately from the other modules. If required this needs to be updated separately to the other Firmware files. Browse to the correct file then click Update on the ZestET1 row. This typically takes 3-4 minutes to complete. Upload Procedure - Confirm the Upload Once the upgrade has been completed: 1. Power down the RTA and close the Upload program. 2. Power the RTA back up and start the Upload program. Click 'Refresh' then:
Verify all firmware versions are correct as per table 1. Ensure the IP addresses show as 192.168.1.100 for the Sonar Head and 192.168.1.101 for
the RTA. Verify the version numbers for all the modules agrees with what was programmed.


![HYPACK MAX - Knudsen Eng · 2019-04-18 · HYPACK® MAX sounding data super-imposed on a Microstation DGN file. [DGN file courtesy USACE – Tuscaloosa] Display from HYPACK® MAX’s](https://img.pdfslide.us/doc/110x75/5e90e9587c4e3f6689675b27/hypack-max-knudsen-eng-2019-04-18-hypack-max-sounding-data-super-imposed-on.jpg)