Embed Size (px)
Citation preview
1
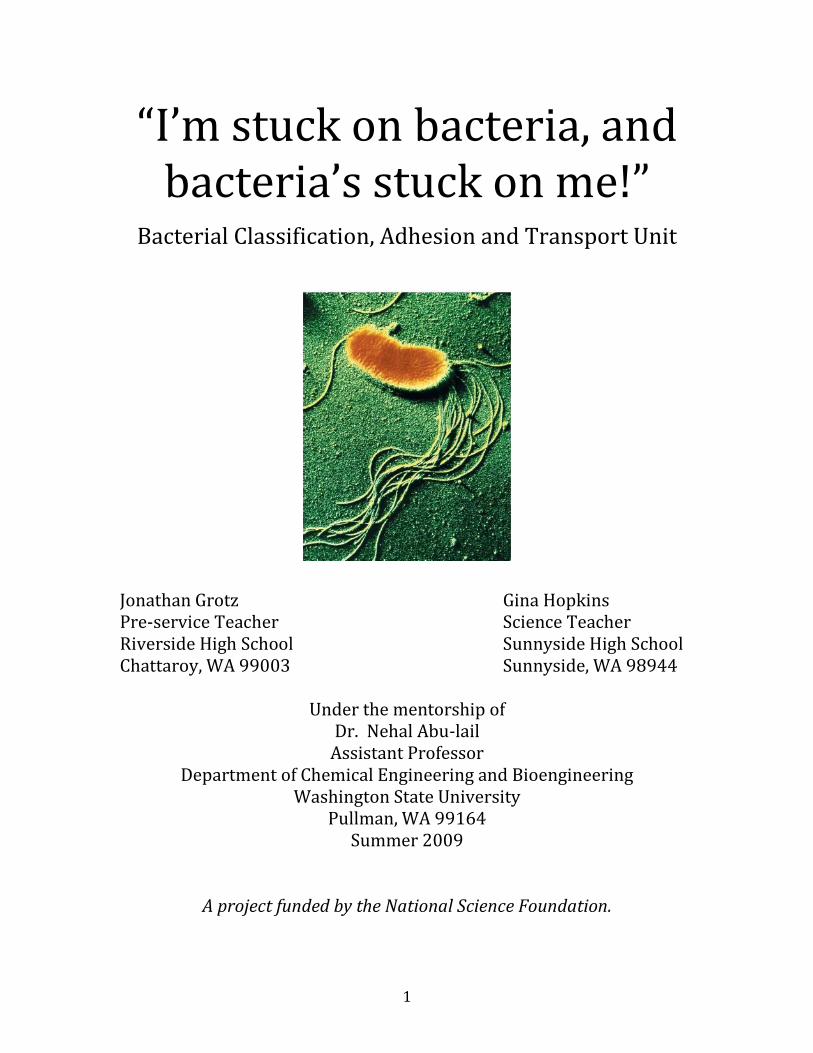
“I’m stuck on bacteria, and bacteria’s stuck on me!”
Bacterial Classification, Adhesion and Transport Unit
Jonathan Grotz Gina Hopkins Pre-service Teacher Science Teacher Riverside High School Sunnyside High School Chattaroy, WA 99003 Sunnyside, WA 98944
Under the mentorship of Dr. Nehal Abu-lail
Assistant Professor Department of Chemical Engineering and Bioengineering
Washington State University Pullman, WA 99164
Summer 2009
A project funded by the National Science Foundation.
2
Table of Contents
Project Summary……...……………………………………………….…………3
GLE’s Applying to This Unit…………………………………………………..5
Module for Kids…………………………………………………………………....6
Lesson 1……………………………………………………………………….……11
Lesson 2………………………………………………………………….…………13
Lesson 3……………………………………………………………………….……14
Lesson 4……………………………………………………………………….……15
Lesson 5…………………………………………………………………………….16
Lesson 6……………………………………………………………………….……17
Lesson 7-10………………………………………………………………….……18
Lesson 11-14……………………………………………………………………..19
Worksheet for Module………………………………………………………..21
Unit Assessment and Rubric ………………………………………………23
Microbiology Safety Guidelines…………………………………………...25
References…………………………………………………………………………26
3
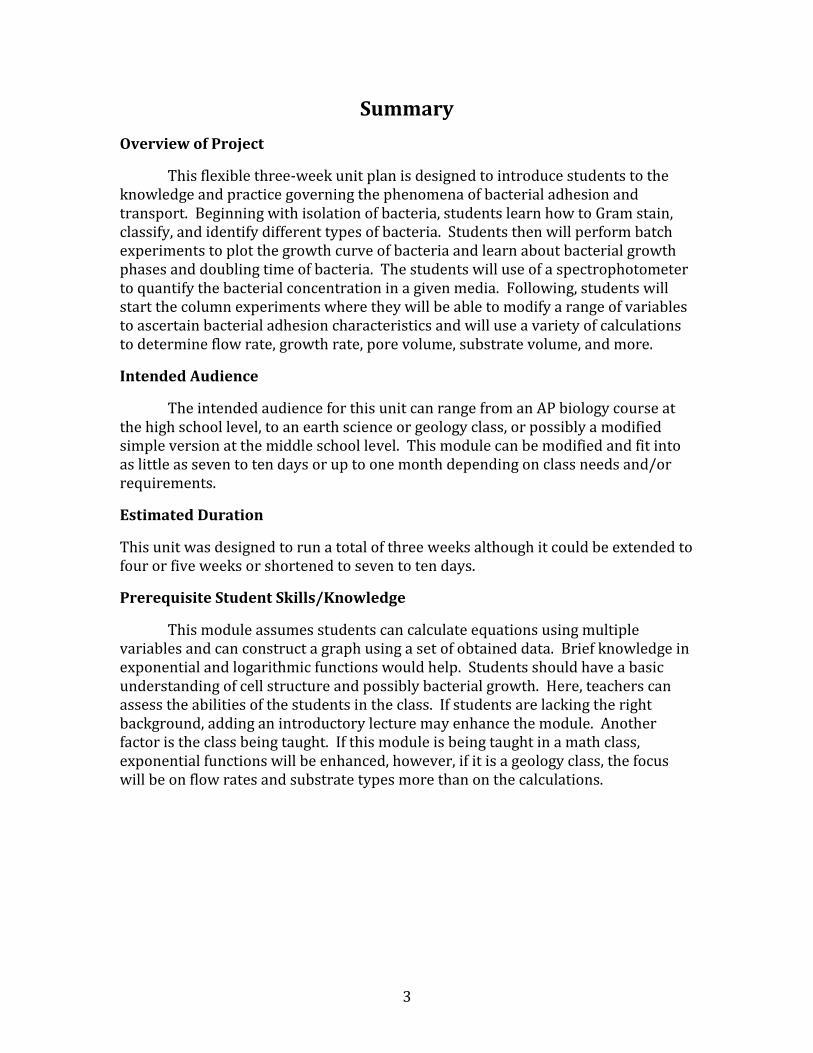
Summary
Overview of Project
This flexible three-week unit plan is designed to introduce students to the knowledge and practice governing the phenomena of bacterial adhesion and transport. Beginning with isolation of bacteria, students learn how to Gram stain, classify, and identify different types of bacteria. Students then will perform batch experiments to plot the growth curve of bacteria and learn about bacterial growth phases and doubling time of bacteria. The students will use of a spectrophotometer to quantify the bacterial concentration in a given media. Following, students will start the column experiments where they will be able to modify a range of variables to ascertain bacterial adhesion characteristics and will use a variety of calculations to determine flow rate, growth rate, pore volume, substrate volume, and more.
Intended Audience
The intended audience for this unit can range from an AP biology course at the high school level, to an earth science or geology class, or possibly a modified simple version at the middle school level. This module can be modified and fit into as little as seven to ten days or up to one month depending on class needs and/or requirements.
Estimated Duration
This unit was designed to run a total of three weeks although it could be extended to four or five weeks or shortened to seven to ten days.
Prerequisite Student Skills/Knowledge
This module assumes students can calculate equations using multiple variables and can construct a graph using a set of obtained data. Brief knowledge in exponential and logarithmic functions would help. Students should have a basic understanding of cell structure and possibly bacterial growth. Here, teachers can assess the abilities of the students in the class. If students are lacking the right background, adding an introductory lecture may enhance the module. Another factor is the class being taught. If this module is being taught in a math class, exponential functions will be enhanced, however, if it is a geology class, the focus will be on flow rates and substrate types more than on the calculations.
4
Introduction
This unit applies to multiple areas of science and engineering. The first real life example is using column experiments, which is very similar to some of the processes used at the Hanford site. In the classroom, students should think about what types of substrates are available in the Hanford area. The sand is contaminated with Uranium. Uranium is mobile and travels through sand or subsurface material of Hanford to reach water resources. To handle this problem, bioremediation is a great solution. Bacteria are injected at a certain concentration in the contaminated site. Of extreme importance is the control of bacterial attachment to the contaminated site. The attachment will depend on flow rate, acidity, size, charge, etc. If the bacterial attachment under flow was not controlled, bacteria will not have a chance to reduce Uranium and immobilize it in the subsurface. Students will learn to manipulate the flow of bacteria to maximize attachment to the surface of different substrates.
Another example is the designs of implant materials that minimize bacterial interactions. For example, implant devices in the body should have a coating that repels bacterial attachment to prevent infections during surgery and after wise as well. The batch experiment mimics this application. Material scientists and engineers apply different coatings and run a batch experiment with bacterial types and concentrations similar to those in vivo. After their experiments, they can assay which coating is better.
Attachment of bacteria to stainless steel or other materials can cause severe corrosion of metals that require the replacement of expensive equipment including drinking water pipes, oil pipes and tanks, and marine subsurface pipes. Understanding how bacteria attach to metals and preventing that will help in minimizing such problems.
Rationale
The unit is designed to expand the prior knowledge of students in two areas, microbial biology and mathematics, and link these areas to engineering. By connecting these three areas, it will cause students to use their critical thinking skills and draw conclusions about how humans impact their environment. Students will need to have the background knowledge discussed in the project summary. Students will be required to manipulate experimental variables to answer biological questions; specifically, how does bacteria attach to surfaces? The intention of the module is to encourage student interest in science and engineering.
5
GLE’s Applying to This Unit:
Science:
1.1.3. Analyze sound waves, water waves, and light waves using wave
properties, including frequency and energy. Understand wave interference.
1.1.5. Understand and analyze how the chemical composition of Earth
materials (rocks, soils, water, and air) is related to their physical properties.
1.1.6. Analyze structural, cellular, biochemical, and genetic characteristics in
order to determine the relationships among organisms.
1.2.6. Understand cellular structures, their functions, and how specific genes regulate these functions.
2.1.2. Understand how to plan and conduct systematic and complex scientific investigations.
2.1.3. Synthesize a revised scientific explanation using evidence, data, and inferential logic.
2.1.4. Analyze how physical, conceptual, and mathematical models represent and are used to investigate objects, events, systems, and processes.
2.2.1. Analyze why curiosity, honesty, cooperation, openness, and skepticism
are important to scientific explanations and investigations.
2.2.3. Evaluate inconsistent or unexpected results from scientific
investigations using scientific explanations.
2.2.4. Analyze scientific investigations for validity of method and reliability of
results.
3.1.1. Analyze local, regional, national, or global problems or challenges in which scientific design can be or has been used to design a solution.
3.1.3. Evaluate consequences, constraints, and applications of solutions to a problem or challenge.
3.2.4. Analyze the effects human activities have on Earth's capacity to sustain biological diversity.
6
Bacterial Adhesion and Transport Module
Objectives:
Students will be able to calculate colloids pore volume using water displacement.
Students will understand how an absorption measurement can be proportional to bacterial concentration.
Students will understand the relationship between surface area and adsorption.
Students will be able to construct a concentration versus time graph of their collected data.
Introduction: Article from today’s news
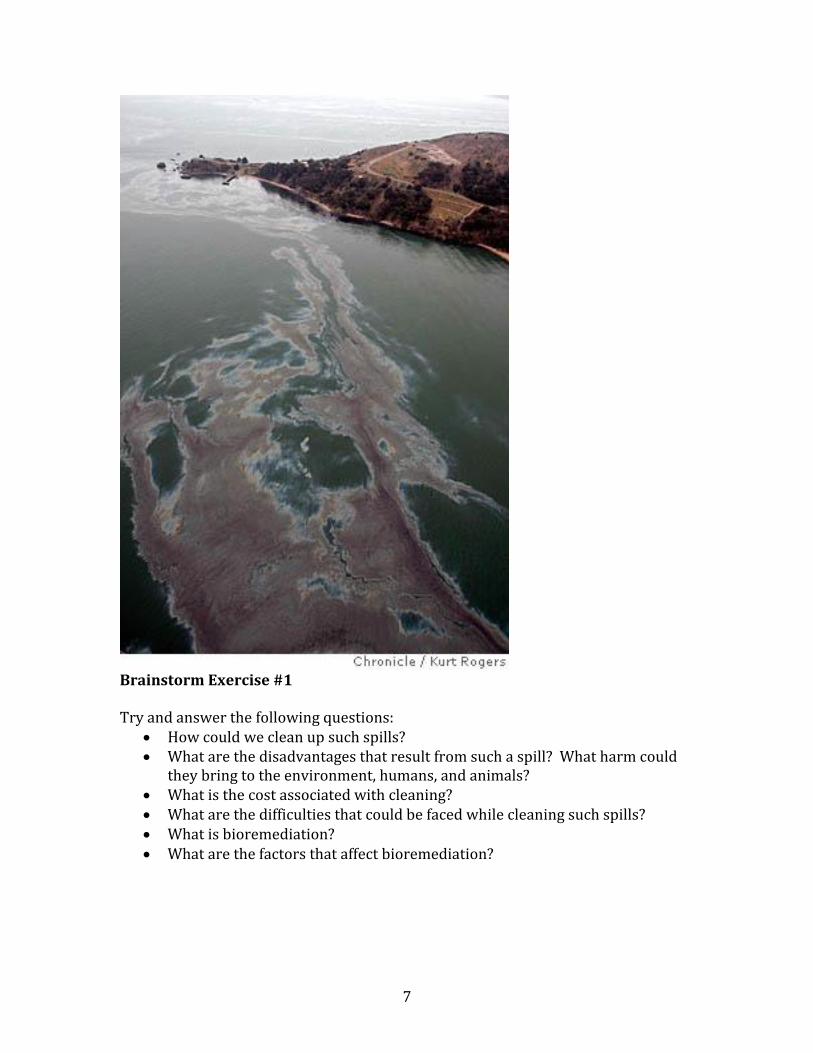
“Alaska Oil Spill Fuels Concerns Over Arctic Wildlife John Roach for National Geographic News Tuesday, 07/27/09, 6:34am Early this morning, an oil spill occurred that is expected to be one of the most devastating human-caused environmental disasters ever to take place at sea. Prince William Sound's remote location (accessible only by helicopter and boat) has made response efforts difficult. The region is a habitat for salmon, sea otters, seals and seabirds. So far, the vessel has spilled 10.8 million U.S. gallons into Prudhoe Bay. The crude oil leaking from the ship’s hull will eventually cover 11,000 square miles (28,000 km2) of ocean and shoreline. Thousands of animals died immediately; current fatality estimates include 250,000 to as many as 500,000 seabirds, at least 1,000 sea otters, approximately 12 river otters, 300 harbor seals, 250 bald eagles, and 22 orcas, as well as the destruction of billions of salmon and herring.” Your team is charged with designing a way to clean up the oil spill using bioremediation. You will be performing a column experiment where you will pump bacteria through one of three types of substrates with modified environments that have been saturated with oil. You will learn what pore volume is and how to calculate it, which will show the importance of having a large surface area to media relationship. Lastly, you will be graphing and comparing your data with other teams to find the best approach for the oil clean up. After finding the best suitable habitat for bioremediation, your team will be flown immediately to Prince William Sound to help restore the environment. Alaska’s animals are relying on you for survival. Good luck on your mission!
7
Brainstorm Exercise #1 Try and answer the following questions:
How could we clean up such spills? What are the disadvantages that result from such a spill? What harm could
they bring to the environment, humans, and animals? What is the cost associated with cleaning? What are the difficulties that could be faced while cleaning such spills? What is bioremediation? What are the factors that affect bioremediation?
8
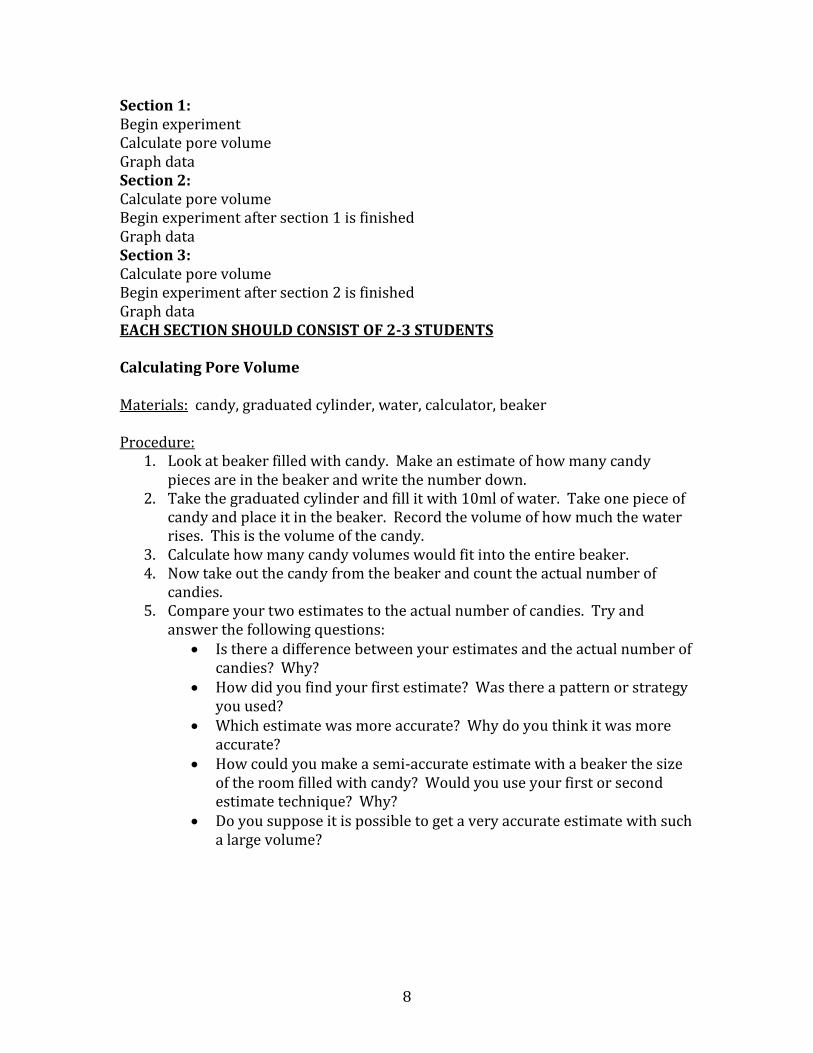
Section 1: Begin experiment Calculate pore volume Graph data Section 2: Calculate pore volume Begin experiment after section 1 is finished Graph data Section 3: Calculate pore volume Begin experiment after section 2 is finished Graph data EACH SECTION SHOULD CONSIST OF 2-3 STUDENTS Calculating Pore Volume Materials: candy, graduated cylinder, water, calculator, beaker Procedure:
1. Look at beaker filled with candy. Make an estimate of how many candy pieces are in the beaker and write the number down.
2. Take the graduated cylinder and fill it with 10ml of water. Take one piece of candy and place it in the beaker. Record the volume of how much the water rises. This is the volume of the candy.
3. Calculate how many candy volumes would fit into the entire beaker. 4. Now take out the candy from the beaker and count the actual number of
candies. 5. Compare your two estimates to the actual number of candies. Try and
answer the following questions: Is there a difference between your estimates and the actual number of
candies? Why? How did you find your first estimate? Was there a pattern or strategy
you used? Which estimate was more accurate? Why do you think it was more
accurate? How could you make a semi-accurate estimate with a beaker the size
of the room filled with candy? Would you use your first or second estimate technique? Why?
Do you suppose it is possible to get a very accurate estimate with such a large volume?
9
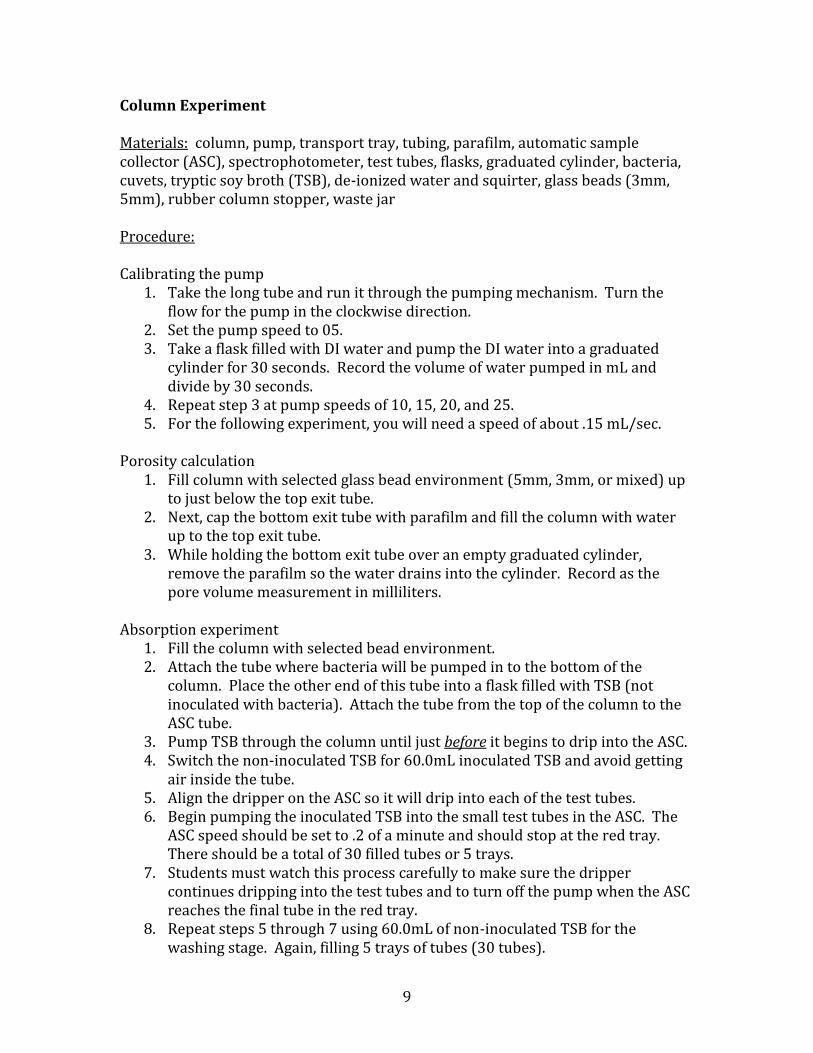
Column Experiment Materials: column, pump, transport tray, tubing, parafilm, automatic sample collector (ASC), spectrophotometer, test tubes, flasks, graduated cylinder, bacteria, cuvets, tryptic soy broth (TSB), de-ionized water and squirter, glass beads (3mm, 5mm), rubber column stopper, waste jar Procedure: Calibrating the pump
1. Take the long tube and run it through the pumping mechanism. Turn the flow for the pump in the clockwise direction.
2. Set the pump speed to 05. 3. Take a flask filled with DI water and pump the DI water into a graduated
cylinder for 30 seconds. Record the volume of water pumped in mL and divide by 30 seconds.
4. Repeat step 3 at pump speeds of 10, 15, 20, and 25. 5. For the following experiment, you will need a speed of about .15 mL/sec.
Porosity calculation
1. Fill column with selected glass bead environment (5mm, 3mm, or mixed) up to just below the top exit tube.
2. Next, cap the bottom exit tube with parafilm and fill the column with water up to the top exit tube.
3. While holding the bottom exit tube over an empty graduated cylinder, remove the parafilm so the water drains into the cylinder. Record as the pore volume measurement in milliliters.
Absorption experiment
1. Fill the column with selected bead environment. 2. Attach the tube where bacteria will be pumped in to the bottom of the
column. Place the other end of this tube into a flask filled with TSB (not inoculated with bacteria). Attach the tube from the top of the column to the ASC tube.
3. Pump TSB through the column until just before it begins to drip into the ASC. 4. Switch the non-inoculated TSB for 60.0mL inoculated TSB and avoid getting
air inside the tube. 5. Align the dripper on the ASC so it will drip into each of the test tubes. 6. Begin pumping the inoculated TSB into the small test tubes in the ASC. The
ASC speed should be set to .2 of a minute and should stop at the red tray. There should be a total of 30 filled tubes or 5 trays.
7. Students must watch this process carefully to make sure the dripper continues dripping into the test tubes and to turn off the pump when the ASC reaches the final tube in the red tray.
8. Repeat steps 5 through 7 using 60.0mL of non-inoculated TSB for the washing stage. Again, filling 5 trays of tubes (30 tubes).
10
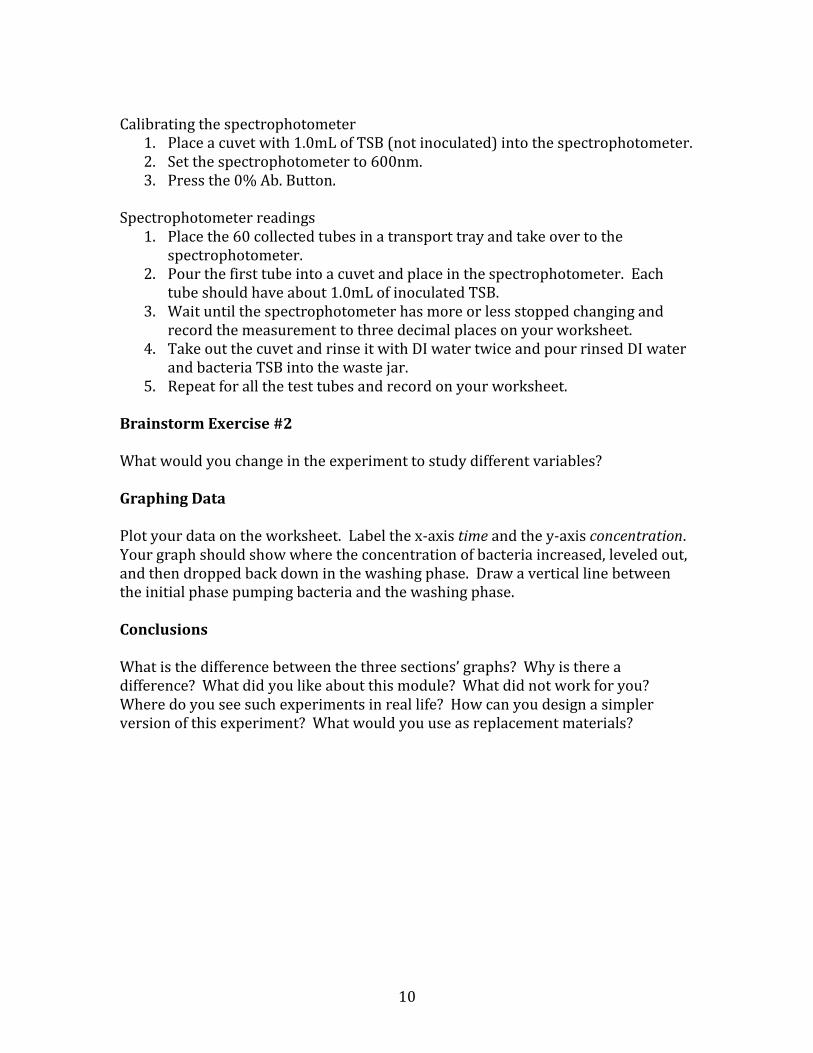
Calibrating the spectrophotometer
1. Place a cuvet with 1.0mL of TSB (not inoculated) into the spectrophotometer. 2. Set the spectrophotometer to 600nm. 3. Press the 0% Ab. Button.
Spectrophotometer readings
1. Place the 60 collected tubes in a transport tray and take over to the spectrophotometer.
2. Pour the first tube into a cuvet and place in the spectrophotometer. Each tube should have about 1.0mL of inoculated TSB.
3. Wait until the spectrophotometer has more or less stopped changing and record the measurement to three decimal places on your worksheet.
4. Take out the cuvet and rinse it with DI water twice and pour rinsed DI water and bacteria TSB into the waste jar.
5. Repeat for all the test tubes and record on your worksheet. Brainstorm Exercise #2 What would you change in the experiment to study different variables? Graphing Data Plot your data on the worksheet. Label the x-axis time and the y-axis concentration. Your graph should show where the concentration of bacteria increased, leveled out, and then dropped back down in the washing phase. Draw a vertical line between the initial phase pumping bacteria and the washing phase. Conclusions What is the difference between the three sections’ graphs? Why is there a difference? What did you like about this module? What did not work for you? Where do you see such experiments in real life? How can you design a simpler version of this experiment? What would you use as replacement materials?
11
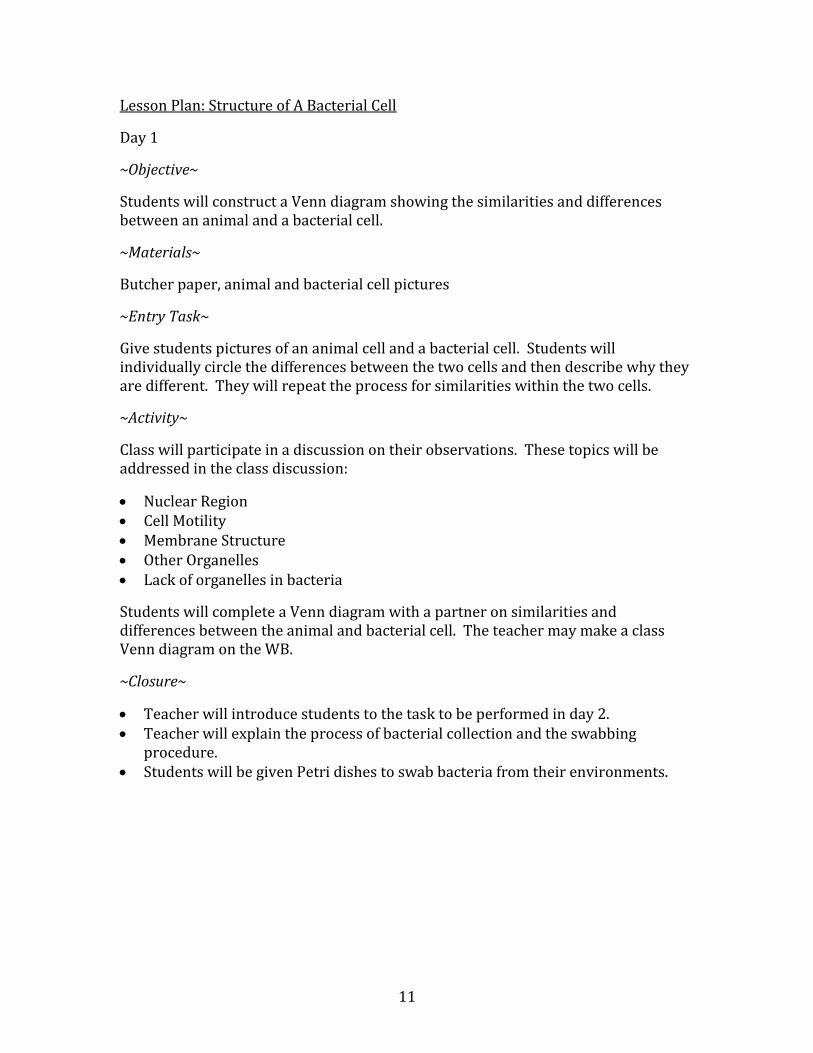
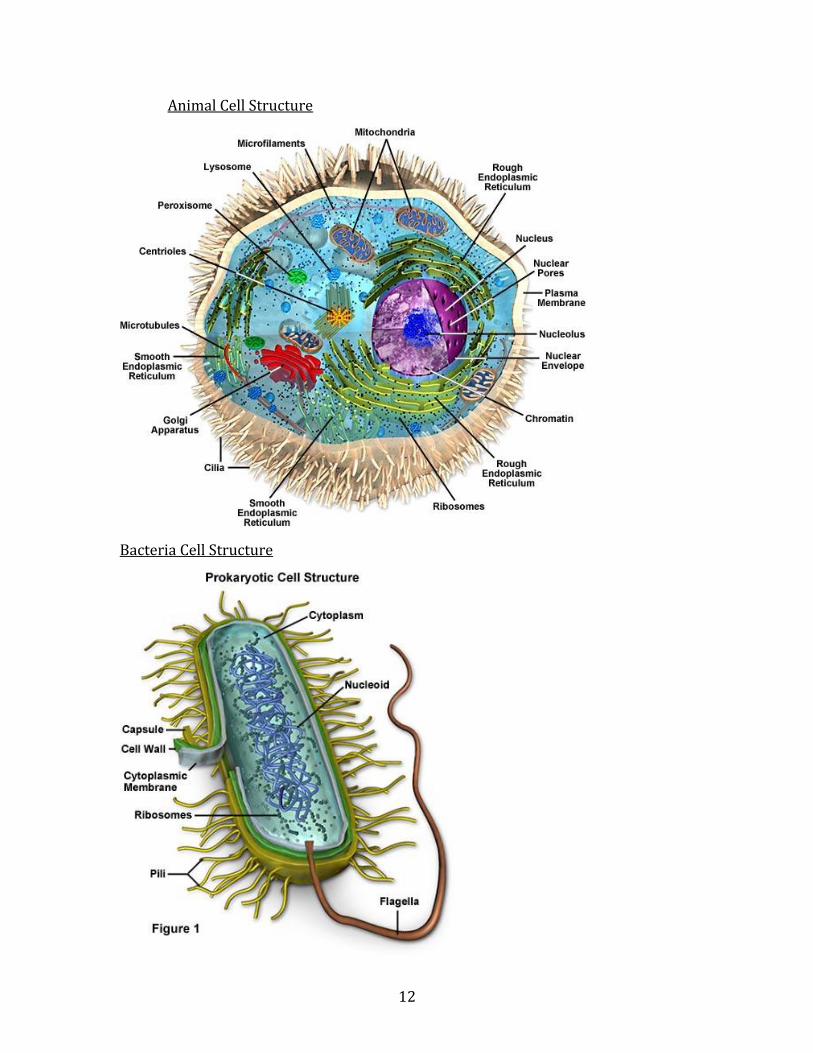
Lesson Plan: Structure of A Bacterial Cell
Day 1
~Objective~
Students will construct a Venn diagram showing the similarities and differences between an animal and a bacterial cell.
~Materials~
Butcher paper, animal and bacterial cell pictures
~Entry Task~
Give students pictures of an animal cell and a bacterial cell. Students will individually circle the differences between the two cells and then describe why they are different. They will repeat the process for similarities within the two cells.
~Activity~
Class will participate in a discussion on their observations. These topics will be addressed in the class discussion:
Nuclear Region Cell Motility Membrane Structure Other Organelles Lack of organelles in bacteria
Students will complete a Venn diagram with a partner on similarities and differences between the animal and bacterial cell. The teacher may make a class Venn diagram on the WB.
~Closure~
Teacher will introduce students to the task to be performed in day 2. Teacher will explain the process of bacterial collection and the swabbing
procedure. Students will be given Petri dishes to swab bacteria from their environments.
12
Animal Cell Structure
Bacteria Cell Structure
13
Lesson Plan: Collecting Bacteria from The Environment
Day 2
~Objectives~
Students will be able to demonstrate proper streaking procedures of bacterial collection.
Students will be able to make predictions about the diversity of bacterial populations and densities for different swabbing sites.
~Materials~
Petri dishes with tryptic soy agar, inoculating loops, parafilm, marker, and labeling tape
~Entry Task~
Students will be given a brain storming exercise that will consist of a series of questions to review material from the previous day. What are bacteria? Where do they live? Why do bacteria lack most organelles? What purpose(s) do bacteria serve? Students will contribute to class discussion.
~Activity~
As a class, students will discuss and decide on 5-10 areas outdoors and at school to collect bacteria. Divide the class into two groups and assign one area to each group. Teacher will need to demonstrate proper collecting and streaking procedures (see appendix (a) for procedure). Take the students outdoors and around the school to collect samples in the agreed upon locations. Teacher will take samples at home the day before and bring to class as a third environment.
~Closure~
Students should make predictions on what they might observe on the plates in the next few days. They should focus on how swabbing surfaces and locations affect the type and density of bacteria to be observed.
14
Lesson Plan: Bacterial Morphology and Categorization
Day 3
~Objectives~
Students will be able to observe and categorize different types of bacteria based on colony size, color, and shape and cell color and shape.
Students will use optical and fluorescence microscopes to observe bacterial cells stained for Gram classification and cell cycle determination.
~Materials~
Microscopes, pre-prepared stained-bacteria slides
~Entry Task~
Students in pair will be asked to brainstorm as many categories as they can that could be used to classify bacteria.
The list may include (color, shape, size, roughness of colonies, source, Gram structure, and viability).
~Activity~
Teacher will give short lecture on bacterial cell and colony morphology and characteristics as well as bacterial size and what students can observe using microscopes. Teacher will show proper microscope observing technique and microscope care techniques. Students will be given sample bacteria slides and will practice cell categorization and identification. Students will be shown a display of potential bacterial shapes, names, and size. Students will properly return equipment.
~Closure~
Teacher will show pictures of different types of dyes used on bacteria and how they work in bacterial cells. Students will realize that bacterial cells display a wide array of types, sizes, and shapes.
15
Lesson Plan: Bacterial Growth
Day 4
~Objectives~ Students will be able to observe and categorize different types of bacteria based on colony size, color, and shape and cell color and shape.
Students identify the different phases of growth for bacteria cultured in a given media.
Students will calculate the doubling time for bacteria.
~Materials~
Tryptic soy broth (TSB), microscopes, magnifying glasses, blank slides, spectrophotometer (if available), 10mL containers
~Entry Task~
Teacher will ask students if they’d rather be given a check for one million dollars or given a penny on the first day, two pennies on the second day, four pennies on the third day, etc exponentially for one month. Teacher will show how exponential increase can dramatically increase magnitude. Teacher will then use the analogy above to describe how bacterial cells grow exponentially.
~Activity~
Teacher will give short lecture on bacterial growth phases. Students will observe their bacteria plates and categorize colonies using worksheet provided. Students will aseptically transfer specific colonies to 5mL broth mixture. Teacher will give short lesson on how a spectrophotometer can be used to measure bacterial growth, and how to take measurements using the spectrophotometer. The usefulness of calibration curves will be introduced.
~Closure~
Students will write on an exit card whether they’d rather be given a one billion dollar check or one dollar a day, doubling each day, for three weeks.
16
Lesson Plan: Growth Curves
Day 5
~Objectives~
Students will be able to use a spectrophotometer and take readings using it.
Students will be able to make a scatter graph using the data collected in MS Excel.
~Materials~
Graph paper, spectrophotometer, solution with different dye concentration (food dye, or juice with different concentrations)
~Entry Task~
Students will need to write out the procedure for the day’s lab. Then they will need to turn and tell a partner and discuss any differences.
~Activity~
Students from multiple classes will take measurements using a spectrophotometer and record data in a data table throughout the day (given by teacher). Teacher will lecture on bacterial growth and demonstrate how to construct a growth curve. Students will be given data points from two different kinds of bacteria for graph practice. They will individually begin constructing a growth curve graph. The graph must include a title, labeled x- and y-axis, and all four phases.
~Closure~
Students will use the sample data to quantify the length of each bacterial growth phase, and also to calculate the doubling time of the two bacterial cultures given.
17
Lesson Plan: Understanding Bacteria Growth Curve
Day 6
~Objectives~
Students will be able to identify lag, exponential, stationary, and death phases.
Students will be able to make a graph using the data collected from the spectrophotometer.
~Materials~
~Entry Task~
Students will look at a given scatter graph and will identify the four growth phases of bacteria.
~Activity~
Students will be given all the data points from the three different kinds of bacteria they grew in previous days. They will individually begin constructing a growth curve graph. The graph must include a title, labeled x- and y-axis, and all four phases. After students have completed their graphs they will then discuss and make inferences in small groups. First they will need to compare their charts. Student will need to make any adjustments necessary if any differences exist between them (specifically phases). Students will have the rest of the period to prepare a short presentation on conclusions drawn, which will be presented at the end of the day.
~Closure~
Student presentations on inferences they have drawn about the three different growth curves.
One can also display the growth curve you have collected and give a matching activity. For example, which bacteria from the ones below showed a stationary phase, which type has the longest lag phase, which ones are the fastest growers, and which one might belong to the same strain?
18
Lesson Plan: Bacterial Transport through Columns
Day 7-10
~Objectives~
Students will be able to list variables affecting bacterial transport and adhesion through colloidal materials.
Students will be able to calculate pore volume of backed beds, calibrate flow rates through pumps, and estimate the number of colloids in a column.
Students will construct a breakthrough curve of the transport of a bacterium in a column filled with colloids. The students will also demonstrate an understanding of the different regimes of the breakthrough curve.
~Materials~
Columns of variable sizes, peristaltic pump, substrates (glass beads, sand, etc.), glassware, spectrophotometer, bacteria, TSB broth, small test tubes, sample taker, calculator
~Entry Task~
Students will brainstorm a list of the main factors that may affect bacteria’s ability to attach to a substrate.
~Activity~
Students will set up the column experiment. Students will then calibrate the pump and calculate the flow rate necessary for the pump to obtain enough broth for the automatic sampler and will calibrate the sampler accordingly. Students will calculate the pore volume after placing substrate into the column. Students will then perform the column experiment and measure the concentration of bacteria for each sample using the spectrophotometer. Finally, they will make a graph of the data points from the results. Students may vary different factors such as the flow rate, size of colloids backed in the column, acidity of the bacterial broth, and the dimensions of the columns used.
~Closure~
Students will use pore volume to estimate how many/much substrate (glass beads, sand, etc) is in the column. After showing their work for their estimated number, students will count the actual amount of beads in the column and calculate an error.
Side note: Days 8-10, the lesson can be modified and repeated using the following factors:
Column height and width Type of bacteria

19
Temperature pH (lemon juice, plant oil, etc) Size and type of substrate Flow rate and direction Layered vs. pure substrates
20
Lesson Plan: Batch Experiments
Day 11-14
~Objectives~
Students will perform batch retention experiments to investigate bacterial adhesion to multiple substrates. As a result of the experiments performed, students will demonstrate a better understanding of the biocorrosion phenomenon.
~Materials~
6x 25mL beakers, tryptic soy broth (TSB), bacteria, large tweezers, balance, spectrophotometer, cuvvets, cubes of different substrates (steel, acrylic, glass, titanium, copper, aluminum, etc)
~Entry Task~
Students will be allowed to choose a substrate of interest to study bacterial attachment. They will take one cube and measure the weight in mass and record it on their worksheet or in their journal.
~Activity~
Students will fill a beaker with enough TSB to completely cover their substrate. Students will then inoculate the TSB with a given type of bacteria and take a spectrophotometer reading of the inoculated TSB broth. After 24 hours, students will remove the cube substrate, wash, clean, and dry it, and then weigh it again. They will also take another reading of bacterial absorbance with the spectrophotometer. By taking out the cube substrate, you are removing all the bacteria attached to it. The second spectrophotometer reading is measuring how much bacteria did not attach to the cube substrate. This cycle will continue for the next 4 to 7 days or until students begin to get a significant weight change. Some of the substrates such as glass or acrylic will not have a weight change.
~Closure~
Note: This lesson does not take long to set up and can continue with minimal input effort. Only a daily measurement is needed. Other lessons may be taught simultaneously. This lesson may also be modified to test other variables including, size of cube, type of bacteria, type of substrate, concentration of solution, solution chemistry, etc.
21
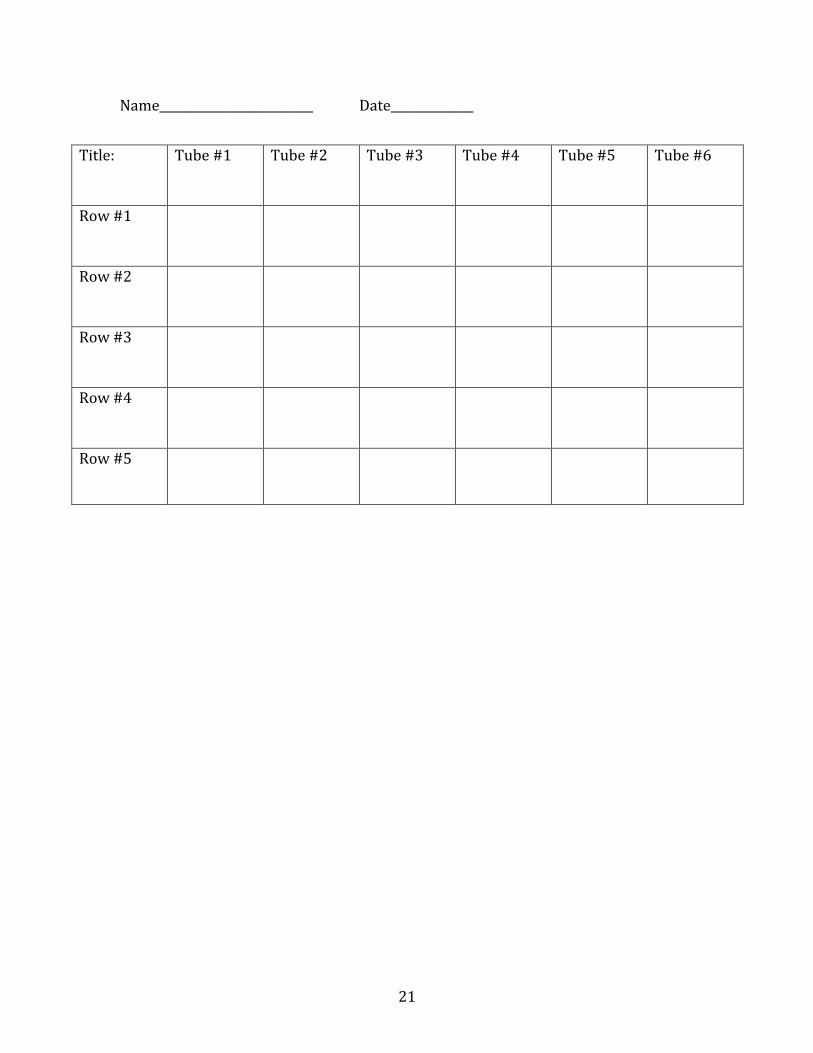
Name__________________________ Date______________
Title: Tube #1 Tube #2 Tube #3 Tube #4 Tube #5 Tube #6
Row #1
Row #2
Row #3
Row #4
Row #5

22
23
Unit Assessment
The project is to design an experiment that would clean up a waste site using bioremediation. The first part of the assignment will be to research a current world issue involving a hazardous waste site. The research must include the name and location of the site, the type of contaminate, the effect area, what processes have already been used to clean up the site, and what type of substrates are effected. From their research, students will need to develop a thesis statement that is supported by evidence as to how they propose to clean up the site. Students will compile this information in a research paper format (12pt. font, double-spaced). There is no length requirement as long as all the criteria are met.
Students will also be creating a poster presentation. Students will write a process and procedure for their proposal and will present it to the class in 5 to 15 minutes. The poster must include drawings showing experimental set-up, a materials list, the rationale for the experiment, the development of and/or changes made to the experiment, and the procedure.
24
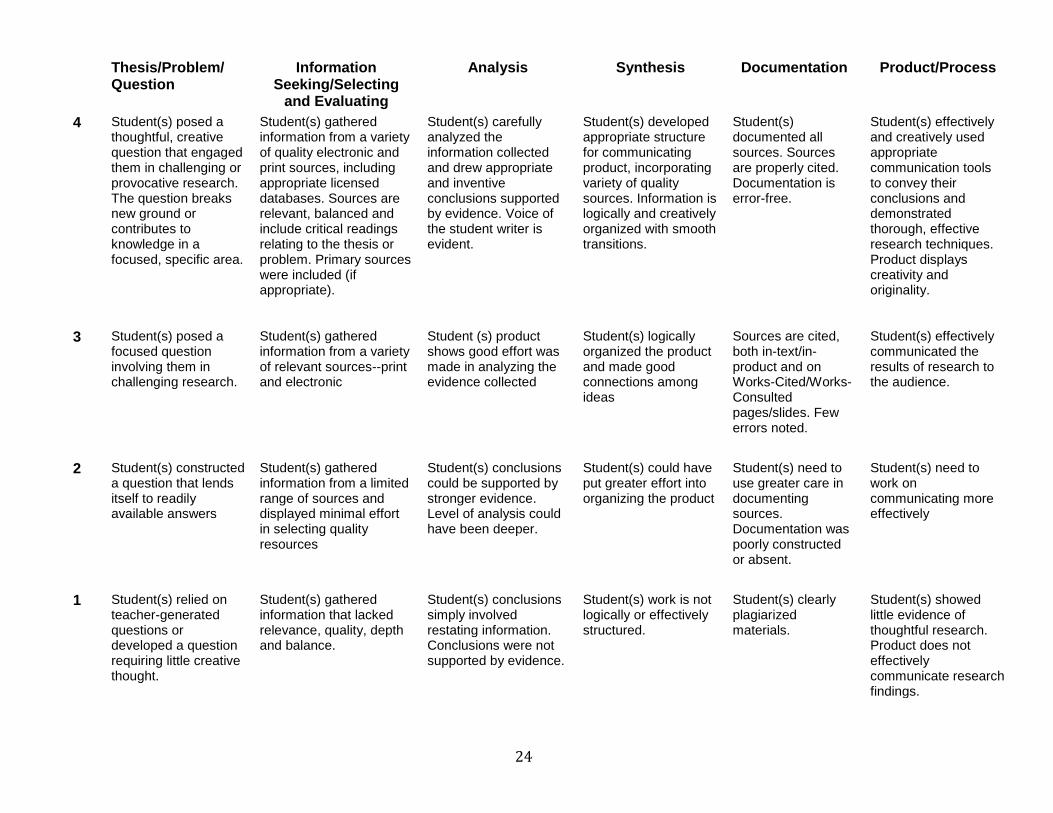
Thesis/Problem/ Question
Information Seeking/Selecting
and Evaluating
Analysis Synthesis Documentation Product/Process
4 Student(s) posed a thoughtful, creative question that engaged them in challenging or provocative research. The question breaks new ground or contributes to knowledge in a focused, specific area.
Student(s) gathered information from a variety of quality electronic and print sources, including appropriate licensed databases. Sources are relevant, balanced and include critical readings relating to the thesis or problem. Primary sources were included (if appropriate).
Student(s) carefully analyzed the information collected and drew appropriate and inventive conclusions supported by evidence. Voice of the student writer is evident.
Student(s) developed appropriate structure for communicating product, incorporating variety of quality sources. Information is logically and creatively organized with smooth transitions.
Student(s) documented all sources. Sources are properly cited. Documentation is error-free.
Student(s) effectively and creatively used appropriate communication tools to convey their conclusions and demonstrated thorough, effective research techniques. Product displays creativity and originality.
3 Student(s) posed a focused question involving them in challenging research.
Student(s) gathered information from a variety of relevant sources--print and electronic
Student (s) product shows good effort was made in analyzing the evidence collected
Student(s) logically organized the product and made good connections among ideas
Sources are cited, both in-text/in-product and on Works-Cited/Works-Consulted pages/slides. Few errors noted.
Student(s) effectively communicated the results of research to the audience.
2 Student(s) constructed a question that lends itself to readily available answers
Student(s) gathered information from a limited range of sources and displayed minimal effort in selecting quality resources
Student(s) conclusions could be supported by stronger evidence. Level of analysis could have been deeper.
Student(s) could have put greater effort into organizing the product
Student(s) need to use greater care in documenting sources. Documentation was poorly constructed or absent.
Student(s) need to work on communicating more effectively
1 Student(s) relied on teacher-generated questions or developed a question requiring little creative thought.
Student(s) gathered information that lacked relevance, quality, depth and balance.
Student(s) conclusions simply involved restating information. Conclusions were not supported by evidence.
Student(s) work is not logically or effectively structured.
Student(s) clearly plagiarized materials.
Student(s) showed little evidence of thoughtful research. Product does not effectively communicate research findings.
25
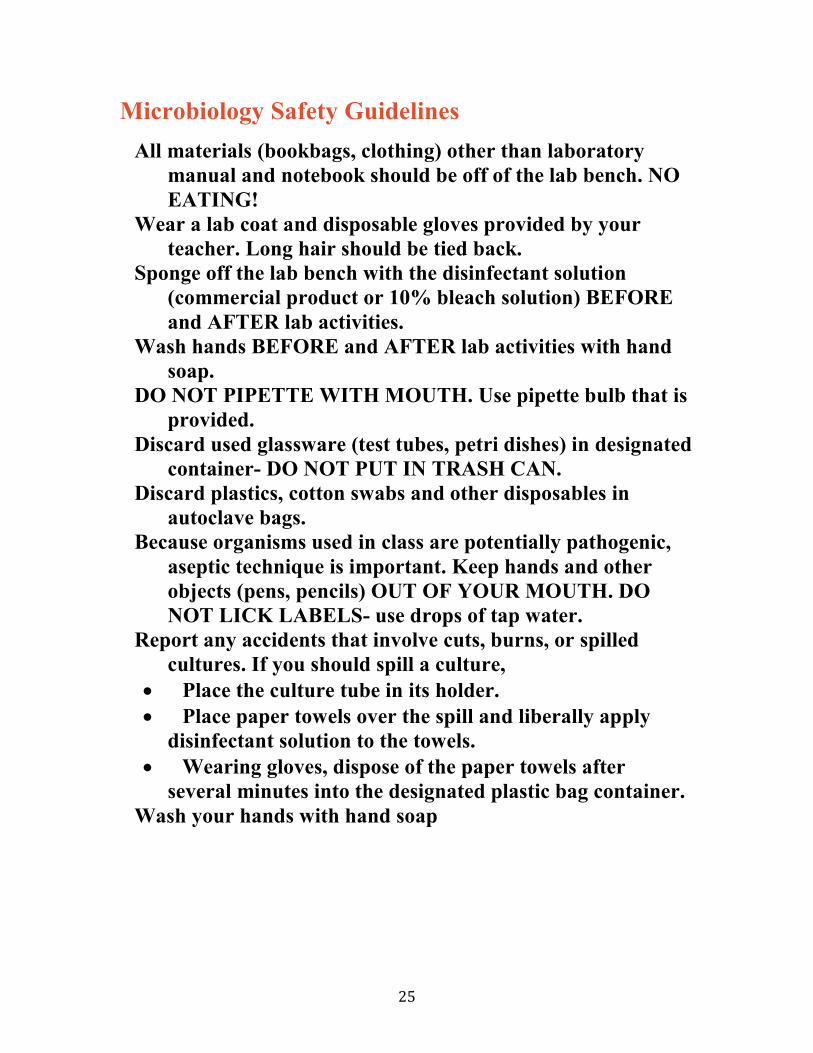
Microbiology Safety Guidelines
All materials (bookbags, clothing) other than laboratory
manual and notebook should be off of the lab bench. NO
EATING!
Wear a lab coat and disposable gloves provided by your
teacher. Long hair should be tied back.
Sponge off the lab bench with the disinfectant solution
(commercial product or 10% bleach solution) BEFORE
and AFTER lab activities.
Wash hands BEFORE and AFTER lab activities with hand
soap.
DO NOT PIPETTE WITH MOUTH. Use pipette bulb that is
provided.
Discard used glassware (test tubes, petri dishes) in designated
container- DO NOT PUT IN TRASH CAN.
Discard plastics, cotton swabs and other disposables in
autoclave bags.
Because organisms used in class are potentially pathogenic,
aseptic technique is important. Keep hands and other
objects (pens, pencils) OUT OF YOUR MOUTH. DO
NOT LICK LABELS- use drops of tap water.
Report any accidents that involve cuts, burns, or spilled
cultures. If you should spill a culture,
Place the culture tube in its holder.
Place paper towels over the spill and liberally apply
disinfectant solution to the towels.
Wearing gloves, dispose of the paper towels after
several minutes into the designated plastic bag container.
Wash your hands with hand soap
26
References Microbiology Safety Guidelines:
http://www.chemheritage.org/educationalservices/pharm/asp/pop/safebio.htm
Cell Structure Pictures:
http://www.ict-science-to-society.org/Pathogenomics/images/bacteria_cell.jpg
http://www.cartage.org.lb/en/themes/Sciences/Zoology/AnimalPhysiology/Anatomy/Anatomy/animalcell.jpg
http://www.scienceclarified.com/images/uesc_02_img0068.jpg Oil Spill Picture:
http://www.pacificariptide.com/pacifica_riptide/images/2007/11/12/ba_oil_spill_0299_kr.jpg