Embed Size (px)
Citation preview
8/7/2019 im project-1
http://slidepdf.com/reader/full/im-project-1 1/37
INVESTMENT MANAGEMENT
PROJECT
METHODS OF COMPUTATION OFSTOCK INDICES AND CONTRAST
BETWEEN NSE NIFTY AND NYSE
DOW JONES.
SUBMITTED BY:
TRISHA ARORA
B.COM (HONS) III, B
ROLL NO.: 146
8/7/2019 im project-1
http://slidepdf.com/reader/full/im-project-1 2/37
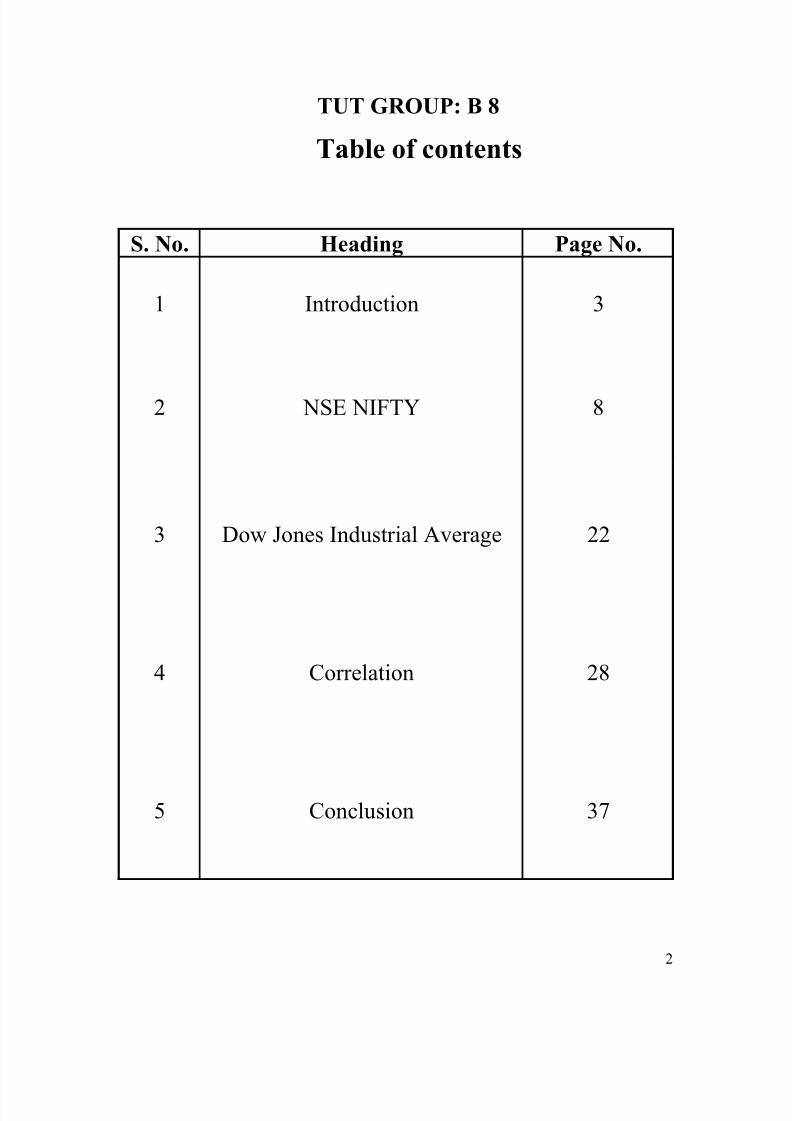
TUT GROUP: B 8
Table of contents
S. No. Heading Page No.
1 Introduction 3
2 NSE NIFTY 8
3 Dow Jones Industrial Average 22
4 Correlation 28
5 Conclusion 37
2

8/7/2019 im project-1
http://slidepdf.com/reader/full/im-project-1 3/37
CHAPTER 1
INTRODUCTIONINTRODUCTION
3

8/7/2019 im project-1
http://slidepdf.com/reader/full/im-project-1 4/37
INTRODUCTION
Stock is a certificate representing partial ownership in a corporation. They are issued by
corporations that need long-term funds. Although the issuing corporation is not
obligated to repurchase this stock at any time in the future, shareholders can sell it to
other investors in the secondary market.
Stock Market is a secondary market where already issued financial assets are traded.
The key distinction between a primary market and secondary market is that in the
secondary market the issuer of the asset does not receive funds from the buyer. Rather,
the existing issues changes hands in the secondary market, and funds flow from the buyer
of the asset to the seller.
The Stock Exchange provides the issuer with regular information about the value of its
outstanding stocks or bonds. It also offers investor’s liquidity for their assets, information
about them as well as prices for the assets they are holding or want to buy. Further, they
bring together many interested buyers and sellers of assets and so can reduce the costs of
searching for them.
Thus, stock markets facilitate the equity investment into firms and the transfer of
funds in exchange of stocks.
A Stock Market Index is a representative sample that makes it simple to understand and
interpret market performance. It is a comprehensive measure of market trends, intended
for investors who are concerned with general stock market price movements. It helps in
evaluating the performance of a given market. It comprises stocks that have large
liquidity and market capitalization. Each stock is given a weightage in the Index
4

8/7/2019 im project-1
http://slidepdf.com/reader/full/im-project-1 5/37
equivalent to its market capitalization. The Index value compares the day’s market
capitalization vis-à-vis base capitalization and indicates how prices in general have
moved over a period of time. Now-a-days, many stock market indices are computed so as
to understand the behavior of the market. Some of them are as follows:
AT BOMBAY STOCK EXCHANGE (BSE):
Sensex representing 30 most active shares
BSE 100
BSE 200
BSE 500
Sectoral Indices like BSE Teck, PSU Index, Healthcare Index, Bankex etc.
AT NATIONAL STOCK EXCHANGE (NSE):
S & P CNX Nifty representing 50 most active shares
CNX MIDCAP 200
CNX Nifty Junior
S & P CNX 500
S & P CNX Defty
CNX IT
However the most well known indices and generally acceptable by all kinds of investors
in the Indian Equity Market are the BSE Sensex and S & P CNX Nifty which reflect the
movement of 30 stocks on the Bombay Stock Exchange and 50 stocks on the National
Stock Exchange (NSE) respectively. The BSE Sensex has grown from a base of 100 in
5
8/7/2019 im project-1
http://slidepdf.com/reader/full/im-project-1 6/37
1979-80 to over 7000 in recent times. On the other hand, S & P CNX Nifty has grown
from a base of 1000 in 1994-95 to 2000 in recent times.
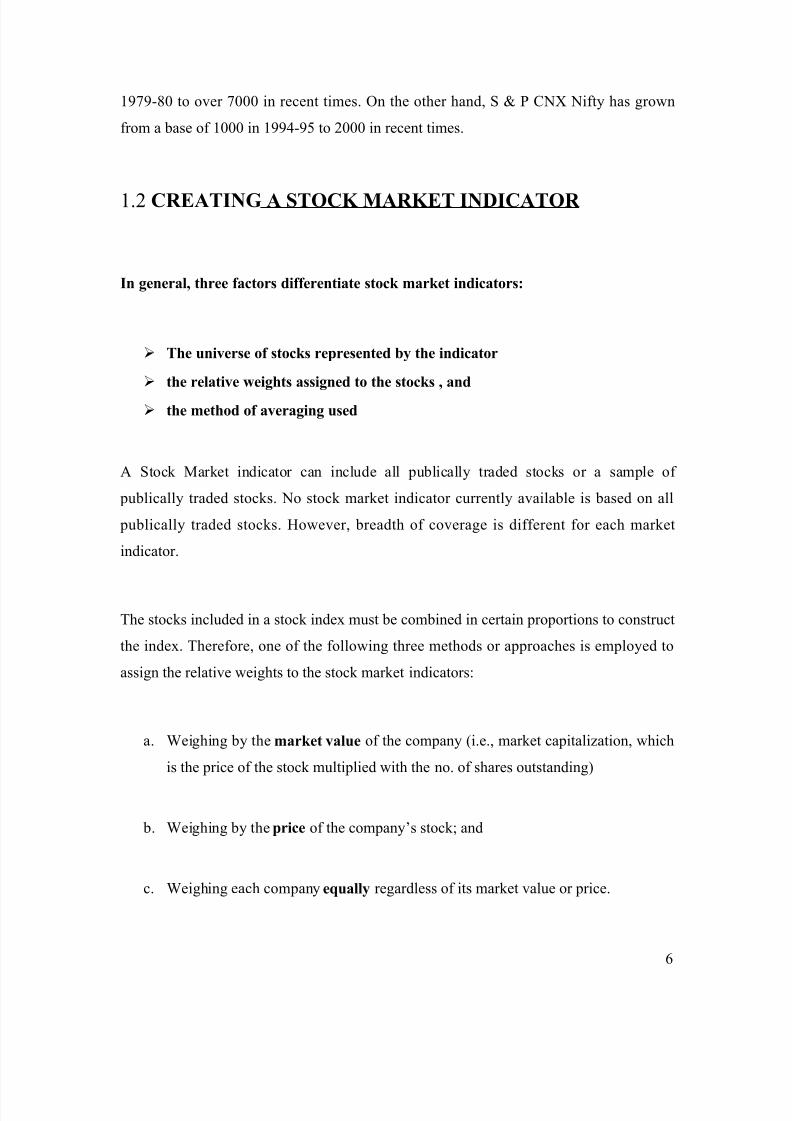
1.2 CREATING A STOCK MARKET INDICATOR
In general, three factors differentiate stock market indicators:
The universe of stocks represented by the indicator
the relative weights assigned to the stocks , and
the method of averaging used
A Stock Market indicator can include all publically traded stocks or a sample of
publically traded stocks. No stock market indicator currently available is based on all
publically traded stocks. However, breadth of coverage is different for each market
indicator.
The stocks included in a stock index must be combined in certain proportions to construct
the index. Therefore, one of the following three methods or approaches is employed to
assign the relative weights to the stock market indicators:
a. Weighing by the market value of the company (i.e., market capitalization, which
is the price of the stock multiplied with the no. of shares outstanding)
b. Weighing by the price of the company’s stock; and
c. Weighing each company equally regardless of its market value or price.
6

8/7/2019 im project-1
http://slidepdf.com/reader/full/im-project-1 7/37
With the exception of DJIA, VLCA and MMI, the preeminent stock market indices are
market value weighed. The DJIA is a price weighed index, with the index adjusted for
stock splits and stock dividends. The VLCA and MMI are equally weighed indices.
Given the stocks and the relative weightage to be assigned to each one of them, it is then
necessary to average the individual components. Two methods of Averaging are
possible: Arithmetic and Geometric.
An Arithmetic Mean is basically a simple average of the component stocks, calculated
by summing the components after weighing them and dividing by the sum of the weights.
A Geometric Mean involves the multiplication of the components, after which the
product is raised to the power of one divided by the number of components.
All properly constructed stock market indicators are constructed using Arithmetic
Averaging.
Globally, so far, the major application of a market index has been to examine the level of
index and know how the overall market has been faring. Therefore, for a market index to
excel at this application, it must have the following three features:
1. It should capture the behavior of a large variety of different portfolios in the
country.
2. The index set should be highly liquid.
7
8/7/2019 im project-1
http://slidepdf.com/reader/full/im-project-1 8/37
3. It should have a long historical time series of index performance.
Keeping this in mind, let us now study in detail the two most recognized and employed
indices of the Indian Equity Market.
CHAPTER 2CHAPTER 2
S & P CNX NIFTYS & P CNX NIFTY
8

8/7/2019 im project-1
http://slidepdf.com/reader/full/im-project-1 9/37
S & P CNX NIFTY
The NSE –50 Index was launched by the National Stock Exchange of India Limited,
taking as base the closing prices of November 3, 1995 when one year of its Capital
Market segment was completed. It was subsequently renamed S & P CNX Nifty- with
S & P indicating endorsement of the Index by Standard and Poor’s and CNX standing for
CRISIL NSE Index.
The S & P CNX NIFTY, also popularly known as the Nifty 50, is one of the most
scientific indices in India that reflects the price movement of 50 blue- chips, large cap,
liquid and highly traded stocks of 23 sectors. The Nifty is managed by India Index
Services & Products Ltd. (IISL). The total value of all Nifty stocks is approximately 70%
of the traded value of all stocks on the NSE. Nifty stocks represent about 59% of the total
market capitalization.
2.1 OBJECTIVES
The basic idea of this index is to ascertain the movements of the stock market as a whole
by tapping the news which can affect the stock. The index also averages out the good
stock - specific news for a few companies and bad stock - specific news for others and
left with the news that is common to all stocks. The news that is common to all stocks is
news about India, which is the sole purpose of NSE Nifty. According to NSE, the Indexwas introduced with the objectives of:
Reflecting market movement more accurately,
Providing Fund Managers with a tool for measuring portfolio returns vis-à-vis
market returns, and
9
8/7/2019 im project-1
http://slidepdf.com/reader/full/im-project-1 10/37
Providing a basis for introducing Index based derivatives.
The Index is based on the prices of the shares of 50 companies (chosen from among the
companies traded on the NSE), each with a market capitalization of at least Rs 500 crores
and having high degree of liquidity. The methodology used for the computation of this
Index is market capitalization weighted as followed by the S & P 500. The base value of
this Index has been set as 1000. The Index allows the corporate actions like stock splits,
rights issues etc without affecting its value.
2.2 SELECTION CRITERIA
The constituents and the criteria for the selection judge the effectiveness of the index. S
& P CNX Nifty is unique in this respect. The criteria for selection and review of scrips
for the S & P CNX NIFTY are:
Liquidity ( or Impact Cost)
Average Market Capitalization for the last six months
Floating Stock, which is traded in the market
IMPACT COST
For inclusion in the index, the security should have traded at an average impact cost of
0.75 percent or less during the last six months for 90 percent of the observations. Impact
cost is cost of executing a transaction in a security in proportion to the weight age of its
market capitalization as against the index market capitalization at any point of time.
Impact cost is a practical and realistic measure of market liquidity; it is closer to the
10
8/7/2019 im project-1
http://slidepdf.com/reader/full/im-project-1 11/37
true cost of execution faced by a trader in comparison to the bid- ask spread. It should
however be emphasized that:
1. Impact cost is separately computed for buy and sell
2. Impact cost may very for different transaction sizes
3. Impact cost is dynamic and depends on the outstanding orders
4. Where a stock is not sufficiently liquid, a penal impact cost is applied
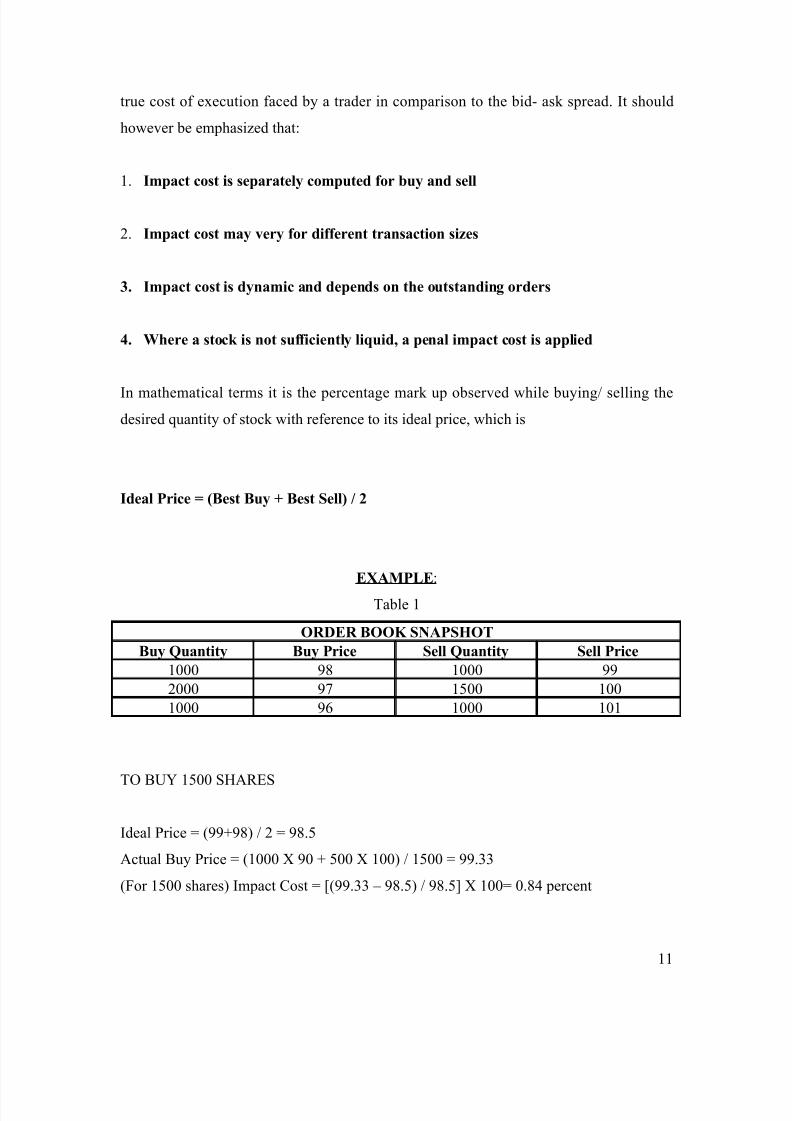
In mathematical terms it is the percentage mark up observed while buying/ selling the
desired quantity of stock with reference to its ideal price, which is
Ideal Price = (Best Buy + Best Sell) / 2
EXAMPLE :
Table 1
ORDER BOOK SNAPSHOT
Buy Quantity Buy Price Sell Quantity Sell Price
1000 98 1000 99
2000 97 1500 100
1000 96 1000 101
TO BUY 1500 SHARES
Ideal Price = (99+98) / 2 = 98.5
Actual Buy Price = (1000 X 90 + 500 X 100) / 1500 = 99.33
(For 1500 shares) Impact Cost = [(99.33 – 98.5) / 98.5] X 100= 0.84 percent
11
8/7/2019 im project-1
http://slidepdf.com/reader/full/im-project-1 12/37
The Electronic Limit Order Book (ELOB) as available on NSE is an ideal provider of
market liquidity. This style of market dispenses with market makers, and allows anyone
in the market to execute orders against the best available counter orders. The market may
thus be thought of as possessing liquidity in terms of outstanding orders laying on the buy
and sell side of the order book, which represent the intention to buy or sell.
When a buyer or seller approaches the market with an intention to buy a particular stock,
he can execute his order in the stock against such sell orders, which are already lying in
the order book, and vice versa.
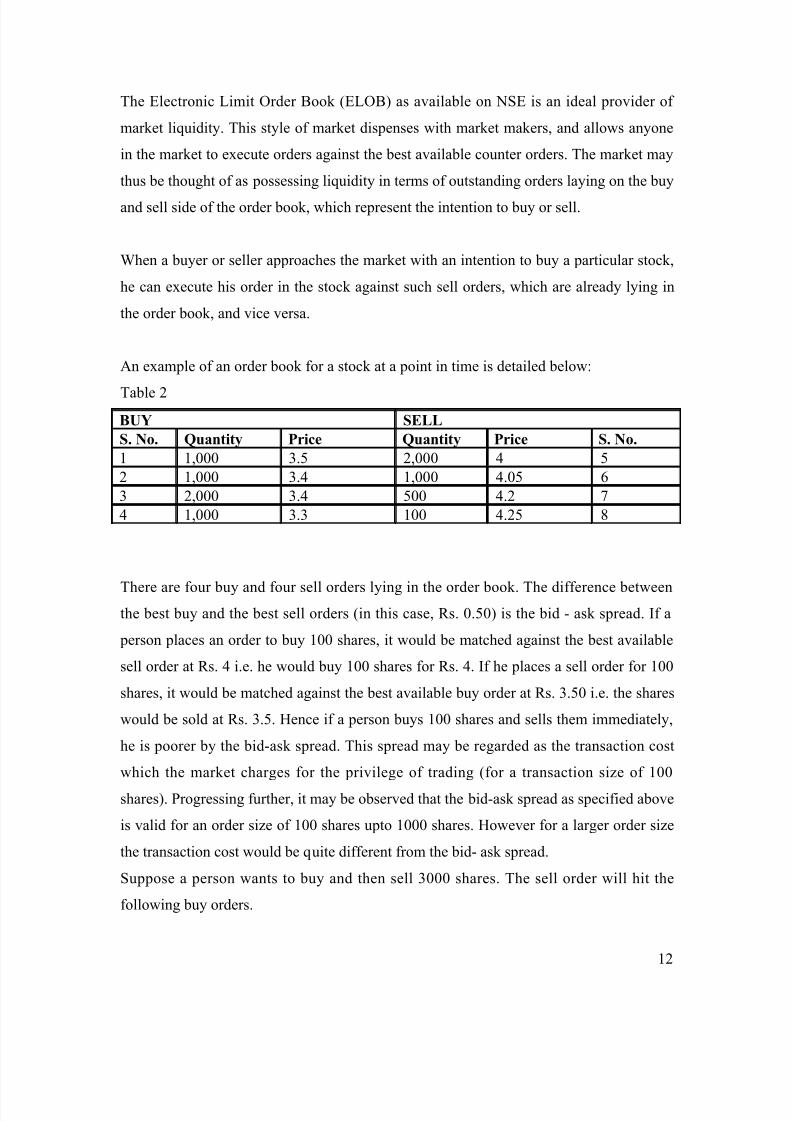
An example of an order book for a stock at a point in time is detailed below:
Table 2
BUY SELL
S. No. Quantity Price Quantity Price S. No.
1 1,000 3.5 2,000 4 5
2 1,000 3.4 1,000 4.05 6
3 2,000 3.4 500 4.2 7
4 1,000 3.3 100 4.25 8
There are four buy and four sell orders lying in the order book. The difference between
the best buy and the best sell orders (in this case, Rs. 0.50) is the bid - ask spread. If a
person places an order to buy 100 shares, it would be matched against the best available
sell order at Rs. 4 i.e. he would buy 100 shares for Rs. 4. If he places a sell order for 100
shares, it would be matched against the best available buy order at Rs. 3.50 i.e. the shares
would be sold at Rs. 3.5. Hence if a person buys 100 shares and sells them immediately,
he is poorer by the bid-ask spread. This spread may be regarded as the transaction cost
which the market charges for the privilege of trading (for a transaction size of 100
shares). Progressing further, it may be observed that the bid-ask spread as specified above
is valid for an order size of 100 shares upto 1000 shares. However for a larger order size
the transaction cost would be quite different from the bid- ask spread.
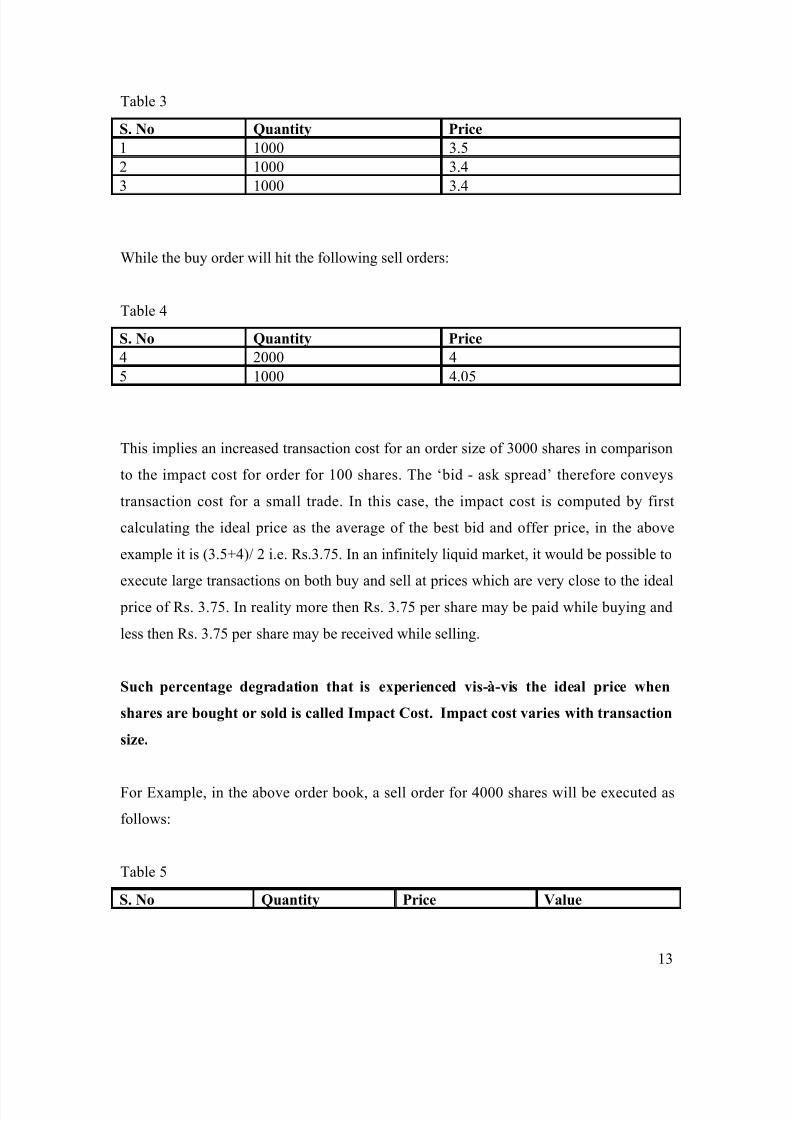
Suppose a person wants to buy and then sell 3000 shares. The sell order will hit the
following buy orders.
12
8/7/2019 im project-1
http://slidepdf.com/reader/full/im-project-1 13/37
Table 3
S. No Quantity Price
1 1000 3.5
2 1000 3.4
3 1000 3.4
While the buy order will hit the following sell orders:
Table 4
S. No Quantity Price
4 2000 4
5 1000 4.05
This implies an increased transaction cost for an order size of 3000 shares in comparison
to the impact cost for order for 100 shares. The ‘bid - ask spread’ therefore conveys
transaction cost for a small trade. In this case, the impact cost is computed by first
calculating the ideal price as the average of the best bid and offer price, in the above
example it is (3.5+4)/ 2 i.e. Rs.3.75. In an infinitely liquid market, it would be possible to
execute large transactions on both buy and sell at prices which are very close to the idealprice of Rs. 3.75. In reality more then Rs. 3.75 per share may be paid while buying and
less then Rs. 3.75 per share may be received while selling.
Such percentage degradation that is experienced vis-à-vis the ideal price when
shares are bought or sold is called Impact Cost. Impact cost varies with transaction
size.
For Example, in the above order book, a sell order for 4000 shares will be executed as
follows:
Table 5
S. No Quantity Price Value
13

8/7/2019 im project-1
http://slidepdf.com/reader/full/im-project-1 14/37
1 1,000 3.5 3,500
2 1,000 3.4 3,400
3 2,000 3.4 6,800
Total Value
Wt. Average Price
13,700
3.43
The sale price for 4000 shares is Rs. 3.43, which is 8.53 percent worse than the ideal
price of Rs. 3.75. Hence we say, ‘The impact cost faced in buying 4000 shares is 8.53
percent.’
Liquidity in the context of stock markets means a market where large orders can be
executed without incurring a high transaction cost. The transaction cost referred here
is not the fixed costs typically incurred like brokerage, transaction charges, depository
charges etc. but is the cost attributable to lack of market liquidity as explained
subsequently. Liquidity comes from the buyers and sellers in the market, who are
constantly on the look out for buying and selling opportunities. Lack of liquidity
translates into a high cost for buyers and sellers.
MARKET CAPITALISATION
Companies eligible for inclusion in Nifty must have six monthly average market
capitalizations of Rs. 500 crores or more during the last six months.
FLOATING STOCK
Companies eligible for inclusion in S & P CNX Nifty should have at least 12 percent
floating stock. For this purpose, floating stock shall mean stocks which are not held by
the promoters and associated entities (where identifiable) of such companies.
14

8/7/2019 im project-1
http://slidepdf.com/reader/full/im-project-1 15/37
2.3 COMPOSITION:
SECTORWISE SHARES IN NIFTY AS ON JULY 30, 2005
ALUMINIUM
• Hindalco Industries Ltd.
• National Aluminium Company Ltd.
AUTOMOBILES - 2 & 3 WHEELERS• Bajaj Auto Ltd.
• Hero Honda Motors Ltd.
AUTOMOBILES – 4 WHEELERS
• Mahindra and Mahindra Ltd.
• MUL
• Tata Motors
BANKS AND FINANCIAL SERVICES
• HDFC
• HDFC Bank Ltd.
• ICICI Bank Ltd.
• Oriental Bank of Commerce (OBC)
• Punjab National Bank (PNB)
• State Bank of India. (SBI)
•
CEMENT & CEMENT PRODUCTS
• Associated Cement Co. Ltd. (ACC)
15

8/7/2019 im project-1
http://slidepdf.com/reader/full/im-project-1 16/37
• Grasim Industries Ltd.
• Gujarat Ambuja Cements Ltd.
FMCG• HUL.
• ITC Ltd.
ENGINEERING GOODS
• ABB
• BHEL
• L & T
INFORMATION TECHNOLOGY
• Infosys Technologies Ltd.
• HCL Technologies Ltd.
• Satyam Computers Ltd.
• TCS
• Wipro Ltd.
OIL AND GAS
• Gas Authority of India Ltd. (GAIL)
• ONGC
MEDIA & ENTERTAINMENT
• Zee Telefilms Ltd.
PERSONAL CARE
16
8/7/2019 im project-1
http://slidepdf.com/reader/full/im-project-1 17/37
8/7/2019 im project-1
http://slidepdf.com/reader/full/im-project-1 18/37
• Steel Authority of India Ltd. (SAIL)
• Tata Steel Ltd.
TEA & COFFEE• Tata Tea Ltd.
TELECOMMUNICATION SERVICES
• Bharti Telecom
• Mahanagar Telephone Nigam Ltd. (MTNL)
• Videsh Sanchar Nigam Ltd. (VSNL)
2.4 RECONSTITUTION
The Index Maintenance Sub - Committee made changes in the Nifty 50 by including
Bharti Televentures Limited and Maruti Udyog Limited in place of Glaxo Smith Kline
18
8/7/2019 im project-1
http://slidepdf.com/reader/full/im-project-1 19/37
Consumer Healthcare Limited and NIIT Limited respectively. These changes became
effective from March 01, 2004.
These type of reshuffling is done in order to achieve the objective with which Nifty is
formed. Also it ensures that all the fifty stocks are liquid stocks. The moment authorities
think that stocks are no longer liquid they brought changes in the composition of index.
S & P CNX Nifty uses clear researched and publicly documented rules for index revision.
These rules are applied regularly, to obtain changes to the index set. Index reviews are
carried out every quarter to ensure that each security in the index fulfills all the laid down
criteria. IDBI was once not listed; SBI was once illiquid; Infosys was once an obscure
software startup. The world changes, and one by one, these stocks have come into the
S & P CNX Nifty. Each change in the S & P CNX Nifty is small, so the continuity of the
Index is maintained.
2.5 COMPUTATION OF NIFTY 50
S & P CNX Nifty is computed using market capitalization weighted method, wherein the
level of the index reflects the total market value of all the stocks in the index relative to a
particular base period. The method also takes into account constituent changes in the
index and importantly corporate actions such as stock splits, rights, etc without affecting
the index value. The base period selected for S &P CNX Nifty index is the close of prices
on November 3, 1995, which marks the completion of one year of operations of NSE’s
Capital Market Segment. The base value of the index has been sat at 1,000 and a base
capital of Rs. 2.06 trillion.
The ‘Market Capitalization Weighted Method’ is same as explained for BSE Sensex. The
steps for computing the value of Sensex and Nifty are same as both uses same method of
computation.
19
8/7/2019 im project-1
http://slidepdf.com/reader/full/im-project-1 20/37
8/7/2019 im project-1
http://slidepdf.com/reader/full/im-project-1 21/37
1. The index levels are calculated from a highly liquid exchange with superior
surveillance procedures
2. S & P CNX Nifty has a large market capitalization so the consequence (upon the
index) of a given move in an individual stock price is smaller
3. S & P CNX Nifty calculation intrinsically requires liquidity in proportion to market
capitalization, thus avoiding weak links which a manipulator can attack. Users of the
S&P CNX Nifty benefit from the research that is possible owing to the long time-
series available: both S & P CNX Nifty and S&P CNX Nifty Total Returns Index
series are observed from July 1990 onwards. S&P CNX Nifty is backed by solid
economic research and three of the most respected institutions: NSE, S&P and
CRISIL.
21
8/7/2019 im project-1
http://slidepdf.com/reader/full/im-project-1 22/37
CHAPTER – 3
DOW JONES INDUSTRIAL
AVERAGE
DOWJONES INDUSTRIAL AVERAGE
22
8/7/2019 im project-1
http://slidepdf.com/reader/full/im-project-1 23/37
The Dow Jones Industrial Average (DJIA), also referred to as the Industrial Average,
the Dow Jones, the Dow 30, or simply the Dow, is a stock market index, and one of
several indices created by Wall Street Journal editor and Dow Jones & Company co-
founder Charles Dow. It is now owned by the CME Group, who is the majority owner
of Dow Jones Indexes. The average is named after Dow and one of his business
associates, statistician Edward Jones. It is an index that shows how 30 large, publicly
owned companies based in the United States have traded during a standard trading
session in the stock market.
The Industrial portion of the name is largely historical, as many of the modern 30
components have little or nothing to do with traditional heavy industry.
Along with the NASDAQ Composite, the S&P 500 Index, and the Russell 2000 Index,
the Dow is among the most closely watched benchmark indices tracking targeted stock
market activities. The index's performance continues to be influenced by not only
corporate and economic reports, but also by domestic and foreign political events such as
war and terrorism, as well as by natural disasters that could potentially lead to economic
harm.
COMPOSITION
The Dow Jones Industrial Average currently consists of the following 30 companies:
CONGLOMERATE
• 3M
• General Electric
• United Technologies Corporation
ALUMINIUM
• Alcoa
23

8/7/2019 im project-1
http://slidepdf.com/reader/full/im-project-1 24/37
CONSUMER FINANCE
• American Express
TELECOMMUNICATION
• AT&T
BANKING
• Bank of America
•JP Morgan Chase
AEROSPACE AND DEFENCE
• Boeing
CONSTRUCTION AND MINING EQUIPMENT
• Caterpillar
OIL AND GAS
• Chevron Corporation
• ExxonMobil
COMUTER NETWORKING
• Cisco System
BEVERAGES
• Coca – Cola
24
8/7/2019 im project-1
http://slidepdf.com/reader/full/im-project-1 25/37
CHEMICAL INDUSTRY
• DuPont
TECHNOLOGY
• Hewlett – Packard
• IBM
HOME IMPROVEMENT RETAILER
•The Home Depot
SEMICONDUCTORS
• Intel
PHARMACEUTICAL
• Johnson & Johnson
• Merck
• Pfizer
FOOD PROCESSING
• Kraft Foods
FAST FOOD
• McDonald’s
25
8/7/2019 im project-1
http://slidepdf.com/reader/full/im-project-1 26/37
SOFTWARE
• Microsoft
CONSUMER GOODS
• Procter & Gamble
INSURANCE
• Travelers
TELECOMMUNICATION• Verizon Communication
RETAIL
• Wal – Mart
BROADCASTING AND ENTERTAINMENT
• Walt Disney
RECONSTITUTION
The components of the DJIA have changed 48 times in its 114 year history. When
companies are replaced, the scale factor used to calculate the index is adjusted so that the
value of the average remains the same. A summary of the more recent changes to the
index include the following:
On February 19, 2008, Chevron and Bank of America replaced Altria
Group and Honeywell. Chevron had previously been a Dow component from July 18,
1930, to November 1, 1999. During Chevron's absence, its split-adjusted price per share
26
8/7/2019 im project-1
http://slidepdf.com/reader/full/im-project-1 27/37
had gone from forty-four dollars to eighty-five, while the price of petroleum had risen
from twenty-four dollars to a hundred. On September 22, 2008, Kraft Foods replaced
the American International Group (AIG) in the index. On June 8, 2009, Gene
Motors and Citigroup were replaced by The Travelers Companies and Cisco Systems,
which became the third company, traded on the NASDAQ to be part of the Dow
COMPUTATION
DOW JONES is calculated by using the price weighted average method. To compensate
for the effects of stock splits and other adjustments, it is currently a scaled average. The
value of the Dow is not the actual average of the prices of its component stocks, but
rather the sum of the component prices divided by a divisor , which changes whenever
one of the component stocks has a stock split or stock dividend, so as to generate a
consistent value for the index.
To calculate the DJIA, the sum of the prices of all 30 stocks is divided by a Divisor,
the Dow Divisor. The divisor is adjusted in case of stock splits, spinoffs or similar
structural changes, to ensure that such events do not in themselves alter the numerical
value of the DJIA. Early on, the initial divisor was composed of the original number of
component companies; which made the DJIA at first, a simple arithmetic average. The
present divisor, after many adjustments, is less than one (meaning the index is larger than
the sum of the prices of the components). That is:
DJIA = ∑p
d
Where p is the prices of the component stocks and d is the Dow Divisor . Events like stock
splits or changes in the list of the companies composing the index alter the sum of the
component prices. In these cases, in order to avoid discontinuity in the index, the Dow
Divisor is updated so that the quotations right before and after the event coincides:
DJIA = ∑p old = ∑ p ne
d old d new
27
8/7/2019 im project-1
http://slidepdf.com/reader/full/im-project-1 28/37
The Dow Divisor is currently 0.132319125. Presently, every $1 change in price in a
particular stock within the average, equates to a 7.56 (1/0.132319125) point movement
CHAPTER 4CHAPTER 4
CORRELATIONCORRELATION
28
8/7/2019 im project-1
http://slidepdf.com/reader/full/im-project-1 29/37
4.1 CORRELATION BETWEEN BSE SENSEX AND NSE NIFTY
The cross – correlation coefficient r, which is a measure of linear association between
two variables, is defined as
∑1(x1-x) (y1-y)
∑1(x1-x) (y1-y)2
…… Equation 1….
A positive value of coefficient r indicates, that as one value increases the other tends to
increase whereas a negative value indicates as one variable increases the other tends to
decrease.
Here we are studying the correlation between the Bombay Stock Exchange Index Sensex
and the National stock exchange index Nifty. Both of these stock exchanges belong to
India and open and close at the same time i.e. they are synchronous.
The BSE index and the NSE index are known to be strongly correlated. Bombay Stock
exchange is the oldest stock exchange in whole of Asia. It was started in1875. The BSE
index is market capitalization weighted index of 30 stocks of sound Indian and
multinational companies. National stock exchange was established to provide access to
investors from all across India. NSE started equity operations in November 1994. The
NSE index also known as NIFTY is determined from 50 stocks of companies taken from
29

8/7/2019 im project-1
http://slidepdf.com/reader/full/im-project-1 30/37
23 sectors of economy. Following diagrams shows BSE index and NSE index
movements for the ten years from 1994 to 2003, both yearly and monthly. It is clear
from figure 1 and 2 that BSE and NSE indices are very similar in terms of the pattern of
share price movements.
FIGURE – 5.1 YEARLY MOVEMENT OF SENSEX & NIFTY
BSE SENSEX AND NSE NIFTY
0
5000
10000
15000
20000
25000
2001
2002
2003
2004
2005
2006
2007
2008
2009
2010
2011
YEARS
SE
NSEX & NIFTY
NIFTY
SENS
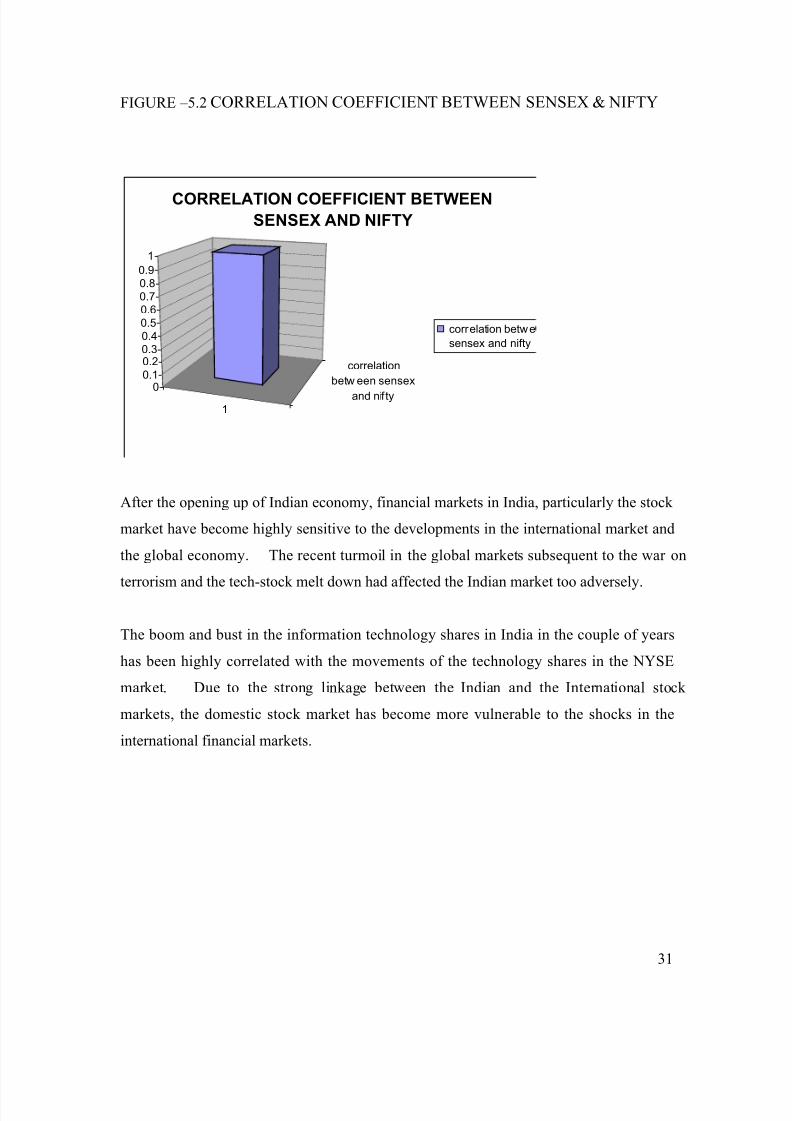
The calculated value of Correlation Coefficient (eauation1) between BSE and NSE
indices is r=0.999371 (yearly), which is represented in the following diagram. This value
of r also indicates that there exist strong positive correlation between BSE Sensex and
NSE Nifty. This is also evident form above two diagrams which show BSE and NSE
indices are highly correlated
30
8/7/2019 im project-1
http://slidepdf.com/reader/full/im-project-1 31/37
FIGURE –5.2 CORRELATION COEFFICIENT BETWEEN SENSEX & NIFTY
1
correlation
betw een sensex
and nif ty0
0.1
0.20.30.40.50.60.70.80.9
1
CORRELATION COEFFICIENT BETWEEN
SENSEX AND NIFTY
correlation betwe
sensex and nifty
After the opening up of Indian economy, financial markets in India, particularly the stock
market have become highly sensitive to the developments in the international market and
the global economy. The recent turmoil in the global markets subsequent to the war on
terrorism and the tech-stock melt down had affected the Indian market too adversely.
The boom and bust in the information technology shares in India in the couple of years
has been highly correlated with the movements of the technology shares in the NYSE
market. Due to the strong linkage between the Indian and the International stock
markets, the domestic stock market has become more vulnerable to the shocks in the
international financial markets.
31

8/7/2019 im project-1
http://slidepdf.com/reader/full/im-project-1 32/37
5.2 CORRELATION BETWEEN SENSEX, NIFTY & DOW
JONES
However, we have also calculated the correlation between Sensex, Nifty and Dow Jones.
It is found out that movement of three popular indices i.e. BSE Sensex, NSE Nifty and
Dow Jones is more similar in direction, both year wise (shows in figures 3, 4 and 5).
Diagrammatically,
FIGURE- 5.3 YEARLY MOVEMENT OF DOW JONES & BSE SENSEX
SENSEX & DOW JONES
0
5000
10000
15000
20000
25000
2001
2002
2003
2004
2005
2006
2007
2008
2009
2010
2011
YEARS
SENSEX & DOW JONES
SENSEX
DOW JON
32
8/7/2019 im project-1
http://slidepdf.com/reader/full/im-project-1 33/37
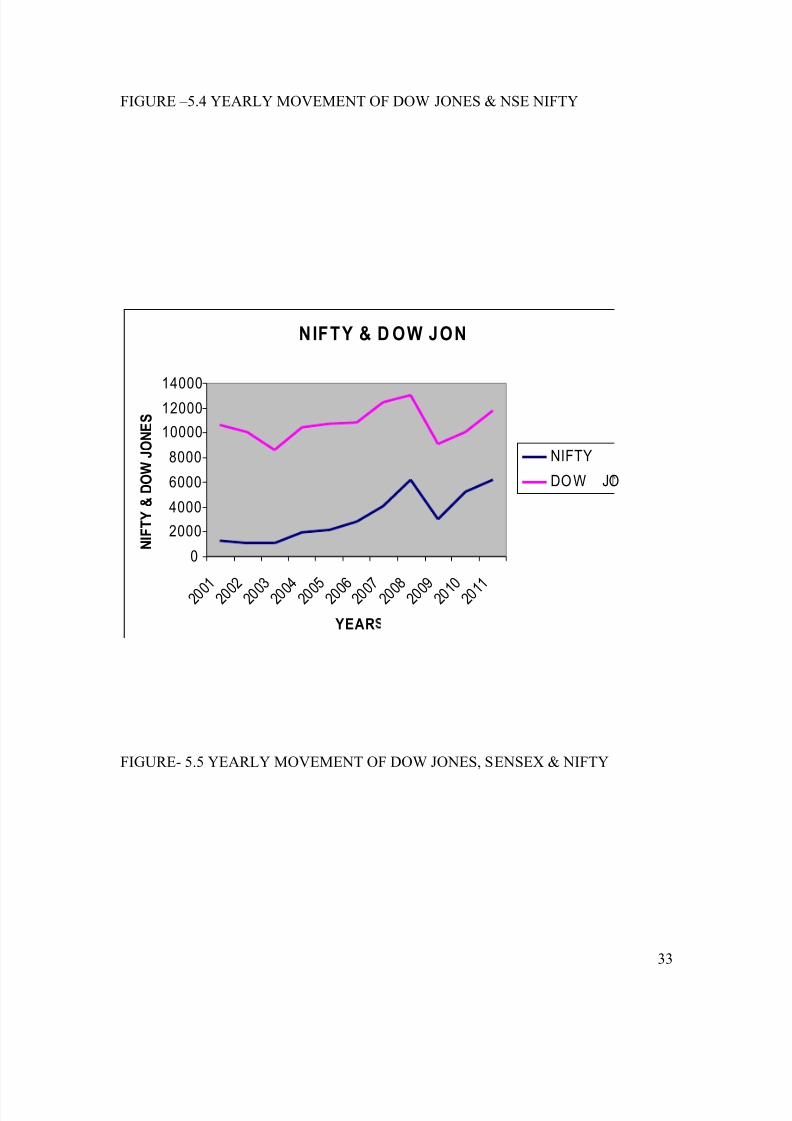
FIGURE –5.4 YEARLY MOVEMENT OF DOW JONES & NSE NIFTY
NIFTY & D OW JON
0
2000
4000
6000
8000
10000
12000
14000
2001 2002 2003 2004 2005 2006 2007 2008 2009 2010 2011
YEAR
NIFTY & DOW JONES
NIFTY
DO W JO
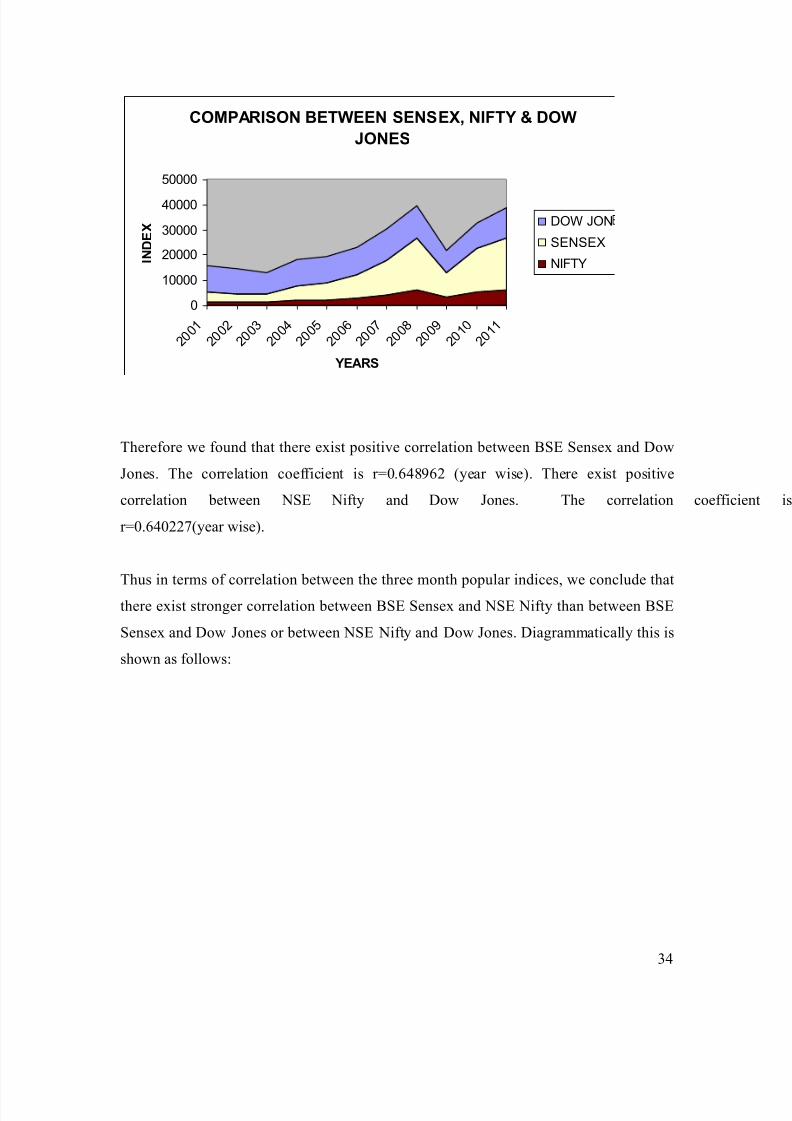
FIGURE- 5.5 YEARLY MOVEMENT OF DOW JONES, SENSEX & NIFTY
33
8/7/2019 im project-1
http://slidepdf.com/reader/full/im-project-1 34/37
COMPARISON BETWEEN SENSEX, NIFTY & DOW
JONES
0
10000
20000
30000
40000
50000
2001
2002
2003
2004
2005
2006
2007
2008
2009
2010
2011
YEARS
INDEX
DOW JON
SENSEX
NIFTY
Therefore we found that there exist positive correlation between BSE Sensex and Dow
Jones. The correlation coefficient is r=0.648962 (year wise). There exist positive
correlation between NSE Nifty and Dow Jones. The correlation coeffici
r=0.640227(year wise).
Thus in terms of correlation between the three month popular indices, we conclude thatthere exist stronger correlation between BSE Sensex and NSE Nifty than between BSE
Sensex and Dow Jones or between NSE Nifty and Dow Jones. Diagrammatically this is
shown as follows:
34

8/7/2019 im project-1
http://slidepdf.com/reader/full/im-project-1 35/37
FIGURE 5.6 CORRELATION BETWEEN SENSEX, NIFTY & DOW JONES
0
0.2
0.4
0.6
0.8
1
correl nifty
sensex
correl nifty
dow jones
correl sensex
nd dow jones
CORRELATION
CORRELATI
35

8/7/2019 im project-1
http://slidepdf.com/reader/full/im-project-1 36/37

8/7/2019 im project-1
http://slidepdf.com/reader/full/im-project-1 37/37
CONCLUSION:
NSE C&P NIFTY is calculated using the average weighted market capitalization method.
Whereas NYSE Dow Jones Industrial Average (DJIA) is computed using the priceweighted method.
Though the method of computation is different but both the indices take into account all
the sectors and show the actual face of the markets.
The NSE NIFTY and the NYSE Dow Jones Industrial Average, have a positive
correlation. This shows as one increases the other also increases and vice versa. The BSE
SENSEX and the NYSE Dow Jones are also positively correlated showing as one
increases the other also increases. Whereas the NSE NIFTY and the BSE SENSEX are
highly correlated having correlation coefficient = 0.999 approximately showing that they
are similar in pattern and share price movements.
![SELF-CONTAINED CUBER IM-21CNE IM-30CNE IM-30CWNE€¦ · Outlet Hose 1 1 2 1 1/2-3/4 Nipple - - 2 - Leg - 4 4 5 Connector Cover 1 1 1 1 3/4-3/4 Nipple - - - 1 [IM-45CNE] Top Panel](https://img.pdfslide.us/doc/110x75/5f7b6508f72d951450780c36/self-contained-cuber-im-21cne-im-30cne-im-30cwne-outlet-hose-1-1-2-1-12-34-nipple.jpg)