Embed Size (px)
Citation preview
Extending System Center Monitoring to 3rd party Database EnginesOleg NoskovSoftware Architect, BridgeWays
IM-B391

Agenda
Building Database Management Packs
Common Critical Database Metrics
Common Oracle RAC Metrics
Best Practices on Management Packs
System Center Databases
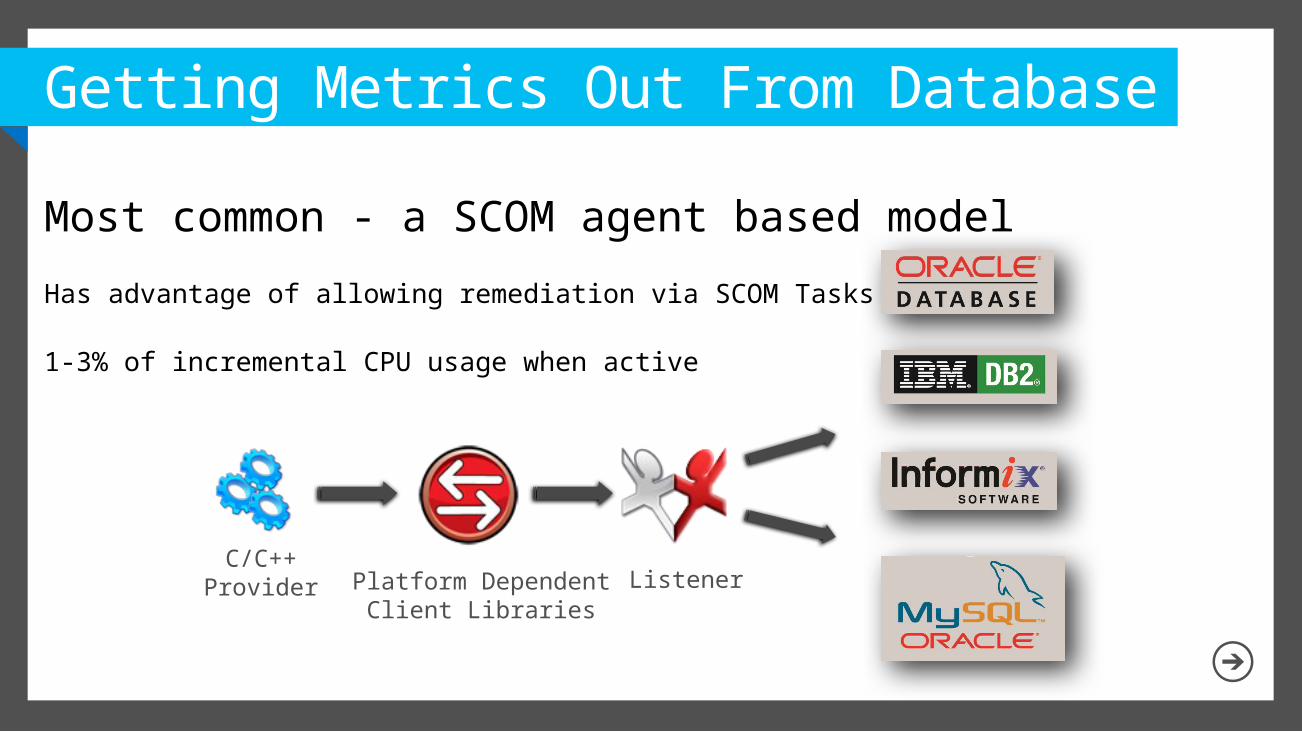
Getting Metrics Out From Database ServersMost common - a SCOM agent based model
Has advantage of allowing remediation via SCOM Tasks
1-3% of incremental CPU usage when active
C/C++Provider ListenerPlatform Dependent
Client Libraries
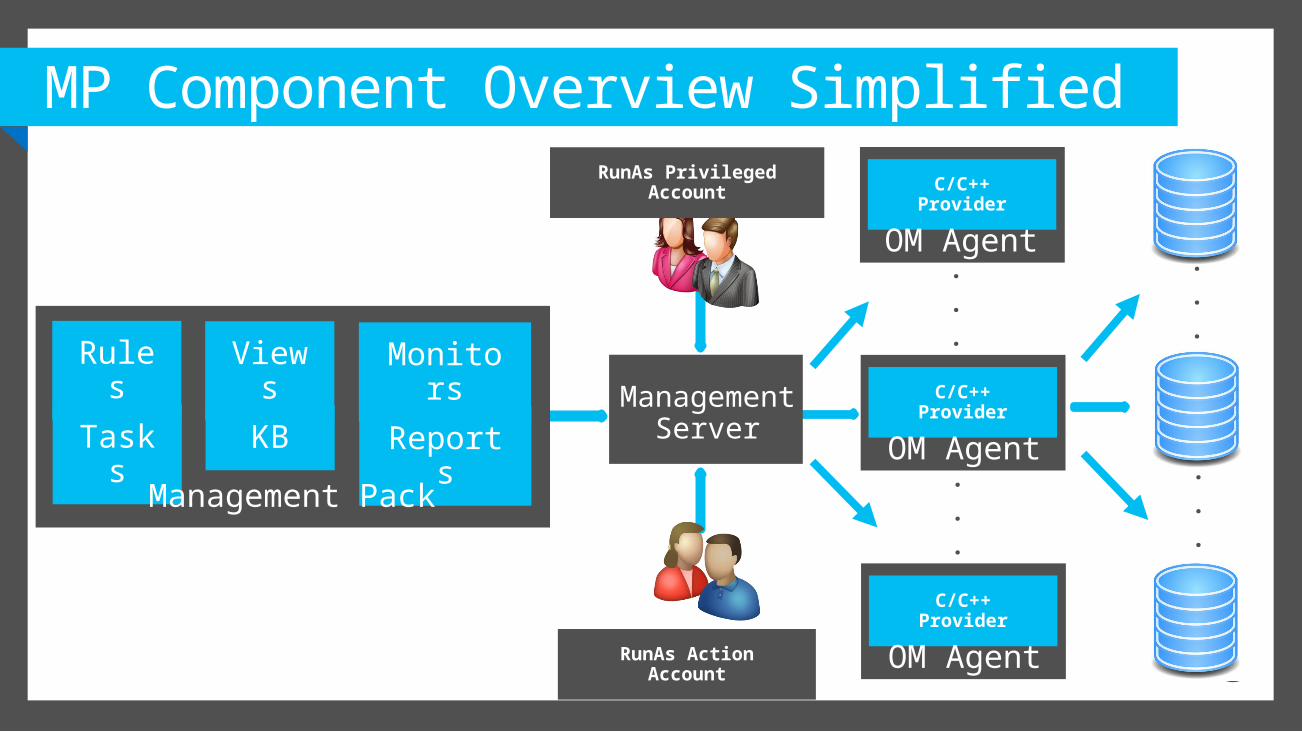
MP Component Overview Simplified
Rules Views
Monitors
Tasks KB Reports
Management Pack
Management Server
RunAs Action Account
RunAs Privileged Account
C/C++ Provider
OM Agent
C/C++ Provider
OM Agent
OM AgentC/C++
Provider
OM Agent
.
.
.
.
.
.
.
.
.
.
.
.
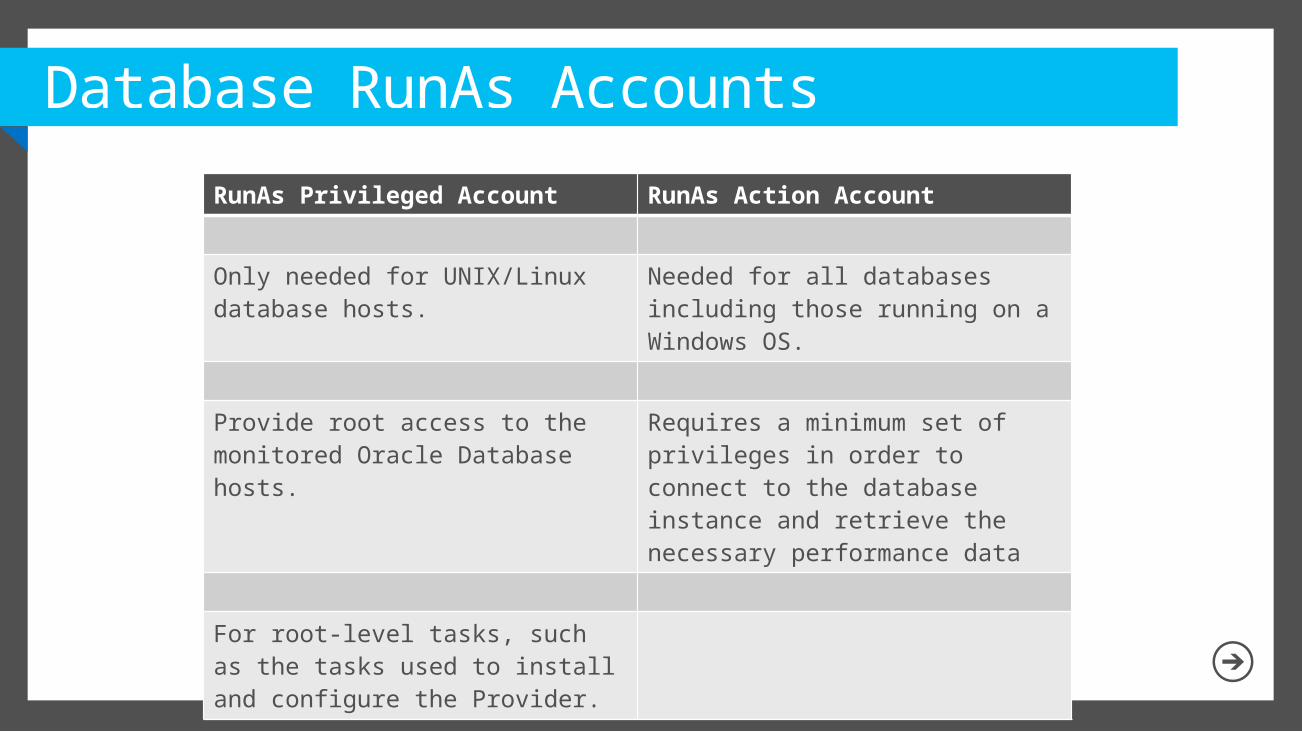
Database RunAs Accounts
RunAs Privileged Account RunAs Action Account
Only needed for UNIX/Linux database hosts.
Needed for all databases including those running on a Windows OS.
Provide root access to the monitored Oracle Database hosts.
Requires a minimum set of privileges in order to connect to the database instance and retrieve the necessary performance data
For root-level tasks, such as the tasks used to install and configure the Provider.
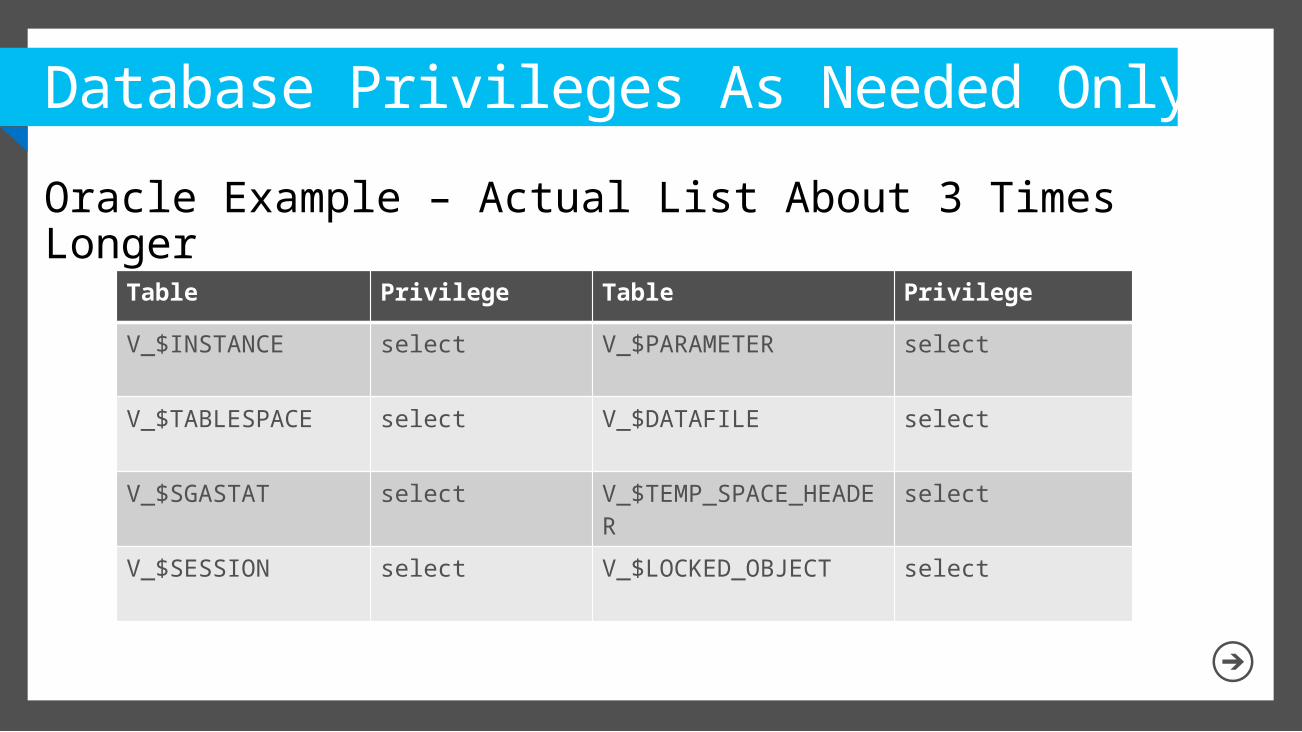
Database Privileges As Needed Only
Oracle Example – Actual List About 3 Times Longer
Table Privilege Table Privilege
V_$INSTANCE select V_$PARAMETER select
V_$TABLESPACE select V_$DATAFILE select
V_$SGASTAT select V_$TEMP_SPACE_HEADER
select
V_$SESSION select V_$LOCKED_OBJECT select
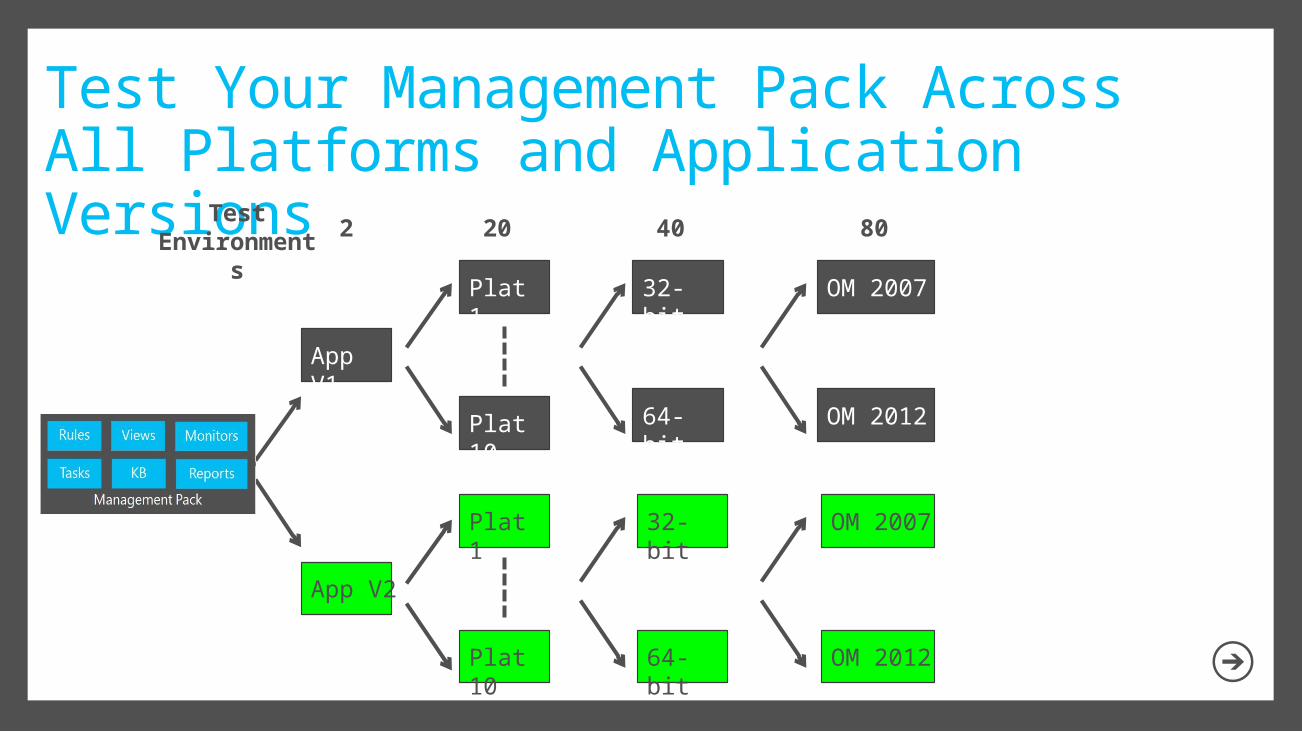
Test Your Management Pack Across All Platforms and Application Versions
MP
App V2
App V1
Plat 10
Plat 1
Plat 10
Plat 1
32-bit
64-bit
32-bit
64-bit
OM 2007
OM 2012
OM 2007
OM 2012
2 20 40 80Test
Environments
Video – RunAs Accounts & Provider Deployment
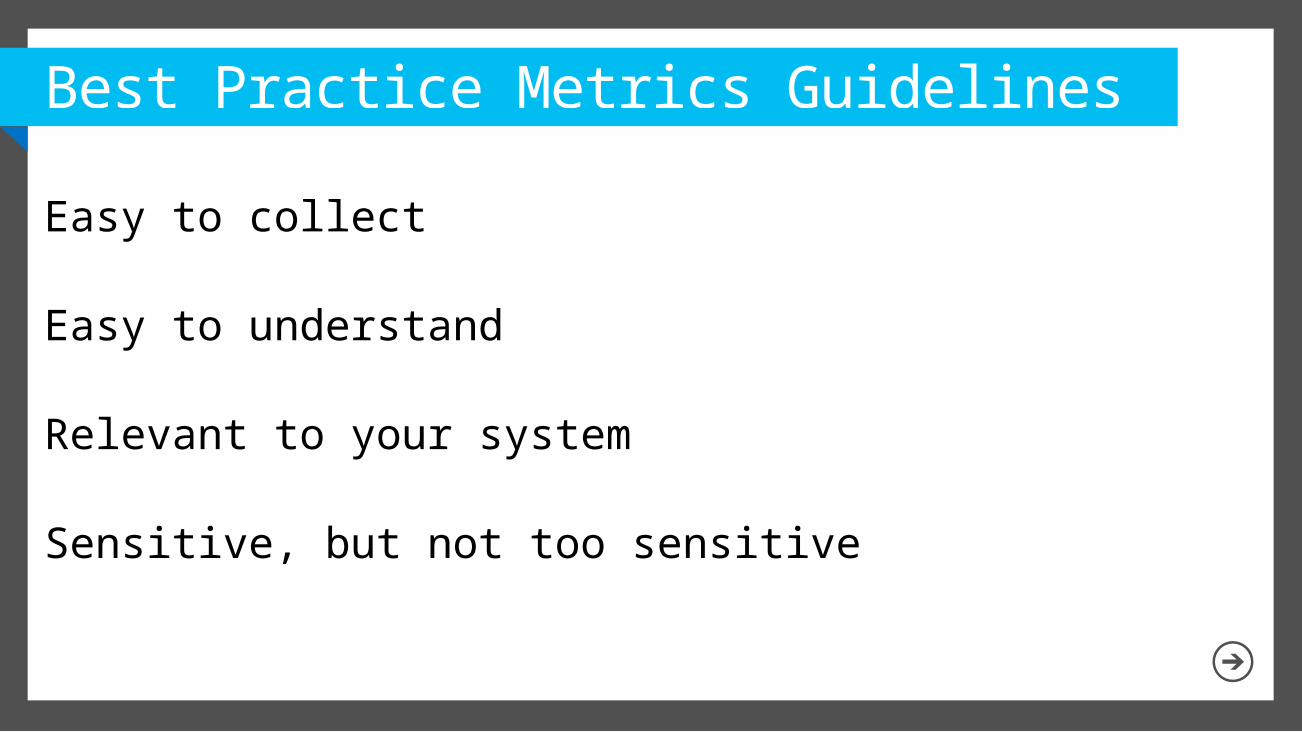
Best Practice Metrics Guidelines
Easy to collect
Easy to understand
Relevant to your system
Sensitive, but not too sensitive
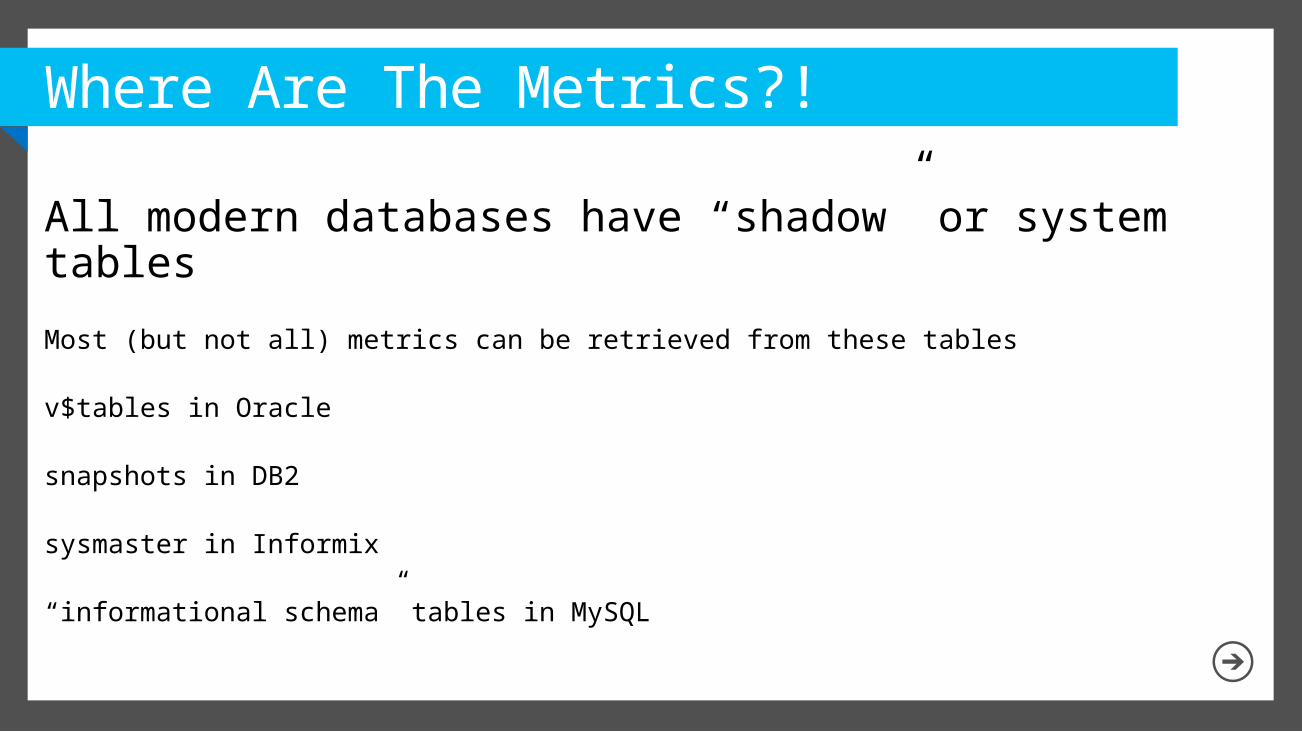
Where Are The Metrics?!
All modern databases have “shadow” or system tables
Most (but not all) metrics can be retrieved from these tables
v$tables in Oracle
snapshots in DB2
sysmaster in Informix
“informational schema” tables in MySQL
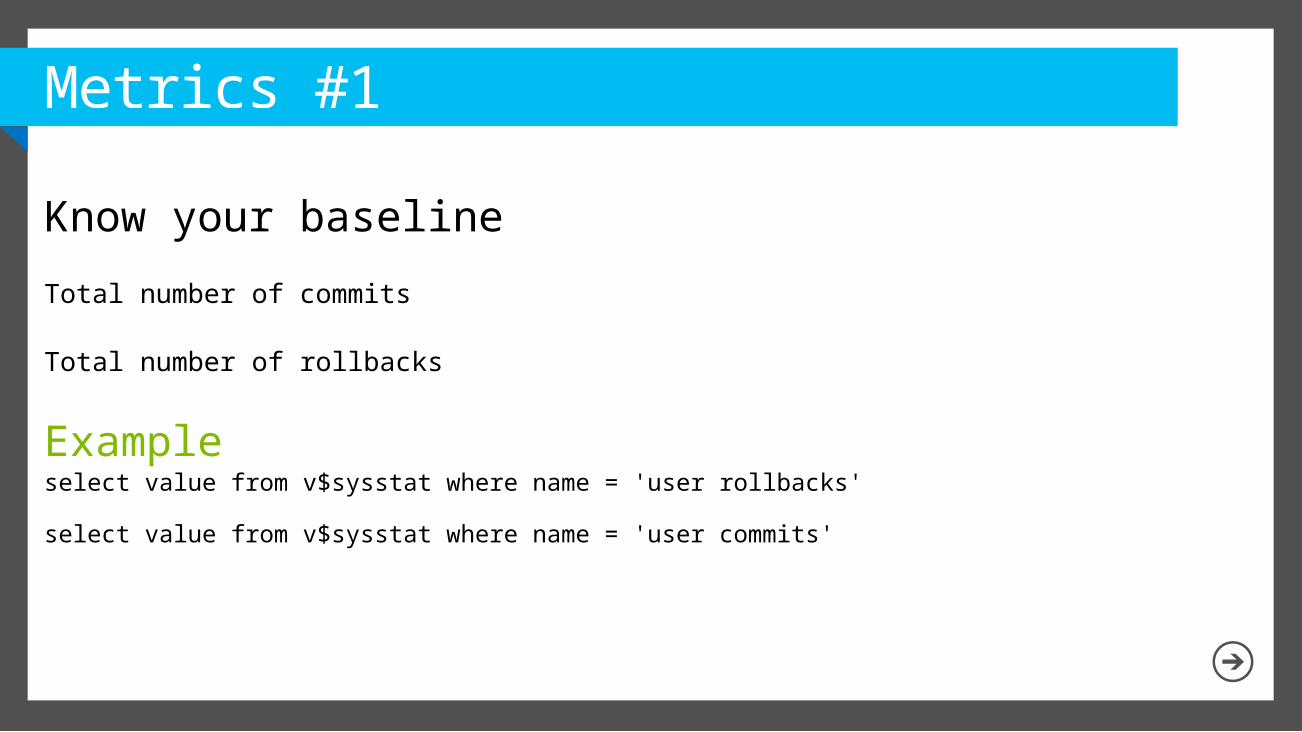
Metrics #1
Know your baseline
Total number of commits
Total number of rollbacks
Exampleselect value from v$sysstat where name = 'user rollbacks'
select value from v$sysstat where name = 'user commits'
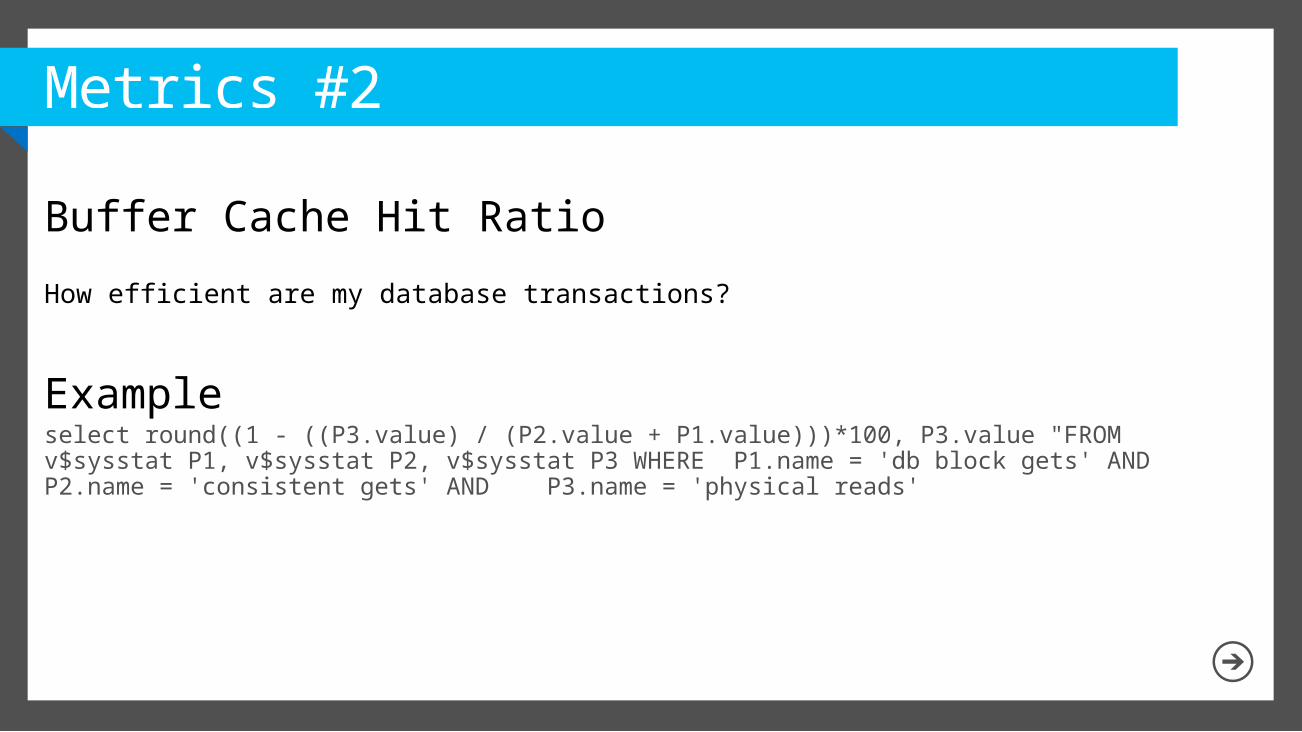
Metrics #2
Buffer Cache Hit Ratio
How efficient are my database transactions?
Exampleselect round((1 - ((P3.value) / (P2.value + P1.value)))*100, P3.value "FROM v$sysstat P1, v$sysstat P2, v$sysstat P3 WHERE P1.name = 'db block gets' AND P2.name = 'consistent gets' AND P3.name = 'physical reads'
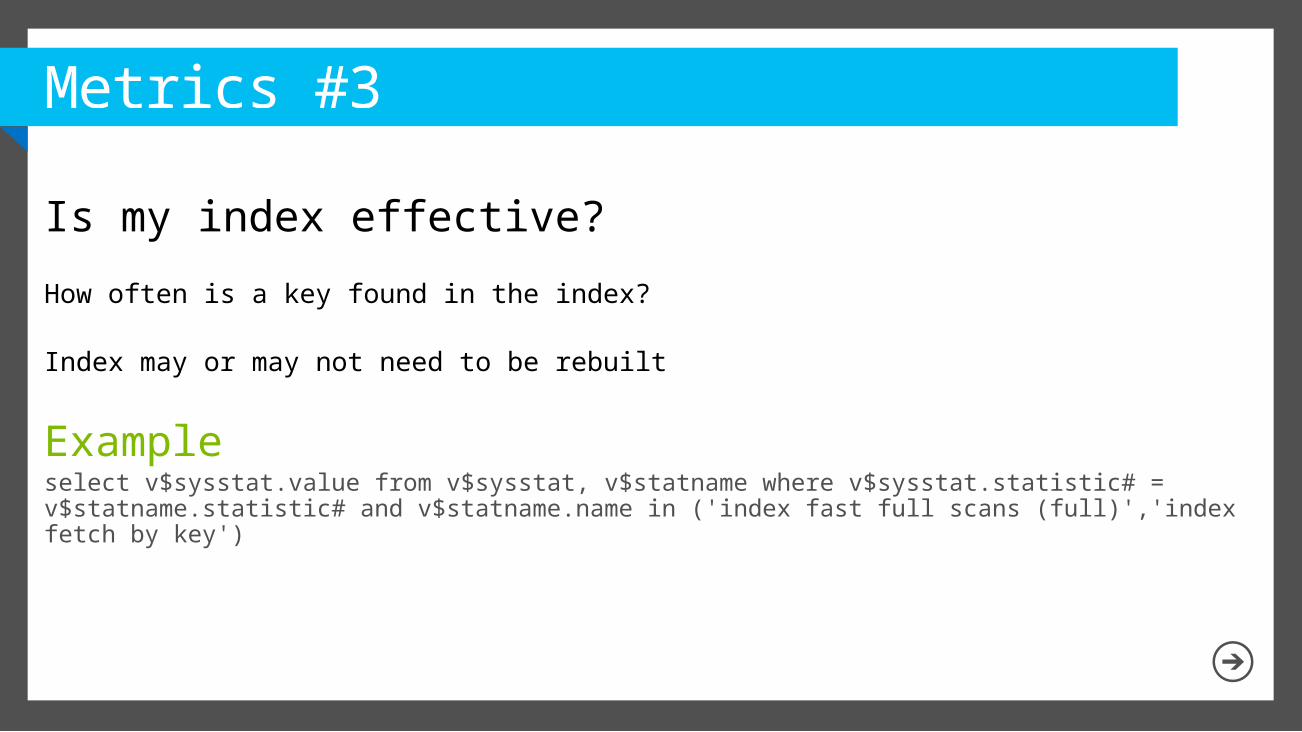
Metrics #3
Is my index effective?
How often is a key found in the index?
Index may or may not need to be rebuilt
Exampleselect v$sysstat.value from v$sysstat, v$statname where v$sysstat.statistic# = v$statname.statistic# and v$statname.name in ('index fast full scans (full)','index fetch by key')
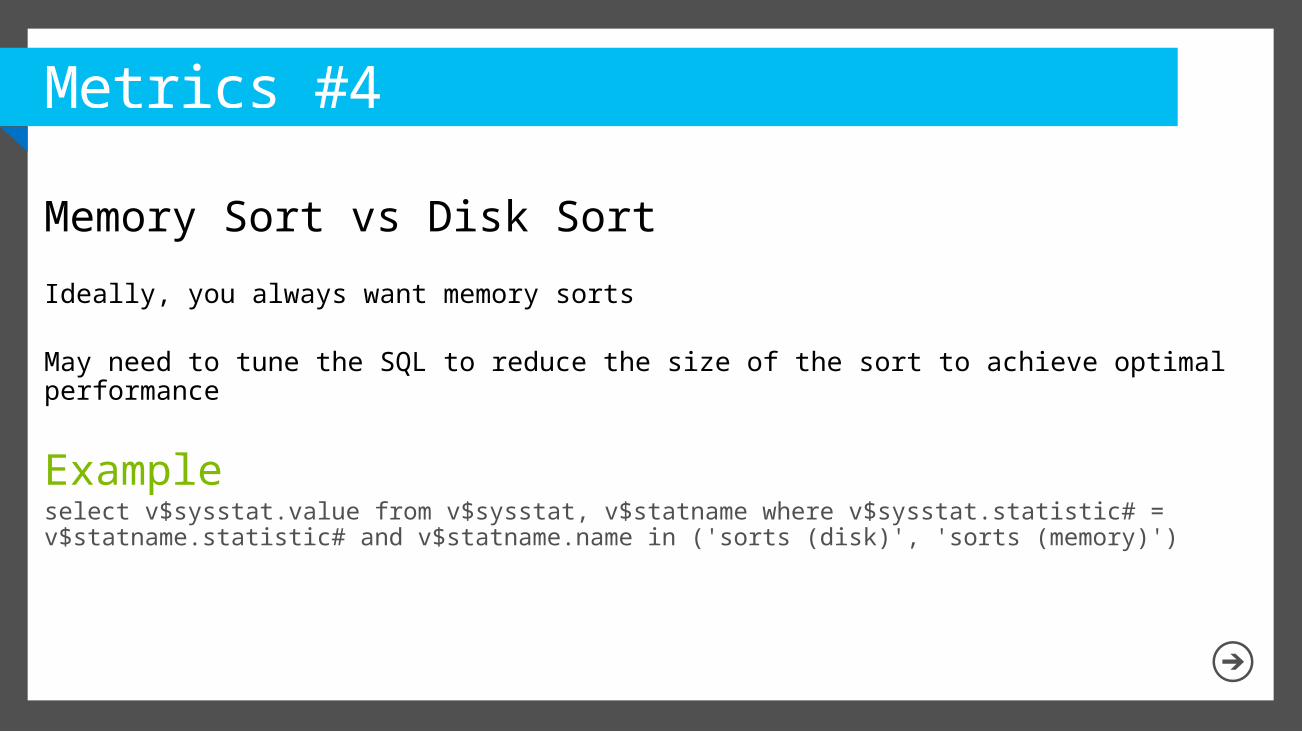
Metrics #4
Memory Sort vs Disk Sort
Ideally, you always want memory sorts
May need to tune the SQL to reduce the size of the sort to achieve optimal performance
Exampleselect v$sysstat.value from v$sysstat, v$statname where v$sysstat.statistic# = v$statname.statistic# and v$statname.name in ('sorts (disk)', 'sorts (memory)')
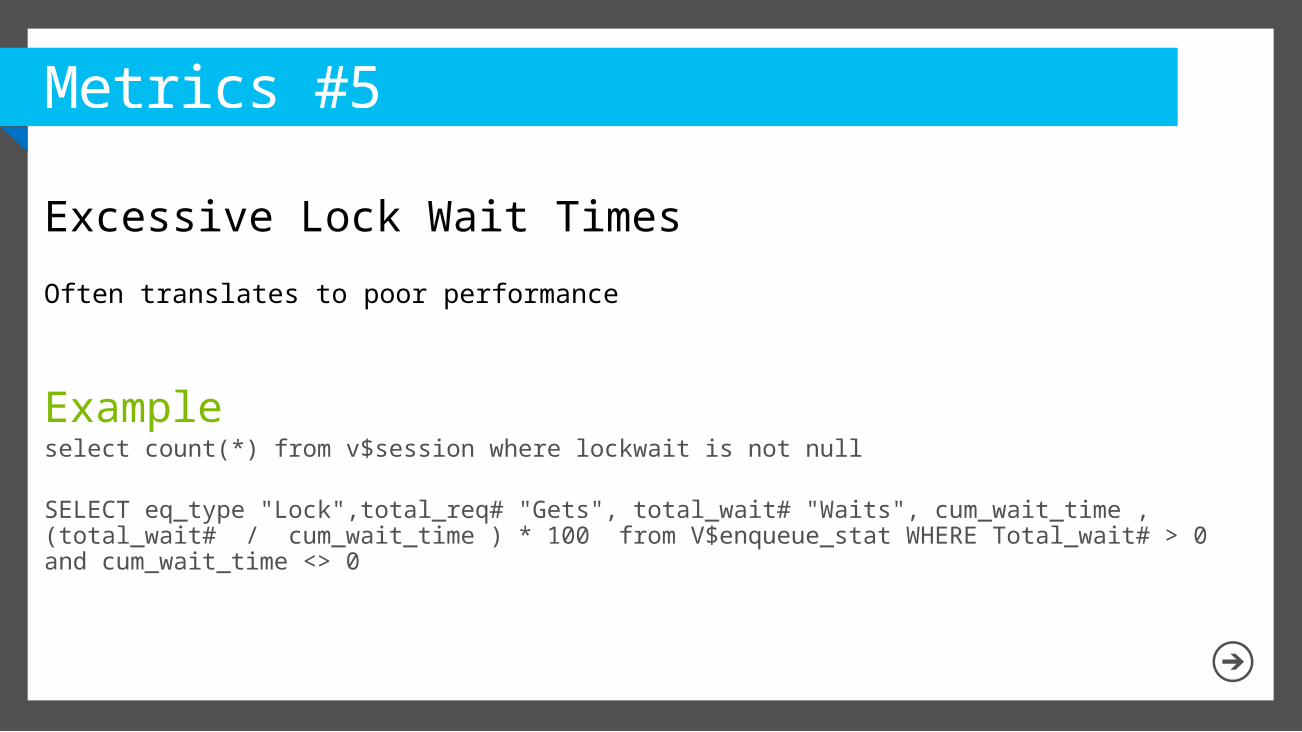
Metrics #5
Excessive Lock Wait Times
Often translates to poor performance
Exampleselect count(*) from v$session where lockwait is not null
SELECT eq_type "Lock",total_req# "Gets", total_wait# "Waits", cum_wait_time , (total_wait# / cum_wait_time ) * 100 from V$enqueue_stat WHERE Total_wait# > 0 and cum_wait_time <> 0

Metrics #6
Deadlocks
Relatively rare in production but still needs to be monitored.
Exampleselect name, value from v$sysstat where name = 'enqueue deadlocks'

Metrics #7
Large Table Scans
Tuning opportunity – may need an index
Exampleselect * from v$sql_plan p,v$sqlstat s,v$snapshot ss, DBA_SEGMENTS sg where p.object_owner <> 'SYS' and p.object_owner = sg.owner and p.object_name = sg.segment_name and sg.blocks > 1000 and p.operation like '%TABLE ACCESS%' and p.options like '%FULL%' and p.sql_id = s.sql_id and s.snap_id = ss.snap_id)
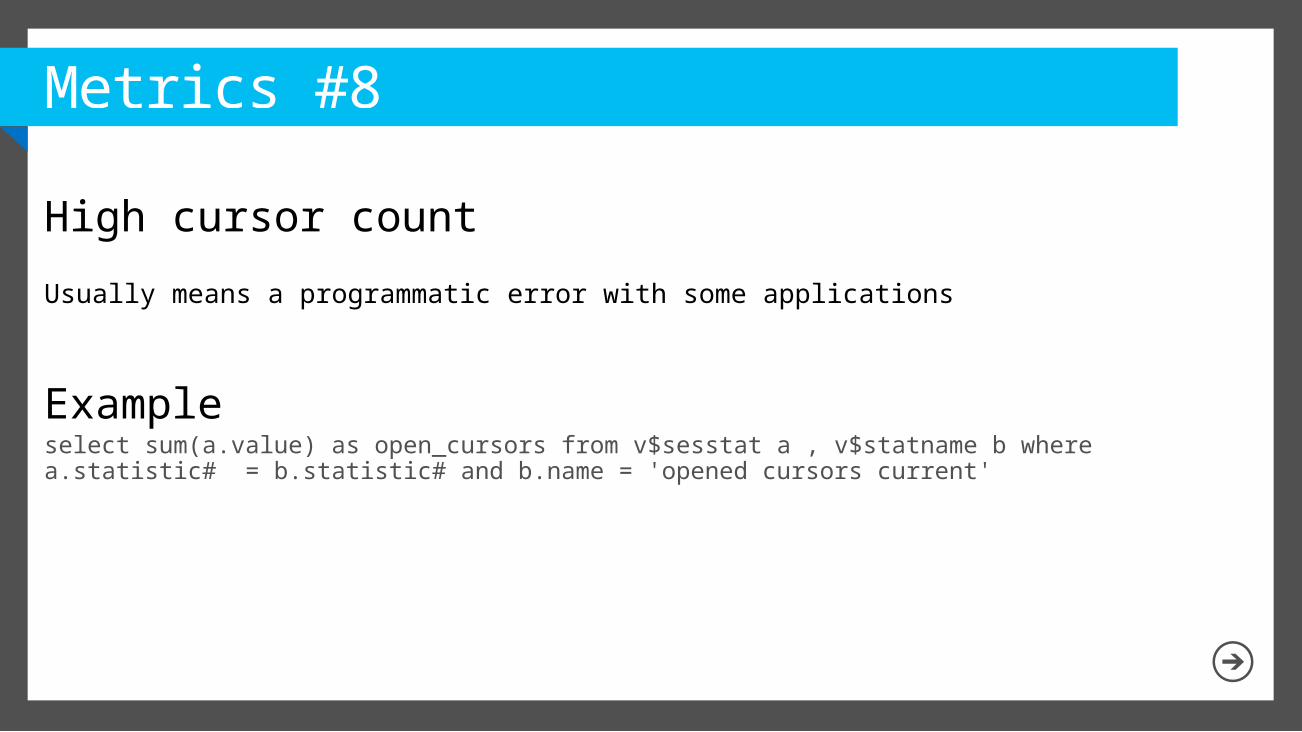
Metrics #8
High cursor count
Usually means a programmatic error with some applications
Exampleselect sum(a.value) as open_cursors from v$sesstat a , v$statname b where a.statistic# = b.statistic# and b.name = 'opened cursors current'
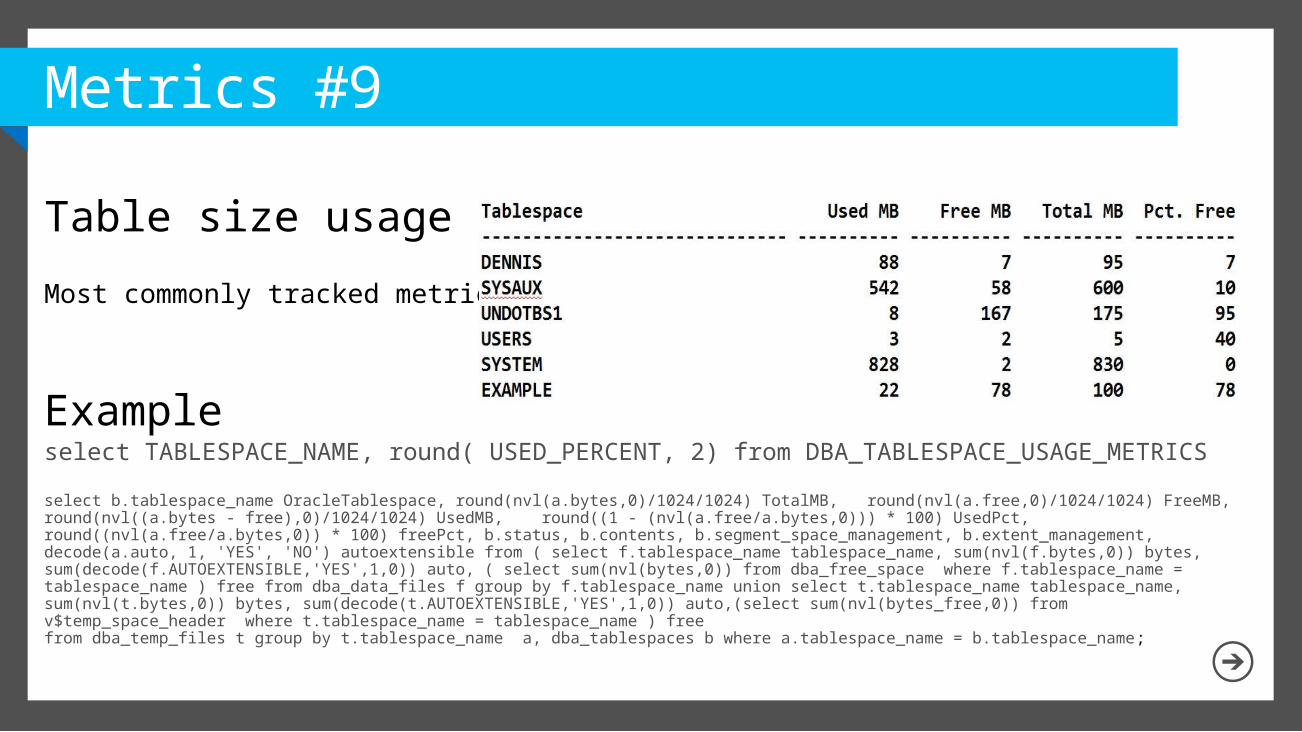
Metrics #9
Table size usage
Most commonly tracked metrics
Exampleselect TABLESPACE_NAME, round( USED_PERCENT, 2) from DBA_TABLESPACE_USAGE_METRICS
select b.tablespace_name OracleTablespace, round(nvl(a.bytes,0)/1024/1024) TotalMB, round(nvl(a.free,0)/1024/1024) FreeMB, round(nvl((a.bytes - free),0)/1024/1024) UsedMB, round((1 - (nvl(a.free/a.bytes,0))) * 100) UsedPct, round((nvl(a.free/a.bytes,0)) * 100) freePct, b.status, b.contents, b.segment_space_management, b.extent_management, decode(a.auto, 1, 'YES', 'NO') autoextensible from ( select f.tablespace_name tablespace_name, sum(nvl(f.bytes,0)) bytes, sum(decode(f.AUTOEXTENSIBLE,'YES',1,0)) auto, ( select sum(nvl(bytes,0)) from dba_free_space where f.tablespace_name = tablespace_name ) free from dba_data_files f group by f.tablespace_name union select t.tablespace_name tablespace_name, sum(nvl(t.bytes,0)) bytes, sum(decode(t.AUTOEXTENSIBLE,'YES',1,0)) auto,(select sum(nvl(bytes_free,0)) from v$temp_space_header where t.tablespace_name = tablespace_name ) freefrom dba_temp_files t group by t.tablespace_name a, dba_tablespaces b where a.tablespace_name = b.tablespace_name;
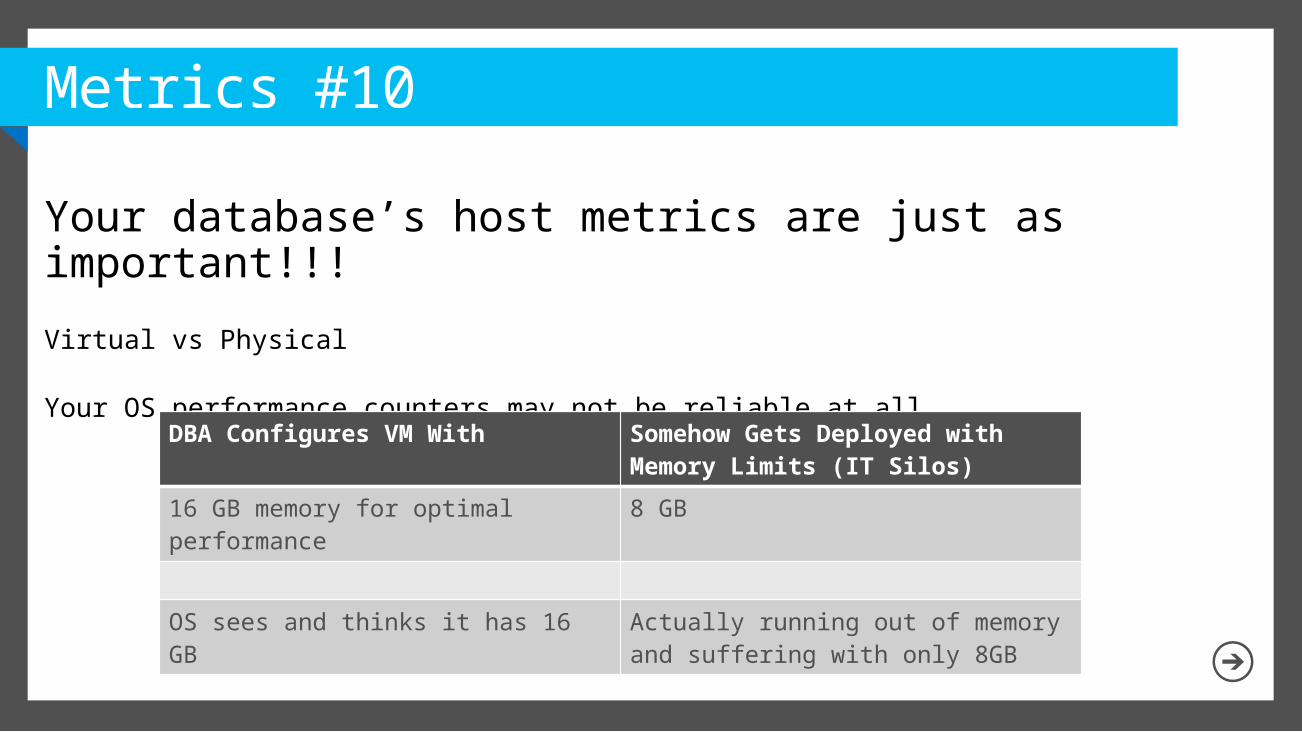
Metrics #10
Your database’s host metrics are just as important!!!
Virtual vs Physical
Your OS performance counters may not be reliable at all
DBA Configures VM With Somehow Gets Deployed with Memory Limits (IT Silos)
16 GB memory for optimal performance
8 GB
OS sees and thinks it has 16 GB Actually running out of memory and suffering with only 8GB
Demo - Examining Oracle, DB2, Informix, MySQL MetricsOleg Noskov

Oracle RAC
What is Oracle RAC?
An active active cluster
Database on shared storage
Cache Fusion
. . . . .
.
Node 1 Node n
High Speed Interconnect
SAN SAN
Oracle Instance
Oracle Instance
Client connecting in via virtual IP address
Local Cache
Local Cache
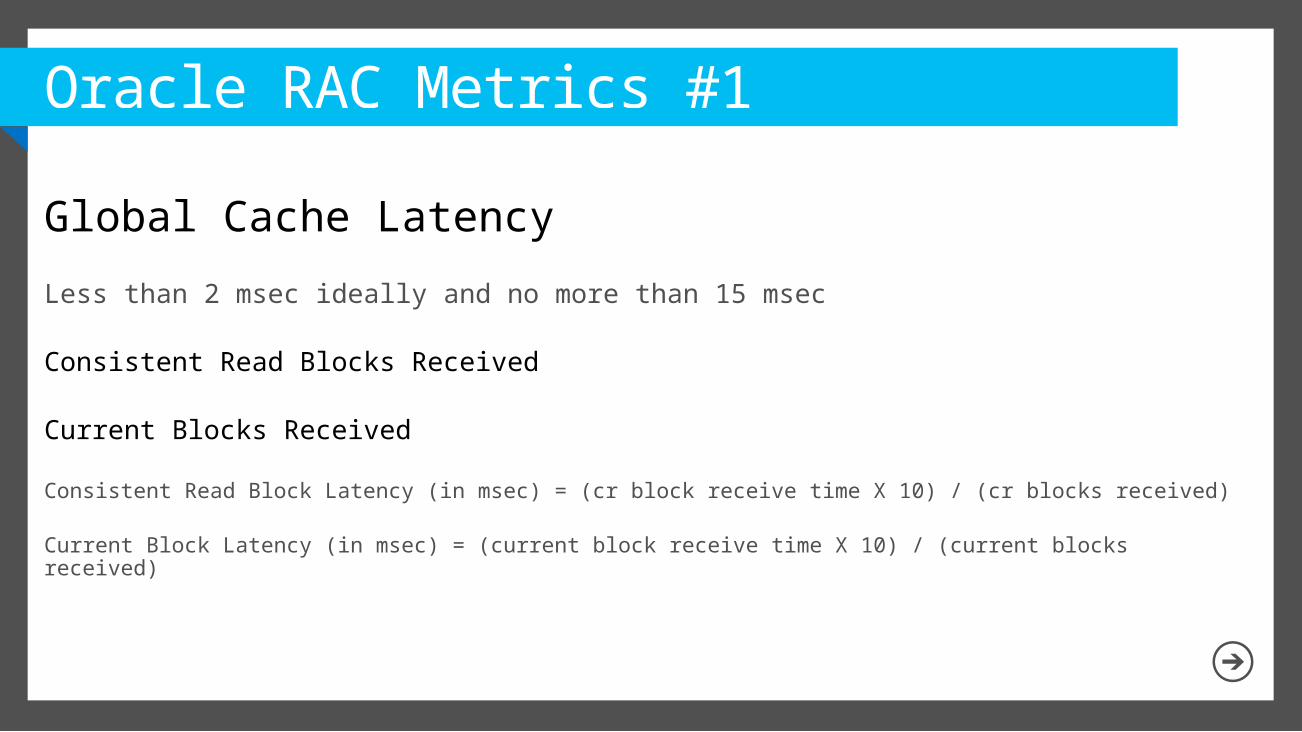
Oracle RAC Metrics #1
Global Cache Latency
Less than 2 msec ideally and no more than 15 msec
Consistent Read Blocks Received
Current Blocks Received
Consistent Read Block Latency (in msec) = (cr block receive time X 10) / (cr blocks received)
Current Block Latency (in msec) = (current block receive time X 10) / (current blocks received)
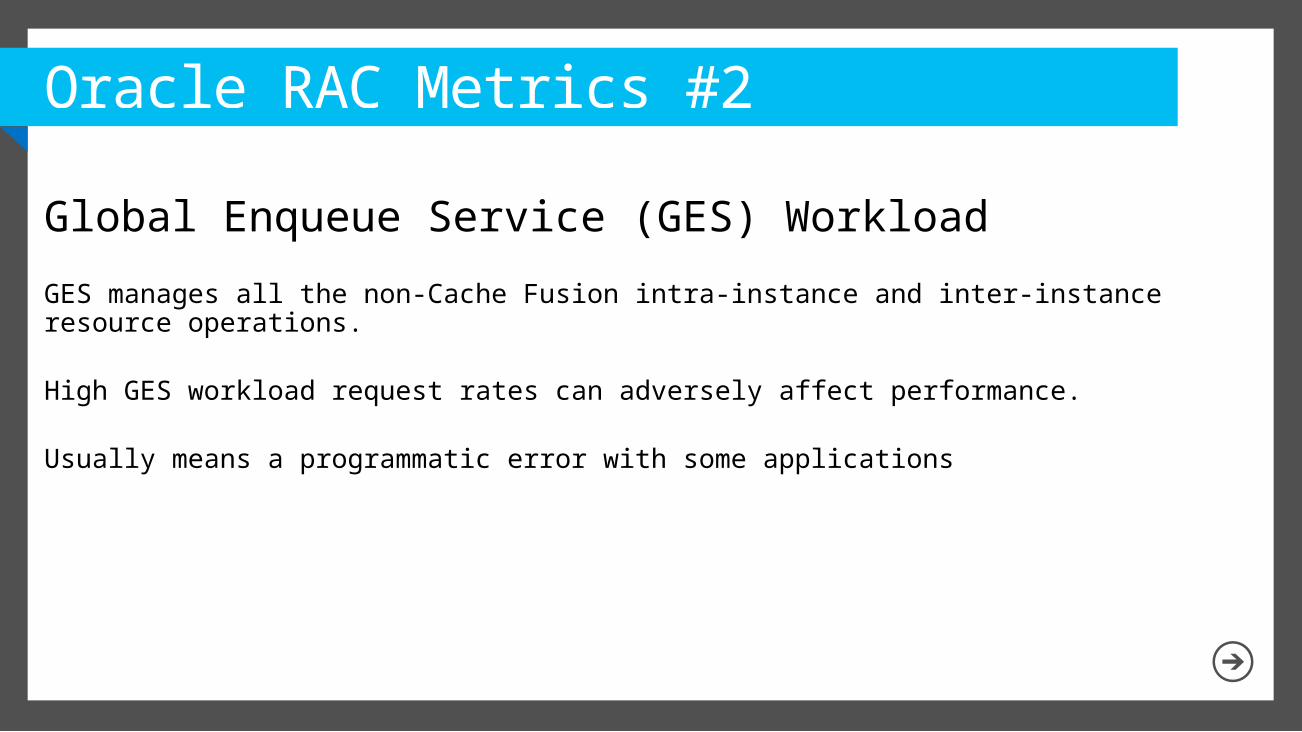
Oracle RAC Metrics #2
Global Enqueue Service (GES) Workload
GES manages all the non-Cache Fusion intra-instance and inter-instance resource operations.
High GES workload request rates can adversely affect performance.
Usually means a programmatic error with some applications
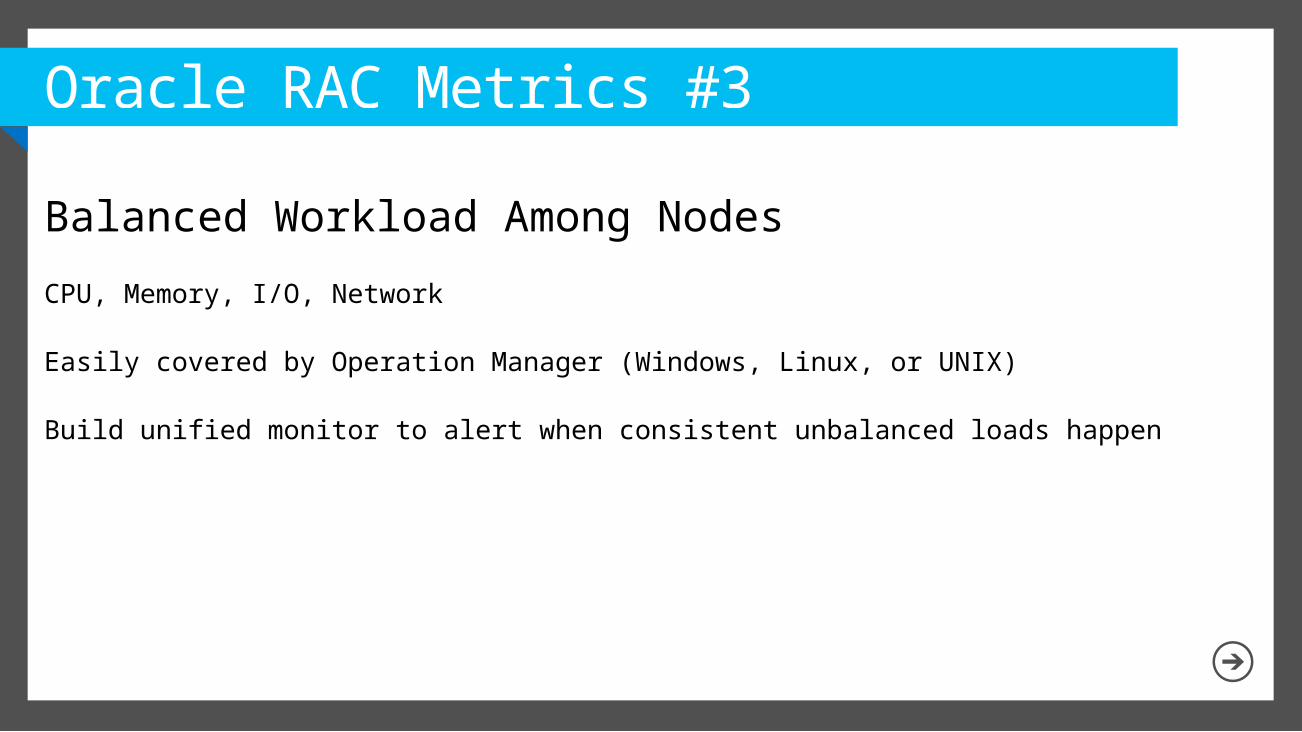
Oracle RAC Metrics #3
Balanced Workload Among Nodes
CPU, Memory, I/O, Network
Easily covered by Operation Manager (Windows, Linux, or UNIX)
Build unified monitor to alert when consistent unbalanced loads happen
Demo – Examining Oracle RAC Metrics
Oleg Noskov
More Best Practices on Management Packs
Management Pack Lifecycle Management

Demo – Management Pack Lifecycle
Randy Roffey

System Center Databases
What to look for?
Demo – System Center Databases
Randy Roffey
Evaluation
Complete your session evaluations today and enter to win prizes daily. Provide your feedback at a CommNet kiosk or log on at www.2013mms.com.Upon submission you will receive instant notification if you have won a prize. Prize pickup is at the Information Desk located in Attendee Services in the Mandalay Bay Foyer. Entry details can be found on the MMS website.
We want to hear from you!
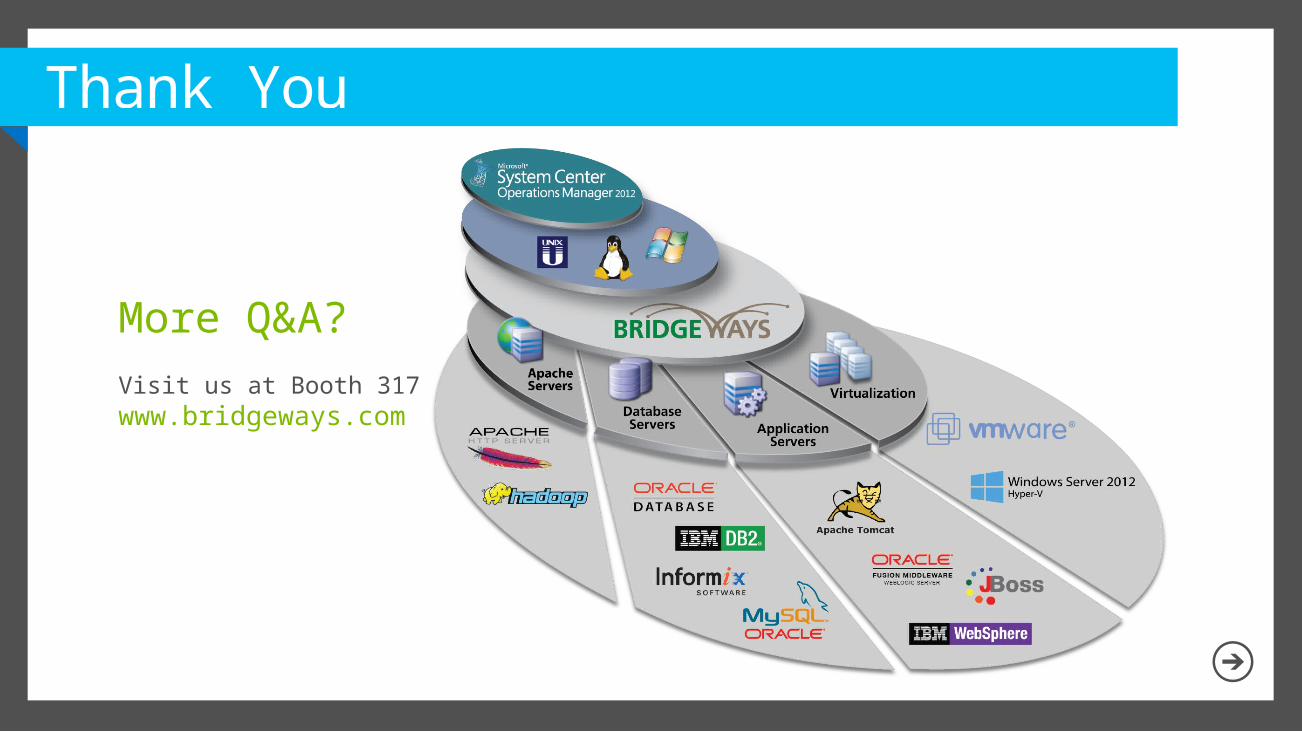
Thank You
More Q&A?Visit us at Booth 317www.bridgeways.com

Evaluation
Complete your session evaluations today and enter to win prizes daily. Provide your feedback at a CommNet kiosk or log on at www.2013mms.com.Upon submission you will receive instant notification if you have won a prize. Prize pickup is at the Information Desk located in Attendee Services in the Mandalay Bay Foyer. Entry details can be found on the MMS website.
We want to hear from you!
Resources
http://channel9.msdn.com/Events
Access MMS Online to view session recordings after the event.
© 2013 Microsoft Corporation. All rights reserved. Microsoft, Windows and other product names are or may be registered trademarks and/or trademarks in the U.S. and/or other countries.The information herein is for informational purposes only and represents the current view of Microsoft Corporation as of the date of this presentation. Because Microsoft must respond to changing market conditions, it should not be interpreted to be a commitment on the part of Microsoft, and Microsoft cannot guarantee the accuracy of any information provided after the date of this presentation. MICROSOFT MAKES NO WARRANTIES, EXPRESS, IMPLIED OR STATUTORY, AS TO THE INFORMATION IN THIS PRESENTATION.