Embed Size (px)
Citation preview

ILO/TF/Rwanda/R.9
Rwanda
Report to the Government
Feasibility study of the introduction of a new maternity cash benefits scheme in Rwanda
Public Finance, Actuarial and Statistics Services Branch (SOC/PFACTS)
Social Protection Department International Labour Office

Copyright © International Labour Organization 2015
First published 2015
Publications of the International Labour Office enjoy copyright under Protocol 2 of the Universal Copyright
Convention. Nevertheless, short excerpts from them may be reproduced without authorization, on condition that
the source is indicated. For rights of reproduction or translation, application should be made to ILO Publications
(Rights and Permissions), International Labour Office, CH-1211 Geneva 22, Switzerland, or by email:
[email protected]. The International Labour Office welcomes such applications.
Libraries, institutions and other users registered with reproduction rights organizations may make copies in
accordance with the licences issued to them for this purpose. Visit www.ifrro.org to find the reproduction rights
organization in your country.
ILO Cataloguing in Publication Data
Feasibility study of the introduction of a new maternity cash benefits scheme in Rwanda / International Labour
Office. - Geneva: ILO, 2015
ISBN: 9789221296249; 9789221296256 (web pdf)
International Labour Office Social Protection Dept.
maternity benefit / cash benefit / payment of benefits / international labour standards / role of ILO / Rwanda
02.08
The designations employed in ILO publications, which are in conformity with United Nations practice, and the
presentation of material therein do not imply the expression of any opinion whatsoever on the part of the
International Labour Office concerning the legal status of any country, area or territory or of its authorities, or
concerning the delimitation of its frontiers.
The responsibility for opinions expressed in signed articles, studies and other contributions rests solely with their
authors, and publication does not constitute an endorsement by the International Labour Office of the opinions
expressed in them.
Reference to names of firms and commercial products and processes does not imply their endorsement by the
International Labour Office, and any failure to mention a particular firm, commercial product or process is not a
sign of disapproval.
ILO publications and electronic products can be obtained through major booksellers or ILO local offices in many
countries, or direct from ILO Publications, International Labour Office, CH-1211 Geneva 22, Switzerland.
Catalogues or lists of new publications are available free of charge from the above address, or by email:
Visit our web site: www.ilo.org/publns
Printed in Switzerland

Feasibility study of the introduction of a new maternity cash benefits scheme in Rwanda iii
Contents
Page
Acknowledgements ........................................................................................................................... vii
Executive summary ........................................................................................................................... ix
Abbreviations and acronyms ............................................................................................................. xi
Introduction ....................................................................................................................................... 1
1. Overview of demographic, economic, social, and social security contexts ............................ 3
1.1. Demography ................................................................................................................. 3
1.1.1. Demographic structure ..................................................................................... 3
1.1.2. Fertility ............................................................................................................. 4
1.1.3. Mortality .......................................................................................................... 4
1.1.4. Population growth ............................................................................................ 4
1.2. Labour .......................................................................................................................... 4
1.2.1 Labour force ..................................................................................................... 4
1.2.2. Employment ..................................................................................................... 4
1.3. Macroeconomy ............................................................................................................. 4
1.3.1. Gross Domestic Product (GDP) ....................................................................... 4
1.3.2. Inflation ............................................................................................................ 5
1.4. Poverty and health ....................................................................................................... 5
1.5. Social security benefits of the Rwanda Social Security Board (RSSB)........................ 5
1.5.1. Pension scheme ................................................................................................ 5
1.5.2. Occupational hazard scheme ............................................................................ 7
1.5.3. Medical scheme ............................................................................................... 7
2. International labour standards on maternity protection and international practices................ 9
2.1. International labour standards on maternity protection ................................................ 9
2.2. ILO maternity protection standards .............................................................................. 9
2.3. Financing maternity protection schemes: Social insurance versus employer liability .... 11
3. Maternity cash benefits in Rwanda ......................................................................................... 13
3.1. Existing national legislation on maternity protection ................................................... 13
Law Regulating Labour in Rwanda No. 13/2009 of 27 May 2009 ............................... 13
Law Establishing the General Statutes for Public Service No. 86/2013
of 11 September 2013 .................................................................................................. 14
3.2. Gaps between the duration and levels of cash benefits established
by national legislation and international standards ....................................................... 15
3.3. Maternity protection around the world ......................................................................... 15

iv Feasibility study of the introduction of a new maternity cash benefits scheme in Rwanda
3.4. Insurance options for maternity schemes ...................................................................... 17
3.4.1. Qualifying conditions ....................................................................................... 19
3.4.2. Pay-As-You-Go (PAYG) financing method .................................................... 19
4. Demographic and financing projections ................................................................................. 20
4.1. Assumptions .................................................................................................................. 20
4.2. Estimation of the population covered by the maternity scheme ................................... 20
4.3. Estimation of salaries and salary mass .......................................................................... 23
4.4. Estimation of annual births ........................................................................................... 24
4.5. Estimation of costs and PAYG rate .............................................................................. 25
4.6. Simulation of the reserves ............................................................................................. 27
5. Conclusions and recommendations ......................................................................................... 30
Annex ................................................................................................................................................ 31
Tables
1. Options recommended by the ILO .......................................................................................... ix
2. Options proposed by the Government ..................................................................................... x
4.1. Main assumptions used for the projections ............................................................................. 20
4.2. Distribution of insured active members from private and public sectors, 2013 ...................... 21
4.3. Population, labour force (ages 15-64), and covered population (in thousands),
and coverage rates for the projection period, 2014-25 ............................................................ 22
4.4. Density of contributions by sector, gender, and age, 2013 ..................................................... 23
4.5. Annual inflation, nominal salary increase, and nominal interest rate (in %) .......................... 24
4.6. Assumed fertility ratios by age groups of females and total fertility rate ............................... 24
4.7. Projected expenditures for maternity benefits, administration costs, and the PAYG
cost rate for the three options recommended by the ILO, 2014-25
(in billions Rwandan francs) ................................................................................................... 26
4.8. Projected expenditure of maternity benefits, administration costs and the PAYG
cost rate of the options proposed by the Government, 2014-25
(in billions Rwandan francs) ................................................................................................... 26
4.9. Simulation of cash flow (in millions) for Option 1, 2014-25, assuming
1% contribution rate ................................................................................................................ 28
4.10. Simulation of cash flow (in millions Rwandan francs) for Option 9, 2014-25,
assuming 0.6% contribution rate ............................................................................................. 28
A1. Population distribution projections per age groups and gender, 2014-25 (thousands) ........... 31
A2. Labour force distribution projections per age groups and gender, 2014-25 (thousands) ........ 33

Feasibility study of the introduction of a new maternity cash benefits scheme in Rwanda v
A3. Labour force participation rate distribution projections per age groups
and gender, 2014-25 ................................................................................................................ 35
A4. Projections of the population actively contributing to the maternity scheme
in the private sector per age groups and gender, 2014-25 ....................................................... 37
A5. Projection of the population actively contributing to the maternity scheme
in the public sector per age groups and gender, 2014-25 ........................................................ 39
A6. Projections of salaries per age and sex and salary mass ......................................................... 41
A7. Economic variables and salary growth ................................................................................... 43
A8. Projected number of new births from population covered by the maternity
scheme, 2014-25 ..................................................................................................................... 43
Figures
1.1. Rwandan population pyramid in 2012, 5-year age-groups ..................................................... 3
2.1. Brief overview of the main requirements: ILO social security standards on maternity .......... 12
3.1. Paid maternity leave: A world map ......................................................................................... 16
3.2. Level of benefits around the world ......................................................................................... 17


Feasibility study of the introduction of a new maternity cash benefits scheme in Rwanda vii
Acknowledgements
The Government of Rwanda requested the ILO to carry out a feasibility study on the
introduction of a new maternity benefit scheme in Rwanda. The Director General of the
ILO designated the ILO Public Finance, Actuarial and Statistics Branch (ILO
SOC/PFACTS) of the Social Protection Department (SOCPRO), to carry out the feasibility
study in collaboration with the ILO Decent Work Team for Central Africa, the ILO
Country Office for Cameroon, Angola, and Sao Tome and Principe (DWT/CO - Yaoundé),
and the Rwanda Social Security Board (RSSB).
The ILO team at the headquarters, namely, Mr Hiroshi Yamabana, Mr Kroum
Markov, Ms Cristina Lloret, and Ms Victoire Umuhire, undertook this assignment in
collaboration with Mr Theopiste Butare of ILO DWT/CO Yaoundé and Ms Laura
Llewellyn Jones, RSSB’s consultant. The ILO has worked in collaboration with the staff of
the RSSB and Ms Laura Llewellyn Jones for data collection and exploring options of the
study through distant communications. The ILO team drafted the report in consultation
with the RSSB.
The Director General of the ILO extends his sincere gratitude to Mr Joseph Mudenge,
Director of Planning Research and Statistics Division of the RSSB, and Ms Yvonne
Mujawabega, Director of Maternity Leave Benefits Division of the RSSB, for their
collaboration and assistance rendered throughout this feasibility study.

Feasibility study of the introduction of a new maternity cash benefits scheme in Rwanda ix
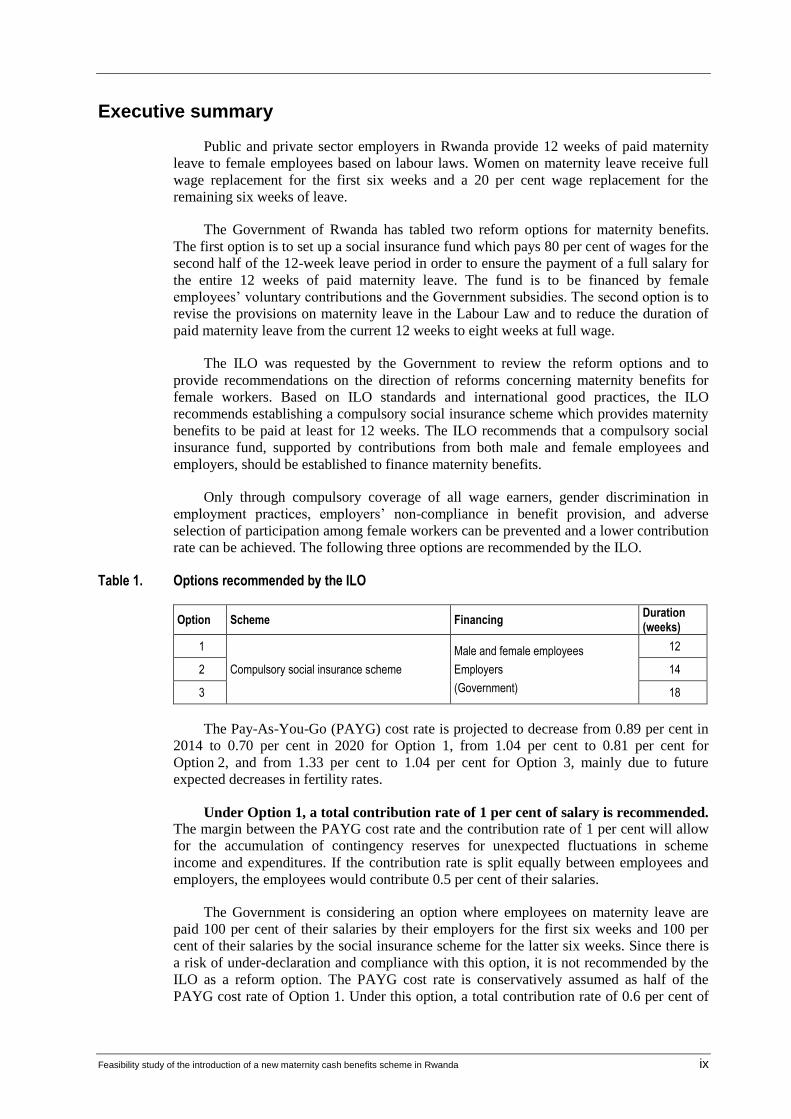
Executive summary
Public and private sector employers in Rwanda provide 12 weeks of paid maternity
leave to female employees based on labour laws. Women on maternity leave receive full
wage replacement for the first six weeks and a 20 per cent wage replacement for the
remaining six weeks of leave.
The Government of Rwanda has tabled two reform options for maternity benefits.
The first option is to set up a social insurance fund which pays 80 per cent of wages for the
second half of the 12-week leave period in order to ensure the payment of a full salary for
the entire 12 weeks of paid maternity leave. The fund is to be financed by female
employees’ voluntary contributions and the Government subsidies. The second option is to
revise the provisions on maternity leave in the Labour Law and to reduce the duration of
paid maternity leave from the current 12 weeks to eight weeks at full wage.
The ILO was requested by the Government to review the reform options and to
provide recommendations on the direction of reforms concerning maternity benefits for
female workers. Based on ILO standards and international good practices, the ILO
recommends establishing a compulsory social insurance scheme which provides maternity
benefits to be paid at least for 12 weeks. The ILO recommends that a compulsory social
insurance fund, supported by contributions from both male and female employees and
employers, should be established to finance maternity benefits.
Only through compulsory coverage of all wage earners, gender discrimination in
employment practices, employers’ non-compliance in benefit provision, and adverse
selection of participation among female workers can be prevented and a lower contribution
rate can be achieved. The following three options are recommended by the ILO.
Table 1. Options recommended by the ILO
Option Scheme Financing Duration (weeks)
1
Compulsory social insurance scheme
Male and female employees
Employers
(Government)
12
2 14
3 18
The Pay-As-You-Go (PAYG) cost rate is projected to decrease from 0.89 per cent in
2014 to 0.70 per cent in 2020 for Option 1, from 1.04 per cent to 0.81 per cent for
Option 2, and from 1.33 per cent to 1.04 per cent for Option 3, mainly due to future
expected decreases in fertility rates.
Under Option 1, a total contribution rate of 1 per cent of salary is recommended. The margin between the PAYG cost rate and the contribution rate of 1 per cent will allow
for the accumulation of contingency reserves for unexpected fluctuations in scheme
income and expenditures. If the contribution rate is split equally between employees and
employers, the employees would contribute 0.5 per cent of their salaries.
The Government is considering an option where employees on maternity leave are
paid 100 per cent of their salaries by their employers for the first six weeks and 100 per
cent of their salaries by the social insurance scheme for the latter six weeks. Since there is
a risk of under-declaration and compliance with this option, it is not recommended by the
ILO as a reform option. The PAYG cost rate is conservatively assumed as half of the
PAYG cost rate of Option 1. Under this option, a total contribution rate of 0.6 per cent of

x Feasibility study of the introduction of a new maternity cash benefits scheme in Rwanda
wages would cover benefits and administrative costs for the latter six weeks and would
allow for the accumulation of a contingency reserve.
As the current actuarial assessment relies on limited data, it is recommended that
scheme-specific data be collected once the scheme is implemented. Data collection and
analysis should be used for monitoring the implementation of the scheme and for
improving accuracy of future assessments of the contribution rate.
The ILO does not recommend the following options proposed by the Government, but
the PAYG cost rate for each case is estimated for illustrative purposes.
Table 2. Options proposed by the Government
Option Scheme Financing Duration (weeks)
4 Supplementary social insurance scheme to provide 80% of wages for the latter 6 weeks
Male and female employees
Employers
(Government)
12
5
Compulsory social insurance scheme Female employees
Employers
(Government)
12
6 14
7 18
8 Supplementary social insurance scheme to provide 80% of wages for the latter 6 weeks
12
9 100% salary to be paid by employers for the first 6 weeks and 100% salary to be paid by the social insurance scheme for the latter 6 weeks.
First 6 weeks: directly by employer
Latter 6 weeks: male and female employees, employers (Government)
12
(6 + 6)
The PAYG cost rate is estimated to decrease from 0.36 per cent in 2014 to 0.27 per
cent in 2021 for Option 4, from 2.98 per cent to 2.32 per cent for Option 5, from 3.48 per
cent to 2.71 per cent for Option 6, from 4.48 per cent to 3.48 per cent for Option 7, from
1.19 per cent to 0.93 per cent for Option 8, and from 0.44 per cent to 0.34 per cent for
Option 9.
An option in which 100 per cent of wages are provided for eight weeks through both
female and male contributions is also assessed since this option is currently being
considered by the Government. The PAYG cost rate is expected to decrease from 0.59 per
cent in 2014 to 0.45 per cent in 2025. Nevertheless, the ILO does not recommend this
Option as the Social Security (Minimum Standards) Convention, 1952 (No. 102),
stipulates a minimum benefit duration of 12 weeks.

Feasibility study of the introduction of a new maternity cash benefits scheme in Rwanda xi
Abbreviations and acronyms
DHS Demographic and Health Survey
DWT/CO – Yaoundé ILO Decent Work Team for Central Africa and ILO Country
Office for Cameroon, Angola and Sao Tome and Principe
EAC East African Countries
EICV Enquête Intégrale sur les Conditions de Vie des ménages (i.e.
Household Living Conditions Survey)
GAD Government Actuary’s Department (of the United Kingdom)
GDP gross domestic product
ILC International Labour Conference
ILO International Labour Organization / Office
IPAR Institute of Policy Analysis and Research (in Rwanda)
MMR maternal mortality ratio
PAYG pay-as-you-go
Reserve ratio ratio of the end-of-year reserve to total annual expenditure of the
scheme
RDHS Rwanda Demographic and Housing Survey
RSSB Rwanda Social Security Board
SOC/PFACTS Public Finance, Actuarial and Statistics Services Branch (of the
ILO)
SOCPRO Social Protection Department (ILO)
TFR total fertility rate
UN WPP United Nations World Population Prospects
WSPR World Social Protection Report (ILO)


Feasibility study of the introduction of a new maternity cash benefits scheme in Rwanda 1
Introduction
Employers pay maternity benefits directly to female employees in Rwanda. Two laws
are in place for private and public sector employees. The Labour Law of Rwanda of
27 May 2009, which governs private sector employees, stipulates that employees are
entitled to maternity leave of 12 weeks duration with full salary paid for the first six weeks
and 20 per cent of salary paid for the remaining six weeks. This law is currently under
review. The law that governs public servants was modified on 21 October 2013. Maternity
leave, with the payment of full salary for 90 days, has been changed such that full salary is
paid for the initial six weeks and 20 per cent of salary is paid for the remaining six weeks.
The Government of Rwanda, represented by the Rwanda Social Security Board
(RSSB), requested the ILO to conduct a feasibility study on the introduction of a new
maternity benefits scheme and the agreement was concluded on 18 July 2014. The
Government is proposing a Maternity Insurance Fund to ensure the payment of full salary
to employees on maternity leave for 12 weeks. The Government has drafted a new law on
the maternity benefits scheme which is to be submitted to the Senate.
This report provides quantitative and qualitative assessments of maternity insurance
schemes based on the Government’s proposed options and ILO’s recommended options,
which take into account ILO social security standards as well as international good
practices.
This report consists of the following four sections:
Chapter 1 presents an overview of past and recent demographic, labour market,
macro-economic, poverty, health, and social security contexts in Rwanda.
Chapter 2 describes international standards on maternity protection and financing
maternity protection schemes.
Chapter 3 analyses the existing legislation on maternity protection, assesses gaps
between the existing legislation and international standards on maternity protection,
provides an overview of maternity protection all over the world, and lays down policy
options in Rwanda.
Chapter 4 is the main chapter of the report as it presents financial assessments of
policy options, including data, projection methodologies, assumptions, and results of the
projections.
Chapter 5 concludes and recommends policy options based on the analysis and
quantitative assessments.


Feasibility study of the introduction of a new maternity cash benefits scheme in Rwanda 3
1. Overview of demographic, economic, social, and social security contexts
1.1. Demography 1
The total population of Rwanda was 10,537,222 in 2012, an increase from 8,128,523
in 2002. The percentage increase over the past ten years was of 29.6 per cent and the
average annual increase rate was 2.6 per cent.
1.1.1. Demographic structure
The age structure in 2012 indicates that Rwanda has a relatively young population,
with 41.1 per cent under the age of 15. Furthermore, 48.4 per cent of the population is
between 15 and 49 years of age and 10.4 per cent is 50 years of age and above.
Figure 1.1. Rwandan population pyramid in 2012, 5-year age-groups
Source: 2012 Population and housing census.
1 Data are drawn from Population and Housing Censuses of Rwanda in the years 2002 and 2012,
Rwanda Demographic and Housing Survey 2010, and Rwanda Demographic and Housing Survey
(RDHS).

Feasibility study of the introduction of a new maternity cash benefits scheme in Rwanda 4
1.1.2. Fertility
The total fertility rate (TFR) substantially decreased from 6.1 in 2005 to 5.5 in 2007
and 4.6 in 2010. TFR in the urban area was 3.4 and TFR in the rural area was 4.8 in 2010.
The mean child-bearing age of females increased from 22.0 in 2005 to 22.4 in 2010. The
sex ratio at birth was 102 male new births per 100 female new births in 2010.
1.1.3. Mortality
Life expectancy at birth increased from 49 years for males and 51 years for females in
2000 to 61 and 65 years in 2010, respectively.
The maternal mortality ratio (MMR) remains as high as 487 deaths per 100,000 live
births in 2010, but has substantially decreased from 1,071 in 2000 and 750 in 2005.
1.1.4. Population growth
The total population has doubled over the last two decades. The annual population
growth rate was 1.2 per cent from the years 1991 to 2001 and 2.6 per cent from 2002 to 2012.
1.2. Labour 2
1.2.1 Labour force
The labour force participation rate was 88 per cent in 2000/01, 86 per cent in 2005/06
and 85 per cent in 2010/11. In 2012 there were 5,846,000 people in the working age
population and 5,563,300 participated in the labour force, of which 4,152,700 were
employed and 1,410,600 were unemployed.
1.2.2. Employment
The percentage of the employed population in the primary sector decreased from 87 per
cent in 2002 to 73 per cent in 2010/11. The percentage of the employed population in the
secondary sector grew from 3 per cent in 2002 to 6 per cent in 2010/11, while the percentage
in the tertiary sector increased from 10 per cent in 2002 to 20 per cent in 2010/11.
1.3. Macroeconomy
1.3.1. Gross Domestic Product (GDP)
Despite the socio-economic crisis at the time of the 1994 war, economic growth over
the last decade has been remarkable. The annual average real growth rate was 8.2 per cent
between 2000 and 2012 and the annual average real growth per capita was 4.3 per cent
between 2000 and 2012.
2 Data are obtained from Enquête Intégrale sur les Conditions de Vie des ménages 2000/01
(EICV1), 2005/06 (EICV2) and 2010/11 (EICV3).

Feasibility study of the introduction of a new maternity cash benefits scheme in Rwanda 5
1.3.2. Inflation
Rwanda has achieved rapid, sustained growth and macroeconomic stability over the
past decade. Inflation declined from 15.4 per cent to 4.2 per cent between 2008 and 2013.
However, the inflation rate in Rwanda was high among East African Countries (EAC) in
2011 due to elevated oil and food prices and a drought in the horn of Africa.
1.4. Poverty and health 3
Increases in non-farm wages explain much of the decrease in the poverty rate from
57 per cent in 2005/06 to 45 per cent in 2010/11. Extreme poverty was reduced from
40 per cent in 2000/01 to 36 per cent in 2005/06 and 24 per cent in 2010/11. The Gini
coefficient decreased from 0.52 in 2005 to 0.49 in 2011.
The health-care coverage rate stood at 91 per cent in 2010. Rwanda has improved the
quality of health services, which has contributed to a rapid decrease in maternal and child
mortality. Approximately 69 per cent of live births were attended by skilled health staff
in 2010.
1.5. Social security benefits of the Rwanda Social Security Board (RSSB) 4
This section provides an overview of the pension, occupational hazard, and medical
schemes of the Rwanda Social Security Board (RSSB).
1.5.1. Pension scheme
Coverage
All salaried workers are covered, including temporary and casual workers,
professional and in-service trainees, apprentices, civil servants, political appointees, and
government officials. The coverage is voluntary for self-employed persons and for persons
who were previously insured for at least six consecutive months and who had mandatory
coverage in the last 12 months. Voluntary members must be less than 45 years of age in
order to be accepted. If an individual has previously participated in mandatory insurance,
they are eligible to apply for voluntary insurance within the first 12 months of the date on
which their mandatory insurance ended.
Financing
The employee and employer both contribute 3 per cent of earnings. The salary
declared under voluntary insurance must be at least the minimum monthly salary, subject
to a ceiling of 104,000 Rwandan francs (RWF).
3 Data are drawn from the ECIVs, Institute of Policy Analysis and Research (IPAR), Rwanda, and
the ILO’s World Social Protection Report 2014-15.
4 Information is taken from Social Security Programs throughout the World, Africa 2013
(ISSA/SSA) and the web page of the RSSB http://www.csr.gov.rw/.

Feasibility study of the introduction of a new maternity cash benefits scheme in Rwanda 6
Benefits
Normal retirement pension
A pension is provided to those who reach the age of 55 after 15 or more years of
contributions. After 15 years of contributions, the benefit amount is 30 per cent of the
average monthly earnings during the last 3 or 5 years of employment, whichever is greater.
An additional 2 per cent of average monthly earnings is added for each additional year of
contribution beyond 15 years.
Early retirement pension
An early retirement pension is given in case the insured is physically or mentally
incapacitated. It is replaced by an old-age pension at the age of 55.
Retirement lump sum
A lump sum settlement is given to the insured older than 55 and having less than
15 years of contributions. In order to qualify, the member must have contributed for at
least 12 months. The amount is equal to the average monthly salary times the number of
contributing years.
Invalidity pension
To qualify for an invalidity pension, the member must have at least five years of
contributions and be insured for at least six months in the 12 months preceding the
invalidity.
The invalidity pension is replaced by an old-age pension at the age of 55.
Survivor pension
Survivor pensions are given to eligible survivors in the case of death of an insured
person who qualifies for an old-age or invalidity pension or who has contributed more than
180 months, or the death of an old-age or invalidity pensioner. Eligible survivors include
widows, children, or parents of the deceased. A widow must have been married for at least
six months before the death of the insured. Children must be legitimate, adopted, or
recognized by law, be single without obtaining wages, and younger than 18 years old
(younger than 25 years old if the child is engaged in full-time education) or disabled. A
parent can be legitimate or adopted and is eligible only if the deceased does not have a
wife, a husband, or children left.
The amount is a percentage of the deceased’s original pension, namely 50 per cent for
an eligible widow, 25 per cent for each child if they have a remaining parent, 40 per cent
for each child if both parents are dead, and 25 per cent for each parent if the deceased has
no remaining widow or children.
Funeral grant
A lump sum is granted to the survivor if the deceased did not fulfil the eligibility
criteria for an old-age pension. The amount is equal to the pension that the deceased would
have received if they had contributed for 15 years times the number of six-month periods
during which they contributed.

Feasibility study of the introduction of a new maternity cash benefits scheme in Rwanda 7
1.5.2. Occupational hazard scheme
Coverage
The scheme covers all employed persons, excluding the self-employed. Workers are
protected from accidents incurred while at work, on their way to work, or on work-related
journeys.
Financing
Employers contribute 2 per cent of employee wages. No contributions are collected
from the employees and no voluntary members are admitted.
Benefits
Temporary disability
The benefit amount is 75 per cent of the average earnings of the last three months
before the injury took place. The benefit lasts until the worker is fully recovered or until a
permanent disability certificate is issued, with a maximum duration of 180 days.
Total permanent disability
In the case of a permanent disability where the degree of disability is 100 per cent, the
benefit amount is 85 per cent of the average earnings of the last three months before the
injury takes place.
Partial permanent disability
When the insured is partially disabled, the beneficiary receives a percentage of the
total permanent disability benefit based on the disability percentage. In case the disability
is less than 15 per cent, a lump-sum payment equal to a three years periodical payment is
paid.
Survivor pension
In case of death of the insured, the survivors receive a survivor’s pension. Eligible
widows receives 30 per cent of the salary and children receive 15 per cent each if they
have a remaining parent and 20 per cent each of they become orphans. The direct parents
also receive 10 per cent each. All survivor benefits combined must not exceed 100 per cent
of the deceased person's permanent disability pension. These allowances are not offered in
case the death of the insured results from a crime, from an illegal act committed by the
worker, or by an intentional fault.
Funeral grant
A lump sum of 100 times the legal monthly minimum wage, which varies by sector,
is paid.
1.5.3. Medical scheme
Coverage
This scheme covers all civil servants, pensioners who previously contributed to
medical care, and workers from private institutions who have been accepted.

Feasibility study of the introduction of a new maternity cash benefits scheme in Rwanda 8
Financing
The employee and employer both contribute 7.5 per cent of earnings. Pensioners also
contribute 7.5 per cent of their monthly pension.
Benefits
An insured person must have contributed for at least three months in order to benefit
from this scheme and is still covered for three months after losing their job.
In case of sickness, the fund pays 85 per cent of the bills from health facilities
accredited by the RSSB. The remaining 15 per cent is paid by the insured person. The
scheme covers medical consultations, prescribed drugs, surgical interventions, dental care,
medical imaging, laboratory tests, physiotherapy, hospitalization, eye treatment, prosthesis,
orthesis, and dialysis. Full medical check-ups are provided only for women older than 35
and men older than 40.

Feasibility study of the introduction of a new maternity cash benefits scheme in Rwanda 9
2. International labour standards on maternity protection and international practices
2.1. International labour standards on maternity protection
Maternity protection is multidimensional and encompasses different perspectives—be
it labour law (leave, employment protection), occupational safety and health (health
protection), or social security (maternal health care and maternity cash benefits)—and has
long been seen by the international community as an essential prerequisite for the
achievement of women’s rights and gender equality. Hence, the right of women to
maternity protection has been included in all major fundamental human rights instruments.
Maternity protection is enshrined in the Universal Declaration of Human Rights, 5 which
states that motherhood and childhood are entitled to special care and assistance, as well as
in the International Covenant on Economic, Social and Cultural Rights, 6 which includes
special protection for mothers during a reasonable period before and after childbirth,
including paid leave or leave with adequate social security benefits. While maternity
protection contributes to the advancement of gender equality in the world of work, it also
contributes to the achievement of Millennium Development Goals 3, 4, and 5, which seek
to promote gender equality and the empowerment of women, to reduce child mortality, and
to improve maternal health, respectively, by 2015.
Maternity protection for female workers falls directly under the mandate of the ILO
and has been a core issue since its foundation in 1919. The main concern for the protection
of female workers has been, on one hand, to ensure that the women’s reproductive role
does not compromise their economic and employment security. On another hand,
protections ensure that women’s work does not pose risks to the health of the woman and
her child. There is a global consensus that paid maternity leave is one of the crucial
elements of maternity protection. This consensus is reflected in the fact that various
maternity cash benefit provisions exist in the legislation of almost all developed and
developing countries, including Rwanda’s labour legislations. International labour
standards on maternity protection demonstrate the crucial value placed on having paid
leave available for working women as a replacement for lost income. As of November
2014, 67 ILO member states have ratified at least one of the three Maternity Protection
Conventions, namely Convention Nos 3, 103, and 183, explained below.
2.2. ILO maternity protection standards
ILO maternity standards go as far back as its foundation in 1919 when governments,
employers, and trade union representatives of member States adopted the first Maternity
Protection Convention, 1919 (No. 3). ILO constituents have further enhanced protections
for working mothers through adopting no less than 42 standards that are directly or
indirectly linked to maternity protections in its multidimensional facets. With the adoption
of the Convention on Social Security (Minimum Standard), No. 102, 1952, maternity was
recognized as one of the nine branches comprising comprehensive social security. In recent
5 Article 25(2) Universal Declaration of Human Rights, 1948.
6 Article 10(2).

10 Feasibility study of the introduction of a new maternity cash benefits scheme in Rwanda
years, ILO members have reaffirmed their commitment to protecting maternity and
developing the social protection systems required to make maternity protection a reality for
all women. It is in this spirit that ILO members revised Convention No. 103 by adopting
Convention No. 183 and Maternity Protection Recommendation, 2000 (No. 191), and
included maternity protection in the Social Protection Floors Recommendation, 2012
(No. 202), aimed at guiding countries towards building comprehensive social security
schemes comprising, among others, basic social security guarantees that combine both
maternal health care and basic income security in case of maternity.
The body of ILO standards on maternity protection, especially those exclusively
dedicated to it (Conventions Nos 3, 103, and 183 and Recommendations Nos 95 and 191),
have progressively expanded the coverage, material scope, and entitlements of maternity
protection at work, providing detailed guidance to orient national policy and action. These
standards should be viewed as representing a minimum level for protection. Countries are
encouraged to grant more favourable conditions in line with national circumstances.
Although Rwanda has not ratified the minimum social security standard (Convention
No. 102) or the higher maternity protection standard (Convention No. 183), these
Conventions, as well as Recommendation No. 191, should serve as guidance to the
Rwandan Government as it redefines its maternity protection policy, as they represent the
most up-to-date internationally accepted minimum levels of maternity protection.
In regards to the minimum social security standard, Part VIII of Convention No. 102
provides for maternity benefits comprising of medical care and periodical payments to
compensate for the suspension of earnings due to maternity. The Convention calls for free
maternity medical care (at least prenatal, confinement, and postnatal care either by medical
practitioners or by qualified midwives, and hospitalization where necessary) and cash
benefits for at least 12 weeks or a longer period corresponding to the actual duration of
maternity leave.
As for the most advanced and up-to-date maternity protection instruments, the
Maternity Protection Convention, 2000 (No. 183), and Maternity Protection
Recommendation, 2000 (No. 191), are notable for several advances in maternity
protection. For instance, Convention No. 183 expands the scope of maternity protection to
cover all employed women, including those in atypical forms of dependent work in the
informal economy. The minimum leave period was extended from the 12 weeks specified
in earlier Conventions to 14 weeks in Convention No. 183, and 18 weeks in
Recommendation No. 19. Convention No. 183 requires cash benefits to reach at least two-
thirds of previous earnings, while Recommendation No. 191 suggests that the level of cash
benefits should be raised to the full amount of previous earnings, where practicable.
Furthermore, Convention No. 183 provides stronger employment protections by requiring
health protection measures as well as to ensure that maternity does not constitute grounds
for discrimination in employment, including in access to employment, and explicitly
prohibiting pregnancy tests as part of candidate selection procedures (except in very
limited specific circumstances to protect the woman’s and the baby’s health). In terms of
breastfeeding, Recommendation No. 191 calls for the establishment of breastfeeding
facilities at the workplace.
With regards to cash benefits, a consistent theme in all ILO maternity protection
Conventions is to ensure that maternity cash benefits are provided through public funds or
social insurance. Convention No. 183 insists in Article 6 paragraph 8 that “benefits in
respect of the leave referred to in Articles 4 and 5 [maternity leave and leave in case of

Feasibility study of the introduction of a new maternity cash benefits scheme in Rwanda 11
illness or complications] 7 shall be provided through compulsory social insurance or public
funds, or in a manner determined by national law and practice.” Recommendation No. 191
emphasizes the way the collective resource pool should be comprised, specifically that
both men and women should contribute: “Any contribution due under compulsory social
insurance providing maternity benefits and any tax based on payrolls which is raised for
the purpose of providing such benefits, whether paid by both the employer and the
employees, […] should be paid in respect of the total number of men and women
employed, without distinction of sex.” Furthermore, Convention No. 102, with regards to
general principles in financing social insurance schemes, states that the total of insurance
contributions borne by the employees should not exceed 50 per cent of the total financial
resources allocated to social security. These principles ensure a broad, stable pooling of
resources that avoids adverse selection and ensures fair distribution of the costs and
responsibilities for reproduction between non-childbearing individuals and
childbearing individuals, regardless of age and sex, and comparable to child benefits.
Thus, even persons who can certify medically an inability to bear children should
contribute.
As to the frequency of payments for cash maternity benefits, international labour
standards require periodic payments as opposed to a lump-sum payment during the entire
duration of maternity leave (Article 52 of Convention No. 102). This is consistent with the
function of income replacement attributed to cash benefits. In practice, most maternity
cash benefit schemes around the world provide for a benefit payment mechanism that
follows the same frequency of payments as usual salaries and wages.
2.3. Financing maternity protection schemes: Social insurance versus employer liability 8
Maternity cash benefits can be financed through different types of schemes, including
social insurance, social assistance, universal schemes, and employer liability schemes. The
ILO strongly advocates for publically funded or social insurance schemes and places the
responsibility for the sound financing of maternity schemes on the State through all its
social security and maternity protection standards. Financing of maternity benefits should
be borne collectively based on insurance contributions and/or taxation. Pooling financial
resources ensures fair distribution of the cost and redistribution through pooling creates
incentives for employers to hire females and males on an equitable basis.
According to worldwide experience, employer liability schemes create disincentives
for employers to hire women who may become pregnant and incentives to discharge
pregnant employees in order to avoid paying maternity benefits as well as wages to
replacement workers during maternity leave. 9
Labour administrations often face
difficulties in enforcing employers’ compliance in employer liability compensation
schemes, particularly in developing countries. Administrative costs with respect to
providing direct maternity compensation is substantial for small enterprises. In summary,
employer liability schemes are detrimental to the promotion of equal treatment for men and
7 Our addition.
8 ILO: Maternity Protection Resource Package: From aspiration to reality for all, ILO Conditions
of Work and Employment Programme (TRAVAIL) (Geneva, 2012), p. 26.
9 Ibid.

12 Feasibility study of the introduction of a new maternity cash benefits scheme in Rwanda
women in the labour market. There has been a shift in the last 20 years from employer
liability systems to collectively financed maternity benefits, mainly through social
insurance schemes. The percentage of countries that finance cash maternity benefits
through employer liability systems decreased from 31 per cent in 1994 to 26 per cent in
2009.
Figure 2.1. Brief overview of the main requirements: ILO social security standards on maternity 10
10 ILO: 2014 World Social Protection Report 2014/15: Building economic recovery, inclusive
development and social justice. Available in: http://www.ilo.org/global/research/global-
reports/world-social-security-report/2014/WCMS_245201/lang--en/index.htm [03 Nov. 2014].

Feasibility study of the introduction of a new maternity cash benefits scheme in Rwanda 13
3. Maternity cash benefits in Rwanda
Rwanda has put in place various laws and policies on maternity protection at work.
The current labour laws provide for paid leave and benefits, including maternity leave and
cash benefits for public and private sector employees. The public sector maternity scheme
is regulated through the Law Establishing the General Statutes for Public Service No.
86/2013 of 11 September 2013, while the private sector maternity scheme is organized
through the Law Regulating Labour in Rwanda No. 13/2009 of 27 May 2009. The
following section provides a brief description and analysis of current maternity leave and
cash benefits provisions. While existing collective agreements might offer better maternity
protection from the current legislation, the report does not comment on them as they may
differ from one company/employer to another.
3.1 Existing national legislation on maternity protection
A general law regulating general labour relations and a specific law governing labour
relations for public servants include existing legal provisions for maternity protection
through social security.
Law Regulating Labour in Rwanda No. 13/2009 of 27 May 2009
The Law Regulating Labour in Rwanda No. 13/2009 of 27 May 2009 is the
foundation of all labour relations in Rwanda, outlining and defining employment relations,
the actors of the formal labour sector, and their obligations to each other. Articles 2 and 3
determine the scope of the Law and to whom it applies. Thus, all workers under a contract
of employment either oral or written (see article 1(2) (32) for definitions of contract of
employment and worker), trainees, and apprentices under employment contracts are
covered by the general labour law. Exclusions from the scope of this law are public sector
employees who are governed by specific statutes, workers in family agricultural, breeding,
commercial or industrial activities, and informal sector workers (defined in article 1(38)).
However, the exclusion from the scope of this legislation does not extend to social security
provisions, thus making maternity provisions in this law applicable to all categories of
workers in the private sector.
Maternity protection is primarily covered in section 3, articles 64 through 69, of the
Law Regulating Labour in Rwanda. Article 64 sets the scope of maternity leave, while
article 66 sets the replacement rate of lost income during maternity leave:
Article 64: Maternity leave duration
Every employed woman has the right to a maternity leave of twelve (12) consecutive weeks. This woman may decide to start benefiting from this leave two (2) weeks before the tentative date of delivery.
[…]
Article 66: Remuneration during maternity leave
The mother with no maternity insurance coverage shall, during the first six (6) weeks of her maternity leave, have the right to her entire salary. During the last six (6) weeks of her maternity leave, this mother may either, resume service and receive her full salary or else, have the right to twenty per cent (20%) of her salary.
She shall also keep enjoying the right to other types of benefits.
14 Feasibility study of the introduction of a new maternity cash benefits scheme in Rwanda
Thus, every employed woman, as defined by articles 2 and 3, is entitled to
12 consecutive weeks of maternity leave, with a possibility to commence the leave up to
two weeks before the tentative date of delivery. The level of benefits to be paid by the
employer for women without maternity insurance depends on the number of weeks taken.
The first six weeks of maternity leave are payable at the full rate of the beneficiary’s
previous salary, while the latter six weeks are payable at 20 per cent of her previous salary.
However, the law permits the beneficiary to resume work after the sixth week of maternity
leave in order to recover her full salary. During the whole period of maternity leave the
beneficiary continues to enjoy the right to other types of benefits (article 66(2)) including
annual leave, incidental leave, among others.
Moreover, in the event of complications related to the delivery or a congenital
condition in the baby that has been diagnosed and certified by a doctor, the beneficiary is
entitled to additional paid maternity leave for a maximum of one month to ensure the
child’s and/or the mother’s health (article 69).
Law Establishing the General Statutes for Public Service No. 86/2013 of 11 September 2013
As mentioned in the subsection above, public sector employees are excluded
explicitly from the scope of the general Law Regulating Labour in Rwanda. A specific
legislation, the Law Establishing the General Statutes for Public Service adopted in 2013,
governs their labour relationships. This law applies to public servants employed on a
permanent basis (article 2), thus excluding contractual public servants who are governed
by the Law Regulating Labour in Rwanda No. 13/2009 of 27 May 2009. 11
Maternity leave and cash benefits are provided for and determined under chapter 4,
articles 22 through 24 of the legislation. These provisions encompass similar rights as
those awarded to private sector workers. Indeed, the duration and replacement rate of
maternity leave and cash benefits are identical. Thus, the replacement rate for the first six
weeks is established at 100 per cent of the beneficiary’s salary while in the latter six weeks
the replacement rate falls to 20 per cent of the beneficiary’s salary. The option to go back
to work after six weeks of maternity leave is also maintained for public servants. In
addition, the public servant is also entitled to additional leave of at most one month
payable at 100 per cent of the income replacement rate in the case of complications related
to childbirth.
The only notable difference between the public and private regimes is that the
voluntary two weeks of maternity leave before delivery or due date is made compulsory in
the public sector maternity regime.
11 Article 13 defines a public servant as any person with a permanent job position or working on
employment contract in public service and who is paid out of the public funds.

Feasibility study of the introduction of a new maternity cash benefits scheme in Rwanda 15
3.2. Gaps between the duration and levels of cash benefits established by national legislation and international standards
In light of Chapter VIII of the Social Security (Minimum Standards) Convention,
1952 (No. 102), and the most advanced and up-to-date Maternity Protection Convention,
2000 (No. 183), explained in section 2 of this report, gaps regarding maternity cash
benefits have been identified between the current Rwandan provisions for maternity and
these international labour standards, namely on the level and duration of cash benefits and
the financing mechanisms of the cash benefits.
The first gaps identified pertain to the level and duration of maternity cash benefits.
The Rwandan provisions for maternity protection provide an average of a 60 per cent
replacement rate for 12 weeks of maternity leave (100 per cent for the first six weeks and
20 per cent for the remaining six weeks). On average the replacement rate of the maternity
cash benefit meets the requirement under Convention No. 102, which requires an average
replacement rate of 45 per cent over the total 12-week maternity leave. However, under
more recent standards on maternity protection, Convention No. 183 establishes a
replacement rate of two-thirds (approximately 67 per cent) of previous earnings for at least
14 weeks, including six compulsory weeks after childbirth. Provisions from both the Law
Establishing the General Statutes for Public Service and the Law Regulating Labour in
Rwanda meet neither the requirement on the duration of protection nor the requirement on
the replacement rate.
Furthermore, the current legal framework for maternity protection is based on
employer liability, making the employer solely responsible for financing maternity cash
benefits. Both Conventions Nos 102 and 183 require a financing mechanism based on
collective risk sharing through social insurance, public funding, or any other risk-sharing
mechanism identified and agreed upon by the government and representatives of workers
and employers. In principle, these Conventions prohibit employers from being solely
responsible for financing maternity cash benefits except under very strict conditions. 12
3.3. Maternity protection around the world
This section examines trends in maternity protection around the world with particular
focus on the duration of national statutory leave and the replacement rate to compensate
the loss of income in light of international standards.
The majority of countries around the world offer more than 12 weeks of paid
maternity leave, the minimum established by international standards. In fact, according to
the World Social Protection Report 2014/15, of the 188 countries studied, 96 provided
maternity leave of at least 14 weeks (51 per cent), meeting the requirements of Convention
No. 183. Furthermore, 59 countries (32 per cent) provided 12 to 13 weeks of leave,
meeting the minimum requirements in Convention No. 102, while 27 countries (15 per
12 Article 8 of the Maternity Protection Convention, 2000 (No. 183), states that employers shall not
be individually liable to finance cash benefits without their consent, except for member States where
such a financing mechanism was in place before the adoption of the Convention in 2000 by the
International Labour Conference (ILC) or have an agreement at the national level between the
government and the representatives of employers and workers.

16 Feasibility study of the introduction of a new maternity cash benefits scheme in Rwanda
cent) provide less than 12 weeks of paid maternity leave. 13
Among the 52 African
countries analysed, almost half (48 per cent) provide at least 14 weeks of leave and an
additional 35 per cent provide 12 to 13 weeks. A minority of countries (17 per cent)
provides less than 12 weeks of leave.
Looking at the evolution of national legislation, a recent ILO study on maternity and
paternity at work found that the global trend over the last 20 years has been to increase the
duration of maternity leave to exceed the ILO’s minimum standards. 14
Thus, more and
more countries are shifting towards longer maternity leave. It is to be noted that none of
the countries studied reduced the duration of existing statutory paid maternity leave below
the 12-week minimum required by ILO standards in the last 20 years.
Figure 3.1. Paid maternity leave: A world map
Source: World Social Protection Report 2014-15, 2014, p.65
Regarding the levels of compensation for the loss of income due to maternity, the
levels of maternity cash benefits vary widely from country to country. According to the
World Social Protection Report 2014-15, 77 countries out of 188 countries analysed
offered new mothers at least two-thirds of their regular salaries for at least 14 weeks,
conforming to Convention No. 183. In 28 countries women have a right to 100 per cent of
their regular salary for at least 18 weeks, which is consistent with the highest standard set
out in Recommendation No. 191. In 61 countries women are entitled to benefits of
between 45 per cent and 67 per cent of their previous salaries for a period of 12–13 weeks,
complying with the minimum standard set by Convention No. 102. In 31 countries, the
cash benefit corresponds to less than 45 per cent of the previous salary and/or the period of
paid maternity leave is inferior to 12 weeks.
13 ILO: World Social Protection Report (WSPR) 2014-15: Building economic recovery, inclusive
development and social justice (Geneva, 2014).
14 ILO: Maternity and paternity at work: Law and Practice around the World, ILO Conditions of
Work and Employment Programme (TRAVAIL) (Geneva, 2014).

Feasibility study of the introduction of a new maternity cash benefits scheme in Rwanda 17
Figure 3.2. Level of benefits around the world
As Rwanda is revising its maternity protection scheme, this is an opportunity to be a
trendsetter for the African region and specifically the East African Community for the
advancement of women’s rights at work. By providing working women in Rwanda better
maternity protection, the Rwandan Government sends a clear message that it is taking
concrete action to reduce gender inequality and discrimination at work.
3.4. Insurance options for maternity schemes
The present report analyses various policy options with respect to schemes, benefits,
and financing of benefits. Dimensions of the different options are as follows:
Three different schemes are proposed providing different levels of benefits:
■ a compulsory social insurance scheme that provides 100 per cent of wages for the
entire maternity period;
■ a supplementary social insurance scheme that provides 80 per cent of wages for the
latter six weeks of the maternity leave; and
■ an employer liability scheme that provides 100 per cent of wages for the first six
weeks of maternity leave.
Proposed contributors to the scheme include:
■ both male and female workers, employers, and the Government;
■ female workers, employers, and the Government; and

18 Feasibility study of the introduction of a new maternity cash benefits scheme in Rwanda
■ employers and the Government.
Benefit durations include: 15
■ 12 weeks;
■ 14 weeks; and
■ 18 weeks.
Three options have been proposed by the ILO and six by the Government. The first
three options are in line with the ILO Conventions and Recommendations on maternity
benefits. The six options proposed by the Government are not in line with ILO
recommendations as they are discriminatory and against gender equality. Nevertheless,
cost estimates of these options are provided for illustrative purposes only since they are
proposed by the Government.
The first three options in line with ILO recommendations are:
Option 1: A compulsory social insurance scheme that provides a maternity benefit of
100 per cent of wages for 12 weeks. Both male and female workers, employers,
and the Government will contribute.
Option 2: A compulsory social insurance scheme that provides a maternity benefit of
100 per cent of wages for 14 weeks. Both male and female workers, employers,
and the Government will contribute.
Option 3: A compulsory social insurance scheme that provides a maternity benefit of
100 per cent of wages for 18 weeks. Both male and female workers, employers,
and the Government will contribute.
The six options proposed by the Government are:
Option 4: A supplementary social insurance scheme that provides a maternity benefit of
80 per cent of wages during the latter six weeks of maternity leave. Both male
and female workers, employers, and the Government will contribute.
Option 5: A compulsory social insurance scheme that provides a maternity benefit of
100 per cent of wages for 12 weeks. Only female workers, employers, and the
Government will contribute.
Option 6: A compulsory social insurance scheme that provides a maternity benefit of
100 per cent of wages for 14 weeks. Only female workers, employers, and the
Government will contribute.
Option 7: A compulsory social insurance scheme that provides a maternity benefit of
100 per cent of wages for 18 weeks. Only female workers, employers, and the
Government will contribute.
15 Durations correspond to the minimum period in Convention No. 102, Convention No. 183, and
Recommendation No. 191.

Feasibility study of the introduction of a new maternity cash benefits scheme in Rwanda 19
Option 8: A supplementary social insurance scheme that provides a maternity benefit of
80 per cent of wages during the latter six weeks of maternity leave. Only female
workers, employers, and the Government will contribute.
Option 9: Employers pay the 100 per cent of salary for the first six weeks and the social
insurance scheme pays the 100 per cent of salary for the latter six weeks. Both
male and female workers, employers, and the Government will contribute to the
social insurance scheme for the benefit paid in the latter six weeks.
Another Option for which 100 per cent of wages are provided for eight weeks with
both female and male contributors is also assessed since this option is being considered by
the Government.
3.4.1. Qualifying conditions
Qualifying conditions for the new maternity benefit are set as follows:
■ The benefit is payable to all female employees currently insured under the pension
and occupational hazards schemes.
■ The benefit is granted in the event of suspension of earnings due to pregnancy and
confinement and their consequences.
■ There should be conditions to preclude abuse. For example, a woman must contribute
for at least three months out of six months or six months out of 12 months preceding
the commencement of maternity leave. 16
■ The beneficiary must present a medical certificate with an estimated date of birth
(only in cases where leave starts before delivery) or a birth record.
■ There is no limit on the number of claims for individual females.
■ Payments cease upon return to work.
3.4.2. Pay-As-You-Go (PAYG) financing method
Maternity benefits are usually provided for several months and annual expenditures
are relatively stable over time. Therefore, the Pay-As-You-Go (PAYG) financing system is
adopted. Under this system, a contribution rate is set to meet annual benefit expenditures
and administration costs. A small margin is usually added to the contribution rate in order
to build contingency reserves for unexpected fluctuations of income and expenditures.
16 There should be transitional measures stipulated during the introduction of the chosen scheme.
For example, eligibility could be determined by counting the working period before the
implementation date of the scheme as the contribution period.
20 Feasibility study of the introduction of a new maternity cash benefits scheme in Rwanda
4. Demographic and financing projections
The main objective of this study is to assess, for each policy option, the contribution
rate of a newly introduced social insurance scheme. Options include the Government
proposal to set up a social insurance scheme which provides 80 per cent of salary for the
latter six weeks of maternity leave in order to supplement the 20 per cent of salary paid
directly by employers, as well as the ILO’s recommended options of entirely shifting from
an employer liability to a social insurance scheme.
In principle, the financing method for maternity benefits is a PAYG method, namely
to finance annual total expenditures solely by social insurance contributions. However,
some margins are added to the PAYG cost rate in order to build up contingency reserves
for fluctuating income and expenditures.
Based on the information obtained for the year 2013, projections have been calculated
from 2014 until 2025.
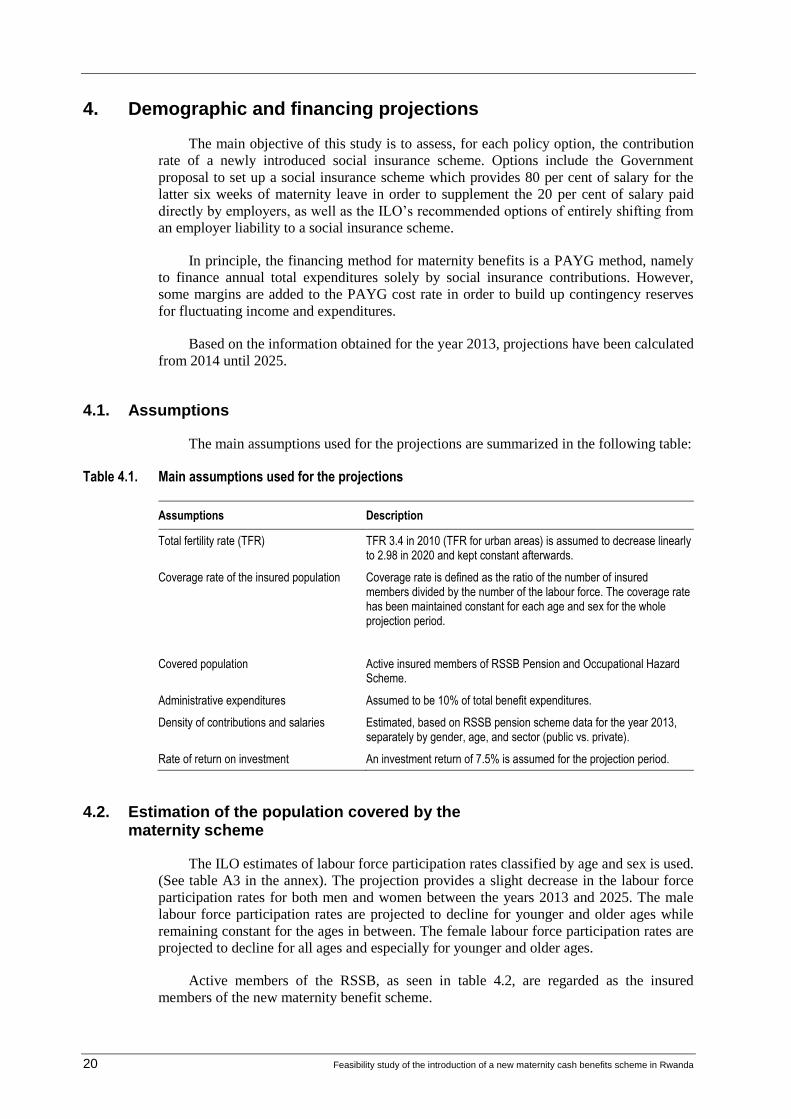
4.1. Assumptions
The main assumptions used for the projections are summarized in the following table:
Table 4.1. Main assumptions used for the projections
Assumptions Description
Total fertility rate (TFR) TFR 3.4 in 2010 (TFR for urban areas) is assumed to decrease linearly to 2.98 in 2020 and kept constant afterwards.
Coverage rate of the insured population Coverage rate is defined as the ratio of the number of insured members divided by the number of the labour force. The coverage rate has been maintained constant for each age and sex for the whole projection period.
Covered population Active insured members of RSSB Pension and Occupational Hazard Scheme.
Administrative expenditures Assumed to be 10% of total benefit expenditures.
Density of contributions and salaries Estimated, based on RSSB pension scheme data for the year 2013, separately by gender, age, and sector (public vs. private).
Rate of return on investment An investment return of 7.5% is assumed for the projection period.
4.2. Estimation of the population covered by the maternity scheme
The ILO estimates of labour force participation rates classified by age and sex is used.
(See table A3 in the annex). The projection provides a slight decrease in the labour force
participation rates for both men and women between the years 2013 and 2025. The male
labour force participation rates are projected to decline for younger and older ages while
remaining constant for the ages in between. The female labour force participation rates are
projected to decline for all ages and especially for younger and older ages.
Active members of the RSSB, as seen in table 4.2, are regarded as the insured
members of the new maternity benefit scheme.

Feasibility study of the introduction of a new maternity cash benefits scheme in Rwanda 21
Table 4.2. Distribution of insured active members from private and public sectors, 2013
Both sexes Number Percentage of LF Average salary
15-19 4 567 0.5% 146 418
20-24 39 560 5.2% 640 271
25-29 83 939 8.3% 1 320 338
30-34 75 862 9.2% 1 988 322
35-39 52 712 8.9% 2 466 807
40-44 37 598 8.8% 2 722 792
45-49 24 274 6.8% 2 794 433
50-54 16 459 5.3% 2 760 619
55-59 8 912 3.8% 2 787 579
60-64 3 769 2.2% 2 921 567
Total 347 652 6.2% 1 924 882
Male
15-19 2 773 0.6% 155 020
20-24 26 874 7.4% 610 581
25-29 56 997 11.7% 1 261 774
30-34 52 086 13.3% 1 927 655
35-39 37 447 13.0% 2 454 005
40-44 27 354 13.5% 2 767 197
45-49 17 617 10.2% 2 863 342
50-54 12 188 8.3% 2 822 273
55-59 6 909 6.7% 2 839 498
60-64 3 061 4.0% 2 991 606
Total 243 304 9.1% 1 933 226
Female
15-19 1 795 0.4% 133 130
20-24 12 686 3.2% 703 167
25-29 26 947 5.1% 1 444 235
30-34 23 776 5.5% 2 121 227
35-39 15 265 4.9% 2 498 214
40-44 10 244 4.6% 2 604 226
45-49 6 658 3.7% 2 612 093
50-54 4 271 1.1% 2 584 662
55-59 2 003 0.5% 2 608 529
60-64 709 0.2% 2 619 153
Total 104 348 3.5% 1 905 427
Sources: RSSB, ILO Stats.
The coverage rates for active members in the labour force are calculated by gender
and age groups as seen in the second column of table 4.2. The coverage rates by gender
and age groups have been maintained constant over the whole projection period.
Implicitly, this means that the absolute numbers of active members are assumed to evolve
in line with projected growth in the labour force. The numbers of insured active members
by age, gender, year, and sector are shown in tables A4 and A5 in the Annex.

22
R
wa
nd
a_
ma
terity_fin
al_14ap
ril15
.do
c
Error! Unknown document property name.
Table 4.3. Population, labour force (ages 15-64), and covered population (in thousands), and coverage rates for the projection period, 2014-25
Both sexes 2014 2015 2016 2017 2018 2019 2020 2021 2022 2023 2024 2025
Total population 10 925 11 141 11 363 11 590 11 820 12 053 12 290 12 529 12 772 13 017 13 264 13 514
Labour force 5 844 6 046 6 234 6 411 6 586 6 767 6 962 7 172 7 395 7 627 7 862 8 096
Population covered 359 371 384 397 411 425 439 454 469 485 500 516
Male
Total population 5 273 5 383 5 496 5 610 5 727 5 845 5 964 6 085 6 207 6 331 6 456 6 582
Labour force 2 785 2,884 2 978 3 066 3 153 3 244 3 341 3 446 3 558 3 673 3 790 3 906
Population covered 251 260 269 279 288 298 309 319 330 341 353 364
Female
Total population 5 652 5 758 5 868 5 979 6 093 6 209 6 326 6 444 6 564 6 686 6 808 6 932
Labour force 3 059 3 161 3 256 3 346 3 433 3 523 3 620 3 726 3 838 3 954 4 072 4 190
Population covered 108 111 115 119 122 126 130 134 139 143 148 152
Coverage rates
Both 6.1% 6.1% 6.2% 6.2% 6.2% 6.3% 6.3% 6.3% 6.3% 6.4% 6.4% 6.4%
Male 9.0% 9.0% 9.0% 9.1% 9.1% 9.2% 9.2% 9.3% 9.3% 9.3% 9.3% 9.3%
Female 3.5% 3.5% 3.5% 3.5% 3.6% 3.6% 3.6% 3.6% 3.6% 3.6% 3.6% 3.6%

Feasibility study of the introduction of a new maternity cash benefits scheme in Rwanda 23
4.3. Estimation of salaries and salary mass
A projection of the total salary mass was carried out in order to compute the
contributory basis for the scheme needed to finance expenditures.
Salary data for active members of the Rwanda Pension and Occupational Hazard
Scheme have been provided by age, gender, and sector for the year 2013. The average
salary by age and gender is shown in table A6 of the annex. Average salaries have been
estimated over the whole projection period by using salary growth assumptions shown in
table 4.5.
Table 4.4 reports the density of contributions estimated separately for the private and
public sectors by both gender and age based on contributing months for the year 2013.
Table 4.4. Density of contributions by sector, gender, and age, 2013
Age
Private
Public
Males Females Age Males Females
15 0.525510 0.426829 18 0.607143 0.657407
20 0.559083 0.595213 23 0.856969 0.83667
25 0.699234 0.718956 28 0.912767 0.919106
30 0.765007 0.792131 33 0.935311 0.934783
35 0.789888 0.806402 38 0.946464 0.934965
40 0.793263 0.801887 43 0.945800 0.932095
45 0.795664 0.791041 48 0.931217 0.949115
50 0.803095 0.804974 53 0.911142 0.954545
55 0.784799 0.782369 58 0.907186 0.942446
60 0.785514 0.783708 63 0.893466 0.908333
64 0.791494 0.755000 64 0.922535 0.904762
Source: RSSB data and own calculations.
Note: the density of contribution is the ratio of the average number of contributed months divided by 12.
The salary growth rate is assumed to be the same as the productivity growth rate. Real
productivity growth has been estimated based on assumed GDP real growth and the
projected number of the employed population. The inflation projection from the IMF
World Economic Outlook is adopted to inflate the real values into nominal values. The
economic variables used to estimate salary growth are reported in table A7 in the annex.

24 Feasibility study of the introduction of a new maternity cash benefits scheme in Rwanda
Table 4.5. Annual inflation, nominal salary increase, and nominal interest rate (in %)
2014 2015 2016 2017 2018 2019 2020 2021 2022 2023 2024 2025
Inflation 4.07 4.75 5.00 5.00 5.00 5.00 5.00 5.00 5.00 5.00 5.00 5.00
Nominal salary increase rate 7.78 8.80 9.41 9.67 9.80 9.78 8.64 8.34 8.04 7.74 7.44 7.14
Interest rate 7.50 7.50 7.50 7.50 7.50 7.50 7.50 7.50 7.50 7.50 7.50 7.50
Sources: IMF World Economic Outlook 2014, actuarial valuation of the Rwanda Pension and Occupational Hazards Scheme as at 30 June 2012, ILO statistics, and ILO’s own calculations.
The total salary mass has been estimated by multiplying the number of active insured
members by the average salary and density of contributions classified by age, gender, and
sector.
4.4. Estimation of annual births
The fertility rates for actively insured female members are assumed to be the same as
the fertility rates of the urban population. Since fertility rates for female wage earners are
usually lower than the fertility rates for residents in urban areas, the estimate of annual
births and hence the cost incurred for the maternity benefits is deemed to be conservative.
Data with respect to insured members as well as female beneficiaries should be collected
once the scheme is implemented in order to improve the accuracy of future projections.
The fertility rates for the urban population have been provided by the 2010
Demographic and Health Survey (DHS) classified by age groups. The projected fertility
rates have been built based on 2010 urban fertility rates and the fertility trend of the UN
World Population Prospects (WPP) between 2011 and 2020 (high fertility estimate). From
2020 onwards, the fertility rates are assumed to be constant.
Table 4.6. Assumed fertility ratios by age groups of females and total fertility rate
Age group 2010 2014 2020
15-21 0.0630 0.0855 0.0991
22-28 0.1721 0.1856 0.1938
29-35 0.1399 0.1146 0.0992
36-42 0.0926 0.0551 0.0323
43-49 0.0232 0.0095 0.0012
Total fertility rate 3.44 3.15 2.98
Sources: Own calculations from demographic data from the UN WPP and DHS 2010.
Notes: Urban fertility rates from the DHS 2010 have been used and projected using the high assumptions of the UN WPP.
The total number of beneficiaries is estimated by multiplying the projected fertility
rate by the number of insured members classified by age groups. The number of new births
for each year is shown in table A8 of the annex.

Feasibility study of the introduction of a new maternity cash benefits scheme in Rwanda 25
4.5. Estimation of costs and PAYG rate
The benefit expenditure is calculated as follows:
Where:
B: total benefit expenditures in y financial year;
N: number of females in the population covered by the system for each age, x;
T: percentage of women of age x who give birth (namely, age-wise fertility rates);
S: average monthly salary of women of age x;
E: percentage of women who satisfy the qualifying period;
R: percentage of salary paid during the maternity leave (namely, the replacement
rate); and
D: average duration of maternity leave expressed in months.
Benefit expenditures are obtained by multiplying the projected number of
beneficiaries by the number of months during which the cash benefit is paid and the
average monthly benefit amount.
The number of beneficiaries is obtained by multiplying the number of births by the
assumed percentage of women who satisfy the qualifying conditions for the benefits.
Without any experience available, it was conservatively assumed that the percentage of
women who satisfy the qualifying period is 100 per cent.
Administrative expenditures are assumed to be 10 per cent of total benefit
expenditures.
The table below shows the estimated evolutions of the PAYG cost rates from 2014 to
2025 for the three options recommended by the ILO.
The PAYG cost rates are projected to decrease from 0.89 per cent in 2014 to 0.7 per
cent in 2020 for Option 1, from 1.04 per cent to 0.80 per cent for Option 2, and from
1.33 per cent to 1.03 per cent for Option 3, mainly due to the assumed decrease of the
fertility rates.

26 Feasibility study of the introduction of a new maternity cash benefits scheme in Rwanda
Table 4.7. Projected expenditures for maternity benefits, administration costs, and the PAYG cost rate for the three options recommended by the ILO, 2014-25 (in billions Rwandan francs)
2014 2015 2016 2017 2018 2019 2020 2021 2022 2023 2024 2025
Option 1
Maternity benefit 5.12 5.50 5.94 6.43 7.00 7.69 8.46 9.43 10.51 11.71 12.98 14.29
Administrative costs 0.51 0.55 0.59 0.64 0.70 0.77 0.85 0.94 1.05 1.17 1.30 1.43
PAYG rate 0.89 0.84 0.80 0.76 0.73 0.71 0.69 0.68 0.68 0.68 0.68 0.68
Option 2
Maternity benefit 5.97 6.42 6.93 7.50 8.17 8.97 9.88 11.00 12.27 13.66 15.14 16.68
Administrative costs 0.60 0.64 0.69 0.75 0.82 0.90 0.99 1.10 1.23 1.37 1.51 1.67
PAYG rate 1.04 0.98 0.94 0.89 0.85 0.82 0.80 0.80 0.80 0.80 0.79 0.79
Option 3
Maternity benefit 7.68 8.26 8.91 9.65 10.50 11.54 12.70 14.14 15.77 17.56 19.47 21.44
Administrative costs 0.77 0.83 0.89 0.96 1.05 1.15 1.27 1.41 1.58 1.76 1.95 2.14
PAYG rate 1.33 1.27 1.20 1.15 1.10 1.06 1.03 1.03 1.02 1.02 1.02 1.01
Notes: ILO’s own calculations. The PAYG cost rate is defined as total expenditures (benefits and administration) divided by the salary mass of active insured persons. The PAYG cost rate is the percentage of the salary needed to finance total expenditures only by contribution income from the scheme.
Table 4.8 shows the evolution of the PAYG cost rates from 2014 to 2025 for the
options proposed by the Government only for illustrative purposes.
Table 4.8. Projected expenditure of maternity benefits, administration costs and the PAYG cost rate of the options proposed by the Government, 2014-25 (in billions Rwandan francs)
2014 2015 2016 2017 2018 2019 2020 2021 2022 2023 2024 2025
Option 4
Maternity benefit 2.05 2.20 2.38 2.57 2.80 3.08 3.39 3.77 4.21 4.68 5.19 5.72
Administrative costs 0.20 0.22 0.24 0.26 0.28 0.31 0.34 0.38 0.42 0.47 0.52 0.57
PAYG rate 0.35 0.34 0.32 0.31 0.29 0.28 0.28 0.27 0.27 0.27 0.27 0.27
Option 5
PAYG rate 2.98 2.82 2.69 2.56 2.46 2.38 2.40 2.32 2.32 2.32 2.32 2.31
Option 6
PAYG rate 3.48 3.29 3.14 2.99 2.87 2.78 2.80 2.71 2.70 2.70 2.70 2.69
Option 7
PAYG rate 4.48 4.24 4.03 3.85 3.69 3.57 3.60 3.48 3.48 3.48 3.47 3.46
Option 8
PAYG rate 1.19 1.13 1.08 1.03 0.98 0.95 0.96 0.93 0.93 0.93 0.93 0.92
Option 9
PAYG rate 0.44 0.42 0.40 0.38 0.37 0.35 0.34 0.34 0.34 0.34 0.34 0.34
Notes: the maternity benefit and administrative expenditures of option 5, 6, and 7 are the same as the options 1, 2, and 3, respectively. The maternity benefit and administrative expenditures of option 8 are the same as option 4. The total maternity benefit and administrative expenditures for option 9 are the same as option 1. Nevertheless, the social insurance benefit and administrative expenditures are only half of the total expenditures as the other half is paid by the employer liability scheme. Therefore, the estimated PAYG cost rate for option 9 concerns only the latter six weeks paid by the social insurance scheme.

Feasibility study of the introduction of a new maternity cash benefits scheme in Rwanda 27
The PAYG cost rates are estimated to decrease from 0.35 per cent in 2014 to 0.27 per
cent in 2021 for Option 4, from 2.98 per cent to 2.32 per cent for Option 5, from 3.48 per
cent to 2.71 per cent for Option 6, from 4.48 per cent to 3.48 per cent for Option 7, from
1.19 per cent to 0.92 per cent for Option 8, and from 0.44 per cent to 0.34 for Option 9.
The PAYG cost rates for options for which only female workers pay contributions are
substantially higher than the PAYG cost rates for options for which both male as well as
female workers contribute.
The option for which 100 per cent of wages are provided for eight weeks with both
female and male contributors is also assessed as this Option is being considered by the
Government. The PAYG rate is expected to decrease from 0.59 per cent in 2014 to
0.45 per cent in 2025. Nevertheless, the ILO does not recommend this option since ILO
Convention No. 102 stipulates a minimum benefit duration of 12 weeks.
4.6. Simulation of the reserves
Building contingency reserves is important, even for short-term benefit schemes
based on a PAYG financing method, in case of unexpected higher expenditures and lower
income due to demographic or economic fluctuations. A contribution rate set above the
PAYG cost rate allows for the accumulation of reserves and investment income from the
reserves. The annual investment return assumed in the Government Actuary’s Department
(GAD) Actuarial valuation of the Rwanda Pension and Occupational Hazards Scheme,
2012, was 7.5 per cent for the entire projection period. This assumes a real return of 2.5 per
cent over price inflation. The same assumption was adopted in the estimates.
Table 4.9 shows simulations of the cash flow at the end of the year (in millions
Rwandan francs) of the maternity scheme based on Option 1, namely maternity benefits at
the rate of 100 per cent of wages to be provided for 12 weeks.
The annual reserve at the end of the year is the annual reserve at the beginning of the
year plus primary balance and investment income. The reserve ratio shown in the last row
of table 4.9 is defined as the accumulated reserves divided by the total annual expenditures
of the scheme. The reserve ratio represents the number of years that the reserve could
finance the expenditures without income. This ratio is an indicator of the financial
robustness of the scheme under adverse demographic and economic environments.
It is important to bear in mind that the current actuarial assessment relies on limited
data, which is normal at the introduction of a new scheme. It is recommended that scheme-
specific data be collected once the scheme is implemented so as to improve accuracy of
future assessments of the contribution rate.

28 Feasibility study of the introduction of a new maternity cash benefits scheme in Rwanda
Table 4.9. Simulation of cash flow (in millions) for Option 1, 2014-25, assuming 1% contribution rate
Contribution rate: 1.0%
2014 2015 2016 2017 2018 2019 2020 2021 2022 2023 2024 2025
Income 6 370 7 268 8 352 9 629 11 123 12 855 14 712 16 786 19 087 21 623 24 406 27 448
Contribution income 6 343 7 172 8 147 9 266 10 545 11 993 13 497 15 144 16 941 18 889 20 990 23 242
Investment income 27 95 205 363 579 861 1 215 1 642 2 146 2 734 3 416 4 206
Expenditures 5 629 6 054 6 536 7 076 7 703 8 459 9 311 10 373 11 566 12 879 14 276 15 724
Maternity benefit 5 117 5 504 5 942 6 433 7 002 7 690 8 465 9 430 10 515 11 708 12 978 14 295
Administration costs 512 550 594 643 700 769 846 943 1 051 1 171 1 298 1 429
Primary balance 714 1 118 1 611 2 190 2 842 3 534 4 185 4 771 5 374 6 010 6 714 7 518
Reserve 714 1 928 3 744 6 298 9 719 14 114 19 514 25 928 33 449 42 192 52 323 64 047
Reserve ratio 0.13 0.32 0.57 0.89 1.26 1.67 2.10 2.50 2.89 3.28 3.67 4.07
Scheme implementation at the beginning of 2015
Reserve
1 118 2 874 5 362 8 713 13 033 18 352 24 679 32 105 40 748 50 771 62 379
Reserve ratio
0.18 0.44 0.76 1.13 1.54 1.97 2.38 2.78 3.16 3.56 3.97
Scheme implementation at the beginning of 2016
Reserve
1 611 4 005 7 254 11 464 16 666 22 866 30 157 38 654 48 519 59 958
Reserve ratio
0.25 0.57 0.94 1.36 1.79 2.20 2.61 3.00 3.40 3.81
Notes: The primary balance is the surplus or deficit at the end of each year considering the total contribution income and the total expenditure. The Reserves at the end of the year is the sum of the reserves at the end of the last year plus the primary balance and investment income
The reserves were estimated based on three different implementation dates, namely at
the beginning of the year 2014, 2015, and 2016.
The following table depicts the financial development for Option 9, where 100 per
cent of salary is paid directly by employers for the first six weeks and 100 per cent of
salary is paid by the social insurance scheme for the latter six weeks. The contribution rate
is assumed to be 0.6 per cent of the wages for the social insurance fund.
Table 4.10. Simulation of cash flow (in millions Rwandan francs) for Option 9, 2014-25, assuming 0.6% contribution rate
Contribution rate: 0.6% 2014 2015 2016 2017 2018 2019 2020 2021 2022 2023 2024 2025
Income 3 843 4 426 5 128 5 954 6 920 8 037 9 243 10 592 12 094 13 755 15 586 17 594
Contribution income 3 806 4 303 4 888 5 560 6 327 7 196 8 098 9 086 10 164 11 333 12 594 13 945
Interest income 37 122 240 395 593 841 1 145 1 506 1 929 2 422 2 992 3 649
Expenditure 2 815 3 027 3 268 3 538 3 851 4 230 4 656 5 186 5 783 6 439 7 138 7 862
Maternity benefit 2 559 2 752 2 971 3 216 3 501 3 845 4 232 4 715 5 257 5 854 6 489 7 147
Administration costs 256 275 297 322 350 385 423 471 526 585 649 715
Net result 991 1 276 1 620 2 022 2 475 2 966 3 442 3 900 4 381 4 894 5 456 6 083
Reserve 991 2 390 4 250 6 667 9 735 13 543 18 130 23 536 29 846 37 162 45 610 55 342
Reserve ratio 0.35 0.79 1.30 1.88 2.53 3.20 3.89 4.54 5.16 5.77 6.39 7.04
Scheme implementation at the beginning of 2015
Reserve
1 276 3 053 5 380 8 352 12 056 16 531 21 817 27 999 35 176 43 475 53 047
Reserve ratio
0.42 0.93 1.52 2.17 2.85 3.55 4.21 4.84 5.46 6.09 6.75
Scheme implementation at the beginning of 2016

Feasibility study of the introduction of a new maternity cash benefits scheme in Rwanda 29
Contribution rate: 0.6% 2014 2015 2016 2017 2018 2019 2020 2021 2022 2023 2024 2025
Reserve
1 620 3 840 6 696 10 275 14 618 19 760 25 788 32 799 40 920 50 300
Reserve ratio
0.50 1.09 1.74 2.43 3.14 3.81 4.46 5.09 5.73 6.40
Notes: The calculations on the table only concern the income and expenditure of the social insurance scheme and do not take into account the employer liability scheme’s expenditure. Thus, only six weeks of maternity benefit is considered as expenditure financed by the social insurance scheme.

30 Feasibility study of the introduction of a new maternity cash benefits scheme in Rwanda
5. Conclusions and recommendations
1. Following an agreement between the ILO and the Government of Rwanda, this report
assesses the feasibility of a maternity insurance scheme in Rwanda, especially the
design of the scheme and the contribution rate required for a new scheme.
Nevertheless, the ILO has also been required to give a neutral opinion on these policy
options.
2. The ILO recommends a compulsory social insurance scheme for the entire benefit
period of at least 12 weeks, contributed by both male and female workers, employers,
and the Government. The scheme should be introduced to replace current direct
payments of maternity benefits by employers.
3. The designs of the Government’s proposals are not in line with ILO policy in one or
more dimensions: the duration of some proposals are below the minimum standard of
12 weeks; the scheme is voluntary; only female employees contribute to the scheme;
and some options are a mixture of direct payments and a social insurance mechanism.
4. In principle, the financing method of the new social insurance scheme is a PAYG
method. However, the contribution rate should be set to allow for the accumulation of
contingency reserves to prepare for unexpected lower income and/or higher
expenditures of the scheme.
5. The ILO recommends options for a compulsory social insurance scheme which
provides maternity benefits at a replacement rate of 100 per cent of wages for
12 weeks or longer, contributed by both male and female workers, employers, and the
Government. The PAYG cost rate of Option 1 with 12 weeks benefit duration is
estimated at 0.89 per cent in 2014 and 0.68 per cent in 2025. A contribution rate of
1 per cent is recommended in order to build contingency reserves.
6. The current actuarial assessment relies on limited data. Scheme-specific data with
respect to the insured members and future beneficiaries should be collected once the
scheme is implemented so as to improve accuracy of future projections.
7. It recommended that a set of transitional provisions should be introduced with a view
to secure the maintenance of rights acquired under the previous system.
8. As the new scheme in Rwanda is expected to pay 100 per cent of gross wages, there
is a good reason to ask for taxation/social security contributions to be paid out of
maternity benefits, as well as payments of social security contributions from
employers during the maternity leave. It is recommended that social security rights
should be acquired during the maternity period, including those for pensions and
health care. This can be done either by collecting contributions from the maternity
benefits or the pension scheme provides credit without collecting contributions from
maternity benefits. In case the pension scheme provides contribution credits without
collecting contributions from the maternity scheme, the pension scheme will bear the
implicit cost for pension payments and hence this will be subject to a financial
assessment in the next actuarial valuation.
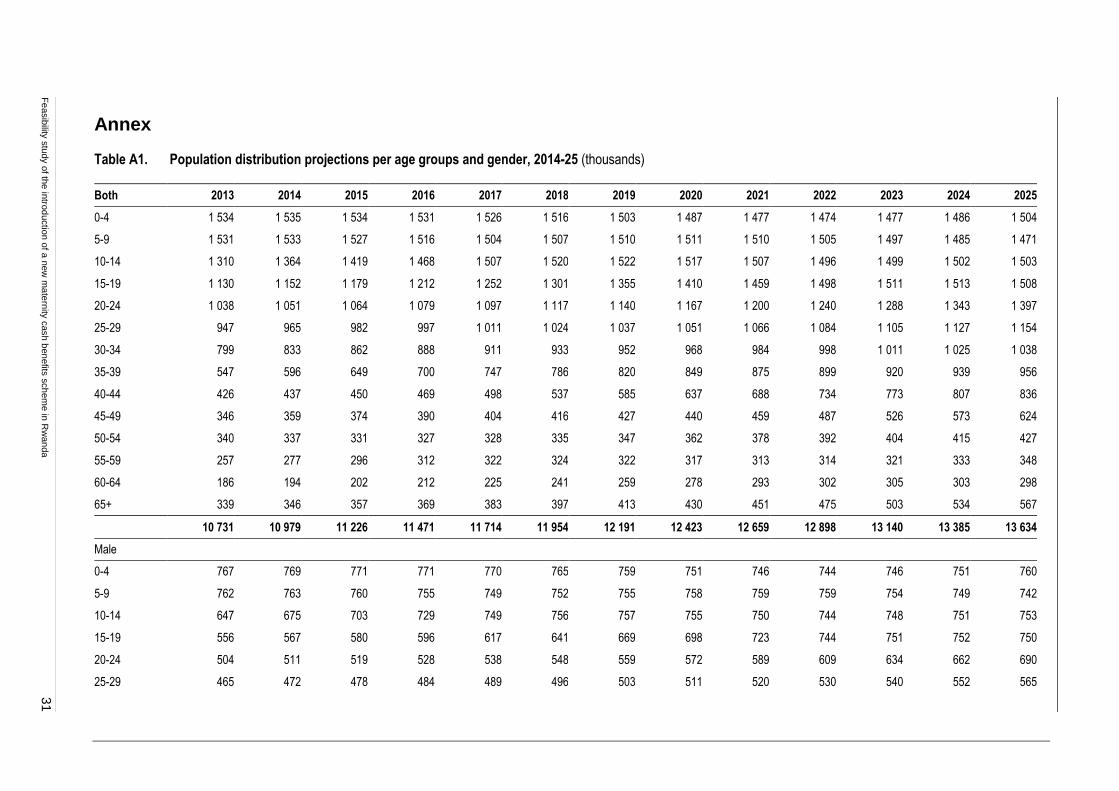
Fe
asib
ility s
tudy o
f the in
trod
uctio
n o
f a n
ew
ma
tern
ity c
ash b
en
efits
sch
em
e in
Rw
an
da
31
Annex
Table A1. Population distribution projections per age groups and gender, 2014-25 (thousands)
Both 2013 2014 2015 2016 2017 2018 2019 2020 2021 2022 2023 2024 2025
0-4 1 534 1 535 1 534 1 531 1 526 1 516 1 503 1 487 1 477 1 474 1 477 1 486 1 504
5-9 1 531 1 533 1 527 1 516 1 504 1 507 1 510 1 511 1 510 1 505 1 497 1 485 1 471
10-14 1 310 1 364 1 419 1 468 1 507 1 520 1 522 1 517 1 507 1 496 1 499 1 502 1 503
15-19 1 130 1 152 1 179 1 212 1 252 1 301 1 355 1 410 1 459 1 498 1 511 1 513 1 508
20-24 1 038 1 051 1 064 1 079 1 097 1 117 1 140 1 167 1 200 1 240 1 288 1 343 1 397
25-29 947 965 982 997 1 011 1 024 1 037 1 051 1 066 1 084 1 105 1 127 1 154
30-34 799 833 862 888 911 933 952 968 984 998 1 011 1 025 1 038
35-39 547 596 649 700 747 786 820 849 875 899 920 939 956
40-44 426 437 450 469 498 537 585 637 688 734 773 807 836
45-49 346 359 374 390 404 416 427 440 459 487 526 573 624
50-54 340 337 331 327 328 335 347 362 378 392 404 415 427
55-59 257 277 296 312 322 324 322 317 313 314 321 333 348
60-64 186 194 202 212 225 241 259 278 293 302 305 303 298
65+ 339 346 357 369 383 397 413 430 451 475 503 534 567
10 731 10 979 11 226 11 471 11 714 11 954 12 191 12 423 12 659 12 898 13 140 13 385 13 634
Male
0-4 767 769 771 771 770 765 759 751 746 744 746 751 760
5-9 762 763 760 755 749 752 755 758 759 759 754 749 742
10-14 647 675 703 729 749 756 757 755 750 744 748 751 753
15-19 556 567 580 596 617 641 669 698 723 744 751 752 750
20-24 504 511 519 528 538 548 559 572 589 609 634 662 690
25-29 465 472 478 484 489 496 503 511 520 530 540 552 565

32
F
easib
ility s
tudy o
f the in
trod
uctio
n o
f a n
ew
ma
tern
ity c
ash b
en
efits
sch
em
e in
Rw
an
da
Both 2013 2014 2015 2016 2017 2018 2019 2020 2021 2022 2023 2024 2025
30-34 389 407 423 436 447 457 464 470 476 482 489 496 504
35-39 253 278 307 335 360 381 400 415 428 440 449 457 463
40-44 195 199 204 213 227 247 273 301 328 353 374 392 408
45-49 158 164 172 179 185 190 194 199 207 221 241 266 294
50-54 153 152 150 148 149 152 158 165 172 179 183 187 192
55-59 114 123 132 139 143 145 144 142 141 142 145 151 158
60-64 81 85 89 93 99 106 114 122 129 133 135 134 132
65+ 132 136 141 146 153 159 167 175 184 195 208 221 236
5 175 5 301 5 427 5 551 5 674 5 796 5 916 6 034 6 153 6 274 6 397 6 521 6 647
Female
0-4 767 766 763 760 755 750 744 736 731 729 731 735 744
5-9 769 770 766 761 755 755 754 753 751 747 742 737 729
10-14 663 690 716 740 758 764 765 762 757 751 751 751 750
15-19 574 586 599 616 636 659 685 712 736 754 760 761 759
20-24 534 539 545 551 559 569 581 594 611 631 655 681 707
25-29 482 493 504 513 521 528 534 539 546 554 564 576 589
30-34 410 426 440 452 464 476 487 498 508 516 523 529 534
35-39 295 317 342 365 387 405 420 434 447 459 471 482 493
40-44 231 238 246 257 271 290 312 336 360 381 399 415 428
45-49 188 194 202 211 219 226 233 241 251 266 284 306 330
50-54 187 185 182 179 179 183 189 197 205 213 220 227 235
55-59 143 154 165 173 178 180 178 175 172 173 176 182 190
60-64 105 109 114 119 126 135 145 156 164 169 170 169 166
65+ 206 210 216 222 230 238 246 256 267 280 296 313 331
5 555 5 677 5 799 5 920 6 040 6 158 6 275 6 389 6 505 6 623 6 743 6 864 6 987
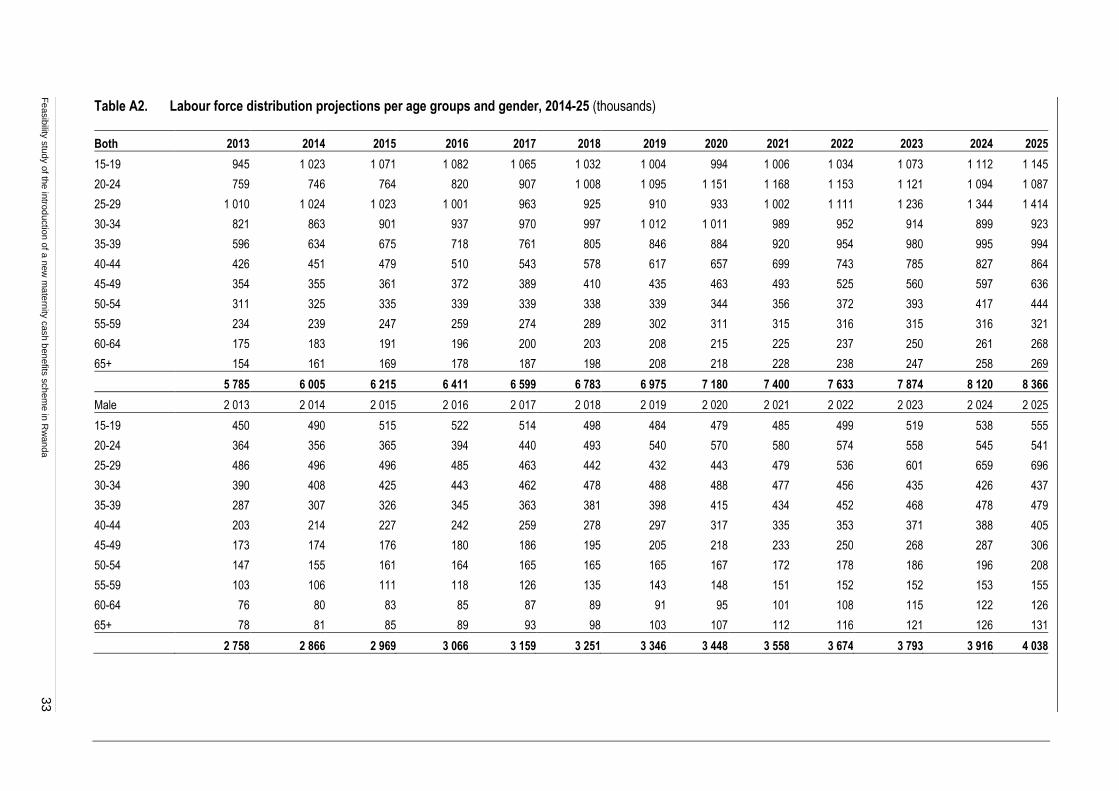
Fe
asib
ility s
tudy o
f the in
trod
uctio
n o
f a n
ew
ma
tern
ity c
ash b
en
efits
sch
em
e in
Rw
an
da
33
Table A2. Labour force distribution projections per age groups and gender, 2014-25 (thousands)
Both 2013 2014 2015 2016 2017 2018 2019 2020 2021 2022 2023 2024 2025
15-19 945 1 023 1 071 1 082 1 065 1 032 1 004 994 1 006 1 034 1 073 1 112 1 145
20-24 759 746 764 820 907 1 008 1 095 1 151 1 168 1 153 1 121 1 094 1 087
25-29 1 010 1 024 1 023 1 001 963 925 910 933 1 002 1 111 1 236 1 344 1 414
30-34 821 863 901 937 970 997 1 012 1 011 989 952 914 899 923
35-39 596 634 675 718 761 805 846 884 920 954 980 995 994
40-44 426 451 479 510 543 578 617 657 699 743 785 827 864
45-49 354 355 361 372 389 410 435 463 493 525 560 597 636
50-54 311 325 335 339 339 338 339 344 356 372 393 417 444
55-59 234 239 247 259 274 289 302 311 315 316 315 316 321
60-64 175 183 191 196 200 203 208 215 225 237 250 261 268
65+ 154 161 169 178 187 198 208 218 228 238 247 258 269
5 785 6 005 6 215 6 411 6 599 6 783 6 975 7 180 7 400 7 633 7 874 8 120 8 366
Male 2 013 2 014 2 015 2 016 2 017 2 018 2 019 2 020 2 021 2 022 2 023 2 024 2 025
15-19 450 490 515 522 514 498 484 479 485 499 519 538 555
20-24 364 356 365 394 440 493 540 570 580 574 558 545 541
25-29 486 496 496 485 463 442 432 443 479 536 601 659 696
30-34 390 408 425 443 462 478 488 488 477 456 435 426 437
35-39 287 307 326 345 363 381 398 415 434 452 468 478 479
40-44 203 214 227 242 259 278 297 317 335 353 371 388 405
45-49 173 174 176 180 186 195 205 218 233 250 268 287 306
50-54 147 155 161 164 165 165 165 167 172 178 186 196 208
55-59 103 106 111 118 126 135 143 148 151 152 152 153 155
60-64 76 80 83 85 87 89 91 95 101 108 115 122 126
65+ 78 81 85 89 93 98 103 107 112 116 121 126 131
2 758 2 866 2 969 3 066 3 159 3 251 3 346 3 448 3 558 3 674 3 793 3 916 4 038

34
F
easib
ility s
tudy o
f the in
trod
uctio
n o
f a n
ew
ma
tern
ity c
ash b
en
efits
sch
em
e in
Rw
an
da
Both 2013 2014 2015 2016 2017 2018 2019 2020 2021 2022 2023 2024 2025
Female 2 013 2 014 2 015 2 016 2 017 2 018 2 019 2 020 2 021 2 022 2 023 2 024 2 025
15-19 495 533 555 560 551 534 520 514 520 535 554 574 590
20-24 395 390 399 426 467 514 555 581 587 579 563 550 546
25-29 524 529 527 517 500 483 477 489 523 575 635 686 718
30-34 431 455 476 494 509 519 524 523 513 496 479 474 486
35-39 309 327 349 372 398 424 448 469 487 501 512 517 516
40-44 223 237 253 268 284 301 319 340 364 389 415 439 459
45-49 181 181 185 192 202 215 230 245 260 275 292 310 331
50-54 165 170 174 175 174 173 174 177 184 194 207 221 236
55-59 130 133 136 141 148 154 159 163 164 163 162 163 166
60-64 98 104 108 111 113 115 117 120 124 129 135 139 142
65+ 76 80 84 89 94 100 106 111 116 122 127 132 138
3 027 3 139 3 246 3 345 3 440 3 532 3 629 3 732 3 842 3 959 4 081 4 205 4 328

Fe
asib
ility s
tudy o
f the in
trod
uctio
n o
f a n
ew
ma
tern
ity c
ash b
en
efits
sch
em
e in
Rw
an
da
35
Table A3. Labour force participation rate distribution projections per age groups and gender, 2014-25
Both 2013 2014 2015 2016 2017 2018 2019 2020 2021 2022 2023 2024 2025
15-19 69.9 69.6 69.4 69.1 68.8 68.6 68.3 68.0 67.8 67.5 67.2 67.0 66.7
20-24 76.1 76.1 76.0 76.0 76.0 75.9 75.9 75.8 75.8 75.8 75.7 75.7 75.6
25-29 95.1 95.1 95.1 95.0 95.0 95.0 95.0 95.0 95.0 94.9 94.9 94.9 94.9
30-34 96.1 96.1 96.1 96.1 96.1 96.0 96.0 96.0 96.0 96.0 95.9 95.9 95.9
35-39 96.7 96.6 96.6 96.6 96.6 96.5 96.5 96.5 96.4 96.4 96.4 96.4 96.3
40-44 96.7 96.7 96.7 96.7 96.6 96.6 96.6 96.6 96.5 96.5 96.5 96.5 96.4
45-49 96.5 96.4 96.4 96.4 96.3 96.3 96.3 96.2 96.2 96.2 96.1 96.1 96.1
50-54 95.8 95.8 95.8 95.8 95.8 95.7 95.7 95.7 95.7 95.7 95.6 95.6 95.6
55-59 93.9 93.9 93.9 93.8 93.8 93.8 93.8 93.7 93.7 93.7 93.7 93.6 93.6
60-64 89.2 89.0 88.7 88.5 88.2 88.0 87.7 87.5 87.2 87.0 86.7 86.5 86.2
65+ 55.0 54.7 54.3 54.0 53.6 53.2 52.9 52.5 52.2 51.8 51.5 51.2 50.8
85.8 85.7 85.5 85.4 85.2 85.2 85.1 85.0 85.0 85.0 85.0 85.0 85.0
Male
15-19 67.6 67.4 67.2 67.0 66.7 66.5 66.2 66.0 65.8 65.6 65.3 65.1 64.9
20-24 75.7 75.8 75.8 75.8 75.9 75.9 75.9 76.0 76.0 76.0 76.1 76.1 76.1
25-29 94.8 94.8 94.8 94.8 94.8 94.8 94.8 94.8 94.8 94.8 94.8 94.8 94.8
30-34 95.8 95.8 95.8 95.8 95.8 95.8 95.8 95.8 95.8 95.8 95.8 95.8 95.8
35-39 96.2 96.2 96.2 96.2 96.2 96.2 96.2 96.2 96.2 96.2 96.2 96.2 96.2
40-44 96.3 96.3 96.3 96.3 96.3 96.3 96.3 96.3 96.3 96.3 96.3 96.3 96.3
45-49 95.9 95.9 95.9 95.9 95.9 95.9 95.9 95.9 95.9 95.9 95.9 95.9 95.9
50-54 95.5 95.5 95.5 95.5 95.5 95.5 95.5 95.5 95.5 95.5 95.5 95.5 95.5
55-59 93.5 93.5 93.5 93.5 93.5 93.5 93.5 93.5 93.5 93.5 93.5 93.5 93.5
60-64 88.3 88.1 87.9 87.7 87.5 87.3 87.1 86.9 86.7 86.5 86.4 86.2 86.0
65+ 61.5 61.2 60.9 60.6 60.2 59.9 59.6 59.2 58.9 58.6 58.3 58.0 57.6
85.3 85.1 85.0 84.9 84.8 84.8 84.8 84.8 84.9 84.9 85.0 85.0 85.0

36
F
easib
ility s
tudy o
f the in
trod
uctio
n o
f a n
ew
ma
tern
ity c
ash b
en
efits
sch
em
e in
Rw
an
da
Both 2013 2014 2015 2016 2017 2018 2019 2020 2021 2022 2023 2024 2025
Female
15-19 72.1 71.8 71.5 71.2 70.9 70.6 70.3 70.0 69.7 69.4 69.1 68.8 68.5
20-24 76.5 76.4 76.3 76.2 76.0 75.9 75.8 75.7 75.6 75.5 75.4 75.3 75.2
25-29 95.4 95.4 95.3 95.3 95.2 95.2 95.2 95.2 95.1 95.1 95.0 95.0 95.0
30-34 96.5 96.4 96.4 96.4 96.3 96.3 96.2 96.2 96.2 96.1 96.1 96.0 96.0
35-39 97.0 97.0 97.0 96.9 96.8 96.8 96.8 96.7 96.6 96.6 96.6 96.5 96.4
40-44 97.2 97.1 97.1 97.0 97.0 96.9 96.9 96.8 96.8 96.7 96.7 96.6 96.6
45-49 97.0 96.9 96.9 96.8 96.7 96.7 96.6 96.5 96.5 96.4 96.4 96.3 96.2
50-54 96.2 96.2 96.1 96.1 96.0 96.0 95.9 95.9 95.9 95.8 95.8 95.7 95.7
55-59 94.2 94.2 94.1 94.1 94.0 94.0 94.0 93.9 93.9 93.8 93.8 93.8 93.7
60-64 90.0 89.7 89.4 89.1 88.8 88.5 88.2 87.9 87.6 87.3 87.0 86.8 86.5
65+ 49.7 49.4 49.0 48.7 48.4 48.0 47.7 47.4 47.0 46.7 46.4 46.0 45.7
86.4 86.2 86.0 85.8 85.6 85.5 85.3 85.2 85.2 85.1 85.1 85.0 85.0

Fe
asib
ility s
tudy o
f the in
trod
uctio
n o
f a n
ew
ma
tern
ity c
ash b
en
efits
sch
em
e in
Rw
an
da
37
Table A4. Projections of the population actively contributing to the maternity scheme in the private sector per age groups and gender, 2014-25
Both 2013 2014 2015 2016 2017 2018 2019 2020 2021 2022 2023 2024 2025
15-19 4 192 4 543 4 761 4 815 4 739 4 593 4 466 4 420 4 474 4 602 4 776 4 952 5 098
20-24 27 288 26 782 27 439 29 515 32 773 36 521 39 782 41 877 42 529 42 019 40 871 39 887 39 632
25-29 46 502 47 254 47 234 46 185 44 320 42 438 41 649 42 698 46 008 51 181 57 138 62 332 65 673
30-34 39 258 41 133 42 908 44 683 46 419 47 873 48 697 48 703 47 619 45 678 43 715 42 901 44 009
35-39 25 910 27 633 29 401 31 188 32 967 34 718 36 407 38 013 39 611 41 176 42 483 43 226 43 240
40-44 19 683 20 791 22 062 23 505 25 107 26 836 28 662 30 530 32 409 34 290 36 125 37 913 39 612
45-49 14 656 14 681 14 890 15 312 15 922 16 716 17 678 18 776 20 025 21 406 22 901 24 474 26 084
50-54 11 582 12 176 12 589 12 801 12 843 12 811 12 849 13 040 13 412 13 951 14 651 15 496 16 475
55-59 6 114 6 285 6 542 6 909 7 363 7 847 8 270 8 570 8 725 8 763 8 754 8 783 8 919
60-64 2 482 2 598 2 697 2 773 2 828 2 881 2 958 3 079 3 250 3 465 3 689 3 885 4 022
197 666 203 875 210 524 217 685 225 279 233 235 241 418 249 706 258 061 266 529 275 104 283 851 292 765
Male
15-19 2 525 2 750 2 891 2 928 2 884 2 794 2 716 2 688 2 721 2 801 2 909 3 019 3 110
20-24 17 991 17 605 18 045 19 490 21 776 24 414 26 719 28 214 28 703 28 382 27 610 26 947 26 784
25-29 32 285 32 909 32 936 32 165 30 765 29 331 28 693 29 417 31 807 35 571 39 920 43 724 46 180
30-34 28 498 29 768 31 025 32 361 33 727 34 917 35 618 35 662 34 830 33 310 31 755 31 076 31 879
35-39 18 759 20 047 21 322 22 557 23 740 24 890 26 021 27 145 28 335 29 557 30 616 31 244 31 290
40-44 14 366 15 123 16 029 17 105 18 329 19 660 21 040 22 406 23 722 24 996 26 220 27 437 28 647
45-49 10 781 10 800 10 937 11 204 11 590 12 106 12 759 13 536 14 462 15 513 16 657 17 838 19 007
50-54 8 821 9 321 9 677 9 869 9 923 9 911 9 941 10 074 10 327 10 694 11 182 11 790 12 525
55-59 4 977 5 126 5 353 5 676 6 075 6 504 6 880 7 150 7 294 7 338 7 338 7 362 7 468
60-64 2 103 2 200 2 282 2 346 2 392 2 439 2 508 2 618 2 772 2 968 3 171 3 350 3 477
141 107 145 650 150 496 155 702 161 201 166 966 172 896 178 909 184 974 191 130 197 378 203 787 210 367

38
F
easib
ility s
tudy o
f the in
trod
uctio
n o
f a n
ew
ma
tern
ity c
ash b
en
efits
sch
em
e in
Rw
an
da
Both 2013 2014 2015 2016 2017 2018 2019 2020 2021 2022 2023 2024 2025
Female
15-19 1 667 1 793 1 870 1 887 1 855 1 799 1 750 1 732 1 752 1 801 1 867 1 933 1 988
20-24 9 297 9 177 9 394 10 024 10 996 12 107 13 063 13 663 13 826 13 637 13 261 12 941 12 849
25-29 14 217 14 345 14 299 14 019 13 555 13 107 12 955 13 281 14 201 15 609 17 219 18 608 19 493
30-34 10 760 11 364 11 883 12 322 12 692 12 956 13 079 13 041 12 789 12 367 11 961 11 826 12 130
35-39 7 150 7 586 8 080 8 631 9 227 9 827 10 386 10 868 11 276 11 619 11 867 11 983 11 950
40-44 5 317 5 668 6 033 6 400 6 778 7 176 7 623 8 124 8 688 9 294 9 905 10 476 10 965
45-49 3 874 3 881 3 954 4 108 4 332 4 611 4 919 5 240 5 563 5 893 6 244 6 636 7 077
50-54 2 760 2 854 2 913 2 931 2 920 2 899 2 908 2 967 3 086 3 256 3 469 3 706 3 950
55-59 1 137 1 159 1 189 1 233 1 287 1 343 1 390 1 420 1 430 1 425 1 416 1 421 1 451
60-64 378 398 415 427 436 442 450 461 477 497 518 535 545
56 559 58 225 60 028 61 983 64 078 66 268 68 522 70 797 73 087 75 399 77 726 80 064 82 398

Fe
asib
ility s
tudy o
f the in
trod
uctio
n o
f a n
ew
ma
tern
ity c
ash b
en
efits
sch
em
e in
Rw
an
da
39
Table A5. Projection of the population actively contributing to the maternity scheme in the public sector per age groups and gender, 2014-25
Both 2013 2014 2015 2016 2017 2018 2019 2020 2021 2022 2023 2024 2025
15-19 375 407 427 432 425 412 400 396 401 412 428 444 457
20-24 12 272 12 038 12 334 13 278 14 761 16 468 17 955 18 911 19 212 18 985 18 466 18 022 17 908
25-29 37 436 38 028 38 007 37 168 35 680 34 182 33 558 34 403 37 056 41 198 45 966 50 122 52 794
30-34 36 604 38 386 40 054 41 691 43 268 44 574 45 302 45 293 44 299 42 532 40 752 40 027 41 060
35-39 26 802 28 579 30 409 32 266 34 120 35 948 37 708 39 375 41 023 42 630 43 966 44 723 44 732
40-44 17 915 18 925 20 082 21 396 22 852 24 424 26 086 27 785 29 497 31 211 32 884 34 513 36 061
45-49 9 618 9 635 9 774 10 054 10 460 10 987 11 622 12 346 13 165 14 068 15 046 16 076 17 134
50-54 4 877 5 119 5 287 5 371 5 385 5 369 5 385 5 468 5 630 5 863 6 166 6 527 6 942
55-59 2 798 2 873 2 984 3 143 3 339 3 548 3 730 3 857 3 921 3 934 3 927 3 941 4 004
60-64 1 288 1 349 1 401 1 441 1 469 1 496 1 535 1 594 1 679 1 785 1 896 1 992 2 059
149 986 155 339 160 759 166 237 171 760 177 407 183 280 189 429 195 883 202 618 209 498 216 388 223 151
Male 2 013 2 014 2 015 2 016 2 017 2 018 2 019 2 020 2 021 2 022 2 023 2 024 2 025
15-19 248 270 284 288 283 274 267 264 267 275 286 297 305
20-24 8 883 8 692 8 910 9 623 10 752 12 054 13 193 13 930 14 172 14 013 13 632 13 305 13 224
25-29 24 712 25 190 25 210 24 621 23 548 22 451 21 963 22 517 24 346 27 227 30 556 33 468 35 348
30-34 23 588 24 640 25 680 26 786 27 916 28 902 29 482 29 518 28 829 27 572 26 284 25 722 26 387
35-39 18 688 19 970 21 240 22 471 23 649 24 795 25 922 27 042 28 227 29 445 30 499 31 124 31 170
40-44 12 988 13 672 14 491 15 464 16 570 17 773 19 021 20 256 21 446 22 597 23 704 24 804 25 898
45-49 6 835 6 847 6 934 7 103 7 348 7 675 8 089 8 582 9 169 9 835 10 560 11 309 12 050
50-54 3 367 3 558 3 693 3 767 3 787 3 783 3 794 3 845 3 941 4 082 4 268 4 500 4 780
55-59 1 932 1 990 2 078 2 203 2 358 2 525 2 671 2 775 2 831 2 848 2 848 2 858 2 899
60-64 957 1 001 1 039 1 068 1 089 1 110 1 141 1 192 1 262 1 351 1 443 1 525 1 583
102 197 105 830 109 558 113 392 117 302 121 342 125 542 129 920 134 491 139 245 144 081 148 911 153 645

40
F
easib
ility s
tudy o
f the in
trod
uctio
n o
f a n
ew
ma
tern
ity c
ash b
en
efits
sch
em
e in
Rw
an
da
Both 2013 2014 2015 2016 2017 2018 2019 2020 2021 2022 2023 2024 2025
Female
15-19 127 137 143 144 142 137 133 132 134 137 142 147 152
20-24 3 389 3 345 3 424 3 654 4 009 4 414 4 762 4 981 5 040 4 971 4 834 4,717 4 684
25-29 12 724 12 839 12 797 12 547 12 132 11 731 11 595 11 886 12 710 13 970 15 411 16,654 17 446
30-34 13 016 13 746 14 374 14 905 15 352 15 672 15 820 15 775 15 470 14 960 14 468 14,305 14 673
35-39 8 114 8 609 9 169 9 795 10 471 11 152 11 786 12 333 12 796 13 186 13 467 13,598 13 562
40-44 4 928 5 253 5 591 5 932 6 282 6 651 7 065 7 530 8 052 8 614 9 180 9,709 10 163
45-49 2 783 2 788 2 840 2 951 3 112 3 312 3 534 3 764 3 996 4 233 4 485 4,767 5 084
50-54 1 510 1 562 1 594 1 604 1 597 1 586 1 591 1 623 1 688 1 782 1 898 2,027 2 161
55-59 866 883 906 939 981 1 023 1 059 1 082 1 090 1 086 1 079 1,083 1 106
60-64 331 348 362 373 381 386 393 403 417 434 452 467 476
47 789 49 509 51 201 52 845 54 458 56 065 57 739 59 509 61 393 63 373 65 417 67 476 69 506
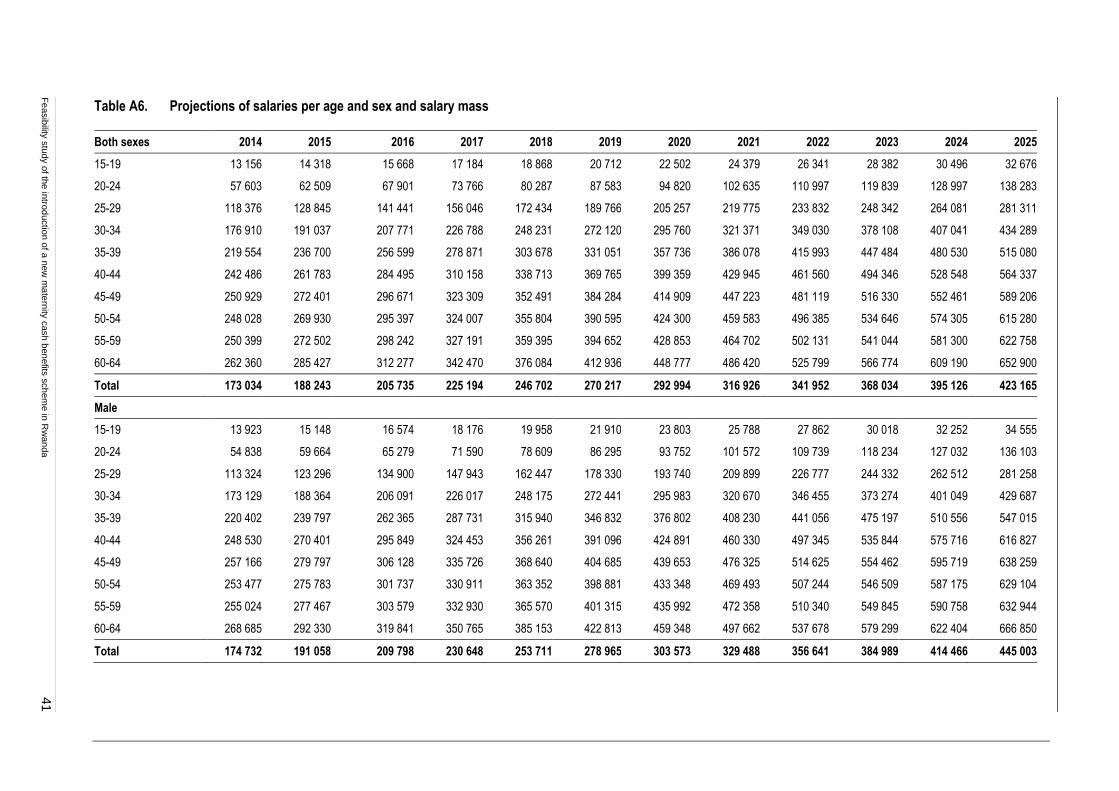
Fe
asib
ility s
tudy o
f the in
trod
uctio
n o
f a n
ew
ma
tern
ity c
ash b
en
efits
sch
em
e in
Rw
an
da
41
Table A6. Projections of salaries per age and sex and salary mass
Both sexes 2014 2015 2016 2017 2018 2019 2020 2021 2022 2023 2024 2025
15-19 13 156 14 318 15 668 17 184 18 868 20 712 22 502 24 379 26 341 28 382 30 496 32 676
20-24 57 603 62 509 67 901 73 766 80 287 87 583 94 820 102 635 110 997 119 839 128 997 138 283
25-29 118 376 128 845 141 441 156 046 172 434 189 766 205 257 219 775 233 832 248 342 264 081 281 311
30-34 176 910 191 037 207 771 226 788 248 231 272 120 295 760 321 371 349 030 378 108 407 041 434 289
35-39 219 554 236 700 256 599 278 871 303 678 331 051 357 736 386 078 415 993 447 484 480 530 515 080
40-44 242 486 261 783 284 495 310 158 338 713 369 765 399 359 429 945 461 560 494 346 528 548 564 337
45-49 250 929 272 401 296 671 323 309 352 491 384 284 414 909 447 223 481 119 516 330 552 461 589 206
50-54 248 028 269 930 295 397 324 007 355 804 390 595 424 300 459 583 496 385 534 646 574 305 615 280
55-59 250 399 272 502 298 242 327 191 359 395 394 652 428 853 464 702 502 131 541 044 581 300 622 758
60-64 262 360 285 427 312 277 342 470 376 084 412 936 448 777 486 420 525 799 566 774 609 190 652 900
Total 173 034 188 243 205 735 225 194 246 702 270 217 292 994 316 926 341 952 368 034 395 126 423 165
Male
15-19 13 923 15 148 16 574 18 176 19 958 21 910 23 803 25 788 27 862 30 018 32 252 34 555
20-24 54 838 59 664 65 279 71 590 78 609 86 295 93 752 101 572 109 739 118 234 127 032 136 103
25-29 113 324 123 296 134 900 147 943 162 447 178 330 193 740 209 899 226 777 244 332 262 512 281 258
30-34 173 129 188 364 206 091 226 017 248 175 272 441 295 983 320 670 346 455 373 274 401 049 429 687
35-39 220 402 239 797 262 365 287 731 315 940 346 832 376 802 408 230 441 056 475 197 510 556 547 015
40-44 248 530 270 401 295 849 324 453 356 261 391 096 424 891 460 330 497 345 535 844 575 716 616 827
45-49 257 166 279 797 306 128 335 726 368 640 404 685 439 653 476 325 514 625 554 462 595 719 638 259
50-54 253 477 275 783 301 737 330 911 363 352 398 881 433 348 469 493 507 244 546 509 587 175 629 104
55-59 255 024 277 467 303 579 332 930 365 570 401 315 435 992 472 358 510 340 549 845 590 758 632 944
60-64 268 685 292 330 319 841 350 765 385 153 422 813 459 348 497 662 537 678 579 299 622 404 666 850
Total 174 732 191 058 209 798 230 648 253 711 278 965 303 573 329 488 356 641 384 989 414 466 445 003

42
F
easib
ility s
tudy o
f the in
trod
uctio
n o
f a n
ew
ma
tern
ity c
ash b
en
efits
sch
em
e in
Rw
an
da
Both sexes 2014 2015 2016 2017 2018 2019 2020 2021 2022 2023 2024 2025
Female
15-19 11 957 13 009 14,233 15,609 17 140 18 816 20 441 22 146 23 927 25 779 27 698 29 676
20-24 63 411 68 492 73,480 78,482 83 991 90 466 97 233 105 052 113 864 123 499 13 477 143 259
25-29 129 175 140 752 155,422 173,181 193 256 213 360 229 023 240 380 248 809 257 003 26 515 281 429
30-34 185 103 196 810 211,419 228,482 248 355 271 395 295 257 322 951 354 766 388 724 420 067 444 292
35-39 217 460 229 055 242,509 257,554 274 638 294 081 313 209 334 027 356 378 380 627 407 325 436 896
40-44 226 548 239 153 254,510 271,958 291 209 311 582 329 776 347 957 366 456 385 795 406 467 428 822
45-49 234 426 252 949 272,142 291,724 312 172 333 966 354 130 375 284 397 247 419 600 441 882 463 923
50-54 232 136 252 565 276,334 303,051 332 761 365 298 396 863 429 965 464 538 500 498 537 740 576 139
55-59 234 280 254 897 278,885 305,849 335 834 368 671 400 528 433 936 468 828 505 120 542 705 581 459
60-64 235 234 255 935 280,021 307,095 337 202 370 173 402 159 435 703 470 737 507 177 544 915 583 827
Total 169 070 181 662 196,213 212,380 230 184 249 540 267 919 287 085 306 981 327 590 348 892 370 833
Annual Salary Mass (Billions) 746 839 948 1,073 1 216 1 377 1 544 1 726 1 925 2 140 2 372 2 620
Male 527 596 677 771 878 999 1 125 1 263 1 414 1 577 1 754 1 944
Female 219 242 270 302 338 378 419 463 511 563 618 676
Source: RSSB data and own calculations.
Notes: Monthly salaries.

Feasibility study of the introduction of a new maternity cash benefits scheme in Rwanda 43
Table A7. Economic variables and salary growth
Year Employment (thousands)
GDP, constant prices (RWF
billions)
GDP growth Productivity per capita
Productivity growth
Inflation Salary growth
2012 4 152.7 2 733.7 658 287.1
2013 4 317.9 2 870.4 5.0% 664 763.6 0.98% 4.22% 5.25%
2014 4 482.3 3 085.6 7.5% 688 407.9 3.56% 4.07% 7.78%
2015 4 639.1 3 317.1 7.5% 715 025.0 3.87% 4.75% 8.80%
2016 4 785.9 3 565.8 7.5% 745 062.7 4.20% 5.00% 9.41%
2017 4 925.9 3 833.3 7.5% 778 189.0 4.45% 5.00% 9.67%
2018 5 063.7 4 120.8 7.5% 813 791.4 4.58% 5.00% 9.80%
2019 5 206.5 4 429.8 7.5% 850 822.3 4.55% 5.00% 9.78%
Table A8. Projected number of new births from population covered by the maternity scheme, 2014-25
Number of new births from covered female workers
2014 2015 2016 2017 2018 2019 2020 2021 2022 2023 2024 2025
15-19 177 195 206 209 207 204 203 206 211 219 227 233
20-24 2 193 2 305 2 514 2 803 3 123 3 395 3 562 3 604 3 555 3 457 3 374 3 350
25-29 4 953 4 955 4 871 4 718 4 567 4 516 4 631 4 952 5 443 6 004 6 489 6 797
30-34 2 892 2 894 2 884 2 873 2 856 2 830 2 795 2 741 2 650 2 563 2 534 2 600
35-39 1 263 1 208 1 165 1 136 1 122 1 123 1 142 1 185 1 221 1 247 1 259 1 255
40-44 369 326 285 250 224 208 206 220 236 251 266 278
45-49 48 35 25 16 9 3 1 1 1 1 1 1
Total 11 896 11 918 11 949 12 005 12 107 12 280 12 540 12 908 13 317 13 742 14 149 14 514
Notes: Own calculations from the projected fertility rates and insured female members