Embed Size (px)
Citation preview


EEEEEmplomplomplomplomployment and poyment and poyment and poyment and poyment and povvvvverererererty in rty in rty in rty in rty in rural Iural Iural Iural Iural India:ndia:ndia:ndia:ndia:Which way to go noWhich way to go noWhich way to go noWhich way to go noWhich way to go now?w?w?w?w?
G.K. Chadha ([email protected]) is a Member of the Economic Advisory Council of thePrime Minister of India and is also the Chief Executive Officer of the South Asian University beingestablished in Delhi under the auspices of the 8 SAARC Countries. He had been conferred the titleof Professor Emeritus at Jawaharlal Nehru University, New Delhi (from where he retired as Vice-Chancellor, in 2005). He holds a PhD. in Economics from Panjab University. He has written 16books besides contributing 90 research papers to national and international research journals onvarious development issues relating to India and other developing countries of Asia, notably Indonesiaand China. He is currently an Honorary Professor at Shenzhen University, China and Nihon FukushiUniversity, Nagoya-Japan and is also a member of the International Advisory Board of the Centrefor Development Research, Colombo. He was a Visiting Fellow at Institute of Development Studies,University of Sussex, England, a Visiting Research Fellow at Institute of Developing Economies,Tokyo, and a Visiting Professor at University of Mauritius. Prof. Chadha has been a Consultant toseveral international development organizations including agencies such as FAO, ILO, UNCTAD,ESCAP, etc. besides serving on numerous other international and national expert committees. Hehas recently been elected as the President of the Indian Economic Association and has also beenthe President of the Indian Society of Agricultural Economics as well the Indian Society of LabourEconomics. He has been honoured with numerous awards and distinctions for his contribution inthe field of education, the latest being the D.Litt Degree (honoris causa) conferred by PanjabUniversity, Chandigarh.
The responsibility for the opinions expressed in this paper rests solely with the author and publication doesnot constitute an endorsement by the International Labour Office of the opinions expressed in this paper, orof any products, processes or geographical designations mentioned in it.
G. K. ChadhaG. K. ChadhaG. K. ChadhaG. K. ChadhaG. K. Chadha

Copyright © International Labour Organization 2008First published 2008
Publications of the International Labour Office enjoy copyright under Protocol 2 of the UniversalCopyright Convention. Nevertheless, short excerpts from them may be reproduced without authorization,on condition that the source is indicated. For rights of reproduction or translation, application shouldbe made to the ILO Publications (Rights and Permissions), International Labour Office, CH-1211 Geneva22, Switzerland or by email: [email protected]. The International Labour Office welcomes such applications.
Libraries, institutions and other users registered in the United Kingdom with the Copyright LicensingAgency, 90 Tottenham Court Road, London W1T 4LP [Fax: (+44) (0)20 7631 5500; email: [email protected]],in the United States with the Copyright Clearance Center, 222 Rosewood Drive, Danvers, MA 01923(Fax: (+1) (978) 750 4470; email: [email protected]] or in other countries with associated ReproductionRights Organizations, may make photocopies in accordance with the licences issued to them for thispurpose.
EEEEEmplomplomplomplomployment and poyment and poyment and poyment and poyment and povvvvverererererty in rty in rty in rty in rty in rural Iural Iural Iural Iural India: ndia: ndia: ndia: ndia: Which way to go noWhich way to go noWhich way to go noWhich way to go noWhich way to go now?w?w?w?w?Subregional Office New Delhi 2008
ISBN: 978-92-2-121675-9 (print)ISBN: 978-92-2-121676-6 (web pdf )
The designations employed in ILO publications, which are in conformity with United Nations practice,and the presentation of material therein do not imply the expression of any opinion whatsoever on thepart of the International Labour Office concerning the legal status of any country, area or territory or ofits authorities, or concerning the delimitation of its frontiers.
The responsibility for opinions expressed in signed articles, studies and other contributions rests solely withtheir authors, and publication does not constitute an endorsement by the International Labour Office ofthe opinions expressed in them.
Reference to names of firms and commercial products and processes does not imply their endorsementby the International Labour Office, and any failure to mention a particular firm, commercial product orprocess is not a sign of disapproval.
ILO publications can be obtained through major booksellers or ILO Subregional Office for South Asia,India Habitat Center, Theatre Court Road, 3rd Floor, Lodi Road, New Delhi-110 003. Catalogues or listsof new publications are available free of charges from the above address, or by email: [email protected].
Visit our website: www.ilo.org/publns, or www.ilo.org/india
Printed in India

EEEEExxxxxecutivecutivecutivecutivecutive Se Se Se Se SummarummarummarummarummaryyyyyThe paper "Employment and poverty in rural India: Which way to go now?" explores the cause andchallenges of poverty, amongst rural masses in India. It goes on to establish the relation between ruralpoverty and various efforts to increase employment in rural India. Though recently there has been adecline in estimates of population below the poverty line, the absolute number of rural poor is still veryhigh with agricultural labour households facing the worst brunt of poverty. The paper assesses thecontribution of farm and non-farm sector in reducing poverty across the rural population. The paperalso explores the role played by the National Rural Employment Guarantee Programme (NREGP) tohelp the rural poor at the level at which poverty is most virulent.
The paper suggests that there is tremendous scope, at the policy and implementation level, to improverural employment and reduce poverty in India. Since agriculture and allied activities are still the mainstayof the rural people and will continue to be so in the near future, productivity improvement in this sectormust be looked at as a far more decisive instrument to reduce poverty amongst the rural poor. Efficientmanagement of natural resources and adoption of precision farming practices can facilitate theimprovement of productivity. There is also an urgent need to improve the scope of non-agriculturalemployment in the rural areas, improved physical infrastructure and human capital base can pave theway for success.
iii


FFFFForororororeeeeeworworworworwordddddThe problem of rural poverty poses a serious challenge for our policy makers. In this paper, the authoranalyses the incidence of poverty in India both in the pre and post reform period and delves into theprofile of poverty spread and examines the state level effectiveness of poverty alleviation programs. Hecompares the performance of the 17 major states of India and sheds light on the factors that have ledcertain states to attain considerable progress in poverty reduction, where others have failed. Whileexploring the characteristic features of poverty, this paper establishes the relationship between the growthof employment and the reduction in poverty in rural India. The direct measures enacted by thegovernment like the NREGA is critically examined in terms of their efficacy and impact on rural poverty.
This paper clearly shows that a lot can still be done to accelerate the alleviation of rural poverty andthe major suggestions offered include a greater focus on the diversification of rural employmentopportunities yet identifying agriculture as the epicenter of rural employment. There is a need to increaseagricultural GDP and improvement of production technologies therein. Emphasis should be laid onincreasing the productivity in the crop sector and also in the non-crop sector. Public investment andbetter implementation of the NREGA along with reducing the dependence on rains by focusing on dryland agriculture are important guidelines for the policy makers. Nonfarm employment creation is animportant tool in handling rural poverty. Manufacturing industry in rural India shows great promisein terms of employment generation and poverty alleviation. It is of extreme importance that we identifythe potential of textile and garment export and related industry. Thus poverty alleviation can be bifurcatedinto farm and nonfarm measures, both of which offer a wide range of possible improvements that needto be undertaken in order to reduce the incidence of poverty that currently affects more than two thirdsof rural India.
This paper is part of a series of studies that have been launched by the ILO, Delhi Office, coordinatedby Sukti Dasgupta, Employment and Labour Market Policies Specialist, to analyze and understand thecurrent employment challenges in India.
Leyla Leyla Leyla Leyla Leyla TTTTTegmo-Regmo-Regmo-Regmo-Regmo-ReddyeddyeddyeddyeddyDirector and ILO Representative in India
Sub Regional Office for South Asia, New DelhiInternational Labour Organization
v


TTTTTable of Contentsable of Contentsable of Contentsable of Contentsable of Contents
1. Rural Poverty 1
2. Employment - Poverty Linkages 5
3. National Rural Employment Guarantee Programme: Looking Back and Forth 11
4. Looking Ahead, with Optimism 17
vii


1ILO Subregional Office for South Asia, New Delhi
1.1.1.1.1. RRRRRural Pural Pural Pural Pural Pooooovvvvvererererertytytytyty
Rural poverty poses the most serious concern to policy makers and public analysts in India forvarious reasons. First, more than 70 per cent of India's population still lives in the rural areas. Second,no fewer than three-fourths of the Indian poor live in villages. Third, in contrast to the numerous optionsopen to urban dwellers, poverty alleviation among the rural masses is relatively difficult, most ostensiblybecause of the not-so-easy-to-change occupational distribution. Four, the highly iniquitous agrarianstructure, on the one hand, and the relatively weak and biased functioning of public institutions, onthe other, make it that much more difficult to conquer rural poverty. Finally, the weaker and the poorersections of the rural society are confronted with caste and class divides and male-female disparities, inmany aspects of employment and work environment, especially in job changes from less productiveagricultural to more productive non-agricultural activities, almost on a day-to-day basis.
1.11.11.11.11.1 RRRRRural Pural Pural Pural Pural Pooooovvvvverererererty Pty Pty Pty Pty Prrrrrofileofileofileofileofile
Table 1 portrays the rural poverty profile for three points of time: 1983, 1993-94 and 2004-05. The figures show the usual head-count poverty estimates (Govt. of India, 2002). The changes between1983 and 1993-94 can be taken to reflect the realities of the eighties (the pre-reform period) while thosebetween 1993-94 and 2004-05 may be interpreted to reflect the post-reform picture. A number offeatures need to be underlined.
● At the national level, the number and the percentage of the rural people under poverty didwitness a noticeable decline, first between 1983 and 1993-94, and then again, between 1993-94 and 2004-05. For example, while during the 1983 to 1993-94 period, 7.9 million rural peoplesucceeded in freeing themselves from the clutches of poverty, a larger number — 11.9 million— did so during the 1993-94 to 2004-05 period. The decline was equally boldly discerniblein proportionate terms, from 45.7 per cent in 1983 to 37.3 per cent in 1993-94, and furtherdown to 28.3 per cent in 2004-05. In a broad sense, it is a fairly creditable national-levelachievement that is the result of a combination of growth processes and a set of povertyeradication initiatives expressly put in place since the late 1970s.
● In spite of this creditable national-level achievement, in 2004-05, the absolute number of therural poor was still as high as 232.2 million; the proportion too was high at 28.3 per cent. Inthe context of the global record of poverty alleviation, India has a middle-ranking position. Indiahas reasons to be happy with its record in reduction of rural poverty compared to many countriesin Africa and Latin America,. On the other hand, in relation to most developing countries inEast and North-East Asia, India's record is hardly flattering, particularly vis-à-vis China. In totalterms, India has still a long way to go in ridding itself of this human scourge.
It may be pointed out, in passing, that the Indian definition of poverty is rather mild, and the scourgewould appear more frightening if international yardsticks, say, per capita income of US $2 a day, wereinvoked for separating the poor from the non-poor. It is precisely in this sense that poverty alleviationstill remains a gigantic task for India; the lackadaisical performance in achieving the poverty reductiontarget under the Millennium Development Goals is reflective of genuine concerns.
● It is undoubtedly heartening to see that between 1983 and 2004-05, each of the 17 major statessucceeded in curtailing the proportion of rural people in poverty. It is equally uplifting to see

2 ILO Subregional Office for South Asia, New Delhi
that, barring Bihar, Madhya Pradesh, and Uttar Pradesh, the absolute number of the rural pooralso declined, by varying numbers, in each of the remaining 14 states. Nevertheless, in spiteof this widespread decline, the number of the rural poor is astoundingly high in some of thestates, understandably because the absolute size of their rural population in also very high. Bihar,Madhya Pradesh, Maharashtra, Orissa, Uttar Pradesh and West Bengal clearly fall in this category.
● The states where around one-third or more of rural population was still in poverty as late as2004-05 are Bihar, Madhya Pradesh, Maharashtra, Orissa, Uttar Pradesh and West Bengal; nofewer than 74.6 per cent of India's rural poor live in these six states alone. On the other hand,most other states succeeded, in varying degrees, in reducing the incidence of their rural poverty.For some, especially the four southern states of India, the decline in the proportion of the ruralpoor was highly impressive. In others like Punjab, Haryana, Jammu and Kashmir, HimachalPradesh and Kerala, rural poverty now appears as a marginal phenomenon - in 2004-05, theproportion of the rural poor in these states varied between 4.3 per cent in Jammu and Kashmirto 13.2 per cent in Haryana and Kerala.
TTTTTable 1 : Nable 1 : Nable 1 : Nable 1 : Nable 1 : Number (million) and perumber (million) and perumber (million) and perumber (million) and perumber (million) and percentage of rcentage of rcentage of rcentage of rcentage of rural personsural personsural personsural personsural personsbelobelobelobelobelow pow pow pow pow povvvvverererererty : 1983, 1993-94 and 2004-05ty : 1983, 1993-94 and 2004-05ty : 1983, 1993-94 and 2004-05ty : 1983, 1993-94 and 2004-05ty : 1983, 1993-94 and 2004-05
1983 1993-94 2004-05
State No. of % of State's No. of % of State's No. of % of State'sPersons Persons Share Persons Persons Share Persons Persons Share
(million) in the (million) in the (million) in thePoor Poor Poor
1 2 3 4 5 6 7 8 9 10
Andhra Pradesh 11.4 26.5 4.5 7.9 15.9 3.3 6.3 10.5 2.7Assam 7.3 42.6 2.9 9.4 45.0 3.9 5.7 22.1 2.5Bihar 41.8 64.4 16.6 45.1 58.2 18.5 45.3 42.6 19.5Gujarat 7.3 29.8 2.9 6.2 22.2 2.6 6.7 18.9 2.9Haryana 2.2 20.6 0.9 3.7 28.0 1.5 2.2 13.2 0.9Himachal Pradesh 0.7 17.0 0.3 1.5 30.3 0.6 0.7 10.5 0.3Jammu-Kashmir 1.3 26.0 0.5 1.9 30.3 0.8 0.4 4.3 0.2Karnataka 10.1 36.3 4.0 9.6 29.9 3.9 8.7 20.7 3.7Kerala 8.2 39.0 3.2 5.6 25.8 2.3 3.0 13.2 1.3Madhya Pradesh 21.5 48.9 8.6 21.6 40.6 8.9 25.1 36.8 10.8Maharashtra 19.4 45.2 7.7 19.3 37.9 7.9 18.0 29.6Orissa 16.5 67.5 6.5 14.1 49.7 5.8 15.8 46.9 6.8Punjab 1.7 13.2 0.7 1.8 12.0 0.7 1.6 9.0 0.7Rajasthan 9.7 33.5 3.8 9.5 26.5 3.9 9.1 18.3 3.9Tamil Nadu 18.2 54.0 7.2 12.2 32.5 5.0 7.8 23.0 3.4Uttar Pradesh 44.8 46.5 17.8 49.6 42.3 20.3 51.4 33.3 22.1West Bengal 26.9 63.1 10.7 21.0 40.8 8.6 17.6 28.4 7.6All India 252.0 45.7 2488.4 244.0 37.3 2400.4 232.2 28.3 2321.6
Source: 1. For 1983 and 1993-94, Govt. of India, National Human Development Report, 2001, PlanningCommission, March 2002.
2. For 2004-05, Dev. Mahendra and C. Ravi, "Poverty and Inequality: All-India and States, 1983-2005", Economic and Political Weekly, Vol. XLII, No. 6, January 10-16, 2007.

3ILO Subregional Office for South Asia, New Delhi
In total terms, it is fairly evident that rural poverty in India did decline during the twodecades beginning 1983, although the pace of decline did vary from state to state. It is also evidentthat, in spite of the decline, the proportion, as also the absolute number, of the rural poor continuesto be fairly high, most discernibly in the more populous states of Bihar, Madhya Pradesh, Maharashtra,Orissa, Uttar Pradesh and West Bengal. In terms of India's march against rural poverty, the statesstand broadly divided into three groups: one in which rural poverty has witnessed a fairly bigdecline, first during 1983 to 1993-94, and then during 1993-94 to 2004-05; second in whichthe decline has been of a moderate order, and the third group reporting low degree of decline.It is thus clear that the Indian experience of tackling rural poverty cannot be fathomed unlesswe look deeply into what has been going on in individual states. Temporally, we have a richconstellation of no fewer than 17 individual experiences which together can educate us about howsome states could do so well while others failed to do much. In other words, most of the factorsthat determine the level of rural poverty, notably the rate at which the local economy is growing,the pace and pattern of employment growth, the working of the rural labour markets, especiallyin terms of the behaviour of real wages, among others, must essentially be seen at the level ofindividual states.
1.21.21.21.21.2 PPPPPooooovvvvverererererty among Agricultural Hty among Agricultural Hty among Agricultural Hty among Agricultural Hty among Agricultural Householdsouseholdsouseholdsouseholdsouseholds
Any discussion on rural poverty must also look into the poverty status of households engagedin agriculture and allied activities, primarily because no fewer than 70 per cent of rural workersare still employed in this sector. Although non-agricultural employment and earnings do mattera lot in determining the poverty status of rural households, a high growth of agriculture, on asustained basis, provides the prime trigger for employment, earnings and poverty levels for suchhouseholds. However, the poverty profile of the two major segments of agricultural workers, namelycultivators and wage labourers, must be looked at separately, essentially because the nature andintensity of poverty among agricultural labour households is primarily determined by the functioningof rural labour markets while for the cultivators, it is the combination of productivity per hectare/worker and factor-product price ratios that matters the most. Table 2 gives the state-level picturefor the two categories of agricultural households for 1983, 1993-94 and 2004-05. A few pointsneed to be underlined.
First, as expected, the incidence of poverty is much higher among agricultural labourers,compared to cultivators. At the national level, 37 per cent of cultivators were poor in 1983 against60.4 per cent of agricultural labourers; in 1993, the two figures were 28.6 per cent and 47.7 percent and in 2004-05, these were 21.5 per cent and 46.4 per cent, respectively. It is thus clear thatthe most crushing burden of rural poverty in India is being borne by agricultural labour households.While the incidence of poverty is quite high even among the cultivating households, yet their break-up into various farm size categories would, most certainly, reveal that the most afflicted amongthem are sub-marginal and marginal farming households and to a lesser extent, the small cultivatinghouseholds which together constitute an overwhelming proportion of the cultivating households. Manyamong these households share the work and earning conditions commonly associated with agriculturallabour households, most markedly, the quantum of wage-paid employment and wage rates availableoutside their own farms.
4 ILO Subregional Office for South Asia, New Delhi
Second, the proportion of the rural poor witnessed varying degrees of decline in 2004-05 compared with 1993-94, in as many as 14 of the 17 states, both among the cultivators andagricultural labourers; in three states (Gujarat, Orissa and Madhya Pradesh), a mixed pattern wasin operation. In Gujarat, it increased slightly for agricultural labourers but remained unchangedfor cultivators; in Orissa, it witnessed a slight increase for both categories and, in Madhya Pradesh,it increased slightly for agricultural labourers but declined for cultivators.
In overall terms, it is fairly evident that, during the post-1993 period, the process of povertyalleviation succeeded more widely, and more intensely, in the case of cultivating households comparedwith agricultural labour households. The point of substance is that in a big majority of states,the proportion of the poor among agricultural labourers declined side by side with cultivatinghouseholds. Clearly, if the cultivating households were the beneficiaries of agricultural growth inall those states, so have been the wage-employed agricultural labourers. The stray cases where thepoverty-reducing benefit of growth did not accrue commonly to both categories need furtherstudy.
Finally, it needs to be underlined that in spite of the progress in poverty alleviation inrespect of agricultural households, the proportion of the poor among the wage-paid agriculturallabourers was 45 per cent or more, in Bihar, Orissa, West Bengal, Madhya Pradesh, Maharashtraand Uttar Pradesh, even as late as 2004-05. The first four are the former zamindari1 states whichhave a historical legacy of subjecting agricultural labourers to diverse types of exploitation, andsuch a high incidence of poverty among them even in 2004-05, may be a carry-over of this legacy.But then, the proportion of the poor among the cultivating households is also very high in thesevery states, especially in comparison with the green revolution states of Punjab and Haryana. Thus,the historical neglect of agriculture in these states seems to encompass all agricultural functionariesin the present times, the landless agricultural labourers much more furiously than the cultivatorswhose command over land has also witnessed considerable diminution during the post-Independencedecades. As regards Madhya Pradesh and Maharashtra, they, along with the former zamindari states,have never witnessed high agricultural growth, on a sustained basis. The fall-out on agriculturallabour households is, therefore, quite understandable.
In most of the Indian states, agricultural households dominate in the rural economies andrural labour markets. In that case, the picture on poverty among agricultural households shouldclosely correspond with the one among rural households as a whole. This indeed is the storyfor rural India. Using the state-level time-series-cum-cross-section data, we discover that Spearman'srank correlation coefficient between poverty among agricultural households and that among ruralhouseholds is 0.77 for 1983, 0.95 for 1993-94 and 0.97 for 2000-04; the corresponding valuesfor Karl Pearson's coefficient are 0.99, 0.97 and 0.97, respectively. All the three coefficients aresignificant at 0.01 level. In plain terms, the phenomenon of rural poverty can be authentically gaugedthrough, and meaningfully addressed, only if the employment and earning conditions of agriculturalhouseholds are analyzed in fine detail.
1 The system of employing zamindars to collect taxes from peasants, started by the Moghuls and continued even by the British

5ILO Subregional Office for South Asia, New Delhi
TTTTTable 2 : Pable 2 : Pable 2 : Pable 2 : Pable 2 : Pererererercentage of the poor among agricultural worcentage of the poor among agricultural worcentage of the poor among agricultural worcentage of the poor among agricultural worcentage of the poor among agricultural workers andkers andkers andkers andkers andrrrrrural population: 1983/2004-05ural population: 1983/2004-05ural population: 1983/2004-05ural population: 1983/2004-05ural population: 1983/2004-05
Agricultural Cultivators Agricultural RuralLabourers Workers Persons
State 1983 1993- 2004- 1983 1993- 2004- 1983 1993- 2004- 1983 1993- 2004-94 05 94 05 94 05 94 05
Andhra Pradesh 34.4 18.5 15.9 17.4 9.6 8.8 27.4 15.2 12.9 26.5 15.9 10.5Assam 49.0 57.5 36.6 35.2 35.1 15.6 40.8 45.3 19.1 42.6 45.0 22.1Bihar 81.3 72.3 67.5 53.6 44.5 25.5 67.3 58.6 43.6 64.4 58.2 42.6Gujarat 40.2 28.5 29.6 23.7 13.4 13.3 29.4 20.7 21.2 29.8 22.2 18.9Haryana 43.0 50.0 28.0 16.7 14.3 5.3 22.7 25.0 10.7 20.6 28.0 13.2Himachal Pradesh 12.9 45.8 35.0 17.8 30.1 9.3 17.6 29.0 10.1 17.0 30.3 10.5Jammu andKashmir - 28.6 10.9 - 22.7 2.2 23.4 19.6 2.9 26.0 30.3 4.3Karnataka 49.8 40.6 32.4 24.9 19.7 14.1 35.8 28.9 23.5 36.3 29.9 20.7Kerala 57.1 33.9 23.9 26.2 15.4 5.7 37.7 20.8 14.6 39.0 25.8 13.2Madhya Pradesh 65.0 55.3 56.5 44.0 32.8 27.1 51.2 40.9 37.9 48.9 40.6 36.8Maharashtra 61.2 51.8 47.3 33.4 24.1 18.2 46.8 38.6 33.3 45.2 37.9 29.6Orissa 81.9 63.5 64.5 65.3 45.8 46.1 73.5 52.9 54.5 67.5 49.7 46.9Punjab 25.5 24.9 25.8 5.4 2.8 0.9 12.6 11.0 11.4 13.2 12.0 9.0Rajasthan 44.4 38.7 37.0 32.7 20.7 14.1 33.7 22.6 16.6 33.5 26.5 18.3Tamil Nadu 65.2 44.5 33.6 38.7 21.6 15.7 54.9 36.2 28.0 54.0 32.5 23.0Uttar Pradesh 64.6 62.5 55.3 42.0 36.3 26.4 46.0 41.7 32.3 46.5 42.3 33.3West Bengal 81.0 54.8 45.6 44.9 28.0 17.6 65.5 41.5 32.0 63.1 40.8 28.4All India 60.4 47.7 46.4 37.0 28.6 21.5 45.5 35.7 31.1 45.7 37.3 28.3
Source: 1. For extrapolated population figures, Govt. of India, Population Census Reports for 1981, 1991and 2001, Registrar General, New Delhi.
2. Poverty figures derived from unit-level NSS data on consumer expenditure for 1983-84, 1993-94 and 2004-05.
2.2.2.2.2. EEEEEmplomplomplomplomployment-Pyment-Pyment-Pyment-Pyment-Pooooovvvvverererererty Linkagesty Linkagesty Linkagesty Linkagesty Linkages
Usually, a faster pace of employment growth is expected to result in a faster pace of declinein poverty. However, the post-reform experience in India does not bear this out. As analysis in this sectionshows, in an overwhelming majority of states, the faster pace of decline in the number of the rural poorduring the 1993-94 to 2004-05 period compared with the 1983 to 1993-94 period is accompanied byvarying degrees of decline (not increase) in the rate of growth of agricultural, non-agricultural or totalrural employment. Is it, then, the rate of growth of productivity/worker - in and outside agriculture- that makes a more decisive dent into rural poverty rather than the mere rate of growth of employment?Other factors can also be thought of for explaining the post-reform pattern of decline in rural poverty.Let us, however, first see the relationship between the growth of rural employment and the rate of ruralpoverty decline.

6 ILO Subregional Office for South Asia, New Delhi
2.12.12.12.12.1 GGGGGrrrrrooooowth of Ewth of Ewth of Ewth of Ewth of Emplomplomplomplomployment and Ryment and Ryment and Ryment and Ryment and Rural Pural Pural Pural Pural Pooooovvvvvererererertytytytyty
Table 3 gives the state-wise picture on the growth of rural employment and the rate of declineof rural poverty. Here, rural poverty is measured in terms of the absolute number of the poor, firstduring the 1983 to 1993-94 period (pre-reform decade), and then during the 1993-94 to 2004-05 period (post-reform years). Growth of rural employment is seen under three broad categories:agricultural employment, non-farm employment and total rural employment. Whatever type ofemployment is considered, no neat relationship emerges between the rate of growth of employmentand the rate of poverty decline.
TTTTTable 3 : Dable 3 : Dable 3 : Dable 3 : Dable 3 : Decline in the noecline in the noecline in the noecline in the noecline in the no. of the r. of the r. of the r. of the r. of the rural poor in rural poor in rural poor in rural poor in rural poor in relation to the grelation to the grelation to the grelation to the grelation to the grooooowth rate ofwth rate ofwth rate ofwth rate ofwth rate ofrrrrrural emploural emploural emploural emploural employment : 1983/2004-05yment : 1983/2004-05yment : 1983/2004-05yment : 1983/2004-05yment : 1983/2004-05
Annual Rate Growth Rate of Rural Employmentof Decline(-)/Increase(+) in Agricultural Non- Total
the No. of Employment Agricultural Employmentthe Rural Poor Employment
State 1983/93 93/2004- 1983/93 93/2004- 1983-93 93/2004- 1983-93 93/2004-05 05 05 05
Andhra Pradesh -3.63 -2.05 2.16 0.15 2.68 3.58 2.27 0.75
Assam 2.50 -4.45 1.92 -0.89 2.14 4.61 1.96 2.76
Bihar 0.80 0.05 1.37 1.17 0.87 4.67 1.29 1.51
Gujarat -1.60 0.68 0.92 1.89 5.09 2.73 1.65 2.08
Haryana 5.20 -4.63 1.83 2.03 4.63 5.31 2.54 3.07
Himachal Pradesh 8.10 -6.56 1.85 -0.15 7.30 4.83 2.72 1.08
Jammu-Kashmir 3.80 -13.23 2.47 0.20 5.09 5.19 3.05 1.68
Karnataka -0.40 -0.92 1.83 1.45 3.54 2.03 2.12 1.56
Kerala -3.70 -5.48 -0.92 -1.28 1.79 3.91 0.17 1.34
Madhya Pradesh 0.00 1.37 1.84 0.37 2.28 6.33 1.89 1.16
Maharashtra -0.10 -0.66 1.26 1.25 3.61 2.81 1.63 1.54
Orissa -1.50 1.02 1.96 0.03 0.84 6.13 1.74 1.50
Punjab 0.60 -0.89 -0.86 1.22 3.73 4.69 0.10 2.22
Rajasthan -0.20 -0.39 1.38 0.83 6.31 4.43 2.18 1.66
Tamil Nadu -3.90 -3.93 0.50 -1.38 2.52 0.62 1.06 -0.74
Uttar Pradesh 1.10 0.32 1.29 1.07 2.56 4.82 1.53 1.94
West Bengal -2.40 -1.60 0.71 1.52 5.32 1.87 2.13 1.65
All-India -0.30 -0.45 1.38 0.96 1.75 3.89 1.75 1.67
Source: 1 Govt. of India, National Human Development Report, 2001, Planning Commission, March2002.
2 Govt. of India, NSS Report No. 363/1, June 1989; NSS Report No. 409, March 1997; NSSReport No. 433, August 1998; and NSS Report No. 515, June 2006.

7ILO Subregional Office for South Asia, New Delhi
Clearly, during the post-1993 years, varying degrees of decline in the number of the
rural poor occurred in no fewer than 12 of the 17 states, varying degrees of increase occurred
in four and the situation remained unchanged in one. In contrast, during the 1983 to 1993-
94 period, varying degrees of decline occurred only in nine states, against an increase in seven
and no change in one state. The pre- and post-reform employment scenarios bear no resemblance
with the pattern of poverty decline. In no fewer than 13 states, the rate of growth of agricultural
employment witnessed varying degrees of decline during the post-1993 period compared with
the pre-1993 one, Gujarat, Haryana, Punjab and West Bengal being the four exceptions. In
the case of non-agricultural employment growth rate, the post-reform decline occurred in as
many as seven states while in the remaining ten states (Andhra Pradesh, Assam, Bihar, Haryana,
Jammu and Kashmir, Kerala, Madhya Pradesh, Orissa, Punjab and Uttar Pradesh), the post-
reform growth rates witnessed varying degrees of improvement. Finally, in the case of growth
rate of total rural employment, the post-reform decline encompassed no fewer than ten states;
Assam, Bihar, Gujarat, Haryana, Kerala, Punjab and Uttar Pradesh, were the seven states to
witness some improvement.
Two things thus stand out in the employment-rural poverty relationship. First, the higher
pace of decline in the number of the rural poor, during the post-reform years, does not owe
itself entirely to a corresponding improvement in the rate of growth of agricultural employment,
and a little less so, to non-agricultural employment. Most strikingly, the improved performance
on the poverty alleviation front has occurred in spite of a decline in the rate of growth
of agricultural employment, spread over no fewer than 13 of the 17 major states. Perhaps,
it is not the level but the content or productivity of employment which provides a more
convincing explanation for the faster pace of poverty decline in the post-1993 years. Second,
during the post-1993 period, a higher growth rate of non-agricultural employment compared
with that of agricultural employment, in as many as ten states, may have played a role towards
the faster pace of poverty decline, most ostensibly because the productivity and earning content
of non-agricultural employment is relatively higher than that of agricultural employment. The
rural non-farm sector thus holds a great promise towards rural poverty reduction.
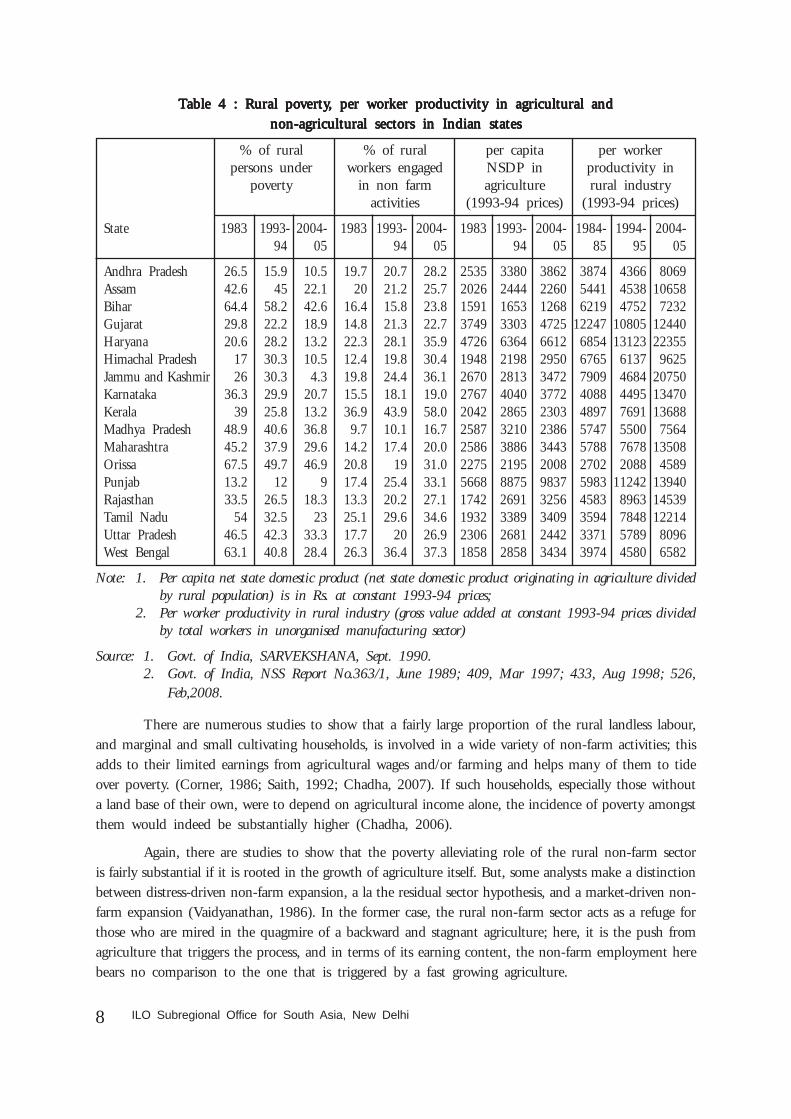
2.22.22.22.22.2 Labour PLabour PLabour PLabour PLabour Prrrrroductivity and Roductivity and Roductivity and Roductivity and Roductivity and Rural Pural Pural Pural Pural Pooooovvvvvererererertytytytyty
Table 4 lends adequate support to our argument that it is the earning content of
employment, rather than the mere counting of number of persons employed, that makes a
decisive impact on poverty. In particular, the impact that the higher level of productivity and
earnings in rural non-farm employment makes on rural poverty is well documented.
8 ILO Subregional Office for South Asia, New Delhi
TTTTTable 4 : Rable 4 : Rable 4 : Rable 4 : Rable 4 : Rural poural poural poural poural povvvvvererererertytytytyty, per wor, per wor, per wor, per wor, per worker prker prker prker prker productivity in agricultural andoductivity in agricultural andoductivity in agricultural andoductivity in agricultural andoductivity in agricultural andnon-agricultural sectors in Inon-agricultural sectors in Inon-agricultural sectors in Inon-agricultural sectors in Inon-agricultural sectors in Indian statesndian statesndian statesndian statesndian states
% of rural % of rural per capita per workerpersons under workers engaged NSDP in productivity in
poverty in non farm agriculture rural industryactivities (1993-94 prices) (1993-94 prices)
State 1983 1993- 2004- 1983 1993- 2004- 1983 1993- 2004- 1984- 1994- 2004-94 05 94 05 94 05 85 95 05
Andhra Pradesh 26.5 15.9 10.5 19.7 20.7 28.2 2535 3380 3862 3874 4366 8069Assam 42.6 45 22.1 20 21.2 25.7 2026 2444 2260 5441 4538 10658Bihar 64.4 58.2 42.6 16.4 15.8 23.8 1591 1653 1268 6219 4752 7232Gujarat 29.8 22.2 18.9 14.8 21.3 22.7 3749 3303 4725 12247 10805 12440Haryana 20.6 28.2 13.2 22.3 28.1 35.9 4726 6364 6612 6854 13123 22355Himachal Pradesh 17 30.3 10.5 12.4 19.8 30.4 1948 2198 2950 6765 6137 9625Jammu and Kashmir 26 30.3 4.3 19.8 24.4 36.1 2670 2813 3472 7909 4684 20750Karnataka 36.3 29.9 20.7 15.5 18.1 19.0 2767 4040 3772 4088 4495 13470Kerala 39 25.8 13.2 36.9 43.9 58.0 2042 2865 2303 4897 7691 13688Madhya Pradesh 48.9 40.6 36.8 9.7 10.1 16.7 2587 3210 2386 5747 5500 7564Maharashtra 45.2 37.9 29.6 14.2 17.4 20.0 2586 3886 3443 5788 7678 13508Orissa 67.5 49.7 46.9 20.8 19 31.0 2275 2195 2008 2702 2088 4589Punjab 13.2 12 9 17.4 25.4 33.1 5668 8875 9837 5983 11242 13940Rajasthan 33.5 26.5 18.3 13.3 20.2 27.1 1742 2691 3256 4583 8963 14539Tamil Nadu 54 32.5 23 25.1 29.6 34.6 1932 3389 3409 3594 7848 12214Uttar Pradesh 46.5 42.3 33.3 17.7 20 26.9 2306 2681 2442 3371 5789 8096West Bengal 63.1 40.8 28.4 26.3 36.4 37.3 1858 2858 3434 3974 4580 6582
Note: 1. Per capita net state domestic product (net state domestic product originating in agriculture dividedby rural population) is in Rs. at constant 1993-94 prices;
2. Per worker productivity in rural industry (gross value added at constant 1993-94 prices dividedby total workers in unorganised manufacturing sector)
Source: 1. Govt. of India, SARVEKSHANA, Sept. 1990.2. Govt. of India, NSS Report No.363/1, June 1989; 409, Mar 1997; 433, Aug 1998; 526,
Feb,2008.
There are numerous studies to show that a fairly large proportion of the rural landless labour,and marginal and small cultivating households, is involved in a wide variety of non-farm activities; thisadds to their limited earnings from agricultural wages and/or farming and helps many of them to tideover poverty. (Corner, 1986; Saith, 1992; Chadha, 2007). If such households, especially those withouta land base of their own, were to depend on agricultural income alone, the incidence of poverty amongstthem would indeed be substantially higher (Chadha, 2006).
Again, there are studies to show that the poverty alleviating role of the rural non-farm sectoris fairly substantial if it is rooted in the growth of agriculture itself. But, some analysts make a distinctionbetween distress-driven non-farm expansion, a la the residual sector hypothesis, and a market-driven non-farm expansion (Vaidyanathan, 1986). In the former case, the rural non-farm sector acts as a refuge forthose who are mired in the quagmire of a backward and stagnant agriculture; here, it is the push fromagriculture that triggers the process, and in terms of its earning content, the non-farm employment herebears no comparison to the one that is triggered by a fast growing agriculture.

9ILO Subregional Office for South Asia, New Delhi
Conceptually, therefore, regions in a country may stand divided in two broad groups. In onegroup, agriculture is growing, productivity levels are high, agricultural output per rural dweller is high,and consequently, through a chain of forward and backward linkages, a variety of local non-farm activitiescome up. In the other group, agricultural growth is sluggish and erratic, productivity levels are low, percapita agricultural output is low, and a majority of the rural people hunt around for any non-farm job,locally in the village or in the nearby urban and semi-urban centres, that can sustain them on day-to-day basis. In total terms, therefore, the level of rural poverty in any region depends on the combinedeffect of the pace of agricultural development, and the nature and spread of non-farm activities.
Table 5 shows the state-wise picture on rural poverty for 1983, 1993-94 and 2004-05, in relationto the level of agricultural development (surrogated by per capita national state domestic product inagriculture) and rural non-farm development. Rural non-farm development is presented in two ways:quantitatively, it is proxied by the percentage of rural workers engaged in non-farm activities, andqualitatively, by the level of per worker productivity, say, in rural industry.
TTTTTable 5 : Uable 5 : Uable 5 : Uable 5 : Uable 5 : Unevnevnevnevneven spren spren spren spren spread of read of read of read of read of rural poural poural poural poural povvvvverererererty acrty acrty acrty acrty across the statesoss the statesoss the statesoss the statesoss the states
State % of State's Share of States's State's State's State's % ofrural share (%) rural poor share (%) share (%) share (%) share in farmerspoor in India's in states's in India's in India's in India's India's net without
[2004-05] rural poor total poor rural sub- marginal irrigated membership[2004-05] [2004-05] population marginal holdings area of coops.
(1.3.2005) holdings [2003] [2003-04] [2003][2003]
Orissa 46.9 6.8 85.6 4.2 4.1 6.8 2.4 78Bihar 42.6 19.5 89.7 13.1 16.1 10.8 6.2 91Madhya Pradesh 36.8 10.8 76.2 8.3 4 9.8 10.2 57Uttar Pradesh 33.3 22.1 80.4 19.0 25.8 20 22.5 77Maharashtra 29.6 7.7 56.8 7.4 3.4 6.4 5.4 46West Bengal 28.4 7.6 79.6 7.7 12.7 7.9 5.4 77Sub-Total 39.4 69.5 78.9 59.7 65.2 58.7 47 -Tamil Nadu 23.0 3.4 42.1 4.3 4.6 4.9 4 56Assam 22.1 2.5 97.4 3.1 2.5 3.4 0.3 83Karnataka 20.7 3.7 56.5 4.6 2.2 5.3 4.3 64Gujarat 18.9 2.9 72.4 4.3 2.7 3.9 5.5 51Rajasthan 18.3 3.9 67.2 6.0 3.6 5 9.5 79Sub-Total 22.6 24.6 60.7 22.3 20.6 33.2 35.2 -Haryana 13.2 0.9 66.4 2.0 2.3 1.5 5.4 59Kerala 13.2 1.3 62.8 3.10 5.2 1.6 0.7 40Himachal Pradesh 10.5 0.3 96.1 0.7 1.4 1 0.2 43Andhra Pradesh 10.5 2.7 53.4 7.4 4.3 7.7 6.6 69Punjab 9.0 0.7 75.2 2.1 3 0.8 7.4 51Jammu and Kashmir 4.3 0.2 74.1 1.0 1.3 1.3 0.6 75Sub-Total 11.57 3.4 61.0 16.3 13.2 6.1 14.2 -
Source: 1. Cols. 2-4 derived from Tables 1 & 2.2. Col. 5, Govt. of India, Census of India 2001: Population Projections for India and States 2001-2026,
National Commission on Population, Ministry of Health and Family Welfare, May 2006: 28-513. Cols. 6-7, Govt. of India, NSS Report No. 498, May 2005: A67-A814. Cols. 8-9, Govt. of India, Report of the Inter-Ministry Task Group on Redressing Growing Regional
Imbalances; Planning Commission; January 2005: 32-35

10 ILO Subregional Office for South Asia, New Delhi
A number of interesting points emerge. First, the picture on rural poverty decline is far clearerfor the post-1993 years in contrast to that for the period 1983 to 1993-94. For example, during 1983to1993-94, the proportion of the rural people under poverty declined in 13 and increased in four states.However, during the 1993-94 to 2004-05 period, it declined in all the 17 states, the degree of declinenotwithstanding.
Second, to comprehend the relationships in concrete statistical terms, a few correlationcoefficients are computed from Table 5.
Correlation Coefficient between:
A. Rural Poverty and: 1983 93-94 04-05(i) Per person agriculture net state -0.55* -0.65* -0.62*
domestic product (-0.61*) (-0.61*) (0.54*)(ii) Per worker productivity (rural industry) -0.56* -0.50* -0.67*
(-0.45**) (-0.57*) (-0.68*)(iii) Percentage of rural non-farm workers 0.22 -0.43** -0.44**
(0.18) (-0.30) (-0.39)
B. Percentage of rural non-farm workers and per -0.34 0.37 0.23worker productivity in rural industry (-0.27) (0.25) (0.26)
* is significant at 0.05 level; ** is significant at 0.10 level; figures in parenthesesare Karl Pearson's Correlation Coefficients while those outside are Spearman'sRank Correlation Coefficients.
A few interesting facts need to be underlined. First, given the usual limitations of the state-level cross-section data, significant (negative) correlation do not generally emerge between rural povertyand rural non-farm development, for any of the three points of time, the value of Spearman's rankcorrelation coefficient being 0.22, -0.43 and -0.28, and the one for Karl Pearson's coefficient being0.18, -0.30 and -0.39, for 1983, 1993-94 and 2004-05, respectively. This upholds our contentionthat in some states, a sheer proliferation of rural non-farm employment may not make a dent intorural poverty if their agricultural base is weak, and the movement into the non-farm sector is a distress-driven phenomenon. Assam, Jammu and Kashmir, Tamil Nadu, Uttar Pradesh and West Bengalcharacterize this scenario for 1993-94, and Assam, Orissa, Uttar Pradesh and West Bengal are theexamples for 2004-05. On the other extreme, there are states where low level of rural poverty goeshand in hand with medium to high level of rural non-farm as well as agricultural development. AndhraPradesh, Gujarat, Haryana, Punjab, and Rajasthan are examples for 1993-94 and Andhra Pradesh,Gujarat, Haryana, Himachal Pradesh, Jammu and Kashmir, Karnataka, Kerala, Punjab, and Rajasthanprovide illustrations for 2004-05. Finally, there are a group of states where rural poverty is high partlybecause their agricultural productivity is low and the rural non-farm sector is weak. Bihar, HimachalPradesh, Karnataka, Madhya Pradesh, Maharashtra, and Orissa, illustrate this combination for 1993-94, and, Bihar, Madhya Pradesh, and Orissa provide examples for 2004-05. In sum, the rural non-farm development, surrogated merely by the proportion of rural non-farm workers, does not showits impact on rural poverty alleviation in all cases.

11ILO Subregional Office for South Asia, New Delhi
Second, if rural non-farm development is proxied by a more refined, and qualitatively superior,
indicator, say, the level of per worker productivity in rural industry, its poverty alleviation impact
comes up neat and clean. The rank correlation coefficient now rises to -0.56 for 1983, -0.50 for
1993-94 and as high as -0.67 for 2004-05. The corresponding value for Karl Pearson's coefficient
rises to -0.45, -0.57 and -0.68, respectively. Each coefficient is significant at 0.01 level. This lends
considerable support to the point that a mere shift of rural workers from agriculture to non-farm
activities may not relieve many of the rural households of their poverty; the productivity levels
of the non-farm activities to which they migrate are a more decisive touchstone. In plain terms,
poverty alleviation comes if and only if the workers shift from low to higher productivity jobs.
In an oblique sense, many of the state-sponsored poverty alleviation schemes that encourage rural
households to undertake a variety of self-employing non-farm activities could make only a limited
impact on rural poverty primarily because many of these 'self-employing' enterprises continue to
suffer, inter alia, from low levels of productivity.
Third, to put added emphasis on the qualitative aspects of the rural non-farm development,
we estimated the rank correlation coefficient between the two variants of the rural non-farm
development, viz. the percentage of rural workers engaged in non-farm activities, representing the
quantitative aspect (RNFqn), and the level of per worker productivity in rural industry, capturing
the qualitative aspect of the RNF development (RNFqt). The coefficients are -0.34, 0.37 and
0.23 for 1983, 1993-94 and 2004-05, respectively; none is significant. Likewise, the corresponding
Karl Pearson Correlation Coefficients are -0.27, 0.25 and 0.26; none of them is significant either.
We are, once again, in a position to assert that a state where RNFqn is high is not necessarily
the same where RNFqt is also high. It is a jumble of odd combinations: a high RNFqn and
a high RNFqt (the green revolution states of Punjab and Haryana), a high RNFqn but a low/
medium RNFqt (e.g. Assam, Kerala, Orissa, Tamil Nadu, Uttar Pradesh, and West Bengal), and
a low/medium RNFqn but a medium/low RNFqt (e.g. Bihar, Karnataka, and Madhya Pradesh).
Finally, it is duly confirmed, once again, that agricultural development (again, measured in
terms of qualitative gains such as higher levels of productivity/worker) does make a decisive dent
into rural poverty; the rank correlation coefficient between rural poverty and agricultural production
per rural person is -0.55, -0.65 and -0.62 for 1983, 1993-94 and 2004-05, respectively (the
corresponding values of Karl Pearson Coefficient are -0.45, -0.57 and -0.68); all are significant.
This result cautions the exclusive club of rural non-farm promoters against dismissing the poverty
alleviation capability of agriculture. Agriculture still contributes nearly 55 per cent of rural net domestic
product and any breakthrough in productivity/worker here is bound to show its effect on rural
poverty, most ostensibly because no fewer than three-fourth of rural workers are still engaged in
this sector.
3.3.3.3.3. NNNNNational Rational Rational Rational Rational Rural Eural Eural Eural Eural Emplomplomplomplomployment Gyment Gyment Gyment Gyment Guarantee Puarantee Puarantee Puarantee Puarantee Prrrrrogramme: Looking Bogramme: Looking Bogramme: Looking Bogramme: Looking Bogramme: Looking Backackackackackand Fand Fand Fand Fand Forororororththththth
The preceding analysis shows that the process of rural poverty decline has been highly
uneven across states. There are pockets of high, medium and low poverty. Clearly, six out of the17

12 ILO Subregional Office for South Asia, New Delhi
major states studied by us (Orissa, Bihar, Madhya Pradesh, Maharashtra, Uttar Pradesh and West
Bengal) are high poverty pockets. As Table 5 shows, as late as 2004-05, around one-third to one-
half of the rural population of these six states was still plagued by poverty, even by India's own
modest criteria. Six out of 17 states is not a frightening number but the logic of ordinary numbers
just does not apply here. In 2005, no fewer than 467 million people (nearly 60 per cent of
India's rural population) lived in the rural areas of these six states; no fewer than 70 per cent
of India's rural poor belonged to these states; in each of these six states, a preponderant majority
of the poor belong to the rural areas so that the problem of poverty with them is largely a
problem of rural poverty. Nearly two-third of India's sub-marginal and about 60 per cent of marginal
farms are located in these states. A preponderant majority of farmers do not have membership
of grass-roots institutional (cooperative) credit societies, and so on. More variables can be added
to highlight the distress of these states. The moot point is that the agricultural base of nearly
the whole lot of these six states is pretty weak, and the expansion of their rural non-farm sector
is largely a distress-driven phenomenon. A high incidence of rural poverty is a natural offshoot
of these factors.
At the other end of the poverty spectrum stand another group of states (Haryana, Kerala,
Himachal Pradesh, Andhra Pradesh, Punjab and Jammu and Kashmir) where rural poverty is well
under control, and looks like a marginal phenomenon. Although pleasing in its own right, this
does not counter the menacing level of poverty in the first group of six states, firstly, because
only about 16 per cent of India's rural people and just around 3 per cent of India's rural poor
live in these 'well-off' states. In plain terms, the gratifying part of the rural poverty decline touches
no more than 3 per cent of India's poor while the unfortunate part encompasses no fewer than
70 per cent of the poor. This unevenness needs to be rectified through numerous policy initiatives,
most essentially, through strengthening their employment base.
Second, our exercise of clubbing states on the basis of the level of rural poverty does not
mean that every part of an intensely poor state, say Orissa or Bihar, is poor or every part of
a non-poor state, say Punjab or Haryana, is non-poor. For all practical purposes, each state has
an uneven distribution of poverty among its districts or lower levels of administrative divisions.
The issue of employment promotion, through government-sponsored programmes and institutional
support, should, therefore, be focused more and more intensively on the districts that really need
them. A positive development in recent times has been that policy makers have been tending to
concentrate their attention on 'backward parts within states' (Govt. of India, 2005). Table 6 clearly
shows that the high poverty states have a much larger number of backward districts, defined on
the basis of three parameters: (i) proportion of scheduled caste/scheduled tribe (SC/ST) population;
(ii) inverse of agricultural productivity per worker; and (iii) inverse of agricultural wage rate (ibid,
2005). To the extent that a significant majority of the rural poor, including those among the six
poor-majority states, belong to the SC/ST population, and are most severely affected by the second
and third parameters, the degree of backwardness of a district would, ipso facto, would reflect the
severity of its rural poverty.

13ILO Subregional Office for South Asia, New Delhi
TTTTTable 6 : Pable 6 : Pable 6 : Pable 6 : Pable 6 : Prrrrrogrogrogrogrogress of Ness of Ness of Ness of Ness of National Rational Rational Rational Rational Rural Eural Eural Eural Eural Emplomplomplomplomployment Gyment Gyment Gyment Gyment Gurantee Purantee Purantee Purantee Purantee Prrrrrogramme (NREGP)ogramme (NREGP)ogramme (NREGP)ogramme (NREGP)ogramme (NREGP)
(As on August 21, 2006)
State % of total no. of no. of % of % of state's % of rural % ofrural no. of backward districts households population households interestedpoor districts districts in selected in nregp in nregp interested households
planning for districts districts in nregp alreadycom. study nregp employment issued job
[2004-05] [2001] [2005] [2006] [2006] [2006] [2006] cards(aug.06)
Orissa 46.9 30 (30) 15 19 57.96 55.73 78.4 76.2
Bihar 42.6 55(61) 53 43 70.17 70.59 33.6 53.2
Assam 22.1 23(27) 8 7 19.44 19.81 17.4 64.9
Madhya Pradesh 36.8 61(66) 29 29 47.49 46.62 100 95
West Bengal 28.4 18(19) 5 10 62.68 63.85 56.3 65.3
Uttar Pradesh 33.3 83(83) 30 25 34.18 33.46 31.3 91.9
Sub-Total 270(286) 140 133 52.74 51.49 51.3 76.8
Maharashtra 29.6 35(35) - 12 33.23 33.12 30.7 96
Tamil Nadu 23.0 30(30) - 6 24.96 26.02 29.9 98.9
Karnataka 20.7 27(27) - 5 19.08 20.57 38.6 55.1
Rajasthan 18.3 32(32) 9 6 18.34 16.89 98.8 98.6
Gujarat 18.9 25(26) - 6 23.36 25.16 42.1 90.7
Andhra Pradesh 10.5 23(23) 8 13 53.27 55.31 69 100
Sub-Total 172(173) 17 48 31.79 31.51 53.1 95.4
Kerala 13.2 14(14) - 2 12.3 12.78 37.5 -
Haryana 13.2 19(20) - 2 10.12 10.15 26.8 93.8
Himachal Pradesh 10.5 12(12) - 2 13.96 15.27 47.2 96.5
Punjab 9.0 17(20) - 1 7.93 7.38 16.6 92.8
Jammu-Kashmir 4.3 14(22) - 3 20.65 21.21 58.4 85.2
Sub-Total 76(88) - 10 11.81 12.07 33.5 90.1
Note: 1. In Col.3, the figures in brackets are the number of districts (provisional) in 2008.2. Number of districts in Col.5 total up to 191 only; remaining 9 districts come from the seven
non-Assam North-Eastern States
Source: 1. Table 1 for Col.2;2. The 2001 Population Census Data for Cols. 3,6 and 7.3. Govt. of India, Report of the Inter-Ministry Task Group on Redressing Growing Regional
Imbalances, Planning Commission, January 2005; 32-35, for Col. 4.4. Govt. of India, The National Rural Employment Guarantee Act 2005 (NREGA), Annexure-I,
Ministry of Rural Development; 2006: 27-30

14 ILO Subregional Office for South Asia, New Delhi
It is in this sense that the recently launched flagship National Rural Employment GuaranteeProgramme (NREGP) is to be interpreted as an attempt to help the rural poor at the level at whichpoverty is most virulent. The NREGP began to focus, consciously, on districts within a state rather thanthe state as a whole. Initially launched on February 2, 2006, in 200 most-backward or the poor-majoritydistricts, the programme was extended last year to another 130 districts, and from April 1, 2008 onwards,has been extended to the whole of rural India.
The NREGP promises to provide a minimum of 100 days of guaranteed public wageemployment in a financial year to every rural household whose adult members volunteer to do unskilledmanual work, at the minimum wage rate fixed by the state. Unemployment allowance would be paidto the extent that the employment actually offered falls short of the promised employment. Creationof durable assets and strengthening the livelihood resource base of the rural poor are the two core elementsof the NREGP. The Programme envisages a collaborative partnership between the Centre and the stategovernments, the panchayats2 and the local communities. While the Programme draws its basicsustenance from the history of wage employment in India, "it is different in that it is a guarantee, notreversible with any changes of government. It also provides scope for implementation by local groupsand agencies; devolves considerable powers to panchayats; mandates a high quality of conditions of workthrough provisions for medical aid, drinking water, shade and crèche, on the worksite; and encouragesthe use of the Right to Information and Social Audit to ensure transparent and effective implementation".(ILO-ISST, 2006).
The NREGP, in its ideal form, is expected to (i) increase employment, earnings and purchasingpower of the rural poor; (ii) ensure greater participation of women in the workforce; (iii) strengthenrural infrastructure through creation of durable community assets; (iv) improve productivity in ruraleconomic activities; (v) regenerate natural resources that provide the livelihood resource base of local ruraleconomy, and (vi) reduce distress migration. In a sense, it opens a new chapter in pro-poor governanceof rural India and, if implemented in letter and content, can steadily become an instrument of socialand economic change in rural India. Above all, it does have the potential for restoring the poor people'sfaith in public sector delivery mechanisms. In overall terms, going by its design, content and operationalmake, we have reasons for investing our faith in NREGP.
● It seems that significant political dividends that can accrue from its rigorous and flawlessimplementation, most crucially because it is addressed upfront to the neediest people, are graspedwell by the ruling coalition. The NREGP's non-bureaucratic design, economic content,operational flexibility, decentralized functioning, accountability procedures, and in-built socialauditing and implementing mechanism, most obvious being the complete ban on the use ofcontractors are markedly different from those of the earlier initiatives and adequately reflect theawareness of the present government not only about what stops rural employment-promotionprogrammes from working but also about what makes them work. In fact, nearly the wholeof the developing world is keenly watching the working of India's NREGP so that it is summarilya 'now or never' game. Thanks to the huge in-built political dividends of the NREGP,competition among political parties and ruling states is more than apparent (Dreze, 2006). Inrural India, the economics of NREGP has already become politics of NREGP.
2 Indian local village level government

15ILO Subregional Office for South Asia, New Delhi
● A fortunate combination of the involvement of gram3 panchayats in the selection and executionof infrastructure development projects that are relevant to the needs of the village communityor for breaking the structural bottlenecks for agricultural and rural development, and expectedlylesser incidence of 'leakages', 100 days of employment to every 'needy household' should makea noticeable improvement to employment and earning status of many a poor household. Whilesome poor households may succeed in flipping over from below to above poverty line, otherNREGP-beneficiaries may well end up as 'less poor' than before.
● In the ultimate analysis, the net economic gains that would accrue to the village communityin general, and the rural poor in particular, on an enduring basis, would depend on the choice,execution and maintenance of infrastructure development projects. Happily, the field informationon NREGP asset formation and infrastructural build-up available so far reflects correct choicesfar more than incorrect ones. Water conservation (mini irrigation development projects, waterharvesting, watershed and wasteland development among others), rural roads/connectivity,drought proofing and plantation, and flood control, nearly sum up the whole range of theNREGP works. All these works are directly related to agricultural rejuvenation and, on theirsuccessful completion, may give a boost to agricultural production which, in turn, may startthrowing up enhanced employment opportunities in agriculture and areas associated with it. Asustained process of agricultural growth may diversify the local economic and employment base.If all these ideal things happen, in the next few years, the employment and earnings of the ruralpoor may increase on a sustained basis, rural poverty may well witness a noticeable diminution,and the 'employment guarantee programme' may steadily liquidate itself.
● A relatively higher level of women's participation in the Programme would mean that they wouldhave some cash in hand that would entail some economic independence (Dreze, ibid). Besides,men would be spared to scout for non-farm employment, including short-term migration tonearby towns and urban centres, so that the total addition to household employment andearnings would be greater than what would have been the case under NREGP alone. A spin-off could be that older children may start going to school.
● An extremely valuable fall-out of the NREGP is that distress migration from the poorer anddepressed regions may decline, in varying form and degree. At the very least, if additionalemployment opportunities are available in and around the village - under the auspices of theNREGP to begin with and in the expanding local economy later on - the concept of off-seasonunemployment undergoes a change, and with that, the exigency for seasonal migration getsdiluted. A switch-over from an uncertain mix of off-season wage-paid jobs in 'distant lands',to local 'wage-paid' NREGP employment followed by self-employing local jobs, inside or outsideagriculture, is more effective in fighting the menace of poverty, besides harmonizing family life,child care and social relations.
In total terms, NREGP reflects a commitment by the state that is unprecedented in the post-independence history of India - both as a legally enforceable right and in terms of financial resources.The programme should not be looked upon as a dole-bearing welfare measure; it is a concretedevelopment initiative, chipping in with crucial public investments for creation of durable assets, without
3 village

16 ILO Subregional Office for South Asia, New Delhi
which the growth process will not get the requisite momentum in the most backward regions of ruralIndia.
What is the experience so far? It is, at best, a mixed one. The available field-based evaluationstudies and official assessment reports do point towards tardiness in the issue of job cards, days andtimings of employment offers, administering of muster rolls, delayed wage payments, non-payment ofminimum wages, and so on, are the commonly reported lapses whose intensity varies sharply from regionto region (Dreze, 2006, 2008; IHD, 2006; ILO-ISST, 2006; Shankar, 2006; Ambasta, 2008). Again,a recent official report summarizes the operational deficiencies and the consequent leakages of theprogramme as under:
the main deficiency was the lack of adequate administrative and technical manpower at the blockand GP levels. The lack of manpower adversely affected the preparation of plans, scrutiny,approval, monitoring and measurement of works, and maintenance of the stipulated records atthe block and GP level. Besides affecting the implementation of the scheme and the provisionof employment, this also impacted adversely on transparency, and made it difficult to verify theprovision of the legal guarantee of 100 days of employment on demand. Planning was inadequateand delayed, which resulted in poor progress of works. Systems for financial management andtracking were deficient, with numerous instances of diversion/misutilization, and delay in transferof state share. Monthly squaring of accounts at different levels to maintain financialaccountability and transparency was also not being done. Maintenance of records at the blockand GP levels was extremely poor, and the status of monitoring, evaluation and social auditwas also not up to the mark (Comptroller and Auditor General, 2007).
Such initial infirmities are understandable, most ostensibly because the NREGP is only two yearsold. The implementation lacunae, thrown bare by field-based feedbacks, citizen voices and assessment/evaluation reports, pouring in from different regions, and encompassing diverse perspectives andorientations, are remediable, and should dwindle as India goes deeper into the programme. Happily,the field-based critical assessments are becoming learning pads for the central and state governments toimprove their understanding and performance, the occasional over-assertions such as 'tremendoussuccesses' notwithstanding; the civil society organizations are determinedly intensifying their social auditcampaigns; and the grass-roots democratic institutions are assimilating and more expressly addressingthemselves to local development issues, with a far better understanding of the stakes involved and'people's involvement for their own development'. Thanks to the dogged perseverance of the civil societyorganizations, there is a clear trend for regions to understand, and build upon, one another's strongpoints, as also to avoid their own implementation lacunae, when the programme proceeds to the nextstage. The most redeeming fact is that large-scale misuse of funds, a dreadful reality with the earlierstate-supported employment generation programmes, is nearly conspicuous by its absence. In brief, evenduring the short spell of its existence, the NREGP has shown itself to be ahead of, and substantiallydifferent from, most of its employment generation predecessors. It is for sure that some more unhappyinsights and operational weaknesses may show themselves in the days ahead but the 'politics of NREGP'looks strong enough to absorb them well. The issue of rural poverty can no more stay in 'politicalwilderness'. Finally, the unrelenting support of intellectuals and other public men, at the national, stateand village levels, conjunctly with the incessant watch, being exercised by numerous civil society groupsand activists, over the on-going implementation procedures, adds its own weight to our optimism.

17ILO Subregional Office for South Asia, New Delhi
4.4.4.4.4. Looking Ahead, with OLooking Ahead, with OLooking Ahead, with OLooking Ahead, with OLooking Ahead, with Optimismptimismptimismptimismptimism
Our analysis clearly suggests that there is tremendous scope, at the policy and implementationlevel, to improve the situation for rural employment and poverty in India. The major policy concerns,such as that employment must now become a central issue in planning; that rural non-farm employmentmust be promoted as aggressively as possible, yet employment in agriculture and its associated sectorswould have to stay back as the mainstay of the rural working people, for many years to come; thatproductivity improvement, especially in the farm sector, must be looked at as a far more decisiveinstrument for poverty reduction among the working poor, especially among the bottom layers (WorldBank, 2007); that multiple strategies would be needed to effect a steady switch-over from agricultureto non-agricultural jobs, and so on, are well known, and duly accepted by policy makers (Govt. of India,2006b). This concluding section sketches out a few issues that, in our view, should help our policymakers chisel out an effective poverty-reducing employment growth strategy for the Eleventh Plan.
4.14.14.14.14.1 Agricultural EAgricultural EAgricultural EAgricultural EAgricultural Emplomplomplomplomploymentymentymentymentyment
It bears reiteration that employment in agriculture and its allied sectors is crucial for earnings,well-being and poverty reduction among a vast majority of rural households. Agricultural employmenthas both quantitative and qualitative ramifications for rural poverty alleviation. Quantitatively, bothlabour-displacing and labour-absorbing tendencies are likely to be in operation. While yield growth,changes in relative prices and shift to higher value crops may create additional work opportunities, thesteadily declining size of operational holdings and increasing mechanization may reduce the quantumand growth of agricultural employment. Clearly, a balance is called for.
Qualitatively, if the growth of agricultural gross domestic product (GDP) indeed goes up to 4per cent per year, as envisaged, it will improve employment conditions in agriculture by raising real wagesand reducing under-employment (Govt. of India, 2006b). For a decisive impact on rural poverty,improving per hectare or per person productivity, in crop and non-crop sectors, would have to be themost essential ingredient of the employment promotion strategy. Productivity improvement would haveto be achieved through efficient management of natural resources and by adopting precision farmingpractices. Perhaps, a few examples are in order.
● On a broad plane, improvement in agricultural productivity can come through expandingdivdivdivdivdiversification within agriculturersification within agriculturersification within agriculturersification within agriculturersification within agricultureeeee or through introduction of nenenenenew prw prw prw prw production technologiesoduction technologiesoduction technologiesoduction technologiesoduction technologies,or a varying combination of both. Diversification within agriculture can come about throughcropping pattern changes, say, a shift from less labour-intensive and low value crops to morelabour-intensive and higher value crops, or through shifts from less remunerative crop enterprisesto more lucrative non-crop activities. Indian agriculture has been witnessing all thesedevelopments, in varying form and combination, in the recent past, and, as our analysis shows,their impact on rural poverty has also been felt, again in varying ways across regions. Thechallenge for the Eleventh Plan is how to harmonize the numerous policy initiatives already inoperation, to ensure that agricultural employment does not remain a 'self-employing dumpingground' for many of the rural poor. Employment should essentially be productive employmentif it has to ensure a decisive dent into poverty.
● As regards prprprprproductivity in the croductivity in the croductivity in the croductivity in the croductivity in the crop sectorop sectorop sectorop sectorop sector, yield rate for wheat can improve substantially,

18 ILO Subregional Office for South Asia, New Delhi
especially in the eastern and north-eastern regions, through a balanced use of NPK fertilizers,precision farming, improved varieties (including higher seed replacement). Hybrid technologypromises higher and stable yield rates for rice, especially in the poverty-stricken areas such aseastern Uttar Pradesh, Bihar, Orissa, West Bengal and Assam. Single cross hybrids have thepotential to improve yield levels for maize, most notably in eastern Uttar Pradesh, Bihar,Jharkhand and West Bengal. Sugarcane for bio-fuel can considerably improve the earnings offarm operators. Productivity levels for pulses can be improved through improved short durationand disease resistant varieties, in varying combinations with the use of sulphur in deficientregions, integrated pest management (IPM) and life-saving irrigation. Systematically planned useof genetically-modified soyabean, sowing in permanently-raised beds with plastic mulching, onesupplemental irrigation, effective control of weeds in respect of groundnut, emphasizing thepotential of their cultivation in the eastern and north-eastern states and support of one irrigation(sprinkler), higher dose of fertilizers and IPM approach for rapeseed and mustard, among others,in Rajasthan, Haryana, Uttar Pradesh, Madhya Pradesh and West Bengal, may improve yieldlevels for oilseeds (Paroda, 2006). Again, the increasing emphasis on horticulture, vegetables andfruits is bound to push the cultivating households to higher levels on the value chain.
● Likewise, for prprprprproductivity in the non-croductivity in the non-croductivity in the non-croductivity in the non-croductivity in the non-crop sectorsop sectorsop sectorsop sectorsop sectors, there are tremendous unexploredpossibilities of promoting inland aquaculture through production and supply of quality seed,rural-based fish processing, improved packing, cold-storage and transportation, especially forpromoting exports (Paroda, ibid). Likewise, the livestock sector promises a lot for rural povertyreduction, if only crop-livestock integration grows apace, especially in arid regions, orinstitutional innovations, such as linking farmers to markets and processing firms (a laNestleIndia, e-Chaupals), or forging farmers' cooperatives enterprises (Gujarat model), or healthycontract farming (Venkateshwara Hatcheries), are in place.
● The states must strive to strengthen their agricultural base, as also to undertake appropriateinitiatives for agricultural diversification, mainly through reversing the recent downtrends in therate of growth of investment. Although public-private sector partnership is bound to increase,and encompass a wider array of investment activities, yet the crucial role that public invpublic invpublic invpublic invpublic investmentestmentestmentestmentestmenthas to play in strengthening rural and agricultural infrastructure must be realized as aninescapable public choice, especially because, around 70 per cent of the rural workforce, in amajority of states, is still absorbed by agriculture, and it is this very sector that has to absorbthe employment setbacks emerging in other sectors when globalization goes deeper. The issueof public investment is inescapably linked with the development of technology. Happily, in recentmonths, the policy makers themselves have been talking aloud, and concretizing their investmentplans, to restore public investment for agriculture to its position of eminence (Govt. of India,2006b).
● The policy makers must spare their attention and public resources for rain fed agriculturrain fed agriculturrain fed agriculturrain fed agriculturrain fed agricultureeeee whichis typically characterized by low, and highly fluctuating, productivity levels. The volatile natureof agricultural production has largely been the cause of employment uncertainties, high incidenceof poverty, and a high rate of seasonal outflow of labour. A vast majority of districts includedunder the first round of NREGP typically portray such uncertain production and employmentregimes. The NREGP may alleviate some of the distress, but agriculture in these depressed areas
19ILO Subregional Office for South Asia, New Delhi
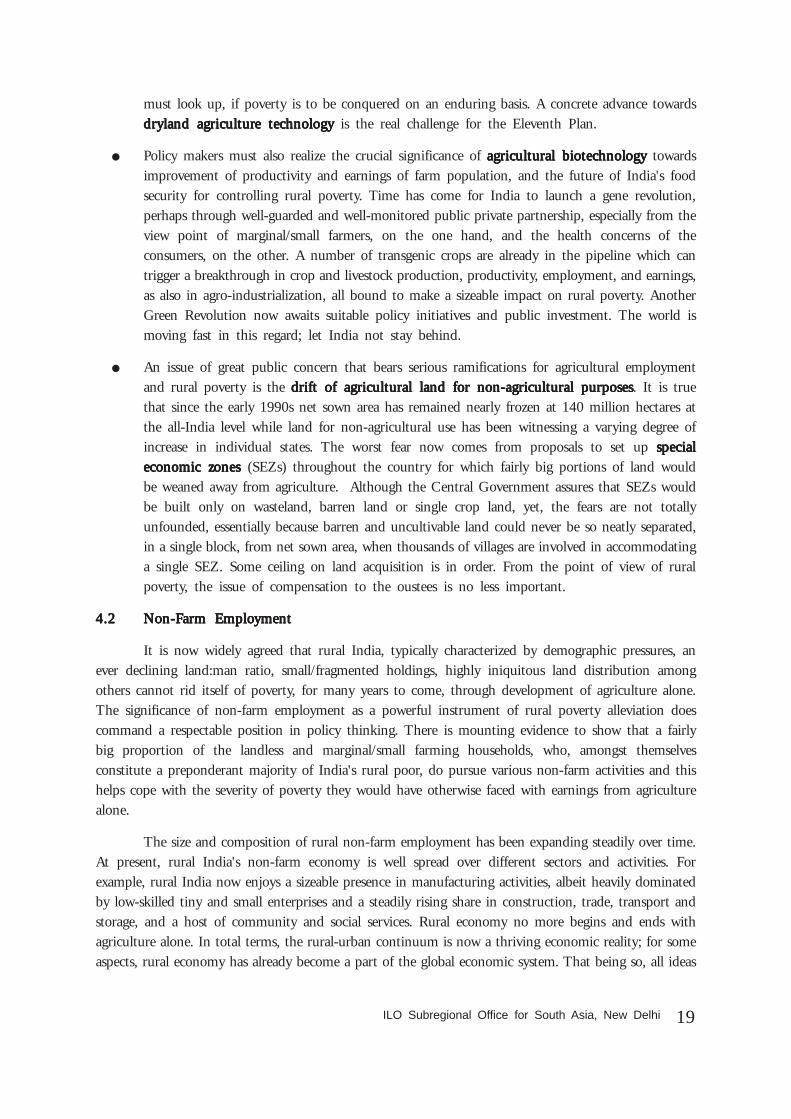
must look up, if poverty is to be conquered on an enduring basis. A concrete advance towardsdrdrdrdrdryland agriculturyland agriculturyland agriculturyland agriculturyland agriculture technologye technologye technologye technologye technology is the real challenge for the Eleventh Plan.
● Policy makers must also realize the crucial significance of agricultural biotechnologyagricultural biotechnologyagricultural biotechnologyagricultural biotechnologyagricultural biotechnology towardsimprovement of productivity and earnings of farm population, and the future of India's foodsecurity for controlling rural poverty. Time has come for India to launch a gene revolution,perhaps through well-guarded and well-monitored public private partnership, especially from theview point of marginal/small farmers, on the one hand, and the health concerns of theconsumers, on the other. A number of transgenic crops are already in the pipeline which cantrigger a breakthrough in crop and livestock production, productivity, employment, and earnings,as also in agro-industrialization, all bound to make a sizeable impact on rural poverty. AnotherGreen Revolution now awaits suitable policy initiatives and public investment. The world ismoving fast in this regard; let India not stay behind.
● An issue of great public concern that bears serious ramifications for agricultural employmentand rural poverty is the drift of agricultural land for non-agricultural purposesdrift of agricultural land for non-agricultural purposesdrift of agricultural land for non-agricultural purposesdrift of agricultural land for non-agricultural purposesdrift of agricultural land for non-agricultural purposes. It is truethat since the early 1990s net sown area has remained nearly frozen at 140 million hectares atthe all-India level while land for non-agricultural use has been witnessing a varying degree ofincrease in individual states. The worst fear now comes from proposals to set up specialspecialspecialspecialspecialeconomic zeconomic zeconomic zeconomic zeconomic zones ones ones ones ones (SEZs) throughout the country for which fairly big portions of land wouldbe weaned away from agriculture. Although the Central Government assures that SEZs wouldbe built only on wasteland, barren land or single crop land, yet, the fears are not totallyunfounded, essentially because barren and uncultivable land could never be so neatly separated,in a single block, from net sown area, when thousands of villages are involved in accommodatinga single SEZ. Some ceiling on land acquisition is in order. From the point of view of ruralpoverty, the issue of compensation to the oustees is no less important.
4.24.24.24.24.2 NNNNNon-Fon-Fon-Fon-Fon-Farm Earm Earm Earm Earm Emplomplomplomplomploymentymentymentymentyment
It is now widely agreed that rural India, typically characterized by demographic pressures, anever declining land:man ratio, small/fragmented holdings, highly iniquitous land distribution amongothers cannot rid itself of poverty, for many years to come, through development of agriculture alone.The significance of non-farm employment as a powerful instrument of rural poverty alleviation doescommand a respectable position in policy thinking. There is mounting evidence to show that a fairlybig proportion of the landless and marginal/small farming households, who, amongst themselvesconstitute a preponderant majority of India's rural poor, do pursue various non-farm activities and thishelps cope with the severity of poverty they would have otherwise faced with earnings from agriculturealone.
The size and composition of rural non-farm employment has been expanding steadily over time.At present, rural India's non-farm economy is well spread over different sectors and activities. Forexample, rural India now enjoys a sizeable presence in manufacturing activities, albeit heavily dominatedby low-skilled tiny and small enterprises and a steadily rising share in construction, trade, transport andstorage, and a host of community and social services. Rural economy no more begins and ends withagriculture alone. In total terms, the rural-urban continuum is now a thriving economic reality; for someaspects, rural economy has already become a part of the global economic system. That being so, all ideas

20 ILO Subregional Office for South Asia, New Delhi
and proposals for rural non-farm development must be couched against the total national economy asalso the emerging international realities. A number of suggestions, partly emerging from rural India'sown recent development experience, and partly tempered by outside realities, are currently underdiscussion, especially for framing the Eleventh Plan strategy for rural non-farm employment.
● A wide range of manufacturing activitiesmanufacturing activitiesmanufacturing activitiesmanufacturing activitiesmanufacturing activities (e.g. textile products, food processing and beverages,wood and leather products, metal products, non-metallic mineral products, basic metalindustries), constrconstrconstrconstrconstruction, hotel-ruction, hotel-ruction, hotel-ruction, hotel-ruction, hotel-restaurant and tourism, transporestaurant and tourism, transporestaurant and tourism, transporestaurant and tourism, transporestaurant and tourism, transport-storage-communicationst-storage-communicationst-storage-communicationst-storage-communicationst-storage-communications,and a wide range of activities under community and social sercommunity and social sercommunity and social sercommunity and social sercommunity and social servicesvicesvicesvicesvices (e.g. education and scientificpersonnel, medical and health services) stand out as the most likely thrust areas, for theforthcoming Eleventh Plan. Perhaps, rural India can chip off a modest share in informationtechnology-enabled services (ITES) as also in financial services (Govt. of India, 2006b).
● RRRRRural manufacturingural manufacturingural manufacturingural manufacturingural manufacturing lends itself for special policy attention during the Eleventh plan, bothfor its employment potential and contribution to rural poverty alleviation. That ruralmanufacturing accounts for nearly one-third of India's net domestic product in manufacturing,that tiny and small enterprises constitute an overwhelming percentage of rural manufacturingunits, that agro-based enterprises constitute a bulk of rural manufacturing units, and that food-processing commands pre-eminence, both in output and employment, among the rural agro-based manufacturing, indicate the nature and thrust of rural industrialization that shouldunderlie the Eleventh Plan strategy for rural non-farm employment expansion. Agro-industryis a logical extension of agricultural development - it fosters forward and backward linkages withagriculture, enhances value adding to agricultural produce, and promotes rural people's shift tonon-farm activities. Directly, it promotes cropping pattern improvements, on-farm productdiversification, and employment, income and well-being of the rural people. Indirectly, it reducesdemographic pressure on land, improves farm-non-farm linkages, makes people leave land butnot the countryside, and helps urban decongestion. Most crucially, what ensures greateremployability of the rural job-seekers in agro-industrial enterprises is their low skill-intensiveoperations; the advantage of low labour cost is readily realizable in such industries. In brief, underthe totality of circumstances, the case for rural agro-industry merits a comprehensive policyattention.
It is a pity that agro-industry in India is still highly under-developed. A small proportion ofpaddy, wheat and pulses feed semi-processing agro-industries; a very insignificant proportion of fruit andvegetables go in for processing; not more than 20-25 per cent of milk and fish enter primary processing;not more than 10 per cent of value addition through processing is realized in India. A number ofinitiatives have been undertaken recently to lend a boost to agro-industrialization, more notably thelaunching of agro-processing zones (and now special economic zones), amendment of AgriculturalProduce Marketing Acts, financial sector reforms and numerous other reforms for small and mediumenterprise development, forging of institutional innovations such as farm-to-firm contract-farminglinkages, and so on. Admittedly, much more needs to be done.
● With the end of the textile import quota regime in the industrialized world, India faces a hugeopportunity for expanding textile and garment exportextile and garment exportextile and garment exportextile and garment exportextile and garment exportststststs which can generate substantialadditional employment some of which would accrue to rural households. Bold production- and

21ILO Subregional Office for South Asia, New Delhi
trade-related policy initiatives are, however, needed to strengthen our competitiveness in theseareas, especially vis-à-vis China. TTTTTourismourismourismourismourism (both domestic and international) provides largepossibilities for additional employment in hotel, catering, enterhotel, catering, enterhotel, catering, enterhotel, catering, enterhotel, catering, entertainment, water supportainment, water supportainment, water supportainment, water supportainment, water support,t,t,t,t, andtravtravtravtravtravel industriesel industriesel industriesel industriesel industries. Understandably, it can also expand the market for handloom and handicrafthandloom and handicrafthandloom and handicrafthandloom and handicrafthandloom and handicraftprprprprproducts oducts oducts oducts oducts with consequential expansion of rural non-farm employment. Likewise, substantialadditional employment can come off in, and because of, constrconstrconstrconstrconstruction sectoruction sectoruction sectoruction sectoruction sector development.Building of rural roads, watersheds, educational and health buildings, market yards, wastelandreclamations, and others, can lend tremendous boost to agricultural production, on the one handand resultant non-farm employment, on the other.
● Currently, a number of self-emploself-emploself-emploself-emploself-employment schemesyment schemesyment schemesyment schemesyment schemes, relying on the formation of self-help grself-help grself-help grself-help grself-help groupsoupsoupsoupsoups,seek to enable rural communities to take up diverse economic activities. These schemes areafflicted by overlaps and inefficiencies, involving as they do numerous departments, diverseprocedures and guidelines. The Eleventh Plan would do well to harmonize such schemes andputs them under an integrated self-employment programme that cuts across ministerialboundaries, and has a special component for training and capacity building of educatedunemployed youth, especially in rural areas (Govt. of India, 2006a).
4.34.34.34.34.3 PPPPPrrrrre-re-re-re-re-requisites for Sequisites for Sequisites for Sequisites for Sequisites for Successuccessuccessuccessuccess
From among the numerous pre-requisites for making a success of our ideas, we are persuadedto lay the most heightened emphasis on two. One is the improvement of physical infrastructure, andthe other one is improvement of human capital base.
Lack of adequate infrastrLack of adequate infrastrLack of adequate infrastrLack of adequate infrastrLack of adequate infrastructuructuructuructuructureeeee has been a proverbial weakness that has thwarted a fastergrowth of India's rural economy. The list of bottlenecks is rather long. Power and transport are atopfor industry, no less for agriculture. For rural industry, banking and credit, trading and marketing services,research and extension assistance, business information centres, product designing centres, repairworkshops, have all along continued to be weak spots. To all this, one has now to add communicationand information technology (IT) network that would govern the future working of the industrial systems,whether in rural or urban areas. We have neither time nor space to elaborate on what the policy makersare contemplating to do for bridging the gaps. The best we can do is to reiterate that ideas and proposalsfor rural employment expansion, inside as well as outside agriculture, would remain only a paper exercise,primarily because growth rates would not pick up, if the crucial infrastructure bottlenecks are notremedied. Power and transport are indeed the most restrictive bottlenecks.
The significance of human capitalhuman capitalhuman capitalhuman capitalhuman capital hardly needs to be emphasized. The emerging technology-institutional-human interfaces are likely to defy the frontiers of ordinary human capabilities, especiallythose revealed by the glaring educational deficiencies of the present generation of India's rural workforceand those likely to be reached during the next decade or so, thanks to newer and higher levels ofintelligence and commercial acumen required to survive in the intensely competitive trade regime. Thequality of workforce has to improve no less in agriculture than in other sectors; the new agriculture toocannot 'survive' with its army of illiterate and uneducated workers. And, for seeking entry into non-farm sectors, some critical minimum educational attainment is a must.
There is a lot that India has to do, through education, skill-formation and training, to make

22 ILO Subregional Office for South Asia, New Delhi
its emerging rural labour-force increase its employability, including sustainable and productive self-employability. As yet, there is no evidence of policy thinking for effecting mass improvement. On thecontrary, the increasing pace of privatization of education (and health services) is threatening to widenthe rural-urban, male-female and inter-regional human capital gaps. To the extent that access to 'decentwork opportunities' varies directly with the level of educational accomplishments, the poor-non-poordivide in the Indian labour market in general, and rural labour market in particular, is likely to becomea serious social matter, besides becoming a fetter on growth itself. The recent developments may catapulta handful of Indian workers to the world stage, but the multitude of those languishing behind in loweducation- and skill-intensive, low-productivity rural jobs would create new have-have-not dichotomies.Let us not kill the goose for the egg!
23ILO Subregional Office for South Asia, New Delhi
RRRRReferefereferefereferencesencesencesencesences
Ambasta, Pramathesh; Vijay Shankar, P S; Shah, Mihir. 2008. "Two years of NREGA: The road ahead",in Economic & Political Weekly (Mumbai, EPW Research Foundation), Vol.43, No.8, Feb. 23.
Chadha, G.K. 2007. "The rural non-farm sector in the Indian economy: Growth, challenges andfuture directions", in Ashok Gulati; Shenggen Fan (eds.) The Dragon and the elephant: Agricultureand rural reforms in China and India (Baltimore, John Hopkins University Press).
--------. 2006. "Economic growth, employment and poverty reduction: The case of rural India", (mimeo),(Geneva, International Labour Organization), April.
Comptroller and Auditor General. 2007. "Draft performance audit of implementation of National RuralEmployment Guarantee Act,2005 (NREGA)". Office of the Principal Director of Audit,Economic and Service Ministries, (New Delhi, Comptroller and Auditor General), December.
Corner, Lorraine. 1986. "The prospects for off-farm employment as an anti-poverty strategy amongMalaysian paddy farm households: Macro and micro views", in R.T. Shand (ed.) Off-FarmEmployment in the Development of Rural Asia, (Canberra, Australian National University).
Dev, Mahendra; Ravi, C. 2007. "Poverty and inequality: All-India and states. 1983-2005", in Economic& Political Weekly, (Mumbai, EPW Research Foundation), Vol. 42, No. 6, pp.509-521,Feb.10-16.
Dreze, Jean. 2008. "Employment Guarantee: Beyond Propaganda", The Hindu, (Chennai, The HinduGroup), January 11.
-------. 2006. "National Employment Guarantee Inaction", The Hindu, (Chennai, The Hindu Group),September 12.
Government of India (2008). National Rural Employment Guarantee Act (NREGA): Two Years 2006-08, (New Delhi, Ministry of Rural Development), (n.d.)
-------. 2006. "Employment and Unemployment Situation in India, 2004-05" (Part - I), Report No.515(61/10/1), (New Delhi, Ministry of Statistics and Programme Implementation).
-------. 2006. Census of India 2001: Population projections for India and states 2001-2026,National Commission on Population, (New Delhi, Ministry of Health and Family Welfare), May.
-------. 2006. Towards faster and more inclusive growth: An approach to the Eleventh Five Year Plan,(New Delhi, Planning Commission), June 14.
-------. 2006. The National Rural Employment Guarantee Act 2005 (NREGA), OperationalGuidelines 2006, Annexure-I, (New Delhi, Ministry of Rural Development), February.
-------. 2005. Situation assessment survey of farmers: Indebtedness of farmer households, NSS ReportNo. 498 (59/33/1), (New Delhi, Ministry of Statistics and Programme Implementation), May.
-------. 2005. Report of the Inter-ministry task group on redressing growing regional imbalance, (NewDelhi, Planning Commission), January 2005.

24 ILO Subregional Office for South Asia, New Delhi
-------. 2002. National Human Development Report 2001, (New Delhi, Planning Commission).
-------. 1998. Unorganized manufacturing sector in India: Its size, employment and some key estimates,NSS Report No. 433(July 1994- June 1995), NSSO, (New Delhi, Ministry of Statistics andProgramme Implementation), August.
-------. 1997. Employment and Unemployment Situation in India, 1993-94, Report No. 409, NSSFiftieth Round (July 1993 - June 1994), NSSO, (New Delhi, Ministry of Statistics andProgramme Implementation), March.
-------. 1990. Sarvekshana, Special Number, September.
-------. 1989. Tables with notes on survey of unorganized manufacturing: Non-directory establishmentsand own account enterprises, Part I, Part II (Volume 1 and 2), NSS Report No. 363/1(July1984- June 1985), (New Delhi, Ministry of Statistics and Programme Implementation), June.
-------. National Accounts Statistics & Statistical Abstract of India,CSO, (various issues).
-------. Economic Survey, Ministry of Finance, New Delhi (various issues).
Institute of Human development. 2006. Evaluation and impact assessment of National RuralEmployment Guarantee Scheme in Bihar, (New Delhi, Institute of Human Development),September 9.
International Labour Organisation; Institute for Social Studies Trust. 2006. Study on Women and theNREGA, (mimeo), (New Delhi, ILO), June.
Paroda, R.S. 2006. "Strategy for increasing productivity growth rate in agriculture", Paper submitted tothe Planning Commission, for the proposed draft Eleventh Five Year Plan, July 12.
Saith A. 1992. The rural non farm economy: Processes and policies, (Geneva, ILO).
Shankar, Vijay; Rangu Rao, P S; Banerji, Nivedita; Shah, Mihir. 2006. "Revising the schedule of rates:An imperative for NREGA, in Economic and Political Weekly, (Mumbai, EPW ResearchFoundation), April 9.
Vaidyanathan, A. 1986. "Labour use in rural India: A study of spatial and temporal variations", inEconomic and Political Weekly, (Mumbai, EPW Research Foundation), December 27.
World Bank. 2007. Agriculture for Development: World Development Report 2008, World Bank.