Embed Size (px)
Citation preview

1 of 107 © 2014 ILM
ILM Research Paper 5: Future trends in leadership and management Tom May & David Pardey
May 2014

2 of 107 © 2014 ILM
ILM Research Papers are a series of reports that explore leadership and management topics in detail, to create a resource that trainers and learners may find of use. All ILM’s Research Papers are distributed free of charge and available for download from the ILM website (www.ilm.com/research). They may be copied and used for education and training purposes as long as the source is acknowledged. The report should be cited as:
May, T., Pardey, D (2013) ILM Research Paper 5: Future trends in leadership and management. London: ILM.

3 of 107 © ILM 2014
ILM Research Paper 5: Future trends in leadership and management
Section A Research aims, approach and design 4
A1 Project aim and background 5
A2 Approach and methodology 5
A3 Online survey sample 7
A4 Conceptual and methodological limitations 10
Section B The trends 12
B1 Six trends 13
B2 A new model of capitalism is emerging 13
B3 Flexible working is increasing and is now the norm 16
B4 Relationships are increasingly important both within teams and with external stakeholders 18
B5 The core functions of leadership & management are more important but harder to achieve 19
B6 Managers increasingly prioritise their own employability over stable employment 20
B7 The means of measuring and rewarding performance is more sophisticated 20
Section C Results 23
C1 A new model of capitalism is emerging 24
C2 Flexible working is increasing and is now the norm 37
C3 Relationships are increasingly important both within teams and with external stakeholders 46
C4 The core functions of leadership & management are more important but harder to achieve 52
C5 Managers increasingly prioritise their own employability over stable employment 60
C6 The means of measuring and rewarding performance is more sophisticated 70
Section D Discussion and conclusions 78
D1 A new model of capitalism is emerging 79
D2 Flexible working is increasing and is now the norm 81
D3 Relationships are increasingly important both within teams and with external stakeholders 82
D4 The core functions of leadership & management are more important but harder to achieve 83
D5 Managers increasingly prioritise their own employability over stable employment 85
D6 The means of measuring and rewarding performance is more sophisticated 86
D7 Responses by different groups 87
D8 Implications for leadership and management 89
D9 Conclusions 91
Annex 1 Bibliography 95
Annex 2 Online survey 101

4 of 107 © ILM 2014
ILM Research Paper 5: Future trends in leadership and management
Section A Research aims, approach and design

5 of 107 © ILM 2014
ILM Research Paper 5: Future trends in leadership and management
Section introduction This research builds on a number of ILM research projects. We wanted to know, what will managers and leaders need to know, do and be, if they are to be successful in five years’ time? This section details the aims, approach and methodology. It describes the samples of the managers who participated, then considers the conceptual and methodological limitations.
A1 Project aim and background The Institute of leadership & Management (ILM) has an active research programme and this current research builds on a number of ILM research projects. This research is a joint project between ILM (https://www.i-l-m.com) and QA (http://www.qa.com). We wanted to know, what will managers and leaders need to know, do and be, if they are to be successful in five years’ time? Leadership and management is not a new occupation, so it might be assumed that the competencies are needed have not changed. However, the context in which organisations operate has been changing (not least driven by technological development and continued globalisation, with global supply chains for goods and services). Working practices have also changed; recent ILM research found that for the majority of managers and their organisations, flexible working is the default way of working (ILM, 2013). Furthermore the management workforce is also changing. While they are ageing at a slightly faster rate than the UK working population, generation X managers are increasing and the generation Y or ‘Millennials’ are starting to appear as managers (Pardey & May, 2013). Their approaches to work and life differ from their baby boomer predecessors (ILM, Ashridge Business School, 2011). Also while women remain a (sizeable) minority the balance between male and female managers is becoming more even (Pardey & May, 2013).
A2 Approach and methodology We have approached this project with the assumption that, ‘the future is already here – it’s just not evenly distributed’ (Gibson, 2003). Hence if we can identify current trends and early patterns of behaviour and understand their context and the drivers behind them, we can identify the likely future trends influencing leadership and management in five year’s time. This differs from the scenarios approach which is commonly used for forecasting. Indeed the UK Commission for Employment and Skills (UKCES) has recently published scenarios based research, predicting the nature of jobs and skills in 2030 (UKCES, 2014).

6 of 107 © ILM 2014
ILM Research Paper 5: Future trends in leadership and management
This research aim is more suited to qualitative than quantitative methods and the methods and instruments we have used reflect this. However, we have still used a mixture of methods. We used, (in order):
• A qualitative workshop with expert academic input
• An online community
• An online survey
The qualitative workshop was held in early 2013 with the project staff from both QA and ILM and with the management philosopher Dr Charles Hampden-Turner1. At the workshop, Charles presented a number of trends and his predictions of their impact on future behaviour. These were then debated by the group (including Charles) drawing on our collective knowledge and experience in leadership and management training, coaching, qualifications, policy and research. From this workshop, six trends were identified.
The second stage of the research used an online community. An online community is like a highly moderated online forum with the characteristics of focus groups and questionnaires. An online community enables a high degree of engagement with the moderator (and the other community participants) but also has the benefit of being asynchronous (the members do not have to respond at the same time) and allows participants to reflect and consider before responding to questions and comments (see for example, (Simon, 2009) or (Poynter, 2011)).
Online community members were recruited from the ILM member Linkedin group and contacts known to the research team. Members were primarily selected for recruitment on the basis that they would have experience of management to reflect on and would have the time to participate. Members were also recruited to be from a range of industry sectors (including marketing, HR, pharmaceuticals, education and training, banking, business consultancy and charity sector) and at a range of management levels, from supervisor/ first line manager through to director and board chair. These people worked for organisations varying from SMEs to large multinational companies. The members were also recruited to give a geographical spread, albeit with a UK bias. So while most were working in the UK or Europe, some were working in Asia and one person was working in North America. Finally they were also selected to provide a gender balance. Initially 34 people were recruited and from these a total of 22 people participated throughout the week during which the online community ran in September 2013.
The community was structured so that each day a different trend was presented with an explanation or rationale and supporting evidence (stimulus material).It was then
1 http://www.thtconsulting.com/website/AboutTHT/Bios/CHT.asp

7 of 107 © ILM 2014
ILM Research Paper 5: Future trends in leadership and management
discussed, starting with specific questions and prompts. This stimulus material and associated questions are not presented in this report. However, the stimulus material forms the basis of the next section which presents the trends and the information from the questions are presented in the results section. The initial questions and responses were then followed by additional questions for clarification, as required, and into more general discussion; though given the nature of the method and the distribution across time zones of the participants there was considerable overlap. Each member participated for approximately 15 to 20 minutes a day. Once completed, the script of the responses and discussion were coded manually, to identify general agreement/ disagreement and the common reasons or issues given. This was then used to produce interim findings and dissemination (Elvin & Steer, 2013).
The findings for the third stage were then used to develop an online survey to QA contacts, ILM members and a Toluna panel of 500 managers. In total 1051 people completed the survey and the dataset consists of 1106 respondents. A copy of the survey questions can be found in Annex B. The questions were mainly multiple choice and covered respondents’ experience, perceptions and behaviour as well as their agreement of otherwise with the six trends. Once completed the responses were analysed in IBM SPSS Statistics version 20. Most of the variables in the dataset are either categorical or ordinal. So answers are reported as a percentage, based on the number of people answering each question, selecting each response. Chi-square tests have been used to identify where the responses given by different groups (i.e. sex, or between different levels of manager) are statistically significantly different.
A3 Online Survey sample Of the managers who responded to the survey, the majority of the respondents were male. This is broadly similar to the UK population of managers where 65% are male and 35% are female (Pardey & May, 2013, p. 11). While the sample is slightly skewed towards females, this helped to increase the sample numbers of females at more senior management levels so that more comparisons can be made.
Sex Managers Percentage Female 422 38.2% Male 684 61.8% 1106 100.0%
In terms of age, the females in our sample are two and a half years younger than the UK female manager population, but the overall sample is only under a year younger than UK managers (Pardey & May, 2013, p. 11).

8 of 107 © ILM 2014
ILM Research Paper 5: Future trends in leadership and management
Age Sample % UK managers % Female 42.9 45.4 Male 46.3 46.9 All managers 45.0 45.9
Most of the respondents were working for private sector organisations and again this is broadly similar to the pattern in the UK.
Sector Managers Percentage Public sector 295 26.7% Private sector 722 65.3% Third sector 89 8.0% 1106 100.0%
We also asked our respondents if their organisation has external investors (not directly involved in day to day operations) or shareholders (referred to throughout the report as shareholders), as the table below shows, just over half were working for organisations which did not have shareholders.
Sector Managers Percentage Shareholders 522 47.2% No shareholders 584 52.8% 1106 100.0%
Nearly half of the respondents were from organisations with over a thousand staff. Nearly a fifth are from the medium sized organisations (100 – 500 staff) while over a tenth were from small sized organisations with less than 20 staff. Compared to the UK the sample has a slightly smaller proportion of small businesses and a slightly bigger proportion of large businesses. With this slight skew in mind, in terms of organisational size, the sample is broadly representative.
Organisational size Managers Percentage Fewer than 20 150 13.6% 20 - 49 68 6.1% 50 - 99 79 7.1% 100 - 249 110 9.9% 250 - 499 103 9.3% 500 - 999 80 7.2% Over 1,000 493 44.6% Don’t know 23 2.1% Total 1106 100.0%

9 of 107 © ILM 2014
ILM Research Paper 5: Future trends in leadership and management
The survey sample is representative of the UK, though nearly a third of respondents were from London or the South East.
Country or Region Managers Percentage North East 62 5.9% North West 119 11.4% Yorks & Humber 83 8.0% East Midlands 79 7.6% West Midlands 86 8.2% East 56 5.4% London 148 14.2% South East 182 17.4% South West 78 7.5% Wales 31 3.0% Scotland 94 9.0% Northern Ireland 13 1.2% Other 12 1.2% Total 1043 100.0%
The table below shows the spread across industries; the largest single group work in professional services and consultancy.
Industry Managers Percentage Financial services, banking and insurance 113 10.8% Health and social care 139 13.3% Education 86 8.2% Central or local government (incl. Police and Fire Services) 76 7.3% Retail, wholesale, distribution, travel & transport 130 12.5% Leisure, catering and hospitality 55 5.3% Professional services and consultancy 158 15.1% Engineering, manufacturing, construction and housing 141 13.5% Utilities (water, gas, electricity), post and telecoms 52 5.0% Media, publishing, PR and marketing 20 1.9% Military 4 0.4% Other 42 4.0% Not sure/prefer not to say 27 2.6 Total 1043 100.0%
In terms of ethnicity, the majority described themselves as white and only approximately 8% have replied that they are in a non-white ethnic group, this is broadly representative of the UK manager population where those from non-white ethnic groups form 8.8% (Pardey & May, 2013, p. 13).

10 of 107 © ILM 2014
ILM Research Paper 5: Future trends in leadership and management
Ethnicity Managers Percentage White - English / Welsh / Scottish / Northern Irish / British, Irish, Gypsy or Irish Traveller 885 84.9%
White - Any Other White background 52 5.0% Mixed / Multiple ethnic group - White and Black Caribbean, White and Black African, White and Asian, Any Other Mixed group
17 1.6%
Asian / Asian British – Bangladeshi, Chinese, Indian, Pakistani 37 3.5%
Asian / Asian British - Any other Asian background 13 1.2% Black / African / Caribbean / Black British 14 1.3% Other ethnic group – Any other ethnic group 6 0.6% Don't know/ prefer not to say 19 1.8% Total 1043 100.0%
We have not split the results down by industry sector, region or ethnicity. This is a conscious decision, partly because (particularly region and ethnicity) are not a prime interest in this study and to avoid the need to collect responses from a much larger sample. Instead these details are given here to demonstrate that this sample of managers is, overall, representative of the UK population of managers.
A4 Conceptual and methodological limitations By managers we are referring to those who have specific line management responsibility; at least one person reports to them. Hence management is to do with people not just activities and resources. Leadership concerns inspiring people to achieve things they may not have done otherwise. These are used as operational definitions for this research, and we have deliberately not attempted to fully conceptualise these. For ease, we refer through the report to leadership and management or to leaders and managers. This is a conceptual limitation of the research and we accept that they are not inter-changeable terms or concepts. However, while different, there is overlap. Leadership is shown not just by the senior people at the top of an organisation. Similarly, board level directors have to carry out management functions as well as leadership. As a conceptual compromise we refer generically to leadership and management. Each trend has implications for both, though the nature and strength of those implications will differ.
By using mixed methods this research project is less vulnerable to the methodological weaknesses of any one method. We deliberately choose a workshop in order to identify our potential trends rather than using a scenarios-based approach which works through a detailed identification of potential drivers and trends. The latter requires more intensive work to identify the drivers and trends whereas the approach we have taken is less intensive. However, their findings are still validated by the more in-depth qualitative

11 of 107 © ILM 2014
ILM Research Paper 5: Future trends in leadership and management
online community and the online survey, whose larger numbers enable wider generalisation.
Recruitment to and drop out from the online community was a potential issue. This was mitigated by careful recruitment which included clear communication of the commitment expected from the community members. More than the minimum required number were recruited to ensure that the group would remain ‘quorate’.
The spread of members across time zones and industry sectors ensured that the whole group was not affected by one event (such as Thanksgiving or being away on a weekend). We have explained above that given that the online community members would read and respond at different times, there was overlap between members answering initial questions and engaging in the discussion. There is a risk that those reading and answering after others would be biased by previous responses. To minimise this risk, each member could only see the other responses once they had responded to an initial question (which asked them to rate their level of agreement) and to explain their answer. For the later questions and discussion each member could see the other’s comments. While it is possible that earlier answers biased subsequent comments from other members, this was not overtly evident as members appeared comfortable in contradicting or qualifying what others had said. It may be that the more anonymous environment (none of the participants knew each other before) and indirect nature of the method (compared to being face to face in a traditional focus group) encouraged this.
Finally, while overall survey sample numbers are reasonably large for leadership and management research, it is still possible to reach small cell sizes by segmenting responses by just one or two categories. Generalising from small numbers of people can be problematic and so we try to avoid more than one cross tabulation at a time and report both statistical significance and its effect size. As mentioned earlier, it is partly for this reason that we do not split results by region, industry sector or ethnicity. Again to avoid small cell sizes where comparisons are made by management level, responses from senior managers and board level managers have been combined. Similarly, comparisons by age are organised by two groups (35 years and younger, 36 or older).
In order to mitigate the potential bias in our sample we have deliberately taken conservative interpretations of the results. We also highlight this potential methodological issue when reporting specific findings. One area where this might be the case concerns third sector organisations, which only eight percent of the managers responding to the survey where from. This means that we are less likely to detect significant differences in responses from managers in this group compared to those working for private or public sector organisations. Ideally we would over sample this group to avoid this limitation.

12 of 107 © ILM 2014
ILM Research Paper 5: Future trends in leadership and management
Section B
The trends

13 of 107 © ILM 2014
ILM Research Paper 5: Future trends in leadership and management
Section introduction This section introduces and explains the six trends identified and their drivers. It is here that we refer to some of the relevant literature and other sources to evidence these trends and drivers. B1 Six trends These trends have been identified from an initial workshop, as described in the previous section. Some of the trends act as drivers on other trends and some drivers influence more than one trend. The six identified trends are:
• A new model of capitalism is emerging
• Flexible working is increasing and is now the norm
• Relationships are increasingly important both within teams and with external stakeholders
• The core functions of leadership & management are more important but harder to achieve
• Managers increasingly prioritise their own employability over stable employment
• The means of measuring and rewarding performance is more sophisticated
For ease and consistency these trends are generally presented in this order through the report. This is not intended to infer relative importance or order of causation.
B2 A new model of capitalism is emerging Of all the future trends this first one is the grandest and requires the most explanation. There is an increasing appetite for a new model of capitalism to replace the current dominant model in publicly-quoted businesses which focusses on maximising short-term shareholder value. This is driven by two influences:
• The recent crises of capitalism centred in North America and Europe and financial and business scandals
• The increasing economic, cultural and political influence of the countries in East Asia.
The 2008 banking crisis, economic crash and associated Euro crisis vividly demonstrated that far from achieving stable economies, large and apparently profitable banks such as Northern Rock or Lehman Brothers can fail with little warning. Also the

14 of 107 © ILM 2014
ILM Research Paper 5: Future trends in leadership and management
experiences of Ireland and Greece with the euro-crisis have shown that countries too can almost literally have to be taken into administration. The report of the UK House of Commons Treasury Committee into the banking crisis stated:
Governments, politicians, regulators and central bankers in the UK and across the world share a responsibility for sustaining the illusion that banking growth and profitability would continue for the foreseeable future. A culture of easy reward, illustrated by risky lending of credit and capital, has been underpinned by an assumption of continuous expansion in banking accompanied by an expectation of ever bigger bankers’ rewards. (House of Commons Treasury Committee, 2009, p. 14)
Additionally in the last five years there have been various scandals, including LIBOR rigging (BBC, 2013), mis-selling of PPI (BBC, 2011), contamination of beef products with horsemeat (Food Standards Agency, 2014) and the infamous ‘London Whale’ who cost JP Morgan (considered one of the safer investment banks) multi-billion losses plus fines (Financial Times, 2014). These and other scandals are evidence of the sense that there is something wrong. The occupy movement, which included an encampment around St Paul’s close to the London Stock Exchange in October 2011 until evicted in June 2012, challenged the model of capitalism. While they may have overtly failed to have changed the system, their criticism has been recognised and questioning the status quo has become more mainstream (Kirkup, 2012). In the wake of the banking crash and scandals, described in section B, there is increased public and media pressure (see for example Porter & Kramer (2011)); this has emphasised corporate social responsibility (CSR).
The second driver is the increasing influence of the East Asian economies, notably China and South Korea, in addition to Japan where, although not immune to short term pressures for strong quarterly reports, there is also a longer term view and an emphasis on and commitment to long term relationships between customers, businesses and their suppliers (Smith, 2013).
It is accepted that there are different types, or varieties, of capitalism (Hall & Soskice, 2001), although the exact number of these varieties and the parameters for distinguishing them are not agreed in the literature (Jackson & Deeg, 2006). One of these varieties is shareholder capitalism. This prioritises the interests of shareholders and is typified by a short term outlook to maximise short term profits; business decisions are made more on the basis of cost than on the strength of relationships with clients or suppliers. While it has been much criticised, it remains dominant (Mayfield, et al., Dec2011 - Feb2012).
This current model of capitalism is described by Raj Sisodia (Professor at Babson College, Massachusetts, US2) and John Mackey (founder and co-CEO of Whole Foods
2 http://www.babson.edu/academics/faculty/profiles/pages/sisodia-raj.aspx

15 of 107 © ILM 2014
ILM Research Paper 5: Future trends in leadership and management
Market which has more than 360 stores (Wholefoods Market, 2014)) as shareholder capitalism. They promote a new model of capitalism which considers the benefits to all stakeholders. They call it Conscious Capitalism (Mackey & Sisodia, 2013). Central to their argument is that each business has a higher purpose, other than to make money and that it is not a zero sum game; one stakeholder does not necessarily have to ‘lose’ for another to ‘win’. Examples of this alternative model of capitalism are provided by the growing benefit corporation (‘B Corps) movement. B Corps are for-profit companies certified against transparency, social, environmental and accountability standards (similar to Fair Trade). There are over 950 benefit corporations across 32 countries from its start in the United States (B Lab, 2014). Although generating short term profit for shareholders is the antithesis of B Corps and there isn’t public data on their financial performance, there is some evidence that they can deliver market beating performance. Harvard Business Review found that Millenials want to work for a higher purpose than just pay. Hewitt Associates have stated that companies where employee engagement is higher outperformed the stock market by nearly twenty percent (quoted by (B Lab, 2014).
In what appears to be synonymous with conscious capitalism, the CEO of Unilever refers to responsible capitalism in which, [g]rowth and the needs of society don’t actually work against each other, but go hand in hand’ (CBI, 2012).
The political economist and writer Will Hutton also refers to responsible capitalism in his call for adoption of good capitalism to replace, what he describes as, bad capitalism. Like Mackey and Sisodia, he argues that firms should have a higher purpose than profit. Hutton also argues that a precondition of good capitalism is, ‘plural, engaged and stewardship-orientated ownership’ (2012b, p. 16), he explains that this is a, ‘variant of north European stakeholder capitalism’ (2012).
Stakeholder capitalism was presented as a model by Freeman et al. (2007), which, ‘focuses on individuals voluntarily working together to create sustainable relationships in the pursuit of value creation’ (ibid. p. 311). In stakeholder capitalism no one group dominates and each accepts responsibility for the outcomes (economic, environmental and social) of their actions. Hampden-Turner appears to regard conscious capitalism and stakeholder capitalism as broadly synonymous (2013). Its stakeholder orientation is recognised by others (Fyke & Buzzanell, 2013, p. 1623) which Mackey and Sisodia include as ‘stakeholder integration’ in its four central tenents (2013, p. 32).
Shareholder or bad capitalism is characterised in the literature by shareholder dominance and a drive for short term profits. Additionally some commentators also highlight disproportionate reward for poor performance to staff, or even failure, particularly in the financial sector; for example, Hutton (2012b) and Walker (2013).
The proposed responses, stakeholder, conscious or good capitalism are not clearly defined. So the extent to which they are the same is not clear. However, they do share common characteristics. These include a longer term focus and less emphasis on shareholder profits to the exclusion of other stakeholders’ interests; the relative balance of interests between different groups is not regarded as a zero-sum game
16 of 107 © ILM 2014
ILM Research Paper 5: Future trends in leadership and management
(Hutton, 2012b), (Mackey & Sisodia, 2013). They also emphasise the social purpose for being in business; profit is a means to further social ends, not an end in itself. For the purposes of this report stakeholder, responsible, conscious and good capitalism are regarded as the same broad construct which offers an alternative model to shareholder or bad capitalism.
Hampden-Turner highlights the key difference between these two models of capitalism as being the order in which shareholders are rewarded. In shareholder capitalism, when it comes to wealth creation, shareholders’ needs are satisfied first. In stakeholder capitalism their needs are met last, though he explains they are not the least important:
It means there is no wealth for anyone until managers have inspired employees, employees have served customers, these latter have upped their purchases and provided revenue. It is from this revenue that shareholders are paid their share. It follows that that cutting employee costs, paying suppliers late, preying on your customers, avoiding taxes etc. are all self-defeating. It makes everyone else poorer and in the end harms shareholders too. (Hampden-Turner, 2013, p. 3)
There is a lack of literature on the resulting difference in practice by managers in the UK in response to the calls for a move towards stakeholder capitalism and away from shareholder capitalism. This article refers to the example of the Unilever CEO’s vision and highlights the examples of B Corps. However, there is no readily available literature on managers’ perceptions of their changing orientation towards one model or the other.
These drivers and indicators are far from conclusive (and there is plenty of anecdotal evidence that in investment banking, for example, there has been little cultural change, see, for example, Benjamin (2012) or Jacobs (2013)). However, as a whole, they do demonstrate a trend which, if not dominant, is certainly established at least with a minority at present.
B3 Flexible working is increasing and is now the norm Flexible working (flexibility regarding when and where employees work) has increased and recent ILM research concluded that for the majority or organisations in the UK this is now normal (ILM, 2013). There are two main drivers behind this trend:
• The increased connectivity that IT development offers
• The increased expectations colleagues and customers to have immediate service or response
There are also other drivers, though they are not quite as influential, they include:
• The need to attract and retain key talent (the ‘war for talent’, for a brief overview see Wikipedia (2013))

17 of 107 © ILM 2014
ILM Research Paper 5: Future trends in leadership and management
• The increased efficiency gained from smaller offices that home working and hot desks offer
The continuous improvement in IT and speeds in data transfer (wired, wifi, 3G and 4G) mean that knowledge workers do not have to go to a physical office location to access email or documents. In the past few years this has been accelerated as the ubiquity of computer devices and increased data speeds have allowed fast and convenient access to files, often at any time of the day and from almost any location (as long as there is an internet connection). This change is indicated by the growing public awareness of cloud computing (Carlebach, 2014) and the use of coffee shops in lieu of traditional office space (see for example BT (2012)). Because we can read and reply quickly, there is a growing expectation that we will and colleagues and customers expect near immediate responses to their queries. This is further underlined by the global nature of many organisations and their supply chains where colleagues (and customers) may be living in different time zones – being halfway between East Asia and North America, this is particularly noticeable in Europe.
It might be considered with the global recessionary conditions since 2008 that the ‘war for talent’ is no longer relevant. Yet in certain areas there remain skills shortages and so competition for key talent remains (UK Border Agency, 2013); (Holt, et al., 2010); (Groom, 2013). Where budgets are constrained, flexible working improves the offer organisations can make to recruit or retain such individuals; at little or no cost. Furthermore, as the Millennials become an increasing proportion of the workforce, they are seen to have increased expectations to work flexibly, which they might prioritise over higher pay, though older workers may be equally keen to work flexibly (Finn & Donovan, 2013).
Unsurprisingly knowledge-based organisations have realised that large offices with individual desks are an overhead that can be reduced by having smaller office buildings with hot desks. Indeed, potentially when workers are away from the office they may be more productive; consequently the purpose and function of office buildings should be revised (Millard & Gillies, 2011).
The effect of these drivers is the increasing incidence of flexible working. This is despite a tendency towards increased presenteeism (Canada Life, 2012) and being seen to be at the office, driven by fear of job insecurity in the recessionary economic conditions. In 2013, ILM found that almost three quarters of managers said their organisations were largely supportive of flexible working and 94% said their organisations offer some form of it (ILM, 2013, p. 2). Hence flexible working is now normal. Between 60-65% of managers agreed that flexible working engendered greater staff motivation, better staffing to organisational needs and to customer needs (ILM, 2013, p. 6).
With flexible working as the new normal, for teams to be successful, managers and their reports need to have higher levels of trust in each other. Both sides need to be able to communicate effectively without the need to read body language or facial expressions. Managers have to take a facilitative rather than directive approach to managing and directing their reports; this may be new to both them and their reports.

18 of 107 © ILM 2014
ILM Research Paper 5: Future trends in leadership and management
Associated with flexible working is the increase in virtual teams (see for example Lekushoff (2012)). These may be co-located, but from different teams, or spread across the globe. They may also be interdisciplinary. One of the scenarios for the nature of jobs and skills in 2030, published by UKCES (2014) highlights the ability to collaborate within such teams in order to take advantage of new opportunities. This leads onto the importance of working relationships.
B4 Relationships are increasingly important both within teams and with external stakeholders This trend is driven in part by the increased emphasis that conscious or stakeholder capitalism places on long term relationships, rather than just transactions. The increase in flexible working also makes relationships more important. As mentioned in the above section, higher levels of trust are needed as it is more difficult to observe people’s behaviour remotely. Particularly with virtual teams, it is more difficult to engender the desired team identity, ways of working and culture; a more concerted effort is required compared to a co-located team with fixed hours and location.
There is also another and perhaps more powerful driver, which is characterises modern day living and working but which is easy to overlook: that is the network. The politician and diplomat Paddy Ashdown describes this as the:
… paradigm structure of our time… In the modern age where everything is connected to everything, the most important thing about what you can do is about what you can do with others. (Ashdown, 2011)
This concurs with Charles Hampden-Turner’s observation that value comes from relationships not individuals. So the most important thing is not having the best individuals in the team but the best working relationships (Hampden-Turner, 2013).
A further driver comes from the increased influence of the East Asian economies where there is already increased influence on relationships. For example in China, the concept of ‘guanxi’ (approximately translated as ‘relationships’) is a necessary condition for business success. ‘Quanxi’ operates on a personal level between individuals, is reciprocal and has a longer term focus, with each party obligated to the relationship (Yang, 2011, p. 164). This doesn’t mean that there aren’t the same or similar pressures to achieve quarterly targets, but the emphasis is beyond purely transactional relationships with suppliers and customers.

19 of 107 © ILM 2014
ILM Research Paper 5: Future trends in leadership and management
B5 The core functions of leadership & management are more important but harder to achieve Managers and leaders must still exercise the core functions (which have not changed) of management and leadership. We do not exhaustively define these core functions, as doing so could easily become a research project within its own right, but to give an indication they include:
• Planning, organising and co-ordinating activities
• Task delegation
• Communicating with and motivating direct reports
• Performance monitoring performance and providing feedback
The UK is noted by the UK Government Department for Business Innovation & Skills (BIS) as being about halfway down the management league tables amongst the advanced economies, improved management quality in UK firms could markedly increase overall productivity (Bloom, et al., 2011). However, they must increasingly exercise the core functions in less time and in a more complex environment.
The lack of time is caused partly by the higher tempo of communications (as described above with the increase in flexible working) and, when dealing with people working in different time zones, there is no clearly defined end to the working day. The lack of time may also be caused by the introduction of flatter management structures, where managers are responsible for more direct reports and projects or functions.
The context within which managers are expected to manage and lead their people is more complex. Within IT, finance, manufacturing and engineering for example, progress has meant that the products and processes have become more sophisticated and more difficult to understand. It was lack of understanding in the banking sector that led, in part, to the 2008 crash. In giving evidence to the House of Commons Select Committee, Jon Danielsson (Reader in Finance at the London School of Economics) explained:
… the individual making things complicated is not at the top of the bank, [he] is in the middle of the bank. This is the ‘quant guy’ [quantitative trader], the 35-year-old, whatever he is; he creates instruments. His boss has no understanding of what he has is doing, the regulator has no understanding of what he is doing. All they know is that he is making money from some black box. (House of Commons Treasury Committee, 2009, p. 37)
Another layer of complexity is added by the many potential channels of communication, in addition to face to face conversations or telephone calls, it is possible to talk to a business colleague or customer using a mixture of email, instant messaging, Skype/Facetime, Linkedin, Facebook or Twitter. Meanwhile managers must find time to focus on core management responsibilities such as task or project delegation,
20 of 107 © ILM 2014
ILM Research Paper 5: Future trends in leadership and management
performance monitoring and motivating and developing their direct reports; who are also subject to similar time pressures and multiple communication channels.
These core functions are more important now because they are even more crucial for team and organisational success in this more complex and interconnected environment; not simply because they are harder to achieve. Indeed a comparison of managers’ and employees’ perceptions shows that managers really cannot over do the basics or core functions of leadership and management (ILM, 2013, p. 11).
B6 Managers increasingly prioritise their own employability over stable employment A job for life with one organisation, even if it ever existed, is no longer the default assumption; the legal and psychological contracts between employers and employees have changed rapidly. The interim management sector is forecast to grow to £2 billion a year in the UK by 2015 (Interim Management Association, 2012). ILM’s research, on talent pipelines, found that just 55% of managers are recruited internally to organisations and that the ratio of internal recruitment drops with seniority (ILM, 2012, p. 4). The tougher employment market over the last five to six years has made some managers more defensive. Others are embracing the realisation that it is the ability to get employment, rather than the particular job that they are currently in, that matters. This comes from the acceptance that there is no immunity from potential job redundancy and the most rational response is to be prepared to find other employment.
For some accepting this new reality, it is seen as an unpleasant necessity. For others, it provides freedom and opportunity for career progression and to vary their work/life balance to best suit their personal circumstances. Some are able to do this within organisations, others work as freelancers to maintain such freedom. The UKCES, in looking at scenarios for 2030, highlights the importance of freelancers continuously investing in their own skills and development, to maintain a compelling offer in the labour market (UKCES, 2014). They may be at the more extreme end of the spectrum, yet for those in the middle they too increasingly need to take an interest in their own professional development. If they do not it is increasingly unlikely that anyone else will do this for them.
B7 The means of measuring and rewarding performance is more sophisticated More and more, employers are seeking to reward employees individually, based on their personal contribution to the organisation achieving its goals. This requires three key elements to be in place:

21 of 107 © ILM 2014
ILM Research Paper 5: Future trends in leadership and management
• Clarity about what employees are expected to do
• The ability of managers to be able to assess that performance effectively, and to provide feedback and support to help employees improve their performance
• Employees to be motivated, by the possible rewards available to them, to raise their performance
One of the benefits from the increased sophistication and complexity of modern organisations is that it is possible to measure more and more sophisticated indicators of performance beyond basic metrics on sales or expenditure. Over the last two years there has been growing interest in and excitement about big data, which some people expect will revolutionise research and analysis in various fields, including management (see for example, (Naughton, 2012) or (McAfee & Brynjolfsson, 2012)). Big data is possible because of the computational power now available to collect, store and analyse very large and complex data sets in an acceptably short period of time. It is often referred to in terms of being ‘high-volume, high-velocity and high-variety’ (Gartner, 2013). So a supermarket using historical sales data to determine what and how much to stock next week, isn’t necessarily using big data. A supermarket using historical sales data, stock data, detailed weather forecasts and readings and social data, probably is using big data (Asay, 2013).
More and more representative indicators of staff performance may usually not be a big data issue (at least not in small or medium size organisations). However, its adoption by organisations does point towards an increase and diversification of performance indicators beyond simple sales targets or proportion of targets met on schedule.
Recent findings from ILM’s research into employee motivation and reward indicates that managers were less effective than they think themselves to be in communicating clear goals and outcomes, in providing feedback, or helping employees to improve their performance (ILM, 2013). Women in particular were critical of the way that their organisation’s performance management system operated and there was significant cynicism about its role in improving performance.
The top priorities for employees were the enjoyment they got from their job and the quality of the relationship they had with their colleagues and their manager. Although they expected to be paid appropriately, bonuses and other performance-related financial incentives were important only to a small proportion of the employees we surveyed (who were selected to be broadly representative of the UK workforce). These were either (mainly male) better paid employees or young, lower paid employees. Both groups were far less likely to be concerned about the organisation or other people, so the trade-off for employers in attracting people who are more financially motivated is far less commitment to the organisation and the team.
Given this, organisations need to think carefully about how they approach the whole area of performance improvement and the use of financial rewards to motivate employees to reach and surpass personal and organisational goals. This isn’t to say

22 of 107 © ILM 2014
ILM Research Paper 5: Future trends in leadership and management
that they shouldn’t be used, but they need to be constructed in ways that reflect what employees told us really matters to them.

23 of 107 © ILM 2014
ILM Research Paper 5: Future trends in leadership and management
Section C
Results

24 of 107 © ILM 2014
ILM Research Paper 5: Future trends in leadership and management
Section introduction This section presents the results from the online community and online survey by each trend. Detailed numbers are given through charts and table. Where there are statistically significant differences in responses by specific groups we provide the statistical reporting. All of these are accompanied by a commentary. It is in this section that some of the key themes emerge. C1 A new model of capitalism is emerging Discussion amongst the Online Community suggested that questioning of the current paradigm is now mainstream. There is appetite for change and a sense that change is in the air but it remains ephemeral, as one manager reflected, ‘My belief is that this is trendy and not necessarily a trend’ (male, senior manager). The Community suggested that the main driver is whether external shareholders or investors are involved or not: they drive the need for a short term focus and quarterly reports. As one participant reflected:
Short term qly [sic] focus on bottom line always takes priority over any other objective. More social behaviour and CSR [corporate social responsibility] along with all stake holder health becomes a focus if the basic profit goals are being met. If not, shareholder value and the pressure this generates in short term takes precedence from what I have observed. … Somehow short term profit and value generation even at cost of mkt [market] share and long term sustainability is not a principle that majority of mgt [management] boards have the courage and discipline to follow except for a few corporates. (male, board director)
We asked the survey participants, compared to five years ago, ‘are your dealings with suppliers and customers based more on cost or more on the strength of the relationship (trust)?’ A third felt there was no change, but of the remainder nearly ten per cent more respondents thought that the emphasis on cost was greater than those thinking it was relationships. But views were significantly different between those who work for organisations with shareholders or external investors and those whose organisations don’t. As chart 1 shows, those without shareholders were significantly more likely to say that there had been no change. The views of managers from organisations with shareholders had diverged over the last five years. They were significantly more likely to say that they were either more cost orientated or more relationship orientated3.
3 X2 (2, N=1106) = 22.848, p<.001. Cramer’s V = .144

25 of 107 © ILM 2014
ILM Research Paper 5: Future trends in leadership and management
Around ten per cent more said that they were more cost orientated. The strength of association is weak, but nevertheless statistically significant.
Total Shareholders No Shareholders
More cost orientated 37.7% 41.6% 34.2%
No change 33.8% 26.6% 40.2%
More relationship orientated 28.5% 31.8% 25.5%
Total (N) 100.0% (1106)
100.0% (522)
100.0% (584)
Again, managers from small organisations were more likely to see no change and significantly less likely to have become more cost orientated or more relationship orientated. Similarly managers from large organisations were more likely to have become either more cost orientated or more relationship orientated and less likely to
0.0%
20.0%
40.0%
More cost-orientated No Change More relationship orientated
Chart 1: More cost or relationship orientated compared to five years ago,by shareholder relationship
Total Shareholders No Shareholders

26 of 107 © ILM 2014
ILM Research Paper 5: Future trends in leadership and management
report no change4. Although visible on chart 2, the differences for medium sized organisations are not statistically significant.
1 - 49 50 - 250 250+
More cost-orientated 29.8% 35.4% 41.1%
No change 49.1% 38.1% 26.8%
More relationship orientated 21.1% 26.5% 32.1%
Total (N) 100.0% (218)
100.0% (189)
100.0% (676)
We also asked the managers responding to the survey if they were more short term (for example next quarterly report) or long term (one, two or three years) in their outlook at work, compared to five years ago. As chart 3 shows, in total approaching half (45%) said that they were taking a longer term perspective. When comparing those from organisations with shareholders and those without, the former (at 51%) were significantly more likely to say that they were had a longer term outlook. While those from organisations without shareholders were also most likely (at almost 40%) to be
4 X2 (6, N=1106) = 47.921, p<.001. Cramer’s V = .147
0.0%
20.0%
40.0%
1-49 50-250 250+
Chart 2: More cost or relationship orientated compared to five years ago, by organisation size
More cost orientated No Change More relationship orientated

27 of 107 © ILM 2014
ILM Research Paper 5: Future trends in leadership and management
taking a longer term view, they were significantly more likely than their shareholder-related counterparts to say that they had not changed5. As before, the strength of association between shareholder and non-shareholder related groups is weak, indicated by a low Cramer’s V value, though significant.
Total Shareholders No Shareholders
More long term 45.2% 51.3% 39.7%
No change 30.3% 24.3% 35.6%
More short term 24.5% 24.3% 24.7%
Total (N) 100.0% (1106)
100.0% (522)
100.0% (584)
There are also a few differences by organisation size (Chart 4). Managers from small organisations (1-49 people) were significantly more likely to say that there has been no change over the last five years and less likely to say that their outlook has become
5 X2 (2, N=1106) = 19.830, p<.001. Cramer’s V = .134
0.0%
20.0%
40.0%
60.0%
More long term No Change More short term
Chart 3: Outlook at work more long term or short term compared to five years ago, by shareholder relationship
Total Shareholders No Shareholders

28 of 107 © ILM 2014
ILM Research Paper 5: Future trends in leadership and management
more long term. This is in contrast to those from large organisations with 250 or more people who were more likely to say that their outlook is now more long term and less likely to say that there has been no change6. This may indicate that small organisations changed their outlook either more rapidly or more than five years ago, whereas the large organisations are changing now.
1 - 49 50 - 250 250+
More long term 32.6% 45.0% 49.7%
No change 39.9% 36.0% 24.7%
More short term 27.5% 19.0% 25.6%
Total (N) 100.0% (218)
100.0% (189)
100.0% (676)
We also asked if, compared to five years ago, they were more process orientated or more outcomes orientated (Chart 5). In total managers were most likely to say that they
6 X2 (6, N=1106) = 37.927, p<.001. Cramer’s V = .131
0.0%
20.0%
40.0%
1-49 50-250 250+
Chart 4: Outlook at work more long term or short term compared to five years ago, by organisation size
More long term No Change More short term

29 of 107 © ILM 2014
ILM Research Paper 5: Future trends in leadership and management
were more outcomes orientated (almost 42%). However, again the differences between managers from shareholder-related organisations and those who were not, are evident. Managers from organisations without shareholders (Chart 5) were significantly more likely to say that they have not changed compared to their shareholder-related counterparts. The shareholder-related group, again appear to have diverged, becoming more outcomes orientated or more process orientated. They were significantly more likely (at 38%) than non-shareholder-related managers to have become more process orientated (at 24%)7.
7 X2 (2, N=1106) = 19.830, p<.001. Cramer’s V = .134
0.0%
20.0%
40.0%
More process orientated No Change More outcomes orientated
Chart 5: More process or more outcomes orientated compared to five years ago, by shareholder relationship
Total Shareholders No Shareholders

30 of 107 © ILM 2014
ILM Research Paper 5: Future trends in leadership and management
Total Shareholders No Shareholders
More process orientated 30.7% 38.3% 24.0%
No change 27.8% 20.3% 34.4%
More outcomes orientated 41.5% 41.4% 41.6%
Total (N) 100.0% (1106)
100.0% (522)
100.0% (584)
Given the sample size, it is possible to compare the responses for length of outlook and for process or outcomes orientation, by company size. The results are broadly but not entirely what might be expected. Overall, for organisations of all sizes, managers were more likely to report no change for both questions and less likely to report no change for only one8. Managers in large organisations were significantly more likely to report being more outcomes orientated and having a longer term outlook or being more process orientated and having a shorter term outlook9. However, there were confounding patterns in the responses from managers of small and medium size organisations (more short term and outcomes orientated or more long term and process orientated)10.
Again, in Chart 6, we see significant differences between managers in small organisations, who were more likely to say there has been no change rather than that they have become either more process or more outcomes orientated, and those from large organisations. Those managers, in large organisations, were significantly more likely to respond that they were either more process orientated or more outcomes orientated but less likely to say there had been no change11.
8 X2 (4, N=1106) = 124.183, p<.001. Cramer’s V = .237 9 X2 (4, N=676) = 43.892, p<.001. Cramer’s V = .180 10 Small organisations: X2 (4, N=215) = 41.945, p<.001. Cramer’s V = .310 X2 (4, N=189) = 26.258, p<.001. Cramer’s V = .264 11 X2 (6, N=1106) = 61.832, p<.001. Cramer’s V = .167

31 of 107 © ILM 2014
ILM Research Paper 5: Future trends in leadership and management
1 - 49 50 - 250 250+
More process orientated 21.1% 31.2% 34.5%
No change 44.5% 31.2% 20.4%
More outcomes orientated 34.4% 37.6% 45.1%
Total (N) 100.0% (218)
100.0% (189)
100.0% (676)
There was only one significant difference between managers from public, private or third sector organisations. Managers from private sector organisations were significantly more likely to have said that they were more outcomes orientated. Managers from third sector organisations were significantly less likely to say that they were more outcomes orientated12. This question asked about relative change over the previous five years, so these responses do not indicate that third sector managers are less outcomes orientated than their private sector colleagues, merely that they haven’t
12 X2 (4, N=1106) = 9.938, p=.041. Cramer’s V = .067
0.0%
20.0%
40.0%
1-49 50-250 250+
Chart 6: More process or more outcomes orientated compared to five years ago, by organisation size
More process orientated No Change More outcomes orientated

32 of 107 © ILM 2014
ILM Research Paper 5: Future trends in leadership and management
changed as much. The overall strength of association is only .067, below the level .1 used as the threshold to indicate association.
Having compared whether managers feel they have become more cost or relationship orientated over the last five years, we asked if they thought the nature of their work would become more cost or relationship orientated in five years’ time. The pattern, illustrated in Chart 7, is broadly similar to the reflection on five years ago compared to now, except that fewer non-shareholder-related managers thought there would be no change. They were more likely to expect no change than their shareholder related counterparts; though the strength of association is less than the generally accepted Cramer’s V threshold of 0.113. Overall, the largest proportion (at around 40%) expect that the nature of their work will be more cost orientated, though approximately 30% expect that it will be more relationship orientated.
13 X2 (2, N=1051) = 7.820, p=.020. Cramer’s V = .086
0.0%
20.0%
40.0%
More cost orientated No change More relationship orientated
Chart 7: More cost or more relationships orientated in five years time, by shareholder relationship
Total Shareholders No Shareholders

33 of 107 © ILM 2014
ILM Research Paper 5: Future trends in leadership and management
Total Shareholders No Shareholders
More cost-orientated 41.2% 43.7% 38.5%
No change 27.7% 23.6% 31.3%
More relationship orientated 31.1% 32.7% 29.7%
Total (N) 100.0% (1106) 100.0% (522) 100.0% (584)
The same pattern that we have observed by organisation size is also visible when comparing managers’ expectations for five years’ time (Chart 8). Those from small organisations were more likely to expect no change in contrast to becoming more cost or relationship orientated. Medium sized organisations were also more likely to expect no change. Managers from large organisations were more likely to expect the nature of their work to become either more cost or more relationship orientated; they were less likely to expect there to be no change14.
14 X2 (6, N=1051) = 57.031, p<.001. Cramer’s V = .165
0.0%
20.0%
40.0%
1-49 50-250 250+
Chart 8: More cost or more relationships orientated in five years time, by organisation size
More cost orientated No change More relationship orientated

34 of 107 © ILM 2014
ILM Research Paper 5: Future trends in leadership and management
1 - 49 50 - 250 250+
More cost-orientated 33.8% 37.0% 44.9%
No change 42.5% 36.5% 19.7%
More relationship orientated 23.7% 26.5% 35.4%
Total (N) 100.0% (218)
100.0% (189)
100.0% (676)
There are also some significant differences between public and private sector managers. Public sector managers were significantly more likely to expect the nature of their work to be more cost orientated and less likely to expect no change. Those from the private sector had the opposite expectations; more likely to expect no change and less likely to expect more emphasis on cost15. The strength of association however, at .085, is considered minimal.
When considering whether managers’ outlooks at work will be more long term or more short term in five years from now, the pattern is much clearer in Chart 9. Around three quarters thought that there will either be no change or they’ll have a longer term outlook – slightly under a quarter felt that they will be more short term. There are no significant differences associated with shareholder involvement.
15 X2 (4, N=1051) = 14.738, p=.005. Cramer’s V = .085

35 of 107 © ILM 2014
ILM Research Paper 5: Future trends in leadership and management
Total Shareholders No Shareholders
More long term 38.7% 41.7% 36.1%
No change 38.9% 36.8% 40.8%
More short term 22.4% 21.5% 23.1%
Total (N) 100.0% (1106)
100.0% (522)
100.0% (584)
There were no significant differences between the responses of third, private or public sector managers. Though there were a couple of differences between managers in small and large organisations. Managers in small organisations were more likely to expect no change rather than having a longer term outlook. Managers in large organisations were more likely to expect their outlook to be more long term and less likely to expect no change16. However, the overall strength of association is not beyond the minimum considered level of .1.
16 X2 (6, N=1051) = 15.163, p=.019. Cramer’s V = .085
0.0%
20.0%
40.0%
More long term No change More Short term
Chart 9: Outlook at work more long term or more short term in five years time
Total Shareholders No Shareholders

36 of 107 © ILM 2014
ILM Research Paper 5: Future trends in leadership and management
1 - 49 50 - 250 250+
More long term 31.9% 37.0% 42.0%
No change 46.4% 39.8% 35.4%
More short term 21.7% 23.2% 22.6%
Total (N) 100.0% (207) 100.0% (181) 100.0% (641)
A couple of members of the online community pointed out that SMEs are more likely to be led by their owners (family owned or privately held) than to have external shareholders. While cashflow remains very important, SMEs can focus more on the medium to longer term, internal (employee) shareholding and profit sharing may be more common. It was felt that the inspirational leaders needed, to change the shareholder capitalism paradigm, are more likely to be owners than part of a corporate management board; they sensed little change amongst businesses with shareholders.
Overall the evidence for this trend is mixed. When asked if they recognised this trend towards a longer-term relationship-orientated model of capitalism, only 22% agreed. The managers we surveyed generally prioritise cost over relationships (though between a quarter and a third see relationships as more important). Yet most support was for outcomes, rather than process, and being longer term, rather than short term.
Within the online community the divergent views by managers, in organisations with shareholders, on prioritising costs or relationships (illustrated the in the charts) was also evident. There was also a sense that much of the CSR activity from businesses is merely presentational. As one experienced coach explained, ‘I would look to the conversations in senior executive teams and here the emphasis is still on the short term shareholder values’ (female, CEO). Yet for some people the experience of the last five years has shifted values:
The basic problem is personal greed, which usually demands swift returns. What we are seeing now is a spread of people who are prepared to be less personally greedy, partly because of recent enlightenment. (male, senior manager)
A few of the online community remarked on the increase in social enterprises and charities or on existing companies seeking to increase the benefits to society and to differentiate themselves within the market. This was explained by a senior manager at one of the large accountancy/consultancy firms:
The model of capitalism still exists, of course, the Firm wants to make money for the partnership but we've seen a big bold shift to working on projects in the public sector that make a material positive difference to either our clients or their stakeholders, usually the general public. Its [sic] about making conscious choices and not always chasing the most profitable work but something that engages colleagues in our business with the results that they achieve. … I think

37 of 107 © ILM 2014
ILM Research Paper 5: Future trends in leadership and management
the trend is market differentiation, talent attraction, client attraction and retention etc. It's important to our clients and their shareholders/stakeholders that if they use consultants they are able to justify why a particular consultancy was chosen and this isn't just about (although it plays a big part!) their price. It's about quality, people, and CSR plays a big part in this. (female, senior manager)
This market differentiation was also explained by another community member, an HR practitioner:
The fact that we have awards for Best Company to Work for or Investors in People shows trending towards being able to attract people as employees. This in turn offers reassurance to shareholders, customers and suppliers that you operate ethically in terms of how you look after people. (female, senior manager)
She explained that in turn, some of this is driven by different priorities of the younger generation(s) (Y/Millenials) whose custom and employ businesses want.
Members of the community also pointed out that, of course, there is also variation by industry sector. In the financial sector short term results dominate, conversely sectors which require significant capital investment (such as in manufacturing) or operate in highly regulated markets will have a longer term focus. While the sample is broadly representative, we do not have a sufficient survey size to reliably differentiate responses by sector. So it is not possible to generalise these views via the survey.
C2 Flexible working is increasing and is now the norm Overall slightly more managers believed that their direct reports are working more flexibly than five years ago; but the difference is very slight. However, as Chart 10 shows, the single biggest category selected by managers was that there had been minimal change (41%), though only 7% replied that their direct reports were working less flexibly. This may be a defensive response to the tougher labour market conditions and relative job insecurity during the last five years; an undercurrent against the overall trend towards greater flexible working. As one of the online community participants noted, ‘the tough business situation… ..[is] forcing Senior Managers to search for efficiency gains and abuse of flexible working is seen as [a] big problem in achieving such gains’ (male, board director).
But the chart also shows that the situation is more nuanced than a simple increase or not in flexible working for all direct reports. For 11% of managers flexible working is the default for their direct reports and for a further 16% there has been a big increase within their teams. One of the online community participants gave their rationale for embracing flexible working as the default for all staff within his company, with virtual teams spread across Europe to the United States:

38 of 107 © ILM 2014
ILM Research Paper 5: Future trends in leadership and management
It depends on what kind of tasks are needed, but we see that flexible work has critical benefits to offer, particularly for staff with families. Given the high stress work environment, we are more than happy to make this trade-off. We also see this among our customers. (male, CEO)
However, a quarter of all the managers who responded (and nearly half of those that replied ‘yes’) replied that flexible working has increased only for a chosen few of their direct reports.
Total
No, they are now working less flexibly 7.2%
No, there's been minimal change 41.0%
Yes, but only for a chosen few 25.4%
Yes, there has been a big increase 15.7%
0.0%
20.0%
40.0%
60.0%
No, they arenow workingless flexibly
No, there'sbeen minimal
change
Yes, but onlyfor a chosen
few
Yes, therehas been abig increase
Yes, it is nowthe default
way ofworking
Total No Total Yes
Chart 10: Are your reports working more flexibly compared to five years ago?

39 of 107 © ILM 2014
ILM Research Paper 5: Future trends in leadership and management
Yes, it is now the default way of working 10.6%
Total No 48.3%
Total Yes 51.7%
Total (N) 100.0% (1106)
Combining the positive responses into one Yes category and the negative responses into a No category, the near equal spread remains broadly consistent across groups (Chart 11). This includes the responses by public, private and third sector (not shown below). There were few significant differences. Managers working for organisations with shareholders were significantly more likely to say that their reports are working more flexibly and their non-shareholder-related counterparts are significantly more likely to say no17. First line managers were also more likely to reply No and less likely to reply Yes compared to their more senior counterparts. However, the strength of association (Phi or Cramer’s V) is below the 0.1 threshold.
17 X2 (1, N=1106) = 6.427, p=.011. Phi = -.076
0.0%
20.0%
40.0%
60.0%
Chart 11: Are your direct reports workign more flexibly now compared to five years ago, by shareholders, by sex, seniority and age
Total No Total Yes

40 of 107 © ILM 2014
ILM Research Paper 5: Future trends in leadership and management
Total No Total Yes Total (N)
Shareholders 44.3% 55.7% 100% (522)
No Shareholders 51.9% 48.1% 100% (584)
Male 47.8% 52.2% 100% (684)
Female 49.1% 50.9% 100% (422)
SM, Dir, CEO, NED, Chair 45.0% 55.0% 100% (289)
MM 43.8% 56.2% 100% (324)
FLM 53.1% 46.9% 100% (493)
35 or younger 47.1% 52.9% 100% (261)
36 or older 48.6% 51.4% 100% (845)
Total 48.3% 51.7% 100% (1106)
There are also some differences by sector. Managers working in the public sector were significantly more likely to say that flexible working had decreased (12%), in contrast private sector managers were less likely to have seen a decrease in flexible working (6%). However, private sector managers were also less likely to say that there had been a big increase (14%) and more likely to say that the increase in flexible working has only been for a chosen few (28%), public sector managers were less likely to choose this option (21%)18. There were more differences by organisation size, as indicated in Chart 12. Managers from small organisations were significantly less likely to report that there has been a big increase (10%); as were those from medium sized organisations (9%), whose managers were also less likely to recognise it is now the default way of working (6%). Instead these managers (from medium sized organisations) were significantly more likely, at 37%, to report minimal change. The responses from the managers in larger organisations are notably and significantly different from those of the managers from the smaller organisations. Managers from larger organisations were significantly less likely to respond that their direct reports were working less flexibly (6%) or that there had been minimal change (37%). Instead they were significantly more likely to say that there has been a big increase (20%)19.
18 X2 (8, N=1106) = 25.765, p=.001. Cramer’s V = .108 19 X2 (12, N=1106) = 68.424, p<.001. Cramer’s V = .144

41 of 107 © ILM 2014
ILM Research Paper 5: Future trends in leadership and management
1 - 49 50 - 250 250+
No, they are now working less flexibly 10.1% 7.4% 5.5%
No, there's been minimal change 45.4% 52.9% 36.8%
Yes, but only for a chosen few 22.0% 24.9% 27.1%
Yes, there has been a big increase 9.6% 8.5% 20.1%
Yes, it is now the default way of working 12.8% 6.3% 10.5%
Total 100% (218) 100% (189) 100% (676)
While many felt that only the chosen few had flexible working as the default in organisations, potentially self-employment also offers increased flexible working. The online survey didn’t ask managers if they were self-employed. However, one online community member, effectively was and works with clients across Europe, the Middle East, Asia and Africa, and reflected that the only clue his clients have about his location may be the phone number they dial, unless they use Skype, ‘The only limitations I face are time zones and technology’ (male, CEO).
0.0%
20.0%
40.0%
60.0%
No, they are nowworking less flexibly
No, there's beenminimal change
Yes, but only for achosen few
Yes, there has beena big increase
Yes, it is now thedefault way of
working
Chart 12: Are your direct reports working more flexibly now compared to five years ago, by organisation size
1-49 50-250 250+

42 of 107 © ILM 2014
ILM Research Paper 5: Future trends in leadership and management
Few managers (8%, overall) saw flexible working declining in five years from now and most groups (but not all) foresaw their direct reports working more flexibly. Of all these groups the most notable differences are between managers working for organisations with shareholders and those not. Those associated with shareholders were significantly more likely to foresee their reports working more flexibly and were significantly less likely to expect no change, than their non-shareholder-related counterparts; though the level of association is weak20. Overall 51% of the managers recognised that flexible working is the new normal.
More flexibly
No change
Less flexibly
Total (N)
20 X2 (1, N=1051) = 17.239, p<.001. Cramer’s V = .128
0.0%
20.0%
40.0%
60.0%
Chart 13: Do you see your direct reports working more flexibly now compared in five years' time, by shareholders, by sex, seniority and age
More flexibly No change Less flexibly

43 of 107 © ILM 2014
ILM Research Paper 5: Future trends in leadership and management
Shareholders 53.3% 38.4% 8.3% 100% (492)
No Shareholders 41.3% 51.0% 7.7% 100% (559)
Male 47.2% 45.3% 7.5% 100% (653)
Female 46.5% 44.7% 8.8% 100% (398)
SM, Dir, CEO, NED, Chair 48.0% 46.2% 5.9% 100% (273)
MM 48.9% 42.7% 8.4% 100% (309)
FLM 45.0% 46.1% 9.0% 100% (469)
35 or younger 51.6% 38.2% 10.2% 100% (254)
36 or older 45.4% 47.3% 7.3% 100% (797)
Total 46.9% 45.1% 8.0% 100% (1051)
Again there are significant differences by organisation size (Chart 14). Managers from large organisations were significantly more likely to expect more flexible working (54%) and less likely to expect no change (38%). Managers from small organisations were more likely to expect no change (58%) and less likely to expect their reports to work more flexibly (37%) in comparison. The views of managers from medium size organisations were similar; less likely to expect their reports to work more flexibly (35%), more likely to expect no change (52%) and also more likely to expect their direct reports to work less flexibly (13%). There were no significant differences by public, private or third sector.

44 of 107 © ILM 2014
ILM Research Paper 5: Future trends in leadership and management
1 - 49 50 - 250 250+
More flexibly 36.7% 34.8% 54.3%
No Change 58.0% 51.9% 38.4%
Less flexibly 5.3% 13.3% 7.3%
Total 100% (207) 100% (181) 100% (641)
Picking up on the chilling effect of the tougher labour market, some of the online community members felt that it has, in effect, increased flexible working (for employees and managers) but only to benefit the employer in meeting customer expectations with fewer staff. Sometimes the resulting poor work/life balance has been, ‘sold as part of what’s required to move up the career ladder’ (female, CEO).
The practice of out-sourcing can also limit flexible working, at least to the benefit of staff, when few staff are left. A first line manager for a utilities company gave an extreme example:
It has gotten to where many of the companies have just enough resources to respond to emergencies with no excess. This is great for the profit margins, but challenging as employees because at times it feels like there isn't a lot of room to breath [sic] because we are so busy and strapped to get things done. The
0.0%
20.0%
40.0%
60.0%
1-49 50-250 250+
Chart 14: Do you see your direct reports working more flexibly now compared in five years' time, by organisation size
More flexibly No change Less flexibly

45 of 107 © ILM 2014
ILM Research Paper 5: Future trends in leadership and management
average salaried employees put in 10-20 hours extra every week so they are beginning to get burned out. (male, first line manager)
The spread and speed of modern communications methods (email, messaging etc) adds pressure for quick responses and a few participants reminisced about the days when there was only phone or fax and the time available for reflection and in-depth conversation. An Online Community participant who was an operations director explained:
Whereas 10 years ago I had the choice of responding in office hours, my customers know now that I will be (unconsciously perhaps) maintaining a listening watch on multiple channels, and will expect an immediate response in a manner that suits them… A Middle Eastern customer will anticipate Sunday availability… A Chinese or Russian customer will anticipate suppliers working 16 - 18 h a day in order to meet their needs. Is this reasonable? Maybe not. Is this the face of business in today's environment? Absolutely. (male, board director)
This places a strain on managers and directors as well as employees, as, ‘there's also a need to have your “game face” on all the time. Gets a bit wearing after a while both for management and the execution team...’ (male, board director).
Effectively managing flexibly working staff requires management by outcome rather than inputs or process. As a senior manager, who has worked in the public and private sector, explains this has:
…metamorphosed into a general approach of outcome-focused responsibility for all levels of staff and managers, with everything being seen as a project, and project progress being the determinant of performance, not hours worked or time seen in the office. (male, senior manager)
Some roles and individuals are more suited than others to flexible working. There is also a challenge in managing mixed teams and working with some colleagues who are flexibly working and others who are not. This was highlighted by another senior manager who despite her company’s positive attitude to and practices for flexible working intended to remain fulltime after returning from her second maternity leave, ‘as in some ways – it just seems easier’ (female, senior manager). Several online community members had current or previous experience of being home-based. They raised the importance of belonging to an organisation for their sense professional identity as well as personal wellbeing and socialisation.

46 of 107 © ILM 2014
ILM Research Paper 5: Future trends in leadership and management
C3 Relationships are increasingly important both within teams and with external stakeholders In total, only 4% thought that working relationships have become less important over the last five years, shown in Chart 15. Forty per cent thought that their importance has remained static and 56% that they are now more important. The same percentage (56%) recognised as a trend that relationships are even more important (both within teams and with customers/suppliers).
Although there is slight variation by seniority, sex and age, none of these are statistically significant. Neither are the differences between managers in public, or private or third sector organisations (not shown below). However, the one difference that is significant, amongst these groups, is the presence of shareholders. Mangers whose organisations have shareholders were significantly more likely to say that working relationships have become more important and significantly less likely to say that there had been no change, in comparison to managers in organisations without shareholders21. As with the other strengths of association, observed so far between these two groups, this strength of association is weak but still significant.
21 X2 (2, N=1106) = 24.562, p<.001. Cramer’s V = .149

47 of 107 © ILM 2014
ILM Research Paper 5: Future trends in leadership and management
Less important
No Change
More important
Total (N)
Shareholders 5.2% 32.0% 62.8% 100% (522)
No Shareholders 3.8% 46.6% 49.7% 100% (584)
Male 3.9% 37.7% 58.3% 100% (684)
Female 5.2% 42.9% 51.9% 100% (422)
SM, Dir, CEO, NED, Chair 3.5% 40.8% 55.7% 100% (289)
MM 4.0% 39.2% 56.8% 100% (324)
FLM 5.3% 39.4% 55.4% 100% (493)
35 or younger 6.5% 40.6% 52.9% 100% (261)
36 or older 3.8% 39.4% 56.8% 100% (845)
Total (N) 4.4% 39.7% 55.9% 100% (1106)
While there are no statistically significant differences in the views of managers from public, private or third sectors, there are differences by organisation size (Chart 16). Managers from large organisations were significantly more likely to say that working
0.0%
20.0%
40.0%
60.0%
Chart 15: Importance of working relationships compared to five years ago by shareholders, sex, seniority and age
Less important No change More important

48 of 107 © ILM 2014
ILM Research Paper 5: Future trends in leadership and management
relationships are more important than five years’ ago (65%) and significantly less likely to think they had become less important (3%) or that there had been no change (33%). In contrast managers from small and medium size organisations were less likely to think that working relationships had become more important (39% and 49% respectively). Managers from small organisations were more likely to report that the importance of working relationships had not changed (56%) and managers from medium sized organisations were more likely to say that working relationships had become less important (9%)22.
1 - 49 50 - 250 250+
Less important 4.6% 8.5% 3.0%
No Change 56.4% 42.9% 32.5%
More important 39.0% 48.7% 64.5%
Total 100% (207) 100% (181) 100% (641)
22 X2 (6, N=1106) = 69.105, p<.001. Cramer’s V = .177
0.0%
20.0%
40.0%
60.0%
1-49 50-250 250+
Chart 16: Importance of working relationships compared to five years ago by organisation size
Less important No change More important

49 of 107 © ILM 2014
ILM Research Paper 5: Future trends in leadership and management
These results only indicate relative change over the last five years. It does not give an absolute indication and it is not possible, from these results alone, to conclude that one group prioritises the importance of working relationships more than the other.
It may be that for many people effective working relationships have always been important and this was highlighted by the Online Community. The participants pointed out that there is now increased awareness of their importance and more emphasis on relationship management. Because, ‘[o]rganisations are becoming larger, more diverse and more disparate’ and job roles change quickly, skilled staff are used to moving in many sectors, between roles, organisations and countries. In this context, ‘[n]etworking and relationship management in pretty much every sector are vital’ (male, CEO). The flattening of organisational hierarchies and increasing prevalence of matrix-orientated structures further emphasise this trend.
This has also played out in the context of globalisation and the network (the ‘paradigm structure’ of our time explained in Section B3). Hence, relationships are no longer so concentrated by local geographical area, as another online community participant explained:
The main difference between the past and the present is that in the past, the business relationships were far more local whereas now they are global. In both the past and present, your relationships with your customers are very important because when a relationship goes sour, whether on the web or in a small community, everyone knows very quickly. (male, first line manager)
Some of the Online Community members had a sales and marketing background. They pointed out that strong relationships with customers can be a market differentiator if not a necessity. From a sales perspective, more effort is required now compared to the boom times and an advertisement alone is no longer sufficient, consumers will consult online before deciding to buy. Therefore companies actually have to nurture relationships with potential customers as well as their current ones. One participant was a manager at a call centre. They explained that customer experience can now be measured as in terms of return on investment; therefore it can be measured against profit rather than cost. Another community member highlighted consumer banking in the UK where customer relationship management was regarded as cost to be minimised (perhaps through off-shoring) but is now seen more as a market differentiator.
This also means increased emphasis on working relationships within organisations:
…of late individuals have more access to coaching, training, research tools, studies and more importantly far more exposure to relationship management as a formalised virtue in a commercial or social economic enterprise. (male, board director)
Such training and development includes communication and emotional intelligence (one participant had trained over a thousand people, on a ten day leadership programme focussing on emotional intelligence, over the last decade). We also asked

50 of 107 © ILM 2014
ILM Research Paper 5: Future trends in leadership and management
the Online Survey respondents if they had training in relationship management in the previous 12 months. Chart 17 shows the responses, both overall and split by different groups. In total 29% had received some form of relationship management training in the previous 12 months. While there appears to be some minor differences between the groups, the differences which are statistically significant are by shareholder influence and age. Managers from organisations with shareholders were significantly more likely than their counterparts from organisations without shareholders to have had relationship management training (36% compared to 23%)23. Similarly 40% of managers aged 35 or younger had training in contrast to 26% of those aged 36 or older. This second, significant difference, like the first has a weak level of association (Phi) but is still above the threshold of 0.1 for accepting association between a specific group and a specific outcome24. Although slightly more Middle Managers (33%) appear to have had relationship management training, compared to their more senior or more junior management colleagues (both 28%), the differences are not statistically significant.
23 X2 (1, N=1098) = 23.085, p<.001. Phi = .145 24 X2 (1, N=1098) = 19.735, p<.001. Phi = .134
0.0%
20.0%
40.0%
60.0%
80.0%
Chart 17: Received training in relationship management in the last 12 months
Yes No

51 of 107 © ILM 2014
ILM Research Paper 5: Future trends in leadership and management
Total Yes Total No Total (N)
Shareholders 36.4% 63.6% 100% (516)
No Shareholders 23.2% 76.8% 100% (582)
Male 28.6% 71.4% 100% (679)
Female 30.8% 69.2% 100% (419)
SM, Dir, CEO, NED, Chair 28.2% 71.8% 100% (287)
MM 32.5% 67.5% 100% (323)
FLM 28.1% 71.9% 100% (488)
35 or younger 40.4% 59.6% 100% (260)
36 or older 26.0% 74.0% 100% (838)
Total 29.4% 70.6% 100% (1098)
There were no significant differences in the responses by private, third or public sector. However, managers from large organisations, at 33%, were more likely to have had training in relationship management than those from small organisations (16%)25.
The emphasis on relationships within organisations applies equally to those whose staff work flexibly. As one such Online Community member remarked, ‘Although we are on Skype and email all day long, this is not a substitute for regular relationship building’ (male, CEO). Even senior management teams need to dedicate time and effort to this. One head of an HR consultancy sees that, ‘[o]ften time they are too head down in the task to appreciate the value of relationship building’ (female, CEO). One participant, chairman of an SME, twice a year spends time with the chief executive, talking to each employee:
…finding out about them their needs and aspirations… …all stakeholders want to feel listened to and respected; and this has an effect of reducing staff turnover, and feelings of 'family' within and outside of our companies. (male, board chair)
25 X2 (3, N=1098) = 27.564, p<.001. Cramer’s V = .158

52 of 107 © ILM 2014
ILM Research Paper 5: Future trends in leadership and management
C4 The core functions of leadership & management are more important but harder to achieve When asked if they thought the basics of leadership and management had become more or less important, the online survey respondents replied similarly to how they had on the importance of working relationships. Only four per cent thought that the basics had become less important, but there was markedly less difference in the percentages of managers who thought that there was no change (44%) and those who felt that they had become more important over the last five years (52%).
There are no notable and significant differences between groups, except for those associated with shareholders and those who are not, (Chart 18, below). Managers from organisations with shareholders were significantly more likely to say that the basics or core functions are more important than those from organisations without shareholders. Additionally managers from organisations without shareholders were significantly more likely to say that there was no change compared to their shareholder-associated counterparts26. Of all the groups within the sample that we have analysed here, managers from organisations without shareholders were the only group to be more likely to say that there had been no change; though the value of Cramer’s V (.130) indicates only a weak level of association.
Although the difference is not statistically significant, it is interesting that more of those aged 35 or younger thought that the basics were less important than five years ago. We can only speculate why this is the case, it may be that these people were starting out in management five years ago and perceived that step change more keenly; compared to the subsequent five years.
26 X2 (2, N=1106) = 18.649, p<.001. Cramer’s V = .130

53 of 107 © ILM 2014
ILM Research Paper 5: Future trends in leadership and management
Less important
No Change
More important
Total (N)
Shareholders 4.8% 37.4% 57.9% 100% (522)
No Shareholders 3.3% 50.2% 46.6% 100% (584)
Male 3.7% 44.0% 52.3% 100% (684)
Female 4.5% 44.3% 51.2% 100% (422)
SM, Dir, CEO, NED, Chair 3.5% 43.6% 52.9% 100% (289)
MM 5.2% 43.2% 51.5% 100% (324)
FLM 3.4% 45.0% 51.5% 100% (493)
35 or younger 7.3% 43.7% 49.0% 100% (261)
36 or older 3.0% 44.3% 52.8% 100% (845)
Total (N) 4.0% 44.1% 51.9% 100% (1106)
As with some of the other responses seen so far, there were no statistically significant differences in response by third, private or public sector. Managers from small organisations were significantly more likely to report that there had been no change (62%) and less likely to report that they had become more important (33%). This is the opposite to the responses from managers in large organisations who were more likely
0.0%
20.0%
40.0%
60.0%
Chart 18: Importance of basics or core functions of leadership and management compared to five years ago by shareholders, sex, seniority and age
Less important No Change More important

54 of 107 © ILM 2014
ILM Research Paper 5: Future trends in leadership and management
to state that the basics had become more important (60%) and significantly less likely to report no change (37%)27.
The view from the online community was fairly equally split between no change and the basics becoming more important. Those that thought there had been no change, pointed out that the core or basic functions have always been important. Instead, there is more awareness and it is more clearly defined as one chief executive and coach explained, ‘the basic needed skills or attributes are little changed over the last few decades and that skills as such inspiring, motivating and engaging others is as important as ever’. (male, CEO)
We also asked the mangers answering the online survey if they thought that practising the basics or core functions of leadership and management had become easier or harder over the last five years. Chart 19 shows that the proportions, of those who thought there has been no change in difficultly (44%), are similar to those that thought there has been no change in the relative importance. Slightly more people believed the basics or core functions have become harder (46%), only 11% thought that these functions had become easier to do.
When comparing responses by group, there are more differences which are statistically significant. Firstly, managers from organisations without shareholders were significantly more likely to say that there had been no change and less likely think that it was now easier, in contrast to managers in organisations with shareholders, who were more likely to say that it was now easier and less likely to have seen no change28. Though the strength of association is towards the lower end of what is considered to be weak, it is still significant.
27 X2 (6, N=1106) = 63.661, p<.001. Cramer’s V = .170 28 X2 (2, N=1106) = 14.898, p=.001. Cramer’s V = .116

55 of 107 © ILM 2014
ILM Research Paper 5: Future trends in leadership and management
Easier No Change Harder Total (N)
Shareholders 14.6% 39.5% 46.0% 100% (522)
No Shareholders 7.9% 47.1% 45.0% 100% (584)
Male 9.6% 42.8% 47.5% 100% (684)
Female 13.3% 44.5% 42.2% 100% (422)
SM, Dir, CEO, NED, Chair 11.4% 45.3% 43.3% 100% (289)
MM 10.5% 45.7% 43.8% 100% (324)
FLM 11.2% 41.0% 47.9% 100% (493)
35 or younger 18.4% 46.0% 35.6% 100% (261)
36 or older 8.8% 42.7% 48.5% 100% (845)
Total (N) 11.0% 43.5% 45.5% 100% (1106)
0.0%
20.0%
40.0%
60.0%
Chart 19: Basics or core functions of leadership and management, easier or harder than five years ago by shareholders, sex, seniority and age
Easier No Change Harder

56 of 107 © ILM 2014
ILM Research Paper 5: Future trends in leadership and management
Public sector managers were significantly more likely to feel that the basics had become harder (52%) and less likely to say that there had been no change (38%); this is the opposite of private sector managers who were more likely to have reported no change (47%) than the basics becoming harder (42%)29 though the overall level of association is only .08 (and below the accepted threshold of .1). Managers from large organisations were significantly more likely to say that the basics had become harder (43%), rather than not changing (40%). This is in contrast with managers from small organisations who were more likely to report that there had been no change (61%) rather than becoming harder (29%)30.
Looking to the future, 39% of the managers responding to the online survey recognised that the core functions or basics of leadership & management will be more important and harder to achieve. The reasons why ‘the basics’ are more important and harder to achieve were explored with the online community, one director summarised some of the challenges in the modern workplace:
Globalised workforce, increase in compliance and regulatory complexity, more public scrutiny, faster communication environment, well informed employees, ethical conduct formalised focus, talent retention at the same time profit motive in the complex market place and other pressures has increasing put an ascending pressure and focus on leadership.(male, board director)
This means that, as another director, explained leaders are finding it is, ‘harder to find space to “look after” their teams - which they know is important - at the same time as holding down their other responsibilities’ (male, board chair).
We also asked the online survey respondents, who said that the core functions or basics were harder to do, why? As chart 20 shows, the two main reasons were lack of time due to pressure from other priorities and the added complexity from the structures, processes and systems associated with management. The pattern is fairly consistent across the groups we have considered and the only significant differences were between managers whose organisations have shareholders and those that don’t31. Shareholder-related managers were more likely to select the increasing complexity brought by systems, processes and structures. Non-shareholder-related managers were more likely to highlight decreasing tolerance of mistakes; though this is still third after lack of time and increasing complexity. While not statistically significant, the effect of age and experience was suggested by the increased number of those aged 35 or younger highlighting being responsible for more people compared to first line managers.
29 X2 (4, N=1106) = 14.126, p=.007. Cramer’s V = .080 30 X2 (6, N=1106) = 43.019, p<.001. Cramer’s V = .139 31 X2 (2, N=1106) = 12.021, p=.017. Cramer’s V = .155

57 of 107 © ILM 2014
ILM Research Paper 5: Future trends in leadership and management
Less time…
Responsible for…
Structures, processes…
Less tolerance
…
Other Total (N)
Shareholders 40.5% 5.9% 43.0% 8.4% 2.1% 100% (500)
No Shareholders 48.3% 6.1% 29.7% 14.4% 1.5% 100% (237)
Male 44.0% 5.0% 36.5% 9.6% 1.9% 100% (323)
Female 45.8% 7.9% 35.0% 9.6% 1.7% 100% (177)
SM, Dir, CEO, NED, Chair
40.0% 9.6% 35.2% 12.8% 2.4% 100% (125)
MM 43.7% 4.9% 37.3% 11.3% 2.8% 100% (142)
FLM 47.6% 4.7% 35.6% 11.2% 0.9% 100% (233)
35 or younger 45.2% 11.8% 34.4% 8.6% 0.0% 100% (93)
36 or older 44.5% 4.7% 36.4% 12.3% 2.2% 100% (407)
Total (N) 44.6% 6.0% 36.0% 11.0% 1.8% 100% (1106)
0.0%
20.0%
40.0%
60.0%
Chart 20: Why the basics or core functions of leadership and management have become harder
Less time because of competition from other priorities
Responsible for more people
Structures, processes and systems have become more complex
Less tolerance of mistakes
Other
58 of 107 © ILM 2014
ILM Research Paper 5: Future trends in leadership and management
Managers in large organisations were more likely to point towards the complexity of systems, processes and structures (42%). Managers in medium size organisations were more likely to cite less tolerance for mistakes (12%), or being responsible for more people (20%)32.
Only a minority of the online survey respondents pointed towards being responsible for more people as the cause of this increasing difficulty. However, one of the online community members (a management consultant and CEO) reflected on the combination of management being spread thinly and the influence of lean principles in manufacturing and the service sector. This means that employees are expected to manage important tasks and be accountable for the results. Overall he thought there is a realisation that, ‘everyone needs to pull the corporate oar, not just the top management’ (male, CEO).
Regarding the increased complexity of systems, processes and structures, another in the Online Community pointed towards increased level of information for managers and leaders to absorb and understand to make effective decisions. For leadership and management one senior manager emphasised that self-awareness matters more, ‘In a world of complex communications, “simple” becomes more, not less, important’ (male, senior manager)
There was a sense in the Community that broadly, over the last twenty years, management styles have become more facilitative than directive, coaching and mentoring from managers was rare but is now more common. As discussed earlier, this is happening within the context of increased flexible working. While flexible working offers many benefits it is more difficult to manage. One participant (a chairman) explained:
Managers involved will need to work harder and adapt their own working patterns to ensure their teams are performing to plan. There's as much if not more onus on the manager to perform than anyone else. (male, board chair)
This was elaborated by another participant, ‘Leaders are needing to continuously enhance their communication and presence…’ (male, board chair). Presence, as opposed to being present, is the required trait. So decision making and practising a more facilitative, rather than directive, style will have to be increasingly mediated through email, instant messaging and voice conversations. This is more difficult than when physically co-located and interactions can be conducted in person.
A few of the Community members noted that within larger organisations there is increased awareness of their own talent pipeline, partly to help in recruiting, as well as retaining top talent. Yet there is a reduced risk tolerance which runs contradictory to talent development as a senior HR person noted, ‘[t]here appears be this need to
32 X2 (12, N=1106) = 48.977, p<.001. Cramer’s V = .181

59 of 107 © ILM 2014
ILM Research Paper 5: Future trends in leadership and management
inspire, engage, motivate whilst delivering and at the same time an intolerance for getting it wrong’ (female, CEO).
We also asked the Online Community members which were the top three functions that they found were done badly by the managers with whom they work. We then asked them which functions they prioritised for their own development. Their responses are listed in the following table. Managers rank clear communication as both the function most often done badly by the managers they work with and as the top priority for their own development. This is followed by effective planning second and decision making, fourth. The relative third rankings however, differ. In terms of what managers think is done badly by other managers it is dealing with conflict in the workplace, but they prioritise problem solving for their own development. While, as a whole, managers think other managers are not good at dealing with conflict, they rank it as one of the lowest priorities (12th) for their own development. The other function where there is a notable difference in relative rankings is motivating direct reports. Managers ranked this at seventh for their own development, but only 11th in terms of it being done badly by their colleagues. While there are differences in rankings for the other functions, these are not so great, being within three places of each other.
Rank Functions done badly amongst managers… Functions prioritised for own development
1 Clear communication Clear communication
2 Effective planning Effective planning
3 Dealing with conflict in the workplace Problem solving
4 Decision making Decision making
5 Giving effective feedback to direct reports Listening and being accessible to direct reports
6 Delegating Goal setting
7 Listening and being accessible to direct reports Motivating direct reports
8 Goal setting Giving effective feedback to direct reports
9 Coaching direct reports Delegating
10 Consistently demonstrating emotional intelligence
Coaching direct reports
11 Motivating direct reports Consistently demonstrating emotional intelligence
12 Talent recruitment and selection Dealing with conflict in the workplace
13 Monitoring performance of direct reports Monitoring performance of direct reports
14 Problem solving Chairing meetings
15 Chairing meetings Talent recruitment and selection
16 Other Other
N: 1055

60 of 107 © ILM 2014
ILM Research Paper 5: Future trends in leadership and management
C5 Managers increasingly prioritise their own employability over stable employment The managers responding to the online survey were asked whether five years ago they would have chosen a stable permanent job with fewer career development opportunities or a 12 month fixed term contract offering more career development opportunities. In short, this question asked whether they would have prioritised stable employment or employability.
As Chart 21, below, shows nearly three quarters (71%) preferred stability over employability. There is little difference between the different groups (including the influence of shareholders). However, there is a significant difference by age33. Those aged 35 or younger were significantly less likely to choose stability compared to those aged 36 or older, 43% of those younger managers would have prioritised the career development opportunities that would improve their own employability. There were no significant differences in responses by organisation size or by private, third or public sector.
33 X2 (1, N=1098) = 33.145, p<.001. Phi = -.174
0.0%
20.0%
40.0%
60.0%
80.0%
Chart 21: Choose career stability or career opportunity five years ago
A stable, permanent job offering fewer career development opportunities
A 12 month fixed term contract offering more career development opportunities

61 of 107 © ILM 2014
ILM Research Paper 5: Future trends in leadership and management
A stable, permanent job… A 12 month contract… Total (N)
Shareholders 72.3% 27.7% 100% (516)
No Shareholders 70.6% 29.4% 100% (582)
Male 72.8% 27.2% 100% (679)
Female 69.2% 30.8% 100% (419)
SM, Dir, CEO, NED, Chair 70.0% 30.0% 100% (287)
MM 70.0% 30.0% 100% (323)
FLM 73.2% 26.8% 100% (488)
35 or younger 57.3% 42.7% 100% (260)
36 or older 75.8% 24.2% 100% (838)
Total (N) 71.4% 28.6% 100% (1098)
We then asked the managers which of the two scenarios they would choose now (Chart 22). Overall, fewer managers chose stability (nearly 70%), more selected employability (nearly 31%). Again, those aged 35 or younger were less likely to prioritise stability 57% compared to those aged 36 or older (76% choosing stability over employability)34. Though, in both cases, the strength of association (Phi) between age and preference for stability or employability is weak. There are also significant differences between shareholder influence and seniority. Managers from organisations with shareholders (at 66%) were significantly less likely than non-shareholder related managers (at 73%) to choose stability, and (although still a minority) had a larger proportion choosing employability35. Senior managers and board level directors were also more likely (at 36%), than other groups (28-29%), to prioritise employability36.However, for both of these groups the strength of association is below the commonly accepted 0.1 threshold.
34 X2 (1, N=1098) = 12.220, p<.001. Phi = -.105 35 X2 (1, N=1098) = 5.323, p=.021. Phi = -.070 36 X2 (1, N=1098) = 6.035, p=.049. Phi = -.074

62 of 107 © ILM 2014
ILM Research Paper 5: Future trends in leadership and management
A stable, permanent job… A 12 month contract… Total (N)
Shareholders 66.1% 33.9% 100% (516)
No Shareholders 72.5% 27.5% 100% (582)
Male 68.9% 31.1% 100% (679)
Female 70.4% 29.6% 100% (419)
SM, Dir, CEO, NED, Chair 63.8% 36.2% 100% (287)
MM 71.2% 28.8% 100% (323)
FLM 71.7% 28.3% 100% (488)
35 or younger 60.8% 39.2% 100% (260)
36 or older 72.2% 27.8% 100% (838)
Total (N) 69.5% 30.5% 100% (1098)
In terms of differences by organisation size, managers from large organisations were more likely to choose the option offering greater employability (33%), than those from medium size organisations (23%); though in both cases these managers were in the
0.0%
20.0%
40.0%
60.0%
80.0%
Chart 22: Choose career stability or career opportunity now
A stable, permanent job offering fewer career development opportunities
A 12 month fixed term contract offering more career development opportunities

63 of 107 © ILM 2014
ILM Research Paper 5: Future trends in leadership and management
minority and most chose stable employment. The overall strength of association however, is below .137.
So, we can compare the relative changes, in preference for stable employment or more career development opportunities to improve employability, between five years ago and now. Chart 23 shows only the positive differences (as with only two options, the negative differences are of equal, though opposite, value). Overall there has been a very slight (two percentage points) move towards employability (and thus a correspondingly slight move away from stable employment). The moves towards one or the other are split roughly equally between the groups:
• Shareholder-related managers, males, senior and board-level managers, first line managers and those aged 36 or older have all tended towards employability
• Non shareholder-related managers, females, middle managers and those aged 35 or younger have all tended towards stable employment
Given that the overall move is towards employability (albeit still a minority choice), the biggest differences are also found amongst those groups who have moved towards employability. The biggest moves are of six percentage points by shareholder-related managers and senior and board-level managers, all the others have changes of less than four percentage points.
37 X2 (3, N=1098) = 8.027, p=.045. Cramer’s V = .086
0%
2%
4%
6%
8%
Chart 23: stable employment or career development, difference between five years ago and now (percentage points)
A stable, permanent job offering fewer career development opportunities
A 12 month fixed term contract offering more career development opportunities

64 of 107 © ILM 2014
ILM Research Paper 5: Future trends in leadership and management
A stable, permanent job… A 12 month contract…
Shareholders -6.2% 6.2%
No Shareholders 1.9% -1.9%
Male -3.8% 3.8%
Female 1.2% -1.2%
SM, Dir, CEO, NED, Chair -6.3% 6.3%
MM 1.2% -1.2%
FLM -1.4% 1.4%
35 or younger 3.5% -3.5%
36 or older -3.6% 3.6%
Total -1.9% 1.9%
In total, 26% of the Online Survey respondents recognised that managers prioritise their own employability over stable employment as a trend. The majority view of the Online Community participants saw a move towards employability, although the difficult labour market has meant some managers cling to stable employment. One UK based manager noted that they had seen increasing prioritisation of employability become commonplace over the last decade, while another, who over the same period has worked in the Middle East and East Asia went further:
To move up, to grow, to seek a new challenge, whatever the reason, we see employability prioritised, and even encourage it. We see individuals continuing with the same coach through different organisations and meeting leadership development costs out of their own pockets so as to ensure continuity while moving. (male, board director)
A few managers in the Community reflected that managers are reacting differently to the increased job insecurity. Some are being more conservative, than they otherwise would be, focussing on stable employment in response to their colleagues taking longer than expected to find new employment. One senior manager explained that they see, ‘older managers just hunkering down, working hard and taking the money’ (male, senior manager). A marketing director saw, ‘more clients are now making job security their priority often resulting in frustration and demotivation’ (female, director). Other managers, ‘feel less faithful to their employers, and will indeed focus more on their own development for guaranteeing an income’ (male, CEO) One director explained their own pragmatic approach:
I think stable employment these days is a bit of a pipe dream. As a result there is a split between making the most of what you have whilst always being prepared to get the life jacket on! (male, board director)

65 of 107 © ILM 2014
ILM Research Paper 5: Future trends in leadership and management
But some people refuse to acknowledge that the labour market has changed. One manager, with an HR background, reported that in some managers they see an almost blithe indifference:
Despite the changes in the environment I still see a head in the sand approach to keeping oneself at the top of ones [sic] ability. Too often people look only inwardly and against the same population rather than the wider external population. (female, CEO)
Even though the managers aged 35 or younger responding to the Online Survey have moved towards stable employment now, compared to five years ago, they are (and were) more likely to favour employability over stable employment, compared to their older counterparts. These intergenerational differences were identified by several of the Online Community. One, a senior manager in East Asia), explained:
Gone is the value of loyalty of the previous generation. The Gen Y managers tend to be [a] more impatient lot. They are more confident and are ready to leave their organisations. The executive MBA programmes offered in the market have increased as the weekend classes are filled with Gen Y managers paying exorbitant fees and toiling over their free time to better their personal positioning and marketability. (male, senior manager)
Although he explains that this doesn’t summarise all Gen Y managers. An orientation that prioritises employability means organising and, at times, entirely funding your own training or coaching. This is perhaps more readily accepted by generation Y managers. Interestingly, a couple of participants (Gen X) have said that their own outlooks have changed towards employability, as one said, ‘I have certainly seen my peers take far more notice of the need to be employable, and taking active measures with their networks, social media presence, etc.’ (male, senior manager). Although another participant also remarked that, ‘[m]ost managers seem to confuse employability with networking’.
Unsurprisingly, given the tough economic conditions after the 2008 banking crisis employability may be more strongly associated with generating income. The head of a business development consultancy explained in the Online Community what employers are after:
What managers are looking for today are rainmakers, people with a proven capacity to sell [generate immediate income]. Such a position will be actively headhunted. There is a very large scepticism to MBAs and others who want a high salary, but essentially have to be trained on the job. This extends all the way up the value chain, to include our clients. …Right now, employability is a function of whether you can gain new contracts (or save contracts, i.e. through technical skills) or whether you can save someone money. (male, CEO)
The managers responding to the Online Survey were asked if they had any definite plans to improve their own employability in the next 12 months (Chart 24). They could select more than one option (unless choosing no plans). A third (32%) had no plans. Of

66 of 107 © ILM 2014
ILM Research Paper 5: Future trends in leadership and management
the remaining two thirds, most (36%) were intending to undertake specific technical/subject knowledge training or qualification. Slightly fewer, 29%, were intending to undertake specific leadership or management training or qualification. Nearly 15% were looking for advice and support from a career or executive coach. Slightly fewer, 13%, were seeking a mentor. Of the managers that selected other, 2.1%, some explained that they were looking for a new role or career and others that they were simply looking to retire.
Total
Undertake specific technical/subject knowledge training/ qualification 36.1%
Undertake specific leadership or management training /qualification 29.3%
Advice and support from a career or executive coach 14.7%
Undertake a secondment 6.1%
Seek a mentor 12.8%
No plans 32.1%
Other 2.1%
Total (N) 100.0% (1106)
0.0%
20.0%
40.0%
Chart 24: Definite plans to improve own employability
Total

67 of 107 © ILM 2014
ILM Research Paper 5: Future trends in leadership and management
As we have seen elsewhere in this report, there are statistically significant differences between managers from organisations with shareholders and those without, which Chart 25 illustrates. This latter group were significantly more likely to say that they had no plans (39%) in contrast to only 24% of mangers from organisations with shareholders38. Shareholder-related managers were significantly more likely to plan to undertake specific technical/ subject training or a qualification39, or specific leadership or management training or a qualification40, or to engage a coach41, or to seek a secondment42 or a mentor43. For all of these options the strength of association is weak and only when considering leadership or management development is the value of Phi greater than .1. Although the strength of association is generally very weak the differences between these two groups are consistent, suggesting that overall there is a greater tendency by shareholder-related managers to have definite plans to improve their own employability.
38 X2 (1, N=1046) = 27.334, p<.001. Phi = .162 39 X2 (1, N=1046) = 4.219, p = .040. Phi = -.064 40 X2 (1, N=1046) = 13.684, p = .040. Phi = -.114 41 X2 (1, N=1046) = 5.056, p = .025. Phi = -.070 42 X2 (1, N=1046) = 8.116, p = .004. Phi = -.088 43 X2 (1, N=1046) = 7.970, p = .005. Phi = -.087
0.0%
20.0%
40.0%
Chart 25: Definite plans to improve own employabilty by shareholder influence
Shareholders No Shareholders

68 of 107 © ILM 2014
ILM Research Paper 5: Future trends in leadership and management
Shareholders No Shareholders
Undertake specific technical/subject knowledge training/ qualification 39.4% 33.3%
Undertake specific leadership or management training /qualification 34.9% 24.5%
Advice and support from a career or executive coach 17.3% 12.4%
Undertake a secondment 8.4% 4.1%
Seek a mentor 15.9% 10.1%
No plans 24.1% 39.2%
Other 2.4% 1.8%
Total (N) 100.0% (490)
100.0% (556)
Male managers, at 40%, were significantly more likely to plan to undertake specific technical/ subject training or a qualification than female managers, at 30%44. In contrast female managers are more likely to seek a secondment, at 8%, compared to only 5% of male managers; although the strength of association is only .064 (well below the standard threshold of .1)45. There was only one significant difference by management level: middle managers, at 10%, were more likely than Senior or board level managers to plan to undertake a secondment (5%)46.
There are though more differences by age. Chart 26 shows that, again, the biggest difference is whether managers had definite plans or not. Those aged 36 or older were significantly more likely to say that they had no plans (37%) in contrast to younger managers (17%)47. Managers aged 35 or younger were more likely to plan to undertake specific leadership or management training or a qualification48, or to engage a coach49, or to seek a secondment50 or a mentor51. The strength of association for seeking a secondment (Phi = -.061) is below the level considered for association; the strength of association for the others is weak, but nevertheless present.
44 X2 (1, N=1046) = 10.791, p = .001. Phi = -.102 45 X2 (1, N=1046) = 4.344, p = .037. Phi = .064 46 X2 (2, N=1046) = 14.632, p = .001. Phi = .118 47 X2 (1, N=1046) = 36.371, p< .001. Phi = .186 48 X2 (1, N=1046) = 22.748, p < .001. Phi = -.147 49 X2 (1, N=1046) = 14.871, p < .001. Phi = -.119 50 X2 (1, N=1046) = 3.942, p = .047. Phi = -.061 51 X2 (1, N=1046) = 22.074, p < .001. Phi = -.145

69 of 107 © ILM 2014
ILM Research Paper 5: Future trends in leadership and management
35 or younger
36 or older
Undertake specific technical/subject knowledge training/ qualification 40.1% 34.9%
Undertake specific leadership or management training /qualification 41.3% 25.6%
Advice and support from a career or executive coach 22.2% 12.3%
Undertake a secondment 8.7% 5.3%
Seek a mentor 21.4% 10.1%
No plans 16.7% 37.0%
Other 1.6% 2.3%
Total (N) 100.0% (252)
100.0% (794)
Managers from private sector organisations, at 34%, were significantly less likely than managers overall (36%) to have plans for a specific technical or subject knowledge
0.0%
20.0%
40.0%
Chart 26: Definite plans to improve own employabilty by age
35 or younger 36 or older

70 of 107 © ILM 2014
ILM Research Paper 5: Future trends in leadership and management
qualification or training52. The low Cramer’s V indicates no overall association between plans and sector background. There were more differences by organisation size. Managers from small organisations were significantly more likely, at 45%, than those from large organisations, at 26%, to have no plans53. Conversely, managers from large organisations were significantly more likely than their peers in smaller organisations to have plans for a specific technical or subject knowledge qualification or training (40% compared to 29%)54, or for specific leadership or management training or qualification (35% compared to 18%)55, or to seek a mentor (16% compared to 9%)56.
C6 The means of measuring and rewarding performance is more sophisticated The managers responding to the Online Survey were asked if how performance was measured in their organisations had changed, in particular if more indicators were being used. Overall, 64% replied that how they measured performance had changed, compared to only 36% who replied that the performance indicators their organisations used had stayed broadly similar over the last five years.
Chart 27 shows that managers from organisations without shareholders were more likely to have replied that there had been no change (45%) compared to shareholder related managers (36%), though the strength of association is below .157. Interestingly, there are no significant differences by public, private or third sector. There are also no significant differences in the responses of female and male managers (shown in the chart), nor by management seniority (not shown), with the exception that middle managers were more likely to say that their organisation uses more indicators and they are more complicated58. Those aged 35 or younger were less likely to say that there had been no change (34%) and their older peers more likely to report no change (43%), although there was no overall association by age (Cramer’s V = .09)59. The chart also shows a big difference in response by managers from small organisations compared to those from large organisations. Managers from small organisations were significantly more likely to report no change (62%) than those from large organisations (35%), who in turn were more likely to report that they used more indicators and that
52 X2 (2, N=1046) = 6.330, p = .042. Cramer's V = .078 53 X2 (3, N=1046) = 32.530, p < .001. Cramer's V = .176 54 X2 (3, N=1046) = 10.136, p = .017. Cramer's V = .098 55 X2 (3, N=1046) = 27.780, p < .001. Cramer's V = .163 56 X2 (3, N=1046) = 12.789, p = .005. Cramer's V = .111 57 X2 (3, N=1106) = 8.554, p=.036. Cramer's V = .088 58 X2 (6, N=1106) = 13.162, p=.041. Cramer's V = .077 59 X2 (3, N=1106) = 8.967, p=.030. Cramer's V = .090

71 of 107 © ILM 2014
ILM Research Paper 5: Future trends in leadership and management
they were now more sophisticated (20% compare to 7% of managers from small organisations)60.
60 X2 (9, N=1106) = 60.197, p<.001. Cramer's V = .135
0.0%
20.0%
40.0%
60.0%
Chart 27: Performance measures different compared to five years ago?
No, the performance indicators are broadly similar
Yes, we use more indicators
Yes, we use more indicators and they are now more sophisticated
Yes, we use more indicators and they are more complicated
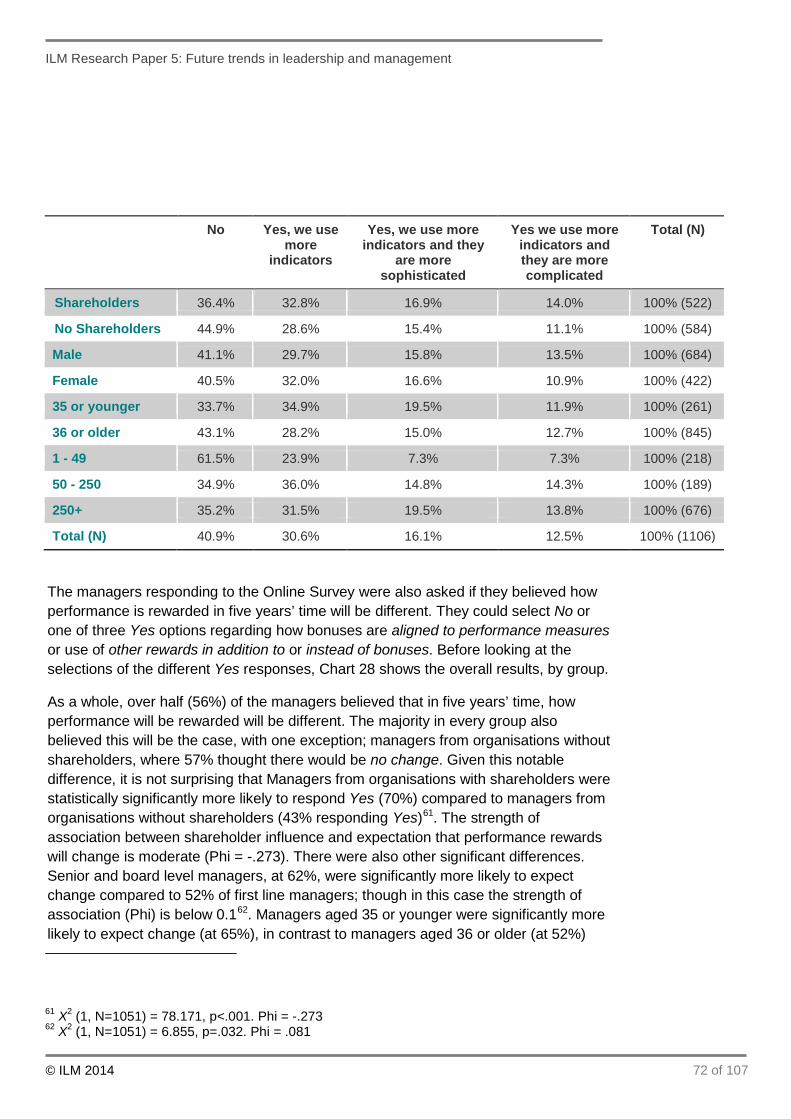
72 of 107 © ILM 2014
ILM Research Paper 5: Future trends in leadership and management
No Yes, we use more
indicators
Yes, we use more indicators and they
are more sophisticated
Yes we use more indicators and they are more complicated
Total (N)
Shareholders 36.4% 32.8% 16.9% 14.0% 100% (522)
No Shareholders 44.9% 28.6% 15.4% 11.1% 100% (584)
Male 41.1% 29.7% 15.8% 13.5% 100% (684)
Female 40.5% 32.0% 16.6% 10.9% 100% (422)
35 or younger 33.7% 34.9% 19.5% 11.9% 100% (261)
36 or older 43.1% 28.2% 15.0% 12.7% 100% (845)
1 - 49 61.5% 23.9% 7.3% 7.3% 100% (218)
50 - 250 34.9% 36.0% 14.8% 14.3% 100% (189)
250+ 35.2% 31.5% 19.5% 13.8% 100% (676)
Total (N) 40.9% 30.6% 16.1% 12.5% 100% (1106)
The managers responding to the Online Survey were also asked if they believed how performance is rewarded in five years’ time will be different. They could select No or one of three Yes options regarding how bonuses are aligned to performance measures or use of other rewards in addition to or instead of bonuses. Before looking at the selections of the different Yes responses, Chart 28 shows the overall results, by group.
As a whole, over half (56%) of the managers believed that in five years’ time, how performance will be rewarded will be different. The majority in every group also believed this will be the case, with one exception; managers from organisations without shareholders, where 57% thought there would be no change. Given this notable difference, it is not surprising that Managers from organisations with shareholders were statistically significantly more likely to respond Yes (70%) compared to managers from organisations without shareholders (43% responding Yes)61. The strength of association between shareholder influence and expectation that performance rewards will change is moderate (Phi = -.273). There were also other significant differences. Senior and board level managers, at 62%, were significantly more likely to expect change compared to 52% of first line managers; though in this case the strength of association (Phi) is below 0.162. Managers aged 35 or younger were significantly more likely to expect change (at 65%), in contrast to managers aged 36 or older (at 52%)
61 X2 (1, N=1051) = 78.171, p<.001. Phi = -.273 62 X2 (1, N=1051) = 6.855, p=.032. Phi = .081

73 of 107 © ILM 2014
ILM Research Paper 5: Future trends in leadership and management
and the strength of association, at .112, is just above the 0.1 threshold63. Although a greater percentage of males (57%) than females (53%) responded Yes, the difference is not statistically significant.
No Yes Total (N)
Shareholders 30.1% 69.9% 100% (492)
No Shareholders 57.2% 42.8% 100% (559)
Male 43.0% 57.0% 100% (653)
Female 47.0% 53.0% 100% (398)
SM, Dir, CEO, NED, Chair 38.1% 61.9% 100% (273)
MM 45.0% 55.0% 100% (309)
FLM 48.0% 52.0% 100% (469)
35 or younger 34.6% 65.4% 100% (254)
36 or older 47.7% 52.3% 100% (797)
Total (N) 44.5% 55.5% 100% (1051)
63 X2 (1, N=1051) = 13.246, p<.001. Phi = .112
0.0%
20.0%
40.0%
60.0%
Chart 28: Will performance be rewarded differently in five years time, no/yes?
No Yes

74 of 107 © ILM 2014
ILM Research Paper 5: Future trends in leadership and management
Chart 29 shows the more detailed results from the four possible response options. Of those responding, that they believed there would be change in how performance is rewarded in five years’ time, most (29%) believed that bonuses would be more closely aligned to performance measures (including traditionally harder to measure ‘soft’ skills). Nearly 14% thought that other awards, in addition to bonuses would be used, while 13% thought, in five years’ time, they will be using other awards instead of bonuses, to reward performance.
Managers from organisations with shareholders were significantly more likely, than their non-shareholder related counterparts, to believe that five years’ from now, bonuses will be more closely aligned to performance measures, or that in addition to bonuses they will also use other rewards64. Here the strength of association (.276) is moderate rather than weak. There are also significant differences by age. Managers aged 35 or younger were more likely to expect to use other rewards in addition to bonuses (19%) compared to older managers (12%); though the strength of association is weak65. Interestingly, there also appear to be differences by level of management. A higher proportion of senior and board level managers, than expected, thought that they would be using other rewards in addition to bonuses and were less likely than expected to foresee no change; the opposite of first line managers. However, with a significance value of .05 this is just below the commonly accepted significance level of under .05 and the overall strength of association (at .077) is also below the .1 threshold for association66
64 X2 (3, N=1051) = 80.264, p<.001. Cramer’s V = .276 65 X2 (3, N=1051) = 15.722, p=.001. Cramer’s V = .122 66 X2 (6, N=1051) = 12.599, p=.050. Cramer’s V = .077

75 of 107 © ILM 2014
ILM Research Paper 5: Future trends in leadership and management
No Yes, bonuses will be…
Yes, in addition to bonuses…
Yes, we will use other rewards…
Total (N)
Shareholders 30.1% 37.6% 17.5% 14.8% 100% (492)
No Shareholders 57.2% 21.1% 10.4% 11.3% 100% (559)
Male 43.0% 30.3% 13.5% 13.2% 100% (653)
Female 47.0% 26.4% 14.1% 12.6% 100% (398)
SM, Dir, CEO, NED, Chair
38.1% 28.9% 19.0% 13.9% 100% (273)
MM 45.0% 28.8% 13.3% 12.9% 100% (309)
FLM 48.0% 28.8% 10.9% 12.4% 100% (469)
35 or younger 34.6% 31.9% 18.9% 14.6% 100% (254)
36 or older 47.7% 27.9% 12.0% 12.4% 100% (797)
Total (N) 44.5% 28.8% 13.7% 12.9% 100% (1051)
0.0%
20.0%
40.0%
60.0%
Chart 29: Will performance be rewarded differently in five years time?
No
Yes, bonuses will be more closely aligned to performance measures including traditionally harderto measure 'soft' skillsYes, in addition to bonuses, we will use other rewards
Yes, we will use other rewards instead of bonuses

76 of 107 © ILM 2014
ILM Research Paper 5: Future trends in leadership and management
There were no significant differences by organisation size. However, there were significant differences by public or private sector. Managers from public sector organisations, at 64%, were significantly more likely than their private sector counterparts, at 36%, to expect no change. In contrast, private sector managers were more likely to expect closer alignment of bonuses to performance measures (35% compared to 16%) and use of other rewards in addition to bonuses (17% private sector managers compared to 7% public sector managers)67. There were no statistically significant differences by organisation size.
In total, 33% of the Managers responding to the Online Survey recognised that the means of measuring and rewarding performance is more sophisticated as a trend.
Most of the Online Community thought that performance management has become more sophisticated over the last decade. A few mentioned the increased use and sophistication of 360 degree feedback, or at least aspects of it. One participant, currently based in East Asia, responded, ‘[t]hankfully, I have seen a move away from the annual or six-monthly appraisal, which has typically been viewed as a chore at best by both sides, if not fear.’ (male, board director). The box ticking exercise was highlighted by a couple of people including a first line manager, ‘…generally the performance review process is cumbersome and becomes a box ticking exercise, with managers and line reports both hoping for it to “hurry up and be done with” (female, first line manager). Another participant was, ‘…seeing a move away from the tick box exercise where often it was a cut and paste from previous years!’ (female, CEO).
One director explained that the good intentions by HR, can be undermined through the mediation by directors and managers:
Very rarely does the intent of PMS [performance management system] get translated into objective appraisal as designed as not all division apply the same benchmarks or demonstrate integrity and discipline towards the defined process. …PMS integrity if not demonstrated top down leads to more dissatisfaction in the system rather than extremes of not having one. (male, board director)
This was echoed by another participant, a chief executive of a business development consultancy: ‘Yes, performance assessment systems have become more sophisticated. But no, this does not mean they are actually used in practice.’ (male, CEO). Additionally, a few participants, from senior manager to director and chair, reflected that performance appraisal systems sometimes seem to exist only for the sake of having one, rather than for their effect. In the words of one, ‘performance management does however turn into a complete industry… This in turn dilutes the effectiveness of the process…’ (female, senior manager)
67 X2 (6, N=1051) = 83.318, p<.001. Cramer’s V = .199

77 of 107 © ILM 2014
ILM Research Paper 5: Future trends in leadership and management
One senior manager found that:
…performance management has become more complex, more time-consuming, more difficult to 'get right' and less rewarding as a part of a manager's job. The advent of a profound emphasis on soft talents (such as EQ) has made 'performance' a fuzzy, foggy, uncertain thing, and the measurement of it less precise or even possible. (male, senior manager)
However, as with all of these trends this trend is not absolute as one participant remarked, ‘[f]or many, appraisals are few and between, for others the system has introduced more measurement. There are winners and losers.’ (male, board chair). Others thought that performance assessment had become more complex but not necessarily more sophisticated.
While performance assessment may have become more sophisticated (or at least more complex) the means of rewarding good performance has often not changed:
In some cases, competency management and appraisal systems have also been changed to reflect this demand [for soft skills]. Yet the financial bonus for superior performance in most companies remains tied nearly 100% to quantitative results: sales achieved, defect levels achieved, etc. Very few companies have the strength to replace an ROI [return on investment] approach with a 70-30% or 50-50% ROI – competency approach. (male, CEO)
A couple of participants highlighted the negative effect of awarding bonuses, including when people chase simple targets rather than meet the outcome they are meant to represent, ‘…rewards are not well targeted to induce better focus on “the job”’ (male, board director). When not awarded, it is perceived as punishment. Even bonuses for overall company performance may have the intended affect as one participant, with a background in HR, explained, that it, ‘can sometimes make it difficult for people to understand how they can contribute, so it can become a demotivator as it seems unachievable.’ (female, senior manager).
One director and consultant argued that:
A 21st century management practice would be to compensate people according to their effectiveness at their level of work. No more bonuses, incentive pays, or other results based compensation... But at which university is this taught? (male, CEO)
However, one participant highlighted an unexpected benefit of the current economic situation:
…the fact that there has been pay freezes for the past number of years which then gets the managers thinking about how to be more effective in looking at how to recognise and reward in a non financial way. (female, CEO)
Another participant explained that, ‘with reward too, the basket of options has increased with other incentives than financial being put on the table.’ (male, board director)

78 of 107 © ILM 2014
ILM Research Paper 5: Future trends in leadership and management
Section D Discussion and conclusions

79 of 107 © ILM 2014
ILM Research Paper 5: Future trends in leadership and management
Section introduction This section discusses the results and judges the evidence for each trend. It then considers certain groups, in particular the difference in response by managers whose organisations have shareholders and those who don’t, as well as managers in large organisations. We then discuss the implications for leadership and management, before concluding. D1 A new model of capitalism is emerging Overall the findings for this trend are mixed, they don’t clearly indicate a trend towards either stakeholder or shareholder capitalism. Only a fifth agreed that a more long term and relationship orientated model of capitalism has emerged. More managers, over the last five years were more cost orientated and in five years’ time were also expected to be more cost orientated than relationship orientated. However, compared to five years ago more managers thought they were more outcomes than process orientated. Also, compared to five years ago, more managers thought their outlook at work was longer term, and more expected it to be longer term in five years’ time.
Both the feedback from the Online Community and the results from the Online Survey highlight the influence of shareholders. It is striking that the consistent and statistically significant differences are by shareholder involvement, not by private, public or third sector. On the whole, managers from organisations without shareholders were significantly more likely than their shareholder related counterparts to have experienced no change over the last five years in or to expect no change in the next five years.
In contrast, managers from organisations with shareholders were generally more likely to have experienced change over the last five years and to expect change in the next five years. But within this shareholder-related managers were split in their opinions. Compared to five years ago, there were 10% more who thought they had become more cost orientated than those who had become more relationship orientated. While over half had become more long term in their outlook, a quarter had become more short term. Only 3% more had become more outcomes orientated than those who had become more process orientated. Looking forward five years, shareholder related managers were more likely to expect to change to be either more cost or more relationship orientated.
So, while managers without shareholders see less change, managers with shareholders seem to be becoming either more shareholder orientated or more stakeholder orientated. This may be market differentiation with some competing on the basis of cost and others competing on the basis of service.

80 of 107 © ILM 2014
ILM Research Paper 5: Future trends in leadership and management
The other consistent differences are by organisation size. Managers from small (and to an extent from medium) organisations were more likely to have experienced no change over the last five years, while those from large organisations were more likely to have changed; most becoming more cost orientated but some becoming more relationships orientated. Regarding expectations of five years’ time this pattern is stronger. Managers form large organisations were also more likely to report becoming more outcomes orientated or more process orientated in the last five years. Managers from large organisations were much more likely, than managers from small organisations, to report that their outlook at work had become more long term compared to five years ago. And in five years’ time managers from small organisations were more likely to expect no change and those from large organisations were expecting to become more long term in their outlook.
These findings raise the question, do managers have to work in organisations with shareholders in order to practise shareholder capitalism? The differences tend to be found amongst managers working in large organisations and those with shareholders; not amongst those who work in medium or small organisations or those who work in organisations without shareholders. There is also an overlap; within the sample there is a moderate to strong association between large organisations and having shareholders, and between small organisations and not having shareholders ( X2 (3, N=1106) = 100.223, p<.001. Cramer’s V = .301). However, the sample also contained managers working for large organisations which were more likely to be public sector than private sector ( X2 (6, N=1106) = 46.568, p<.001. Cramer’s V = .145). So it is not true to simply equate large organisations with shareholder organisations. This question requires a paper of its own and with greater theoretical underpinning. However, the answer would appear to be no. Managers in non-shareholder organisations have no shareholders to whom they are accountable. Yet they will be working in a system where shareholder capitalism remains the dominant paradigm and may have clients (and suppliers) who do have shareholders. Also while public or third sector organisations may not have a short term focus on profits, they will experience similar pressures regarding costs or other targets (as demonstrated in the introduction with the example of Mid Staffordshire NHS Foundation Trust).
The lack of change amongst medium and small organisations is interesting. The Online Survey and Online Community deliberately asked about perceptions of relative change, they did not ask the respondents to rate themselves on a scale. This is because self-rating against a scale of the degree of cost or outcomes orientation, or short term or long term outlook (for example) requires more subjectivity. Also, this research is concerned with relative change rather than absolute measures. However, this means that it is not possible from the data to determine if non-shareholder related managers and managers from small organisations are more relationship orientated, for example, than their counterparts in large organisations, or in those with shareholders. One possible explanation is that it is quicker to change orientation in small organisations than it is in large organisations; small organisations had already moved towards stakeholder capitalism by the end of 2008.

81 of 107 © ILM 2014
ILM Research Paper 5: Future trends in leadership and management
For managers whose perceptions have changed and who expect further change towards greater stakeholder orientation, it is difficult to know which drivers they and their organisations are responding to. Given that a relative minority appear to be more stakeholder orientated, there has not been a paradigm shift and shareholder capitalism remains dominant. The views from the Online Community suggest that some activity, consistent with stakeholder capitalism, is merely presentational to demonstrate corporate social responsibility. To restate the comments from one community member: ‘My belief is that this is trendy and not necessarily a trend’ (‘A’ male, senior manager). Yet for some the change is more sincere and as community member ‘E’ explained is driven by market differentiation, talent attraction and retention.
D2 Flexible working is increasing and is now the norm The responses from the Online Survey were fairly evenly split. At 52%, only 3% more reported an increase in flexible working, over the last five years, for their direct reports than those who responded negatively. Though only 7% reported a decrease; the rest saw minimal change. So there may be an increase but it does not appear to be the default for all; the picture is more mixed.
The increases appear to be more common amongst large, private sector organisations. Those in the private sector were more likely to say it was for the chosen few, while in comparison those in the public sector were more likely to report a decrease (though still only a minority). It seems that for the former, the offer of flexible working may be to engage and retain key staff (‘talent’). For the latter the restructuring and general budget cuts are, if anything, limiting the increase in flexible working. Managers from small organisations were most likely to report minimal change, though there appears to be a slightly more pronounced split amongst a minority of small organisations, which have either decreased or have embraced flexible working as the default.
Looking to the future, only 8% of managers foresaw a decline in their direct reports working flexibly and most groups were more likely to expect an increase rather than no change; the exception being with managers from small and medium size organisations, who were more likely to expect no change. Managers in large organisations generally expect an increase in flexible working, whereas those in medium and small organisations generally expect no change. Again the split by shareholder influence is evident; more managers whose organisations have shareholders expected an increase, yet non-shareholder related managers tended towards no change. A split by age is also evident, managers aged 35 or younger foresaw an increase, those who were older were more evenly split between expecting an increase and no change.
It appears that flexible working is regarded as flexibility for the convenience and benefit of the individual rather than for their organisation or as a mutually convenient arrangement. The comments from the Online Community show that there has (at least for some people) been an increase in flexible working but for the benefit and convenience of the organisation rather than the individual. The perceptions of flexible

82 of 107 © ILM 2014
ILM Research Paper 5: Future trends in leadership and management
working over the past five years and expectations for the next five years do not clearly evidence flexible working is now the norm. However, just over half (51%) recognised this as a trend. That flexible working is increasing (perhaps predominantly for the chosen few) and is unlikely to decrease, does seem clear.
The comment quoted previously from the Online Community, illustrates the related culture where flexible working is commonplace; an orientation over the years towards a general outcome-focussed responsibility and everything being a project.
D3 Relationships are increasingly important both within teams and with external stakeholders Perhaps asking people if working relationships are more or less important is a leading question; few are likely to say that they are less important. Yet the majority (56%) of managers responding through the online survey said that the importance of working relationships had increased rather than remained the same. Additionally 56% of the managers responding to the Online Survey recognised this as a trend. So this appears to reflect a genuine trend rather than answers to leading questions.
The responses between groups were fairly consistent and the only differences are by organisation size and by shareholder influence. These differences follow the same pattern. Those from large organisations were more likely to report increasing importance, managers from small organisations were tending towards no change. Shareholder related managers were more likely than their non-shareholder related counterparts to report increasing importance. As explained in section C3, this only indicates relative change within each group, rather than between groups over time. It may be that small and medium size organisations were quicker to change than large organisations.
As quoted in section C3, one of the Online Community members noted an increase in access to training in and emphasis on relationship management. While only between a quarter and a third had received training in the previous 12 months, this increased to 36% for shareholder related managers. Again, managers in large organisations were more likely than those in small organisations to have had training.
The responses from the Online Community highlighted the importance of networking and relationship management. This might be seen as another outcome of globalisation and technological development; where the network is the paradigm structure. Also, as one of the Online Community members highlighted, where flexible working with dispersed teams is the default, the importance of relationship management becomes more explicit.
Increasing emphasis on relationship management is consistent with a changing orientation away from shareholder capitalism and towards stakeholder capitalism. In this context, working relationships are more important; not just within teams but also with suppliers and with customers. Stronger working relationships with suppliers help to

83 of 107 © ILM 2014
ILM Research Paper 5: Future trends in leadership and management
develop increased trust between both groups, it also engenders a longer term perspective. These may or may not be regarded as benefits in themselves but in turn could lead to efficiencies and urgent issues or crises might be tackled more successfully. Greater emphasis on working relationships with customers can also be used as a market differentiator. Together both can provide a competitive advantage.
D4 The core functions of leadership & management are more important but harder to achieve Generally managers believe that the core functions of leadership and management have become more important but harder to achieve, even if the functions themselves haven’t changed. Overall just over half (52%) agreed that the core functions or ‘basics’ of leadership and management are more important than five years ago, only 4% believed they had become less important. Slightly under half (46%) thought they had become harder to do and only 11% that they had become easier. Differences by shareholder influence and organisation size continue to be apparent. Managers whose organisations have shareholders were significantly more likely, than those from organisations without shareholders, to find that the core functions had become more important. Managers from large organisations were significantly more likely to report increasing importance, those from medium and small organisations tended towards no change. Though in a difference to the established pattern, those managers within the minority that found it had become easier were significantly more likely to be from organisations with shareholders. Non-shareholder related managers were relatively more likely to find that there had been no change. Managers from small or medium size organisations tended towards no change, those from large organisations found the core functions had become harder.
When asked explicitly if that in the future the core functions or ‘basics’ of leadership and management will become more important and harder to do, only 39% recognised this as a trend. This level of agreement is less than half, in contrast to the increase in flexible working and the prominence of working relationships. So at face value this does not seem to be so evident and therefore important. However, in the context of these other two trends, management and leadership is more demanding. Achieving the nuances in communication through email and instant messaging, even Twitter, is much harder than through more discursive prose or in person. It requires a more facilitative than directive style, as reflected in the comments of the Online Community. This is summed up in the observation made by one of the members that it is about exerting presence rather than being present. Exerting presence remotely that supports, inspires and encourages, can be challenging. Such efforts can appear clumsy, superficial or interfering micromanagement; despite good intentions from the manager’s side. This is all against a national background where the management quality could be improved, compared to that of the UK’s competitor countries, as already noted in section B4.
Overall, the primary reason why these core functions have become harder to do, as identified by the managers responding to the online survey, has been less time

84 of 107 © ILM 2014
ILM Research Paper 5: Future trends in leadership and management
because of competition from other priorities. This was followed by increasing complexity of structures, processes and systems. This was indicated by the Online Community who raised the high volume of information which managers and leaders must digest and make sense of, in order to make effective decisions.
Again there were significant differences by shareholder influence. Non-shareholder related managers were less likely to highlight complexity, in contrast to shareholder related managers who ranked complexity ahead of having less time. Managers in large organisations, in contrast to those from medium and small organisations, also highlighted the complexity of systems, processes and structures.
Decreasing tolerance of mistakes or having to manage more people are factors, but only for a minority of managers. Decreasing tolerance of mistakes was highlighted by approximately ten per cent, within the different groups. Being responsible for more people was indicated by usually less than 10%. So both may be considerable factors for some and this was reflected in part by one of the Online Community members. They noted the contradiction in expecting leaders to inspire and motivate without mistakes happening. Yet, for the majority these are not the factors behind the increased difficulty of achieving the core or basic functions of leadership and management.
The table in Section C4 compares the rankings (with one being the most commonly cited) of the functions that the managers thought were done badly amongst the managers with whom they work and the functions which they had prioritised for their own development. The relative rankings are similar and not too much should be read into relative differences of only two or three places. It is interesting to note how similar they are and the top two rankings match, clear communication (first) and effective planning (second), as does the fourth, decision making. Their prominence over other functions can be seen in the context of globalisation and the development of technology. Information flows rapidly over multiple channels, potentially from many sources and it can be hard to implement a plan before the assumptions, upon which it was based, are no longer valid. Equally, it is interesting to see where dramatic differences in rankings for dealing with conflict in the workplace and problem solving and motivating direct reports. The first of these is listed as the third worst function carried out by managers and yet for their own development it is ranked 12th. Conversely, motivating direct reports is ranked 11th and problem solving is ranked 14th in the list of functions done badly amongst managers, yet they are 7th and 3rd respectively for managers’ priorities for their own development.
The Online Survey deliberately asked managers about the functions that were done badly by their peers, rather than them. Firstly, it can be difficult to accurately identify your relative strengths and weaknesses (this is well illustrated by (Kruger & Dunning, 2009)). Secondly, there may be bias in reporting, resulting in over modesty or optimism. The need to keep the online survey relatively short, prevented the option of asking about peers’ and each manager’s own relative weaknesses. So it is difficult to know the extent to which the question we have asked is a reliable proxy for managers’ own weaknesses. However, with this caveat in mind, there does appear to be a

85 of 107 © ILM 2014
ILM Research Paper 5: Future trends in leadership and management
contradiction, given for example that many managers feel that it is the other managers who could be better at dealing with conflict in the workplace, not them. Given the general recognition of the increasing importance of working relationships, it is also notable that consistently demonstrating emotional intelligence is not regarded as a high priority for personal development.
D5 Managers increasingly prioritise their own employability over stable employment Only 39% of the Online Survey respondents recognised as a trend that managers will prioritise their own employability over stable employment in five years’ tme. Yet in comparing the responses choosing between a scenario offering greater employability or greater employment stability, in 2013 compared to five years ago there was a slightly move towards employability. This represents a shift of only 1.9 percentage points and the majority both overall and in each group we considered preferred stable employment, each time; but this still represents a slight swing towards employability. It might be accounted for by the slightly improved economic conditions, in which there are more jobs; the biggest swings (of 6%) were by managers in organisations with shareholders and by senior and board level managers. Between the different groups there was a fairly equal split, with non shareholder-related managers, Females, Middle Managers and those aged 35 or younger all tending towards stable employment
Although few chose the employability option over stable employment in the scenario they were presented with, perceptions from the Online Community indicated that managers are taking greater ownership of their own professional development. But equally there were reports of people determinedly remaining in their current roles with little focus on their own continuing professional development.
This is broadly consistent with the responses from the Online Survey, as already discussed, regarding prioritising employability or stable employment and also plans to improve own employability. Two thirds of the managers responding in the Online Survey had definite plans; usually technically or subject related, a slightly smaller proportion planned specific leadership or management related training, though a further 15% were intending to engage a coach. That those aged 35 or younger were more likely to have definite plans than older managers, might indicate that, despite an ageing workforce, the new generation of managers will lead to a further increase in five years’ time. While there was no significant difference by shareholder influence, managers from large organisations were more likely to have plans for technical, leadership or management training or to seek a mentor.
So there is a slightly increased tendency towards prioritising employability over employment but only for a minority. However, a much larger proportion have had plans to improve their own employability. Altogether, the results in this research indicate this may be a currently emerging and future trend but it is not one that is likely to be dominant to the extent of some of the other trends.

86 of 107 © ILM 2014
ILM Research Paper 5: Future trends in leadership and management
D6 The means of measuring and rewarding performance is more sophisticated In total, only 33% of the Online Survey respondents recognised that the means of measuring and rewarding performance is more sophisticated as a trend which they thought would happen in five years. Although, both overall and in each group considered, most of the responding managers said that they used more performance indicators compared to five years ago, though only 16% overall said that the indicators now used were more sophisticated. Also looking forward five years, over half the managers expected that how performance will be rewarded will be different.
Managers from organisations with shareholders were significantly more likely to expect change in how performance is rewarded in five years’ time, compared to managers from organisations without shareholders. At .273 the strength of association, though moderate, was one of the highest found in this piece of research. More non-shareholder related managers thought performance would not be rewarded differently in the future than those that would. Of those that anticipated change, most expected that bonuses would be more closely aligned to performance measures, including traditionally harder to measure skills.
These results suggest, rather than evidence, increasing sophistication of performance measurement and reward. The general, but not overwhelming, sense from the Online Community was that performance management has become more sophisticated over the last decade. As reported in section C6, the members of the Online Community reflected on the effectiveness or otherwise of performance measurement and their related management systems, whether they were treated as yet another system or process to be subverted or avoided, and how well or poorly indicators were linked to bonuses. A couple of comments from the Community did point towards alternatives to bonuses being used.
There do appear to be more indicators being used and possibly closer alignment of bonuses to performance. However, it does not seem to be a markedly more sophisticated either in terms of measurement or reward. But increasingly the technical possibility is there (as described in Section B6), as may too be the political or cultural will. In section C3 we reported the example, given by one of the Online Community members, about call centre activity now being measured in return on investment, because of the metrics now available. It is possible that similar metrics may increasingly be used to measure staff performance.

87 of 107 © ILM 2014
ILM Research Paper 5: Future trends in leadership and management
D7 Responses by different groups It is clear from both the results and the subsequent discussion that these trends do not apply equally to all groups. Instead they are most notable in large organisations and those with shareholders.
Managers in organisations with shareholders are significantly more likely than managers in organisations without shareholders to:
• Be either more cost orientated or more relationship orientated compared to five years ago
• Be more long term but also more process orientated than five years ago
• Have seen a big increase in flexible working over the last five years and to expect more flexible working in five years’ time
• Have found working relationships have become more important over the last five years and to have had training in relationship management over the previous 12 months
• Have found that the indicators used to measure performance have changed, expect that performance will be rewarded differently in five years’ time and believe that the means of measuring and rewarding performance is more sophisticated, is a trend
• Believe that the basics or core functions of leadership and management have become more important though easier
• Prioritise own employability over stable employment and have definite plans to improve their own employability
Managers in large organisations (compared to those in medium or small size organisations):
• Are either more cost orientated or more relationship orientated compared to five years ago
• Are more long term but also more process or outcome orientated than five years ago and expect to have a more long term outlook at work in five years’ time
• Have seen a big increase in flexible working over the last five years and to expect more flexible working in five years’ time
• Have found working relationships have become more important over the last five years, to have had training in relationship management over the previous 12 months and to recognise this as a trend

88 of 107 © ILM 2014
ILM Research Paper 5: Future trends in leadership and management
• Have found that the indicators used to measure performance have changed and recognise as a trend that the means of measuring and rewarding performance is more sophisticated
• Believe that the basics or core functions of leadership and management have become more important but harder, and to recognise this as a trend
• Prioritise own employability over stable employment and have definite plans to improve their own employability
There are slightly fewer significant differences by age and they have not been emphasised to the same extent but there are a number. In contrast to managers aged 36 or older, those aged 35 or younger were significantly more likely to:
• Expect to have a more long term than short term outlook at work and be slightly more likely to expect to be more relationship than cost orientated in five years’ time
• Have found that the indicators used to measure performance have changed, expect that performance will be rewarded differently in five years’ time
• Have had training in relationship management over the previous 12 months and believe that the basics or core functions of leadership and management have become less important and easier (albeit a minority)
• Prioritise own employability over stable employment and have definite plans to improve their own employability
For each of these points, it does not necessarily apply to the majority in that group. However, they were significantly more likely, compared to the other groups. So it may be the majority of the group or a larger minority compared to other groups.
It is notable that there are very few significant differences between the survey responses by management level, or whether managers were from private, public or third sector organisations, or whether they were female and male. Perhaps we might have expected more differences by management level, but that there is almost no match between responses by management level and by age, shows that one is not a proxy for the other.
Similarly it is notable most of the significant differences observed are with managers from organisations that have shareholders but not those from private organisations. There is some overlap between organisations being large and having shareholders but again one is not a good proxy for the other. Clearly the influence of shareholders is considerable and it does not always drive trends in the same direction for each organisation. As pointed out towards the beginning of Section F1, shareholder organisations are more likely to change and appear to be choosing to differentiate themselves either by cost or by relationships.

89 of 107 © ILM 2014
ILM Research Paper 5: Future trends in leadership and management
Finally it is also of interest that there were few significant differences in the responses by females and males in the Online Survey. This is because it is likely that a greater proportion of the workforce, managers and non-managers, will be female in five years’ time. This is a trend that ILM has observed in comparing Annual Population Survey data between 2004 and 2012 (May & Pardey, 2013). While women are likely to be a larger proportion of the UK workforce in five years’ time, this does not change the implications of this research.
D8 Implications for leadership and management All of these trends have implications for leadership and management though some are more obvious and some implications come from more than one trend. The increasing importance of working relationships and the increasing tendency towards flexible working are linked. If teams and supply chains are to be effective and efficient and for customers to have their expectations met, if not surpassed, all require strong working relationships; characterised by trust and shared understanding. As flexible working increases, building and maintaining strong working relationships becomes more important. Time remains fixed, so while the drivers discussed in section B encourage us to spread ourselves thinner, managers and leaders need to remain focussed. Hence some working relationships may fade, to later be reenergised; though only at the expense of others. This means moving around networks and quickly picking up old threads. This comes back to the observation reported in section B that it matters less what you can do and more about what you can do with others.
This leads onto the importance of the basics or core functions, which although less recognised by managers, are also increasingly important; partly because of the increasing importance of working relationships. They are also increasingly difficult, partly because of the increase in flexible working. All of the core functions of leadership and management are necessary; attempting to define which is the most important is not a productive exercise; all are needed to be successful. However, these findings place particular emphasis on the importance of communication and presence.
Managers and leaders who can communicate and maintain the clarity of their message without compromising tone or sincerity, through the many channels and methods available to them will have an advantage. So while few managers or leaders will feel they are especially bad at communicating, we could all improve. Getting this right will enable them to project the right presence to those they are working with. It is achieving the effect of presence rather than necessarily being physically present that is the goal here. In terms of leadership, having a clear vision will help in projecting that presence.
For flexible working to be effective, there must be trust between the manager and their reports. They must also have a common understanding and expectation of the arrangement, as well as its limits. Managers must ensure clarity and provide clear direction; they will be helped or hindered by the clarity of organisational policies and practices set by their senior management. Clarity and direction is also needed by those

90 of 107 © ILM 2014
ILM Research Paper 5: Future trends in leadership and management
who do not work flexibly in mixed teams, to prevent the perception of unfair distribution of workload and resentment. Again this comes back to effective communication.
Although not such a strongly apparent trend, the divergence amongst organisations with shareholders towards differentiating on the basis of cost or relationships is one of the more notable findings. It also points towards leading culture change. This is a considerable topic within itself and so we will not attempt to properly address it here. But is does raise the question of where leaders position themselves between the current and desired cultures. ‘To galvanise a following’ (male, senior manager, Online Community) and create change they need to be different enough, yet not so different that they fail to gain any traction. Individual leaders may also only be able to effect so much change on their own before handing over to another leader.
These trends also have implications for leadership styles. For those managers and leaders whose styles are predominantly transactional and or directive, they may find that they will need to vary their approaches. They may find that taking a more facilitative approach is more effective, for example leading their reports towards the right course of action via Socratic questioning. For managers at board level, it will be increasingly important to be able to clearly articulate their vision to their staff (and suppliers and customers). The perceived difference in effectiveness, between those who can do this well and those who struggle, seems likely to increase in the context of flexible working and working relationships.
Valuing employability over stable employment requires a paradigm change in thinking; it seems both risky and counterintuitive. It means forsaking stability for agility. Some managers accept this change, others will be forced to deal with the prospect of redundancy or worsening of their employment terms and conditions. At a strategic level, managers and leaders need to consider if they are prepared to encourage their direct reports and staff to improve their skills and attractiveness in the labour market. This means overcoming any anxiety about losing key staff or talent and accepting that what benefits individuals will ultimately benefit their sector. Moreover, it is possible that staff who leave for other jobs may return, with more experience and increased skills and knowledge. It may also attract a higher calibre of new candidates.
Finally, managers and leaders should consider how staff performance in their organisation is measured and rewarded. This is not the sole realm of human resource practitioners; managers and leaders should not abdicate their responsibility in determining and using performance measures and rewards.
This topic has already been explored by ILM (2013)and so will not be repeated here. However, one implication for individual managers is to understand and become comfortable in using more sophisticated performance metrics (including composite indicators) and a mixture of quantitative and qualitative measures to define performance. It is also easy to forget the effectiveness of very simple ways of recognising performance and efforts of their staff. From a public thank you to access to training or a personally chosen small present which shows the personal effort made, can be an effective means of recognition, which need not be expensive.

91 of 107 © ILM 2014
ILM Research Paper 5: Future trends in leadership and management
D9 Conclusions The world of work continues to change and with it the nature of leadership and management. The purposes of leadership and management remain the same but the context in which they are practised and the methods which they use, continue to change. They change due to the drivers of globalisation, technological development and intergenerational differences. These changes are happening along the lines of the six future trends we have identified:
• Flexible working is increasing and is now the norm
• Relationships are increasingly important both within teams and with external stakeholders
• The core functions of leadership & management are more important but harder to achieve
• Managers increasingly prioritise their own employability over stable employment
• A new model of capitalism is emerging
• The means of measuring and rewarding performance is more sophisticated
However, these trends are not all as strongly evident and their effects are not equal across all managers and leaders, or their staff. Of the six, the first three exist and are strengthening, the second three are emerging but the strength of their future direction is unclear despite the potential.
The trends are most evident in large organisations and those with shareholders; this is where there have been most change perceived over the last five years and greatest expectation of change in the next five years. Few people expect there to be a decrease in flexible working and a sizeable proportion anticipate a big increase. Yet, flexible working is and will most likely be the norm only for the chosen few. Even so with this increase and the more flexible nature of the labour market working relationships are increasingly important. Indeed managers and leaders who best master this will have a competitive advantage both for their organisations and themselves. These two trends, mean that the basics or core functions of leadership and management are also increasingly important. However, the competing priorities for managers’ and leaders’ time, allied with the increasing complexity of the systems and processes within which they must operate, make them harder to achieve. Of the list of possible core functions two stand out:
• Communication
• Planning

92 of 107 © ILM 2014
ILM Research Paper 5: Future trends in leadership and management
Getting the tone and message right via the multiple channels and methods of communication can be difficult; it means exerting presence without being physically present. Meanwhile, balancing attention between immediate issues or opportunities and longer term vision requires the right kind of approach to planning, a kind of ‘strategic agility’. These core or basic functions will not necessarily different in themselves, but the future contexts in which they are to be carried will be.
More performance indicators are tending to be used; though whether these are currently more sophisticated is another matter. The technical potential increasingly exists, whether it is taken up will depend on the will and readiness of managers and organisation leaders to confidently interpret a range of simple and more complex indicators, varying between the more quantitative and the more qualitative. In some cases this might mean embracing more ambiguity in place of, perhaps mistaken, simplistic certainty. There seems less change in how performance will be rewarded, perhaps there will be more variation in the types of reward given. This is something we should all give more consideration to and certainly not simply leave to the human resource function in an organisation.
Either willingly or reluctantly, planning for a worst case scenario, there is a small shift towards employability. Given the choice, many managers (and probably their staff) would prefer the security of stable employment. Yet a minority have embraced the paradigm change and in a working world of decreasing permanent employment contracts, managers need to consider their own employability. If they don’t it is unlikely that anyone else will on their behalf. Furthermore, they should consider their responsibilities for encouraging their staff to improve their own employability too. This may mean pressing the message that employability is more than simply networking. Often it can be difficult for individuals (managers included) to identify the transferable skills and evidence the competencies they have. Here there may be a task for mentors, if not coaches.
This research also asked if a new model of capitalism is emerging? One that is longer term in perspective and is more stakeholder orientated, as an alternative to the dominant model of shareholder capitalism which privileges short term profits. The short answer appears to be no. However, this oversimplifies a more nuanced picture. There is a general consensus that outlooks at work have become more long term. There also appear to be divergent reactions, some are becoming more shareholder capitalism orientated but others are becoming more stakeholder orientated. Questioning the status quo of shareholder capitalism has become mainstream and there appears to be an appetite for and expectation of stakeholder capitalism by a significant minority. Perhaps future scandals and growing inequalities may trigger a paradigm change, though this does not feel likely at this point.
This research raises plenty of questions for future research and because of its breadth it necessarily lacks depth regarding the detail of each trend. For example, it would be interesting gain a greater insight into managers’ (especially at first line and middle management levels) understanding of employability and the extent to which they feel they can practically improve their attractiveness in the labour market. Also, whether

93 of 107 © ILM 2014
ILM Research Paper 5: Future trends in leadership and management
they feel that increased mobility (both geographically and between sectors) is attainable and desirable. Finally their appetite for taking fuller responsibility (including financial) for improving or updating their skills is another potential topic for further research.
Both modern and traditional messages emerge from this research. To succeed in the future, managers must be agile and able to adapt to the changing workplace. They must also continue to contend with further technological and cultural change that will impact how organisations operate. At the same time, managers must ensure the core functions of leadership and management are carried out. It would be easy to suggest that this requires a different breed of manager - but it is perhaps more accurate to say that they must be a hybrid of traditional skills and qualities, equipped with a modern mindset, thinking and approach. Timeless qualities demonstrated in modern contexts.
Returning to the aim of this research, we wanted to know, what will managers and leaders need to know, do and be, if they are to be successful in five years’ time? So we can summarise our conclusions in terms of knowing, doing, being.
Managers and leaders must know and understand the core functions of leadership and management from planning to vital people skills such as motivation, effective communication and driving engagement. Crucially, the key to being a successful manager will be knowing how to apply these skills in the changing workplace. They must also understand how to balance the organisation’s longer term perspective and goals with their daily challenges. With far more communication channels and options open to them, managers must learn how to use their respective strengths as well as be aware of their limitations. Meanwhile, even those who aren’t in customer-facing roles, must increasingly know and understand the needs of their customers, suppliers and the expectations of all stakeholders. By mastering all of these skills, individuals will not only personally succeed as managers but will deliver competitive edge to their organisations by exploiting the benefits of flexible working, global markets and technological change.
In terms of doing, with the increase of flexible working, managers must trust their reports and avoid micro-management. Some may struggle if they cannot adjust their style and techniques and learn to measure performance on outcome rather than hours worked. If necessary, they should strengthen the link between performance indicators and reward. This may mean developing new methods of measuring performance that are more appropriate to a modern way of working. Relationship management and collaboration will be central to how organisations operate in the future. Managers at all levels, therefore, must be able to build and manage quality two-way relationships with employees, customers, suppliers and other partners. This will require strong and nuanced communication skills and a mastery of the channels available to them.
Leaders and managers must be agile and adaptive but also reliable and solid. They should be comfortable themselves working flexibly and leading virtual and flexible teams. They should be emotionally intelligent as the qualities that embody this will be required in all aspects of management whether it be engaging and motivating teams or building successful working relationships and partnerships. They should also be

94 of 107 © ILM 2014
ILM Research Paper 5: Future trends in leadership and management
prepared to actively encourage and support their reports’ increasing desire to improve their own employability. This may require a mindset change as doing so may result in losing talent, at least in the short term. Such actions form part of being more stakeholder- than shareholder orientated and having the ability to consider the longer term perspective and vision over short-term gains or concerns.
Overall, the basic aims of leadership and management haven’t and will not change, though their contexts are and will continue to change. The changing contexts place more importance in getting the ‘basics’ right and in a sense, distil both management and leadership down to the importance of working relationships: success comes not from what you can do but what you can do with others.

95 of 107 © ILM 2014
ILM Research Paper 5: Future trends in leadership and management
Annex 1 Bibliography

96 of 107 © ILM 2014
ILM Research Paper 5: Future trends in leadership and management
Asay, M., 2013. Big Data Myths Give Way To Reality in 2014. [Online]. Available at: http://readwrite.com/2013/12/26/big-data-myths-reality#awesm=~oyQQcePxYXbjIK [Accessed 18 March 2014].
Ashdown, P., 2011. The global power shift. [Online]. Brussels: TED. Available at: http://www.ted.com/talks/paddy_ashdown_the_global_power_shift [Accessed 18 March 2014].
B Lab, 2014. Not Sure? [Online]. Available at: http://www.bcorporation.net/become-a-b-corp/not-sure [Accessed 24 March 2014].
B Lab, 2014. What are B Corps?. [Online]. Available at: http://www.bcorporation.net/what-are-b-corps [Accessed 2014 March 24].
BBC, 2011. Banking industry gives up on PPI mis-selling battle. [Online]. Available at: http://www.bbc.co.uk/news/business-13330858 [Accessed 21 March 2014].
BBC, 2013. Timeline: Libor-fixing scandal. [Online]. Available at: http://www.bbc.co.uk/news/business-18671255 [Accessed 21 March 2014].
Benjamin, A., 2012. Has the culture of banking changed?. The Guardian. [Online]. 19 December. Available at: http://www.theguardian.com/commentisfree/2012/dec/19/has-banking-culture-changed [Accessed 24 March 2014].
Bloom, N., Lemos, R., Qi, M., Sadun, R., Van Reenen, J., 2011. Constraints on Developing UK Management Practices. BIS Research Paper No. 58. [Online]. UK Department for Business Innovation and Skills. Available at: https://www.gov.uk/government/uploads/system/uploads/attachment_data/file/32097/11-1377-constraints-on-developing-uk-management-practices.pdf [Accessed 13 March 2014]
BT, 2012. BT Let's Talk Blog. [Online]. 29 January. Available at: http://letstalk.globalservices.bt.com/en/2012/01/the-coffice-next-work-location/ [Accessed 24 March 2014].
Canada Life, 2012. Canada Life research highlights presenteeism concerns as 93% of UK employees surveyed have attended work whilst sick. [Online]. Available at: http://www.canadalife.co.uk/group/intouch-whats-new/news/Presenteeism.asp [Accessed 24 March 2014].
Carlebach, E., 2014. Guardian Small Business Network Blog. [Online]. 14 January. Available at: http://www.theguardian.com/small-business-network/2014/jan/14/small-business-accounts-cloud-computing [Accessed 24 March 2014].

97 of 107 © ILM 2014
ILM Research Paper 5: Future trends in leadership and management
CBI, 2012. Unilever chief urges business leaders to 'restore faith in capitalism'. 19 November. [Online]. Available at: http://www.cbi.org.uk/media-centre/news-articles/2012/11/unilever-ceo-rallies-business-leaders-to-restore-faith-in-capitalism/ [Accessed 24 February 2014].
Elvin, C., Steer, D., 2013. Cultivating agile leaders to deliver growth and success. Seminar at the World of Learning Conference & Exhibition 1-2 October 2013. 1 October. Birmingham NEC.
Financial Times, 2014. Definition of London whale. [Online] . Available at: http://lexicon.ft.com/Term?term=London-whale [Accessed 21 March 2014].
Finn, D., Donovan, A., 2013. PwC's NextGen: A global generational study. Summary and compendium of findings. [Online]. PwC. Available at: http://www.pwc.com/gx/en/hr-management-services/publications/nextgen-study.jhtml [Accessed 24 March 2014].
Food Standards Agency, 2014. Horsemeat investigation. [Online]. Available at: http://www.food.gov.uk/enforcement/monitoring/horse-meat/#.UtZiEXBSjXo [Accessed 21 March 2014].
Freeman, E. R., Martin, K. & Parmar, B., 2007. Stakeholder Capitalism. Journal of Business Ethics, Volume 74, pp. 303-314.
Fyke, J. P. & Buzzanell, P. M., 2013. The ethics of conscious capitalism: Wicked problems in leading change and changing leaders. Human Relations, 66(12), pp. 1619 - 1643.
Gartner, 2013. Gartner IT Glossary. [Online]. Available at: https://www.gartner.com/it-glossary/big-data/ [Accessed 18 March 2014].
Gibson, W., 2003. Interview. The Economist, 4 December.
Groom, B., 2013. Employment Growth 'signals skills shortage'. Financial Times. [Online]. 9 January. Available at: http://www.ft.com/cms/s/0/bd8464aa-59b2-11e2-88a1-00144feab49a.html#axzz2rJPY43U8 [Accessed 18 March 2014].
Hall, P. A., Soskice, D., 2001. Varieties of Capitalism: The Institutional Foundations of Comparative Advantage. Oxford: Oxford University Press. ISBN: 0-19-924775-7.
Hampden-Turner, C., 2013. Project workshop. Slough [Workshop] (24 June 2013).
Hampden-Turner, C., 2013. The Rise of Stakeholder Capitalism: Does the UK have the Wrong Model of Capitalism? Essay. An edited version is available at: https://www.i-l-m.com/Insight/Edge/2013/December/charles-hampden-turner-stakeholder-capitalism [Accessed 24 March 2014].
Holt, R., Sawicki, S., Sloan, J., 2010. A Theoretical Review of Skill Shortages and Skill Needs. Evidence Report 20. [Online]. UKCES. ISBN: 978-1-906597-30-6. Available at: http://www.ukces.org.uk/assets/ukces/docs/publications/evidence-report-20-a-theoretical-review-of-skill-shortages-and-skill-needs.pdf [Accessed 24 March 2014]

98 of 107 © ILM 2014
ILM Research Paper 5: Future trends in leadership and management
House of Commons Treasury Committee, 2009. Banking Crisis: dealing with the failure of the UK banks. Seventh Report of Session 2008-09. [Online]. Report, together with formal minutes. HC 416. London: The Stationery Office Limited. Available at: http://www.publications.parliament.uk/pa/cm200809/cmselect/cmtreasy/416/416.pdf [Accessed 24 March 2014].
Hutton, W., 2012b. The Work Foundation 2012 Annual Debate: Does the economy need a new kind of business?. [Online]. Available at: http://www.theworkfoundation.com/Reports/312/Does-the-economy-need-a-new-kind-of-business [Accessed 24 March 2014].
Hutton, W., 2012. If Britain is to recover, we must embrace new models of capitalism. The Observer, [Online]. 17 March. Available at: http://www.theguardian.com/commentisfree/2012/mar/17/britain-models-capitalism [Accessed 24 March 2014].
ILM, Ashridge Business School, 2011. Great expectations: managing Generation Y. [Online]. London: ILM. Available at: https://www.i-l-m.com/Why-ILM/Research-reports/Gen-y [Accessed 18 March 2014].
ILM, 2012. The leadership and management talent pipeline.[Online]. London: ILM. Available at: https://www.i-l-m.com/Why-ILM/Research-reports/Talent-pipeline [Accessed 24 March 2014]
ILM, 2013. Beyond the bonus: Driving employee performance. [Online]. London: ILM. Available at: https://www.i-l-m.com/Why-ILM/Research-reports/Beyond-the-bonus [Accessed 18 March 2014].
ILM, 2013. Flexible working: Goodbye nine to five. [Online]. London: ILM. Available at: https://www.i-l-m.com/Why-ILM/Research-reports/Flexible-working [Accessed 18 March 2014].
Interim Management Association, 2012. The UK's interim management industry. [Online]. Available at: http://www.interimmanagement.uk.com/about-ima/the-uks-interim-management-industry/ [Accessed 24 March 2014].
Jackson, G. & Deeg, R., 2006. How Many Varieties of Capitalism? Comparing the Comparative Institutional Analysses of Capitalist Diversity. MPIfG Discussion Paper, No. 06/2. [Online]. Available at: https://www.econstor.eu/dspace/bitstream/10419/19930/1/dp06-2.pdf [Accessed 24 March 20014].
Jacobs, K., 2013. What can HR do to change the banking culture and rebuild trust?. HR Magazine. [Online]. 26 February. Available at: http://www.hrmagazine.co.uk/hr/feature/1076401/what-hr-change-banking-culture-rebuild-trust [Accessed 24 March 2014].
Kirkup, J., 2012. Occupy protestors were right, says Bank of England official. The Telegraph. [Online]. 29 October. Available at:

99 of 107 © ILM 2014
ILM Research Paper 5: Future trends in leadership and management
http://www.telegraph.co.uk/finance/newsbysector/banksandfinance/9641806/Occupy-protesters-were-right-says-Bank-of-England-official.html [Accessed18 March 2014].
Kruger, J. & Dunning, D., 2009. Unskilled and Unaware of It: How Difficulties in Recognizing One's Own Incompetence Lead to Inflated Self-Assessments. Psychology, Volume 1, pp. 30-46.
Lekushoff, A., 2012. Lifestyle-Driven Virtual Teams: A new Paradigm for Professional Services Firms. [Online] . Available at: http://www.iveybusinessjournal.com/topics/the-workplace/lifestyle-driven-virtual-teams-a-new-paradigm-for-professional-services-firms#.UtfPEXBSiQC [Accessed 24 March 2014].
Mackey, J. & Sisodia, R., 2013. Conscious Capitalism: Liberating the Heroic Spirit of Business. 1 ed. Boston: Harvard Business Press. ISBN: 9781422144206.
Mayfield, C., Purnell, J., Daview, W., Dec2011 - Feb2012. Debate: Why aren't there more companies like John Lewis? The difficulties of breaking the stranglehold of shareholder capitalism. Public Policy Research, 18(4), pp. 216 - 221.
May, T., Pardey, D., 2013. ILM Research Report 3: UK Managers’ Profile 2013. [Online] ILM. Available at: https://www.i-l-m.com/Why-ILM/Research-reports/uk-managers-profile [Accessed 18 March 2014].
McAfee, A. & Brynjolfsson, E., 2012. Big Data: The Management Revolution. [Online] Available at: http://hbr.org/2012/10/big-data-the-management-revolution/ar [Accessed 14 March 2014].
Millard, N. J., Gillies, S., 2011. Workshift: The future of the office. [Online]. BT. Available at: http://www.btireland.ie/pdfs/byod-whitepaper-the-future-of-the-office.pdf [Accessed 18 March 2014].
Naughton, J., 2012. Why Big Data is now such a big deal. The Observer. [Online]. 18 March. Available at: http://www.theguardian.com/technology/2012/mar/18/big-data-storage-analysis-internet [Accessed 17 March 2014].
Porter, M. E., Kramer, M. R., 2011. Creating Shared Value. Harvard Business Review Magazine. [Online]. January. Available at: http://hbr.org/2011/01/the-big-idea-creating-shared-value [Accessed 11 May 2014].
Poynter, R., 2011. A Community Panel Or An MROC?. [Online]. Available at: http://www.visioncritical.com/blog/community-panel-or-mroc [Accessed 2014 March 24].
Simon, M., 2009. Online Research Communities. [Online]. Available at: http://www.toluna-group.com/wp-content/uploads/2011/08/superbrands_toluna_communities_final.pdf [Accessed 24 March 2014].

100 of 107 © ILM 2014
ILM Research Paper 5: Future trends in leadership and management
Smith, M., 2013. Business Success in Asia: The Eight Lessons I've Learned. [Online] Available at: http://www.linkedin.com/today/post/article/20130801095344-275552820-business-success-in-asia-the-eight-lessons-i-ve-learned [Accessed 21 March 2014].
UK Border Agency, 2013. Tier 2 Shortage Occupation List - Government-approved version - valid from 6 April 2013. [Online]. Available at: https://www.gov.uk/government/uploads/system/uploads/attachment_data/file/261493/shortageoccupationlistnov11.pdf [Accessed 24 March 2014].
UKCES, 2014. The Future of Work: Jobs and Skills in 2030. [Online]. London: UKCES. ISBN: 978-1-908418-63-0. Available at: http://www.ukces.org.uk/ourwork/future-of-work [Accessed 21 March 2014].
Walker, S., 2013. IoD Director General speech on the challenges for capitalism. [Online]. 13 March. IoD. Available at: http://www.iod.com/influencing/press-office/press-releases/iod-director-general-speech-on-the-challenges-for-capitalism [Accessed 24 February 2014].
Wholefoods Market, 2014. Company info. [Online]. Available at: http://www.wholefoodsmarket.com/company-info [Accessed 24 March 2014].
Wikipedia, 2013. The War for Talent. [Online]. Available at: http://en.wikipedia.org/wiki/The_war_for_talent [Accessed 24 March 2014].
Yang, F., 2011. The importance of Guanxi to Multinational Companies in China. Asian Social Science, 7(7), pp. 163-168.

101 of 107 © ILM 2014
ILM Research Paper 5: Future trends in leadership and management
Annex 2 Online survey

102 of 107 © ILM 2014
ILM Research Paper 5: Future trends in leadership and management
Survey questions What level of management best describes your role?
• First line manager - I directly supervise at least one person • Middle manager - I have other managers reporting to me • Senior manager - I head up a function or division • Director • Chief Executive • Non-Executive Director • Board Chair • Not a manager or board level director
Are you?
• Male • Female
How old are you?
[open text]
How many people approximately [full time equivalents] does your organisation employ?
• Fewer than 20 • 20 - 49 • 50 - 99 • 100 -249 • 250 - 499 • 500 - 999 • Over 1,000 • Don’t know
Which of these sectors do you work in?
• Public sector (an organisation owned or controlled by Central or Local Government)
• Private sector (a business organisation owned by private individuals, other businesses or financial organisations)
• Third sector (not for profit organisations like charities, social enterprises and mutual organisations owned by employees or customers)
• Not sure/prefer not to say Does your organisation have external investors (not directly involved in day to day operations) or shareholders?
• Yes • No

103 of 107 © ILM 2014
ILM Research Paper 5: Future trends in leadership and management
Compared to five years ago… ... are your dealings with suppliers and customers based more on cost or more on the strength of the relationship (trust)?
• More cost orientated • No change • More relationship orientated
... is your outlook at work more short term (ie next quarterly report), or long term (ie one, two or more years)?
• More long term • No change • More short term
…are you more focussed on managing how people work and what they do (process orientated) or on the quality and quantity of output (output orientated)?
• More process orientated • No change • More outcomes orientated
... are your direct reports working more flexibly (ie compressed hours or flexi time, working from home)?
• No, they are now working less flexibly • No, they are now working less flexibly • Yes, but only for a chosen few • Yes, there has been a big increase • Yes, it is now the default way of working
Compared to five years ago… ... has the importance of working relationships (for effective and efficient communication and collaboration) changed?
• Less important • No change • More important
... do you measure performance differently?
• No, the performance indicators are broadly similar • Yes, we use more indicators • Yes, we use more indicators and they are more complicated • Yes, we use more indicators and they are now more sophisticated
... have the core functions or 'basics' (ie delegating, goal setting, motivating direct reports etc) of management and leadership become more or less important?

104 of 107 © ILM 2014
ILM Research Paper 5: Future trends in leadership and management
• Less important • No change • More important
... have the core functions or 'basics' of management and leadership become easier or harder?
• Easier • No change • Harder
Which of these two scenarios would you have chosen five years’ ago?
• A stable, permanent job offering fewer career development opportunities • A 12 month fixed term contract offering more career development opportunities
Which of these two scenarios would you choose now?
• A stable, permanent job offering fewer career development opportunities • A 12 month fixed term contract offering more career development opportunities
Have you had training in relationship management within the last 12 months?
• Yes • No
Which of the core functions or 'basics' of management and leadership do you find are done badly amongst the managers you work with? Please rank the top three.
• Listening and being accessible to direct reports • Effective planning • Problem solving • Clear communication • Goal setting • Monitoring performance of direct reports • Dealing with conflict in the workplace • Talent recruitment and selection • Delegating • Decision making • Giving effective feedback to direct reports • Coaching direct reports • Chairing meetings • Consistently demonstrating emotional intelligence • Motivating direct reports • Other (i) [Please specify] • Other (ii) [Please specify] • Other (iii) [Please specify]

105 of 107 © ILM 2014
ILM Research Paper 5: Future trends in leadership and management
Which of the core functions or 'basics' of management and leadership do you prioritise for your own development? Please select up to three.
• Listening and being accessible to direct reports • Effective planning • Problem solving • Clear communication • Goal setting • Monitoring performance of direct reports • Dealing with conflict in the workplace • Talent recruitment and selection • Delegating • Decision making • Giving effective feedback to direct reports • Coaching direct reports • Chairing meetings • Consistently demonstrating emotional intelligence • Motivating direct reports • Other [Please specify]
In five years’ time… ... do you think the nature of your work will be more cost (ie transactional) or more relationship (ie trust) orientated?
• More cost orientated • No change • More relationship orientated
... do you think your outlook at work will be more short term (ie next quarterly report), or long term (ie one, two or more years)?
• More long term • No change • More short term
... do you foresee your direct reports working more, or less flexibly (ie compressed hours or flexi time, working from home)?
• More flexibly • No change • Less flexibly
... do you believe how performance is rewarded will be different?
• No • Yes, bonuses will be more closely aligned to performance measures including
traditionally harder to measure 'soft' skills • Yes, in addition to bonuses, we will use other rewards • Yes, we will use other rewards instead of bonuses

106 of 107 © ILM 2014
ILM Research Paper 5: Future trends in leadership and management
Do you have any definite plans to improve your own employability in the next 12 months?
• Undertake a secondment • Other • Seek a mentor • Undertake specific leadership or management training/ qualification • Undertake specific technical/subject knowledge training/ qualification • No plans • Advice and support from a career or executive coach
Which of these trends (if any) do you recognise? Please select all which you think will probably apply in five years' time.
• Managers prioritise their own employability over stable employment • A more long term and relationship-orientated model of capitalism has emerged • The means of measuring and rewarding performance is more sophisticated • Flexible working is the new normal • The Core functions of leadership & management are more important but harder
to achieve • Relationships are even more important (both within teams and with
customers/suppliers) Is there anything else you would like to say? [open text] Which of these industries best describes the kind of organisation you work for?
• Financial services, banking and insurance • Health and social care • Education • Central or local government (incl. Police and Fire Services) • Retail, wholesale, distribution, travel & transport • Leisure, catering and hospitality • Professional services and consultancy • Engineering and manufacturing • Utilities (water, gas, electricity), post and telecoms • Media, publishing, PR and marketing • Military • Other (Please specify) • Not sure/prefer not to say
Where do you live?
• North East • North West • Yorks & Humber • East Midlands • West Midlands

107 of 107 © ILM 2014
ILM Research Paper 5: Future trends in leadership and management
• East • London • South East • South West • Wales • Scotland • Northern Ireland • Other [please specifiy]
To which one of the following ethnic groups do you belong? (categories are from the 2011 Census)
• White - English / Welsh / Scottish / Northern Irish / British, Irish, Gypsy or Irish Traveller
• White - Any Other White background • Mixed / Multiple ethnic group - White and Black Caribbean, White and Black
African, White and Asian, Any Other Mixed / multiple ethnic background • Asian / Asian British – Bangladeshi,Chinese, Indian, Pakistani • Asian / Asian British - Any other Asian background • Black / African / Caribbean / Black British • Other ethnic group – Any other ethnic group • Don't know/ prefer not to say
(Questions on participation in PR activities and prize draw)