Embed Size (px)
Citation preview

Keyword: Environmental comfort, Library, Illuminance
Published Date: 4/30/2018 Page.160-175 Vol 6 No 04 2018
Abstract
The illumination has a great influence on the performance of the students influencing their learning.
Thus, this work has as main objective to evaluate the levels of illuminance that the users are submitted
in the reading areas of the central library of the Federal University. For this, a luximeter was used and
with the support of R software, statistical tests were performed to evaluate the behavior of the
variable illuminance between the shifts, days and reading areas. It was observed that, in general, the
library is not in compliance with the current norm, and there was no significant change in the average
level of illumination between the shifts and days of measurement, except for the reading areas chosen
for analysis. Therefore, it is advisable to maintain the electrical installations of this library, besides the
placement of more luminaires near the windows and replacement of the lamps with the LED ones.
Illuminance assessment: a case study in a central
library of a federal university
Aianna Rios Magalhães Véras e Silva;Matheus das Neves Almeida;Hélio Cavalcanti
Albuquerque Neto;Bárbara Cristina Costa Bacelar de Carvalho;João Isaque Fortes
Machado
Link: http://ijier.net/ijier/article/view/1008

International Journal for Innovation Education and Research www.ijier.net Vol:-6 No-04, 2018
International Educative Research Foundation and Publisher © 2018 pg. 160
Illuminance assessment: a case study in a central library of a federal
University
Aianna Rios Magalhães Véras e Silva, Matheus das Neves Almeida, Hélio Cavalcanti Albuquerque
Neto, Bárbara Cristina Costa Bacelar de Carvalho, João Isaque Fortes Machado
Universidade Federal do Piauí
Brazil
Abstract
The illumination has a great influence on the performance of the students influencing their learning. Thus,
this work has as main objective to evaluate the levels of illuminance that the users are submitted in the
reading areas of the central library of the Federal University. For this, a luximeter was used and with the
support of R software, statistical tests were performed to evaluate the behavior of the variable illuminance
between the shifts, days and reading areas. It was observed that, in general, the library is not in
compliance with the current norm, and there was no significant change in the average level of illumination
between the shifts and days of measurement, except for the reading areas chosen for analysis. Therefore,
it is advisable to maintain the electrical installations of this library, besides the placement of more
luminaires near the windows and replacement of the lamps with the LED ones.
Keywords: Environmental comfort. Library. Illuminance.
1. Introduction
The comfort sensation is essential for the human being to have pleasure and well-being in the exercise of
their activities. On the other hand, many elements have affected into environments, and the environments
have directly affected people [1]. In this sense, the environmental aspects are important for the performance,
protection, and well-being of users [2, 3]. The good environmental conditions reflect directly on the
productivity and quality of the activity performed and for users to feel good in their environment, they need
to enjoy a favorable situation of environmental comfort.
Thus, the place’s environmental comfort conditions have a direct influence on the user’s performance
during their leisure and labor activities, mainly in learning-oriented facilities, as is the case of libraries. For
to achieve a satisfactory environmental performance a series of variables must be involved in the study of
the environment; among them the acoustic, thermal, and luminous that work together for the labor
conditions to be satisfied [4].
The role of lighting in daily lives is essential to operate ideally in every environment [5], in view of creates
a sense of happiness and vitality that could positively affect people [6]. In the case of an educational
learning environment, where people spend most of their day [7], some of these variables overlap with others
in degree of importance when it refers to reading activity, in which case the light variable deserves special

International Journal for Innovation Education and Research www.ijier.net Vol:-6 No-04, 2018
International Educative Research Foundation and Publisher © 2018 pg. 161
attention. In this way, the luminous comfort in learning places improves and increases the performance and
user productivity being able to relieve the eyes tension and accelerate the recognition of things, increasing
their visual stability [8].
Therefore, the determinant factor for the activities development with efficiency is the quality and quantity
of illumination, because through it one has the visual perception of the spaces and the object center of
attention, defining it as visual comfort [9]. It should be emphasized that in the literature, the quality of the
lighting refers to the luminance and to amount is related to the illuminance of the environment [10].
Brazil sets the minimum illuminances to be reached by the type of visual activity according to NBR 8995-
1 in force since 2013, replacing NBR 5413 of 1992, due to the great time without any revision, besides the
appearance of new technologies of lamps, such as the Light Emitting Diode (LED).
This paper aims to evaluate the light performance of the Central Library of the one Federal University in
Brazil, evaluating the intensity of illumination (illuminance) and its variation in the different areas of
reading having as a main objective to evaluate the illuminance levels to which users are submitted in its
reading areas.
Besides the physiological and psychological effects of lighting, studies have also indicated positive effects
of specific lighting conditions on behavior, such as working speed, productivity, and accuracy [11].
Moreover, the visual fatigue causes eye irritation and watery eyes, and with that the person starts to blink
more frequently which makes vision blurred and even doubled [12].
Therefore, a study that guides this prism of environmental comfort in an educational learning environment
has an important impact not only on the performance of activities, but also on the quality of life of those
who enjoy this environment. Generally, 83 percent of learning takes place by the sense of sight in the
learning process [13]. In addition, such research is justified by the fact that the library was founded in 1973,
so the architectural design took into account luminous parameters of norms in force at the time of its
construction; however, NBR 8995-1 of lighting came into effect in April 2013, and there is no survey that
considers it. Thus, this light study becomes pertinent and may contribute to increase the current context of
knowledge on the subject.
2. Methodology
2.2 General Aspects of Data Collection
This subsection explains the article variables and indicators, showing, subsequently, the instruments of data
collection and the procedures for collecting them. Thus, the study variables were divided into 2 dimensions,
in which the first is the dependent variable and the second dimension refers to the independent variables
capable of varying the levels of illumination, outlined in Table 1.
Table 1. Dimensions of variables and indicators
Dimension 1 – Illuminance
Values of illumination level that must be measured by a lux meter.
Variable Indicator

International Journal for Innovation Education and Research www.ijier.net Vol:-6 No-04, 2018
International Educative Research Foundation and Publisher © 2018 pg. 162
Level of illumination Lux
Dimension 2 – Variations of illumination levels among areas, shifts, and days.
Variables Indicators
Area Higher (3) or lower (1 or 2)
Shift Morning (1), afternoon (2), and evening (3)
Day 1, 2, or 3
From Table 1, the level of illumination is considered dependent variable, measured in lux, while the
variables of dimension 2 are considered independent, because these can vary the level of illumination.
Moreover, quantitative data were collected by the LDR-22 lux meter and registered on a Microsoft Excel®
spreadsheet.
In this context, 101 spots for measurement of illuminance were selected across the reading area from the
Central Library. Three (3) measurements were done per each spot, and then an average was calculated,
during 3 shifts in 3 different days, ending in 2727 measurements during 909 observations. Before the
comparison with the values determined by the NBR 8995-1, the equipment was tested in order to verify
the specifications of the lux meter. Finally, the layout of illuminance spots of the reading areas from the
Central Library (Teresina campus) took into consideration the levels of illuminance, the quantity of lamps,
the distance between lamps, and the height in relation to the users’ view level.
2.2 Treatment and Analysis of Data
The collected data were organized in a systematic way to perform a detailed analysis, then the collected
observations regarding the levels of illumination were tabulated with the help of Microsoft Excel®
spreadsheets and saved in .txt format. After this tabulation and organization, the data were compared to that
established by NBR 8995-1.
The data were then imported into the R x64 2.15.0 software®, where basic statistics (central tendency and
dispersion measures) were performed for each shift, reading area, and measurement day, as well as a general
analysis that considers all points without distinction of area, shift, or day. Also in the R x64 2.15.0
software® box plot graphs were elaborated with the intention of having a better visualization of the
behavior of the dependent variable (illuminance) by shift, area, and day of measurement.
In addition to the aforementioned tools, some statistical tests were used. Firstly, normality of the dependent
variable was observed using the histogram followed by the Shapiro-Wilk and Lillitefors tests, and both
have as alternatives the null hypothesis (H0): normal distribution and the alternative hypothesis (H1): not
normal, where for a pvalue less than 0.05, which means at 5% of significance, the null hypothesis is rejected
and does not present a normal probability distribution.
It was also necessary to use the non-parametric Wilcoxon test which considers as a null hypothesis (H0):
the means are equal, and the alternative hypothesis (H1): the means are different. The statistic test is the
pvalue in case it is higher than 0.05, so the null hypothesis must not be rejected.
Furthermore, for the treatment and analysis of the lighting distribution, coordinates were established
representing each measurement point, using AutoCAD software®, in which each area was delimited by a

International Journal for Innovation Education and Research www.ijier.net Vol:-6 No-04, 2018
International Educative Research Foundation and Publisher © 2018 pg. 163
rectangle, the left lower extremities of each area were taken as the reference point with coordinates (0,0).
With these coordinates associated to the illuminance levels measured on the first day of measurement in
the afternoon shift, the response surface was formed in order to have a 3D visualization of the distribution
of illumination within each reading area. The graphs needed for that were elaborated in the STATISTICA
software, being adjusted by a method called softening splines.
3. Results and Discussion
3.1 Measurements and Analysis of Illuminance Levels
Following what was planned, the measure points selected were measured during the days and shifts
proposed. Thus, a sample of illuminance values gathered is shown in Figure 1 already imported to the R
x64 2.15.0 software®.
Thus, for the purpose of calculations in the software, the variables were organized as follows: the morning,
afternoon, and night shifts were represented, respectively, by numbers 1, 2, and 3; the two lower areas and
the upper area were represented, respectively, by the numbers 1, 2, and 3; as for the variable day, this was
numbered in 1, 2, and 3, since there were 3 days of measurement.
Figure 1. sample of illuminance levels measured by the R x64 2.15.0 software®.
Observing Figure 1, notice the first twenty observations with the due representations mentioned in the
previous paragraph referring to the shift, day, and area.
From this tabulation, the statistical data analyses were started, for which three perspectives of variation of
the illumination level were considered due to the independent variables, the area, the shift, and the measured
day. In Table 2 the measures of central tendency and dispersion of the dependent variable (illuminance) for
each independent variable presented previously, and, finally, a general analysis that considers all points
without distinction of area, shift, or day is shown.
International Journal for Innovation Education and Research www.ijier.net Vol:-6 No-04, 2018
International Educative Research Foundation and Publisher © 2018 pg. 164
Table 2. Measures of central tendency and dispersion
Independent
variables
Dependent Variable Illuminance (lux)
Minimum
value Median Average
Maximum
value
Standard
deviation
Morning shift 67.8 197.3 219.2 583.4 92.30
Afternoon shift 52.5 193.5 216.5 621.3 90.65
Evening shift 70.3 196.4 216.8 600.3 90.39
Area 1 92.8 199.0 202.7 345.2 58.98
Area 2 86.1 178.9 184.3 303.6 44.83
Area 3 52.5 236.2 275.9 621.3 128.55
Day 1 52.5 195.2 215.1 621.3 91.21
Day 2 70.3 197.1 218.5 598.7 91.72
Day 3 69.1 196.4 219.0 604.7 91.40
OVERALL 52.5 196,4 217,5 621.3 91.02
With Table 2, a better visualization is possible of the illuminance levels behavior; additionally, verify that
none of the averages have values greater than or equal to 500 lux, which is required in libraries’ reading
areas by NBR 8995-1.
Another important point to be mentioned regarding Table 2 is that in the maximum values found only in
areas 1 and 2 did not reach values within the limit allowed by the referred norm, and thus, these areas did
not have points above the allowed limit, being totally outside the standard required. On the other hand, the
other variables (shifts, area 3, and days) had points within the tolerance limit of the current norm. It is
important to emphasize that all values of this column in the different shifts and days belong to
measurements of area 3.
In relation to the standard deviations, they were similar amid shifts, days, and the general, while in the
areas there was a greater disparity mainly between area 3 and areas 1 and 2, which is the first indication of
a more significant variation among the levels of illuminance measured in the different areas.
For a better visualization of these measurements, box plot graphs were developed that more clearly display
the variations of the illuminance performances per shift, area, and day according to Figures 2, 3, and 4.

International Journal for Innovation Education and Research www.ijier.net Vol:-6 No-04, 2018
International Educative Research Foundation and Publisher © 2018 pg. 165
Figure 2. graph illuminance x shift
Figure 3. graph illuminance x area.
Figure 4. graph illuminance x day.

International Journal for Innovation Education and Research www.ijier.net Vol:-6 No-04, 2018
International Educative Research Foundation and Publisher © 2018 pg. 166
Observing the Box plot Graphs of the independent shift and day variables represented by Figure 2 and
Figure 4, respectively, see that they do not present a large variation in the mean of the illuminance values
observed and, additionally, a concentration of the observations around the value of 200 lux. However, the
variable area Graph (Figure 3) presents indications of a greater variation, mainly between area 3 with the
other areas (1 and 2), showing, once again, the indication of variation among the areas already presented
by the standard deviation in Table 2. However, this clue must be checked by means of statistical tests to
prove what has been exposed here.
For this, the dependent variable observations were verified by the illuminance histogram (Figure 5)
followed by the Shapiro-Wilk and Lillitefors test shown in Table 3.
Figure 5. Illuminance histogram.
From Figure 5, verify that the majority of samples are in the intervals referring to the values of 150 to 250
lux being also notorious that there are only very few values that exceed the 500 lux, required by NBR 8995-
1. It is worth mentioning that these values belong to the same point in the upper area. It is also possible to
assume that the observations profile does not resemble the profile of a normal probability distribution, since
the observations would have to be supposed to be equally divided around an average, which in this case is
not well-defined. However, to prove this indicative the normal Shapiro-Wilk and Lilitefors tests, presented
in Table 3, were applied.
Table 3. Shapiro-Wilk Test and Lillitefors Test
Pvalues – Shapiro-Wilk Test Pvalues – Lillitefors Test
Shift 1 1.287 x e-14 < 2.2 x e-16
Shift 2 5.594 x e-14 2.873 x e-16
Shift 3 6.659 x e-15 < 2.2 x e-16
Area 1 1.353 x e-5 0.006918
Area 2 3.51 x e-6 3.851 x e-9
Area 3 3.239 x e-7 1.479 x e-12
Day 1 1.814 x e-14 3.226 x e-15
Day 2 1.174 x e-14 < 2.2 x e-16
Day 3 2.621 x e-14 < 2.2 x e-16

International Journal for Innovation Education and Research www.ijier.net Vol:-6 No-04, 2018
International Educative Research Foundation and Publisher © 2018 pg. 167
As previously exposed, the hypothesis alternatives are considered for the above tests: null hypothesis (H0):
normal distribution and alternative hypothesis (H1): not normal. Thus, Table 3 shows that the Shapiro-Wilk
and Lillitefors tests results for the three independent variables (shift, day, and area) presented a pvalue of
less than 0.05, that is, at 5% of significance the null hypothesis can be rejected so that the measured
illuminance does not present a normal probability distribution. This confirms the indicative raised by the
observation of Figure 9 of the histogram Graph.
In view of that, it is common to perform Wilcoxon non-parametric test to confirm whether or not there is
variation in the mean of the illuminance due to the three independent variables (shift, day, and area). Thus,
the same was applied for validation of the variation indications of the averages raised in Table 2, with the
standard deviation column, and in the box plot graphs analysis of Figures 2, 3, and 4, the test results are set
forth in Table 4.
Table 4. Wilcoxon Test
Wilcoxon Test Pvalues
Shift 1 – Shift 2 0.8558
Shift 2 – Shift 3 0.9191
Shift 3 – Shift 1 0.7702
Area 1 – Area 2 4.981 x e-5
Area 2 – Area 3 < 2.2 x e-16
Area 3 – Area 1 7.531 x e-12
Day 1 – Day 2 0.5485
Day 2 – Day 3 0.9104
Day 3 – Day 1 0.449
Take into account that for this test it is considered as a null hypothesis (H0): the means are equal and the
alternative hypothesis (H1): the means are different; it is verified, through Table 4, that the Wilcoxon test
results for the variables shift and day presented a pvalue greater than 0.05, that is, at 5% of significance it
can be inferred that the null hypothesis cannot be rejected and that the means are equal. Therefore, only for
the variable area the means can be considered distinct which also confirms the difference found in the box
plot graph of Figure 3, as the result for this independent variable presented a pvalue less than 0.05, where the
null hypothesis is rejected there is no variation of the means to 5% of significance.
This observation shows that natural lighting may not be well used, since there is no significant difference
between the measurements taken in the morning and afternoon shifts with night measurements, which can
be related both to the library architectural design and the format of individual study tables which are in
booths.
3.2 Inner Distribution of the Library’s Illuminance
In this subsection, the layout mapping and the lamps distribution will be exposed, as well as the response
surface analysis to verify the illumination level distribution within each area through the values measured
on the first day of measurement and the afternoon shift. These values were chosen randomly, since, as
evidenced in the previous subsection, there was no significant variation between the shifts and days, only

International Journal for Innovation Education and Research www.ijier.net Vol:-6 No-04, 2018
International Educative Research Foundation and Publisher © 2018 pg. 168
among the areas.
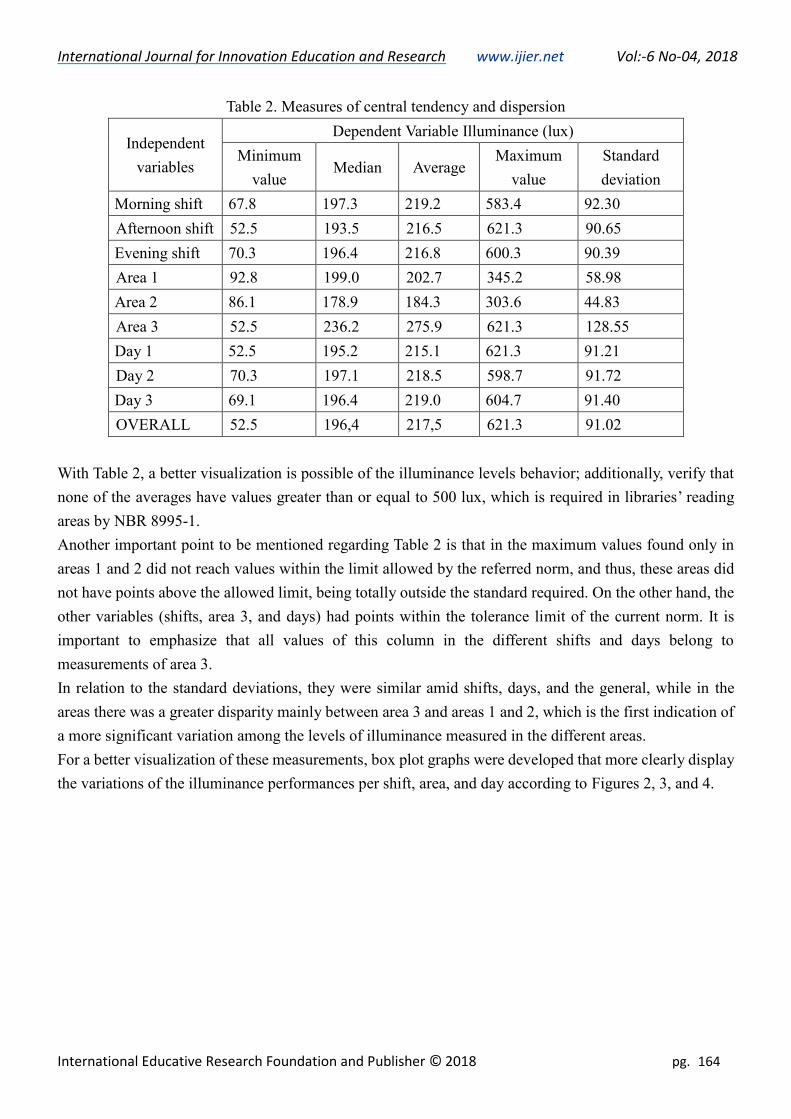
Thus, as expected, a layout mapping and lamps distribution in the reading areas of Central Library were
carried out, and variables such as the amount of lamps, the distances between them, and the height in
relation to the visual field of the user were collected. Figures 6, 7, and 8 show the layout mapping of the
reading areas 1, 2, and 3, respectively, as well as the lamps distribution in these areas, represented by green
and red circles in areas 1 and 2, and by green rectangles in area 3 since they try to represent a format similar
to the actual of the lamps.
Figure 6. layout mapping and lamps distribution of the reading area 1.
International Journal for Innovation Education and Research www.ijier.net Vol:-6 No-04, 2018
International Educative Research Foundation and Publisher © 2018 pg. 169
Figure 7. layout mapping and lamps distribution of the reading area 2.

International Journal for Innovation Education and Research www.ijier.net Vol:-6 No-04, 2018
International Educative Research Foundation and Publisher © 2018 pg. 170
Figure 8. layout mapping and lamps distribution of the reading area 3.
From Figure 6, the presence of 29 lamps can be observed in the reading area 1 distributed among the 129
individual study tables, of which four are burned out, as shown in Figure 9, resulting in the ratio of 1:5,

International Journal for Innovation Education and Research www.ijier.net Vol:-6 No-04, 2018
International Educative Research Foundation and Publisher © 2018 pg. 171
where a lamp illuminates approximately 5 tables. Noteworthy is the presence of only four lamps over the
tables near the windows and there are two of them burned out.
Figure 9. photo of lamps on area 1.
As cited above, there is an indication of poor lighting in this area, since it is unlikely that only one lamp
will illuminate the area equivalent to 5 tables.
In the layout mapping and lamps distribution in the reading area 2 (Figure 7), 55 lamps can be seen
distributed among the 206 individual study tables. However, 20 of them are burnt out (x in red) and in 3
there are only the electric wires without the lamps’ structure (yellow circle), as can be seen through Figure
10, thus succeeding in the ratio 1:6, in which for each lamp there are approximately 6 tables to be
illuminated, leaving this area with an even greater indication of being ill-lit.
Figure10. photo of lamps on area 2.
However, in the layout mapping and in the lamps distribution of reading area 3, there are 74 long luminaires
represented by the rectangles of Figure 8, which bring 2 lamps in each of them, adding up 148 lamps
distributed in the 76 group study tables, in which only 10 are burnt out, resulting in approximately 2 lamps
for each group study table, i.e., one luminaire for each table, indicating a better illumination of that area in
relation to the others.
Another factor that can favor the area 3 illumination is the shorter distance from the lamps to the surfaces

International Journal for Innovation Education and Research www.ijier.net Vol:-6 No-04, 2018
International Educative Research Foundation and Publisher © 2018 pg. 172
of the tables (field of work), being 1.3 meters in addition to its uniform distribution. However, in the other
areas there is no such uniformity as they are supported by electric wires of varying sizes (Figure 11), and
the nearest one is more than 4 meters away from the surface of the table.
Figure 11. misalignment of lamps on area 2.
To corroborate with the aforementioned, the response surfaces of each area were elaborated from the values
of the first day of measurement in the afternoon shift. In Figure 12, see the Graph of the response surface
for area 1 from different perspectives.
Figure 12. response Surface graph for area 1.
The graph plotted on Figure 12 shows that the majority of measured points are on the orange zone with the
average value of 220 lux. There are few points with 300 lux or more corresponding to the dark red color in
the graph. In addition to showing a significant number of points in the green colors, basically present at
one extremity, these refer to the coordinates of the points near the windows and/or burned out lamps,
indicating values below 120 lux. These findings confirm the hint raised by the Figure 6 analysis, which
indicates a poor distribution of the lighting of the place.
Figure 13. response Surface graph for area 2.

International Journal for Innovation Education and Research www.ijier.net Vol:-6 No-04, 2018
International Educative Research Foundation and Publisher © 2018 pg. 173
According to the response surface of area 2, shown in Figure 13, it can be observed that on the day
considered, there were no points higher than 300 lux, which means that the average of its illumination is
lower than that of the previous area, which was proven in Table 2 of subsection 3.1.
From Figure 13, it is also possible to observe the existence of many points with illuminance levels lower
than 160 lux, which, when analyzed, showed that these coordinates represent mainly the closeness of areas
without lamps or with these burned out.
Finally, the response surface of area 3 was analyzed as being the one that showed better results, as proved
in Figure 14.
Figure 14. response Surface graph for area 3.
When analyzing Figure 14, see the prevalence of measurement points higher than 220 lux and many points
between 320 and 400 lux, which surpass the average levels revealed in the other areas. On the other hand,
the existence of points with lux inferior to those of the other areas was observed, which corroborates with
the minimum value column of Table 1, which exhibits the lowest value found belonging to area 3.
4. Conclusion
The measurements assert that the majority of illuminance levels on the selected spots are between 150 and
250 lux and the average is 217.5 lux. Comparing NBR 8995-1 standards, it can be noted that the levels are
under the minimum level of 500 lux, except for area 3, whose values were adequate according to the
standards during all shifts. Thus, the statistical tests show that only amid the areas a considerable variation
of illuminance was found, chiefly on area 3. Shifts and days did not register significant variations.
Area 3 (upper floor) had the highest average of illuminance, which can be justified by the closest and well-
aligned position of lamps in relation to the study tables, by the quantity of lamps, and its uniform
distribution. For this reason, a suggestion is that the height between the lamps and areas 1 and 2 be
decreased, so the illuminance performance can be enhanced. It is also important to keep the periodic
maintenance of lamps and other equipment on the 3 selected areas. Moreover, it was noted that some lamps
have burnt out and there were few lamps next to the windows.
Area 2 had the lowest average of illuminance among the selected areas and it is also the area with the
largest number of burned out lamps. In this perspective, these lamps must be changed for brand new ones
and new lamps must be installed close to the windows. It is also advised that the new lamps must be LEDs,
because of the energy that might be saved, decreasing the expenditure for the maintenance of the Library.

International Journal for Innovation Education and Research www.ijier.net Vol:-6 No-04, 2018
International Educative Research Foundation and Publisher © 2018 pg. 174
Finally, the analysis of the surface areas indicate that the most considerable variation of the illuminance
distribution among the areas occurred during the first day’s afternoon.
It is important to emphasize that, generally, researches with case studies are endowed with limitations,
which was not different for this research. Thus, the main limitation is the financial one due to the library
objection to follow the suggestions due to the high initial cost that it would set for the lamps change by
LED, with the addition of luminaires in the lower areas, besides the standardization and reduction of the
distances between the study tables and the luminaires in the lower areas.
These limitations may be useful to impel new complementary researches investigating more and more
problems and making it easier to propose better solutions. Thus, from the observations mentioned it is
possible to suggest future studies that investigate the library in the other two areas that NBR 8995-1 still
divides, such as shelves and librarians, in order to have a complete analysis of the illuminance of the studied
library.
However, not only illuminance is an essential factor for good lighting, it is alsom suggested that researches
to be done for verify the distribution of luminance, glare, directionality of light and the use of natural light,
according to the current norm. Another recommended complementary study is the analysis of the other
comforts mentioned, such as thermal and acoustic, in order to be a more complete analysis of the library
environmental comfort. Finally, it is also recommended the complement of this study considering the
different types of stations during the year, analysing their influence for light performance.
6. References
[1] S. A. Samani and S. A. Samani, "The Impact of Indoor Lighting on Students’ Learning Performance in
Learning Environments: A knowledge internalization perspective", International Journal of Business and
Social Science, v. 3, n. 24, 2012, pp. 127-136.
[2] E. F. Coutinho Filho et al, Avaliação do conforto ambiental em uma escola municipal de João Pessoa,
IX ENCONTRO NACIONAL DE EXTENSÃO, João Pessoa, 2010, pp. 1-12.
[3] A. O. Azodo, “Illuminance and daylight distribution assessment for learners’ comfort and safety in one-
side-window oriented classroom building”, Arid Zone Journal of Engineering, Technology and
Environment, v. 13, n. 5, 2017, pp. 567-576.
[4] J. H. Ochoa, D. L. Araújo and M. A. Sattler, "Análise do conforto ambiental em salas de aula:
comparação entre dados técnicos e a percepção do usuário," Ambiente Construído, Porto Alegre, v. 12, n.
1, 2012, pp. 91-114.
[5] M. S. Mott, D. H. Robinson, A. Walden, J. Burnette and A. S. Rutherford, "Illuminating the Effects of
Dynamic Lighting on Student Learning", SAGE Open, 2012, pp. 1–9.
[6] N. Nasrollahi and E. Shokri, "Daylight illuminance in urban environments for visual comfort and energy

International Journal for Innovation Education and Research www.ijier.net Vol:-6 No-04, 2018
International Educative Research Foundation and Publisher © 2018 pg. 175
performance", Renewable and Sustainable Energy Reviews, v. 66, 2016, pp. 861–874.
[7] L. Bellia et al, “Methods to evaluate lighting quality in educational environments”, Energy Procedia, v.
78, 1, 2015, pp. 3138-3143.
[8] S. A. Samani, "The impact of indoor lighting on students’ learning performance in learning
environments: A knowledge internalization perspective," International Journal of Business and Social
Science, Malaysia, v. 3, n. 24, 2012, pp. 127-136.
[9] R. Lambert, L. Dutra and F. O. R. Pereira, Eficiência Energética na Arquitetura, São Paulo, Eletrobras/
Procel, 2014.
[10] H. A. Couto, Ergonomia Aplicada ao Trabalho: conteúdo básico: guia prático, Ergo Ltda, Belo
Horizonte, 2007, pp. 1-272.
[11] K. Choi and H. Suk, “Dynamic lighting system for the learning environment: performance of
elementary Students”, Optics Express, v. 24, n. 10, 2016, pp. 1-12
[12] I. Iida and L. B. M. Guimarães, Ergonomia: Projeto e Produção, Blucher Ltda., São Paulo, 2016, pp.
1-850.
[13] A. Gilavand, M. Gilavand and S. Gilavand, "Investigating the Impact of Lighting Educational Spaces
on Learning and Academic Achievement of Elementary Students", International Journal of Pediatrics, v. 4,
n. 5, 2016, pp. 1819-1828.