Embed Size (px)
Citation preview
Road Materials and Pavement Design, 2013Vol. 14, No. S2, 57–78, http://dx.doi.org/10.1080/14680629.2013.812838
IlliTC – low-temperature cracking model for asphalt pavementsEshan V. Davea*, William G. Buttlarb, Sofie E. Leonb, Behzad Behniab and Glaucio H. Paulinob
aDepartment of Civil Engineering, University of Minnesota Duluth, Duluth, MN 55812, USA; bDepartmentof Civil and Environmental Engineering, University of Illinois, Urbana, IL 61801, USA
Low-temperature cracking (LTC) is a major distress and cause of failure for asphalt pavementslocated in regions with cold climate; however, most pavement design methods do not directlyaddress LTC. The thermal cracking model (TCModel) utilised by American Association ofState Highway and Transportation Officials Mechanistic-Empirical Pavement Design Guiderelies heavily on phenomenological Paris law for crack propagation. The TCModel predictionsare primarily based on tensile strength of asphalt mixture and do not account for quasi-brittlebehaviour of asphalt concrete. Furthermore, TCModel utilises a simplified one-dimensionalviscoelastic solution for the determination of thermally induced stresses. This article describes anewly developed comprehensive software system for LTC prediction in asphalt pavements. Thesoftware system called ‘IlliTC’ utilises a user-friendly graphical interface with a stand-alonefinite-element-based simulation programme. The system includes a preanalyser and data inputgenerator module that develops a two-dimensional finite element (FE) pavement model forthe user and which identifies critical events for thermal cracking using an efficient viscoelasticpavement stress simulation algorithm. Cooling events that are identified as critical are rigor-ously simulated using a viscoelastic FE analysis engine coupled with a fracture-energy-basedcohesive zone fracture model. This article presents a comprehensive summary of the compo-nents of the IlliTC system. Model verifications, field calibration and preliminary validationresults are also presented.
Keywords: asphalt; thermal cracking; fracture; performance; simulation; cohesive zone;transverse cracking; viscoelasticity; model; pavement; IDT; DC(T); IlliTC
1. Motivation and introductionOne of the main advantages of asphalt concrete over Portland cement concrete (PCC) is thesmoothness and cost savings afforded by continuous paving, i.e. without the need for transversejoints. Unlike PCC and other infrastructure materials, asphalt concrete is generally able to undergothermal cycling without the need for expansion or contraction joints due to its viscoelastic nature.Under imposed strain, which is constantly occurring in pavements due to temperature change,viscoelastic materials are able to relax stress over time. In addition, asphalt is generally a fracture-resistant material, owing to its flexible mastic matrix and particulate composite morphology.Significant energy is required to initiate and propagate a crack through asphalt concrete, as theasphalt mastic is tough, strain tolerant, and viscoelastic (stress relaxing), and the aggregates addstrength, crack bridging, and crack surface tortuosity. However, improper selection of asphaltgrade, excessive ageing of the asphalt binder, and/or a weak asphalt mixture (weak aggregates,low cohesion, and low adhesion) can all contribute to poor mixture fracture resistance. Poormixture fracture resistance can lead to the development of thermal cracks, which are typicallytransversely oriented with traffic and periodic in nature.
*Corresponding author. Email: [email protected]
© 2013 Taylor & Francis
Dow
nloa
ded
by [U
nive
rsity
of I
llino
is at
Urb
ana-
Cham
paig
n] a
t 15:
53 1
7 Ju
ne 2
014
58 E.V. Dave et al.
Thermal cracking is very serious pavement distress, as it can significantly increase pavementroughness and because it creates a permanent discontinuity in the pavement structure. In a recentstudy by Islam and Buttlar (2012), pavements allowed to reach a rough condition were shownto increase user costs (vehicle repair, tyre, and fuel cost) by over five million dollars per lanemile over a 35-year life cycle. In contrast, by investing just 1/50th of this cost in additionalmaintenance, the pavement could be kept in smooth condition over its lifespan, avoiding theseadditional user costs. However, in order to achieve this result, the pavement would need to beproperly designed to avoid the development of medium- or high- severity thermal cracking,since an improper mixture design could lead to the development of thermal cracks prior to theapplication of the first maintenance or rehabilitation treatment.
Asphalt technologists have long recognised the need to control thermal cracking in asphaltpavements, and the tests and models available to assist in this endeavour have continuouslyevolved. Early efforts to control asphalt behaviour at low temperatures were focused on theasphalt binder. A comprehensive review of early binder tests in the USA has been documented byBrown et al. (2009). The penetration test, especially if run at two temperatures (generally 25◦Cand 4◦C), provided some control over binder ‘consistency’ and ‘temperature susceptibility’. Theductility test provided a simple measure of binder ‘stretch’ or strain tolerance. However, nei-ther of these tests was applicable to temperatures below 0◦C, where thermal cracking is likelyto occur. In Europe, the Fraass breaking point test is used (as specified by EN 12593:2007),which is a torture-type binder test designed to determine the temperature at which a thin film ofbinder bonded to a small rectangular brass plate becomes intolerant to a bending strain arisingfrom flexing the brass plate to a specified curvature. Although this test allowed direct mechan-ical testing of the binder at temperatures below 0◦C, its direct relation to thermal cracking isquestionable due to the very high strain level imposed. Superpave (American Association ofState Highway and Transportation Officials (AASHTO) M320) addressed thermal cracking withmodern binder tests run at low temperatures and in fundamental testing configurations. A bend-ing beam rheometer characterised the stiffness and m-value (a measure of the ability of thebinder to relax stress). An optional direct tension test was also specified, which was designedas a second referee test to address certain polymer-modified binders that possessed not onlyhigher stiffness but also high strain tolerance and fracture resistance. However, the system wasnever intended to directly control thermal cracking; rather, it was developed as a binder purchasespecification.
Although binder tests are convenient, practical, and important from the perspective of binderselection, purchase, and quality control, asphalt technologists have acknowledged the need toaddress thermal cracking more directly through testing of the asphalt mixture and modelling of thepavement structure. Canadian researchers developed limiting mixture stiffness recommendationsbased upon a comprehensive field investigation at Ste. Anne (Deme & Young, 1987). During theStrategic Highway Research Programme (SHRP), a mixture-based testing and analysis schemewere developed to validate the binder test and specification system being developed. A low-temperature mixture creep and strength test was developed, later called the Superpave indirecttension test (the acronym ‘IDT’ was developed in early Superpave publications, and is stillcommonly used), as specified in AASHTO T-322. Master creep compliance curves, shift factors,tensile strength, and optionally, mixture coefficient of thermal expansion and contraction (CTEC)at low temperatures can be obtained with the Superpave IDT. SHRP researchers, working underproject A-005 also developed a computer-based thermal cracking model, called TCModel, as partof the effort to validate the Superpave binder specification. The first version of TCModel wascompleted in 1992, near the end of the SHRP programme.
TCModel made great strides in modelling some of the key physics underlying the thermal crack-ing mechanism. In particular, TCModel had a highly sophisticated viscoelastic pavement response
Dow
nloa
ded
by [U
nive
rsity
of I
llino
is at
Urb
ana-
Cham
paig
n] a
t 15:
53 1
7 Ju
ne 2
014
Road Materials and Pavement Design 59
model, which predicted pavement tensile stress versus depth on an hourly basis throughout thelife of the pavement based upon principles of linear viscoelasticity. Due to limitations in compu-tational power, a phenomenological pavement cracking model was used for distress prediction.Change in crack length was predicted using a power-law-type model reported by Paris, Gomez,and Anderson (1961), which uses change in stress intensity (which was calculated in an approx-imate manner by interpolating presolved two-dimensional (2D) elastic finite element (FE) runs)to predict change in crack length. In TCModel, Paris law parameters were empirically linkedto IDT strength and to the slope of the log mixture compliance versus log time relationshipat long loading times (mixture m-value). TCModel was selected for inclusion in the AASHTOMechanistic-Empirical Pavement Design Guide (MEPDG), and was improved and streamlinedas part of the National Cooperative Highway Research Program 1-37A project. For instance, anautomated mixture master curve generation programme was bundled with TCModel. In addition,additional field data, including that obtained from MnROAD test sections, were used to recalibrateTCModel.
With changes in asphalt binder and mixture designs and materials over the past 20 years, suchas the increased use of polymers and other additives and the increased use of recycled asphaltpavement, it became apparent that the heavy reliance on mixture tensile strength in crackingpredictions was limiting the prediction accuracy of TCModel. New mixture fracture tests weredeveloped to address these new materials, including the disk-shaped compact tension test, orDC(T), which provided a convenient means to obtain mixture fracture energy using a fracturemechanics-based approach. Recognising the shortcomings of TCModel in light of modern mixturefracture tests and computational power, a new TCModel was developed at the University ofIllinois Urbana-Champaign, called ‘IlliTC’, as part of a national Pooled Fund Study on low-temperature cracking (LTC). IlliTC improves the manner in which fracture is handled in thesimulation scheme, namely, the one-dimensional (1D) Paris-law phenomenological modellingapproach was replaced with a 2D, cohesive zone fracture modelling approach implemented withina viscoelastic FE modelling framework. The cohesive zone approach considers both materialstrength and fracture energy in computing crack initiation and propagation using fundamentalfracture mechanics principles. In summary, the new approach used in IlliTC has the followingimprovements over TCModel:
• A 2D model is used instead of 1D.• The physics of cracking in a quasi-brittle, heterogeneous particulate composite is more
correctly captured by using a cohesive zone approach, where softening and fracture have adistinct length scale that is captured.
• Asphalt mixtures may have unique combinations of strength and ‘ductility’ (as characterisedby mixture fracture energy). For instance, some polymer-modified mixes portray moderatetensile strength and high fracture energy; some have high strength and lower fracture energy,and some have both high strength and high fracture energy. Mixtures with higher recycledmaterial content may have high strength, but low fracture energy. IlliTC can capture all ofthese combinations in a direct manner, while TCModel could only capture these effects inan indirect manner.
• A user-friendly graphical interface (GUI) has been provided for IlliTC. The GUI programmemodule within IlliTC is referred to herein as Visual LTC.
This article presents the IlliTCmodel components, model verification, model calibration, andpreliminary validation results. Ongoing research, aimed at adding additional software capabilitiesand modelling features to the IlliTC programme are also described.
Dow
nloa
ded
by [U
nive
rsity
of I
llino
is at
Urb
ana-
Cham
paig
n] a
t 15:
53 1
7 Ju
ne 2
014
60 E.V. Dave et al.
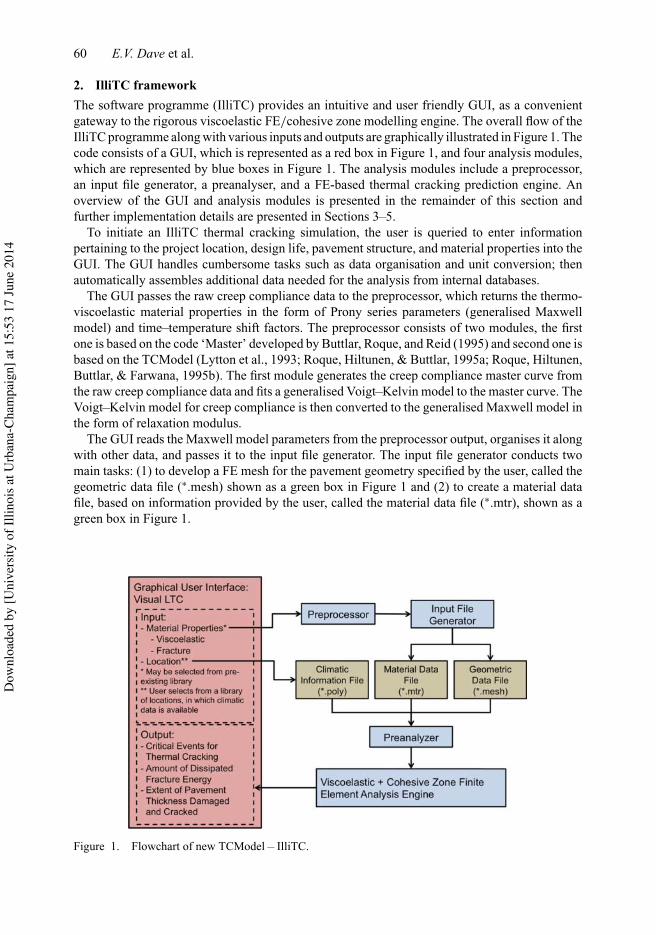
2. IlliTC frameworkThe software programme (IlliTC) provides an intuitive and user friendly GUI, as a convenientgateway to the rigorous viscoelastic FE/cohesive zone modelling engine. The overall flow of theIlliTC programme along with various inputs and outputs are graphically illustrated in Figure 1. Thecode consists of a GUI, which is represented as a red box in Figure 1, and four analysis modules,which are represented by blue boxes in Figure 1. The analysis modules include a preprocessor,an input file generator, a preanalyser, and a FE-based thermal cracking prediction engine. Anoverview of the GUI and analysis modules is presented in the remainder of this section andfurther implementation details are presented in Sections 3–5.
To initiate an IlliTC thermal cracking simulation, the user is queried to enter informationpertaining to the project location, design life, pavement structure, and material properties into theGUI. The GUI handles cumbersome tasks such as data organisation and unit conversion; thenautomatically assembles additional data needed for the analysis from internal databases.
The GUI passes the raw creep compliance data to the preprocessor, which returns the thermo-viscoelastic material properties in the form of Prony series parameters (generalised Maxwellmodel) and time–temperature shift factors. The preprocessor consists of two modules, the firstone is based on the code ‘Master’ developed by Buttlar, Roque, and Reid (1995) and second one isbased on the TCModel (Lytton et al., 1993; Roque, Hiltunen, & Buttlar, 1995a; Roque, Hiltunen,Buttlar, & Farwana, 1995b). The first module generates the creep compliance master curve fromthe raw creep compliance data and fits a generalised Voigt–Kelvin model to the master curve. TheVoigt–Kelvin model for creep compliance is then converted to the generalised Maxwell model inthe form of relaxation modulus.
The GUI reads the Maxwell model parameters from the preprocessor output, organises it alongwith other data, and passes it to the input file generator. The input file generator conducts twomain tasks: (1) to develop a FE mesh for the pavement geometry specified by the user, called thegeometric data file (∗.mesh) shown as a green box in Figure 1 and (2) to create a material datafile, based on information provided by the user, called the material data file (∗.mtr), shown as agreen box in Figure 1.
Figure 1. Flowchart of new TCModel – IlliTC.
Dow
nloa
ded
by [U
nive
rsity
of I
llino
is at
Urb
ana-
Cham
paig
n] a
t 15:
53 1
7 Ju
ne 2
014

Road Materials and Pavement Design 61
The GUI collects the climatic data necessary to perform the analysis in the chosen location forthe specified duration from internal databases. These data are stored in the climatic information file(∗.poly), shown as a green box in Figure 1. Then the GUI passes all input files to the preanalyser.
The preanalysis module (or ‘preanalyser’) serves to minimise the analysis time of the morerigorous FE engine. Typically, LTC analysis is focused around critical cooling events. Hence,critical cooling events are identified by the preanalyser so that the full model can be focused oncritical cooling events, typically reducing computational time by more than 90% (i.e. in a 365day year, less than 36 days would typically need to be simulated). The GUI reads the results ofthe preanalysis module and extracts the data pertinent to the critical cooling events. These dataare then passed to the FE model.
The user is not required to have direct interaction with the viscoelastic and cohesive zone FEsimulation; instead, results are sent back to the GUI, which are interpreted for the user.
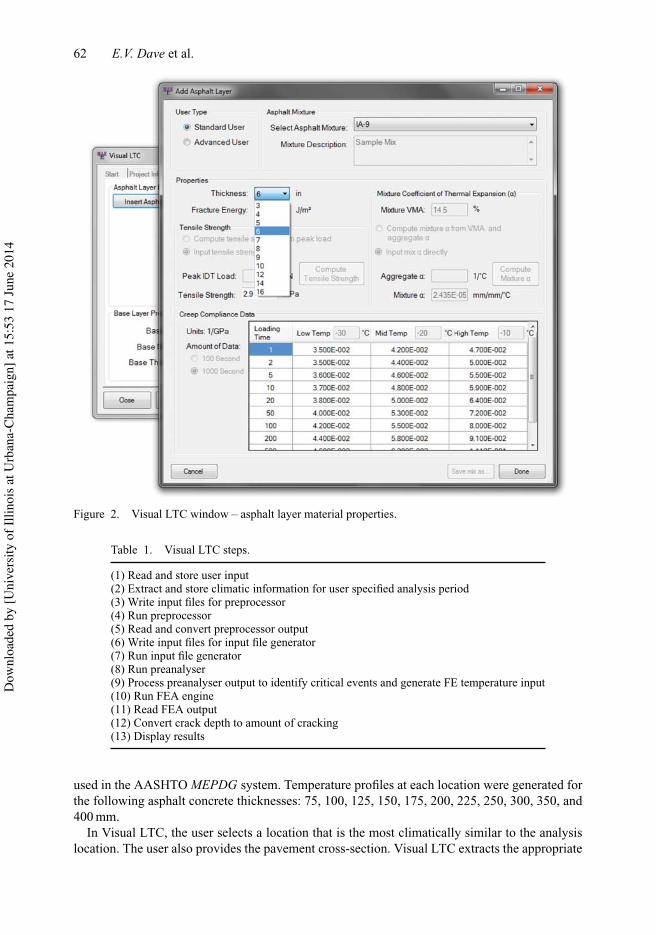
3. Graphical user interfaceThe GUI, called ‘Visual LTC’, collects and compiles the input conditions provided by the user,executes various analysis modules to conduct finite-element analysis (FEA), and interprets anddisplays the results. Visual LTC was written with the object-oriented programming languageC# (pronounced ‘see-sharp’) under Microsoft’s .NET framework, and which is intended for thedevelopment of deployable software. Visual LTC was designed to be intuitive to use by practi-tioners or researchers. A series of windows are used to query the user for required model inputs.For example, the window that collects the asphalt layer material properties is shown in Figure 2.User inputs and options shown in Figure 2 are discussed in more detail in subsequent sections.For further details on conducting analysis using Visual LTC, the reader is referred to Dave, Leon,and Park (2011).
3.1. Communication with analysis modulesData are passed between Visual LTC and the analysis modules via input/output files. VisualLTC reads the user input then performs the series of converting data, writing files, executingprogrammes, and reading output given in Table 1.
3.2. User typesVisual LTC is intended for use by practitioners and researchers alike. Therefore, two user typesare supported: ‘Standard User’, and ‘Advanced User’. Both users have access to all functionalitypreviously described. However, Advanced Users have the additional capability of adding newasphalt mixes and modifying properties of existing asphalt mixes. The distinction between theseuser types is present so that existing properties are protected from inadvertent user error. The usercan easily change from one user type to the other.
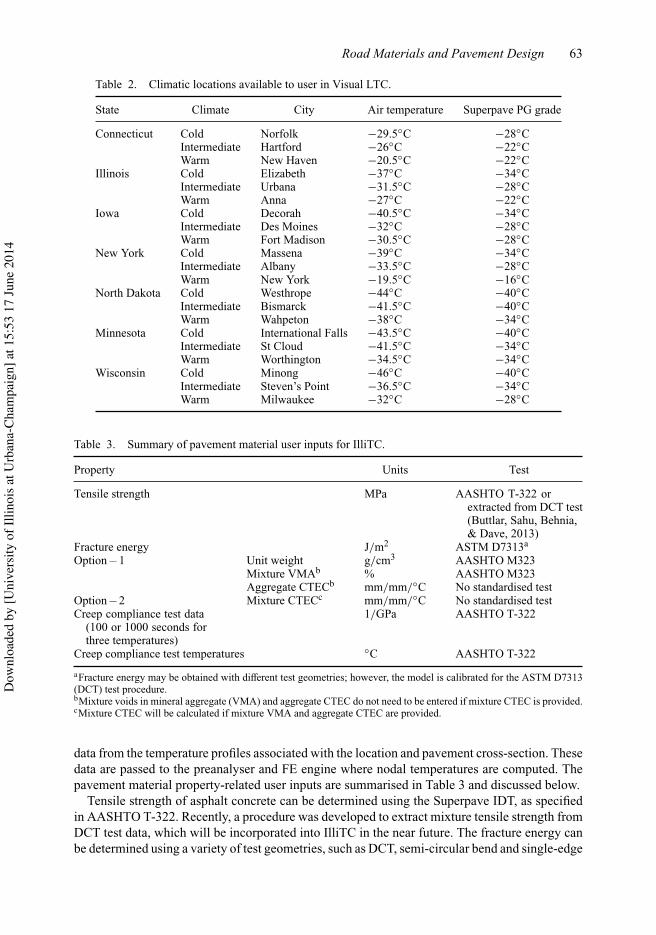
3.3. Visual LTC user inputsThe main user inputs that are required for LTC analysis are the analysis location, analysis duration,and the pavement material properties. A series of integrated climatic model (ICM) simulationswere conducted to create a library of pavement temperature profiles available to the user in VisualLTC. Sets of temperature profiles were generated for one cold, one intermediate and one warmlocation in each participating state of the pooled fund LTC study, as given in Table 2. Eventually,IlliTC will be coupled with the ICM model, so that climatic data from thousands of geographicare available within the model. The data required to generate these libraries are the same as those
Dow
nloa
ded
by [U
nive
rsity
of I
llino
is at
Urb
ana-
Cham
paig
n] a
t 15:
53 1
7 Ju
ne 2
014
62 E.V. Dave et al.
Figure 2. Visual LTC window – asphalt layer material properties.
Table 1. Visual LTC steps.
(1) Read and store user input(2) Extract and store climatic information for user specified analysis period(3) Write input files for preprocessor(4) Run preprocessor(5) Read and convert preprocessor output(6) Write input files for input file generator(7) Run input file generator(8) Run preanalyser(9) Process preanalyser output to identify critical events and generate FE temperature input(10) Run FEA engine(11) Read FEA output(12) Convert crack depth to amount of cracking(13) Display results
used in the AASHTO MEPDG system. Temperature profiles at each location were generated forthe following asphalt concrete thicknesses: 75, 100, 125, 150, 175, 200, 225, 250, 300, 350, and400 mm.
In Visual LTC, the user selects a location that is the most climatically similar to the analysislocation. The user also provides the pavement cross-section. Visual LTC extracts the appropriate
Dow
nloa
ded
by [U
nive
rsity
of I
llino
is at
Urb
ana-
Cham
paig
n] a
t 15:
53 1
7 Ju
ne 2
014
Road Materials and Pavement Design 63
Table 2. Climatic locations available to user in Visual LTC.
State Climate City Air temperature Superpave PG grade
Connecticut Cold Norfolk −29.5◦C −28◦CIntermediate Hartford −26◦C −22◦CWarm New Haven −20.5◦C −22◦C
Illinois Cold Elizabeth −37◦C −34◦CIntermediate Urbana −31.5◦C −28◦CWarm Anna −27◦C −22◦C
Iowa Cold Decorah −40.5◦C −34◦CIntermediate Des Moines −32◦C −28◦CWarm Fort Madison −30.5◦C −28◦C
New York Cold Massena −39◦C −34◦CIntermediate Albany −33.5◦C −28◦CWarm New York −19.5◦C −16◦C
North Dakota Cold Westhrope −44◦C −40◦CIntermediate Bismarck −41.5◦C −40◦CWarm Wahpeton −38◦C −34◦C
Minnesota Cold International Falls −43.5◦C −40◦CIntermediate St Cloud −41.5◦C −34◦CWarm Worthington −34.5◦C −34◦C
Wisconsin Cold Minong −46◦C −40◦CIntermediate Steven’s Point −36.5◦C −34◦CWarm Milwaukee −32◦C −28◦C
Table 3. Summary of pavement material user inputs for IlliTC.
Property Units Test
Tensile strength MPa AASHTO T-322 orextracted from DCT test(Buttlar, Sahu, Behnia,& Dave, 2013)
Fracture energy J/m2 ASTM D7313a
Option – 1 Unit weight g/cm3 AASHTO M323Mixture VMAb % AASHTO M323Aggregate CTECb mm/mm/◦C No standardised test
Option – 2 Mixture CTECc mm/mm/◦C No standardised testCreep compliance test data
(100 or 1000 seconds forthree temperatures)
1/GPa AASHTO T-322
Creep compliance test temperatures ◦C AASHTO T-322
aFracture energy may be obtained with different test geometries; however, the model is calibrated for the ASTM D7313(DCT) test procedure.bMixture voids in mineral aggregate (VMA) and aggregate CTEC do not need to be entered if mixture CTEC is provided.cMixture CTEC will be calculated if mixture VMA and aggregate CTEC are provided.
data from the temperature profiles associated with the location and pavement cross-section. Thesedata are passed to the preanalyser and FE engine where nodal temperatures are computed. Thepavement material property-related user inputs are summarised in Table 3 and discussed below.
Tensile strength of asphalt concrete can be determined using the Superpave IDT, as specifiedin AASHTO T-322. Recently, a procedure was developed to extract mixture tensile strength fromDCT test data, which will be incorporated into IlliTC in the near future. The fracture energy canbe determined using a variety of test geometries, such as DCT, semi-circular bend and single-edge
Dow
nloa
ded
by [U
nive
rsity
of I
llino
is at
Urb
ana-
Cham
paig
n] a
t 15:
53 1
7 Ju
ne 2
014

64 E.V. Dave et al.
notched beam test, although the model has been calibrated and validated based on the DCT testgeometry. Furthermore, the fracture test is expected to be performed at crack mouth openingdisplacement rate of .0167 mm/s and at temperature of 10◦C above the 98% reliability Superpaveperformance grade (PG) low-temperature grade, as dictated by the project location.
The user can either directly input the CTEC or provide asphalt mixture volumetric properties.If volumetric properties are provided, the CTEC is estimated using the approximation equationutilised by the AASHTO MEPDG software. The researchers at the University of Wisconsin haveproposed experimental procedures to measure the CTEC of asphalt mixtures (Marasteanu et al.,2007; Nam & Bahia, 2004, 2009); the use of their procedure is recommended for added accuracyin prediction. The work by the same research group has shown a bilinear trend in the volumetricchanges that occur in asphalt binder and mixes, with significantly different CTEC values aboveand below glass transition temperature. This feature is not currently implemented in the IlliTCsystem; however, it is recognised as one of the tasks for implementation in future versions.
The user can directly enter laboratory measured 100 or 1000 second creep test data fromthree temperatures following the AASHTO T-322 test procedure. These data are passed to thepreprocessor, which converts the data into thermo-viscoelastic material properties in form ofProny series parameters (generalised Maxwell model) and time-temperature shift factors.
3.4. Data storageA simple and intuitive class structure is employed to store and maintain data required for LTCanalysis, i.e. material properties, climatic data, pavement structure, and project information. Thedata should be easily accessible by the user and should not require installation of additionalsoftware. A working directory containing input files stores all of the data necessary for VisualLTC to conduct analysis. Furthermore, the user is not required to directly access the files, as VisualLTC creates and modifies files automatically. The project input file stores general information (i.e.project name, description, date, etc.), climatic information, and the pavement structure. Asphaltconcrete input files store all material properties associated with the mix. A working directory cancontain many project files, thus giving the user the option of creating a new project by modifyingan existing one. Similarly, the working directory can contain as many asphalt concrete input filesas necessary, which creates a library of mix designs for the analyst or designer to investigate.
4. Input generator and preanalyserThe IlliTC prediction system is designed to be practitioner friendly and hence all the necessaryinputs for the FE simulation are generated by the software. The input generator module handles thecreation of FE mesh and corresponding data file with all geometric information and also generatesa material data file in the necessary format for the FEA code. The first task of this module is todevelop a FE mesh for the pavement geometry selected by user. The details on the mesh generationwere previously discussed by Dave, Paulino, and Buttlar (2012). Briefly, the code generates a FEmesh using four node quadrilateral elements (Q4) and it automatically generates a transition meshwith element sizes increasing as the distance from potential thermal crack increases. A single lineof cohesive zone elements are inserted into the mesh. These elements allow for the simulationof a single thermally induced crack that can span across the pavement thickness. The crack issimulated in the transverse direction. The input generator takes the material data provided by theuser as well as the viscoelastic parameters determined by preprocessor and generates the materialdata file (.mtr).
The preanalysis module (or preanalyser) was developed to optimise analysis times of the FEengine. A simplified 1D problem is solved by this module to identify critical events that are
Dow
nloa
ded
by [U
nive
rsity
of I
llino
is at
Urb
ana-
Cham
paig
n] a
t 15:
53 1
7 Ju
ne 2
014

Road Materials and Pavement Design 65
Figure 3. Verification of preanalyser. (a) Comparison of stresses obtained with the preanalyser (VE1D)and the analytical solution and (b) thermal loading.
then analysed by the FEA engine; hence, only critical cooling events are analysed with the fullmodel. The preanalyser module solves the stresses on a restrained 1D viscoelastic body that isimposed with temperature boundary conditions representative of the temperatures at the pavementsurface. The body is assumed to have same properties as the thermo-viscoelastic properties ofasphalt concrete. The 1D viscoelastic solution for thermal stress can be found in Apeagyei, Dave,and Buttlar (2008); this solution is implemented in IlliTC using a recursive-incremental numericalintegration method.
The results from the preanalyser were verified with the analytical solution. The stresses obtainedwith the preanlayser (Viscoelastic 1-D Analyser, VE1D) and the analytical solution for a 1D bodyimposed with thermal loading shown in Figure 3(b) are compared in Figure 3(a). The results showexcellent agreement between the preanalyser results and analytical solution.
The critical cracking events are identified when the thermal stress in the 1D model exceeds80% of the tensile strength of the asphalt mix. The thermal stress from 1D analysis is assumedto represent the stresses on the pavement surface. The threshold of 80% was selected based onprevious experience of researchers in determining the stress threshold corresponding to onset ofdamage. The full analysis with the FE engine is performed for the 24 h surrounding the criticalevent.
Figure 4 shows an example of the results of the preanalyser. The winter time surface temper-atures during the five-year analysis period are shown in Figure 4(a) and the resulting thermalstresses are shown in Figure 4(b). Only the time duration between October 1 and March 31 issimulated, due to significantly greater potential for thermal cracking during these months. Fourcritical events were identified by this analysis; the full FE simulation will be performed on theseevents accordingly.
5. FEA engineThe FEA method is used extensively in everyday design and analysis of civil infrastructure. Thebiggest strengths of FEA are its ability to simulate challenging geometries, such as pavements,and the relative ease in which it is possible to incorporate complicated material behaviour. Forsituations involving these characteristics, analytical solutions would be challenging and oftenunfeasible. The IlliTC system utilises an FE code that was developed in-house for the simulation
Dow
nloa
ded
by [U
nive
rsity
of I
llino
is at
Urb
ana-
Cham
paig
n] a
t 15:
53 1
7 Ju
ne 2
014

66 E.V. Dave et al.
Figure 4. Results from preanalyser. (a) Winter time surface temperatures for five-year analysis period and(b) resulting thermal stresses where four critical events were identified.
of thermo-viscoelastic problems. It has the capability of simulating cracking in asphalt concretethrough the use of a powerful yet computationally efficient cohesive zone fracture model. Tradi-tional modelling approaches have not provided a direct means for the study of crack initiation andpropagation in asphalt materials. The cohesive zone fracture approach provides a rational meansfor modelling cracking in quasi-brittle materials such as asphalt concrete, as the length scale asso-ciated with the fracturing process is accounted for. The following subsections briefly describe thecohesive zone model (CZM) and the thermo-viscoelastic implementation in IlliTC’s FEA engine.This is followed by selected verification examples and brief description of the post-processingmethodology to extract results from the FEA.
5.1. Cohesive zone fracture modelIn order to correctly replicate the complex mechanisms underlying cracking in asphalt concrete,a standard ‘strength of materials’ type analysis is not sufficient, due to: (1) the highly non-linearbehaviour in the vicinity of the crack tip and (2) the importance of the crack in the overall structuralresponse (i.e. the need to model crack as a moving boundary value problem). For simulation ofcrack initiation and propagation, a CZM was selected because of its accuracy and efficiency inaccounting for material response ahead of the crack tip in the fracture process zone (region ofmicro-cracking, crack pining, crack branching, material softening, etc.). Several researchers haveused this type of approach for the simulation of cracking in asphalt materials, for example, Soares,Colares de Freitas, and Allen (2004), Song, Paulino, and Buttlar (2006), Dave and Buttlar (2010),Baek, Ozer, Wang, and Al-Qadi (2010), and Kim, Aragao, Allen, and Little (2010).
The CZM provides the relationship between the displacement jump or the opening along thecrack path and the total capacity of material to transfer traction (or load) across that crack path.In the case of brittle materials, the capacity to carry load across the crack path is either 100%
Dow
nloa
ded
by [U
nive
rsity
of I
llino
is at
Urb
ana-
Cham
paig
n] a
t 15:
53 1
7 Ju
ne 2
014
Road Materials and Pavement Design 67
Trac
tion
(Cap
acity
) acr
oss
crac
k (M
Pa)
Displacement jump across crack (mm)
Tensile strength
Critical displacement
Reloading
Unloading
Area = Fracture Energy
Figure 5. Bi-linear CZM used in IlliTC.
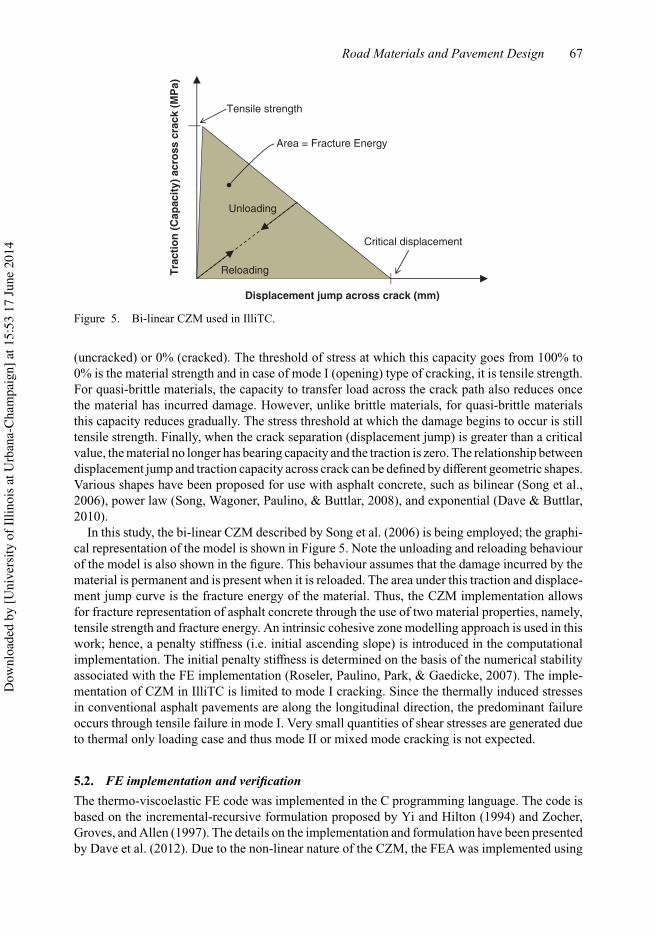
(uncracked) or 0% (cracked). The threshold of stress at which this capacity goes from 100% to0% is the material strength and in case of mode I (opening) type of cracking, it is tensile strength.For quasi-brittle materials, the capacity to transfer load across the crack path also reduces oncethe material has incurred damage. However, unlike brittle materials, for quasi-brittle materialsthis capacity reduces gradually. The stress threshold at which the damage begins to occur is stilltensile strength. Finally, when the crack separation (displacement jump) is greater than a criticalvalue, the material no longer has bearing capacity and the traction is zero. The relationship betweendisplacement jump and traction capacity across crack can be defined by different geometric shapes.Various shapes have been proposed for use with asphalt concrete, such as bilinear (Song et al.,2006), power law (Song, Wagoner, Paulino, & Buttlar, 2008), and exponential (Dave & Buttlar,2010).
In this study, the bi-linear CZM described by Song et al. (2006) is being employed; the graphi-cal representation of the model is shown in Figure 5. Note the unloading and reloading behaviourof the model is also shown in the figure. This behaviour assumes that the damage incurred by thematerial is permanent and is present when it is reloaded. The area under this traction and displace-ment jump curve is the fracture energy of the material. Thus, the CZM implementation allowsfor fracture representation of asphalt concrete through the use of two material properties, namely,tensile strength and fracture energy. An intrinsic cohesive zone modelling approach is used in thiswork; hence, a penalty stiffness (i.e. initial ascending slope) is introduced in the computationalimplementation. The initial penalty stiffness is determined on the basis of the numerical stabilityassociated with the FE implementation (Roseler, Paulino, Park, & Gaedicke, 2007). The imple-mentation of CZM in IlliTC is limited to mode I cracking. Since the thermally induced stressesin conventional asphalt pavements are along the longitudinal direction, the predominant failureoccurs through tensile failure in mode I. Very small quantities of shear stresses are generated dueto thermal only loading case and thus mode II or mixed mode cracking is not expected.
5.2. FE implementation and verificationThe thermo-viscoelastic FE code was implemented in the C programming language. The code isbased on the incremental-recursive formulation proposed by Yi and Hilton (1994) and Zocher,Groves, and Allen (1997). The details on the implementation and formulation have been presentedby Dave et al. (2012). Due to the non-linear nature of the CZM, the FEA was implemented using
Dow
nloa
ded
by [U
nive
rsity
of I
llino
is at
Urb
ana-
Cham
paig
n] a
t 15:
53 1
7 Ju
ne 2
014
68 E.V. Dave et al.
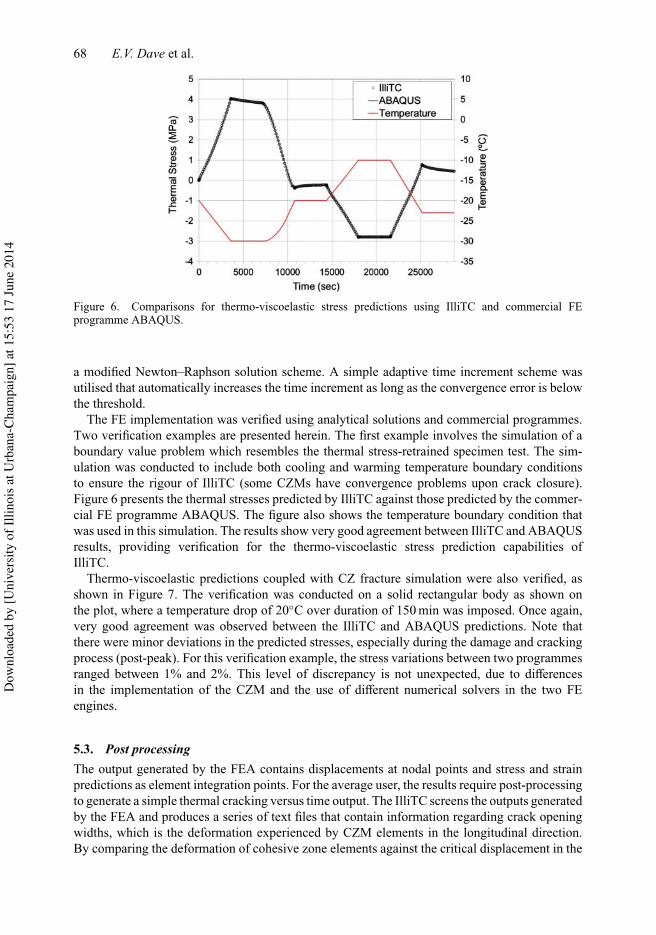
Figure 6. Comparisons for thermo-viscoelastic stress predictions using IlliTC and commercial FEprogramme ABAQUS.
a modified Newton–Raphson solution scheme. A simple adaptive time increment scheme wasutilised that automatically increases the time increment as long as the convergence error is belowthe threshold.
The FE implementation was verified using analytical solutions and commercial programmes.Two verification examples are presented herein. The first example involves the simulation of aboundary value problem which resembles the thermal stress-retrained specimen test. The sim-ulation was conducted to include both cooling and warming temperature boundary conditionsto ensure the rigour of IlliTC (some CZMs have convergence problems upon crack closure).Figure 6 presents the thermal stresses predicted by IlliTC against those predicted by the commer-cial FE programme ABAQUS. The figure also shows the temperature boundary condition thatwas used in this simulation. The results show very good agreement between IlliTC and ABAQUSresults, providing verification for the thermo-viscoelastic stress prediction capabilities ofIlliTC.
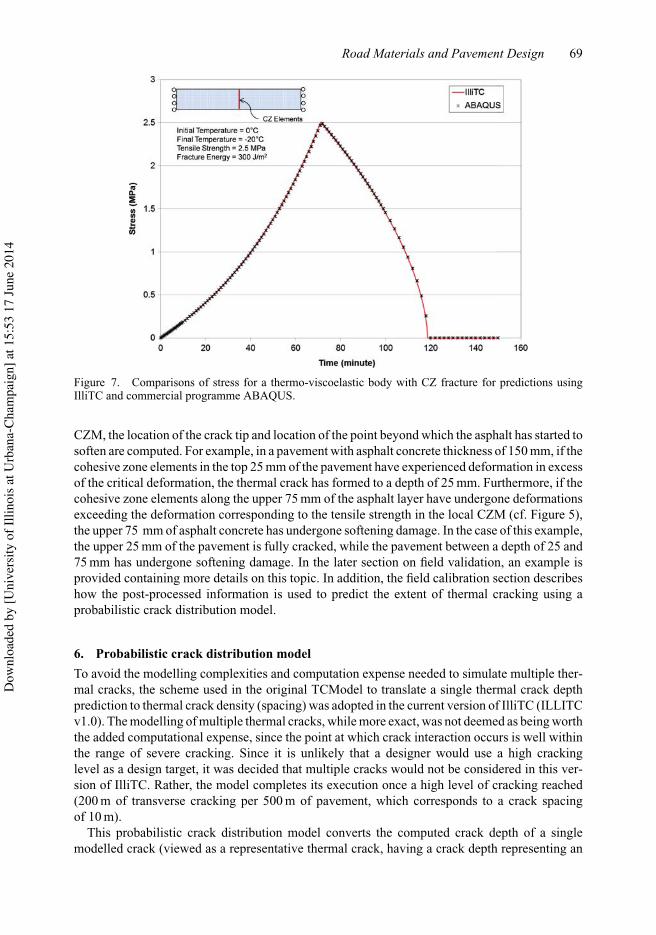
Thermo-viscoelastic predictions coupled with CZ fracture simulation were also verified, asshown in Figure 7. The verification was conducted on a solid rectangular body as shown onthe plot, where a temperature drop of 20◦C over duration of 150 min was imposed. Once again,very good agreement was observed between the IlliTC and ABAQUS predictions. Note thatthere were minor deviations in the predicted stresses, especially during the damage and crackingprocess (post-peak). For this verification example, the stress variations between two programmesranged between 1% and 2%. This level of discrepancy is not unexpected, due to differencesin the implementation of the CZM and the use of different numerical solvers in the two FEengines.
5.3. Post processingThe output generated by the FEA contains displacements at nodal points and stress and strainpredictions as element integration points. For the average user, the results require post-processingto generate a simple thermal cracking versus time output. The IlliTC screens the outputs generatedby the FEA and produces a series of text files that contain information regarding crack openingwidths, which is the deformation experienced by CZM elements in the longitudinal direction.By comparing the deformation of cohesive zone elements against the critical displacement in the
Dow
nloa
ded
by [U
nive
rsity
of I
llino
is at
Urb
ana-
Cham
paig
n] a
t 15:
53 1
7 Ju
ne 2
014
Road Materials and Pavement Design 69
Figure 7. Comparisons of stress for a thermo-viscoelastic body with CZ fracture for predictions usingIlliTC and commercial programme ABAQUS.
CZM, the location of the crack tip and location of the point beyond which the asphalt has started tosoften are computed. For example, in a pavement with asphalt concrete thickness of 150 mm, if thecohesive zone elements in the top 25 mm of the pavement have experienced deformation in excessof the critical deformation, the thermal crack has formed to a depth of 25 mm. Furthermore, if thecohesive zone elements along the upper 75 mm of the asphalt layer have undergone deformationsexceeding the deformation corresponding to the tensile strength in the local CZM (cf. Figure 5),the upper 75 mm of asphalt concrete has undergone softening damage. In the case of this example,the upper 25 mm of the pavement is fully cracked, while the pavement between a depth of 25 and75 mm has undergone softening damage. In the later section on field validation, an example isprovided containing more details on this topic. In addition, the field calibration section describeshow the post-processed information is used to predict the extent of thermal cracking using aprobabilistic crack distribution model.
6. Probabilistic crack distribution modelTo avoid the modelling complexities and computation expense needed to simulate multiple ther-mal cracks, the scheme used in the original TCModel to translate a single thermal crack depthprediction to thermal crack density (spacing) was adopted in the current version of IlliTC (ILLITCv1.0). The modelling of multiple thermal cracks, while more exact, was not deemed as being worththe added computational expense, since the point at which crack interaction occurs is well withinthe range of severe cracking. Since it is unlikely that a designer would use a high crackinglevel as a design target, it was decided that multiple cracks would not be considered in this ver-sion of IlliTC. Rather, the model completes its execution once a high level of cracking reached(200 m of transverse cracking per 500 m of pavement, which corresponds to a crack spacingof 10 m).
This probabilistic crack distribution model converts the computed crack depth of a singlemodelled crack (viewed as a representative thermal crack, having a crack depth representing an
Dow
nloa
ded
by [U
nive
rsity
of I
llino
is at
Urb
ana-
Cham
paig
n] a
t 15:
53 1
7 Ju
ne 2
014

70 E.V. Dave et al.
average crack depth) to an amount of thermal cracking (crack frequency) with the followingexpression:
Cf = β1 × PR(log C > log hac), (1)
Cf = β1 × N!
log C/hac
σ
", (2)
where Cf is the predicted amount of thermal cracking (m/500 m) at a given simulation time, β1 themultiplier representing maximum thermal cracking level, N (x) the standard normal distributionevaluated at x, σ the standard deviation of the log of the depth of cracks in the pavement, C thedepth of crack predicted by IlliTC at a given simulation time and hac the thickness of asphalt layerbeing simulated (generally taken as the thickness of all asphalt layers).
Crack amount (m/500 m) can be converted to thermal crack spacing by dividing predicted crackamount, Cf , by lane width (typically assumed to be 4 m), and taking the inverse of this quotientand multiplying by the unit section length (500 m). Citing the example provided earlier in thissection, a crack amount of 200 m corresponds to: (1/(200/4))∗500 or 10 m. This corresponds to1000/10 or 100 full-lane-width cracks per km, which corresponds to approximately 161 thermalcracks per mile. This corresponds to the maximum thermal cracking level predicted by IlliTCin the current version. Note, similar to the approach taken in the development of TCModel, theparameters β1 and σ were taken as model calibration parameters. Since thermal cracks are difficultto detect until they propagate completely through the pavement, it would be extremely difficult todirectly measure and assess the σ parameter. Thus, its selection as a model calibration parameteris a practical means to circumvent the need to directly measure σ .
7. Field calibrationThe MnROAD full-scale pavement test sections were used to calibrate IlliTC, namely, sections03, 19, 33, and 34. Details about these sections can be found elsewhere (Marasteanu et al., 2007).A decision needed to be made with regards to the climatic files used in model calibration, sincetwo approaches were possible: (1) use the actual time ranges corresponding to the field thermalcracking data for each section simulated or (2) use the climatic files available in IlliTC. Theargument for using the actual time ranges that correspond with the field data is that predictedcritical cooling events would match actual critical events in the crack history data files, leadingto more accurate thermal cracking predictions for model calibration. The argument for usingthe climatic files included in IlliTC is that future pavement simulations conducted using IlliTCwould be expected to utilise these climatic files (unless the user takes the effort to modify IlliTCto utilise alternate climatic files, which is a cumbersome process in the current version of thesoftware). Considering that most users will likely utilise the climatic files provided in IlliTC, andalso considering that the model should be re-calibrated to local conditions rather than rely on thecalibration provided herein, it was decided to conduct model calibration using the climatic filesprovided in the current version of IlliTC.
The subsequent subsections present the results from preanalyser and the FEA engine for each ofthe calibration section. This is followed by the brief description on actual calibration of parametersin the probabilistic crack distribution model.
7.1. Preanalyser runsSelected outputs from IlliTC’s preanalyser are provided in Figure 8(a)–(e), and summarisedin Table 4. By comparing Figure 8(a) with 8(b)–(e), it is clear that the days with the coldest
Dow
nloa
ded
by [U
nive
rsity
of I
llino
is at
Urb
ana-
Cham
paig
n] a
t 15:
53 1
7 Ju
ne 2
014
Road Materials and Pavement Design 71
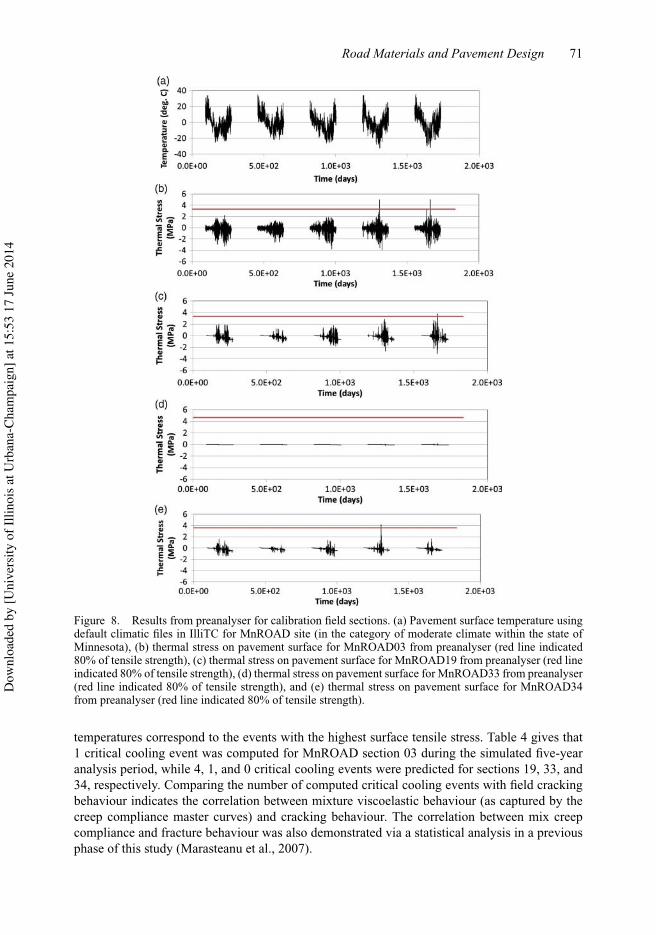
Figure 8. Results from preanalyser for calibration field sections. (a) Pavement surface temperature usingdefault climatic files in IlliTC for MnROAD site (in the category of moderate climate within the state ofMinnesota), (b) thermal stress on pavement surface for MnROAD03 from preanalyser (red line indicated80% of tensile strength), (c) thermal stress on pavement surface for MnROAD19 from preanalyser (red lineindicated 80% of tensile strength), (d) thermal stress on pavement surface for MnROAD33 from preanalyser(red line indicated 80% of tensile strength), and (e) thermal stress on pavement surface for MnROAD34from preanalyser (red line indicated 80% of tensile strength).
temperatures correspond to the events with the highest surface tensile stress. Table 4 gives that1 critical cooling event was computed for MnROAD section 03 during the simulated five-yearanalysis period, while 4, 1, and 0 critical cooling events were predicted for sections 19, 33, and34, respectively. Comparing the number of computed critical cooling events with field crackingbehaviour indicates the correlation between mixture viscoelastic behaviour (as captured by thecreep compliance master curves) and cracking behaviour. The correlation between mix creepcompliance and fracture behaviour was also demonstrated via a statistical analysis in a previousphase of this study (Marasteanu et al., 2007).
Dow
nloa
ded
by [U
nive
rsity
of I
llino
is at
Urb
ana-
Cham
paig
n] a
t 15:
53 1
7 Ju
ne 2
014

72 E.V. Dave et al.
Table 4. Preanalyser results (number of critical events) compared with field cracking.
Number of criticalMnROAD events (as predicted Field crackingcell by preanalyser) Binder grade (m/500 m)
03 1 PEN 120/150 (PG 58-28) 18219 4 AC20 (PG 64-22) 54733 1 PG 58-28 9134 0 PG 58-34 6
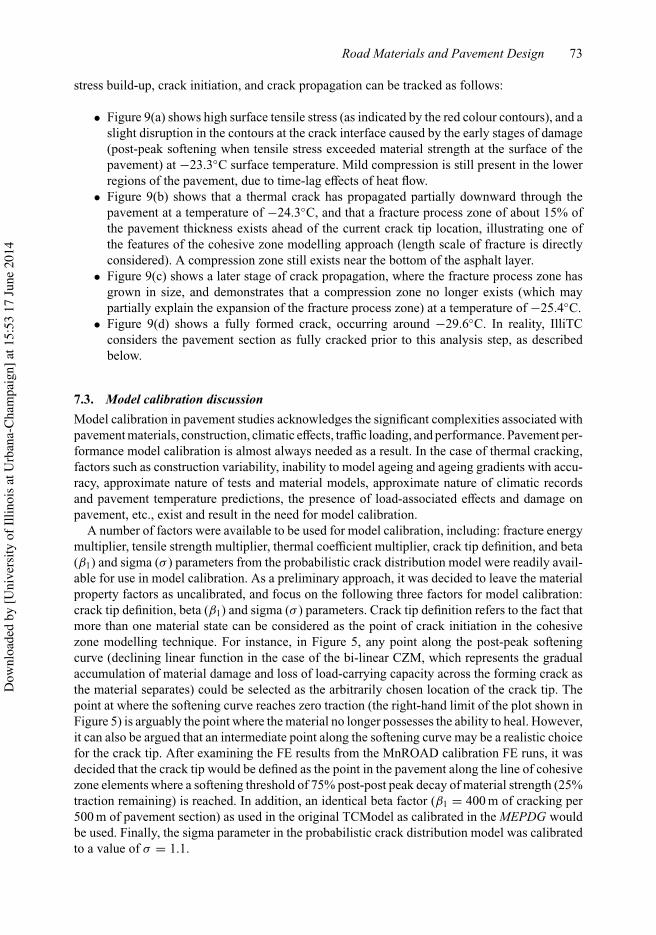
Figure 9. Results from FEA for MnROAD section 19 (calibration field section) (tensile strength =4.22 MPa). (a) Thermal stress built-up along longitudinal direction (surface temperature = −23.3◦C),(b) partial depth softening damage (surface temperature = −24.3◦C), (c) partial depth crack (surfacetemperature = −25.4◦C), and (d) fully formed crack (surface temperature = −29.6◦C).
7.2. FE runsSample FE modelling results from the calibration phase of the study for MnROAD section 19are provided in Figure 9(a)–(d). The various aspects of the cohesive zone-based FE modellingapproach can be seen in these stresses and (exaggerated) deformed structure plots, which showthe elevation view of the asphalt layers in the vicinity of the modelled crack. The progression of
Dow
nloa
ded
by [U
nive
rsity
of I
llino
is at
Urb
ana-
Cham
paig
n] a
t 15:
53 1
7 Ju
ne 2
014
Road Materials and Pavement Design 73
stress build-up, crack initiation, and crack propagation can be tracked as follows:
• Figure 9(a) shows high surface tensile stress (as indicated by the red colour contours), and aslight disruption in the contours at the crack interface caused by the early stages of damage(post-peak softening when tensile stress exceeded material strength at the surface of thepavement) at −23.3◦C surface temperature. Mild compression is still present in the lowerregions of the pavement, due to time-lag effects of heat flow.
• Figure 9(b) shows that a thermal crack has propagated partially downward through thepavement at a temperature of −24.3◦C, and that a fracture process zone of about 15% ofthe pavement thickness exists ahead of the current crack tip location, illustrating one ofthe features of the cohesive zone modelling approach (length scale of fracture is directlyconsidered). A compression zone still exists near the bottom of the asphalt layer.
• Figure 9(c) shows a later stage of crack propagation, where the fracture process zone hasgrown in size, and demonstrates that a compression zone no longer exists (which maypartially explain the expansion of the fracture process zone) at a temperature of −25.4◦C.
• Figure 9(d) shows a fully formed crack, occurring around −29.6◦C. In reality, IlliTCconsiders the pavement section as fully cracked prior to this analysis step, as describedbelow.
7.3. Model calibration discussionModel calibration in pavement studies acknowledges the significant complexities associated withpavement materials, construction, climatic effects, traffic loading, and performance. Pavement per-formance model calibration is almost always needed as a result. In the case of thermal cracking,factors such as construction variability, inability to model ageing and ageing gradients with accu-racy, approximate nature of tests and material models, approximate nature of climatic recordsand pavement temperature predictions, the presence of load-associated effects and damage onpavement, etc., exist and result in the need for model calibration.
A number of factors were available to be used for model calibration, including: fracture energymultiplier, tensile strength multiplier, thermal coefficient multiplier, crack tip definition, and beta(β1) and sigma (σ ) parameters from the probabilistic crack distribution model were readily avail-able for use in model calibration. As a preliminary approach, it was decided to leave the materialproperty factors as uncalibrated, and focus on the following three factors for model calibration:crack tip definition, beta (β1) and sigma (σ ) parameters. Crack tip definition refers to the fact thatmore than one material state can be considered as the point of crack initiation in the cohesivezone modelling technique. For instance, in Figure 5, any point along the post-peak softeningcurve (declining linear function in the case of the bi-linear CZM, which represents the gradualaccumulation of material damage and loss of load-carrying capacity across the forming crack asthe material separates) could be selected as the arbitrarily chosen location of the crack tip. Thepoint at where the softening curve reaches zero traction (the right-hand limit of the plot shown inFigure 5) is arguably the point where the material no longer possesses the ability to heal. However,it can also be argued that an intermediate point along the softening curve may be a realistic choicefor the crack tip. After examining the FE results from the MnROAD calibration FE runs, it wasdecided that the crack tip would be defined as the point in the pavement along the line of cohesivezone elements where a softening threshold of 75% post-post peak decay of material strength (25%traction remaining) is reached. In addition, an identical beta factor (β1 = 400 m of cracking per500 m of pavement section) as used in the original TCModel as calibrated in the MEPDG wouldbe used. Finally, the sigma parameter in the probabilistic crack distribution model was calibratedto a value of σ = 1.1.
Dow
nloa
ded
by [U
nive
rsity
of I
llino
is at
Urb
ana-
Cham
paig
n] a
t 15:
53 1
7 Ju
ne 2
014

74 E.V. Dave et al.
Table 5. IlliTC model calibration results.
Measured field Predicted field crackinga
MnROAD cell Binder grade cracking (m/500 m) (m/500 m)
03 PEN 120/150 (PG 58-28) 182 019 AC20 (PG 64-22) >200 (547) >200
(max. allowable cracking)33 PG 58-28 91 9434 PG 58-34 6 0
aPredictions are made using non-synchronised climate files.
The results of the calibrated IlliTC model, using MnROAD pavement sections, are presented inTable 5. As can be seen, reasonable modelling predictions were achieved for three out of the foursections evaluated. For instance, MnROAD section 19, which experienced very high pavementcracking due to the use of an AC-20 binder (PG 64-22) in a PG XX-34 climate was predicted tohave a maximum level of cracking. Recall that when the maximum predicted crack depth is reached(crack depth = thickness of pavement), this implies that the average crack is equal to the pavementthickness. Thus, half of other pavement cracks will be less than the thickness of the pavement and,therefore, not yet counted as thermal cracks. Stated otherwise, the probabilistic crack distributionmodel has a maximum cracking level of 200 m of cracking per 500 m section, when = 400.MnROAD section 33 was found to have a cracking level of 94 m of cracking, as compared with ameasured level of 91 m (this was the section that drove the calibration of = 1.1), and MnROADsection 34 was found to have a cracking amount of 0 m as compared with a measured cracking levelof 6 m. The only poor prediction that resulted was for MnROAD section 03, where zero crackingwas predicted as compared with 182 m of measured cracking. It should be noted, however, thatIlliTC did indicate that softening damage had begun to occur in this section (although not enoughto reach the 75% softened threshold). It is also acknowledged that the time period for the IlliTCsimulation was shorter than the period of field performance reported for section 03. In addition,the master curve data used in the calibration were less-than-optimal, with data from only two testtemperatures being available (three is preferred). Rather than add additional calibration factorsto IlliTC, it was decided that the aforementioned calibration parameters were sufficient for thecalibration of IlliTC. However, it is recommended that IlliTC be recalibrated to local conditionsto arrive at better model accuracy. Model validation using an independent data set is provided inthe next section of the article.
8. Field validationFive pavement sections were constructed in Olmsted County, Minnesota, during the 2006 con-struction season, which were used for the analysis portion of the validation process. The mixeswere sampled during the construction process and were characterised extensively in the lab.Detailed information about the pavement sections and mixture properties obtained experimen-tally is documented elsewhere (Marasteanu et al., 2012). The five Olmstead Co. pavement sectionswere simulated using IlliTC, and the results from the preanalyser and FEA are briefly presentedin the following section.
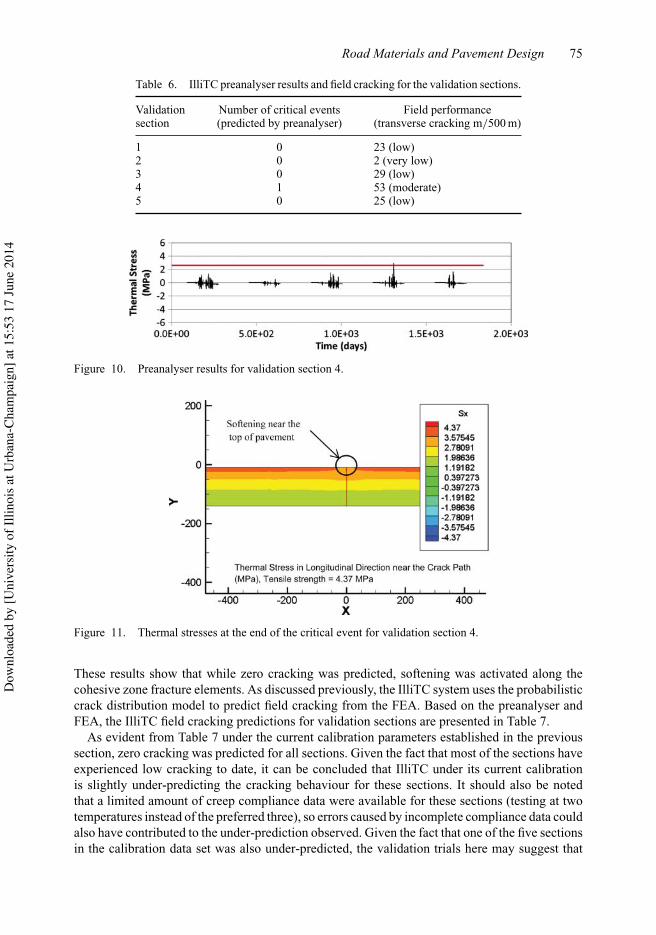
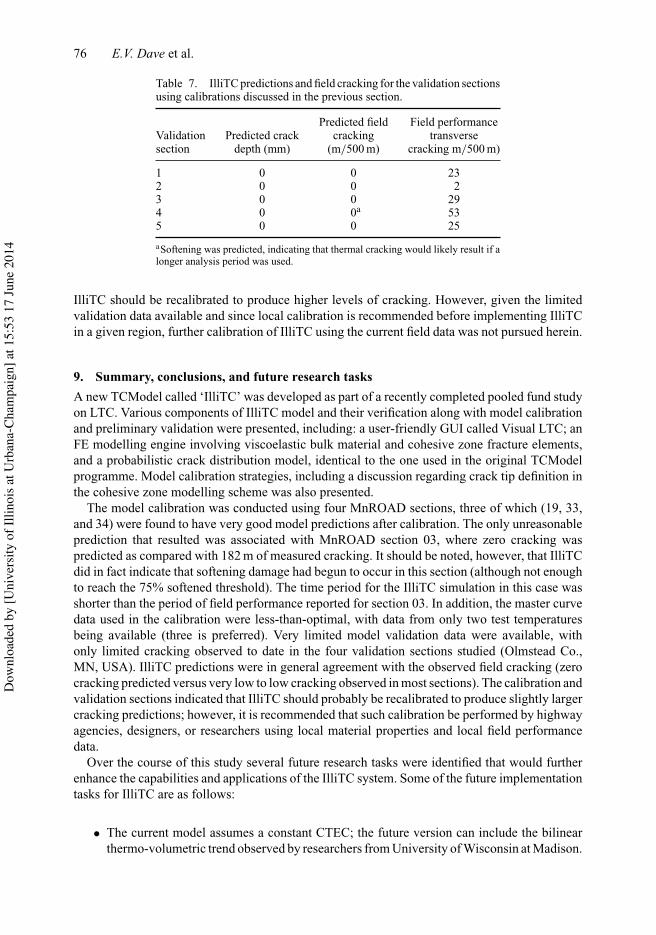
Table 6 presents the results from the IlliTC preanalyser routine. As can be seen, only section 4experienced a critical tensile stress level in the five years analysed. The preanalyser thermalstresses for this section are presented in Figure 10. Since this was the worst section in terms offield cracking, this indicates that the IlliTC programme has correctly ranked the five field sections.
Based on the preanalyser results, the validation section 4 was selected for detailed presentationherein. The thermal stresses and damage predicted by IlliTC for section 4 is presented in Figure 11.
Dow
nloa
ded
by [U
nive
rsity
of I
llino
is at
Urb
ana-
Cham
paig
n] a
t 15:
53 1
7 Ju
ne 2
014
Road Materials and Pavement Design 75
Table 6. IlliTC preanalyser results and field cracking for the validation sections.
Validation Number of critical events Field performancesection (predicted by preanalyser) (transverse cracking m/500 m)
1 0 23 (low)2 0 2 (very low)3 0 29 (low)4 1 53 (moderate)5 0 25 (low)
Figure 10. Preanalyser results for validation section 4.
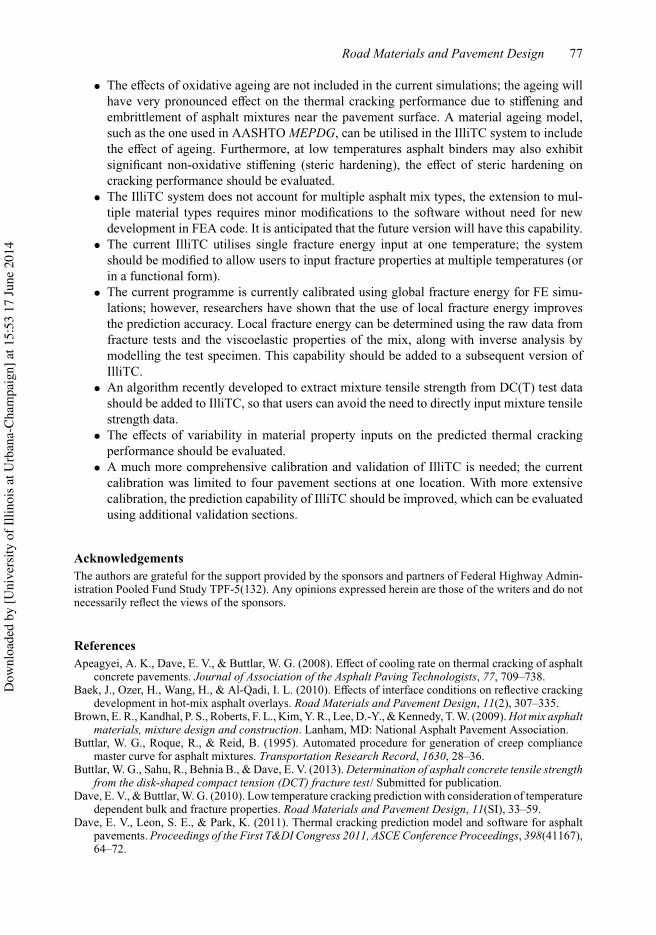
Figure 11. Thermal stresses at the end of the critical event for validation section 4.
These results show that while zero cracking was predicted, softening was activated along thecohesive zone fracture elements. As discussed previously, the IlliTC system uses the probabilisticcrack distribution model to predict field cracking from the FEA. Based on the preanalyser andFEA, the IlliTC field cracking predictions for validation sections are presented in Table 7.
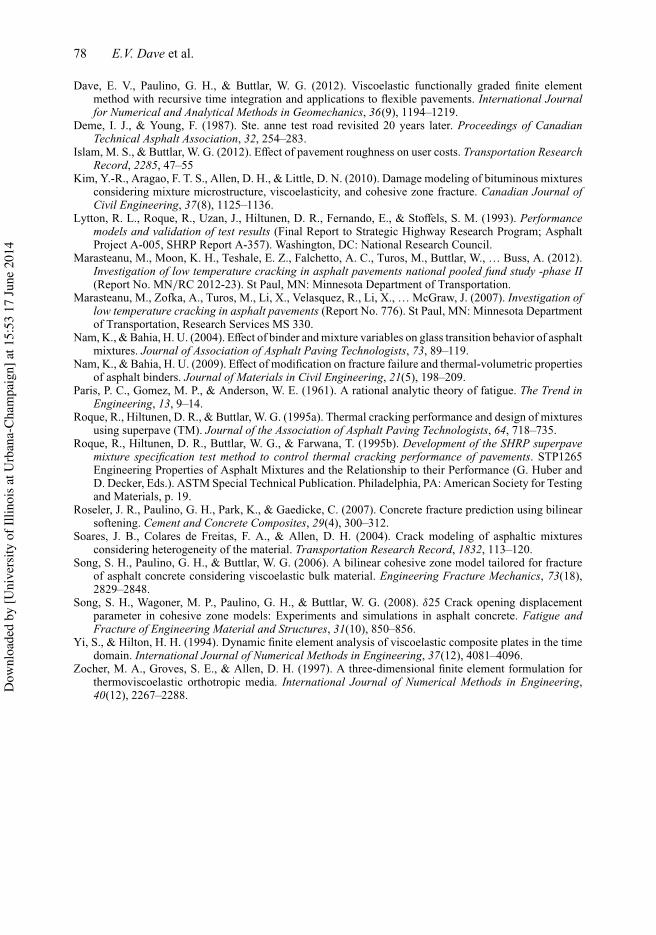
As evident from Table 7 under the current calibration parameters established in the previoussection, zero cracking was predicted for all sections. Given the fact that most of the sections haveexperienced low cracking to date, it can be concluded that IlliTC under its current calibrationis slightly under-predicting the cracking behaviour for these sections. It should also be notedthat a limited amount of creep compliance data were available for these sections (testing at twotemperatures instead of the preferred three), so errors caused by incomplete compliance data couldalso have contributed to the under-prediction observed. Given the fact that one of the five sectionsin the calibration data set was also under-predicted, the validation trials here may suggest that
Dow
nloa
ded
by [U
nive
rsity
of I
llino
is at
Urb
ana-
Cham
paig
n] a
t 15:
53 1
7 Ju
ne 2
014
76 E.V. Dave et al.
Table 7. IlliTC predictions and field cracking for the validation sectionsusing calibrations discussed in the previous section.
Predicted field Field performanceValidation Predicted crack cracking transversesection depth (mm) (m/500 m) cracking m/500 m)
1 0 0 232 0 0 23 0 0 294 0 0a 535 0 0 25
aSoftening was predicted, indicating that thermal cracking would likely result if alonger analysis period was used.
IlliTC should be recalibrated to produce higher levels of cracking. However, given the limitedvalidation data available and since local calibration is recommended before implementing IlliTCin a given region, further calibration of IlliTC using the current field data was not pursued herein.
9. Summary, conclusions, and future research tasksA new TCModel called ‘IlliTC’ was developed as part of a recently completed pooled fund studyon LTC. Various components of IlliTC model and their verification along with model calibrationand preliminary validation were presented, including: a user-friendly GUI called Visual LTC; anFE modelling engine involving viscoelastic bulk material and cohesive zone fracture elements,and a probabilistic crack distribution model, identical to the one used in the original TCModelprogramme. Model calibration strategies, including a discussion regarding crack tip definition inthe cohesive zone modelling scheme was also presented.
The model calibration was conducted using four MnROAD sections, three of which (19, 33,and 34) were found to have very good model predictions after calibration. The only unreasonableprediction that resulted was associated with MnROAD section 03, where zero cracking waspredicted as compared with 182 m of measured cracking. It should be noted, however, that IlliTCdid in fact indicate that softening damage had begun to occur in this section (although not enoughto reach the 75% softened threshold). The time period for the IlliTC simulation in this case wasshorter than the period of field performance reported for section 03. In addition, the master curvedata used in the calibration were less-than-optimal, with data from only two test temperaturesbeing available (three is preferred). Very limited model validation data were available, withonly limited cracking observed to date in the four validation sections studied (Olmstead Co.,MN, USA). IlliTC predictions were in general agreement with the observed field cracking (zerocracking predicted versus very low to low cracking observed in most sections). The calibration andvalidation sections indicated that IlliTC should probably be recalibrated to produce slightly largercracking predictions; however, it is recommended that such calibration be performed by highwayagencies, designers, or researchers using local material properties and local field performancedata.
Over the course of this study several future research tasks were identified that would furtherenhance the capabilities and applications of the IlliTC system. Some of the future implementationtasks for IlliTC are as follows:
• The current model assumes a constant CTEC; the future version can include the bilinearthermo-volumetric trend observed by researchers from University of Wisconsin at Madison.
Dow
nloa
ded
by [U
nive
rsity
of I
llino
is at
Urb
ana-
Cham
paig
n] a
t 15:
53 1
7 Ju
ne 2
014
Road Materials and Pavement Design 77
• The effects of oxidative ageing are not included in the current simulations; the ageing willhave very pronounced effect on the thermal cracking performance due to stiffening andembrittlement of asphalt mixtures near the pavement surface. A material ageing model,such as the one used in AASHTO MEPDG, can be utilised in the IlliTC system to includethe effect of ageing. Furthermore, at low temperatures asphalt binders may also exhibitsignificant non-oxidative stiffening (steric hardening), the effect of steric hardening oncracking performance should be evaluated.
• The IlliTC system does not account for multiple asphalt mix types, the extension to mul-tiple material types requires minor modifications to the software without need for newdevelopment in FEA code. It is anticipated that the future version will have this capability.
• The current IlliTC utilises single fracture energy input at one temperature; the systemshould be modified to allow users to input fracture properties at multiple temperatures (orin a functional form).
• The current programme is currently calibrated using global fracture energy for FE simu-lations; however, researchers have shown that the use of local fracture energy improvesthe prediction accuracy. Local fracture energy can be determined using the raw data fromfracture tests and the viscoelastic properties of the mix, along with inverse analysis bymodelling the test specimen. This capability should be added to a subsequent version ofIlliTC.
• An algorithm recently developed to extract mixture tensile strength from DC(T) test datashould be added to IlliTC, so that users can avoid the need to directly input mixture tensilestrength data.
• The effects of variability in material property inputs on the predicted thermal crackingperformance should be evaluated.
• A much more comprehensive calibration and validation of IlliTC is needed; the currentcalibration was limited to four pavement sections at one location. With more extensivecalibration, the prediction capability of IlliTC should be improved, which can be evaluatedusing additional validation sections.
AcknowledgementsThe authors are grateful for the support provided by the sponsors and partners of Federal Highway Admin-istration Pooled Fund Study TPF-5(132). Any opinions expressed herein are those of the writers and do notnecessarily reflect the views of the sponsors.
ReferencesApeagyei, A. K., Dave, E. V., & Buttlar, W. G. (2008). Effect of cooling rate on thermal cracking of asphalt
concrete pavements. Journal of Association of the Asphalt Paving Technologists, 77, 709–738.Baek, J., Ozer, H., Wang, H., & Al-Qadi, I. L. (2010). Effects of interface conditions on reflective cracking
development in hot-mix asphalt overlays. Road Materials and Pavement Design, 11(2), 307–335.Brown, E. R., Kandhal, P. S., Roberts, F. L., Kim, Y. R., Lee, D.-Y., & Kennedy, T. W. (2009). Hot mix asphalt
materials, mixture design and construction. Lanham, MD: National Asphalt Pavement Association.Buttlar, W. G., Roque, R., & Reid, B. (1995). Automated procedure for generation of creep compliance
master curve for asphalt mixtures. Transportation Research Record, 1630, 28–36.Buttlar, W. G., Sahu, R., Behnia B., & Dave, E. V. (2013). Determination of asphalt concrete tensile strength
from the disk-shaped compact tension (DCT) fracture test/ Submitted for publication.Dave, E. V., & Buttlar, W. G. (2010). Low temperature cracking prediction with consideration of temperature
dependent bulk and fracture properties. Road Materials and Pavement Design, 11(SI), 33–59.Dave, E. V., Leon, S. E., & Park, K. (2011). Thermal cracking prediction model and software for asphalt
pavements. Proceedings of the First T&DI Congress 2011, ASCE Conference Proceedings, 398(41167),64–72.
Dow
nloa
ded
by [U
nive
rsity
of I
llino
is at
Urb
ana-
Cham
paig
n] a
t 15:
53 1
7 Ju
ne 2
014
78 E.V. Dave et al.
Dave, E. V., Paulino, G. H., & Buttlar, W. G. (2012). Viscoelastic functionally graded finite elementmethod with recursive time integration and applications to flexible pavements. International Journalfor Numerical and Analytical Methods in Geomechanics, 36(9), 1194–1219.
Deme, I. J., & Young, F. (1987). Ste. anne test road revisited 20 years later. Proceedings of CanadianTechnical Asphalt Association, 32, 254–283.
Islam, M. S., & Buttlar, W. G. (2012). Effect of pavement roughness on user costs. Transportation ResearchRecord, 2285, 47–55
Kim, Y.-R., Aragao, F. T. S., Allen, D. H., & Little, D. N. (2010). Damage modeling of bituminous mixturesconsidering mixture microstructure, viscoelasticity, and cohesive zone fracture. Canadian Journal ofCivil Engineering, 37(8), 1125–1136.
Lytton, R. L., Roque, R., Uzan, J., Hiltunen, D. R., Fernando, E., & Stoffels, S. M. (1993). Performancemodels and validation of test results (Final Report to Strategic Highway Research Program; AsphaltProject A-005, SHRP Report A-357). Washington, DC: National Research Council.
Marasteanu, M., Moon, K. H., Teshale, E. Z., Falchetto, A. C., Turos, M., Buttlar, W., … Buss, A. (2012).Investigation of low temperature cracking in asphalt pavements national pooled fund study -phase II(Report No. MN/RC 2012-23). St Paul, MN: Minnesota Department of Transportation.
Marasteanu, M., Zofka, A., Turos, M., Li, X., Velasquez, R., Li, X., … McGraw, J. (2007). Investigation oflow temperature cracking in asphalt pavements (Report No. 776). St Paul, MN: Minnesota Departmentof Transportation, Research Services MS 330.
Nam, K., & Bahia, H. U. (2004). Effect of binder and mixture variables on glass transition behavior of asphaltmixtures. Journal of Association of Asphalt Paving Technologists, 73, 89–119.
Nam, K., & Bahia, H. U. (2009). Effect of modification on fracture failure and thermal-volumetric propertiesof asphalt binders. Journal of Materials in Civil Engineering, 21(5), 198–209.
Paris, P. C., Gomez, M. P., & Anderson, W. E. (1961). A rational analytic theory of fatigue. The Trend inEngineering, 13, 9–14.
Roque, R., Hiltunen, D. R., & Buttlar, W. G. (1995a). Thermal cracking performance and design of mixturesusing superpave (TM). Journal of the Association of Asphalt Paving Technologists, 64, 718–735.
Roque, R., Hiltunen, D. R., Buttlar, W. G., & Farwana, T. (1995b). Development of the SHRP superpavemixture specification test method to control thermal cracking performance of pavements. STP1265Engineering Properties of Asphalt Mixtures and the Relationship to their Performance (G. Huber andD. Decker, Eds.). ASTM Special Technical Publication. Philadelphia, PA: American Society for Testingand Materials, p. 19.
Roseler, J. R., Paulino, G. H., Park, K., & Gaedicke, C. (2007). Concrete fracture prediction using bilinearsoftening. Cement and Concrete Composites, 29(4), 300–312.
Soares, J. B., Colares de Freitas, F. A., & Allen, D. H. (2004). Crack modeling of asphaltic mixturesconsidering heterogeneity of the material. Transportation Research Record, 1832, 113–120.
Song, S. H., Paulino, G. H., & Buttlar, W. G. (2006). A bilinear cohesive zone model tailored for fractureof asphalt concrete considering viscoelastic bulk material. Engineering Fracture Mechanics, 73(18),2829–2848.
Song, S. H., Wagoner, M. P., Paulino, G. H., & Buttlar, W. G. (2008). δ25 Crack opening displacementparameter in cohesive zone models: Experiments and simulations in asphalt concrete. Fatigue andFracture of Engineering Material and Structures, 31(10), 850–856.
Yi, S., & Hilton, H. H. (1994). Dynamic finite element analysis of viscoelastic composite plates in the timedomain. International Journal of Numerical Methods in Engineering, 37(12), 4081–4096.
Zocher, M. A., Groves, S. E., & Allen, D. H. (1997). A three-dimensional finite element formulation forthermoviscoelastic orthotropic media. International Journal of Numerical Methods in Engineering,40(12), 2267–2288.D
ownl
oade
d by
[Uni
vers
ity o
f Illi
nois
at U
rban
a-Ch
ampa
ign]
at 1
5:53
17
June
201
4