Embed Size (px)
Citation preview

Figure 13: Location of the Waukegan River Project in the Waukegan River Watershed of Lake County, Illinois
Illinois
Waukegan River Section 319
National Monitoring Program Project
98
Waukegan River, Illinois
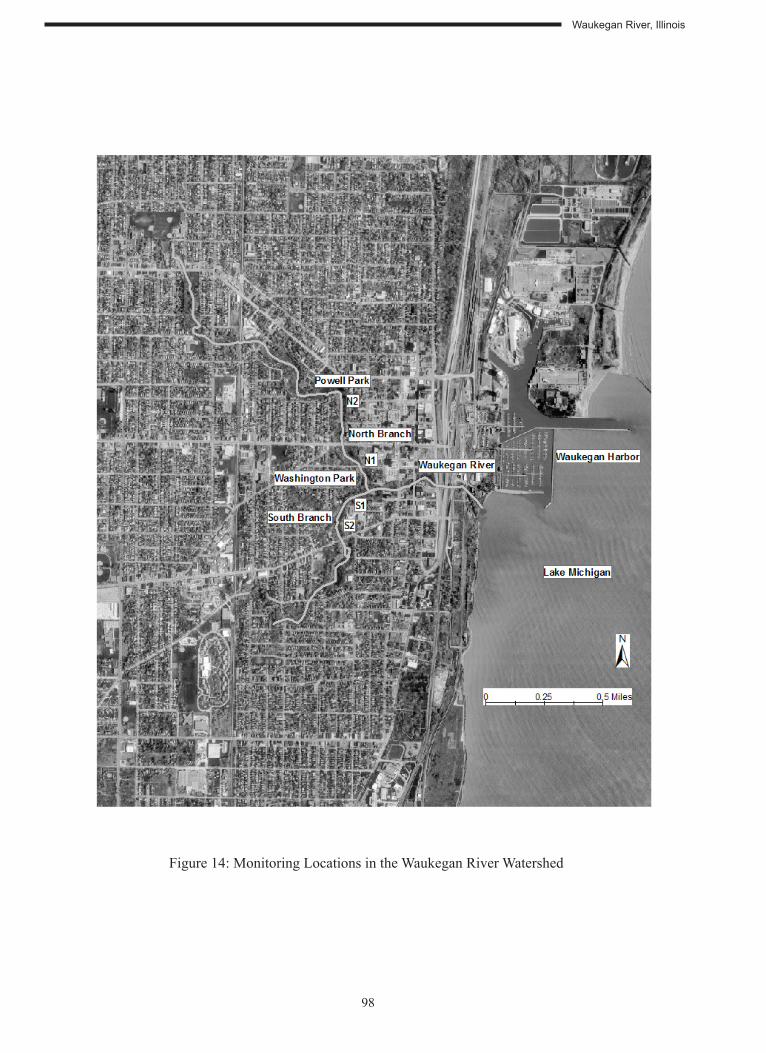
Figure 14: Monitoring Locations in the Waukegan River Watershed
Waukegan River, Illinois
99
PROJECT OVERVIEW
The Waukegan River watershed is located about 35 miles north of Chicago (Figure 1). The project locations for the Waukegan River Section 319 National Monitoring Program project are located in Washington and Powell Parks in the City of Waukegan, Illinois (Figure 2). The watershed is 12.5 miles long and contains 7,397 acres, with major land uses consisting of single and multi-family dwellings (35.0 %), transportation (24.4 %), public and private open space (11.8 %) (Table 1). Washington Park is situated in an area that represents the most urbanized reach of the river and is located at the confluence of the North Branch and the South Branch about 1/2 mile upstream from the river mouth on Lake Michigan. Powell Park is located on the North Branch 1 mile from the river mouth and within a residential area. Most of the watershed was urbanized prior to any requirements for stormwater detention. Therefore, there is little control over stormwater quantity or quality, result-ing in flashy runoff rates and heavy stormwater pollutant loads. Water quality concerns also include cross-connections between sanitary and storm sewers, potential sanitary sewer overflows during wet weather, severe streambank erosion, channel downcutting, and artificial lining.
Erosion control methods used to repair the eroding stream channels included vegetative stabilization (dogwoods, willows, and grasses) combined with structural stabilization (Lunkers, fiber rolls, A-jacks, and stone). A series of pool-and-riffle complexes were created by constructing six rock grade control structures (Newbury Weirs) from granite boulders in a reach covering 1000 feet of the South Branch starting at the confluence and two structures in a reach covering 300 feet of the North Branch in Washington Park.
The Waukegan River Section 319 National Monitoring Program project is being used to demonstrate the effectiveness of stream restoration techniques implemented on the Waukegan River. The stream habitat and urban fisheries were surveyed before implementation of the stream restoration techniques. The in-stream habitat and stream fisheries were also surveyed to provide post-implementation data. The monitoring strategy included macroinvertebrate sampling, physical habitat monitoring, and fish-eries monitoring during the spring, summer, and fall cycles of the project period.
This project has demonstrated that biotechnical streambank stabilization techniques are more cost-effective than traditional armoring approaches in reducing erosion and also provide additional water quality and in-stream habitat benefits. It has been shown that rock grade control structures (Newbury Weirs) that mimic natural pool and riffles add to the in-stream physical diversity which in turn leads to increased biodiversity. In addition to enhancing habitat, pool and riffle structures are effective in reducing erosion of the streambed, improving stream stability and increasing water aeration. Cur-rently, the project is in the post-BMP monitoring phase, with monitoring completed in October 2006. Data analysis and Final Report preparation activities have begun. The Final Report is expected to be completed on or before June 2009.
PROJECT BACKGROUND
Project Area
The project area consists of four stations located within two city parks of Waukegan, IL (Figure 2). Stations located in Washington Park are S1 and S2 on the South Branch of the Waukegan River and station N1 on the North Branch. Station N2 is located in Powell Park on the North Branch. The parks are situated within an older, highly urbanized area of the city.
Relevant Hydrologic, Geologic, and Meteorological Factors
The Waukegan River falls from 730 msl to 580 msl, with the steepest lands located in Washington
100
Waukegan River, Illinois
and Powell Parks. Information from the Midwestern Regional Climate Center indicates that the Waukegan River watershed has a mean annual of 32.82 inches of precipitation.
Land Use
The 7,397 acre watershed of the Waukegan River is largely urbanized, with over 80% of the City of Waukegan lying within the watershed boundaries. As of the 2000 census there were 87,901 people living in Waukegan with a population density of 1,475.0/km2 (3,819.8/mi2). Because this is an older town, there are very few stormwater detention basins.
Table 1: Land Use of the Waukegan River Watershed
Land Use Acres % Agricultural 6.9 0.1Disturbed Land 139.1 1.9Forest and Grassland 495.9 6.7Government and Institutional 449.0 6.0Industrial 204.3 2.8Multi-Family 169.8 2.3Office 1.2 0.0Public and Private Open Space 872.8 11.8Retail/Commercial 482.1 6.5Single Family 2416.8 32.7Transportation 1801.9 24.4Utility and Waste Facilities 161.6 2.2Water 28.3 0.4Wetlands 167.1 2.2TOTAL 7396.8 100 Source: Lake County Planning, Building and Development, 2000, (Waukegan River Watershed Plan, 2007).
Water Resource Type and Size
The Waukegan River Section 319 National Monitoring Program project is located in the northeastern corner of Illinois (Figure 1). The length of the Waukegan River/Ravine main channel and tributaries, which drain predominantly urban areas in Waukegan, IL, is approximately 12.5 miles. Discharge of the Waukegan River is into Lake Michigan, just east of the downtown area and only 6,000 feet from the City’s fresh water intake.
Water Uses and Impairments
As an urban stream, stormwater has caused severe channel erosion. The primary pollutant of con-cern is sediment. Severe bank erosion, due to unstable stream channels and high velocity runoff, is increasing nonpoint source pollution loads into Lake Michigan, breaking smaller sewer lines that were buried in the stream and endangering other sewer lines. In addition to the physical destruction, aquatic habitat has been impaired due to the lack of water depth in pools, limited cobble substrates, and limited stream aeration.
Waukegan River, Illinois
101
Pollutant Sources
High volume of runoff from impervious surfaces is degrading the urban streams within the Waukegan watershed. The steepest lands, and therefore the most eroded, are located in Washington and Powell Parks along the Lake Michigan bluffs.
Pre-Project Water Quality
Aquatic resources were limited by shallow pool depth and high summer water temperatures. Fine silts filled both pools and runs to the extent that little rock substrates were visible.
Water Quality Objectives
The purpose of the project is to restore the stream banks for the Waukegan River in Washington Park and Powell Park, which have become a source of urban nonpoint source pollution and a danger to the public. The detrimental effects of stormwater runoff will be reduced or mitigated.
Project Time Frame
The project was initially funded in 1994 as a 319 Watershed Project. Monitoring began in 1994 and was officially approved in 1996 as a Section 319 National Monitoring Program project. Monitoring activities concluded in October of 2006. This allowed for ten years of post-BMP implementation.
PROJECT DESIGN
Nonpoint Source Control Strategy
Biotechnical stream restoration techniques (a combined vegetative and structural approach) were selected to demonstrate how these techniques can be more cost-effective than traditional engineered approaches in reducing erosion, enhancing habitat and stabilizing the stream.
Projects on the North Branch of the Waukegan River
Lunkers and a-jacks were installed in Powell Park. Lunkers with stone were installed in Washing-ton In May of 1992 Lunkers and A-jacks were installed at station N2 in Powell Park. In September of 1992 Lunkers with stone and A-jacks were installed at station N1in Washington Park. Willows, dogwoods, and grasses were planted on the stream banks where lunkers were installed. In January of 1996 two Newbury Weirs were constructed at station N1. Two sampling stations, N1 and N2 (Figure 2), are utilized for background data collection, but were not part of the Section 319 National Monitor-ing Program project.
Projects on the South Branch of the Waukegan River
In September of 1994, lunkers, a-jacks, stone, dogwoods, willows, and grasses were used to stabilize a severe bank erosion site at station S1on the South Branch of the Waukegan River. Smaller bank erosion sites were stabilized with coir coconut fiber rolls, willows, and grasses. Because the original bank stabilization efforts did not significantly increase stream depth, in January of 1996, a series of six pool-and-riffle complexes were created by the construction of rock grade control structures (Newbury Weirs) from granite boulders in a 1000 foot reach of the South Branch beginning at the confluence. Station S2 did not have any projects installed and was utilized as control. Both station S1 and S2 were primary sampling stations.
102
Waukegan River, Illinois
Water Quality Monitoring
Variables Measured
Biological parameters are measured during the spring, summer, and fall cycles of the project period. Flow is measured continuously.
Biological
Fish samples Macroinvertebrates Habitat
Chemical and Other
None
Covariates
Dissolved oxygen (DO) Temperature Flow
Sampling Scheme
The stream was divided into an upstream untreated reference site designated as station S2 and a se-verely eroding downstream treated area designated as station S1. With this design, urban water qual-ity will affect both the control (S2) and the rehabilitated station (S1) uniformly. At each location fish, macoinvertebrates, and habitat were sampled during the spring, summer, and fall seasons. Sampling was also conducted at stations N1 and N2 on the North Branch as additional reference (Figure 2).
The scoring used for each category to measure stream health were the Index of Biotic Integrity (IBI) for fish, the Macroinvertebrate Biotic Index (MBI) for aquatic insects, and Potential Index of Biotic Integrity (PIBI) for habitat. Major criteria used to determine stream health include percentage of fish species and number of individuals for the IBI; the number of individuals in each taxon and a tolerance value for each taxon for MBI; and. percentage of substrate types, percent of pool, and the average width for the PIBI.
DATA MANAGEMENT AND ANALYSIS
Data Management and Storage
Water quality data are stored and maintained in the USEPA NonPoint Source Management System (NPSMS) databases.
Findings to Date
The biological sampling since 1994 indicates that the number of fish species and abundance in the South Branch had improved after the construction of lunkers and rock grade control structures (New-bury Weirs).The IBI rose sharply from a limited aquatic resource into the moderate category after construction (Figure 3). Both N1 and S1where lunkers and Newbury Weirs were applied averaged higher IBI scores and fish population with more fish species than the untreated control at S2 or the N2 bank armored site from 1996 through 2006.
Waukegan River, Illinois
103
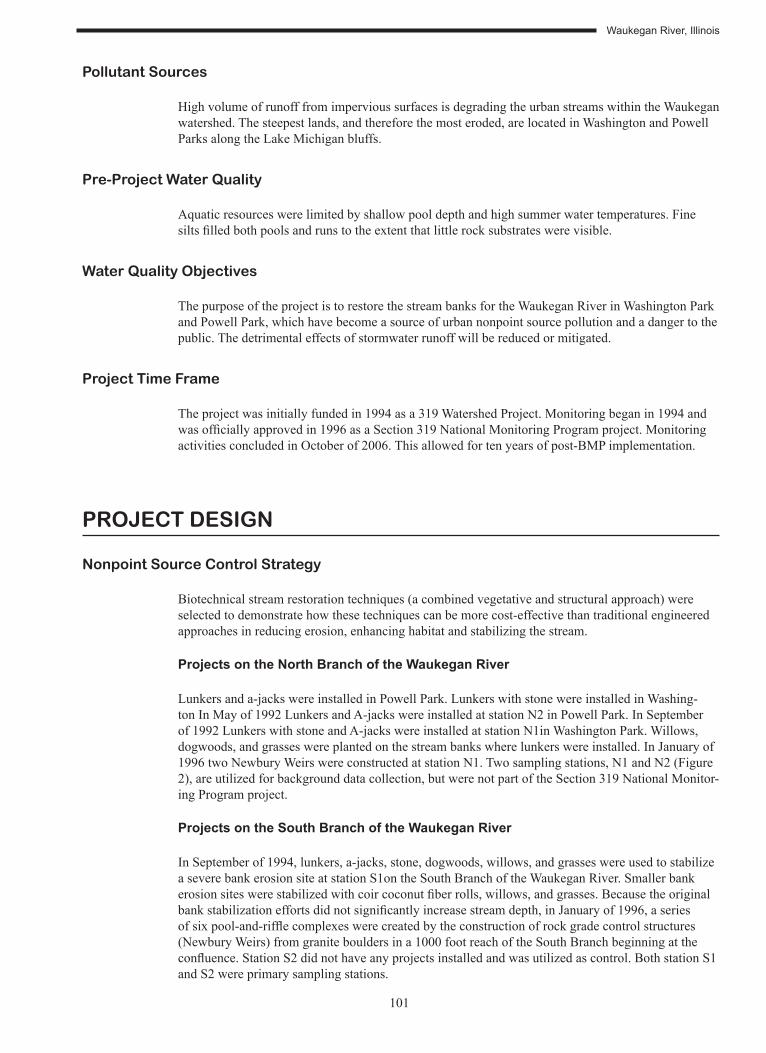
Documented fish kills occurred in 1998 and 1999 impacting the South Branch. The fish kills were observed at very low flow conditions with no turbidity present in the water column. Fish kills were not observed during sampling event activities after 1999. After the 1996 peak IBI scores continued to decline. Tolerant fish species dominated the fish population at all four stations which helped drive down the IBI scores. The Mottled Sculpin was the only intolerant species caught during the entire period making up less than one percent of the total catch. Coho Salmon had the highest overall percent of intermediate species. The occurrence of this non-native species was influenced by annual spring stocking of Lake Michigan. Eighty percent of the Coho Salmon were caught during the spring sampling period. Table 2 shows the percent of the total catch of fish species for each station over the thirteen year period.
Figure 3: IBI Scores from Monitoring stations in the Waukegan River Watershed
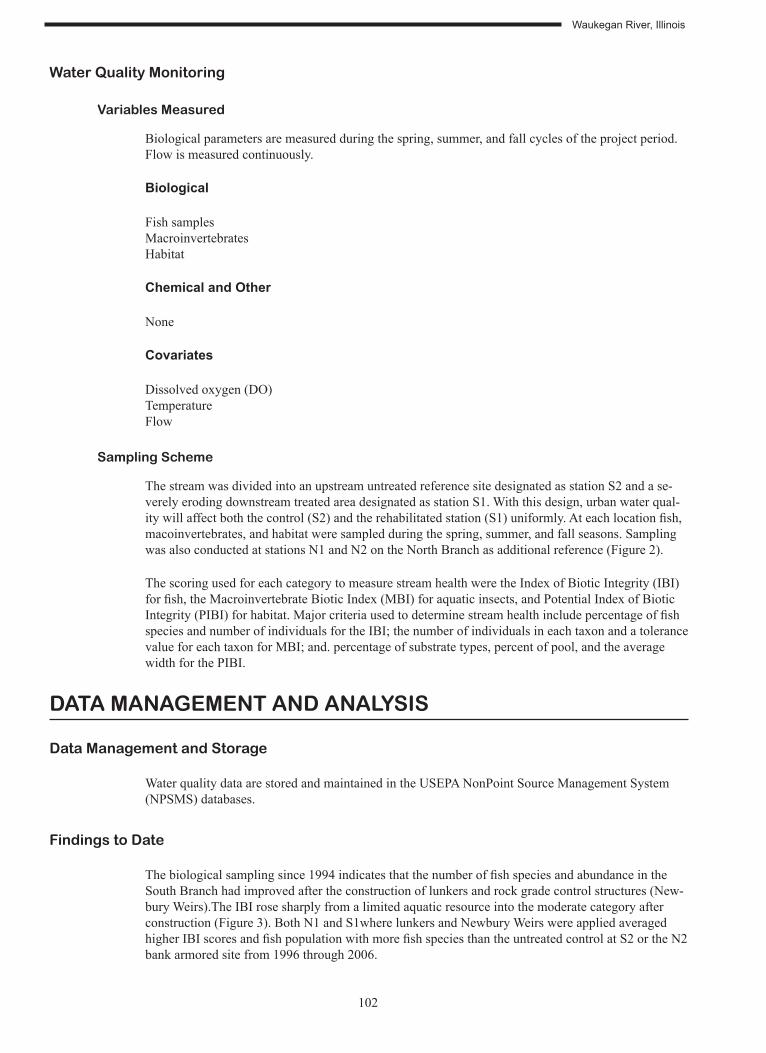
Table 2: Percent of the Total Fish Caught during the Project Period in the Waukegan River Watershed
Native Station Station Station StationFish Species Tolerance Status Station S1 S2 N1 N2Common Name % % % %Green Sunfish Tolerant Native 38.0 13.4 15.2 48.8Mosquitofish Tolerant Native 8.4 37.6 1.6 0.5Threespine Stickleback Intermediate Non-Native 12.2 31.1 43.5 1.2Fathead Minnow Tolerant Native 12.8 8.7 7.5 9.2White Sucker Tolerant Native 8.5 2.2 6.4 23.7Goldfish Tolerant Non-Native 0.9 0.0 0.9 3.7Bluegill Tolerant Native 1.5 0.2 4.6 2.9Coho Salmon Intermediate Non-Native 0.9 4.3 1.5 2.5Longnose Dace Intermediate Native 4.0 0.2 1.6 0.0Largemouth Bass Tolerant Native 3.5 0.7 1.6 0.0Golden Shiner Tolerant Native 2.4 0.7 1.6 0.0Carp Tolerant Non-Native 1.8 0.0 1.1 1.9Number of remaining (12) (3) (13) (8)species <1% & percent 5.1% 0.9% 12.9% 5.6%
104
Waukegan River, Illinois
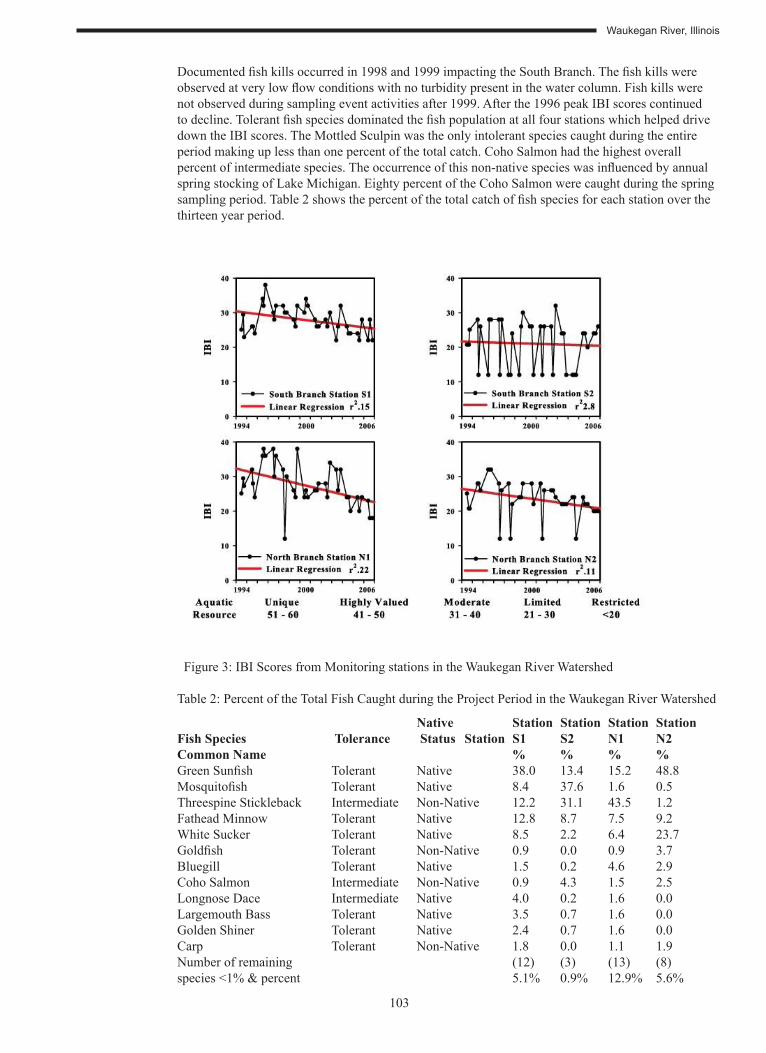
Macroinvertebrate Biotic Index scores progressed into a poor stream condition following a similar pattern to the IBI scores (Figure 4). Some individual scores at station S1 and S2 on the South Branch jumped into the very poor stream condition category. Station S2 had MBI scores that dropped into a fair stream condition after restoration in 1996 and persisted up to 2001where they began to move back into a poor stream condition. The station N1 restoration site also had MBI scores in the fair stream condition category during and after stream restoration from 1995 through 2001where the scores began to creep into a poor stream condition. Station N2 maintained better quality scores throughout the project period with the exception of 2004 and 2006 having poor stream conditions.
Pollutant associated species Chironomidae (Bloodworms or Midge fly larvae), OLIGOCHAETA (Aquatic Earthworms), and Caecidotea (Pillbugs or Sowbugs) dominated the overall population of collected species (Table 3). The average taxa richness for the thirteen year period at station N2, N1, and S2 were 8 (poor) while station S1 averaged a 10 (fair). An overall average of the EPT (Ephemeroptera + Plecoptera + Trichoptera) taxa richness for stations N1 and N2 were in a fair category with a score of 3 where 23% of the 39 sampled dates at station N1fell into the fair, good or excellent category’s and 13% of the sampled dates at station N2 were in the fair, good or excellent categories while the remaining percents fell into the poor or very poor category. At Stations S1 and S2 the overall average EPT taxa richness score was under a 1(very poor) where 8% of the sampled dates at both stations fell into the fair, good or excellent categories.
Examaning the functional feeding designations of the species collected revealed that gatherer/collectors averaged 87% of the population of all stations while 6% were predators and 4% were scrapers with the remaining percent made up of filter/collectors, omnivores, and shredders. Generalists, such as collectors and filterers, have a broader range of acceptable food materials than specialists (scrapers, piercers,and shredders) (Cummins and Klug 1979), and thus are more tolerant to pollution that might alter availability of certain food.
Figure 4: MBI Scores from Monitoring stations in the Waukegan River Watershed
Waukegan River, Illinois
105
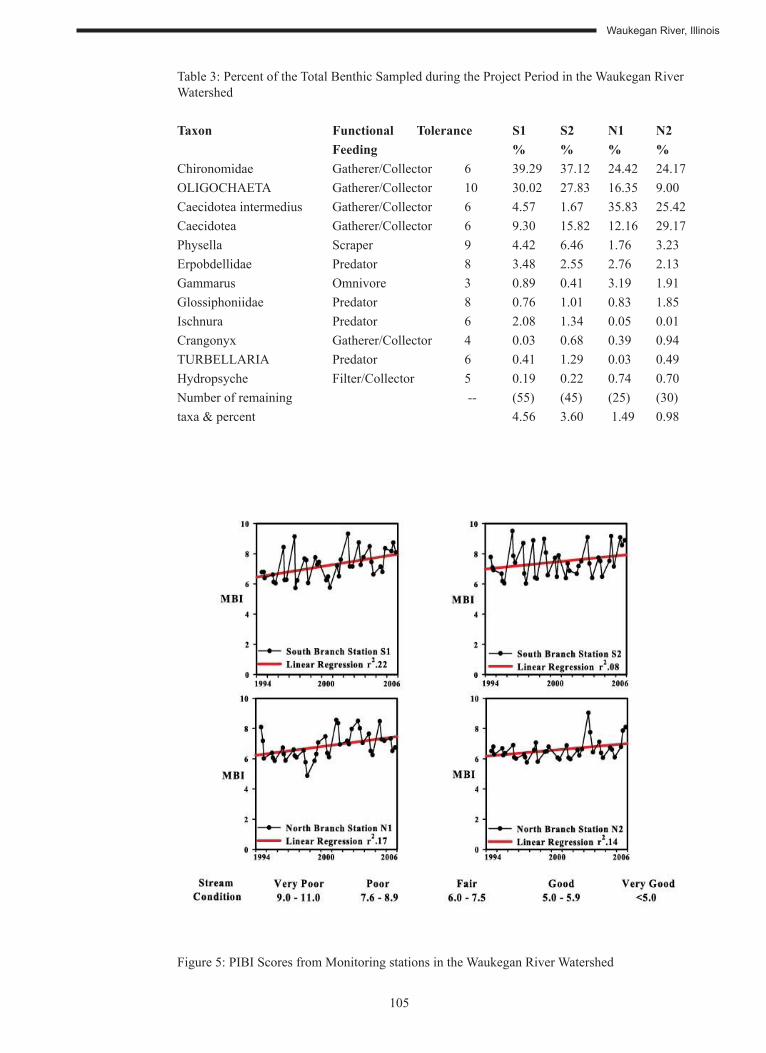
Table 3: Percent of the Total Benthic Sampled during the Project Period in the Waukegan River Watershed
Taxon Functional Tolerance S1 S2 N1 N2 Feeding % % % %Chironomidae Gatherer/Collector 6 39.29 37.12 24.42 24.17OLIGOCHAETA Gatherer/Collector 10 30.02 27.83 16.35 9.00Caecidotea intermedius Gatherer/Collector 6 4.57 1.67 35.83 25.42Caecidotea Gatherer/Collector 6 9.30 15.82 12.16 29.17Physella Scraper 9 4.42 6.46 1.76 3.23Erpobdellidae Predator 8 3.48 2.55 2.76 2.13Gammarus Omnivore 3 0.89 0.41 3.19 1.91Glossiphoniidae Predator 8 0.76 1.01 0.83 1.85Ischnura Predator 6 2.08 1.34 0.05 0.01Crangonyx Gatherer/Collector 4 0.03 0.68 0.39 0.94TURBELLARIA Predator 6 0.41 1.29 0.03 0.49Hydropsyche Filter/Collector 5 0.19 0.22 0.74 0.70Number of remaining -- (55) (45) (25) (30)taxa & percent 4.56 3.60 1.49 0.98
Figure 5: PIBI Scores from Monitoring stations in the Waukegan River Watershed
106
Waukegan River, Illinois
At treated stations S1 and N1the PIBI scores continued to climb into the highly valued category driven by the increase in the percent of pool and a decrease in the percent of silt-mud (Figure 5). The untreated station S2 also shows a slight improvement that is driven by natural changes in the percent of pool. The station N2 bank armored project scores stay fairly consistent where an increase in the percent of claypan substrate due to scour is driving the scores down. At all stations the PIBI scores remain in the moderate to highly valued aquatic resource category.
INFORMATION, EDUCATION, AND PUBLICITY
Station S1on the South Branch of the Waukegan River in Washington Park served as a training site for a streambank restoration class held during the Second National Nonpoint Source Watershed Mon-itoring Workshop. Senior personnel from the city’s Public Works Department and the Waukegan Park District were taken through the restoration and stabilization process before and during construction. Workshop members participated in both the restoration installation and the fish monitoring activities.
A field manual of urban stream restoration and video of the biotechnical streambank restoration ac-tivities have been developed to highlight the biotechnical techniques that were used in the restoration.
An updated videotape production was developed describing the biotechnical stream stabilization techniques, the monitoring program, and the physical and biological enhancements achieved.
The Illinois State Water Survey will produce two educational/informational productions at the end of the Waukegan River National Monitoring Strategy. These two productions include a completed final videotape production and a final project report which is currently being developed to document the entire aspects of the Waukegan River National Monitoring Strategy. The final videotape was pro-duced and the final project report is being created and should be completed on or before June 2009.
TOTAL PROJECT BUDGET
The estimated budget for the Waukegan River Section 319 National Monitoring Program project for the period of FY 92-06 is shown in table 4.
Table 4: Estimated budget for the Waukegan River Section 319 National Monitoring Program
Project Element Funding Source ($) Federal State Local SumProj Mgt 59,895 24,597 NA 84,492I&E 2,023 677 NA 2,700LT [319(h)] 227,218 NA 275,320 502,538WQ Monit 163,047 96,842 NA 259,889 TOTALS 452,183 122,116 275,320 849,619
Source: Illinois Environmental Protection Agency (Personal Communication, 2000), Illinois Environmental Protection Agency (Personal Communication, 2001), Illinois Environmental Protection Agency (Personal Com-munication, 2003), Illinois Environmental Protection Agency (Personal Communication, 2004), Illinois Environ-mental Protection Agency (Personal Communication, 2005), Illinois Environmental Protection Agency (Personal Communication, 2006)
Waukegan River, Illinois
107
IMPACT OF OTHER FEDERAL AND STATE PROGRAMS
Further restoration activities on the South Branch of the Waukegan River included two projects in the Waukegan Park District’s Washington and Roosevelt Parks. The Waukegan River Wetland Restoration Project that was started in 1998 to improved a degraded ½ acre wetland adjacent to the Waukegan River in Washington Park. The intent of this project was to reestablish the natural function of the wetland and to reduce nonpoint source pollution impacts. The project also included the stabilization of 300 feet of eroding streambank on the Waukegan River using bioengineering techniques in Washington Park. An interpretive observation station was constructed that overlooked the wetland site to inform the public about the project, the Waukegan River National Monitoring Project, Waukegan River Watershed and nonpoint source pollution.
The Roosevelt Park and Waukegan River Restoration Project begun in 2002 to address erosion and poor water quality conditions present in the Waukegan Park District's Roosevelt Park. The goals of this project will be addressed in two phases. The first phase will include the design and installation of an interpretive signage and pathway, stream restoration and wetland retrofit of the existing Roosevelt Park sediment basin on the South Branch of the Waukegan River. The proposed second phase will include the "daylighting" of Illinois Route 120 (Belvidere Street) stormwater culvert to connect Washington and Roosevelt Parks and stream corridor restoration on the South Branch of the Waukegan River in Washington Park. While the stream corridor restoration portion of the second phase was accomplished, the “daylighting” efforts for Illinois Route 120 did not proceed forward due to the lack of local/state funding availability. These stream and wetland restoration efforts will help improve water quality, create wildlife habitat and provide for environmental educational opportunities.
Waukegan River Watershed planning initiative begun in 2005 with a local advisory group to facilitate the work with local stakeholders to develop a comprehensive watershed plan. This plan included the selection of a watershed coordinator, formation of stakeholder and technical planning committees, stakeholder workshops, watershed data evaluation and resource inventory, and proposed Action Plan to improve water quality and to identify and reduce pollutants while protecting, restoring and enhancing the natural habitat and aesthetics.
This planning effort brought together the general public, governmental entities, local businesses, educational institutions and homeowners in the Waukegan River Watershed to improve the quality of life for their community. The results of the present planning efforts were the creation of the Waukegan River Watershed Plan in December of 2007 through the input of all the involved stakeholders.
OTHER PERTINENT INFORMATION
Participating agencies and organizations:
• U.S. Environmental Protection Agency
• Illinois Environmental Protection Agency
• Illinois Department of Natural Resources
• Illinois State Water Survey
• Private Contractor
• University of Illinois at Champaign—Urbana
• Waukegan Park District
• Waukegan Public Works Department
108
Waukegan River, Illinois
PROJECT CONTACTS
Administration
Scott TomkinsIllinois Environmental Protection AgencyWatershed Management Section, Bureau of Water1021 North Grand Avenue East, P.O. Box 19276Springfield, IL 62794-9276(217)782-3362; Fax (217) 785-1225Email Address: [email protected]
Water Quality Monitoring/River Restoration Treatment
Mr. William White Institute for Natural Resource Sustainability Illinois State Water Survey University of Illinois P.O. Box 697 Peoria, Illinois 61652-0697 Phone # (309) 671-3196 ext. 207 E-mail: [email protected]

![STATE OF ILLINOIS NINETY-NINTH GENERAL …ilga.gov/senate/journals/99/2015/SJ099047R.pdf3 [May 25, 2015] The Senate met pursuant to adjournment. Senator Terry Link, Waukegan, Illinois,](https://img.pdfslide.us/doc/110x75/5e994d0a1cf79255062314b6/state-of-illinois-ninety-ninth-general-ilgagovsenatejournals992015-3-may.jpg)