Embed Size (px)
Citation preview

Figure 1.Statewide departures from normal
JANUARY 2018 OVERVIEW
Temperatures and precipitation were below the long-term average in Illinois in January. Mean streamflow statewide was below the median for the month. Shallow groundwater levels were below the long-term depths.
Air temperatures averaged 24.1 degrees in January, 2.3 degrees below the long-term average (Figure 1). The southwestern crop reporting district (CRD) had the highest temperatures with an average of 28.4 degrees. The lowest regional temperature was 20.6 degrees, reported from the northwestern CRD.
Precipitation averaged 1.24 inches, 0.83 inches below the long-term average. The southeastern district had the highest average with 2.21 inches. The eastern district had the lowest average at 0.93 inches.
Mean provisional streamflow aggregated statewide was below the long-term median flow for January, about 65 percent of median (Figure 1). Monthly mean discharge values ranged from below normal to above normal for January. Data were limited due to winter conditions.
Water surface levels at the end of January were below full pool or target level at 17 of 25 reporting reservoirs. At the end of January, Lake Shelbyville was 0.4 feet above the winter target level, Carlyle Lake was 0.5 feet above the winter target level, and Rend Lake was 0.6 feet below the spillway level.
Lake Michigan’s level was above its long-term mean for the month.Shallow groundwater levels statewide were below normal this month
with an average departure of 1.5 feet (Figure 1). There was no change in the deviations from normal groundwater levels between December and January. Levels averaged 0.8 feet above December levels and were 2.2 feet below January levels of last year.
ILLINOIS WATER AND CLIMATE SUMMARY
Water and Atmospheric Resources Monitoring Program | www.isws.illinois.edu/warm Contact Jennie R. Atkins: (217) 333-4966, email: [email protected]
January 2018
2
WEATHER/CLIMATE INFORMATION—Jim Angel and Jennie Atkins
The following description of temperatures, growing degree days, precipitation, severe weather, and drought comes from data compiled by a number of networks that report to the National Oceanic and Atmospheric Administration (NOAA). These data are provisional and may change slightly over time.
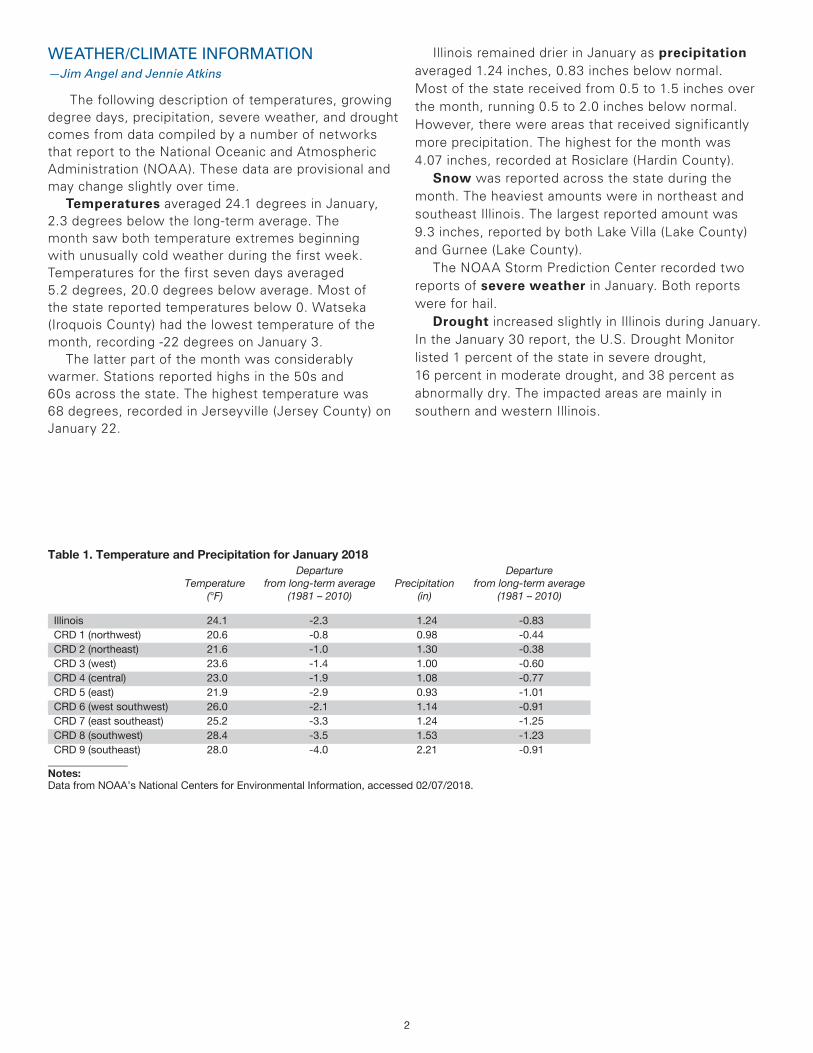
Temperatures averaged 24.1 degrees in January, 2.3 degrees below the long-term average. The month saw both temperature extremes beginning with unusually cold weather during the first week. Temperatures for the first seven days averaged 5.2 degrees, 20.0 degrees below average. Most of the state reported temperatures below 0. Watseka (Iroquois County) had the lowest temperature of the month, recording -22 degrees on January 3.
The latter part of the month was considerably warmer. Stations reported highs in the 50s and 60s across the state. The highest temperature was 68 degrees, recorded in Jerseyville (Jersey County) on January 22.
Illinois remained drier in January as precipitation averaged 1.24 inches, 0.83 inches below normal. Most of the state received from 0.5 to 1.5 inches over the month, running 0.5 to 2.0 inches below normal. However, there were areas that received significantly more precipitation. The highest for the month was 4.07 inches, recorded at Rosiclare (Hardin County).
Snow was reported across the state during the month. The heaviest amounts were in northeast and southeast Illinois. The largest reported amount was 9.3 inches, reported by both Lake Villa (Lake County) and Gurnee (Lake County).
The NOAA Storm Prediction Center recorded two reports of severe weather in January. Both reports were for hail.
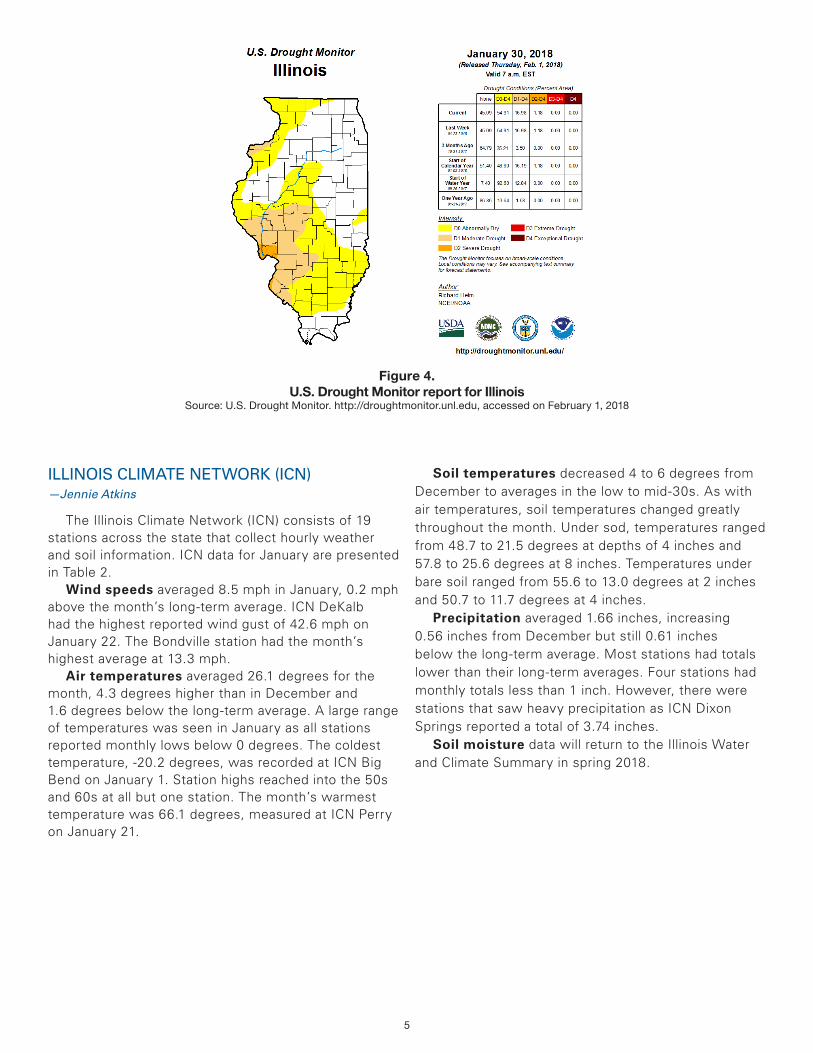
Drought increased slightly in Illinois during January. In the January 30 report, the U.S. Drought Monitor listed 1 percent of the state in severe drought, 16 percent in moderate drought, and 38 percent as abnormally dry. The impacted areas are mainly in southern and western Illinois.
Table 1. Temperature and Precipitation for January 2018
Temperature (°F)
Departure from long-term average
(1981 – 2010)Precipitation
(in)
Departure from long-term average
(1981 – 2010)
Illinois 24.1 -2.3 1.24 -0.83CRD 1 (northwest) 20.6 -0.8 0.98 -0.44CRD 2 (northeast) 21.6 -1.0 1.30 -0.38CRD 3 (west) 23.6 -1.4 1.00 -0.60CRD 4 (central) 23.0 -1.9 1.08 -0.77CRD 5 (east) 21.9 -2.9 0.93 -1.01CRD 6 (west southwest) 26.0 -2.1 1.14 -0.91CRD 7 (east southeast) 25.2 -3.3 1.24 -1.25CRD 8 (southwest) 28.4 -3.5 1.53 -1.23CRD 9 (southeast) 28.0 -4.0 2.21 -0.91
_______________Notes: Data from NOAA’s National Centers for Environmental Information, accessed 02/07/2018.

3
Figure 2.Illinois precipitation, temperature and their departures from average, as well as snowfall, for January 2018
Source: cli-MATE, Midwestern Regional Climate Center. http://mrcc.illinois.edu/CLIMATE accessed on: February 1, 2018

4
Figure 3.Illinois precipitation and precipitation departure from average for
last 6 months (top), and last 3 months (bottom)Source: cli-MATE, Midwestern Regional Climate Center. http://mrcc.illinois.edu/CLIMATE, accessed on February 1, 2018
5
ILLINOIS CLIMATE NETWORK (ICN)—Jennie Atkins
The Illinois Climate Network (ICN) consists of 19 stations across the state that collect hourly weather and soil information. ICN data for January are presented in Table 2.
Wind speeds averaged 8.5 mph in January, 0.2 mph above the month’s long-term average. ICN DeKalb had the highest reported wind gust of 42.6 mph on January 22. The Bondville station had the month’s highest average at 13.3 mph.
Air temperatures averaged 26.1 degrees for the month, 4.3 degrees higher than in December and 1.6 degrees below the long-term average. A large range of temperatures was seen in January as all stations reported monthly lows below 0 degrees. The coldest temperature, -20.2 degrees, was recorded at ICN Big Bend on January 1. Station highs reached into the 50s and 60s at all but one station. The month’s warmest temperature was 66.1 degrees, measured at ICN Perry on January 21.
Soil temperatures decreased 4 to 6 degrees from December to averages in the low to mid-30s. As with air temperatures, soil temperatures changed greatly throughout the month. Under sod, temperatures ranged from 48.7 to 21.5 degrees at depths of 4 inches and 57.8 to 25.6 degrees at 8 inches. Temperatures under bare soil ranged from 55.6 to 13.0 degrees at 2 inches and 50.7 to 11.7 degrees at 4 inches.
Precipitation averaged 1.66 inches, increasing 0.56 inches from December but still 0.61 inches below the long-term average. Most stations had totals lower than their long-term averages. Four stations had monthly totals less than 1 inch. However, there were stations that saw heavy precipitation as ICN Dixon Springs reported a total of 3.74 inches.
Soil moisture data will return to the Illinois Water and Climate Summary in spring 2018.
Figure 4.U.S. Drought Monitor report for Illinois
Source: U.S. Drought Monitor. http://droughtmonitor.unl.edu, accessed on February 1, 2018

6
Table 2. Data from the Illinois Climate Network (ICN), January 2018
Station
Ave Wind Speed (mph)
Ave Wind Direction
(°)
Maximum Wind Gust
(mph)
Maximum Air Temperature
(°F)
Minimum Air Temperature
(°F)
Average Air Temperature
(°F)
Belleville 9.3 219.3 34.5 64.9 M -5.2 M 30.1 MBig Bend 8.4 235.2 29.8 58.8 -20.2 22.7Bondville 13.3 238.2 37.9 59.3 -16.9 23.0Brownstown 8.2 224.1 35.0 63.2 -8.3 27.9Carbondale 8.0 225.8 38.8 64.5 -4.5 30.7Champaign 5.9 237.7 27.2 59.3 M -13.6 M 24.6 MDeKalb 10.1 230.5 42.6 57.3 -17.1 21.5Dixon Springs 5.1 M 213.0 M 33.3 M 63.3 M -1.8 M 32.2 MFairfield 7.4 214.7 31.1 63.0 -4.4 30.4Freeport 6.7 233.8 26.2 49.6 -15.6 20.8Monmouth 11.9 238.7 32.5 56.4 -20.3 23.0Olney 6.6 211.4 34.8 61.2 -6.0 28.1Peoria 8.7 237.7 34.4 59.0 -16.6 24.5Perry 7.8 M 237.9 M 31.0 M 66.1 M -12.2 M 26.4 MRend Lake 5.4 224.8 28.7 63.1 -2.6 30.6Snicarte 11.0 232.1 38.7 63.0 -13.6 26.5Springfield 7.5 237.3 31.4 64.4 -13.2 26.8St. Charles 7.3 222.0 30.8 58.2 -14.6 23.8Stelle 12.8 235.9 34.7 58.4 -18.2 21.9
Table 2. continued
Station
Total Solar Radiation (MJ/m2)
Average Relative
Humidity (%)
Total Precipitation
(in)
Average Dew Point
(°F)
Total Potential Evapotranspiration
(in)
Ave Soil Temperature at 4" under
Sod (°F)
Ave Soil Temperature at 8" under
Sod (°F)
Ave Soil Temperature at 2" under
Bare Soil (°F)
Ave Soil Temperature at 4" under
Bare Soil (°F)
Belleville 263.7 73.4 1.42 21.8 M 1.47 M 32.6 33.7 31.5 29.8Big Bend 239.5 80.3 0.90 17.4 0.94 31.6 32.0 31.0 31.0Bondville 255.1 80.5 1.33 17.7 0.99 30.7 M 32.6 32.1 32.9Brownstown 240.5 70.3 1.27 18.8 1.30 35.6 34.6 31.3 31.8Carbondale 262.4 70.1 2.94 M 21.2 1.49 36.1 35.0 33.4 34.0Champaign 227.8 78.0 M 1.33 18.4 M 0.96 M 35.1 46.2 34.0 34.5DeKalb 238.3 80.1 1.29 16.2 0.88 33.6 32.9 32.5 34.4Dixon Springs 230.9 M 71.2 3.74 M 23.1 M 1.28 M 35.2 M 36.5 M 35.3 M 34.9 MFairfield 259.9 73.3 2.17 22.3 1.34 34.6 35.3 34.6 31.9Freeport 196.6 81.9 1.18 16.0 0.73 33.5 31.8 29.4 29.8Monmouth 263.4 80.4 0.82 17.7 1.03 30.1 30.4 30.2 31.1Olney 260.0 76.6 2.00 21.1 1.19 33.4 34.1 32.3 32.8Peoria 246.8 80.3 1.78 18.9 1.01 34.8 33.7 33.1 32.4Perry 253.2 M 71.7 1.83 M 17.8 M 1.26 M 32.7 M 33.9 M 32.2 M 33.1 MRend Lake 248.8 70.4 1.98 21.4 1.33 34.3 35.7 33.3 34.2Snicarte 258.7 71.9 2.00 18.2 1.35 31.9 32.6 30.9 30.0Springfield 247.8 70.1 0.92 17.9 1.27 32.7 32.4 32.5 32.7St. Charles 221.5 79.4 1.70 18.2 0.89 31.8 33.1 31.4 32.8Stelle 195.7 83.1 0.85 17.4 0.77 32.2 32.1 29.2 30.4
_______________Notes:M = Missing data.

7
Figure 6.Precipitation totals (inches) for (a) Imperial Valley Water Authority and
(b) Cook County raingage networks January 2018
b. Cook County
a. Imperial Valley
OTHER PRECIPITATION NETWORKS —Erin Bauer
Imperial Valley. The average network precipitation for January 2018 was 1.67 inches, which is below the latest 25-year monthly network average of 1.86 inches. The largest monthly gage precipitation totals were in the southwest corner and central portion of the network. The smallest gage totals were along the central eastern edge of the network. Monthly gage totals varied 0.58 inches across the network, from 1.34 inches at site #7, east of Green Valley, to 1.92 inches at site #9 near Topeka. The 1981–2010, 30-year average precipitation amounts for January at Havana and Mason City are 1.92 and 2.08 inches, respectively. The January 2017 network average of 1.67 inches is about 90 percent of the 25-year (1993–2017) IVWA January network average of 1.86 inches.
The Imperial Valley Water Authority funds this 20-station precipitation network operated by the Illinois State Water Survey.
Cook County. During January 2018, precipitation in Cook County was below normal (Figure 6b). Total monthly precipitation amounts were highest in the northern portion of Cook County. The lowest monthly precipitation occurred in the southeastern portion of the county. Precipitation values ranged from 0.76 inches at site #14 (Chicago, near E. 79th St. and S. Shore Dr.) to 1.48 inches at site #3 (Des Plaines, near S. River Rd. and E. Oakton St.). The network average of 1.10 inches is about 53 percent of the 28-year (1990–2017) January network average of 2.07 inches. The Illinois State Water Survey operates this 25-station precipitation network funded by the U.S. Army Corps of Engineers.

8
SURFACE WATER INFORMATION —Bill Saylor
River and stream discharge and stage data are obtained from gaging stations operated by the U.S. Geological Survey (USGS) or the U.S. Army Corps of Engineers (USACE). The USGS gaging station network is supported, in part, by the Illinois Department of Natural Resources Office of Water Resources, the Illinois State Water Survey (ISWS), and the USACE. Provisional discharge data are obtained from the USGS.
Table 3 lists the provisional peak stage for the current month compared to flood stage at selected streamgaging stations located on the Illinois, Mississippi, and Ohio Rivers. Peak stage is represented here by morning readings posted daily by the USACE or the National Weather Service. Flood stage is defined locally for each gage location.
Provisional monthly mean flows for 26 streamgaging stations located throughout Illinois are shown in Table 4. Mean values posted by the USGS are listed if available; otherwise, daily mean discharge data posted by the USGS are used to estimate the mean flow for the month. Long-term mean flows for each month are published by the USGS. The month’s median flow for each station listed in Table 4 was determined by ranking the January mean flow for each year of record, and selecting the middle value, 50 percent exceedence probability.
The statewide percent of historical mean flow and percent of historical median flow are calculated by dividing the sum of the average flows this month at stations in Table 4 by the sum of the historical mean and median flows calculated for the month, respectively, at the same stations. This method is intended to weight individual observations proportionately in the aggregate comparison. (The Illinois River and Rock River stations are excluded from the statewide calculation because other rivers listed in Table 4 contribute to their flow.)
Mean provisional flow aggregated statewide, using the available monthly mean data shown this month in Table 4, was below the median value for January (approximately 65 percent of the median) and below the mean for January (approximately 45 percent of the mean). Monthly mean discharge values were above normal for January in northern Illinois, and mostly below normal elsewhere. Winter conditions limited data availability at many streamgage stations. In this month’s Table 4, several monthly mean values incorporate data that were estimated, where feasible. Readers are reminded that data herein are provisional; USGS eventually posts revised streamflow statistics following further review.
Water-Supply Lakes and Major Reservoirs. Table 5 lists reservoirs in Illinois, their normal pool or target water surface elevation, and other data related to observed variations in water surface elevations. Reservoir levels are obtained from a network of cooperating reservoir operators who are contacted each month by ISWS staff for the current water levels. Reservoir levels are reported in terms of their difference from normal pool (or target level). The average of the month-end readings for the period of record is reported in terms of the difference from normal pool or target level (column 6 of Table 5), and the number of years of record for each reservoir also is given (column 7). Most reservoirs serve as public water supplies, with the exceptions noted in the last column.
Compared to end-of-December water levels at 21 reservoirs for which levels were reported last month and this month, reported end-of-January water levels were lower at eight reservoirs, higher at eight reservoirs, and about the same as at the end of last month at five reservoirs. For the 25 reservoirs with measurements reported at the end of January, water levels were below the normal target pool or spillway level at 17 reservoirs, above the normal target pool or spillway level at six reservoirs (four at which the water levels and outflows can be actively adjusted, and one pair which is not a public water supply), and at about full pool level at two reservoirs. Carlinville resumed use of its primary lake as its supply source in mid-January.
Major Reservoirs. Compared to water levels at the end of December, at the end of January the water level at Lake Shelbyville was 4.4 feet lower, Carlyle Lake was 0.4 feet higher, and Rend Lake was at about the same level as at the end of December. At the end of January, Lake Shelbyville was 0.4 feet above the winter target level, Carlyle Lake was 0.5 feet above the winter target level, and Rend Lake was 0.6 feet below the spillway level.
Great Lakes. Current month mean and end-of-month values are provisional and are relative to International Great Lakes Datum 1985. The January 2018 mean level for Lake Michigan was 579.8 feet. The monthly mean level one year ago (January 2017) was 579.0 feet. The long-term average lake level for January is 578.4 feet, based on 1918-2016 data. In this period of record, the lowest mean level for Lake Michigan for January occurred in 2013 at 576.0 feet, and the highest level for January occurred in 1987 at 581.3 feet. The month-end level of Lake Michigan was 579.9 feet. All values are provided by the U.S. Army Corps of Engineers Detroit District.

9
Table 3. Peak Stages for Major Rivers during January 2018
River StationRiver mile*
Flood stage (feet)*
Peak stage (feet)** Date
IllinoisMorris 263.1 16 7.6 25La Salle 224.7 20 15.9 25Peoria 164.6 18 12.9 25Havana 119.6 14 10.8 29Beardstown 88.6 14 10.9 23Hardin 21.5 25 21.0 27
MississippiDubuque 579.9 17 10.5 24Keokuk 364.2 16 6.7 27Quincy 327.9 17 12.1 13Grafton 218.0 18 16.4 27St. Louis 180.0 30 6.0 29Chester 109.9 27 8.7 30Thebes 43.7 33 12.1 31
OhioCairo 2.0 40 27.7 20
________________Notes:* RivermileandfloodstagefromRiver Stages in Illinois: Flood and Damage Data,IllinoisDepartmentofNaturalResources,OfficeofWater
Resources, August 2004 (and Addendum, February 2007).** Peak stage based on daily a.m. readings, not instantaneous peak. Stage data obtained from U.S. Army Corps of Engineers.
Table 4. Provisional Mean Flows, January 2018
Station
Drainagearea
(sq mi)
Yearsof
record
2018mean flow
(cfs)
Long-term flows
Flow condition
Percentchance of
exceedence
Days ofdata thismonth
Mean*(cfs)
Median(cfs)
Rock River at Rockton 6363 82 5720 3418 3016 above normal 13 31Rock River near Joslin 9549 74 8100 5697 4676 above normal 18 31Pecatonica River at Freeport 1326 98 1190 777 650 above normal 14 30Green River near Geneseo 1003 78 N/A 568 384 N/A N/A N/AEdwards River near New Boston 445 79 62 250 140 below normal 75 31Kankakee River at Momence 2294 100 N/A 2337 2155 N/A N/A N/AIroquois River near Chebanse 2091 93 ~1600 2054 1679 normal 51 21Fox River at Dayton 2642 98 2314 1554 1168 above normal 19 31Vermilion River at Pontiac 579 73 89 423 259 below normal 73 31Spoon River at Seville 1636 100 284 1042 664 below normal 73 30LaMoine River at Ripley 1293 93 68 649 348 below normal 82 25Bear Creek near Marceline 349 72 13 151 64 below normal 74 27Mackinaw River near Congerville 767 68 < 36 526 310 below normal 85 23Salt Creek near Greenview 1804 75 200 1312 860 below normal 81 31Sangamon River at Monticello 550 104 40 446 267 below normal 79 31South Fork Sangamon near Rochester 867 67 < 26 662 300 below normal 80 27Illinois River at Valley City 26,743 78 15,471 21,840 17,120 normal 56 31Macoupin Creek near Kane 868 88 N/A 551 226 N/A N/A N/AVermilion River near Danville 1290 95 603 1213 711 normal 55 31Kaskaskia River at Vandalia 1940 47 1214 2586 2091 below normal 78 31Shoal Creek near Breese 735 73 56 706 338 below normal 83 31Embarras River at Ste. Marie 1516 103 < 260 1737 1132 below normal 84 31SkilletForkatWayneCity 464 97 < 80 651 355 below normal 78 31LittleWabashbelowClayCity 1131 102 < 260 1438 744 below normal 71 31BigMuddyatPlumfield 794 46 161 885 757 below normal 81 31Cache River at Forman 244 93 226 497 373 normal 66 31
________________ Notes:SourcestreamflowdataareobtainedfromtheU.S.GeologicalSurvey.N/A = not available (due to ice or equipment problems).Muchbelownormalflow=90-100%chanceofexceedence. Belownormalflow=70-90%chanceofexceedence.Normalflow=30-70%chanceofexceedence.Abovenormalflow=10-30%chanceofexceedence. Muchabovenormalflow=0-10%chanceofexceedence.*AsreportedinU.S.GeologicalSurvey(USGS)WaterResources Data, Illinois,WaterYear2016.

10
Table 5. Reservoir Levels in Illinois, January 2018
Normal pool Current level Monthly Average difference Years Decemberor target difference from normal change from normal of reported pumpage
Reservoir County level (feet) or target (feet) (feet) or target (feet) record (million gallons)
Altamont Effingham 582.0 N/A N/A -1.4 33 5.8Bloomington McLean 719.5 N/A N/A -2.6 31 N/ACarlinville Macoupin N/A -2.0 N/A -0.5 32 23.8Carlyle(1) Clinton 443.0 +0.5 +0.4 +1.8 40 N/ADecatur(1,3) Macon 612.5 +0.7 +0.1 +0.2 34 972.2Evergreen(4) Woodford 720.0 -5.3 -1.3 -2.1 27 N/AGlenn Shoals(2) Montgomery 590.0 -1.5 -0.2 +0.2 23 w/HillsboroHighland Madison 500.0 0.0 +0.2 0.0 29 28.6Hillsboro(2) Montgomery 589.0 0.0 0.0 +0.2 23 26.8Jacksonville(2) Morgan 644.0 N/A N/A -0.5 12 w/Mauvaise TerreKinkaid Jackson 420.0 -1.5 0.0 -0.2 29 50.5Lake of Egypt Williamson 500.0 -1.0 +0.1 0.0 24 N/AMattoon Coles 632.0 -3.0 0.0 -0.2 21 w/ParadiseMauvaise Terre(2) Morgan 588.5 -1.8 N/A +0.1 18 no meterMt. Olive (new) Macoupin 600.0 N/A N/A -0.7 13 w/Mt. Olive (old)Mt. Olive (old) Macoupin 654.0 -1.8 N/A -0.3 20 5.2Pana Christian 641.6 -3.1 -0.1 -0.9 33 N/AParadise Coles 685.0 -0.3 -0.3 -0.1 26 66.8Paris (east) Edgar 660.0 +0.1 +0.1 -0.2 33 NotPWSParis (west) Edgar 660.1 +0.1 +0.1 +0.1 23 w/Paris (east)Raccoon(1) Marion 477.0 +0.5 0.0 N/A N/A 103.5Rend Franklin 405.0 -0.6 0.0 +2.2 40 N/ASalem(3) Marion 546.5 -1.1 N/A -0.5 23 21.1Shelbyville(1) Shelby 594.0 +0.4 -4.4 +3.5 40 NotPWSSparta(3) Randolph 497.0 -1.7 -0.4 -0.8 20 N/ASpring(3,4) McDonough 654.0 -0.2 +0.3 -0.2 34 48.5Springfield(1,3) Sangamon 559.6 -4.1 -0.5 -1.2 34 556.1Taylorville Christian 590.0 -1.2 -0.3 -0.2 24 62.4Vermilion(4) Vermilion 581.7 -0.1 +0.1 -0.3 32 192.0
_______________Notes: Normal pool and target level datum is NGVD 1929.Current levels reported represent water surface levels at the end of the month, not the monthly average. Average difference from normal or target level is the arithmetic average of reported month-end values for the period of record indicated.Yearsofrecord=totalnumberofmonthlyreadingsincludedinmonth-endaverage.Totalperiodofrecordmaybelonger.NotPWS=notapublicwatersupply.N/A = not available.(1) Target operating level may vary. Seasonal target levels this month represent February 1 values.(2) Instrumentation not available to measure height of water elevation above spillway.(3)Naturalinflowcanbesupplementedbyothersources.(4) Normal pool elevations have changed during period of record reported.

11
Table 6. Month-End Shallow Groundwater Level Data Sites, January 2018
Deviation from
Number Well name CountyWell depth
(feet)This month’s reading (depth to water, feet)
15-year avg. level (feet)
Period of record avg. (feet)
Previousmonth (feet)
Previousyear (feet)
1 Galena JoDaviess 25.00 21.38 -0.16 +0.23 -0.02 -1.35 2 Mt. Morris Ogle 55.00 20.81 +0.03 -0.86 NA -3.79 3 Crystal Lake McHenry 18.00 3.59 +1.35 +1.76 +0.25 +0.05 4 Fermi Lab DuPage 17.00 4.84 +0.93 +1.30 +3.00 +0.17 5 Good Hope McDonough 30.00 10.52 -3.51 -2.51 +0.25 -4.04 6 Snicarte Mason 42.00 34.43 +2.81 +2.84 -0.03 +1.28 7 Coffman Pike 28.00 16.60 -4.59 -3.87 NA NA 8 Greenfield Greene 20.70 19.31 -6.38 -7.58 -0.36 -5.21 9 Janesville Coles 11.00 4.99 -0.11 +0.05 +0.87 -0.17 10 St. Peter Fayette 15.00 5.13 -3.29 -3.12 NA -3.44 11 SWS#2 St. Clair 80.00 16.74 -3.39 -1.97 +0.21 -5.27 12 Boyleston Wayne 23.00 6.06 -2.64 -2.87 +1.38 -1.23 13 Sparta Randolph 27.00 8.46 -2.97 -1.55 +1.06 NA 14 SE College Saline 11.00 6.44 -3.43 -3.60 +1.85 -4.15 15 Bondville Champaign 21.00 4.21 -0.69 -0.49 +1.29 -1.04
Averages -1.74 -1.48 +0.81 -2.17_______________Notes:N/A = Data not available.
month. Levels averaged 0.8 feet above and ranged from 0.4 feet below to 3.0 feet above levels of December.
Comparison to Same Month, Previous Year. Shallow groundwater levels in January were below levels measured one year ago. Levels averaged 2.2 feet below this month and ranged from 5.2 feet below to 1.3 feet above levels of January 2017.
GROUNDWATER INFORMATION —Ken Hlinka
Comparison to Average Levels. Shallow groundwater levels in 15 observation wells, which are remote from pumping centers, were below normal for the month of January. Levels averaged 1.5 feet below and ranged from 7.6 feet below to 2.8 feet above normal levels (Table 6).
Comparison to Previous Month. Shallow groundwater levels were above those of the previous
Data sources for information in this publication include the following:CPC - Climate Prediction Center, http://www.cpc.ncep.noaa.gov/index.phpISWS - Illinois State Water Survey, http://www.isws.illinois.eduMRCC - Midwestern Regional Climate Center, http://mrcc.isws.illinois.eduNCDC - National Climatic Data Center, http://www.ncdc.noaa.govNWS - National Weather Service, http://www.nws.noaa.govUSACE - U.S. Army Corps of Engineers, http://rivergages.com, http://www.lre.usace.army.mil/greatlakes/hhUSGS - U.S. Geological Survey, http://waterdata.usgs.gov/il/nwisWARM - Water and Atmospheric Resources Monitoring Program, http://www.isws.illinois.edu/warm
IllinoisStateWaterSurvey2204GriffithDrive•Champaign,IL61820Tel(217)333-2210•www.isws.illinois.edu