Embed Size (px)
Citation preview
I L L I N O I S T O O L W O R K S I N C .
1 5 5 H A R L E M A V E N U E
G L E N V I E W , I L L I N O I S 6 0 0 2 5
W W W . I T W . C O M
2 0 1 5 A N N U A L R E P O R T
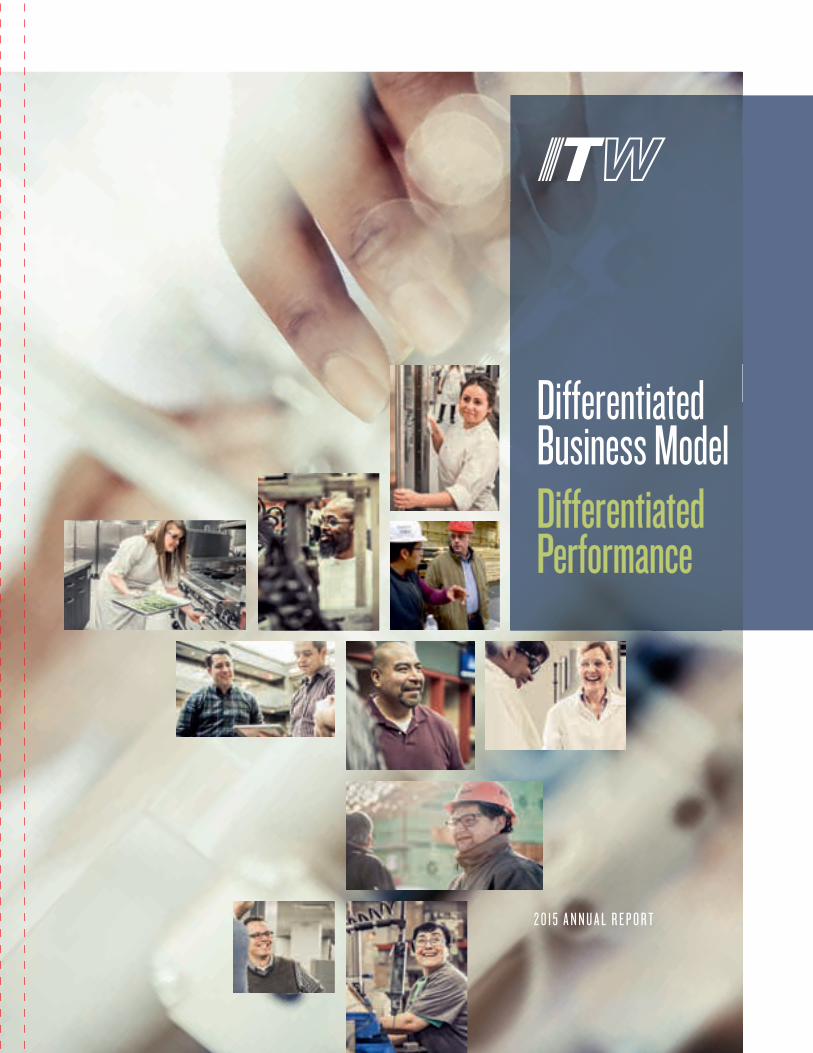
Di� erentiatedBusiness Model Di� erentiated Performance
ITW2015AR_COVER.indd 1-3 2/26/16 4:47 PM
Founded in 1912, ITW (NYSE: ITW) is a global industrial company
centered on a differentiated and proprietary business model.
The company’s seven industry-leading segments leverage the
ITW Business Model to generate solid growth with best-in-class
margins and returns in markets where highly innovative, customer-
focused solutions are required. ITW’s more than 48,000 dedicated
colleagues around the world thrive in our decentralized, entrepreneurial
culture. In 2015, the company achieved revenues of $13.4 billion,
with roughly half coming from outside North America.
To learn more, please visit www.itw.com.
1 L E T T E R T O S H A R E H O L D E R S 5 2 0 1 5 F I N A N C I A L H I G H L I G H T S A N D E N T E R P R I S E S T R A T E G Y P E R F O R M A N C E P R O G R E S S
6 I T W B U S I N E S S M O D E L 7 C U S T O M E R - B A C K I N N O V A T I O N 8 O V E R V I E W O F I T W ’ S B U S I N E S S S E G M E N T S
12 C O R P O R A T E E X E C U T I V E S A N D B O A R D O F D I R E C T O R S INSIDE BACK COVER S H A R E H O L D E R I N F O R M A T I O N
About ITW
CONTENTS
TR ANSFER AGENT AND REGISTR AR
Questions regarding stock ownership, dividend payments or change of address should be directed to the company’s transfer agent: Computershare Trust Company, N.A.P.O. Box 30170College Station, TX 77842-3170www.computershare.com/investorPhone Toll Free: 888.829.7424International: +1.312.360.5155
COMMON STOCK
New York Stock Exchange Symbol: ITW
TR ADEMARKS
Certain trademarks in this publication are owned or licensed by Illinois Tool Works Inc. or its wholly owned subsidiaries.
CONTACT INVESTOR REL ATIONS
For additional assistance, including media inquiries: 224.661.7427 or [email protected]
VISIT US ON THE WEB
www.itw.com
COMMIT TED TO SOCIAL RESPONSIBIL IT Y
Learn about our CSR activities and goals in our 2015 report:workingtogether.itw-csr.com
STOCK AND DIV IDEND ACTION
Effective with the October 6, 2015 payment, the quarterly cash dividend on ITW common stock was increased to 55 cents per share. ITW’s annual dividend payment has increased for more than 50 consecutive years, except during a period of government controls in 1971.
The ITW Common Stock Dividend Reinvestment Plan enables registered shareholders to reinvest the ITW dividends they receive in additional shares of common stock of the company at no additional cost. Participation in the plan is voluntary, and shareholders may join or withdraw at any time. The plan also allows for additional voluntary cash investments in any amount from $100 to $10,000 per month. For a brochure and full details of the program, please direct inquiries to the company’s transfer agent, Computershare Trust Company, N.A.
Friday, May 6, 2016, 9:00 a.m.Illinois Tool Works Inc.155 Harlem AvenueGlenview, Illinois 60025
ANNUAL MEETING
The patent wall at ITW’s corporate headquarters displays a subset of our more than 16,000 patents.
SHAREHOLDER INFORMATION
ITW2015AR_COVER.indd 4-6 2/26/16 4:46 PM
espite a challenging macro-economic environment,
we grew earnings per share 10 percent, 19 percent
excluding the impact of foreign currency translation.
We improved operating margin by 150 basis
points to an all-time high of 21.4 percent and
increased after-tax return on invested capital to
a record 20.4 percent. Once again in 2015, ITW
generated strong free cash � ow, which we utilized to support
the reinvestment of approximately $560 million in our core
businesses for growth and productivity. In addition, we were
able to return more than $2.7 billion of surplus capital to our
shareholders through dividends and share repurchases.
Differentiated Business Model =
Differentiated Performance
ITW is built around a set of highly powerful and proprietary
business practices and capabilities that we refer to as the
ITW Business Model. (A description of the elements of
the ITW Business Model can be found on page 6.) The ITW
Business Model is the source of our competitive advantage.
It drives our ability to win with customers and deliver
differentiated long-term returns for our shareholders. It
is ITW’s “secret sauce,” and through the execution of our
Enterprise Strategy, we are focused on leveraging it to its full
potential. By doing so, we are positioning the company to
deliver solid growth with best-in-class margins and returns
on capital … consistently and sustainably. The strong results
that we delivered in 2015 and the signi� cant progress we have
made since the launch of our Enterprise Strategy in 2012
give us con� dence that we are on the right track.
Best-in-Class Margins and Returns on Capital
We believe that operating margin is a key indicator of both
the magnitude of a company’s competitive advantages and
the ef� ciency with which it leverages them. It is, in our view,
a compelling indicator of the strength and competitiveness of
our company, and it is a key performance metric for every ITW
business. Through the execution of our Enterprise Strategy,
ITW’s operating margin has increased by over 500 basis
points over the past three years.
Another important metric that is central to how we run ITW
is after-tax return on invested capital. We believe that ITW’s
robust returns on capital are a meaningful indicator of our
highly disciplined approach to the choices we make when
investing our shareholders’ capital. At ITW, disciplined capital
allocation means that (1) we invest capital only in areas of
opportunity where we have the potential to leverage the
ITW Business Model to create compelling and sustainable
competitive advantage, and (2) we choose to return surplus
capital to our shareholders, through a combination of an
attractive dividend and an active share repurchase program,
rather than pursue lower-return opportunities that reside
outside our core strengths and competitive advantages.
As a result, ITW’s after-tax return on invested capital has
increased by over 500 basis points since the launch of our
Enterprise Strategy.
Solid Growth
We believe that solid and consistent above-market organic
growth must be the core growth engine that drives our
company forward. Our goal is to achieve enterprise-level
organic growth of 200 basis points or more above market
by the end of 2017 and beyond. Over the course of the past
three years, we have made signi� cant progress in executing
a multistep process to position the company to deliver on
this key Enterprise Strategy objective.
ITW delivered another year of strong financial performance in 2015.
I L L I N O I S T O O L W O R K S I N C . 1
TO OUR FELLOW SHAREHOLDERS
ITW2015AR_TEXT.indd 1 2/24/16 2:02 PM
2 2 0 1 5 A N N U A L R E P O R T
Step 1 > Align Our Portfolio with
Our Organic Growth Focus
(2013-2016)
We have repositioned our business portfolio by exiting
businesses operating in low-growth commoditized markets.
As a result, ITW is now focused on seven core segments that
each have strong sustainable competitive advantages and
favorable long-term growth fundamentals. An overview of
these seven industry-leading businesses can be found on
pages 8 to 11.
ITW’s current business portfolio is both highly pro� table and
highly diversi� ed. We are very well balanced in terms of our
end-market and geographic exposures. As a result, ITW is
well-positioned to perform at a high level across a wide range
of external market conditions and economic scenarios. Our
diversi� ed portfolio, best-in-class operating margins and
proven track record of strong cash generation through the
cycle give us the ability to weather any economic storm and
continue to invest for the long term.
After executing more than 30 divestitures over the past
few years, we are now in the � nal stages of our portfolio
repositioning efforts as our businesses complete the process
of exiting slower-growth product lines and begin to transition
their focus to accelerating organic growth.
Step 2 > Scale-Up Our Operating Structure
(2013-2014)
We have scaled-up our operating structure in order to
better leverage and focus our organic growth investments
and resources and to improve the global reach and
competitiveness of our businesses. By consolidating over
800 regional business units into 84 global divisions, we
have made ITW a much simpler, more focused and more
growth-enabled company.
Step 3 > Prepare for Accelerated Organic Growth
(2014-2016)
Delivering high-quality revenue growth consistently and
sustainably requires a strong foundation of operational and
� nancial performance. All ITW businesses must demonstrate
that they are serving their existing customers with excellence
and delivering acceptable � nancial performance for the
company before they are deemed to be “ready to grow.”
Through the reapplication of ITW’s 80/20 management
process at all of our 84 scaled-up global divisions, we are
ensuring that every one of our businesses is in the best
position possible to fully leverage its growth investments
and long-term growth potential.
In 2015, 60 percent of our businesses achieved “ready to
grow” status and 45 percent grew organic revenue at an
average of 6 percent despite a very challenging external
economic environment. We are encouraged by these results,
and we expect to have 85 percent or more of our businesses
in “ready to grow” status by the end of 2016.
Step 4 > Accelerate Organic Growth
(2016+)
In 2016, we expect to deliver meaningful progress on our
path to accelerated organic growth and our long-term
organic growth goal of 200 basis points or more above
market. Through our signi� cantly more differentiated
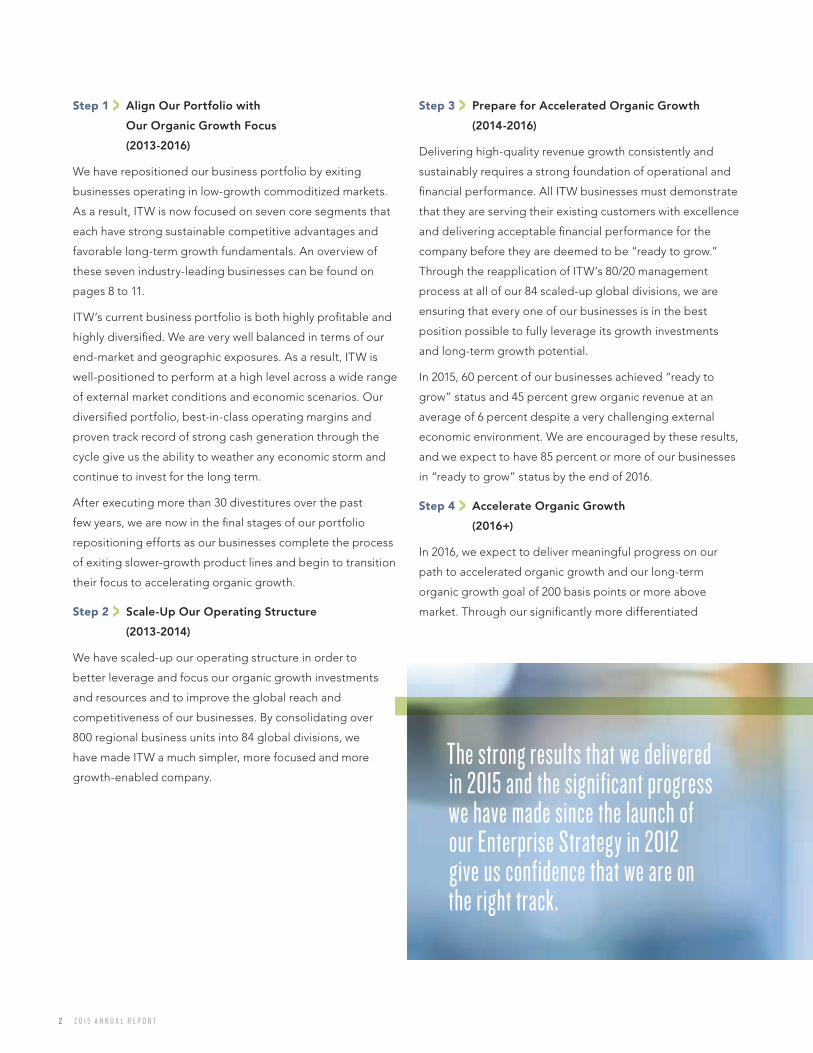
The strong results that we delivered in 2015 and the significant progress we have made since the launch of our Enterprise Strategy in 2012 give us confidence that we are on the right track.
ITW2015AR_TEXT.indd 2 2/26/16 5:01 PM
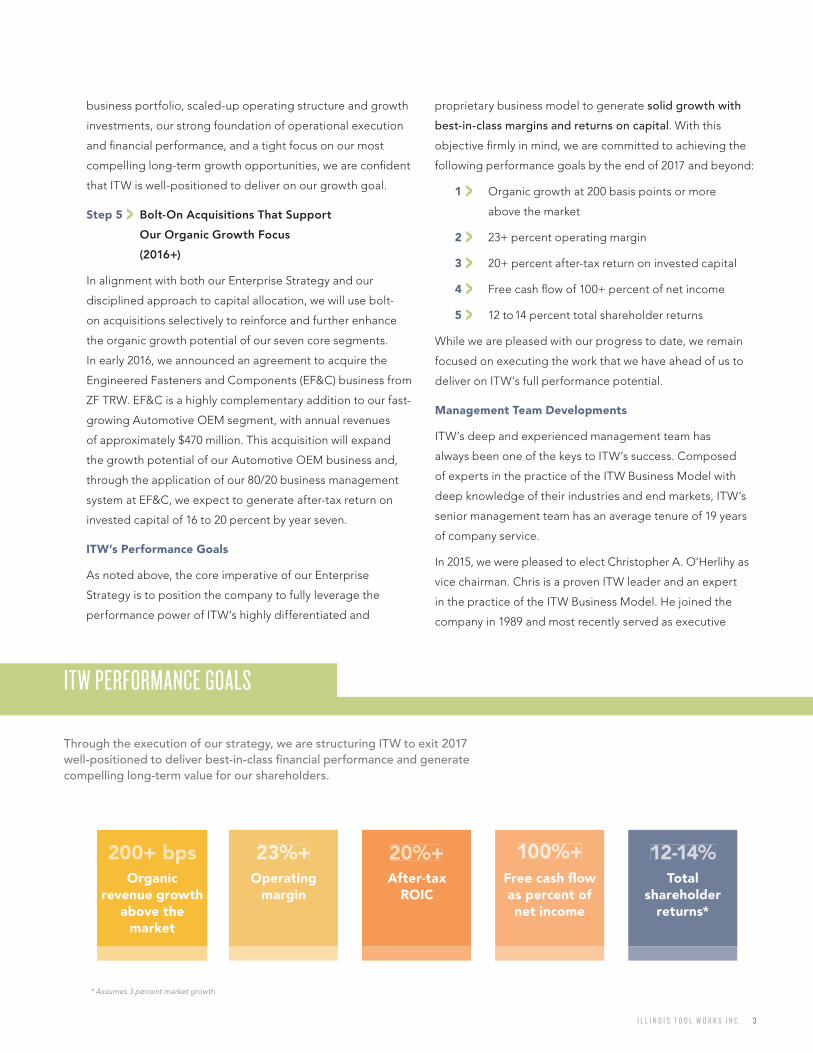
20%+After-tax
ROICTotal
shareholder returns*
12-14%100%+Free cash � ow as percent of net income
200+ bpsOrganic
revenue growth above the
market
Operating margin
23%+
business portfolio, scaled-up operating structure and growth
investments, our strong foundation of operational execution
and � nancial performance, and a tight focus on our most
compelling long-term growth opportunities, we are con� dent
that ITW is well-positioned to deliver on our growth goal.
Step 5 > Bolt-On Acquisitions That Support
Our Organic Growth Focus
(2016+)
In alignment with both our Enterprise Strategy and our
disciplined approach to capital allocation, we will use bolt-
on acquisitions selectively to reinforce and further enhance
the organic growth potential of our seven core segments.
In early 2016, we announced an agreement to acquire the
Engineered Fasteners and Components (EF&C) business from
ZF TRW. EF&C is a highly complementary addition to our fast-
growing Automotive OEM segment, with annual revenues
of approximately $470 million. This acquisition will expand
the growth potential of our Automotive OEM business and,
through the application of our 80/20 business management
system at EF&C, we expect to generate after-tax return on
invested capital of 16 to 20 percent by year seven.
ITW’s Performance Goals
As noted above, the core imperative of our Enterprise
Strategy is to position the company to fully leverage the
performance power of ITW’s highly differentiated and
proprietary business model to generate solid growth with
best-in-class margins and returns on capital. With this
objective � rmly in mind, we are committed to achieving the
following performance goals by the end of 2017 and beyond:
1 > Organic growth at 200 basis points or more
above the market
2 > 23+ percent operating margin
3 > 20+ percent after-tax return on invested capital
4 > Free cash � ow of 100+ percent of net income
5 > 12 to 14 percent total shareholder returns
While we are pleased with our progress to date, we remain
focused on executing the work that we have ahead of us to
deliver on ITW’s full performance potential.
Management Team Developments
ITW’s deep and experienced management team has
always been one of the keys to ITW’s success. Composed
of experts in the practice of the ITW Business Model with
deep knowledge of their industries and end markets, ITW’s
senior management team has an average tenure of 19 years
of company service.
In 2015, we were pleased to elect Christopher A. O’Herlihy as
vice chairman. Chris is a proven ITW leader and an expert
in the practice of the ITW Business Model. He joined the
company in 1989 and most recently served as executive
I L L I N O I S T O O L W O R K S I N C . 3
Through the execution of our strategy, we are structuring ITW to exit 2017 well-positioned to deliver best-in-class � nancial performance and generate compelling long-term value for our shareholders.
* Assumes 3 percent market growth
ITW PERFORMANCE GOALS
ITW2015AR_TEXT.indd 3 2/26/16 5:01 PM
4 2 0 1 5 A N N U A L R E P O R T
vice president of our Food Equipment segment. In addition,
we welcomed two seasoned ITW leaders to our executive
leadership team: Dr. Lei Zhang Schlitz as executive vice
president of our Food Equipment segment and Michael R.
Zimmerman as executive vice president of our Construction
Products segment.
We would also like to recognize two members of our Board
of Directors, Don H. Davis, Jr. and Robert C. McCormack,
who both retired in 2015 after serving on our Board for
15 and 31 years, respectively. We thank them for their
valuable insights and many contributions to the company
and our Board.
Closing Remarks
In 2015, we took another solid step forward in positioning
ITW to deliver solid growth with best-in-class margins
and returns, and we remain �rmly on track to achieve our
enterprise performance goals by the end of 2017. For that,
we offer our deepest thanks to our more than 48,000 ITW
colleagues around the world who, through their hard work
and dedication, continue to serve our customers and
execute our Enterprise Strategy with excellence.
Lastly, on behalf of your Board of Directors, your management
team and all of us at ITW, we thank you, our shareholders,
for your continued support.
Sincerely,
E. Scott Santi
Chairman & Chief Executive Of�cer
Christopher A. O’Herlihy
Vice Chairman
David C. Parry
Vice Chairman
March 23, 2016
Christopher A. O’Herlihy E. Scott Santi David C. Parry
ITW2015AR_TEXT.indd 4 2/26/16 5:01 PM
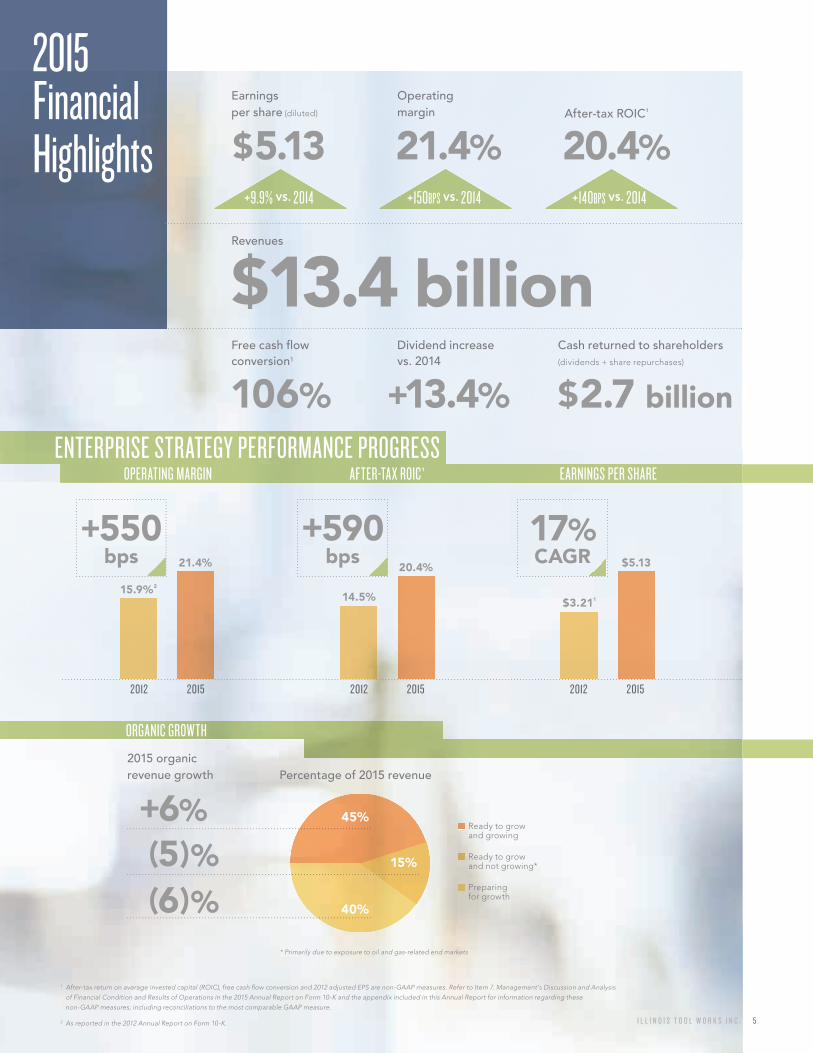
2015Financial Highlights
Earnings per share (diluted)
Operating margin After-tax ROIC1
$5.13 20.4%
AFTER-TAX ROIC1OPERATING MARGIN
+9.9% VS. 2014 +150BPS VS. 2014 +140BPS VS. 2014
Revenues
$13.4 billionFree cash � ow conversion1
Dividend increase vs. 2014
Cash returned to shareholders(dividends + share repurchases)
106% +13.4% $2.7 billion
EARNINGS PER SHARE
I L L I N O I S T O O L W O R K S I N C . 5
21.4%
40%
15%
45%Ready to grow and growing
Ready to grow and not growing*
Preparing for growth
+6%(5)%(6)%
15.9%2
21.4%
2012 2015
+550 bps
Percentage of 2015 revenue
$3.211
$5.13
17% CAGR
2015 organic revenue growth
1 After-tax return on average invested capital (ROIC), free cash � ow conversion and 2012 adjusted EPS are non-GAAP measures. Refer to Item 7. Management’s Discussion and Analysis of Financial Condition and Results of Operations in the 2015 Annual Report on Form 10-K and the appendix included in this Annual Report for information regarding these non-GAAP measures, including reconciliations to the most comparable GAAP measure.
2 As reported in the 2012 Annual Report on Form 10-K.
* Primarily due to exposure to oil and gas-related end markets
14.5%
20.4%
+590 bps
2012 2015 2012 2015
ENTERPRISE STRATEGY PERFORMANCE PROGRESS
ORGANIC GROWTH
ITW2015AR_TEXT.indd 5 2/24/16 2:02 PM
6 2 0 1 5 A N N U A L R E P O R T
Di� erentiated
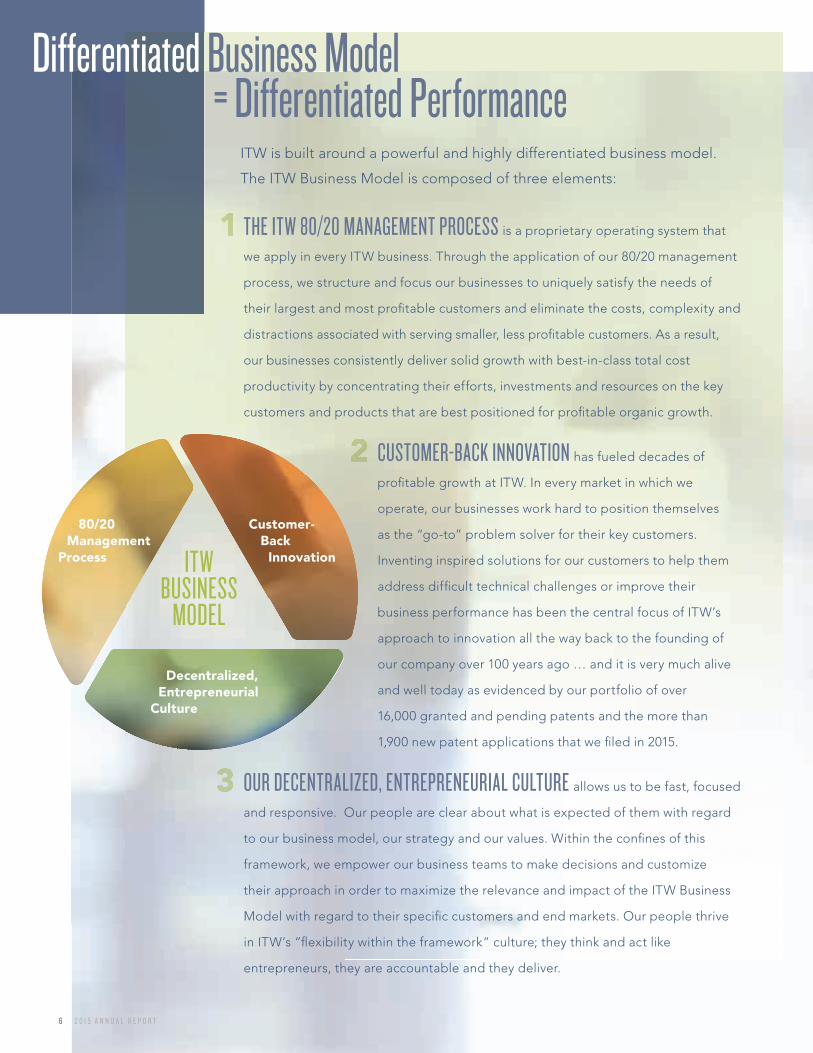
ITW is built around a powerful and highly differentiated business model.
The ITW Business Model is composed of three elements:
THE ITW 80/20 MANAGEMENT PROCESS is a proprietary operating system that
we apply in every ITW business. Through the application of our 80/20 management
process, we structure and focus our businesses to uniquely satisfy the needs of
their largest and most pro� table customers and eliminate the costs, complexity and
distractions associated with serving smaller, less pro� table customers. As a result,
our businesses consistently deliver solid growth with best-in-class total cost
productivity by concentrating their efforts, investments and resources on the key
customers and products that are best positioned for pro� table organic growth.
CUSTOMER-BACK INNOVATION has fueled decades of
pro� table growth at ITW. In every market in which we
operate, our businesses work hard to position themselves
as the “go-to” problem solver for their key customers.
Inventing inspired solutions for our customers to help them
address dif� cult technical challenges or improve their
business performance has been the central focus of ITW’s
approach to innovation all the way back to the founding of
our company over 100 years ago … and it is very much alive
and well today as evidenced by our portfolio of over
16,000 granted and pending patents and the more than
1,900 new patent applications that we � led in 2015.
OUR DECENTRALIZED, ENTREPRENEURIAL CULTURE allows us to be fast, focused
and responsive. Our people are clear about what is expected of them with regard
to our business model, our strategy and our values. Within the con� nes of this
framework, we empower our business teams to make decisions and customize
their approach in order to maximize the relevance and impact of the ITW Business
Model with regard to their speci� c customers and end markets. Our people thrive
in ITW’s “� exibility within the framework” culture; they think and act like
entrepreneurs, they are accountable and they deliver.
ITW BUSINESS
MODEL
80/20 Management Process
Customer- Back Innovation
Decentralized, EntrepreneurialCulture
Business Model = Di� erentiated Performance
ITW2015AR_TEXT.indd 6 2/26/16 5:01 PM
I L L I N O I S T O O L W O R K S I N C . 7
Driving Organic
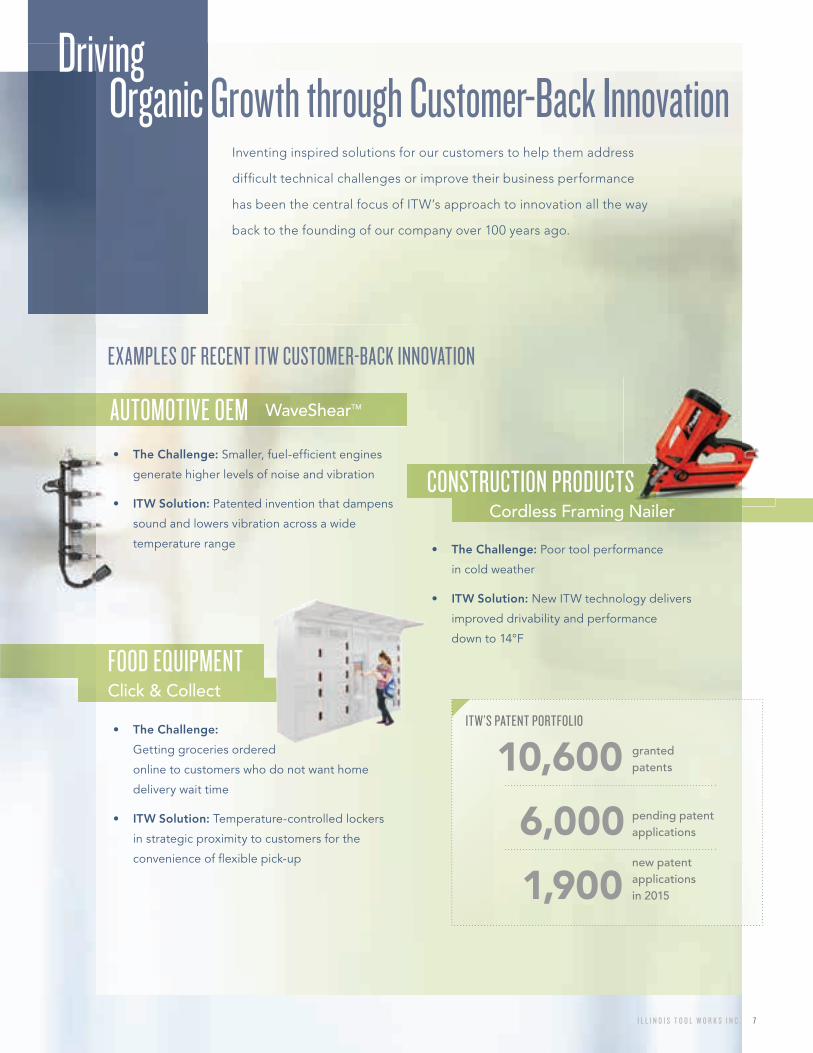
AUTOMOTIVE OEM WaveShearTM
Inventing inspired solutions for our customers to help them address
dif� cult technical challenges or improve their business performance
has been the central focus of ITW’s approach to innovation all the way
back to the founding of our company over 100 years ago.
EXAMPLES OF RECENT ITW CUSTOMER-BACK INNOVATION
Click & Collect
granted patents
pending patent applications
new patent applications in 2015
10,600
6,000
1,900
ITW’S PATENT PORTFOLIO
• The Challenge: Smaller, fuel-ef� cient engines
generate higher levels of noise and vibration
• ITW Solution: Patented invention that dampens
sound and lowers vibration across a wide
temperature range
• The Challenge:
Getting groceries ordered
online to customers who do not want home
delivery wait time
• ITW Solution: Temperature-controlled lockers
in strategic proximity to customers for the
convenience of � exible pick-up
• The Challenge: Poor tool performance
in cold weather
• ITW Solution: New ITW technology delivers
improved drivability and performance
down to 14°F
CONSTRUCTION PRODUCTSCordless Framing Nailer
FOOD EQUIPMENT
Growth through Customer-Back Innovation
ITW2015AR_TEXT.indd 7 2/24/16 2:03 PM
8 2 0 1 5 A N N U A L R E P O R T
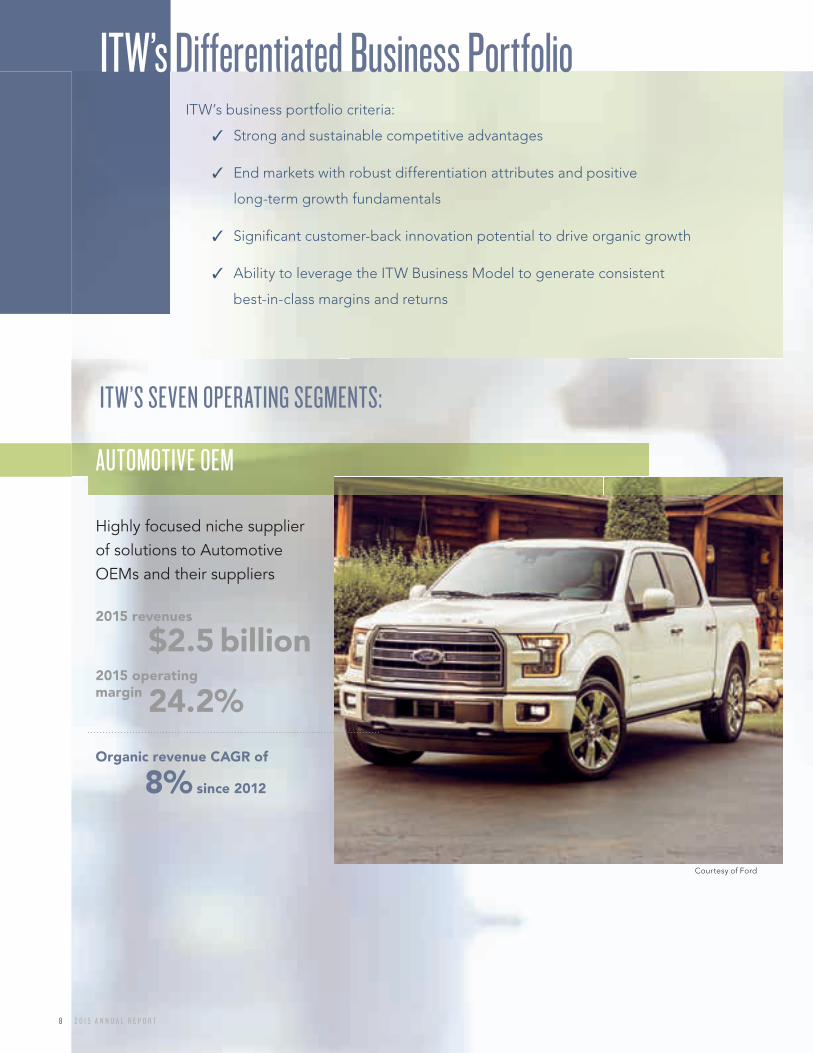
ITW’sITW’s business portfolio criteria:
� Strong and sustainable competitive advantages
� End markets with robust differentiation attributes and positive
long-term growth fundamentals
� Signi� cant customer-back innovation potential to drive organic growth
� Ability to leverage the ITW Business Model to generate consistent
best-in-class margins and returns
Courtesy of Ford
H i g h l y f o c u s e d n i c h e s u p p l i e r o f s o l u t i o n s t o A u t o m o t i v e O E M s a n d t h e i r s u p p l i e r s
2015 revenues
$2.5 billion2015 operating margin 24.2%
Organic revenue CAGR of
8% since 2012
ITW’S SEVEN OPERATING SEGMENTS:
AUTOMOTIVE OEM
Di� erentiated Business Portfolio
ITW2015AR_TEXT.indd 8 2/24/16 2:03 PM
I L L I N O I S T O O L W O R K S I N C . 9
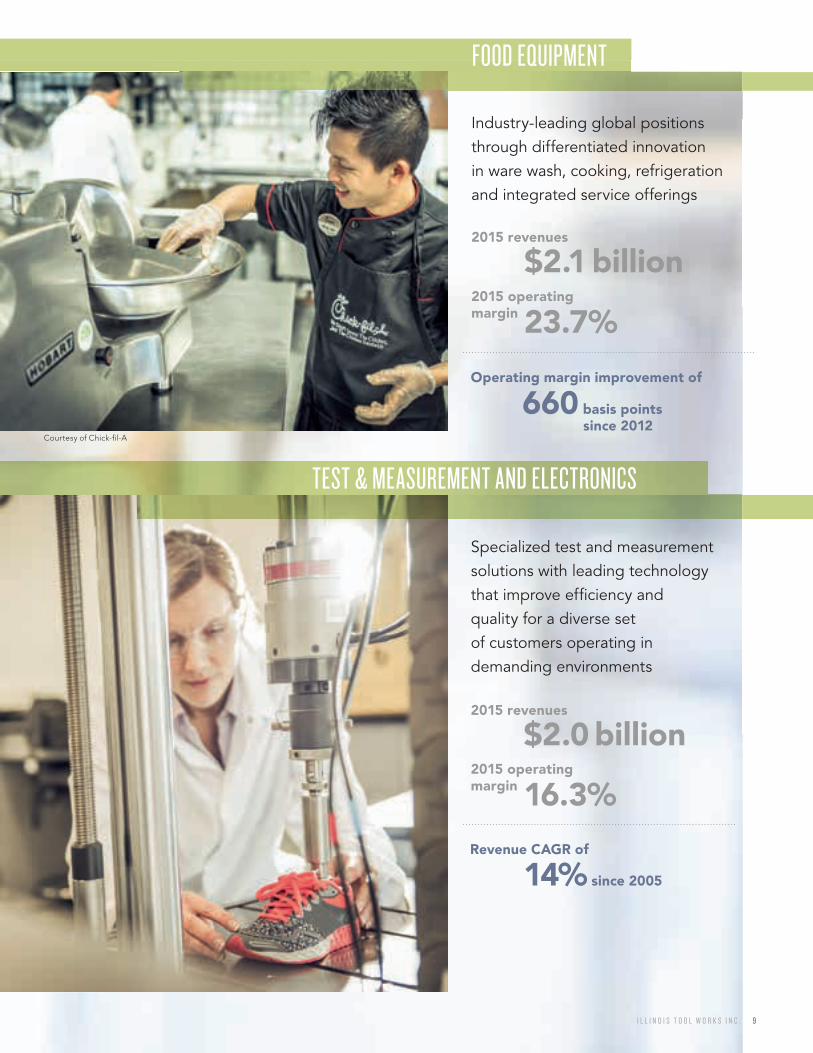
Courtesy of Chick-� l-A
Industry-leading global positions through differentiated innovation in ware wash, cooking, refrigeration and integrated service offerings
2015 revenues
$2.1 billion2015 operating margin 23.7%
Operating margin improvement of
660 basis points since 2012
Specialized test and measurement solutions with leading technology that improve ef� ciency and quality for a diverse set of customers operating in demanding environments
2015 revenues
$2.0 billion2015 operating margin 16.3%
Revenue CAGR of
14% since 2005
TEST & MEASUREMENT AND ELECTRONICS
FOOD EQUIPMENT
ITW2015AR_TEXT.indd 9 2/24/16 2:03 PM
1 0 2 0 1 5 A N N U A L R E P O R T
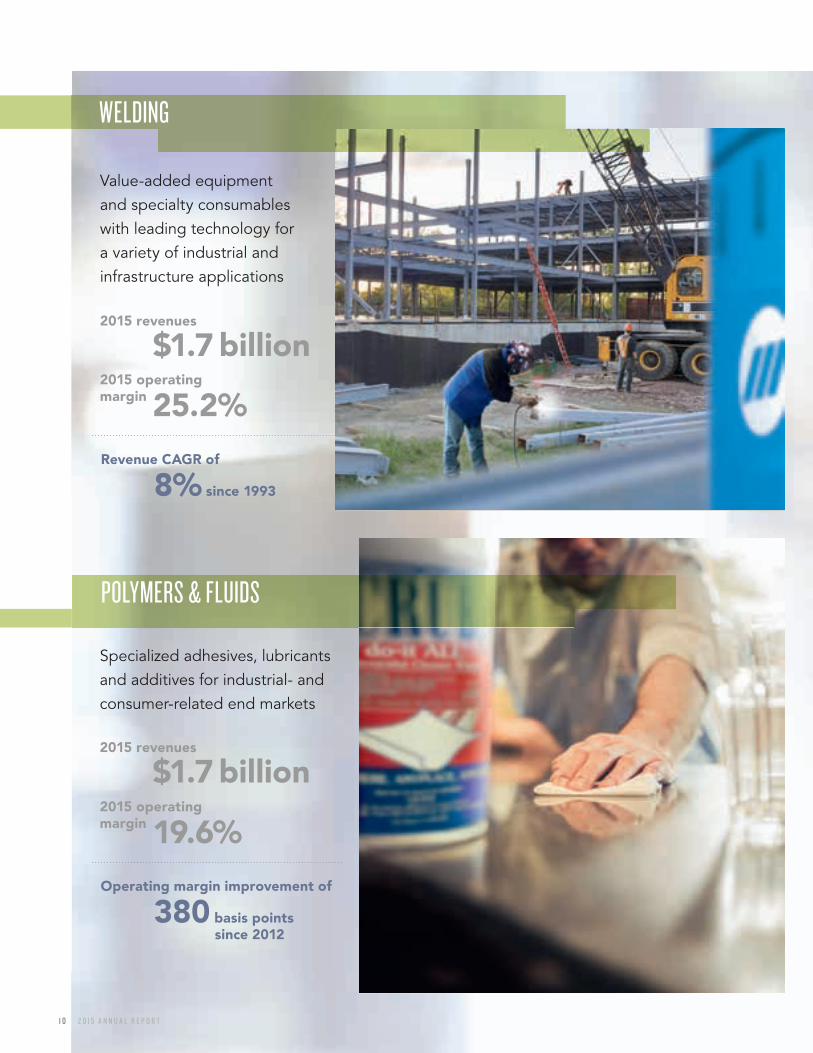
S p e c i a l i z e d a d h e s i v e s , l u b r i c a n t s a n d a d d i t i v e s f o r i n d u s t r i a l - a n d c o n s u m e r - r e l a t e d e n d m a r k e t s
2015 revenues
$1.7 billion2015 operating margin 19.6%Operating margin improvement of
380 basis points since 2012
2015 revenues
$1.7 billion2015 operating margin 25.2%
V a l u e - a d d e d e q u i p m e n t a n d s p e c i a l t y c o n s u m a b l e s w i t h l e a d i n g t e c h n o l o g y f o r a v a r i e t y o f i n d u s t r i a l a n d i n f r a s t r u c t u r e a p p l i c a t i o n s
Revenue CAGR of
8% since 1993
POLYMERS & FLUIDS
WELDING
ITW2015AR_TEXT.indd 10 2/26/16 5:02 PM
I L L I N O I S T O O L W O R K S I N C . 1 1
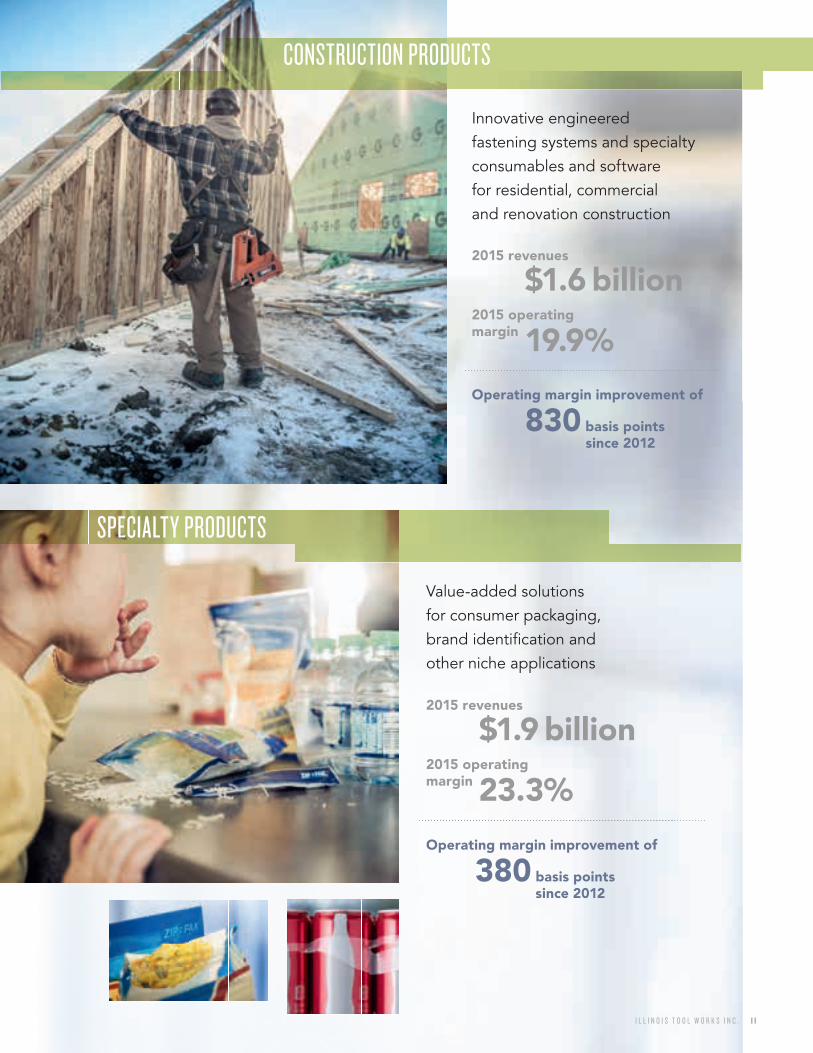
Operating margin improvement of
830 basis points since 2012
Innovative engineered fastening systems and specialty consumables and software for residential, commercial and renovation construction
2015 revenues
$1.6 billion2015 operating margin 19.9%
Value-added solutions for consumer packaging, brand identi� cation and other niche applications
2015 revenues
$1.9 billion2015 operating margin 23.3%
Operating margin improvement of
380 basis points since 2012
CONSTRUCTION PRODUCTS
SPECIALTY PRODUCTS
ITW2015AR_TEXT.indd 11 2/26/16 5:02 PM

1 2 2 0 1 5 A N N U A L R E P O R T
Daniel J. BruttoRetired Senior Vice President, United Parcel Service, Inc.Retired President,UPS International
Susan CrownChairman & Chief Executive Of� cer,Owl Creek Partners, LLC
James W. Grif� thRetired President & Chief Executive Of� cer,The Timken Company
Richard H. LennyNon-Executive Chairman,Information Resources, Inc.
Robert S. Morrison, Lead DirectorRetired Vice Chairman,PepsiCo, Inc.Retired Chairman, President & Chief Executive Of� cer,The Quaker Oats Company
E. Scott SantiChairman & Chief Executive Of� cer,Illinois Tool Works Inc.
James A. SkinnerRetired Vice Chairman & Chief Executive Of� cer,McDonald’s Corporation
David B. Smith, Jr.Executive Vice President for Policy & Legal Affairs and General Counsel,Mutual Fund Directors Forum
Pamela B. StrobelRetired Executive Vice President &Chief Administrative Of� cer,Exelon Corporation
Kevin M. WarrenPresident, Commercial Business Group,Xerox Corporation
Anré D. WilliamsPresident, Global Merchant Services & Loyalty Group,American Express Company
E. Scott SantiChairman & Chief Executive Of� cer
Christopher A. O’HerlihyVice Chairman
David C. ParryVice Chairman
Michael M. LarsenSenior Vice President & Chief Financial Of� cer
Mary K. LawlerSenior Vice President & Chief Human Resources Of� cer
John R. HartnettExecutive Vice President, Welding
Roland M. MartelExecutive Vice President, Specialty Products
Steven L. MartindaleExecutive Vice President, Test & Measurement and Electronics
Sundaram NagarajanExecutive Vice President, Automotive OEM
Lei Zhang SchlitzExecutive Vice President, Food Equipment
Juan VallsExecutive Vice President, Polymers & Fluids
Michael R. ZimmermanExecutive Vice President,Construction Products
Juan Valls, Steven L. Martindale, Sundaram Nagarajan, Roland M. Martel, John R. Hartnett, Mary K. Lawler, David C. Parry, E. Scott Santi, Christopher A. O’Herlihy, Michael M. Larsen, Michael R. Zimmerman, Lei Zhang Schlitz
PICTURED
LEFT TO RIGHT:
BOARD OF DIRECTORS
CORPORATE EXECUTIVES
ITW2015AR_TEXT.indd 12 2/29/16 6:35 PM
UNITED STATES SECURITIES AND EXCHANGE COMMISSIONWASHINGTON, D.C. 20549
FORM 10-KANNUAL REPORT PURSUANT TO SECTION 13 OR 15(d) OF THE SECURITIES EXCHANGE ACT OF 1934
For the fiscal year ended December 31, 2015OR
TRANSITION REPORT PURSUANT TO SECTION 13 OR 15(d) OF THE SECURITIES EXCHANGE ACT OF 1934
For the transition period from to
Commission file number 1-4797
ILLINOIS TOOL WORKS INC.(Exact Name of Registrant as Specified in its Charter)
Delaware 36-1258310(State or Other Jurisdiction ofIncorporation or Organization)
(I.R.S. EmployerIdentification No.)
155 Harlem Avenue, Glenview, Illinois 60025(Address of Principal Executive Offices) (Zip Code)
Registrant’s telephone number, including area code: (847) 724-7500Securities registered pursuant to Section 12(b) of the Act:
Title of Each Class Name of Each Exchange on Which RegisteredCommon Stock New York Stock Exchange
1.75% Euro Notes due 2022 New York Stock Exchange1.25% Euro Notes due 2023 New York Stock Exchange2.125% Euro Notes due 2030 New York Stock Exchange3.00% Euro Notes due 2034 New York Stock Exchange
Securities registered pursuant to Section 12(g) of the Act: NoneIndicate by check mark if the registrant is a well-known seasoned issuer, as defined in Rule 405 of the Securities Act.
Yes No Indicate by check mark if the registrant is not required to file reports pursuant to Section 13 or Section 15(d) of the Act.
Yes No Indicate by check mark whether the registrant (1) has filed all reports required to be filed by Section 13 or 15(d) of the Securities Exchange Act of 1934 during the preceding 12 months (or for such shorter period that the registrant was required to file such reports), and (2) has been subject to such filing requirements for the past 90 days.
Yes No Indicate by check mark whether the registrant has submitted electronically and posted on its corporate Web site, if any, every Interactive Data File required to be submitted and posted pursuant to Rule 405 of Regulation S-T during the preceding 12 months (or for such shorter period that the registrant was required to submit and post such files).
Yes No Indicate by check mark if disclosure of delinquent filers pursuant to Item 405 of Regulation S-K is not contained herein, and will not be contained, to the best of registrant’s knowledge, in definitive proxy or information statements incorporated by reference in Part III of this Form 10-K or any amendment to this Form 10-K.
Indicate by check mark whether the registrant is a large accelerated filer, an accelerated filer, a non-accelerated filer or a smaller reporting company. See the definitions of "large accelerated filer," "accelerated filer" and "smaller reporting company" in Rule 12b-2 of the Exchange Act. (Check one):
Large accelerated filer Accelerated filer
Non-accelerated filer (Do not check if a smaller reporting company) Smaller reporting company
Indicate by check mark whether the registrant is a shell company (as defined in Rule 12b-2 of the Exchange Act).Yes No
The aggregate market value of the voting stock held by non-affiliates of the registrant as of June 30, 2015 was approximately $26.7 billion based on the New York Stock Exchange closing sales price as of June 30, 2015.
Shares of Common Stock outstanding at January 31, 2016: 363,766,897.Documents Incorporated by Reference
Portions of the 2016 Proxy Statement for Annual Meeting of Stockholders to be held on May 6, 2016. Part III
Table of Contents
PART IItem 1. BusinessItem 1A. Risk FactorsItem 1B. Unresolved Staff CommentsItem 2. PropertiesItem 3. Legal ProceedingsItem 4. Mine Safety Disclosures
PART IIItem 5. Market for Registrant’s Common Equity, Related Stockholder Matters and Issuer Purchases of
Equity SecuritiesItem 6. Selected Financial DataItem 7. Management's Discussion and Analysis of Financial Condition and Results of OperationsItem 7A. Quantitative and Qualitative Disclosures About Market RiskItem 8. Financial Statements and Supplementary DataItem 9. Changes in and Disagreements With Accountants on Accounting and Financial DisclosureItem 9A. Controls and ProceduresItem 9B. Other Information
PART IIIItem 10. Directors, Executive Officers and Corporate GovernanceItem 11. Executive CompensationItem 12. Security Ownership of Certain Beneficial Owners and Management and Related Stockholder
MattersItem 13. Certain Relationships and Related Transactions, and Director IndependenceItem 14. Principal Accounting Fees and Services
PART IVItem 15. Exhibits and Financial Statement Schedules
SignaturesExhibit Index
31014141414
15
16183940717171
727272
7272
73
7475
3
PART I
ITEM 1. Business
General
Illinois Tool Works Inc. (the "Company" or "ITW") was founded in 1912 and incorporated in 1915. The Company's ticker symbol is ITW. The Company is a global manufacturer of a diversified range of industrial products and equipment with 84divisions in 57 countries. As of December 31, 2015, the Company employed approximately 48,000 persons.
The Company's operations are organized and managed based on similar product offerings and similar end markets, and are reported to senior management as the following seven segments: Automotive OEM; Test & Measurement and Electronics; Food Equipment; Polymers & Fluids; Welding; Construction Products; and Specialty Products. The following is a description of the Company's seven segments:
Automotive OEM: This segment is a global, niche supplier to top tier OEMs, providing unique innovation to address pain points for sophisticated customers with complex problems. Businesses in this segment produce components and fasteners for automotive-related applications. This segment primarily serves the automotive original equipment manufacturers and tiers market. Products in this segment include:
• plastic and metal components, fasteners and assemblies for automobiles, light trucks and other industrial uses.
Test & Measurement and Electronics: This segment is a branded and innovative producer of test and measurement and electronic manufacturing and maintenance, repair, and operations, or "MRO" solutions that improve efficiency and quality for customers in diverse end markets. Businesses in this segment produce equipment, consumables, and related software for testing and measuring of materials and structures, as well as equipment and consumables used in the production of electronic subassemblies and microelectronics. This segment primarily serves the electronics, general industrial, industrial capital goods, automotive original equipment manufacturers and tiers, and consumer durables markets. Products in this segment include:
• equipment, consumables, and related software for testing and measuring of materials, structures, gases and fluids;• electronic assembly equipment and related consumable solder materials;• electronic components and component packaging;• static control equipment and consumables used for contamination control in clean room environments; and• pressure sensitive adhesives and components for telecommunications, electronics, medical and transportation
applications.
Food Equipment: This segment is a highly focused and branded industry-leader in commercial food equipment differentiatedby innovation and integrated service offerings. This segment primarily serves the food institutional/restaurant, food service and food retail markets. Products in this segment include:
• warewashing equipment;• cooking equipment, including ovens, ranges and broilers;• refrigeration equipment, including refrigerators, freezers and prep tables;• food processing equipment, including slicers, mixers and scales;• kitchen exhaust, ventilation and pollution control systems; and• food equipment service, maintenance and repair.
Polymers & Fluids: This segment is a highly branded supplier to niche markets that require value-added, differentiatedproducts. Businesses in this segment produce adhesives, sealants, lubrication and cutting fluids, and fluids and polymers for auto aftermarket maintenance and appearance. This segment primarily serves the automotive aftermarket, general industrial, MRO, and construction markets. Products in this segment include:
• adhesives for industrial, construction and consumer purposes;• chemical fluids which clean or add lubrication to machines;• epoxy and resin-based coating products for industrial applications;• hand wipes and cleaners for industrial applications;• fluids, polymers and other supplies for auto aftermarket maintenance and appearance;• fillers and putties for auto body repair; and
4
• polyester coatings and patch and repair products for the marine industry.
Welding: This segment is a branded value-added equipment and specialty consumable manufacturer with innovative and leading technology. Businesses in this segment produce arc welding equipment, consumables and accessories for a wide array of industrial and commercial applications. This segment primarily serves the general industrial market, which includes fabrication, shipbuilding and other general industrial markets, and energy, MRO, construction, and industrial capital goods markets. Products in this segment include:
• arc welding equipment;• metal arc welding consumables and related accessories; and• metal jacketing and other insulation products.
Construction Products: This segment is a branded supplier of innovative engineered fastening systems and solutions. Thissegment primarily serves the residential construction, renovation/remodel construction and commercial construction markets. Products in this segment include:
• fasteners and related fastening tools for wood and metal applications;• anchors, fasteners and related tools for concrete applications;• metal plate truss components and related equipment and software; and• packaged hardware, fasteners, anchors and other products for retail.
Specialty Products: This segment is focused on diversified niche market opportunities that deliver strong operating results with substantial patent protection producing beverage packaging equipment and consumables, product coding and marking equipment and consumables, and appliance components and fasteners. This segment primarily serves the food and beverage, consumer durables, general industrial, printing and publishing and industrial capital goods markets. Products in this segment include:
• line integration, conveyor systems and line automation for the food and beverage industries;• plastic consumables that multi-pack cans and bottles and related equipment;• foil, film and related equipment used to decorate consumer products;• product coding and marking equipment and related consumables;• plastic and metal fasteners and components for appliances;• airport ground support equipment; and• components for medical devices.
The information set forth below is applicable to all segments of the Company unless otherwise noted.
The ITW Business Model
The powerful and highly differentiated ITW Business Model is the Company’s core source of value creation. This business model is the Company’s competitive advantage and defines how ITW creates value for its shareholders and comprises three unique elements:
• ITW’s 80/20 management process is the operating system that is applied in every ITW business. Initially introduced as a manufacturing efficiency tool in the 1980’s, ITW has continually refined, improved and expanded 80/20 into a proprietary, holistic business management process that generates significant value for the Company. Through the application of data-driven insights generated by 80/20 practice, ITW focuses on its largest and best opportunities (the “80”) and eliminates complexity associated with the less profitable opportunities (the “20”). 80/20 enables ITWbusinesses to consistently deliver world-class operational excellence in regards to product availability, quality, and innovation, while generating superior financial performance;
• Customer-back innovation has fueled decades of profitable growth at ITW. The Company’s unique innovation approach is built on the insight gathered from the 80/20 management process. Working from the customer back, ITWbusinesses position themselves as the go-to problem solver for their “80” customers. ITW’s innovation efforts are focused on understanding customer needs, particularly those in “80” markets with solid long-term growth fundamentals, and then creating unique solutions to address those needs. These customer insights and learnings drive innovation at ITW and have contributed to a portfolio of more than 16,000 granted and pending patents;
5
• ITW’s decentralized, entrepreneurial culture allows ITW businesses to be fast, focused, and responsive. ITWbusinesses have significant flexibility within the framework of the ITW Business Model to customize their approach in order to best serve their customers. ITW colleagues are clear about what is expected of them with regard to ITW’sbusiness model, strategy, and values. This leads to a focused and simple organizational structure that, combined with outstanding execution, delivers operational excellence adapted to their specific customers and end markets.
Enterprise Strategy
In 2013, ITW began the process of transitioning the Company onto its current strategic path to fully leverage the compelling performance potential of the ITW Business Model. Since then, ITW has made considerable progress, as evidenced by the Company’s strong financial performance over the past three years.
The roots of ITW’s Enterprise Strategy began in 2011-2012, when the Company undertook a complete review of its performance. ITW gathered deep insights from its businesses that were delivering consistent above-market growth with best-in-class margins and returns, and defined a strategy to replicate that performance throughout the Company.
Based on this rigorous and thorough evaluation, ITW determined two paths to deliver world-class financial performance and compelling long-term returns for its shareholders. One, ITW needed to shift the Company's primary growth engine to organic;and two, the Company needed to leverage the ITW Business Model to deliver best-in-class margins and returns.
Shift the Company’s Core Growth Engine to Organic
In order to pivot to fully focus on organic growth, the Company needed to first accomplish several preparatory steps. These key initiatives were a major focus of the Company in 2012-2015, which included portfolio management, business structure simplification and strategic sourcing.
The first step, portfolio management, was to construct and maintain a business portfolio capable of delivering consistent above-market organic growth. As part of this initiative to realign the portfolio, ITW exited businesses that were operating in commoditized market spaces and prioritized sustainable differentiation as a must-have requirement for all ITWbusinesses. This process included both divesting entire businesses and exiting commoditized product lines and customers inside otherwise highly differentiated ITW divisions.
As a result of this work, ITW’s business portfolio now has significantly higher organic growth potential. ITW segments and divisions now possess attractive and differentiated product lines and end markets as they continue to improve marginsand generate price/cost increases. This was achieved through product line simplification which focuses on eliminating the complexity and overhead costs associated with smaller product lines and customers, and focuses businesses on supporting and growing their largest customers and product lines. Most of this initiative is complete and ITW businesses are demonstrating notably improved financial performance; the Company expects the remaining product line simplification work to largely be accomplished in 2016.
The second step, business structure simplification, was to scale-up ITW’s operating structure to support increased engineering, marketing, and sales resources, and to improve global reach and competitiveness, all of which were critical to ITW’s ability to drive accelerated organic growth. ITW now has 84 scaled-up divisions with significantly enhanced focus on growth investments, core customers and products, and customer-back innovation.
With the portfolio realignment and scale-up work largely complete, the Company is now able to shift its focus to preparing for, and accelerating, organic growth.
As a third preparatory step, ITW is currently in the process of reapplying 80/20 to optimize its newly scaled-up divisions for growth. This process involves first using 80/20 to build a foundation of operational excellence, and then applying 80/20-driven insights to identify the best opportunities to drive organic growth.
Once the business is operationally excellent and has identified the right growth opportunities, the final step is to accelerate organic growth. The process of preparing for accelerated organic growth generally takes 18 to 24 months.
Based on the financial performance of the divisions that are further along in this process, the Company believes that this framework is capable of delivering above market organic growth in all ITW segments. Many ITW divisions are ready to grow and growing above their respective markets, while the rest of the Company’s divisions are at various phases of
6
preparing to grow. ITW management is fully aligned on this plan and very focused on executing it. By the end of 2016, the Company expects approximately 85 percent of its businesses to be ready to grow.
Leverage the ITW Business Model to Deliver Best-in-Class Margins and Returns
The Company’s work to deliver best-in-class margins and returns is focused on two key areas of ongoing activity. Thefirst is strategic sourcing, where the Company seeks to benefit from its size and scale in procurement processes. Sourcing is now a core strategic and operational capability and this improved competitiveness supports ITW’s organic growth framework. The Company’s 80/20-enabled sourcing organization has delivered an average of 1 percent reduction in spend each year in 2013-2015 and is on track to do the same in 2016 and 2017.
The second element of the margins and returns area of focus is to better leverage the full power of the ITW Business Model through a much more consistent and focused approach to 80/20 best practice implementation across the Company.ITW has clearly defined what excellence in the practice of ITW’s 80/20 management process looks like and the result is significant opportunity to create meaningful incremental improvement in margins and returns as evidenced by the Company’s improvement in both operating margin and after-tax return on invested capital. These 80/20 initiatives can result in restructuring initiatives that reduce costs and improve profitability and returns.
Divestiture of Majority Interest in Former Decorative Surfaces Segment
On October 31, 2012, the Company divested a 51% majority interest in the Decorative Surfaces segment. Accordingly, the Company ceased consolidating the results of the Decorative Surfaces segment as of October 31, 2012 and now reports its 49% ownership interest using the equity method of accounting. Due to the Company's continuing involvement through its 49% interest, the historical operating results of Decorative Surfaces are presented in continuing operations. Effective November 1, 2012, Decorative Surfaces was no longer a reportable segment of the Company.
Divestiture of the Industrial Packaging Segment
In February 2013, the Company announced that it was initiating a review process to explore strategic alternatives for the Industrial Packaging segment. In September 2013, the Company’s Board of Directors authorized a plan to commence a sale process for the Industrial Packaging segment. The Company classified the Industrial Packaging segment as held for sale beginning in the third quarter of 2013 and no longer presented this segment as part of its continuing operations.
On February 6, 2014, the Company announced that it had signed a definitive agreement to sell the Industrial Packaging business to The Carlyle Group for $3.2 billion. The transaction was completed on May 1, 2014, resulting in a pre-tax gain of $1.7 billion ($1.1 billion after-tax) in the second quarter of 2014 which was included in Income from discontinued operations.
See the Discontinued Operations note in Item 8. Financial Statements and Supplementary Data for further discussion of this transaction.
Current Year Developments
Refer to Item 7. Management's Discussion and Analysis of Financial Condition and Results of Operations.
Financial Information about Segments
Segment and operating results are included in Item 7. Management's Discussion and Analysis of Financial Condition and Results of Operations and the Segment Information note in Item 8. Financial Statements and Supplementary Data.
Distribution Methods
The Company’s businesses primarily distribute their products directly to industrial manufacturers and through independent distributors.
7
Backlog
Backlog generally is not considered a significant factor in the Company’s businesses as relatively short delivery periods and rapid inventory turnover are characteristic of most of their products. Backlog by segment as of December 31, 2015 and 2014was as follows:
In millions 2015 2014Automotive OEM . . . . . . . . . . . . . . . . . . . . . . . . . . . . . . . . . . . . . . . . . . . . . . . . . . . . . . . . . . $ 403 $ 414Test & Measurement and Electronics . . . . . . . . . . . . . . . . . . . . . . . . . . . . . . . . . . . . . . . . . . . 289 301Food Equipment . . . . . . . . . . . . . . . . . . . . . . . . . . . . . . . . . . . . . . . . . . . . . . . . . . . . . . . . . . . 203 237Polymers & Fluids. . . . . . . . . . . . . . . . . . . . . . . . . . . . . . . . . . . . . . . . . . . . . . . . . . . . . . . . . . 53 60Welding . . . . . . . . . . . . . . . . . . . . . . . . . . . . . . . . . . . . . . . . . . . . . . . . . . . . . . . . . . . . . . . . . . 68 84Construction Products . . . . . . . . . . . . . . . . . . . . . . . . . . . . . . . . . . . . . . . . . . . . . . . . . . . . . . . 34 28Specialty Products . . . . . . . . . . . . . . . . . . . . . . . . . . . . . . . . . . . . . . . . . . . . . . . . . . . . . . . . . . 237 263Total. . . . . . . . . . . . . . . . . . . . . . . . . . . . . . . . . . . . . . . . . . . . . . . . . . . . . . . . . . . . . . . . . . . . . $ 1,287 $ 1,387
Backlog orders scheduled for shipment beyond calendar year 2016 were not material as of December 31, 2015.
Competition
With operations in 57 countries, the Company offers a wide range of products in a myriad of markets, many of which are fragmented, and the Company encounters a variety of competitors that vary by product line, end market and geographic area. The Company's competitors include many regional or specialized companies, as well as large U.S. and non-U.S. companies or divisions of large companies. Each of the Company's segments generally has several main competitors and numerous smaller ones in most of their end markets and geographic areas. In addition to numerous smaller regional competitors, the Weldingsegment competes globally with Lincoln Electric and ESAB.
In virtually all segments, the Company differentiates its businesses from its competitors based on product innovation, product quality, brand preference, service delivery and price. Technical capability is also a competitive factor in most segments. TheCompany believes that each segment's primary competitive advantages derive from the Company's business model and decentralized operating structure, which creates a strong focus on end markets and customers at the local level, enabling its businesses to respond rapidly to market dynamics. This structure enables the Company's businesses to drive operational excellence utilizing the Company's 80/20 management process and leveraging its product innovation capabilities. TheCompany also believes that its global footprint is a competitive advantage in many of its markets, especially in its AutomotiveOEM segment.
Raw Materials
The Company uses raw materials of various types, primarily steel, resins, chemicals and paper, that are available from numerous commercial sources. The availability of materials and energy has not resulted in any significant business interruptions or other major problems, and no such problems are currently anticipated.
Research and Development
Developing new and improved products, broadening the application of established products, and continuing efforts to improve and develop new methods, processes and equipment all contribute to the Company's organic growth. Many new products are designed to reduce customers' costs by eliminating steps in their manufacturing processes, reducing the number of parts in an assembly or improving the quality of customers' assembled products. Typically, the development of such products is accomplished by working closely with customers on specific applications. Research and development expenses were $218 million in 2015, $227 million in 2014 and $240 million in 2013.
Intellectual Property
The Company owns approximately 3,400 unexpired U.S. patents and 7,200 foreign patents covering articles, methods and machines. In addition, the Company has approximately 1,500 applications for patents pending in the U.S. Patent Office and
8
4,500 applications pending in foreign patent offices. There is no assurance that any of these patents will be issued. TheCompany maintains a patent group for the administration of patents and processing of patent applications.
The Company believes that many of its patents are valuable and important; however, the expiration of any one of the Company's patents would not have a material effect on the Company's results of operations or financial position. TheCompany also credits its success in the markets it serves to engineering capability; manufacturing techniques; skills and efficiency; marketing and sales promotion; and service and delivery of quality products to its customers.
In addition to patents, many of the Company's products and services are sold under various owned or licensed trademarks, which are important to the Company in the aggregate. Some of the Company's more significant trademarks include ITW,which is also used in conjunction with the trademarks of many of the Company's businesses; Deltar and Shakeproof in the Automotive OEM segment; Instron in the Test & Measurement and Electronics segment; Hobart in the Food Equipment segment; Permatex and Wynn's in the Polymers & Fluids segment; Miller in the Welding segment; Paslode in the Construction Products segment; and Hi-Cone in the Specialty Products segment.
Environmental
The Company believes that its manufacturing plants and equipment are in substantial compliance with all applicable environmental regulations. Additional measures to maintain compliance are not expected to materially affect the Company’scapital expenditures, competitive position, financial position or results of operations.
Various legislative and administrative regulations concerning environmental issues have become effective or are under consideration in many parts of the world relating to manufacturing processes and the sale or use of certain products. To date, such developments have not had a substantial adverse impact on the Company's revenues, earnings or cash flows.
Employees
The Company employed approximately 48,000 persons as of December 31, 2015 and considers its employee relations to be excellent.
International
The Company's international operations include subsidiaries and joint ventures in 56 foreign countries on six continents. Theseoperations serve such end markets as automotive OEM/tiers, automotive aftermarket, general industrial, commercial food equipment, construction, and others on a worldwide basis. The Company's revenues from sales to customers outside the U.S. were approximately 54% of revenues in 2015 and 57% of revenues in 2014 and 2013.
Refer to Item 7. Management's Discussion and Analysis of Financial Condition and Results of Operations and the Segment Information note in Item 8. Financial Statements and Supplementary Data for additional information on international activities. International operations are subject to certain potential risks inherent in conducting business in foreign countries, including price controls, exchange controls, limitations on participation in local enterprises, nationalization, expropriation and other governmental action, and fluctuations in currency exchange rates. Additional risks of the Company's international operations are described under Item 1A. Risk Factors.
9
Executive Officers
Executive Officers of the Company as of February 11, 2016 were as follows:
Name Office AgeE. Scott Santi. . . . . . . . . . . . . . . . . . . Chairman & Chief Executive Officer . . . . . . . . . . . . . . . . . . . . . . . . . . . . . . . . 54John R. Hartnett . . . . . . . . . . . . . . . . Executive Vice President . . . . . . . . . . . . . . . . . . . . . . . . . . . . . . . . . . . . . . . . . . 55Michael M. Larsen . . . . . . . . . . . . . . Senior Vice President & Chief Financial Officer. . . . . . . . . . . . . . . . . . . . . . . . 47Mary K. Lawler. . . . . . . . . . . . . . . . . Senior Vice President & Chief Human Resources Officer . . . . . . . . . . . . . . . . 50Roland M. Martel . . . . . . . . . . . . . . . Executive Vice President . . . . . . . . . . . . . . . . . . . . . . . . . . . . . . . . . . . . . . . . . . 61Steven L. Martindale. . . . . . . . . . . . . Executive Vice President . . . . . . . . . . . . . . . . . . . . . . . . . . . . . . . . . . . . . . . . . . 59Sundaram Nagarajan . . . . . . . . . . . . . Executive Vice President . . . . . . . . . . . . . . . . . . . . . . . . . . . . . . . . . . . . . . . . . . 53Christopher O’Herlihy . . . . . . . . . . . Vice Chairman . . . . . . . . . . . . . . . . . . . . . . . . . . . . . . . . . . . . . . . . . . . . . . . . . . 52David C. Parry. . . . . . . . . . . . . . . . . . Vice Chairman . . . . . . . . . . . . . . . . . . . . . . . . . . . . . . . . . . . . . . . . . . . . . . . . . . 62Randall J. Scheuneman . . . . . . . . . . . Vice President & Chief Accounting Officer . . . . . . . . . . . . . . . . . . . . . . . . . . . 48Lei Schlitz . . . . . . . . . . . . . . . . . . . . . Executive Vice President . . . . . . . . . . . . . . . . . . . . . . . . . . . . . . . . . . . . . . . . . . 49Juan Valls . . . . . . . . . . . . . . . . . . . . . Executive Vice President . . . . . . . . . . . . . . . . . . . . . . . . . . . . . . . . . . . . . . . . . . 54Michael R. Zimmerman . . . . . . . . . . Executive Vice President . . . . . . . . . . . . . . . . . . . . . . . . . . . . . . . . . . . . . . . . . . 55
The executive officers of the Company serve at the discretion of the Board of Directors. Set forth below is information regarding the principal occupations and employment and business experience over the past five years for each executive officer. Unless otherwise stated, employment is by the Company.
Mr. Santi is the Chairman of the Board and Chief Executive Officer of the Company. He was elected Chairman of the Board in 2015 after having served as President and Chief Executive Officer, as well as a director, since November 2012. In October 2012, he was elected President and Chief Operating Officer. Mr. Santi served as Vice Chairman from 2008 to October 2012.
Mr. Hartnett was elected Executive Vice President in 2012. He joined Signode in 1980, which was acquired by ITW in 1986, and has held various management positions of increasing responsibility. Most recently, he served as Group President of the automotive aftermarket businesses.
Mr. Larsen joined the Company and was elected Senior Vice President and Chief Financial Officer in September 2013. From October 2010 to August 2013, he served as Vice President and Chief Financial Officer of Gardner Denver, Inc., a global manufacturer of highly engineered compressors, blowers, pumps and other fluid transfer equipment. In addition, he served as interim CEO of Gardner Denver from July 2012 to November 2012, and as President, Chief Executive Officer and a director of that company from November 2012 to July 2013. Prior to joining Gardner Denver, he was Chief Financial Officer at General Electric Water & Process Technologies, a global provider of water treatment and process solutions. His previous experience includes more than 15 years with General Electric, where he held a number of global finance leadership roles with increasing responsibility.
Ms. Lawler joined the Company and was elected Senior Vice President and Chief Human Resources Officer in October 2014. From June 2013 to October 2014, she served as Executive Vice President, Human Resources, at GATX Corporation, a rail car leasing company. Prior to that, she served as Senior Vice President, Human Resources, at GATX Corporation, from May 2008 to May 2013.
Mr. Martel has served in his present position since 2006.
Mr. Martindale has served in his present position since 2008.
Mr. Nagarajan has served in his present position since 2010.
Mr. O’Herlihy was elected Vice Chairman in 2015. Prior to that, he served as Executive Vice President from 2010 to 2015.
Mr. Parry has served in his present position since 2010.
10
Mr. Scheuneman has served in his present position since 2009.
Ms. Schlitz was elected Executive Vice President in 2015. She joined the Company in 2008 and has held various operational, management and leadership positions of increasing responsibility. Most recently, she served as Group President of the food equipment businesses since 2011.
Mr. Valls has served in his present position since 2007.
Mr. Zimmerman was elected Executive Vice President in 2015. He joined Permatex in 1999, which was acquired by ITW in 2005, and has held various management positions of increasing responsibility. Most recently, he served as Group President of the welding businesses.
Available Information
The Company electronically files reports with the Securities and Exchange Commission ("SEC"). The public may read and copy any materials the Company has filed with the SEC at the SEC's Public Reference Room at 100 F Street, N.E., Washington, D.C. 20549. The public may obtain information on the operation of the Public Reference Room by calling the SEC at 1-800-SEC-0330. In addition, the SEC maintains a website (www.sec.gov) that contains reports, proxy and information statements, and other information regarding issuers that file electronically with the SEC. Copies of the Company's Annual Report on Form 10-K, Quarterly Reports on Form 10-Q and Current Reports on Form 8-K and amendments to those reports filed or furnished pursuant to Section 13(a) or 15(d) of the Securities Exchange Act of 1934 are also available free of charge through the Company's website (www.itw.com), as soon as reasonably practicable after electronically filing with or otherwise furnishing such information to the SEC, and are available in print to any shareholder who requests them. TheCompany will furnish any exhibit not contained herein upon the payment of a fee representing the reasonable cost to the Company of furnishing the exhibit. Requests for exhibits may be sent to Illinois Tool Works Inc., 155 Harlem Avenue,Glenview, IL 60025, Attention: Secretary. Also posted on the Company’s website are the following:
• Statement of Principles of Conduct;• Code of Ethics for CEO and key financial and accounting personnel;• Charters of the Audit, Corporate Governance and Nominating, and Compensation Committees of the Board of
Directors;• Corporate Governance Guidelines;• Global Anti-Corruption Policy;• Corporate Citizenship Statement; • Conflict Minerals Policy Statement; and• Government Affairs Information.
ITEM 1A. Risk Factors
The Company's business, financial condition, results of operations and cash flows are subject to various risks, including, but not limited to, those set forth below, which could cause actual results to vary materially from recent results or from anticipated future results. These risk factors should be considered together with information included elsewhere in this Annual Report on Form 10-K.
The Company's results are impacted by global economic conditions. Downturns in the markets served by the Company could adversely affect its businesses, results of operations or financial condition.
The Company's businesses are impacted by economic conditions around the globe. Slower economic growth, financial market instability, high unemployment, government deficit reduction, sequestration and other austerity measures impacting the markets we serve can adversely affect the Company’s businesses by reducing demand for the Company's products and services, limiting financing available to the Company's customers, increasing order cancellations and the difficulty in collecting accounts receivable, increasing price competition, and increasing the risk that counterparties to the Company's contractual arrangements will become insolvent or otherwise unable to fulfill their obligations.
The global nature of the Company's operations subjects it to political and economic risks that could adversely affect its business, results of operations or financial condition.
The Company currently operates in 57 countries. The risks inherent in the Company's global operations include:• fluctuation in currency exchange rates;
11
• limitations on ownership or participation in local enterprises;• price controls, exchange controls and limitations on repatriation of earnings;• transportation delays and interruptions;• political, social and economic instability and disruptions;• acts of terrorism;• government embargoes or foreign trade restrictions;• the imposition of duties and tariffs and other trade barriers;• import and export controls;• labor unrest and current and changing regulatory environments;• the potential for expropriation or nationalization of enterprises;• difficulties in staffing and managing multi-national operations;• limitations on its ability to enforce legal rights and remedies; and• potentially adverse tax consequences.
If the Company is unable to successfully manage these and other risks associated with managing and expanding its international businesses, the risks could have a material adverse effect on the Company's business, results of operations or financial condition.
The timing and amount of benefits from the Company’s enterprise initiatives may not be as expected and the Company's financial results could be adversely impacted.
The Company’s enterprise strategy and associated initiatives include portfolio management, business structure simplification and strategic sourcing. The portfolio management initiative, which included divesting businesses no longer aligned with the Company’s long-term objectives, is essentially complete; however, product line and customer base simplification, which is a core element of the Company’s 80/20 management process, is being reapplied to the Company’s scaled up operating divisions and remains an active element of this initiative. Although these activities are expected to improve future operating margins and organic revenue growth, they are also expected to have a negative impact on the Company’s overall organicrevenue growth in the short term. The Company's business structure simplification initiative is also essentially completed, although efforts to realize efficiencies in structure are continuous. In addition, the Company continues to seek to benefit from its size and scale in the procurement process through its strategic sourcing initiatives, and the leveraging of purchasing power across businesses involves some execution risk. Also, as its portfolio and 80/20 management activities have positioned its businesses for profitable growth, the Company has shifted its focus to organic growth and has expressed its belief that organicgrowth will be 200 basis points above global GDP by the end of 2017. If the Company is unable to achieve the expected benefits from these initiatives or is unable to complete these initiatives without material disruption to its businesses, the timing and amount of benefits from these initiatives may not be as expected and the Company's financial results could be adversely impacted.
The timing and amount of the Company’s share repurchases are subject to a number of uncertainties.
Share repurchases constitute a significant component of the Company’s capital allocation strategy. The Company funds its share repurchases with free cash flow and short-term borrowings. The amount and timing of share repurchases will be based on a variety of factors. Important factors that could cause the Company to limit, suspend or delay its share repurchases include unfavorable trading market conditions, the price of the Company's common stock, the nature of other investment opportunities presented to us from time to time, the ability to obtain financing at attractive rates and the availability of U.S. cash.
The Company may incur fines or penalties, damage to its reputation or other adverse consequences if its employees, agents or business partners violate anti-bribery, competition, export and import, environmental or other laws.
The Company has a decentralized operating structure under which its individual businesses are allowed significant decision-making autonomy within the Company’s strategic framework and internal financial and compliance controls. The Company cannot ensure that its internal controls will always protect against reckless or criminal acts committed by its employees, agents or business partners that might violate U.S. and/or non-U.S. laws, including anti-bribery, competition, export and import, and environmental laws. Any such improper actions could subject the Company to civil or criminal investigations, could lead to substantial civil or criminal monetary and non-monetary penalties against the Company or its subsidiaries, or could damage its reputation.
12
A significant fluctuation between the U.S. Dollar and other currencies could adversely impact the Company's operating income.
Although the Company's financial results are reported in U.S. Dollars, a significant portion of its sales and operating costs are realized in other currencies, with the largest concentration of foreign sales occurring in Europe. The Company's profitability is affected by movements of the U.S. Dollar against the Euro and other foreign currencies in which it generates revenues and incurs expenses. Significant long-term fluctuations in relative currency values, and in particular, an increase in the value of the U.S. Dollar against foreign currencies, has had and could have an adverse effect on profitability and financial condition.
If the Company is unable to successfully introduce new products or adequately protect its intellectual property, its future growth may be adversely affected.
The Company's ability to develop new products based on innovation can affect its competitive position and sometimes requires the investment of significant time and resources. Difficulties or delays in research, development, production or commercialization of new products and services may reduce future revenues and adversely affect the Company's competitive position. If the Company is unable to create sustainable product differentiation, its organic growth may be adversely affected.
Protecting the Company's intellectual property is critical to its innovation efforts. The Company owns patents, trade secrets, copyrights, trademarks and/or other intellectual property rights related to many of its products, and also has exclusive and non-exclusive license rights under intellectual property owned by others. The Company's intellectual property rights may be challenged or infringed upon by third parties, particularly in countries where property rights are not highly developed or protected, or the Company may be unable to maintain, renew or enter into new license agreements with third-party owners of intellectual property on reasonable terms. Unauthorized use of the Company's intellectual property rights or inability to preserve existing intellectual property rights could adversely impact the Company's competitive position and results of operations.
Recent divestitures pose the risk of retained liabilities that could adversely affect the Company's financial results.
The Company's divestiture activity increased in 2012, 2013 and 2014 in accordance with its portfolio management initiative. Though the divestiture element of its portfolio management initiative is essentially complete, the Company has retained certain liabilities directly or through indemnifications made to the buyer against known and unknown contingent liabilities such as lawsuits, tax liabilities, product liability claims and environmental matters.
The Company has significant goodwill and other intangible assets, and future impairment of these assets could have a material adverse impact on our financial results.
In the past the Company has recorded significant goodwill and other identifiable intangible assets on its balance sheet as a result of acquisitions. A number of factors may result in impairments to goodwill and other intangible assets, including significant negative industry or economic trends, disruptions to our business, increased competition and significant changes in the use of the assets. Impairment charges could result that adversely affect the Company's financial condition or results of operations in the periods recognized.
Disruptions or volatility in global financial markets or changes in our credit ratings could increase our funding costs or reduce the availability of credit.
Global economic conditions may cause volatility and disruptions in the financial markets. The Company’s continued ability to meet its cash requirements requires substantial liquidity and access to the financial markets. In addition, the Company’sborrowing costs can be affected by short and long-term ratings assigned by independent rating agencies. If conditions in the financial markets decline or the Company’s credit ratings are negatively impacted, its funding costs could be increased or the availability of credit could be diminished.
Raw material price increases and supply shortages could adversely affect results.
The supply of raw materials to the Company and to its component parts suppliers could be interrupted for a variety of reasons, including availability and pricing. Prices for raw materials necessary for production have fluctuated significantly in the past and significant increases could adversely affect the Company's results of operations and profit margins. Due to pricing pressure or other factors, the Company may not be able to pass along increased raw material and components parts
13
prices to its customers in the form of price increases or its ability to do so could be delayed. Consequently, its results of operations and financial condition may be adversely affected.
Unfavorable tax law changes and tax authority rulings may adversely affect results.
The Company is subject to income taxes in the U.S. and in various foreign jurisdictions. Domestic and international tax liabilities are based on the income and expenses in various tax jurisdictions. The Company's effective tax rate could be adversely affected by changes in the mix of earnings among countries with differing statutory tax rates, changes in the valuation allowance of deferred tax assets or changes in tax laws. The amount of income taxes and other taxes are subject to ongoing audits by U.S. federal, state and local tax authorities and by non-U.S. authorities. If these audits result in assessments different from amounts recorded, future financial results may include unfavorable tax adjustments.
The Company's defined benefit pension plans are subject to financial market risks that could adversely affect its results of operations and cash flows.
The performance of financial markets and interest rates impact the Company's funding obligations under its defined benefit pension plans. Significant changes in market interest rates, decreases in the fair value of plan assets and investment losses on plan assets may increase the Company's funding obligations and adversely impact its results of operations and cash flows.
Potential adverse outcomes in legal proceedings may adversely affect results.
The Company's businesses expose it to potential toxic tort and other types of product liability claims that are inherent in the design, manufacture and sale of its products and the products of third-party vendors. The Company currently maintains insurance programs consisting of self-insurance up to certain limits and excess insurance coverage for claims over established limits. There can be no assurance that the Company will be able to obtain insurance on acceptable terms or that its insurance programs will provide adequate protection against actual losses. In addition, the Company is subject to the risk that one or more of its insurers may become insolvent and become unable to pay claims that may be made in the future. Even if it maintains adequate insurance programs, claims could have a material adverse effect on the Company's financial condition, liquidity and results of operations and on its ability to obtain suitable, adequate or cost-effective insurance in the future.
If the Company is unable to protect its information technology infrastructure against service interruptions, data corruption, cyber-based attacks or network security breaches, there could be a negative impact on operating results orthe Company may suffer financial or reputational
The Company relies on information technology networks and systems, including the Internet, to process, transmit and store electronic information, and to manage or support a variety of business processes and activities, including procurement, manufacturing, distribution, invoicing and collection. These technology networks and systems may be susceptible to damage, disruptions or shutdowns due to failures during the process of upgrading or replacing software, databases or components; power outages; hardware failures; or computer viruses. In addition, security breaches could result in unauthorized disclosure of confidential information. If these information technology systems suffer severe damage, disruption, or shutdown, and business continuity plans do not effectively resolve the issues in a timely manner, there could be a negative impact on operating results or the Company may suffer financial or reputational damage.
Forward-Looking Statements
This Annual Report on Form 10-K contains forward-looking statements within the meaning of the Private Securities Litigation Reform Act of 1995. Forward-looking statements may be identified by the use of words such as "believe," "expect," "plans," "intends," "may," "strategy," "prospects," "estimate," "project," "target," "anticipate," "guidance," "forecast," and other similar words, including, without limitation, statements regarding the expected acquisition or disposition of businesses, economic conditions in various geographic regions, the timing and amount of share repurchases, the Company's Enterprise Strategy and its ability to manage its strategic business initiatives and the timing and amount of benefits therefrom, the adequacy of internally generated funds and credit facilities to service debt and finance the Company's capital allocation priorities, the sufficiency of U.S. generated cash to fund cash requirements in the U.S., the cost and availability of additional financing, the Company's portion of future benefit payments related to pension and postretirement benefits, the availability of raw materials and energy, the expiration of any one of the Company's patents, the cost of compliance with environmental regulations, the likelihood of future goodwill or intangible asset impairment charges, the impact of failure of the Company's employees to comply with applicable laws and regulations, the impact of foreign currency fluctuations, the outcome of outstanding legal proceedings, the impact of adopting new accounting pronouncements, and the
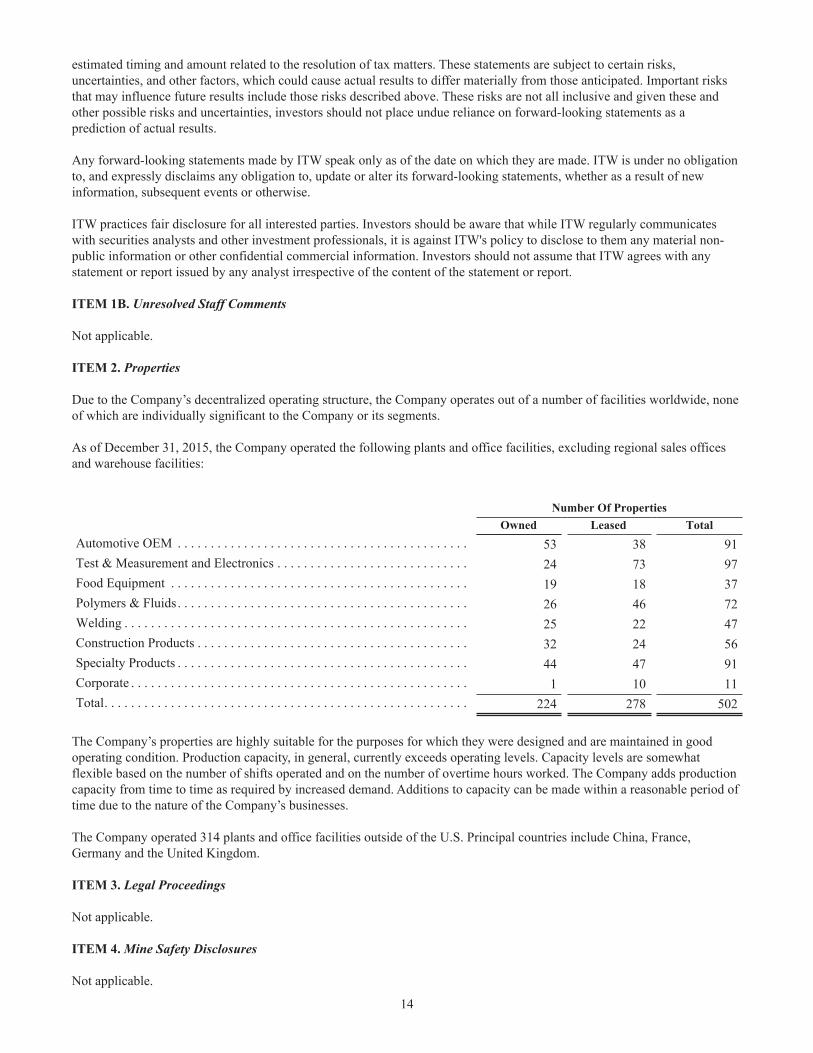
14
estimated timing and amount related to the resolution of tax matters. These statements are subject to certain risks, uncertainties, and other factors, which could cause actual results to differ materially from those anticipated. Important risks that may influence future results include those risks described above. These risks are not all inclusive and given these and other possible risks and uncertainties, investors should not place undue reliance on forward-looking statements as a prediction of actual results.
Any forward-looking statements made by ITW speak only as of the date on which they are made. ITW is under no obligation to, and expressly disclaims any obligation to, update or alter its forward-looking statements, whether as a result of new information, subsequent events or otherwise.
ITW practices fair disclosure for all interested parties. Investors should be aware that while ITW regularly communicates with securities analysts and other investment professionals, it is against ITW's policy to disclose to them any material non-public information or other confidential commercial information. Investors should not assume that ITW agrees with any statement or report issued by any analyst irrespective of the content of the statement or report.
ITEM 1B. Unresolved Staff Comments
Not applicable.
ITEM 2. Properties
Due to the Company’s decentralized operating structure, the Company operates out of a number of facilities worldwide, none of which are individually significant to the Company or its segments.
As of December 31, 2015, the Company operated the following plants and office facilities, excluding regional sales officesand warehouse facilities:
Number Of Properties Owned Leased TotalAutomotive OEM . . . . . . . . . . . . . . . . . . . . . . . . . . . . . . . . . . . . . . . . . . . . 53 38 91Test & Measurement and Electronics . . . . . . . . . . . . . . . . . . . . . . . . . . . . . 24 73 97Food Equipment . . . . . . . . . . . . . . . . . . . . . . . . . . . . . . . . . . . . . . . . . . . . . 19 18 37Polymers & Fluids. . . . . . . . . . . . . . . . . . . . . . . . . . . . . . . . . . . . . . . . . . . . 26 46 72Welding . . . . . . . . . . . . . . . . . . . . . . . . . . . . . . . . . . . . . . . . . . . . . . . . . . . . 25 22 47Construction Products . . . . . . . . . . . . . . . . . . . . . . . . . . . . . . . . . . . . . . . . . 32 24 56Specialty Products . . . . . . . . . . . . . . . . . . . . . . . . . . . . . . . . . . . . . . . . . . . . 44 47 91Corporate . . . . . . . . . . . . . . . . . . . . . . . . . . . . . . . . . . . . . . . . . . . . . . . . . . . 1 10 11Total. . . . . . . . . . . . . . . . . . . . . . . . . . . . . . . . . . . . . . . . . . . . . . . . . . . . . . . 224 278 502
The Company’s properties are highly suitable for the purposes for which they were designed and are maintained in good operating condition. Production capacity, in general, currently exceeds operating levels. Capacity levels are somewhat flexible based on the number of shifts operated and on the number of overtime hours worked. The Company adds production capacity from time to time as required by increased demand. Additions to capacity can be made within a reasonable period of time due to the nature of the Company’s businesses.
The Company operated 314 plants and office facilities outside of the U.S. Principal countries include China, France, Germany and the United Kingdom.
ITEM 3. Legal Proceedings
Not applicable.
ITEM 4. Mine Safety Disclosures
Not applicable.
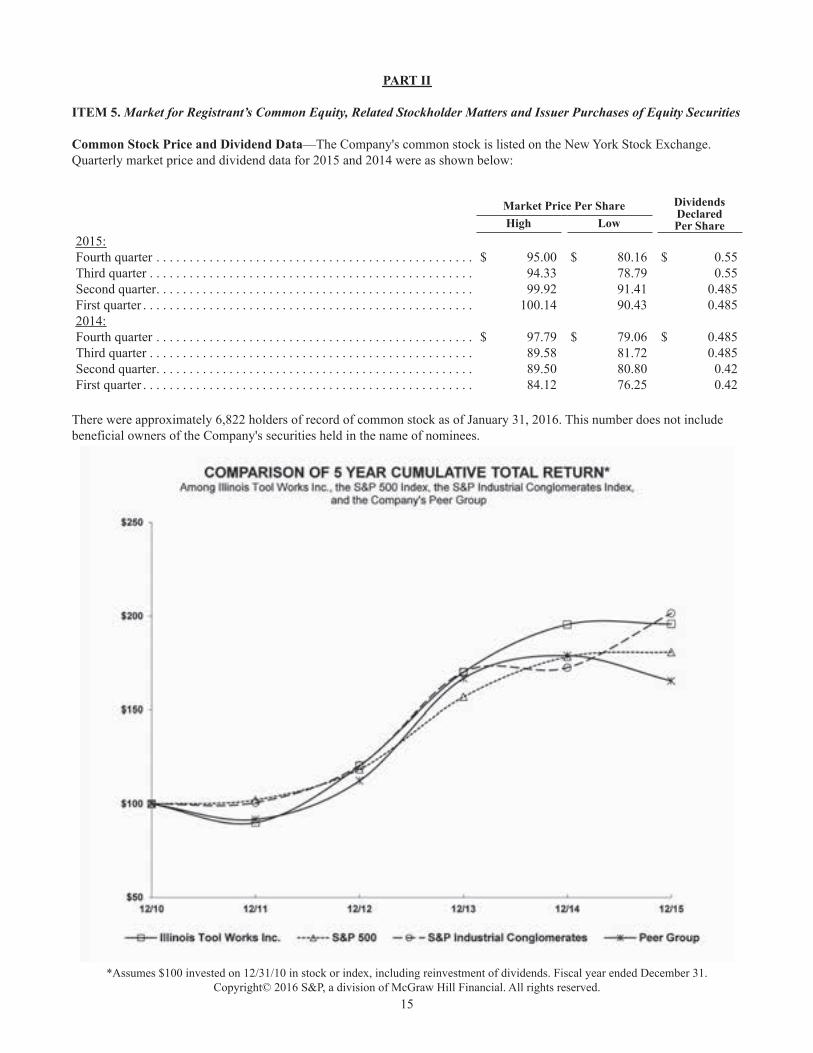
15
PART II
ITEM 5. Market for Registrant’s Common Equity, Related Stockholder Matters and Issuer Purchases of Equity Securities
Common Stock Price and Dividend Data—The Company's common stock is listed on the New York Stock Exchange. Quarterly market price and dividend data for 2015 and 2014 were as shown below:
Market Price Per Share DividendsDeclaredPer Share High Low
2015:Fourth quarter . . . . . . . . . . . . . . . . . . . . . . . . . . . . . . . . . . . . . . . . . . . . . . . . $ 95.00 $ 80.16 $ 0.55Third quarter . . . . . . . . . . . . . . . . . . . . . . . . . . . . . . . . . . . . . . . . . . . . . . . . . 94.33 78.79 0.55Second quarter. . . . . . . . . . . . . . . . . . . . . . . . . . . . . . . . . . . . . . . . . . . . . . . . 99.92 91.41 0.485First quarter . . . . . . . . . . . . . . . . . . . . . . . . . . . . . . . . . . . . . . . . . . . . . . . . . . 100.14 90.43 0.4852014:Fourth quarter . . . . . . . . . . . . . . . . . . . . . . . . . . . . . . . . . . . . . . . . . . . . . . . . $ 97.79 $ 79.06 $ 0.485Third quarter . . . . . . . . . . . . . . . . . . . . . . . . . . . . . . . . . . . . . . . . . . . . . . . . . 89.58 81.72 0.485Second quarter. . . . . . . . . . . . . . . . . . . . . . . . . . . . . . . . . . . . . . . . . . . . . . . . 89.50 80.80 0.42First quarter . . . . . . . . . . . . . . . . . . . . . . . . . . . . . . . . . . . . . . . . . . . . . . . . . . 84.12 76.25 0.42
There were approximately 6,822 holders of record of common stock as of January 31, 2016. This number does not include beneficial owners of the Company's securities held in the name of nominees.
*Assumes $100 invested on 12/31/10 in stock or index, including reinvestment of dividends. Fiscal year ended December 31.Copyright© 2016 S&P, a division of McGraw Hill Financial. All rights reserved.
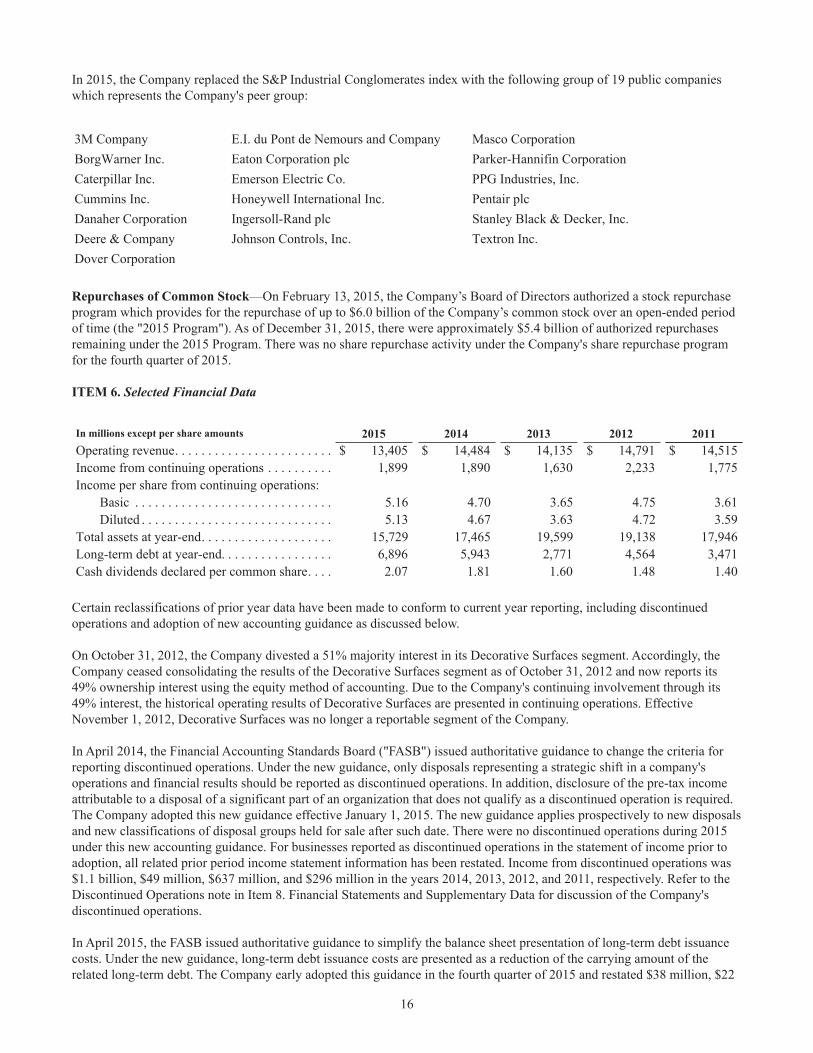
16
In 2015, the Company replaced the S&P Industrial Conglomerates index with the following group of 19 public companies which represents the Company's peer group:
3M Company E.I. du Pont de Nemours and Company Masco CorporationBorgWarner Inc. Eaton Corporation plc Parker-Hannifin CorporationCaterpillar Inc. Emerson Electric Co. PPG Industries, Inc.Cummins Inc. Honeywell International Inc. Pentair plcDanaher Corporation Ingersoll-Rand plc Stanley Black & Decker, Inc.Deere & Company Johnson Controls, Inc. Textron Inc.Dover Corporation
Repurchases of Common Stock—On February 13, 2015, the Company’s Board of Directors authorized a stock repurchase program which provides for the repurchase of up to $6.0 billion of the Company’s common stock over an open-ended period of time (the "2015 Program"). As of December 31, 2015, there were approximately $5.4 billion of authorized repurchases remaining under the 2015 Program. There was no share repurchase activity under the Company's share repurchase program for the fourth quarter of 2015.
ITEM 6. Selected Financial Data
In millions except per share amounts 2015 2014 2013 2012 2011Operating revenue. . . . . . . . . . . . . . . . . . . . . . . . $ 13,405 $ 14,484 $ 14,135 $ 14,791 $ 14,515Income from continuing operations . . . . . . . . . . 1,899 1,890 1,630 2,233 1,775Income per share from continuing operations:
Basic . . . . . . . . . . . . . . . . . . . . . . . . . . . . . . 5.16 4.70 3.65 4.75 3.61Diluted . . . . . . . . . . . . . . . . . . . . . . . . . . . . . 5.13 4.67 3.63 4.72 3.59
Total assets at year-end. . . . . . . . . . . . . . . . . . . . 15,729 17,465 19,599 19,138 17,946Long-term debt at year-end. . . . . . . . . . . . . . . . . 6,896 5,943 2,771 4,564 3,471Cash dividends declared per common share. . . . 2.07 1.81 1.60 1.48 1.40
Certain reclassifications of prior year data have been made to conform to current year reporting, including discontinued operations and adoption of new accounting guidance as discussed below.
On October 31, 2012, the Company divested a 51% majority interest in its Decorative Surfaces segment. Accordingly, the Company ceased consolidating the results of the Decorative Surfaces segment as of October 31, 2012 and now reports its 49% ownership interest using the equity method of accounting. Due to the Company's continuing involvement through its 49% interest, the historical operating results of Decorative Surfaces are presented in continuing operations. EffectiveNovember 1, 2012, Decorative Surfaces was no longer a reportable segment of the Company.
In April 2014, the Financial Accounting Standards Board ("FASB") issued authoritative guidance to change the criteria for reporting discontinued operations. Under the new guidance, only disposals representing a strategic shift in a company's operations and financial results should be reported as discontinued operations. In addition, disclosure of the pre-tax income attributable to a disposal of a significant part of an organization that does not qualify as a discontinued operation is required. The Company adopted this new guidance effective January 1, 2015. The new guidance applies prospectively to new disposals and new classifications of disposal groups held for sale after such date. There were no discontinued operations during 2015 under this new accounting guidance. For businesses reported as discontinued operations in the statement of income prior to adoption, all related prior period income statement information has been restated. Income from discontinued operations was $1.1 billion, $49 million, $637 million, and $296 million in the years 2014, 2013, 2012, and 2011, respectively. Refer to the Discontinued Operations note in Item 8. Financial Statements and Supplementary Data for discussion of the Company's discontinued operations.
In April 2015, the FASB issued authoritative guidance to simplify the balance sheet presentation of long-term debt issuance costs. Under the new guidance, long-term debt issuance costs are presented as a reduction of the carrying amount of the related long-term debt. The Company early adopted this guidance in the fourth quarter of 2015 and restated $38 million, $22
17
million, $26 million, and $17 million of deferred long-term debt issuance costs from Other assets to Long-term debt in the years 2014, 2013, 2012, and 2011, respectively. Refer to the Debt note in Item 8. Financial Statements and Supplementary Data for further information.
In November 2015, the FASB issued authoritative guidance to simplify the presentation of deferred taxes. Under the new guidance, all deferred tax assets and liabilities are presented as noncurrent in the statement of financial position. Early adoption of this guidance in the fourth quarter of 2015 decreased total assets by $175 million, $345 million, $145 million,and $21 million in the years 2014, 2013, 2012, and 2011, respectively. Refer to the Income Taxes note in Item 8. Financial Statements and Supplementary Data for further information.
Additional information on the comparability of results is included in Item 7. Management's Discussion and Analysis of Financial Condition and Results of Operations.
18
ITEM 7. Management's Discussion and Analysis of Financial Condition and Results of Operations
INTRODUCTION
Illinois Tool Works Inc. (the "Company" or "ITW") is a global manufacturer of a diversified range of industrial products and equipment with 84 divisions in 57 countries. As of December 31, 2015, the Company employed approximately 48,000persons.
The Company's operations are organized and managed based on similar product offerings and similar end markets, and are reported to senior management as the following seven segments: Automotive OEM; Test & Measurement and Electronics; Food Equipment; Polymers & Fluids; Welding; Construction Products; and Specialty Products.
Due to the large number of diverse businesses and the Company's decentralized operating structure, the Company does not require its businesses to provide detailed information on operating results. Instead, the Company's corporate management collects data on several key measurements: operating revenue, operating income, operating margin, overhead costs, number of months on hand in inventory, days sales outstanding in accounts receivable, past due receivables and return on invested capital. These key measures are monitored by management and significant changes in operating results versus current trends in end markets and variances from forecasts are discussed with operating unit management.
THE ITW BUSINESS MODEL
The powerful and highly differentiated ITW Business Model is the Company’s core source of value creation. This business model is the Company’s competitive advantage and defines how ITW creates value for its shareholders and comprises three unique elements:
• ITW’s 80/20 management process is the operating system that is applied in every ITW business. Initially introduced as a manufacturing efficiency tool in the 1980’s, ITW has continually refined, improved and expanded 80/20 into a proprietary, holistic business management process that generates significant value for the Company.Through the application of data-driven insights generated by 80/20 practice, ITW focuses on its largest and best opportunities (the “80”) and eliminates complexity associated with the less profitable opportunities (the “20”). 80/20 enables ITW businesses to consistently deliver world-class operational excellence in regards to product availability,quality, and innovation, while generating superior financial performance;
• Customer-back innovation has fueled decades of profitable growth at ITW. The Company’s unique innovation approach is built on the insight gathered from the 80/20 management process. Working from the customer back, ITW businesses position themselves as the go-to problem solver for their “80” customers. ITW’s innovation effortsare focused on understanding customer needs, particularly those in “80” markets with solid long-term growth fundamentals, and then creating unique solutions to address those needs. These customer insights and learnings drive innovation at ITW and have contributed to a portfolio of more than 16,000 granted and pending patents;
• ITW’s decentralized, entrepreneurial culture allows ITW businesses to be fast, focused, and responsive. ITWbusinesses have significant flexibility within the framework of the ITW Business Model to customize their approach in order to best serve their customers. ITW colleagues are clear about what is expected of them with regard to ITW’sbusiness model, strategy, and values. This leads to a focused and simple organizational structure that, combined with outstanding execution, delivers operational excellence adapted to their specific customers and end markets.
ENTERPRISE STRATEGY
In 2013, ITW began the process of transitioning the Company onto its current strategic path to fully leverage the compelling performance potential of the ITW Business Model. Since then, ITW has made considerable progress, as evidenced by the Company’s strong financial performance over the past three years.
The roots of ITW’s Enterprise Strategy began in 2011-2012, when the Company undertook a complete review of its performance. ITW gathered deep insights from its businesses that were delivering consistent above-market growth with best-in-class margins and returns, and defined a strategy to replicate that performance throughout the Company.
19
Based on this rigorous and thorough evaluation, ITW determined two paths to deliver world-class financial performance and compelling long-term returns for its shareholders. One, ITW needed to shift the Company's primary growth engine to organic; and two, the Company needed to leverage the ITW Business Model to deliver best-in-class margins and returns.
Shift the Company’s Core Growth Engine to Organic
In order to pivot to fully focus on organic growth, the Company needed to first accomplish several preparatory steps. These key initiatives were a major focus of the Company in 2012-2015, which included portfolio management, business structure simplification and strategic sourcing.
The first step, portfolio management, was to construct and maintain a business portfolio capable of delivering consistent above-market organic growth. As part of this initiative to realign the portfolio, ITW exited businesses that were operating in commoditized market spaces and prioritized sustainable differentiation as a must-have requirement for all ITWbusinesses. This process included both divesting entire businesses and exiting commoditized product lines and customers inside otherwise highly differentiated ITW divisions.
As a result of this work, ITW’s business portfolio now has significantly higher organic growth potential. ITW segments and divisions now possess attractive and differentiated product lines and end markets as they continue to improve margins and generate price/cost increases. This was achieved through product line simplification which focuses on eliminating the complexity and overhead costs associated with smaller product lines and customers, and focuses businesses on supporting and growing their largest customers and product lines. Most of this initiative is complete and ITW businesses are demonstrating notably improved financial performance; the Company expects the remaining product line simplification work to largely be accomplished in 2016.
The second step, business structure simplification, was to scale-up ITW’s operating structure to support increased engineering, marketing, and sales resources, and to improve global reach and competitiveness, all of which were critical to ITW’s ability to drive accelerated organic growth. ITW now has 84 scaled-up divisions with significantly enhanced focus on growth investments, core customers and products, and customer-back innovation.
With the portfolio realignment and scale-up work largely complete, the Company is now able to shift its focus to preparing for, and accelerating, organic growth.
As a third preparatory step, ITW is currently in the process of reapplying 80/20 to optimize its newly scaled-up divisions for growth. This process involves first using 80/20 to build a foundation of operational excellence, and then applying 80/20-driven insights to identify the best opportunities to drive organic growth.
Once the business is operationally excellent and has identified the right growth opportunities, the final step is to accelerate organic growth. The process of preparing for accelerated organic growth generally takes 18 to 24 months.
Based on the financial performance of the divisions that are further along in this process, the Company believes that this framework is capable of delivering above market organic growth in all ITW segments. Many ITW divisions are ready to grow and growing above their respective markets, while the rest of the Company’s divisions are at various phases of preparing to grow. ITW management is fully aligned on this plan and very focused on executing it. By the end of 2016, the Company expects approximately 85 percent of its businesses to be ready to grow.
Leverage the ITW Business Model to Deliver Best-in-Class Margins and Returns
The Company’s work to deliver best-in-class margins and returns is focused on two key areas of ongoing activity. Thefirst is strategic sourcing, where the Company seeks to benefit from its size and scale in procurement processes. Sourcing is now a core strategic and operational capability and this improved competitiveness supports ITW’s organic growth framework. The Company’s 80/20-enabled sourcing organization has delivered an average of 1 percent reduction in spend each year in 2013-2015 and is on track to do the same in 2016 and 2017.
The second element of the margin and return area of focus is to better leverage the full power of the ITW Business Model through a much more consistent and focused approach to 80/20 best practice implementation across the Company.ITW has clearly defined what excellence in the practice of ITW’s 80/20 management process looks like and the result is significant opportunity to create meaningful incremental improvement in margins and returns as evidenced by the
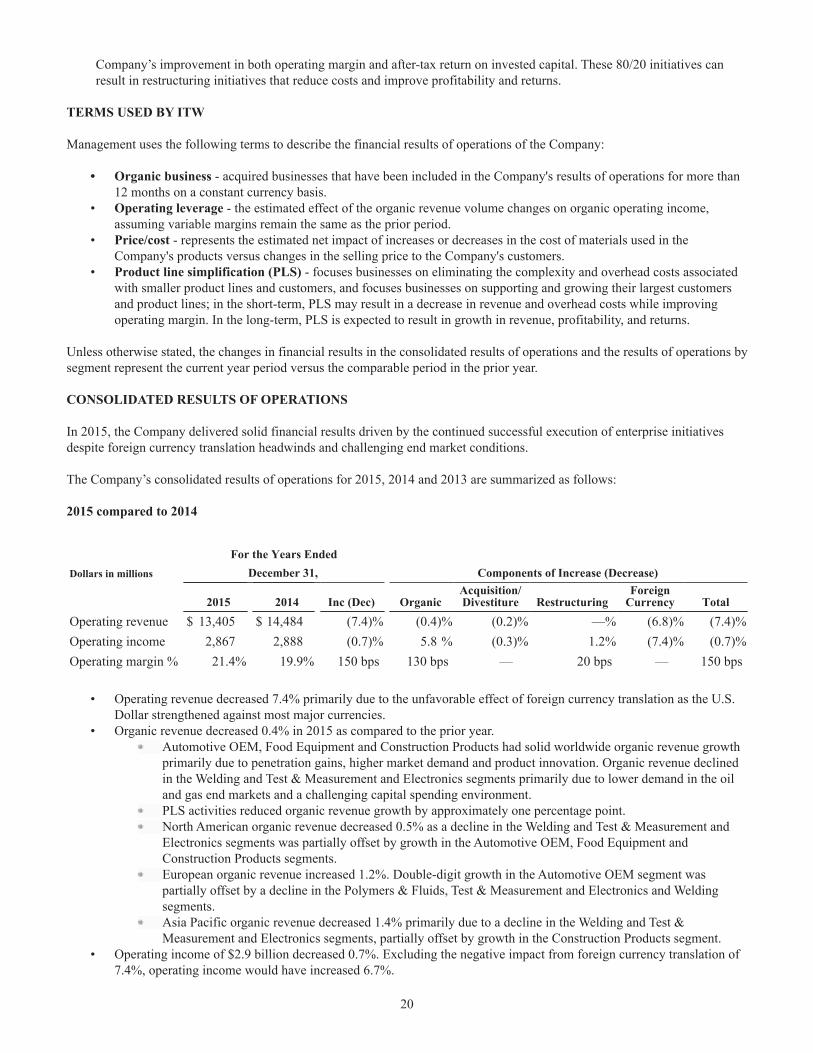
20
Company’s improvement in both operating margin and after-tax return on invested capital. These 80/20 initiatives can result in restructuring initiatives that reduce costs and improve profitability and returns.
TERMS USED BY ITW
Management uses the following terms to describe the financial results of operations of the Company:
• Organic business - acquired businesses that have been included in the Company's results of operations for more than 12 months on a constant currency basis.
• Operating leverage - the estimated effect of the organic revenue volume changes on organic operating income, assuming variable margins remain the same as the prior period.
• Price/cost - represents the estimated net impact of increases or decreases in the cost of materials used in the Company's products versus changes in the selling price to the Company's customers.
• Product line simplification (PLS) - focuses businesses on eliminating the complexity and overhead costs associated with smaller product lines and customers, and focuses businesses on supporting and growing their largest customers and product lines; in the short-term, PLS may result in a decrease in revenue and overhead costs while improving operating margin. In the long-term, PLS is expected to result in growth in revenue, profitability, and returns.
Unless otherwise stated, the changes in financial results in the consolidated results of operations and the results of operations by segment represent the current year period versus the comparable period in the prior year.
CONSOLIDATED RESULTS OF OPERATIONS
In 2015, the Company delivered solid financial results driven by the continued successful execution of enterprise initiatives despite foreign currency translation headwinds and challenging end market conditions.
The Company’s consolidated results of operations for 2015, 2014 and 2013 are summarized as follows:
2015 compared to 2014
For the Years EndedDollars in millions December 31, Components of Increase (Decrease)
2015 2014 Inc (Dec) OrganicAcquisition/Divestiture Restructuring
ForeignCurrency Total
Operating revenue $ 13,405 $ 14,484 (7.4)% (0.4)% (0.2)% —% (6.8)% (7.4)%Operating income 2,867 2,888 (0.7)% 5.8 % (0.3)% 1.2% (7.4)% (0.7)%Operating margin % 21.4% 19.9% 150 bps 130 bps — 20 bps — 150 bps
• Operating revenue decreased 7.4% primarily due to the unfavorable effect of foreign currency translation as the U.S. Dollar strengthened against most major currencies.
• Organic revenue decreased 0.4% in 2015 as compared to the prior year.Automotive OEM, Food Equipment and Construction Products had solid worldwide organic revenue growthprimarily due to penetration gains, higher market demand and product innovation. Organic revenue declined in the Welding and Test & Measurement and Electronics segments primarily due to lower demand in the oil and gas end markets and a challenging capital spending environment.PLS activities reduced organic revenue growth by approximately one percentage point.North American organic revenue decreased 0.5% as a decline in the Welding and Test & Measurement and Electronics segments was partially offset by growth in the Automotive OEM, Food Equipment and Construction Products segments.European organic revenue increased 1.2%. Double-digit growth in the Automotive OEM segment was partially offset by a decline in the Polymers & Fluids, Test & Measurement and Electronics and Weldingsegments.Asia Pacific organic revenue decreased 1.4% primarily due to a decline in the Welding and Test & Measurement and Electronics segments, partially offset by growth in the Construction Products segment.
• Operating income of $2.9 billion decreased 0.7%. Excluding the negative impact from foreign currency translation of 7.4%, operating income would have increased 6.7%.
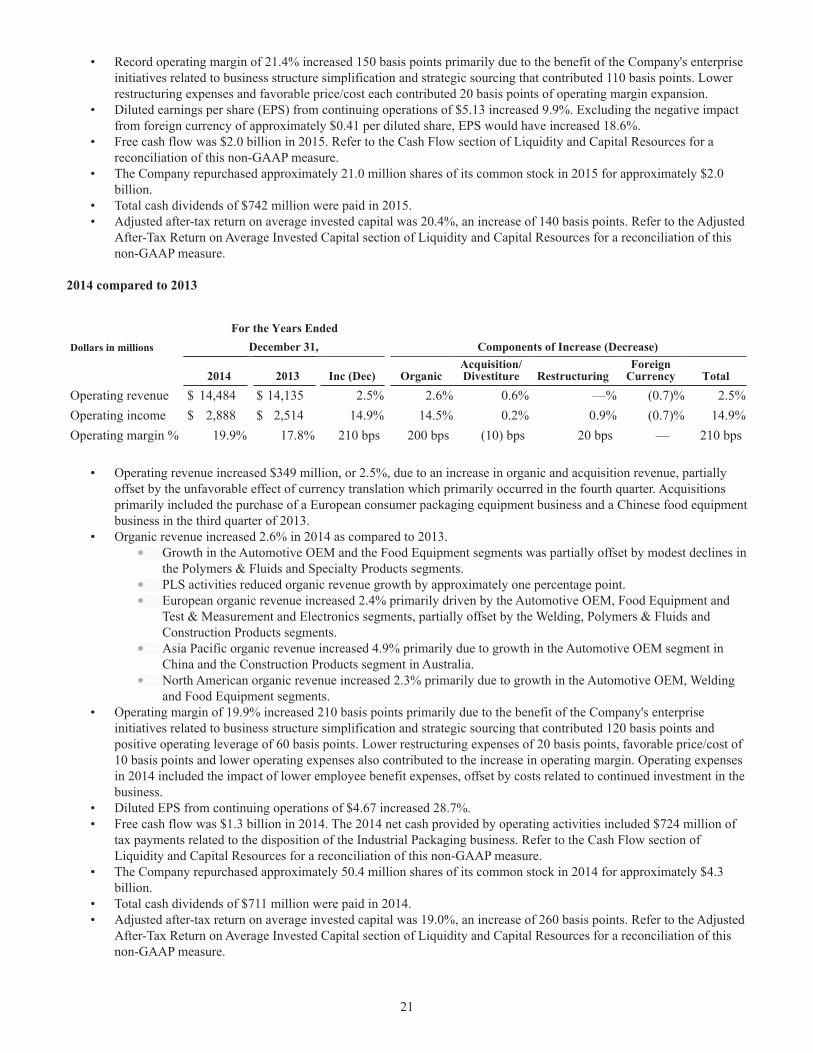
21
• Record operating margin of 21.4% increased 150 basis points primarily due to the benefit of the Company's enterprise initiatives related to business structure simplification and strategic sourcing that contributed 110 basis points. Lower restructuring expenses and favorable price/cost each contributed 20 basis points of operating margin expansion.
• Diluted earnings per share (EPS) from continuing operations of $5.13 increased 9.9%. Excluding the negative impact from foreign currency of approximately $0.41 per diluted share, EPS would have increased 18.6%.
• Free cash flow was $2.0 billion in 2015. Refer to the Cash Flow section of Liquidity and Capital Resources for a reconciliation of this non-GAAP measure.
• The Company repurchased approximately 21.0 million shares of its common stock in 2015 for approximately $2.0 billion.
• Total cash dividends of $742 million were paid in 2015.• Adjusted after-tax return on average invested capital was 20.4%, an increase of 140 basis points. Refer to the Adjusted
After-Tax Return on Average Invested Capital section of Liquidity and Capital Resources for a reconciliation of this non-GAAP measure.
2014 compared to 2013
For the Years EndedDollars in millions December 31, Components of Increase (Decrease)
2014 2013 Inc (Dec) OrganicAcquisition/Divestiture Restructuring
ForeignCurrency Total
Operating revenue $ 14,484 $ 14,135 2.5% 2.6% 0.6% —% (0.7)% 2.5%Operating income $ 2,888 $ 2,514 14.9% 14.5% 0.2% 0.9% (0.7)% 14.9%Operating margin % 19.9% 17.8% 210 bps 200 bps (10) bps 20 bps — 210 bps
• Operating revenue increased $349 million, or 2.5%, due to an increase in organic and acquisition revenue, partially offset by the unfavorable effect of currency translation which primarily occurred in the fourth quarter. Acquisitionsprimarily included the purchase of a European consumer packaging equipment business and a Chinese food equipment business in the third quarter of 2013.
• Organic revenue increased 2.6% in 2014 as compared to 2013.Growth in the Automotive OEM and the Food Equipment segments was partially offset by modest declines in the Polymers & Fluids and Specialty Products segments.PLS activities reduced organic revenue growth by approximately one percentage point.European organic revenue increased 2.4% primarily driven by the Automotive OEM, Food Equipment and Test & Measurement and Electronics segments, partially offset by the Welding, Polymers & Fluids and Construction Products segments.Asia Pacific organic revenue increased 4.9% primarily due to growth in the Automotive OEM segment in China and the Construction Products segment in Australia.North American organic revenue increased 2.3% primarily due to growth in the Automotive OEM, Weldingand Food Equipment segments.
• Operating margin of 19.9% increased 210 basis points primarily due to the benefit of the Company's enterprise initiatives related to business structure simplification and strategic sourcing that contributed 120 basis points and positive operating leverage of 60 basis points. Lower restructuring expenses of 20 basis points, favorable price/cost of 10 basis points and lower operating expenses also contributed to the increase in operating margin. Operating expenses in 2014 included the impact of lower employee benefit expenses, offset by costs related to continued investment in the business.
• Diluted EPS from continuing operations of $4.67 increased 28.7%.• Free cash flow was $1.3 billion in 2014. The 2014 net cash provided by operating activities included $724 million of
tax payments related to the disposition of the Industrial Packaging business. Refer to the Cash Flow section of Liquidity and Capital Resources for a reconciliation of this non-GAAP measure.
• The Company repurchased approximately 50.4 million shares of its common stock in 2014 for approximately $4.3 billion.
• Total cash dividends of $711 million were paid in 2014.• Adjusted after-tax return on average invested capital was 19.0%, an increase of 260 basis points. Refer to the Adjusted
After-Tax Return on Average Invested Capital section of Liquidity and Capital Resources for a reconciliation of this non-GAAP measure.
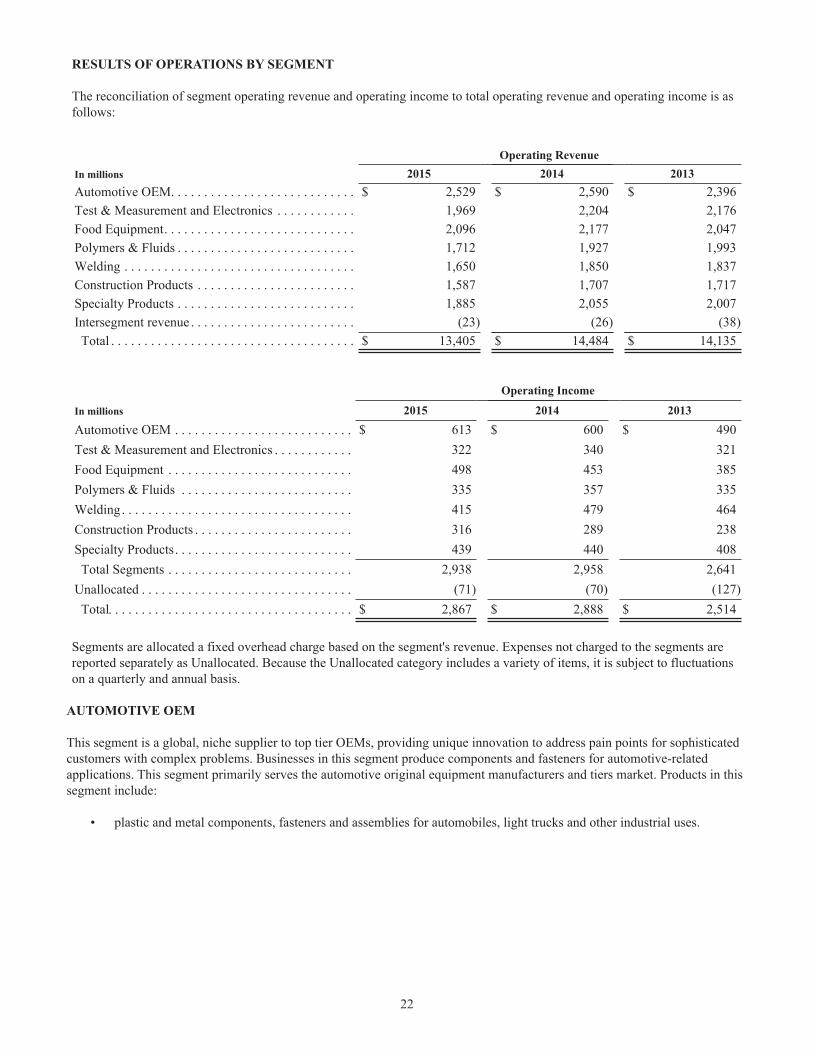
22
RESULTS OF OPERATIONS BY SEGMENT
The reconciliation of segment operating revenue and operating income to total operating revenue and operating income is as follows:
Operating RevenueIn millions 2015 2014 2013Automotive OEM. . . . . . . . . . . . . . . . . . . . . . . . . . . . $ 2,529 $ 2,590 $ 2,396Test & Measurement and Electronics . . . . . . . . . . . . 1,969 2,204 2,176Food Equipment. . . . . . . . . . . . . . . . . . . . . . . . . . . . . 2,096 2,177 2,047Polymers & Fluids . . . . . . . . . . . . . . . . . . . . . . . . . . . 1,712 1,927 1,993Welding . . . . . . . . . . . . . . . . . . . . . . . . . . . . . . . . . . . 1,650 1,850 1,837Construction Products . . . . . . . . . . . . . . . . . . . . . . . . 1,587 1,707 1,717Specialty Products . . . . . . . . . . . . . . . . . . . . . . . . . . . 1,885 2,055 2,007Intersegment revenue . . . . . . . . . . . . . . . . . . . . . . . . . (23) (26) (38) Total . . . . . . . . . . . . . . . . . . . . . . . . . . . . . . . . . . . . . $ 13,405 $ 14,484 $ 14,135
Operating Income
In millions 2015 2014 2013Automotive OEM . . . . . . . . . . . . . . . . . . . . . . . . . . . $ 613 $ 600 $ 490Test & Measurement and Electronics . . . . . . . . . . . . 322 340 321Food Equipment . . . . . . . . . . . . . . . . . . . . . . . . . . . . 498 453 385Polymers & Fluids . . . . . . . . . . . . . . . . . . . . . . . . . . 335 357 335Welding. . . . . . . . . . . . . . . . . . . . . . . . . . . . . . . . . . . 415 479 464Construction Products . . . . . . . . . . . . . . . . . . . . . . . . 316 289 238Specialty Products. . . . . . . . . . . . . . . . . . . . . . . . . . . 439 440 408 Total Segments . . . . . . . . . . . . . . . . . . . . . . . . . . . . 2,938 2,958 2,641Unallocated . . . . . . . . . . . . . . . . . . . . . . . . . . . . . . . . (71) (70) (127) Total. . . . . . . . . . . . . . . . . . . . . . . . . . . . . . . . . . . . . $ 2,867 $ 2,888 $ 2,514
Segments are allocated a fixed overhead charge based on the segment's revenue. Expenses not charged to the segments are reported separately as Unallocated. Because the Unallocated category includes a variety of items, it is subject to fluctuations on a quarterly and annual basis.
AUTOMOTIVE OEM
This segment is a global, niche supplier to top tier OEMs, providing unique innovation to address pain points for sophisticated customers with complex problems. Businesses in this segment produce components and fasteners for automotive-related applications. This segment primarily serves the automotive original equipment manufacturers and tiers market. Products in this segment include:
• plastic and metal components, fasteners and assemblies for automobiles, light trucks and other industrial uses.
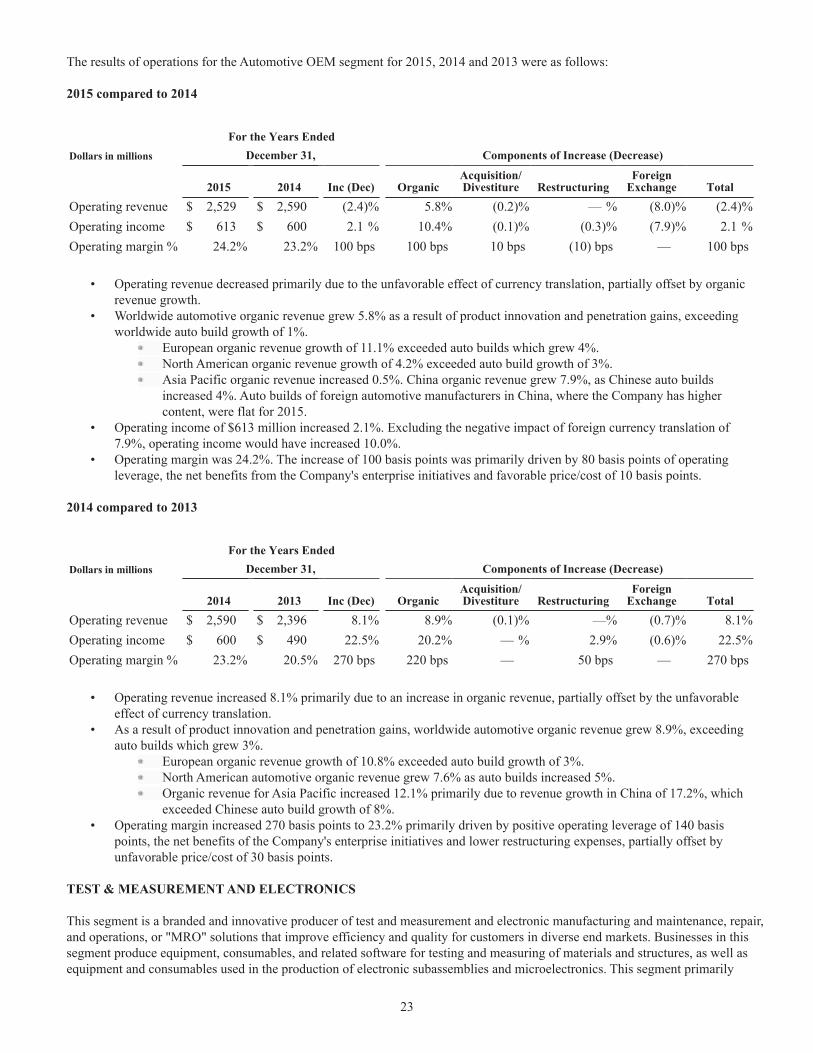
23
The results of operations for the Automotive OEM segment for 2015, 2014 and 2013 were as follows:
2015 compared to 2014
For the Years EndedDollars in millions December 31, Components of Increase (Decrease)
2015 2014 Inc (Dec) OrganicAcquisition/Divestiture Restructuring
ForeignExchange Total
Operating revenue $ 2,529 $ 2,590 (2.4)% 5.8% (0.2)% — % (8.0)% (2.4)%Operating income $ 613 $ 600 2.1 % 10.4% (0.1)% (0.3)% (7.9)% 2.1 %Operating margin % 24.2% 23.2% 100 bps 100 bps 10 bps (10) bps — 100 bps
• Operating revenue decreased primarily due to the unfavorable effect of currency translation, partially offset by organicrevenue growth.
• Worldwide automotive organic revenue grew 5.8% as a result of product innovation and penetration gains, exceeding worldwide auto build growth of 1%.
European organic revenue growth of 11.1% exceeded auto builds which grew 4%. North American organic revenue growth of 4.2% exceeded auto build growth of 3%. Asia Pacific organic revenue increased 0.5%. China organic revenue grew 7.9%, as Chinese auto builds increased 4%. Auto builds of foreign automotive manufacturers in China, where the Company has higher content, were flat for 2015.
• Operating income of $613 million increased 2.1%. Excluding the negative impact of foreign currency translation of 7.9%, operating income would have increased 10.0%.
• Operating margin was 24.2%. The increase of 100 basis points was primarily driven by 80 basis points of operating leverage, the net benefits from the Company's enterprise initiatives and favorable price/cost of 10 basis points.
2014 compared to 2013
For the Years EndedDollars in millions December 31, Components of Increase (Decrease)
2014 2013 Inc (Dec) OrganicAcquisition/Divestiture Restructuring
ForeignExchange Total
Operating revenue $ 2,590 $ 2,396 8.1% 8.9% (0.1)% —% (0.7)% 8.1%Operating income $ 600 $ 490 22.5% 20.2% — % 2.9% (0.6)% 22.5%Operating margin % 23.2% 20.5% 270 bps 220 bps — 50 bps — 270 bps
• Operating revenue increased 8.1% primarily due to an increase in organic revenue, partially offset by the unfavorable effect of currency translation.
• As a result of product innovation and penetration gains, worldwide automotive organic revenue grew 8.9%, exceeding auto builds which grew 3%.
European organic revenue growth of 10.8% exceeded auto build growth of 3%. North American automotive organic revenue grew 7.6% as auto builds increased 5%.Organic revenue for Asia Pacific increased 12.1% primarily due to revenue growth in China of 17.2%, which exceeded Chinese auto build growth of 8%.
• Operating margin increased 270 basis points to 23.2% primarily driven by positive operating leverage of 140 basis points, the net benefits of the Company's enterprise initiatives and lower restructuring expenses, partially offset by unfavorable price/cost of 30 basis points.
TEST & MEASUREMENT AND ELECTRONICS
This segment is a branded and innovative producer of test and measurement and electronic manufacturing and maintenance, repair,and operations, or "MRO" solutions that improve efficiency and quality for customers in diverse end markets. Businesses in this segment produce equipment, consumables, and related software for testing and measuring of materials and structures, as well as equipment and consumables used in the production of electronic subassemblies and microelectronics. This segment primarily
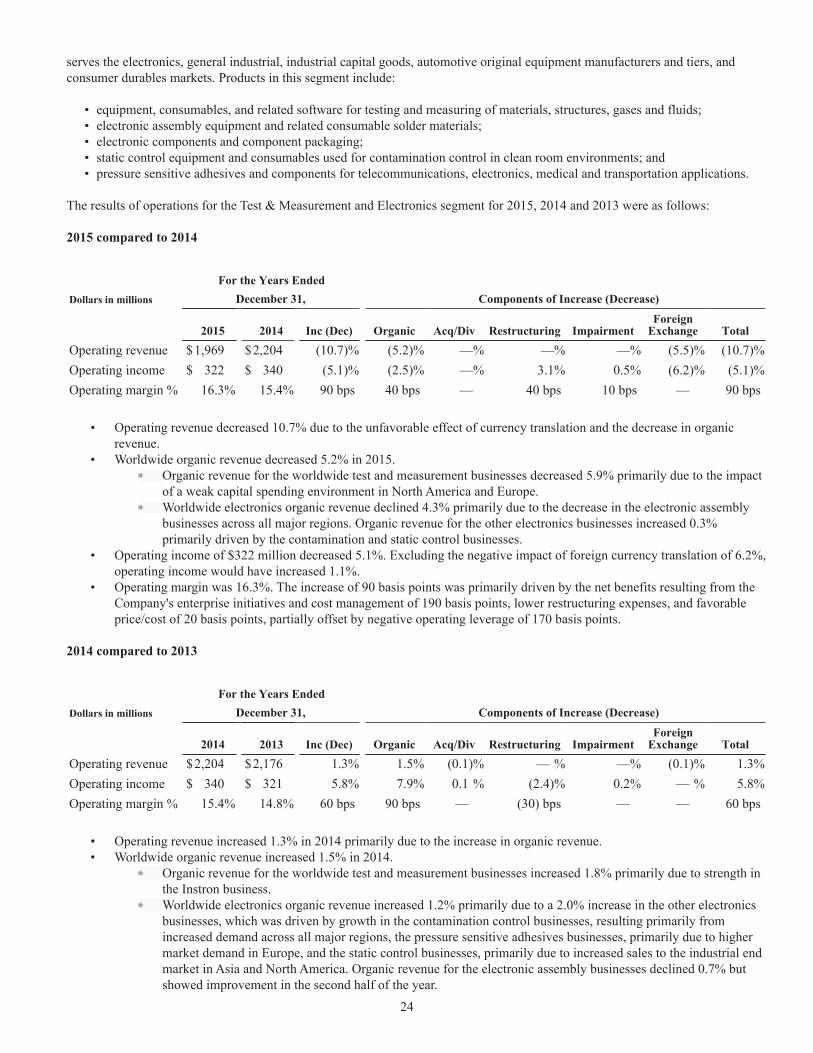
24
serves the electronics, general industrial, industrial capital goods, automotive original equipment manufacturers and tiers, and consumer durables markets. Products in this segment include:
• equipment, consumables, and related software for testing and measuring of materials, structures, gases and fluids;• electronic assembly equipment and related consumable solder materials;• electronic components and component packaging;• static control equipment and consumables used for contamination control in clean room environments; and• pressure sensitive adhesives and components for telecommunications, electronics, medical and transportation applications.
The results of operations for the Test & Measurement and Electronics segment for 2015, 2014 and 2013 were as follows:
2015 compared to 2014
For the Years EndedDollars in millions December 31, Components of Increase (Decrease)
2015 2014 Inc (Dec) Organic Acq/Div Restructuring ImpairmentForeign
Exchange TotalOperating revenue $1,969 $2,204 (10.7)% (5.2)% —% —% —% (5.5)% (10.7)%Operating income $ 322 $ 340 (5.1)% (2.5)% —% 3.1% 0.5% (6.2)% (5.1)%Operating margin % 16.3% 15.4% 90 bps 40 bps — 40 bps 10 bps — 90 bps
• Operating revenue decreased 10.7% due to the unfavorable effect of currency translation and the decrease in organicrevenue.
• Worldwide organic revenue decreased 5.2% in 2015.Organic revenue for the worldwide test and measurement businesses decreased 5.9% primarily due to the impact of a weak capital spending environment in North America and Europe.Worldwide electronics organic revenue declined 4.3% primarily due to the decrease in the electronic assembly businesses across all major regions. Organic revenue for the other electronics businesses increased 0.3% primarily driven by the contamination and static control businesses.
• Operating income of $322 million decreased 5.1%. Excluding the negative impact of foreign currency translation of 6.2%, operating income would have increased 1.1%.
• Operating margin was 16.3%. The increase of 90 basis points was primarily driven by the net benefits resulting from the Company's enterprise initiatives and cost management of 190 basis points, lower restructuring expenses, and favorable price/cost of 20 basis points, partially offset by negative operating leverage of 170 basis points.
2014 compared to 2013
For the Years EndedDollars in millions December 31, Components of Increase (Decrease)
2014 2013 Inc (Dec) Organic Acq/Div Restructuring ImpairmentForeign
Exchange TotalOperating revenue $2,204 $2,176 1.3% 1.5% (0.1)% — % —% (0.1)% 1.3%Operating income $ 340 $ 321 5.8% 7.9% 0.1 % (2.4)% 0.2% — % 5.8%Operating margin % 15.4% 14.8% 60 bps 90 bps — (30) bps — — 60 bps
• Operating revenue increased 1.3% in 2014 primarily due to the increase in organic revenue.• Worldwide organic revenue increased 1.5% in 2014.
Organic revenue for the worldwide test and measurement businesses increased 1.8% primarily due to strength in the Instron business. Worldwide electronics organic revenue increased 1.2% primarily due to a 2.0% increase in the other electronics businesses, which was driven by growth in the contamination control businesses, resulting primarily from increased demand across all major regions, the pressure sensitive adhesives businesses, primarily due to higher market demand in Europe, and the static control businesses, primarily due to increased sales to the industrial end market in Asia and North America. Organic revenue for the electronic assembly businesses declined 0.7% but showed improvement in the second half of the year.
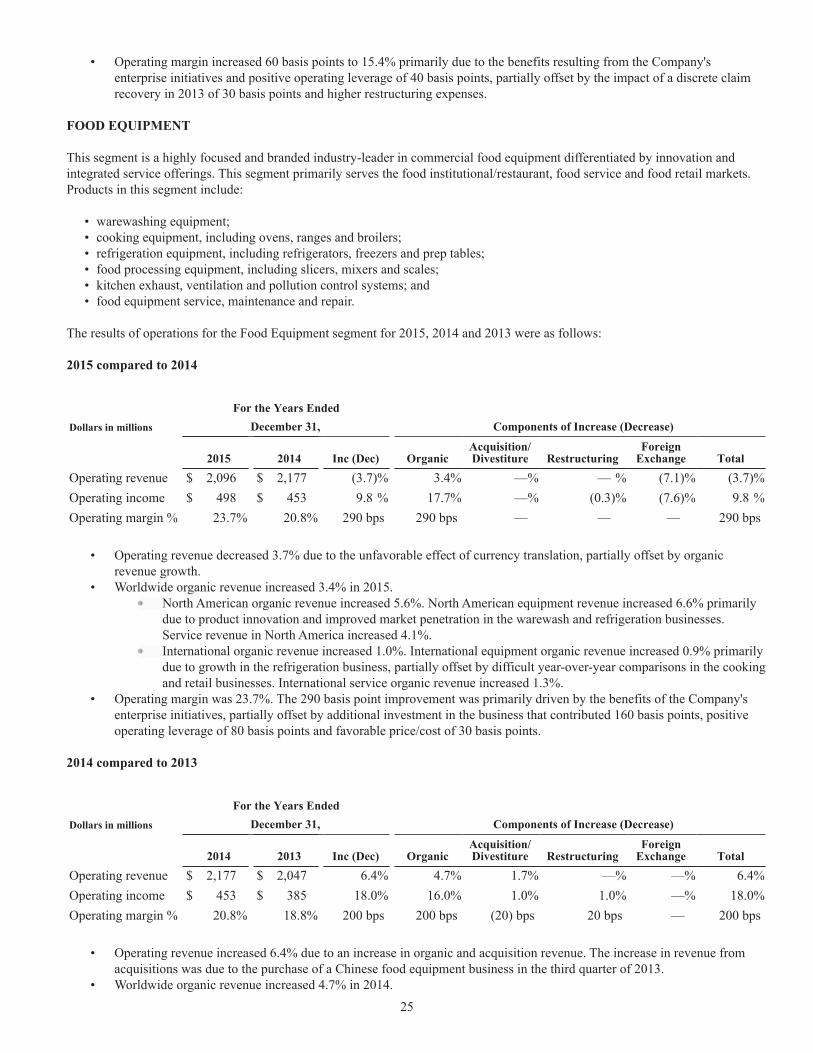
25
• Operating margin increased 60 basis points to 15.4% primarily due to the benefits resulting from the Company's enterprise initiatives and positive operating leverage of 40 basis points, partially offset by the impact of a discrete claim recovery in 2013 of 30 basis points and higher restructuring expenses.
FOOD EQUIPMENT
This segment is a highly focused and branded industry-leader in commercial food equipment differentiated by innovation and integrated service offerings. This segment primarily serves the food institutional/restaurant, food service and food retail markets. Products in this segment include:
• warewashing equipment;• cooking equipment, including ovens, ranges and broilers;• refrigeration equipment, including refrigerators, freezers and prep tables;• food processing equipment, including slicers, mixers and scales;• kitchen exhaust, ventilation and pollution control systems; and• food equipment service, maintenance and repair.
The results of operations for the Food Equipment segment for 2015, 2014 and 2013 were as follows:
2015 compared to 2014
For the Years EndedDollars in millions December 31, Components of Increase (Decrease)
2015 2014 Inc (Dec) OrganicAcquisition/Divestiture Restructuring
ForeignExchange Total
Operating revenue $ 2,096 $ 2,177 (3.7)% 3.4% —% — % (7.1)% (3.7)%Operating income $ 498 $ 453 9.8 % 17.7% —% (0.3)% (7.6)% 9.8 %Operating margin % 23.7% 20.8% 290 bps 290 bps — — — 290 bps
• Operating revenue decreased 3.7% due to the unfavorable effect of currency translation, partially offset by organicrevenue growth.
• Worldwide organic revenue increased 3.4% in 2015.North American organic revenue increased 5.6%. North American equipment revenue increased 6.6% primarily due to product innovation and improved market penetration in the warewash and refrigeration businesses. Service revenue in North America increased 4.1%.International organic revenue increased 1.0%. International equipment organic revenue increased 0.9% primarily due to growth in the refrigeration business, partially offset by difficult year-over-year comparisons in the cooking and retail businesses. International service organic revenue increased 1.3%.
• Operating margin was 23.7%. The 290 basis point improvement was primarily driven by the benefits of the Company's enterprise initiatives, partially offset by additional investment in the business that contributed 160 basis points, positive operating leverage of 80 basis points and favorable price/cost of 30 basis points.
2014 compared to 2013
For the Years EndedDollars in millions December 31, Components of Increase (Decrease)
2014 2013 Inc (Dec) OrganicAcquisition/Divestiture Restructuring
ForeignExchange Total
Operating revenue $ 2,177 $ 2,047 6.4% 4.7% 1.7% —% —% 6.4%Operating income $ 453 $ 385 18.0% 16.0% 1.0% 1.0% —% 18.0%Operating margin % 20.8% 18.8% 200 bps 200 bps (20) bps 20 bps — 200 bps
• Operating revenue increased 6.4% due to an increase in organic and acquisition revenue. The increase in revenue from acquisitions was due to the purchase of a Chinese food equipment business in the third quarter of 2013.
• Worldwide organic revenue increased 4.7% in 2014.

26
North American organic revenue increased 5.1% as North American equipment revenue increased 5.3%, primarily due to product innovation and penetration gains in refrigeration and cooking. North American service revenue increased 4.0%.International organic revenue increased 4.6% as equipment revenue increased 6.4% primarily due to growth in warewash and refrigeration businesses and product innovation. International service revenue growth of 0.6% was impacted by slower demand in southern Europe.
• Operating margin increased 200 basis points to 20.8% primarily due to positive operating leverage of 120 basis points, the benefits of the Company's enterprise initiatives, favorable price/cost of 20 basis points and lower restructuring expenses.
POLYMERS & FLUIDS
This segment is a highly branded supplier to niche markets that require value-added, differentiated products. Businesses in this segment produce adhesives, sealants, lubrication and cutting fluids, and fluids and polymers for auto aftermarket maintenance and appearance. This segment primarily serves the automotive aftermarket, general industrial, MRO, and construction markets. Products in this segment include:
• adhesives for industrial, construction and consumer purposes;• chemical fluids which clean or add lubrication to machines;• epoxy and resin-based coating products for industrial applications;• hand wipes and cleaners for industrial applications;• fluids, polymers and other supplies for auto aftermarket maintenance and appearance;• fillers and putties for auto body repair; and• polyester coatings and patch and repair products for the marine industry.
The results of operations for the Polymers & Fluids segment for 2015, 2014 and 2013 were as follows:
2015 compared to 2014
For the Years EndedDollars in millions December 31, Components of Increase (Decrease)
2015 2014 Inc (Dec) Organic Acq/Div Restructuring ImpairmentForeign
Exchange TotalOperating revenue $1,712 $1,927 (11.2)% (2.0)% (1.0)% —% — % (8.2)% (11.2)%Operating income $ 335 $ 357 (6.3)% 1.8 % (2.3)% 1.7% (0.4)% (7.1)% (6.3)%Operating margin % 19.6% 18.5% 110 bps 80 bps (20) bps 30 bps (10) bps 30 bps 110 bps
• Operating revenue decreased primarily due to the unfavorable effect of currency translation and the decrease in organicrevenue.
• Worldwide organic revenue declined 2.0% primarily due to lower demand in Europe and North America.Organic revenue for the worldwide fluids businesses decreased 3.8% primarily driven by a decline in the industrial maintenance, repair and operations end markets in Europe and North America. Worldwide polymers businesses decreased 2.6% primarily due to the organic revenue decline in the European wind energy business, partially offset by growth in China and South America. Organic revenue for the worldwide automotive aftermarket businesses was essentially flat as a decline in North America was offset by growth in South America.
• Operating income of $335 million decreased 6.3%. Excluding the negative impact of foreign currency translation of 7.1%, operating income would have increased 0.8%.
• Operating margin was 19.6%. The 110 basis point improvement was primarily driven by the net benefits of the Company's enterprise initiatives and cost management of 150 basis points and lower restructuring expenses, partially offset by lower variable margins due to product mix and negative operating leverage of 40 basis points.
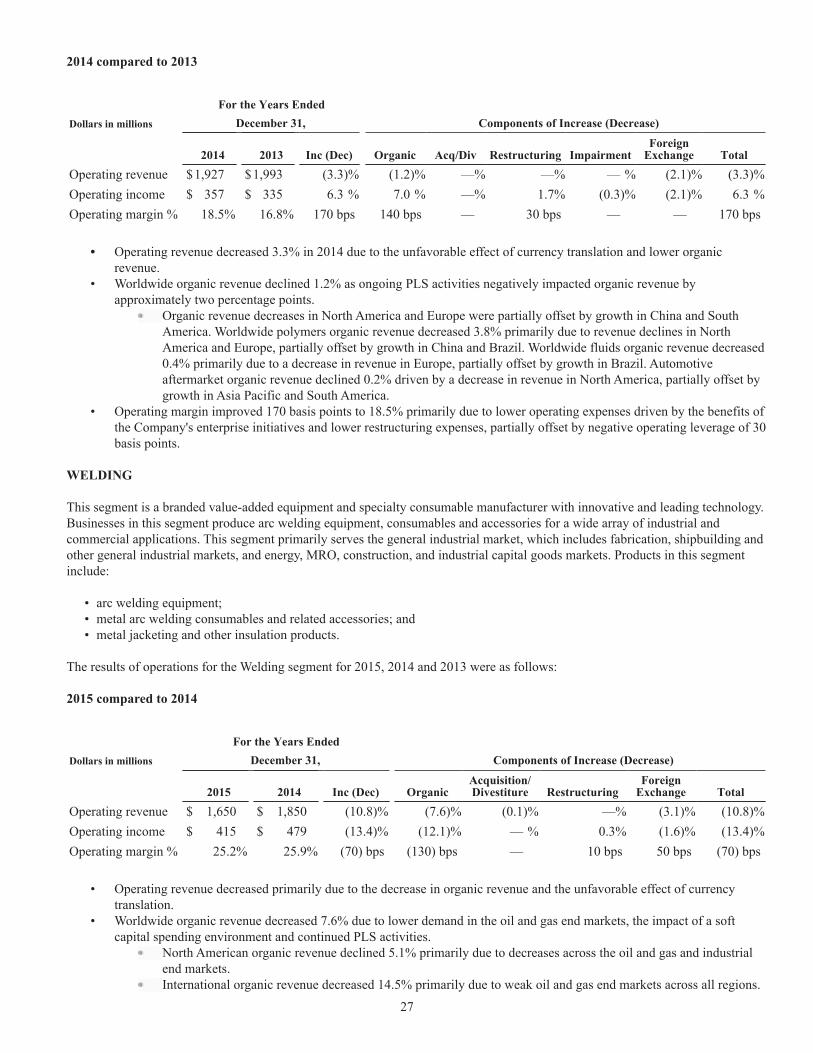
27
2014 compared to 2013
For the Years EndedDollars in millions December 31, Components of Increase (Decrease)
2014 2013 Inc (Dec) Organic Acq/Div Restructuring ImpairmentForeign
Exchange TotalOperating revenue $1,927 $1,993 (3.3)% (1.2)% —% —% — % (2.1)% (3.3)%Operating income $ 357 $ 335 6.3 % 7.0 % —% 1.7% (0.3)% (2.1)% 6.3 %Operating margin % 18.5% 16.8% 170 bps 140 bps — 30 bps — — 170 bps
• Operating revenue decreased 3.3% in 2014 due to the unfavorable effect of currency translation and lower organicrevenue.
• Worldwide organic revenue declined 1.2% as ongoing PLS activities negatively impacted organic revenue by approximately two percentage points.
Organic revenue decreases in North America and Europe were partially offset by growth in China and South America. Worldwide polymers organic revenue decreased 3.8% primarily due to revenue declines in North America and Europe, partially offset by growth in China and Brazil. Worldwide fluids organic revenue decreased 0.4% primarily due to a decrease in revenue in Europe, partially offset by growth in Brazil. Automotiveaftermarket organic revenue declined 0.2% driven by a decrease in revenue in North America, partially offset by growth in Asia Pacific and South America.
• Operating margin improved 170 basis points to 18.5% primarily due to lower operating expenses driven by the benefits of the Company's enterprise initiatives and lower restructuring expenses, partially offset by negative operating leverage of 30 basis points.
WELDING
This segment is a branded value-added equipment and specialty consumable manufacturer with innovative and leading technology.Businesses in this segment produce arc welding equipment, consumables and accessories for a wide array of industrial and commercial applications. This segment primarily serves the general industrial market, which includes fabrication, shipbuilding and other general industrial markets, and energy, MRO, construction, and industrial capital goods markets. Products in this segment include:
• arc welding equipment;• metal arc welding consumables and related accessories; and• metal jacketing and other insulation products.
The results of operations for the Welding segment for 2015, 2014 and 2013 were as follows:
2015 compared to 2014
For the Years EndedDollars in millions December 31, Components of Increase (Decrease)
2015 2014 Inc (Dec) OrganicAcquisition/Divestiture Restructuring
ForeignExchange Total
Operating revenue $ 1,650 $ 1,850 (10.8)% (7.6)% (0.1)% —% (3.1)% (10.8)%Operating income $ 415 $ 479 (13.4)% (12.1)% — % 0.3% (1.6)% (13.4)%Operating margin % 25.2% 25.9% (70) bps (130) bps — 10 bps 50 bps (70) bps
• Operating revenue decreased primarily due to the decrease in organic revenue and the unfavorable effect of currency translation.
• Worldwide organic revenue decreased 7.6% due to lower demand in the oil and gas end markets, the impact of a soft capital spending environment and continued PLS activities.
North American organic revenue declined 5.1% primarily due to decreases across the oil and gas and industrial end markets.International organic revenue decreased 14.5% primarily due to weak oil and gas end markets across all regions.

28
• Operating margin was 25.2%. The decline of 70 basis points was primarily due to negative operating leverage of 130 basis points and lower variable margins due to product mix from lower sales of higher margin equipment, partially offsetby favorable price/cost of 50 basis points and the net benefits of the Company's enterprise initiatives.
2014 compared to 2013
For the Years EndedDollars in millions December 31, Components of Increase (Decrease)
2014 2013 Inc (Dec) OrganicAcquisition/Divestiture Restructuring
ForeignExchange Total
Operating revenue $ 1,850 $ 1,837 0.7% 1.2% 0.3% — % (0.8)% 0.7%Operating income $ 479 $ 464 3.2% 4.3% —% (0.5)% (0.6)% 3.2%Operating margin % 25.9% 25.3% 60 bps 80 bps (10) bps (10) bps — 60 bps
• Operating revenue increased 0.7% due to the increase in organic and acquisition revenue, partially offset by the unfavorable effect of currency translation. The increase from acquisition revenue was due to the purchase of a European supplier of welding consumables in the first quarter of 2013.
• Worldwide welding organic revenue increased 1.2%.North American welding organic revenue increased 6.0% primarily due to strength in equipment sales to general industrial and commercial customers.International organic revenue decreased 10.4% primarily due to a delay in China oil and gas pipeline projects and continued PLS activities in Europe.
• Operating margin increased 60 basis points to 25.9% primarily due to the benefits of the Company's enterprise initiatives, favorable price/cost of 40 basis points and favorable operating leverage of 20 basis points, partially offset by higher overhead expenses driven by continued investment in product innovation.
CONSTRUCTION PRODUCTS
This segment is a branded supplier of innovative engineered fastening systems and solutions. This segment primarily serves the residential construction, renovation/remodel construction and commercial construction markets. Products in this segment include:
• fasteners and related fastening tools for wood and metal applications;• anchors, fasteners and related tools for concrete applications;• metal plate truss components and related equipment and software; and• packaged hardware, fasteners, anchors and other products for retail.
The results of operations for the Construction Products segment for 2015, 2014 and 2013 were as follows:
2015 compared to 2014
For the Years EndedDollars in millions December 31, Components of Increase (Decrease)
2015 2014 Inc (Dec) OrganicAcquisition/Divestiture Restructuring
ForeignExchange Total
Operating revenue $ 1,587 $ 1,707 (7.0)% 3.7% (0.5)% —% (10.2)% (7.0)%Operating income $ 316 $ 289 8.8 % 17.0% (0.2)% 3.8% (11.8)% 8.8 %Operating margin % 19.9% 17.0% 290 bps 220 bps 10 bps 60 bps — 290 bps
• Operating revenue decreased primarily due to the unfavorable effect of currency translation, partially offset by organicrevenue growth.
• Worldwide organic revenue increased 3.7%.North American organic revenue increased 7.1% primarily due to an increase in demand in the renovation/remodel end markets.
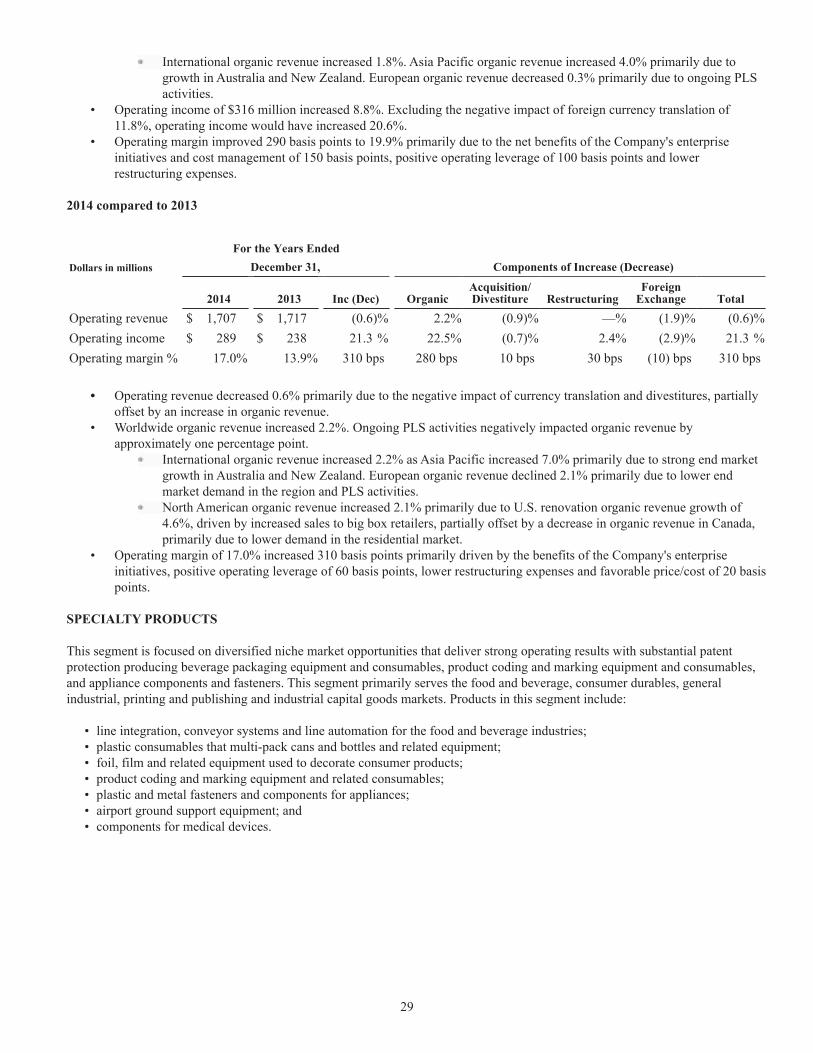
29
International organic revenue increased 1.8%. Asia Pacific organic revenue increased 4.0% primarily due to growth in Australia and New Zealand. European organic revenue decreased 0.3% primarily due to ongoing PLS activities.
• Operating income of $316 million increased 8.8%. Excluding the negative impact of foreign currency translation of 11.8%, operating income would have increased 20.6%.
• Operating margin improved 290 basis points to 19.9% primarily due to the net benefits of the Company's enterprise initiatives and cost management of 150 basis points, positive operating leverage of 100 basis points and lower restructuring expenses.
2014 compared to 2013
For the Years EndedDollars in millions December 31, Components of Increase (Decrease)
2014 2013 Inc (Dec) OrganicAcquisition/Divestiture Restructuring
ForeignExchange Total
Operating revenue $ 1,707 $ 1,717 (0.6)% 2.2% (0.9)% —% (1.9)% (0.6)%Operating income $ 289 $ 238 21.3 % 22.5% (0.7)% 2.4% (2.9)% 21.3 %Operating margin % 17.0% 13.9% 310 bps 280 bps 10 bps 30 bps (10) bps 310 bps
• Operating revenue decreased 0.6% primarily due to the negative impact of currency translation and divestitures, partially offset by an increase in organic revenue.
• Worldwide organic revenue increased 2.2%. Ongoing PLS activities negatively impacted organic revenue by approximately one percentage point.
International organic revenue increased 2.2% as Asia Pacific increased 7.0% primarily due to strong end market growth in Australia and New Zealand. European organic revenue declined 2.1% primarily due to lower end market demand in the region and PLS activities.North American organic revenue increased 2.1% primarily due to U.S. renovation organic revenue growth of 4.6%, driven by increased sales to big box retailers, partially offset by a decrease in organic revenue in Canada, primarily due to lower demand in the residential market.
• Operating margin of 17.0% increased 310 basis points primarily driven by the benefits of the Company's enterprise initiatives, positive operating leverage of 60 basis points, lower restructuring expenses and favorable price/cost of 20 basis points.
SPECIALTY PRODUCTS
This segment is focused on diversified niche market opportunities that deliver strong operating results with substantial patent protection producing beverage packaging equipment and consumables, product coding and marking equipment and consumables, and appliance components and fasteners. This segment primarily serves the food and beverage, consumer durables, general industrial, printing and publishing and industrial capital goods markets. Products in this segment include:
• line integration, conveyor systems and line automation for the food and beverage industries;• plastic consumables that multi-pack cans and bottles and related equipment;• foil, film and related equipment used to decorate consumer products;• product coding and marking equipment and related consumables;• plastic and metal fasteners and components for appliances;• airport ground support equipment; and• components for medical devices.
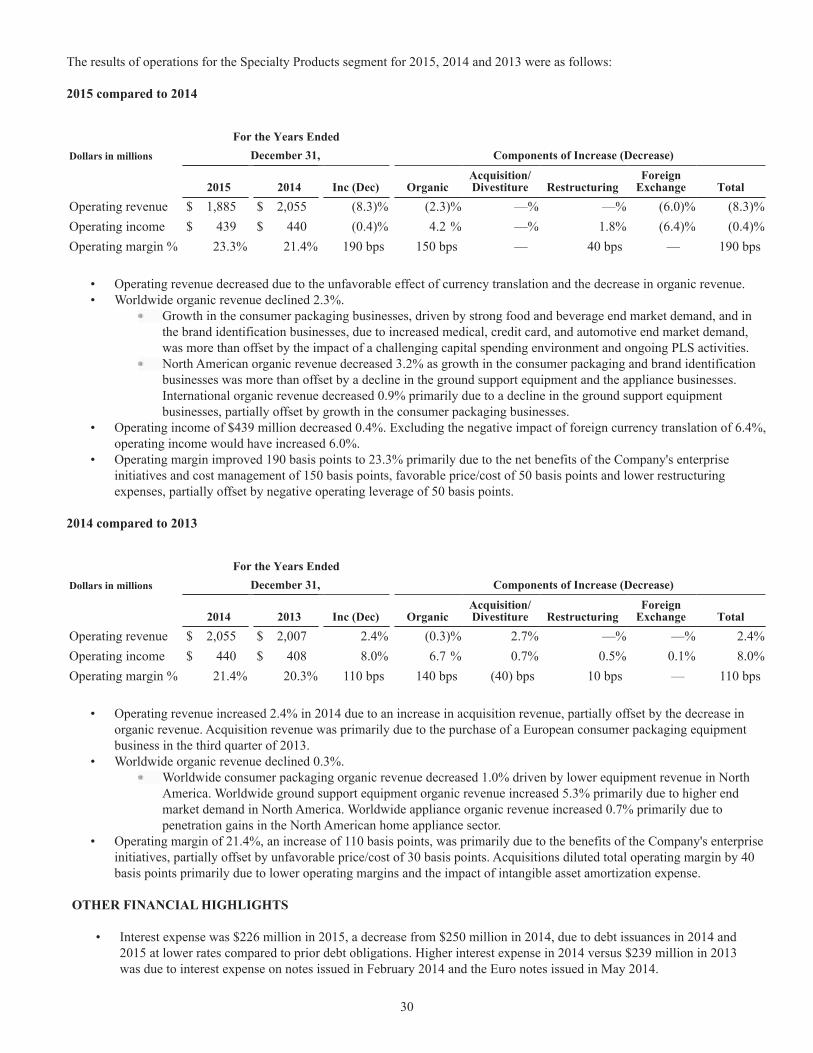
30
The results of operations for the Specialty Products segment for 2015, 2014 and 2013 were as follows:
2015 compared to 2014
For the Years EndedDollars in millions December 31, Components of Increase (Decrease)
2015 2014 Inc (Dec) OrganicAcquisition/Divestiture Restructuring
ForeignExchange Total
Operating revenue $ 1,885 $ 2,055 (8.3)% (2.3)% —% —% (6.0)% (8.3)%Operating income $ 439 $ 440 (0.4)% 4.2 % —% 1.8% (6.4)% (0.4)%Operating margin % 23.3% 21.4% 190 bps 150 bps — 40 bps — 190 bps
• Operating revenue decreased due to the unfavorable effect of currency translation and the decrease in organic revenue.• Worldwide organic revenue declined 2.3%.
Growth in the consumer packaging businesses, driven by strong food and beverage end market demand, and in the brand identification businesses, due to increased medical, credit card, and automotive end market demand, was more than offset by the impact of a challenging capital spending environment and ongoing PLS activities.North American organic revenue decreased 3.2% as growth in the consumer packaging and brand identification businesses was more than offset by a decline in the ground support equipment and the appliance businesses. International organic revenue decreased 0.9% primarily due to a decline in the ground support equipment businesses, partially offset by growth in the consumer packaging businesses.
• Operating income of $439 million decreased 0.4%. Excluding the negative impact of foreign currency translation of 6.4%,operating income would have increased 6.0%.
• Operating margin improved 190 basis points to 23.3% primarily due to the net benefits of the Company's enterprise initiatives and cost management of 150 basis points, favorable price/cost of 50 basis points and lower restructuring expenses, partially offset by negative operating leverage of 50 basis points.
2014 compared to 2013
For the Years EndedDollars in millions December 31, Components of Increase (Decrease)
2014 2013 Inc (Dec) OrganicAcquisition/Divestiture Restructuring
ForeignExchange Total
Operating revenue $ 2,055 $ 2,007 2.4% (0.3)% 2.7% —% —% 2.4%Operating income $ 440 $ 408 8.0% 6.7 % 0.7% 0.5% 0.1% 8.0%Operating margin % 21.4% 20.3% 110 bps 140 bps (40) bps 10 bps — 110 bps
• Operating revenue increased 2.4% in 2014 due to an increase in acquisition revenue, partially offset by the decrease in organic revenue. Acquisition revenue was primarily due to the purchase of a European consumer packaging equipment business in the third quarter of 2013.
• Worldwide organic revenue declined 0.3%.Worldwide consumer packaging organic revenue decreased 1.0% driven by lower equipment revenue in North America. Worldwide ground support equipment organic revenue increased 5.3% primarily due to higher end market demand in North America. Worldwide appliance organic revenue increased 0.7% primarily due to penetration gains in the North American home appliance sector.
• Operating margin of 21.4%, an increase of 110 basis points, was primarily due to the benefits of the Company's enterprise initiatives, partially offset by unfavorable price/cost of 30 basis points. Acquisitions diluted total operating margin by 40 basis points primarily due to lower operating margins and the impact of intangible asset amortization expense.
OTHER FINANCIAL HIGHLIGHTS
• Interest expense was $226 million in 2015, a decrease from $250 million in 2014, due to debt issuances in 2014 and 2015 at lower rates compared to prior debt obligations. Higher interest expense in 2014 versus $239 million in 2013 was due to interest expense on notes issued in February 2014 and the Euro notes issued in May 2014.
31
• Other income (expense) was income of $78 million in 2015, $61 million in 2014 and $72 million in 2013. Theincrease in income in 2015 versus 2014 was primarily due to a $15 million gain on the sale of a business in the first quarter of 2015. The decrease in income in 2014 versus 2013 was primarily due to a pre-tax gain of $30 million recorded in 2013 related to the acquisition of the controlling interest in an existing equity investment, partially offsetby higher interest income ($65 million in 2014 versus $50 million in 2013).
• The effective tax rate was 30.1% in 2015, 30.0% in 2014, and 30.6% in 2013. The effective tax rate for 2013 was unfavorably impacted by a $40 million discrete tax charge in the third quarter of 2013 related to the tax treatment of intercompany financing transactions that impact the taxability of foreign earnings.
• The impact of the Euro and other foreign currencies against the U.S. Dollar decreased operating revenue by approximately $995 million in 2015 versus 2014 and $110 million in 2014 versus 2013. Additionally, the impact of foreign currencies against the U.S. Dollar decreased income from continuing operations by approximately $153 million in 2015 versus 2014 and $14 million in 2014 versus 2013.
DISCONTINUED OPERATIONS
In February 2013, the Company announced that it was initiating a review process to explore strategic alternatives for the Industrial Packaging segment. In September 2013, the Company’s Board of Directors authorized a plan to commence a sale process for the Industrial Packaging segment. The Company classified the Industrial Packaging segment as held for sale beginning in the third quarter of 2013 and no longer presented this segment as part of its continuing operations.
On February 6, 2014, the Company announced that it had signed a definitive agreement to sell the Industrial Packaging business to The Carlyle Group for $3.2 billion. The transaction was completed on May 1, 2014, resulting in a pre-tax gain of $1.7 billion ($1.1 billion after-tax) in the second quarter of 2014 which was included in Income from discontinued operations.
In the third quarter of 2013, the Company also committed to plans for the divestiture of a construction distribution business previously included in the Construction Products segment and a specialty coatings business previously included in the Polymers & Fluids segment. The construction distribution and specialty coatings businesses were classified as held for sale beginning in the third quarter of 2013.
In the first quarter of 2013, the Company committed to plans for the divestiture of two transportation related businesses and a machine components business previously included in the Specialty Products segment, two construction distribution businesses previously included in the Construction Products segment, and a chemical manufacturing business previously included in the Polymers & Fluids segment. These businesses were classified as held for sale beginning in the first quarter of 2013.
The operating results of the businesses discussed above are reported as discontinued operations in the statement of income for all periods presented. As of the second quarter of 2014, the Company had completed the divestiture of all of the businesses previously classified as discontinued operations.
Income from discontinued operations was $1.1 billion in 2014 and $49 million in 2013. Income from discontinued operations in 2014 included the after-tax gain of $1.1 billion on the disposal of the Industrial Packaging business in the second quarter of 2014. Income from discontinued operations in 2013 included after-tax losses on disposals of $72 million and goodwill impairment of $42 million related to various divested businesses. Refer to the Discontinued Operations note in Item 8. Financial Statements and Supplementary Data for discussion of the Company’s discontinued operations.
NEW ACCOUNTING PRONOUNCEMENTS
In April 2014, the Financial Accounting Standards Board ("FASB") issued authoritative guidance to change the criteria for reporting discontinued operations. Under the new guidance, only disposals representing a strategic shift in a company's operations and financial results should be reported as discontinued operations, with expanded disclosures. In addition, disclosure of the pre-tax income attributable to a disposal of a significant part of an organization that does not qualify as a discontinued operation is required. The Company adopted this new guidance effective January 1, 2015. The new guidance applies prospectively to new disposals and new classifications of disposal groups held for sale after such date. As a result, this guidance did not have any impact on the Company's financial statements or related disclosures upon adoption.
In May 2014, the FASB issued authoritative guidance to change the criteria for revenue recognition. The core principle of the new standard is that revenue should be recognized to depict the transfer of promised goods or services to customers in an amount that reflects the consideration to which the entity expects to be entitled in exchange for those goods or services. In
32
addition, several new revenue recognition disclosures will be required. This guidance is effective for the Company beginning January 1, 2018. The Company is currently assessing the potential impact the guidance will have upon adoption.
In April 2015, the FASB issued authoritative guidance to simplify the balance sheet presentation of long-term debt issuance costs. Under the new guidance, long-term debt issuance costs are presented as a reduction of the carrying amount of the related long-term debt. The Company early adopted this guidance in the fourth quarter of 2015 and applied it retrospectively to all periods presented. As of December 31, 2014, the Company restated $38 million of deferred long-term debt issuance costs from Other assets to Long-term debt. Refer to the Other Assets and Debt notes in Item 8. Financial Statements and Supplementary Data for further information.
In May 2015, the FASB issued authoritative guidance removing investments measured at net asset value from the fair value hierarchy disclosures as a practical expedient. The Company early adopted this guidance in the fourth quarter of 2015 and applied it retrospectively to all periods presented. Adoption of this guidance resulted in changes to the fair value disclosures related to the Company's plan assets for pension and other postretirement benefits. Refer to the Pension and Other Postretirement Benefits note in Item 8. Financial Statements and Supplementary Data for further information.
In November 2015, the FASB issued authoritative guidance to simplify the presentation of deferred taxes. Under the new guidance, all deferred tax assets and liabilities are presented as noncurrent in the statement of financial position. TheCompany early adopted this guidance in the fourth quarter of 2015 and applied it retrospectively to all periods presented. Due to the restatement of current deferred tax assets and liabilities to noncurrent, adoption of this guidance resulted in an increase of noncurrent deferred tax assets of $37 million and a decrease of noncurrent deferred tax liabilities of $167 million as of December 31, 2014. Refer to the Income Taxes note in Item 8. Financial Statements and Supplementary Data for further information.
LIQUIDITY AND CAPITAL RESOURCES
The Company’s primary sources of liquidity are free cash flow and short-term credit facilities. In addition, the Company had $3.1 billion of cash on hand at December 31, 2015 and also maintains strong access to public debt markets. Management believes that these sources are sufficient to service debt and to finance the Company's capital allocation priorities, which include:
• internal investments to support organic growth and sustain core businesses;• payment of an attractive dividend to shareholders; and• external investments in selective strategic acquisitions that support organic growth focus and an active share
repurchase program.
In September 2013, the Company’s Board of Directors authorized a plan to commence a sale process for the Industrial Packaging business. The Company classified the Industrial Packaging segment as held for sale beginning in the third quarter of 2013 and no longer presented this segment as part of its continuing operations. As to the impact of this divestiture on the Company’s income per share from continuing operations and capital structure going forward, the Company also indicated that it intended to repurchase approximately 50 million shares through a program utilizing its existing share repurchase authorization to offset the full amount of divestiture-related dilution of income per share from continuing operations through a combination of sale proceeds, free cash flow and additional leverage. The Company completed this program in the second quarter of 2014. Under this program, the Company repurchased approximately 14.0 million shares of its common stock in the fourth quarter of 2013 and approximately 35.7 million shares of its common stock in the first half of 2014.
On February 6, 2014, the Company announced that it had signed a definitive agreement to sell the Industrial Packaging business to The Carlyle Group for $3.2 billion. The transaction was completed on May 1, 2014, resulting in a pre-tax gain of $1.7 billion ($1.1 billion after-tax) in the second quarter of 2014 which was included in Income from discontinued operations. A portion of the proceeds was used to fund share repurchases under the program noted above.
The Company believes that, based on its revenues, operating margins, current free cash flow, and credit ratings, it could readily obtain additional financing if necessary.
Cash Flow
The Company uses free cash flow to measure cash flow generated by operations that is available for dividends, share repurchases, acquisitions and debt repayment. The Company believes this non-GAAP financial measure is useful to investors
33
in evaluating the Company’s financial performance and measures the Company's ability to generate cash internally to fund Company initiatives. Free cash flow represents net cash provided by operating activities less additions to plant and equipment. Free cash flow is a measurement that is not the same as net cash flow from operating activities per the statement of cash flows and may not be consistent with similarly titled measures used by other companies. Summarized cash flow information for the years ended December 31, 2015, 2014 and 2013 was as follows:
In millions 2015 2014 2013Net cash provided by operating activities . . . . . . . . . . . . . . . . . . $ 2,299 $ 1,616 $ 2,528Additions to plant and equipment . . . . . . . . . . . . . . . . . . . . . . . . (284) (361) (368)Free cash flow . . . . . . . . . . . . . . . . . . . . . . . . . . . . . . . . . . . . . . . $ 2,015 $ 1,255 $ 2,160
Cash dividends paid. . . . . . . . . . . . . . . . . . . . . . . . . . . . . . . . . . . $ (742) $ (711) $ (528)Repurchases of common stock . . . . . . . . . . . . . . . . . . . . . . . . . . (2,002) (4,346) (2,106)Acquisition of businesses (excluding cash and equivalents)
and additional interest in affiliates. . . . . . . . . . . . . . . . . . . . . . (6) (45) (369)Net proceeds from sale of discontinued operations. . . . . . . . . . . — 3,191 206Net proceeds from (repayment of) debt. . . . . . . . . . . . . . . . . . . . 151 1,339 1,264Other . . . . . . . . . . . . . . . . . . . . . . . . . . . . . . . . . . . . . . . . . . . . . . 147 224 305Effect of exchange rate changes on cash and equivalents . . . . . . (463) (535) (93)Net increase (decrease) in cash and equivalents . . . . . . . . . . . . . $ (900) $ 372 $ 839
The 2014 net cash provided by operating activities included $724 million of tax payments related to the disposition of the Industrial Packaging business. Cash dividends paid during 2013 do not include the dividend payment of $174 million originally scheduled to be paid in January 2013, which was accelerated and paid in December 2012.
Stock Repurchase Programs
On May 6, 2011, the Company’s Board of Directors authorized a stock repurchase program, which provided for the buyback of up to $4.0 billion of the Company’s common stock over an open-ended period of time (the "2011 Program"). Under the 2011 Program, the Company repurchased approximately 1.8 million shares of its common stock at an average price of $43.20 per share during 2011, approximately 35.5 million shares of its common stock at an average price of $56.93 per share during 2012 and approximately 26.4 million shares of its common stock at an average price of $71.89 per share during 2013. As of December 31, 2013, there were no authorized repurchases remaining under the 2011 Program.
On August 2, 2013, the Company’s Board of Directors authorized a new stock repurchase program, which provided for the buyback of up to an additional $6.0 billion of the Company’s common stock over an open-ended period of time (the "2013 Program"). Under the 2013 Program, the Company repurchased approximately 3.3 million shares of its common stock at an average price of $81.62 per share during 2013, approximately 50.4 million shares of its common stock at an average price of $84.92 per share during 2014, and approximately 14.9 million shares of its common stock at an average price of $96.84during 2015. As of December 31, 2015, there were no authorized repurchases remaining under the 2013 Program.
On February 13, 2015, the Company's Board of Directors authorized a new stock repurchase program, which provides for the buyback of up to an additional $6.0 billion of the Company’s common stock over an open-ended period of time (the "2015 Program"). Under the 2015 Program, the Company repurchased approximately 6.1 million shares of its common stock at an average price of $91.78 per share during 2015. As of December 31, 2015, there was approximately $5.4 billion of authorized repurchases remaining under the 2015 Program.
Adjusted After-Tax Return on Average Invested Capital
The Company uses adjusted after-tax return on average invested capital ("ROIC") to measure the effectiveness of its operations’ use of invested capital to generate profits. ROIC is a non-GAAP financial measure that the Company believes is a meaningful metric to investors in evaluating the Company’s financial performance and may be different than the method used by other companies to calculate ROIC. Adjusted average invested capital represents the net assets of the Company, excluding cash and equivalents and outstanding debt, which are excluded as they do not represent capital investment in the Company's operations, as well as the Company's net investment in the former Industrial Packaging segment and the equity investment in
34
the Wilsonart business (formerly the Decorative Surfaces segment). Average invested capital is calculated using balances at the start of the period and at the end of each quarter.
ROIC for the years ended December 31, 2015, 2014, and 2013 was as follows:
Dollars in millions 2015 2014 2013Operating income . . . . . . . . . . . . . . . . . . . . . . . . . . . . . . . . . . $ 2,867 $ 2,888 $ 2,514
Tax rate (as adjusted in 2013) . . . . . . . . . . . . . . . . . . . . . . . . . 30.1% 30.0% 28.8%Income taxes . . . . . . . . . . . . . . . . . . . . . . . . . . . . . . . . . . . . . . (864) (866) (724)Operating income after taxes . . . . . . . . . . . . . . . . . . . . . . . . . $ 2,003 $ 2,022 $ 1,790
Invested capital:Trade receivables . . . . . . . . . . . . . . . . . . . . . . . . . . . . . . . $ 2,203 $ 2,293 $ 2,365Inventories . . . . . . . . . . . . . . . . . . . . . . . . . . . . . . . . . . . . 1,086 1,180 1,247Net assets held for sale. . . . . . . . . . . . . . . . . . . . . . . . . . . — — 1,519Net plant and equipment . . . . . . . . . . . . . . . . . . . . . . . . . 1,577 1,686 1,709Goodwill and intangible assets . . . . . . . . . . . . . . . . . . . . 5,999 6,466 6,885Accounts payable and accrued expenses . . . . . . . . . . . . . (1,585) (1,799) (1,906)Other, net . . . . . . . . . . . . . . . . . . . . . . . . . . . . . . . . . . . . . 280 427 593
Total invested capital. . . . . . . . . . . . . . . . . . . . . . . . . . . . . . . . $ 9,560 $ 10,253 $ 12,412
Average invested capital . . . . . . . . . . . . . . . . . . . . . . . . . . . . . $ 9,943 $ 11,215 $ 12,581Adjustment for Wilsonart (formerly the Decorative
Surfaces segment) . . . . . . . . . . . . . . . . . . . . . . . . . . . . . . . . (123) (154) (169)Adjustment for Industrial Packaging . . . . . . . . . . . . . . . . . . . — (424) (1,477)Adjusted average invested capital. . . . . . . . . . . . . . . . . . . . . . $ 9,820 $ 10,637 $ 10,935Adjusted return on average invested capital . . . . . . . . . . . . . . 20.4% 19.0% 16.4%
ROIC increased 140 basis points in 2015 versus 2014 as a result of a decrease in adjusted average invested capital of 7.7%. ROIC increased 260 basis points in 2014 versus 2013 as a result of improvement in after-tax operating income of 13.0% and a decrease in adjusted average invested capital of 2.7%.
The 2013 effective tax rate included a discrete tax charge of $40 million related to the tax treatment of intercompany financing transactions that impact the taxability of foreign earnings.
A reconciliation of the 2013 effective tax rate to the adjusted tax rate excluding the discrete tax item is as follows:
For the Year Ended December 31, 2013Dollars in millions Income Taxes Tax RateAs reported. . . . . . . . . . . . . . . . . . . . . . . . . . . . . . . . . . . . . . . . . . . . . . . . . . $ 717 30.6%Discrete tax charge. . . . . . . . . . . . . . . . . . . . . . . . . . . . . . . . . . . . . . . . . . . . (40) (1.8)As adjusted. . . . . . . . . . . . . . . . . . . . . . . . . . . . . . . . . . . . . . . . . . . . . . . . . . $ 677 28.8%

35
Working Capital
Management uses working capital as a measurement of the short-term liquidity of the Company. Net working capital at December 31, 2015 and 2014 is summarized as follows:
Dollars in millions 2015 2014Increase
(Decrease)Current Assets:
Cash and equivalents . . . . . . . . . . . . . . . . . . . . . . . . . . . . . . $ 3,090 $ 3,990 $ (900)Trade receivables . . . . . . . . . . . . . . . . . . . . . . . . . . . . . . . . . 2,203 2,293 (90)Inventories . . . . . . . . . . . . . . . . . . . . . . . . . . . . . . . . . . . . . . 1,086 1,180 (94)Other . . . . . . . . . . . . . . . . . . . . . . . . . . . . . . . . . . . . . . . . . . 341 401 (60)
6,720 7,864 (1,144)Current Liabilities:
Short-term debt . . . . . . . . . . . . . . . . . . . . . . . . . . . . . . . . . . 526 1,476 (950)Accounts payable and accrued expenses . . . . . . . . . . . . . . . 1,585 1,799 (214)Other . . . . . . . . . . . . . . . . . . . . . . . . . . . . . . . . . . . . . . . . . . 257 250 7
2,368 3,525 (1,157)Net Working Capital . . . . . . . . . . . . . . . . . . . . . . . . . . . . . . . . . . $ 4,352 $ 4,339 $ 13
Net working capital increased slightly at December 31, 2015 as lower short-term debt levels were partially offset by lower cash and equivalents resulting from repayments of commercial paper.
Cash and equivalents totaled approximately $3.1 billion as of December 31, 2015 and $4.0 billion as of December 31, 2014,primarily all of which was held by international subsidiaries. Cash and equivalents held internationally may be subject to U.S. income taxes and foreign withholding taxes if repatriated to the U.S. Cash and equivalents balances held internationally are typically used for international operating needs, reinvested to fund expansion of existing international businesses, used to fund new international acquisitions, or used to repay debt held internationally. In the U.S., the Company utilizes cash flows from domestic operations to fund domestic cash needs, which primarily consist of dividend payments, share repurchases, acquisitions, servicing of domestic debt obligations and general corporate needs. The Company also uses its commercial paper program, which is backed by long-term credit facilities, for short-term liquidity needs. The Company believes cash generated domestically and liquidity provided by the Company's commercial paper program will continue to be sufficient to fund cash requirements in the U.S.
Debt
Total debt at December 31, 2015 and 2014 was as follows:
In millions 2015 2014Increase
(Decrease)Short-term debt . . . . . . . . . . . . . . . . . . . . . . . . . . . . . . . . . . . . . $ 526 $ 1,476 $ (950)Long-term debt. . . . . . . . . . . . . . . . . . . . . . . . . . . . . . . . . . . . . . 6,896 5,943 953Total debt . . . . . . . . . . . . . . . . . . . . . . . . . . . . . . . . . . . . . . . . . . $ 7,422 $ 7,419 $ 3
Short-term debt as of December 31, 2015 and December 31, 2014 included commercial paper of $0.5 billion and $1.4 billion,respectively.
In May 2015, the Company issued €500 million of 1.25% Euro notes due May 22, 2023 at 99.239% of face value and €500million of 2.125% Euro notes due May 22, 2030 at 99.303% of face value. Net proceeds from the May 2015 debt issuances were used to repay commercial paper and for general corporate purposes.
The Company may issue commercial paper to fund general corporate needs, share repurchases, and small and medium-sized acquisitions. The Company has committed lines of credit of $2.5 billion in the U.S. to support the potential issuances of commercial paper. Of this amount, $1.5 billion is provided under a line of credit agreement with a termination date of June 8,
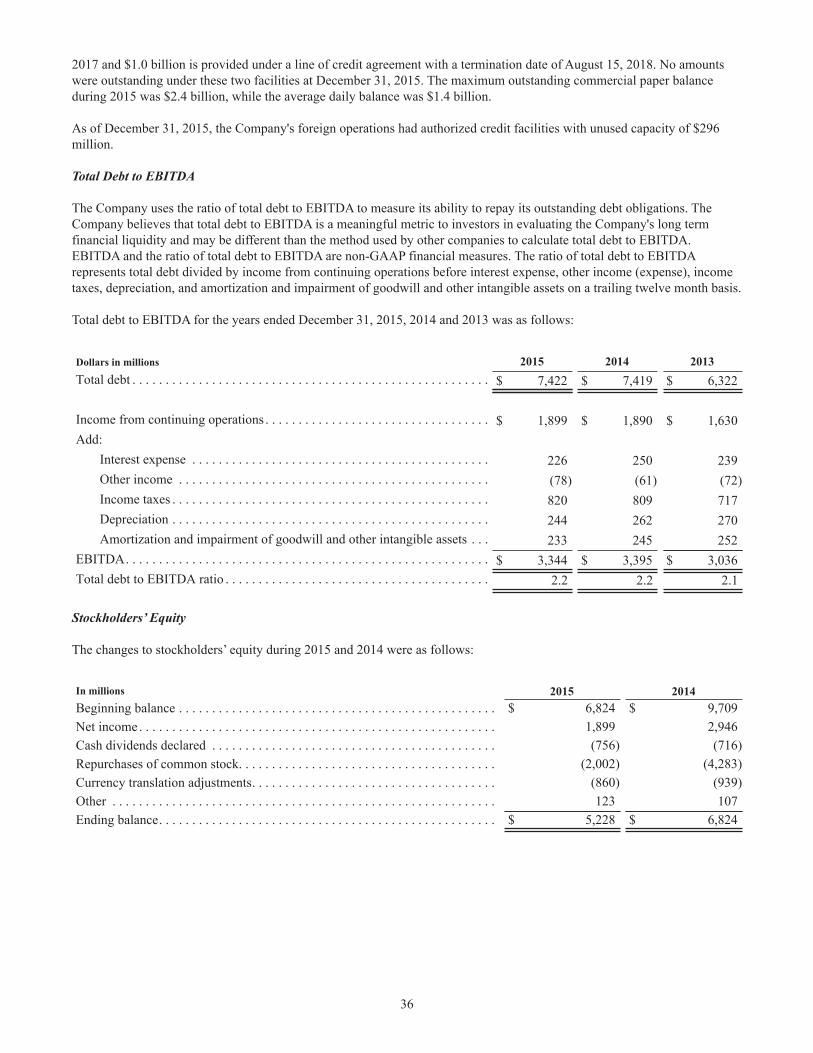
36
2017 and $1.0 billion is provided under a line of credit agreement with a termination date of August 15, 2018. No amounts were outstanding under these two facilities at December 31, 2015. The maximum outstanding commercial paper balance during 2015 was $2.4 billion, while the average daily balance was $1.4 billion.
As of December 31, 2015, the Company's foreign operations had authorized credit facilities with unused capacity of $296million.
Total Debt to EBITDA
The Company uses the ratio of total debt to EBITDA to measure its ability to repay its outstanding debt obligations. TheCompany believes that total debt to EBITDA is a meaningful metric to investors in evaluating the Company's long term financial liquidity and may be different than the method used by other companies to calculate total debt to EBITDA. EBITDA and the ratio of total debt to EBITDA are non-GAAP financial measures. The ratio of total debt to EBITDArepresents total debt divided by income from continuing operations before interest expense, other income (expense), income taxes, depreciation, and amortization and impairment of goodwill and other intangible assets on a trailing twelve month basis.
Total debt to EBITDA for the years ended December 31, 2015, 2014 and 2013 was as follows:
Dollars in millions 2015 2014 2013Total debt . . . . . . . . . . . . . . . . . . . . . . . . . . . . . . . . . . . . . . . . . . . . . . . . . . . . . . $ 7,422 $ 7,419 $ 6,322
Income from continuing operations . . . . . . . . . . . . . . . . . . . . . . . . . . . . . . . . . . $ 1,899 $ 1,890 $ 1,630Add:
Interest expense . . . . . . . . . . . . . . . . . . . . . . . . . . . . . . . . . . . . . . . . . . . . . 226 250 239Other income . . . . . . . . . . . . . . . . . . . . . . . . . . . . . . . . . . . . . . . . . . . . . . . (78) (61) (72)Income taxes . . . . . . . . . . . . . . . . . . . . . . . . . . . . . . . . . . . . . . . . . . . . . . . . 820 809 717Depreciation . . . . . . . . . . . . . . . . . . . . . . . . . . . . . . . . . . . . . . . . . . . . . . . . 244 262 270Amortization and impairment of goodwill and other intangible assets . . . 233 245 252
EBITDA. . . . . . . . . . . . . . . . . . . . . . . . . . . . . . . . . . . . . . . . . . . . . . . . . . . . . . . $ 3,344 $ 3,395 $ 3,036Total debt to EBITDA ratio . . . . . . . . . . . . . . . . . . . . . . . . . . . . . . . . . . . . . . . . 2.2 2.2 2.1
Stockholders’ Equity
The changes to stockholders’ equity during 2015 and 2014 were as follows:
In millions 2015 2014Beginning balance . . . . . . . . . . . . . . . . . . . . . . . . . . . . . . . . . . . . . . . . . . . . . . . . $ 6,824 $ 9,709Net income. . . . . . . . . . . . . . . . . . . . . . . . . . . . . . . . . . . . . . . . . . . . . . . . . . . . . . 1,899 2,946Cash dividends declared . . . . . . . . . . . . . . . . . . . . . . . . . . . . . . . . . . . . . . . . . . . (756) (716)Repurchases of common stock. . . . . . . . . . . . . . . . . . . . . . . . . . . . . . . . . . . . . . . (2,002) (4,283)Currency translation adjustments. . . . . . . . . . . . . . . . . . . . . . . . . . . . . . . . . . . . . (860) (939)Other . . . . . . . . . . . . . . . . . . . . . . . . . . . . . . . . . . . . . . . . . . . . . . . . . . . . . . . . . . 123 107Ending balance. . . . . . . . . . . . . . . . . . . . . . . . . . . . . . . . . . . . . . . . . . . . . . . . . . . $ 5,228 $ 6,824
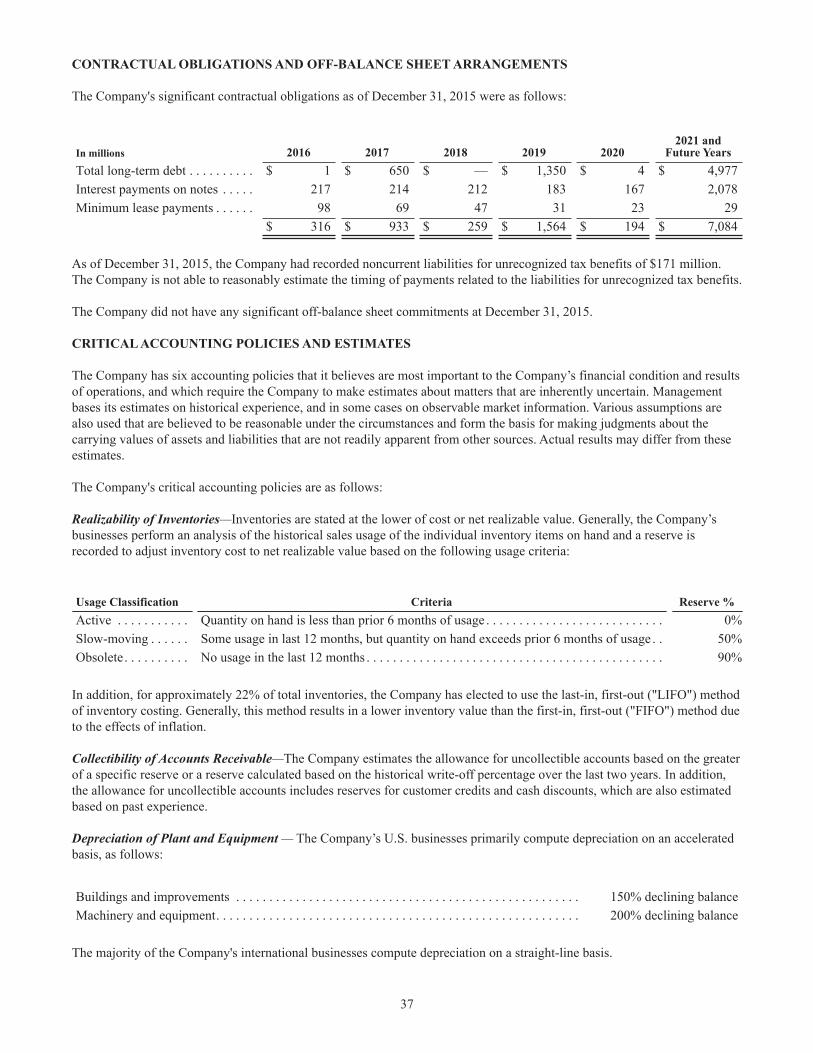
37
CONTRACTUAL OBLIGATIONS AND OFF-BALANCE SHEET ARRANGEMENTS
The Company's significant contractual obligations as of December 31, 2015 were as follows:
In millions 2016 2017 2018 2019 20202021 and
Future YearsTotal long-term debt . . . . . . . . . . $ 1 $ 650 $ — $ 1,350 $ 4 $ 4,977Interest payments on notes . . . . . 217 214 212 183 167 2,078Minimum lease payments . . . . . . 98 69 47 31 23 29
$ 316 $ 933 $ 259 $ 1,564 $ 194 $ 7,084
As of December 31, 2015, the Company had recorded noncurrent liabilities for unrecognized tax benefits of $171 million.The Company is not able to reasonably estimate the timing of payments related to the liabilities for unrecognized tax benefits.
The Company did not have any significant off-balance sheet commitments at December 31, 2015.
CRITICAL ACCOUNTING POLICIES AND ESTIMATES
The Company has six accounting policies that it believes are most important to the Company’s financial condition and results of operations, and which require the Company to make estimates about matters that are inherently uncertain. Management bases its estimates on historical experience, and in some cases on observable market information. Various assumptions are also used that are believed to be reasonable under the circumstances and form the basis for making judgments about the carrying values of assets and liabilities that are not readily apparent from other sources. Actual results may differ from these estimates.
The Company's critical accounting policies are as follows:
Realizability of Inventories—Inventories are stated at the lower of cost or net realizable value. Generally, the Company’sbusinesses perform an analysis of the historical sales usage of the individual inventory items on hand and a reserve is recorded to adjust inventory cost to net realizable value based on the following usage criteria:
Usage Classification Criteria Reserve %Active . . . . . . . . . . . Quantity on hand is less than prior 6 months of usage . . . . . . . . . . . . . . . . . . . . . . . . . . . 0%Slow-moving . . . . . . Some usage in last 12 months, but quantity on hand exceeds prior 6 months of usage . . 50%Obsolete. . . . . . . . . . No usage in the last 12 months . . . . . . . . . . . . . . . . . . . . . . . . . . . . . . . . . . . . . . . . . . . . . 90%
In addition, for approximately 22% of total inventories, the Company has elected to use the last-in, first-out ("LIFO") method of inventory costing. Generally, this method results in a lower inventory value than the first-in, first-out ("FIFO") method due to the effects of inflation.
Collectibility of Accounts Receivable—The Company estimates the allowance for uncollectible accounts based on the greater of a specific reserve or a reserve calculated based on the historical write-off percentage over the last two years. In addition, the allowance for uncollectible accounts includes reserves for customer credits and cash discounts, which are also estimated based on past experience.
Depreciation of Plant and Equipment — The Company’s U.S. businesses primarily compute depreciation on an accelerated basis, as follows:
Buildings and improvements . . . . . . . . . . . . . . . . . . . . . . . . . . . . . . . . . . . . . . . . . . . . . . . . . . . . 150% declining balanceMachinery and equipment. . . . . . . . . . . . . . . . . . . . . . . . . . . . . . . . . . . . . . . . . . . . . . . . . . . . . . . 200% declining balance
The majority of the Company's international businesses compute depreciation on a straight-line basis.
38
Income Taxes—The Company provides deferred income tax assets and liabilities based on the estimated future tax effects of differences between the financial and tax bases of assets and liabilities based on currently enacted tax laws. The Company’sdeferred and other tax balances are based on management’s interpretation of the tax regulations and rulings in numerous taxing jurisdictions. Income tax expense, assets and liabilities recognized by the Company also reflect its best estimates and assumptions regarding, among other things, the level of future taxable income, the effect of the Company’s various tax planning strategies and uncertain tax positions. Future tax authority rulings and changes in tax laws, changes in projected levels of taxable income and future tax planning strategies could affect the actual effective tax rate and tax balances recorded by the Company.
Goodwill and Intangible Assets—The Company’s business acquisitions typically result in recording goodwill and other intangible assets, which are a significant portion of the Company’s total assets and affect the amount of amortization expense and impairment charges that the Company could incur in future periods. The Company follows the guidance prescribed in the accounting standards to test goodwill and intangible assets for impairment. On an annual basis, or more frequently if triggering events occur, the Company compares the estimated fair value of its reporting units to the carrying value of each reporting unit to determine if a potential goodwill impairment exists. If the fair value of a reporting unit is less than its carrying value, an impairment loss, if any, is recorded for the difference between the implied fair value and the carrying value of the reporting unit’s goodwill. In calculating the fair value of the reporting units or specific intangible assets, management relies on a number of factors, including business plans, economic projections, anticipated future cash flows, comparable transactions and other market data. There are inherent uncertainties related to these factors and management’s judgment in applying them in the impairment tests of goodwill and other intangible assets.
As of December 31, 2015, the Company had total goodwill and intangible assets of $6.0 billion allocated to its reporting units. Although there can be no assurance that the Company will not incur additional impairment charges related to its goodwill and other intangible assets, the Company generally believes the risk of significant impairment charges is lessened by the number of diversified businesses and end markets represented by its reporting units that have goodwill and other intangible assets. In addition, the individual businesses in many of the reporting units have been acquired over a long period of time, and in many cases have been able to improve their performance, primarily as a result of the application of the Company’s 80/20 management process. The amount of goodwill and other intangible assets allocated to individual reporting units ranges from approximately $58 million to $1.5 billion, with the average amount equal to $428 million. Fair value determinations require considerable judgment and are sensitive to changes in the factors described above. Due to the inherent uncertainties associated with these factors and economic conditions in the Company’s global end markets, impairment charges related to one or more reporting units could occur in future periods.
Pension and Other Postretirement Benefits—The Company has various company-sponsored defined benefit retirement plans covering a substantial portion of U.S. employees and many employees outside the U.S. Pension and other postretirement benefit expense and obligations are determined based on actuarial valuations. Pension benefit obligations are generally based on each participant’s years of service, future compensation, and age at retirement or termination. Important assumptions in determining pension and postretirement expense and obligations are the discount rate, the expected long-term return on plan assets, life expectancy, and health care cost trend rates. Future changes in any of these assumptions could materially affect the amounts recorded related to the Company's pension and other postretirement benefit plans. See the Pension and Other Postretirement Benefits note in Item 8. Financial Statements and Supplementary Data for additional discussion of actuarial assumptions used in determining pension and postretirement health care liabilities and expenses.
The Company determines the discount rate used to measure plan liabilities as of the year-end measurement date for the U.S. primary pension plan. The discount rate reflects the current rate at which the associated liabilities could theoretically be effectively settled at the end of the year. In estimating this rate, the Company looks at rates of return on high-quality fixed income investments, with similar duration to the liabilities in the plan. A 25 basis point decrease in the discount rate would increase the present value of the U.S. primary pension plan obligation by approximately $37 million.
The expected long-term return on plan assets is based on historical and expected long-term returns for similar investment allocations among asset classes. For the U.S. primary pension plan, a 25 basis point decrease in the expected return on plan assets would increase the annual pension expense by approximately $4 million. See the Pension and Other Postretirement Benefits note in Item 8. Financial Statements and Supplementary Data for information on the Company's pension and other postretirement benefit plans and related assumptions.
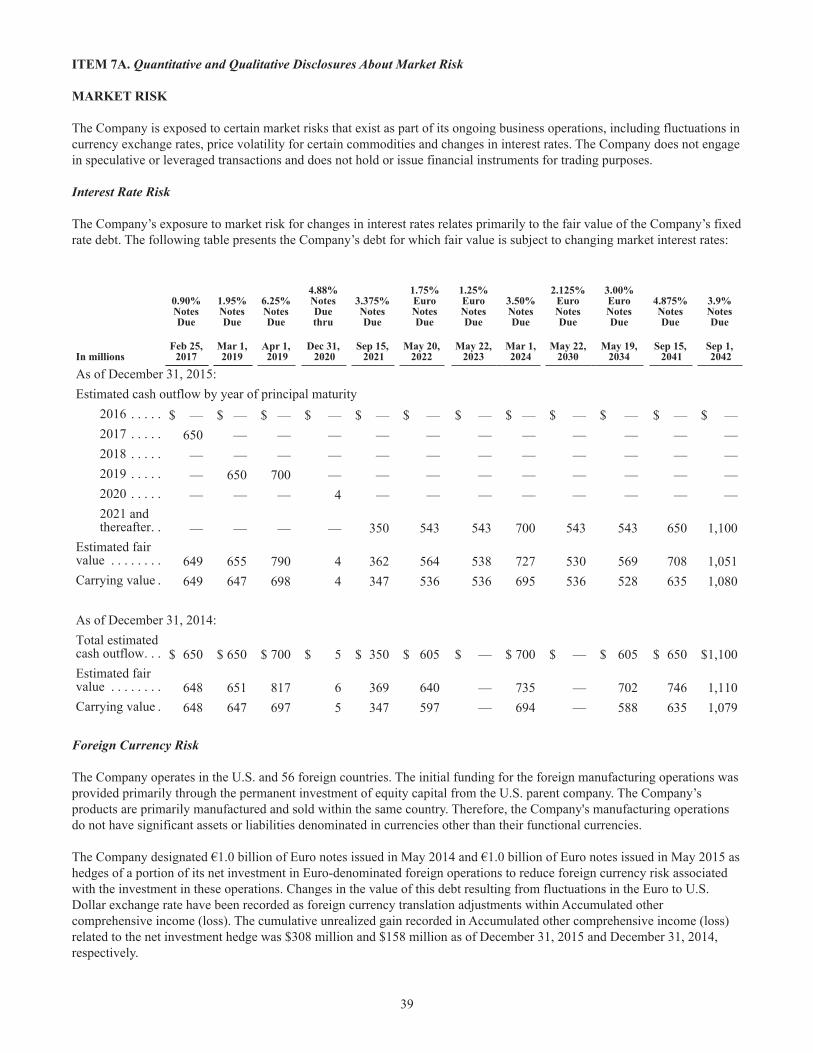
39
ITEM 7A. Quantitative and Qualitative Disclosures About Market Risk
MARKET RISK
The Company is exposed to certain market risks that exist as part of its ongoing business operations, including fluctuations in currency exchange rates, price volatility for certain commodities and changes in interest rates. The Company does not engage in speculative or leveraged transactions and does not hold or issue financial instruments for trading purposes.
Interest Rate Risk
The Company’s exposure to market risk for changes in interest rates relates primarily to the fair value of the Company’s fixed rate debt. The following table presents the Company’s debt for which fair value is subject to changing market interest rates:
0.90%NotesDue
1.95%NotesDue
6.25%NotesDue
4.88%NotesDuethru
3.375%NotesDue
1.75%EuroNotesDue
1.25%EuroNotesDue
3.50%NotesDue
2.125%EuroNotesDue
3.00%EuroNotesDue
4.875%NotesDue
3.9%NotesDue
In millionsFeb 25,
2017Mar 1, 2019
Apr 1, 2019
Dec 31, 2020
Sep 15, 2021
May 20, 2022
May 22, 2023
Mar 1, 2024
May 22, 2030
May 19, 2034
Sep 15, 2041
Sep 1, 2042
As of December 31, 2015:Estimated cash outflow by year of principal maturity
2016 . . . . . $ — $ — $ — $ — $ — $ — $ — $ — $ — $ — $ — $ —2017 . . . . . 650 — — — — — — — — — — —2018 . . . . . — — — — — — — — — — — —2019 . . . . . — 650 700 — — — — — — — — —2020 . . . . . — — — 4 — — — — — — — —2021 andthereafter. . — — — — 350 543 543 700 543 543 650 1,100
Estimated fairvalue . . . . . . . . 649 655 790 4 362 564 538 727 530 569 708 1,051Carrying value . 649 647 698 4 347 536 536 695 536 528 635 1,080
As of December 31, 2014:Total estimatedcash outflow. . . $ 650 $ 650 $ 700 $ 5 $ 350 $ 605 $ — $ 700 $ — $ 605 $ 650 $1,100Estimated fairvalue . . . . . . . . 648 651 817 6 369 640 — 735 — 702 746 1,110Carrying value . 648 647 697 5 347 597 — 694 — 588 635 1,079
Foreign Currency Risk
The Company operates in the U.S. and 56 foreign countries. The initial funding for the foreign manufacturing operations was provided primarily through the permanent investment of equity capital from the U.S. parent company. The Company’sproducts are primarily manufactured and sold within the same country. Therefore, the Company's manufacturing operations do not have significant assets or liabilities denominated in currencies other than their functional currencies.
The Company designated €1.0 billion of Euro notes issued in May 2014 and €1.0 billion of Euro notes issued in May 2015 as hedges of a portion of its net investment in Euro-denominated foreign operations to reduce foreign currency risk associated with the investment in these operations. Changes in the value of this debt resulting from fluctuations in the Euro to U.S. Dollar exchange rate have been recorded as foreign currency translation adjustments within Accumulated other comprehensive income (loss). The cumulative unrealized gain recorded in Accumulated other comprehensive income (loss) related to the net investment hedge was $308 million and $158 million as of December 31, 2015 and December 31, 2014,respectively.
40
ITEM 8. Financial Statements and Supplementary Data
MANAGEMENT REPORT ON INTERNAL CONTROL OVER FINANCIAL REPORTING
The management of Illinois Tool Works Inc. (the "Company" or "ITW") is responsible for establishing and maintaining adequate internal control over financial reporting, as such term is defined in Exchange Act Rule 13a-15(f). ITW’s internal control system was designed to provide reasonable assurance to the Company’s management and Board of Directors regarding the preparation and fair presentation of published financial statements.
All internal control systems, no matter how well designed, have inherent limitations. Therefore, even those systems determined to be effective can provide only reasonable assurance with respect to financial statement preparation and presentation.
ITW management assessed the effectiveness of the Company’s internal control over financial reporting as of December 31,2015. In making this assessment, it used the criteria set forth by the Committee of Sponsoring Organizations of the TreadwayCommission (COSO) in Internal Control—Integrated Framework (2013). Based on our assessment we believe that, as of December 31, 2015, the Company’s internal control over financial reporting is effective based on those criteria.
The effectiveness of the Company’s internal control over financial reporting as of December 31, 2015 has been audited by Deloitte & Touche LLP, an independent registered public accounting firm, as stated in their report herein.
/s/ E. Scott SantiE. Scott SantiChairman & Chief Executive OfficerFebruary 11, 2016
/s/ Michael M. LarsenMichael M. LarsenSenior Vice President & Chief Financial OfficerFebruary 11, 2016
41
REPORT OF INDEPENDENT REGISTERED PUBLIC ACCOUNTING FIRM
To the Board of Directors and Stockholders of Illinois Tool Works Inc. Glenview, Illinois
We have audited the accompanying consolidated statements of financial position of Illinois Tool Works Inc. and subsidiaries (the "Company") as of December 31, 2015 and 2014, and the related consolidated statements of income, comprehensive income, income reinvested in the business, and cash flows for each of the three years in the period ended December 31, 2015. We also have audited the Company's internal control over financial reporting as of December 31, 2015, based on criteria established in Internal Control - Integrated Framework (2013) issued by the Committee of Sponsoring Organizations of the Treadway Commission. The Company's management is responsible for these financial statements, for maintaining effectiveinternal control over financial reporting, and for its assessment of the effectiveness of internal control over financial reporting, included in the accompanying Management Report on Internal Control over Financial Reporting. Our responsibility is to express an opinion on these financial statements and an opinion on the Company's internal control over financial reporting based on our audits.
We conducted our audits in accordance with the standards of the Public Company Accounting Oversight Board (United States). Those standards require that we plan and perform the audit to obtain reasonable assurance about whether the financial statements are free of material misstatement and whether effective internal control over financial reporting was maintained in all material respects. Our audits of the financial statements included examining, on a test basis, evidence supporting the amounts and disclosures in the financial statements, assessing the accounting principles used and significant estimates made by management, and evaluating the overall financial statement presentation. Our audit of internal control over financial reporting included obtaining an understanding of internal control over financial reporting, assessing the risk that a material weakness exists, and testing and evaluating the design and operating effectiveness of internal control based on the assessed risk. Our audits also included performing such other procedures as we considered necessary in the circumstances. We believe that our audits provide a reasonable basis for our opinions.
A company's internal control over financial reporting is a process designed by, or under the supervision of, the company's principal executive and principal financial officers, or persons performing similar functions, and effected by the company's board of directors, management, and other personnel to provide reasonable assurance regarding the reliability of financial reporting and the preparation of financial statements for external purposes in accordance with generally accepted accounting principles. A company's internal control over financial reporting includes those policies and procedures that (1) pertain to the maintenance of records that, in reasonable detail, accurately and fairly reflect the transactions and dispositions of the assets of the company; (2) provide reasonable assurance that transactions are recorded as necessary to permit preparation of financial statements in accordance with generally accepted accounting principles, and that receipts and expenditures of the company are being made only in accordance with authorizations of management and directors of the company; and (3) provide reasonable assurance regarding prevention or timely detection of unauthorized acquisition, use, or disposition of the company's assets that could have a material effect on the financial statements.
Because of the inherent limitations of internal control over financial reporting, including the possibility of collusion or improper management override of controls, material misstatements due to error or fraud may not be prevented or detected on a timely basis. Also, projections of any evaluation of the effectiveness of the internal control over financial reporting to future periods are subject to the risk that the controls may become inadequate because of changes in conditions, or that the degree of compliance with the policies or procedures may deteriorate.
In our opinion, the consolidated financial statements referred to above present fairly, in all material respects, the financial position of Illinois Tool Works Inc. and subsidiaries as of December 31, 2015 and 2014, and the results of their operations and their cash flows for each of the three years in the period ended December 31, 2015, in conformity with accounting principles generally accepted in the United States of America. Also, in our opinion, the Company maintained, in all material respects, effective internal control over financial reporting as of December 31, 2015, based on the criteria established in Internal Control - Integrated Framework (2013) issued by the Committee of Sponsoring Organizations of the TreadwayCommission.
/s/ DELOITTE & TOUCHE LLPDeloitte & Touche LLPChicago, IllinoisFebruary 11, 2016
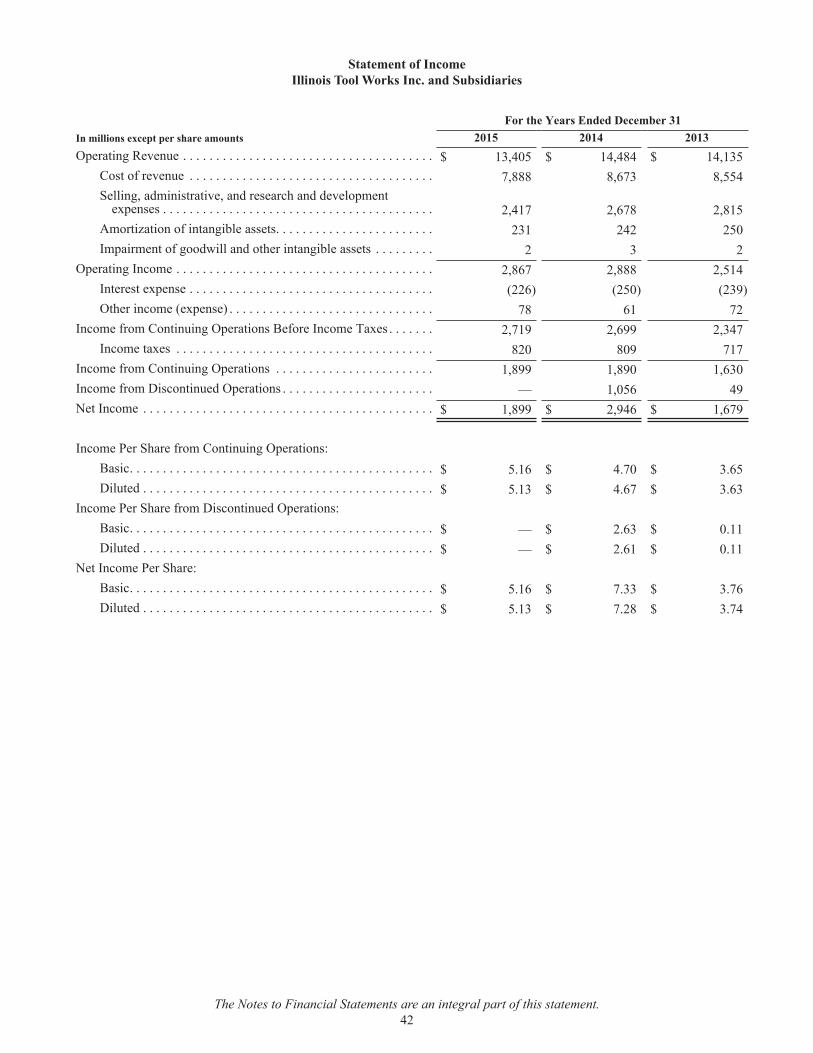
The Notes to Financial Statements are an integral part of this statement.42
Statement of IncomeIllinois Tool Works Inc. and Subsidiaries
For the Years Ended December 31In millions except per share amounts 2015 2014 2013Operating Revenue . . . . . . . . . . . . . . . . . . . . . . . . . . . . . . . . . . . . . . $ 13,405 $ 14,484 $ 14,135
Cost of revenue . . . . . . . . . . . . . . . . . . . . . . . . . . . . . . . . . . . . . 7,888 8,673 8,554Selling, administrative, and research and development
expenses . . . . . . . . . . . . . . . . . . . . . . . . . . . . . . . . . . . . . . . . . 2,417 2,678 2,815Amortization of intangible assets. . . . . . . . . . . . . . . . . . . . . . . . 231 242 250Impairment of goodwill and other intangible assets . . . . . . . . . 2 3 2
Operating Income . . . . . . . . . . . . . . . . . . . . . . . . . . . . . . . . . . . . . . . 2,867 2,888 2,514Interest expense . . . . . . . . . . . . . . . . . . . . . . . . . . . . . . . . . . . . . (226) (250) (239)Other income (expense) . . . . . . . . . . . . . . . . . . . . . . . . . . . . . . . 78 61 72
Income from Continuing Operations Before Income Taxes . . . . . . . 2,719 2,699 2,347Income taxes . . . . . . . . . . . . . . . . . . . . . . . . . . . . . . . . . . . . . . . 820 809 717
Income from Continuing Operations . . . . . . . . . . . . . . . . . . . . . . . . 1,899 1,890 1,630Income from Discontinued Operations . . . . . . . . . . . . . . . . . . . . . . . — 1,056 49Net Income . . . . . . . . . . . . . . . . . . . . . . . . . . . . . . . . . . . . . . . . . . . . $ 1,899 $ 2,946 $ 1,679
Income Per Share from Continuing Operations:Basic. . . . . . . . . . . . . . . . . . . . . . . . . . . . . . . . . . . . . . . . . . . . . . $ 5.16 $ 4.70 $ 3.65Diluted . . . . . . . . . . . . . . . . . . . . . . . . . . . . . . . . . . . . . . . . . . . . $ 5.13 $ 4.67 $ 3.63
Income Per Share from Discontinued Operations:Basic. . . . . . . . . . . . . . . . . . . . . . . . . . . . . . . . . . . . . . . . . . . . . . $ — $ 2.63 $ 0.11Diluted . . . . . . . . . . . . . . . . . . . . . . . . . . . . . . . . . . . . . . . . . . . . $ — $ 2.61 $ 0.11
Net Income Per Share:Basic. . . . . . . . . . . . . . . . . . . . . . . . . . . . . . . . . . . . . . . . . . . . . . $ 5.16 $ 7.33 $ 3.76Diluted . . . . . . . . . . . . . . . . . . . . . . . . . . . . . . . . . . . . . . . . . . . . $ 5.13 $ 7.28 $ 3.74
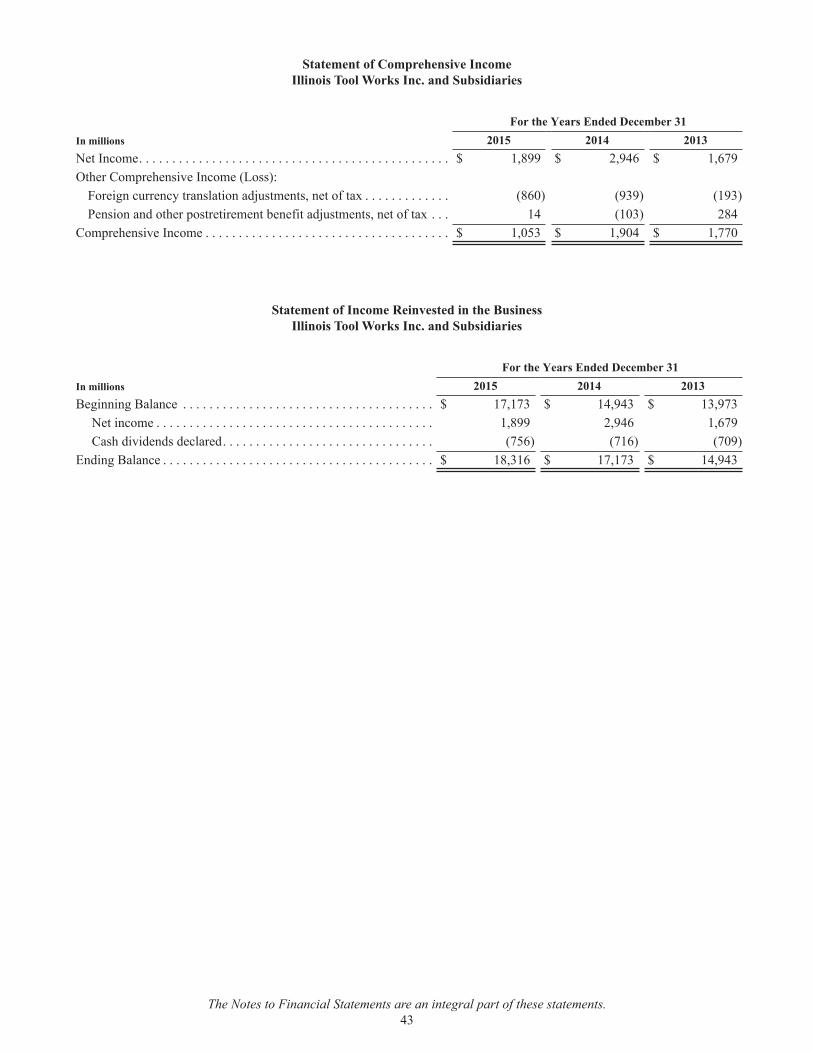
The Notes to Financial Statements are an integral part of these statements.43
Statement of Comprehensive IncomeIllinois Tool Works Inc. and Subsidiaries
For the Years Ended December 31In millions 2015 2014 2013Net Income. . . . . . . . . . . . . . . . . . . . . . . . . . . . . . . . . . . . . . . . . . . . . . . $ 1,899 $ 2,946 $ 1,679Other Comprehensive Income (Loss):
Foreign currency translation adjustments, net of tax . . . . . . . . . . . . . (860) (939) (193)Pension and other postretirement benefit adjustments, net of tax . . . 14 (103) 284
Comprehensive Income . . . . . . . . . . . . . . . . . . . . . . . . . . . . . . . . . . . . . $ 1,053 $ 1,904 $ 1,770
Statement of Income Reinvested in the BusinessIllinois Tool Works Inc. and Subsidiaries
For the Years Ended December 31In millions 2015 2014 2013Beginning Balance . . . . . . . . . . . . . . . . . . . . . . . . . . . . . . . . . . . . . . $ 17,173 $ 14,943 $ 13,973
Net income . . . . . . . . . . . . . . . . . . . . . . . . . . . . . . . . . . . . . . . . . . 1,899 2,946 1,679Cash dividends declared. . . . . . . . . . . . . . . . . . . . . . . . . . . . . . . . (756) (716) (709)
Ending Balance . . . . . . . . . . . . . . . . . . . . . . . . . . . . . . . . . . . . . . . . . $ 18,316 $ 17,173 $ 14,943
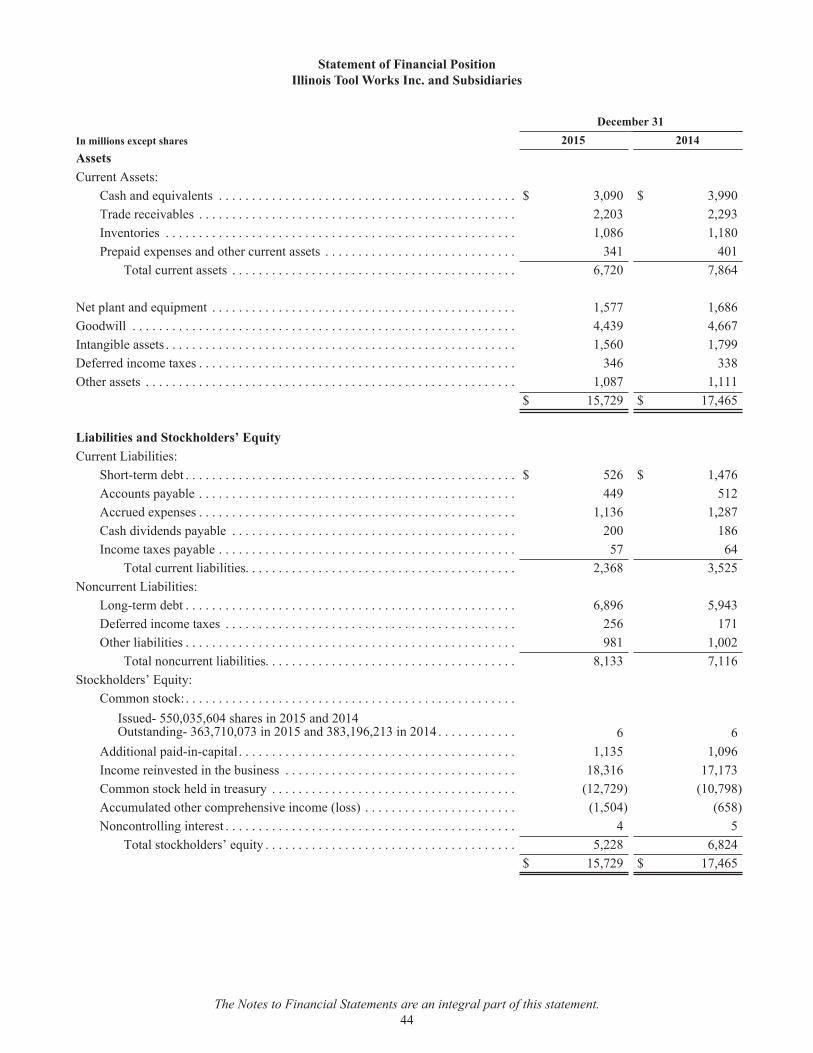
The Notes to Financial Statements are an integral part of this statement.44
Statement of Financial PositionIllinois Tool Works Inc. and Subsidiaries
December 31In millions except shares 2015 2014AssetsCurrent Assets:
Cash and equivalents . . . . . . . . . . . . . . . . . . . . . . . . . . . . . . . . . . . . . . . . . . . . . $ 3,090 $ 3,990Trade receivables . . . . . . . . . . . . . . . . . . . . . . . . . . . . . . . . . . . . . . . . . . . . . . . . 2,203 2,293Inventories . . . . . . . . . . . . . . . . . . . . . . . . . . . . . . . . . . . . . . . . . . . . . . . . . . . . . 1,086 1,180Prepaid expenses and other current assets . . . . . . . . . . . . . . . . . . . . . . . . . . . . . 341 401
Total current assets . . . . . . . . . . . . . . . . . . . . . . . . . . . . . . . . . . . . . . . . . . . 6,720 7,864
Net plant and equipment . . . . . . . . . . . . . . . . . . . . . . . . . . . . . . . . . . . . . . . . . . . . . . 1,577 1,686Goodwill . . . . . . . . . . . . . . . . . . . . . . . . . . . . . . . . . . . . . . . . . . . . . . . . . . . . . . . . . . 4,439 4,667Intangible assets . . . . . . . . . . . . . . . . . . . . . . . . . . . . . . . . . . . . . . . . . . . . . . . . . . . . . 1,560 1,799Deferred income taxes . . . . . . . . . . . . . . . . . . . . . . . . . . . . . . . . . . . . . . . . . . . . . . . . 346 338Other assets . . . . . . . . . . . . . . . . . . . . . . . . . . . . . . . . . . . . . . . . . . . . . . . . . . . . . . . . 1,087 1,111
$ 15,729 $ 17,465
Liabilities and Stockholders’ EquityCurrent Liabilities:
Short-term debt . . . . . . . . . . . . . . . . . . . . . . . . . . . . . . . . . . . . . . . . . . . . . . . . . . $ 526 $ 1,476Accounts payable . . . . . . . . . . . . . . . . . . . . . . . . . . . . . . . . . . . . . . . . . . . . . . . . 449 512Accrued expenses . . . . . . . . . . . . . . . . . . . . . . . . . . . . . . . . . . . . . . . . . . . . . . . . 1,136 1,287Cash dividends payable . . . . . . . . . . . . . . . . . . . . . . . . . . . . . . . . . . . . . . . . . . . 200 186Income taxes payable . . . . . . . . . . . . . . . . . . . . . . . . . . . . . . . . . . . . . . . . . . . . . 57 64
Total current liabilities. . . . . . . . . . . . . . . . . . . . . . . . . . . . . . . . . . . . . . . . . 2,368 3,525Noncurrent Liabilities:
Long-term debt . . . . . . . . . . . . . . . . . . . . . . . . . . . . . . . . . . . . . . . . . . . . . . . . . . 6,896 5,943Deferred income taxes . . . . . . . . . . . . . . . . . . . . . . . . . . . . . . . . . . . . . . . . . . . . 256 171Other liabilities . . . . . . . . . . . . . . . . . . . . . . . . . . . . . . . . . . . . . . . . . . . . . . . . . . 981 1,002
Total noncurrent liabilities. . . . . . . . . . . . . . . . . . . . . . . . . . . . . . . . . . . . . . 8,133 7,116Stockholders’ Equity:
Common stock:. . . . . . . . . . . . . . . . . . . . . . . . . . . . . . . . . . . . . . . . . . . . . . . . . .Issued- 550,035,604 shares in 2015 and 2014Outstanding- 363,710,073 in 2015 and 383,196,213 in 2014 . . . . . . . . . . . . 6 6
Additional paid-in-capital . . . . . . . . . . . . . . . . . . . . . . . . . . . . . . . . . . . . . . . . . . 1,135 1,096Income reinvested in the business . . . . . . . . . . . . . . . . . . . . . . . . . . . . . . . . . . . 18,316 17,173Common stock held in treasury . . . . . . . . . . . . . . . . . . . . . . . . . . . . . . . . . . . . . (12,729) (10,798)Accumulated other comprehensive income (loss) . . . . . . . . . . . . . . . . . . . . . . . (1,504) (658)Noncontrolling interest . . . . . . . . . . . . . . . . . . . . . . . . . . . . . . . . . . . . . . . . . . . . 4 5
Total stockholders’ equity . . . . . . . . . . . . . . . . . . . . . . . . . . . . . . . . . . . . . . 5,228 6,824$ 15,729 $ 17,465
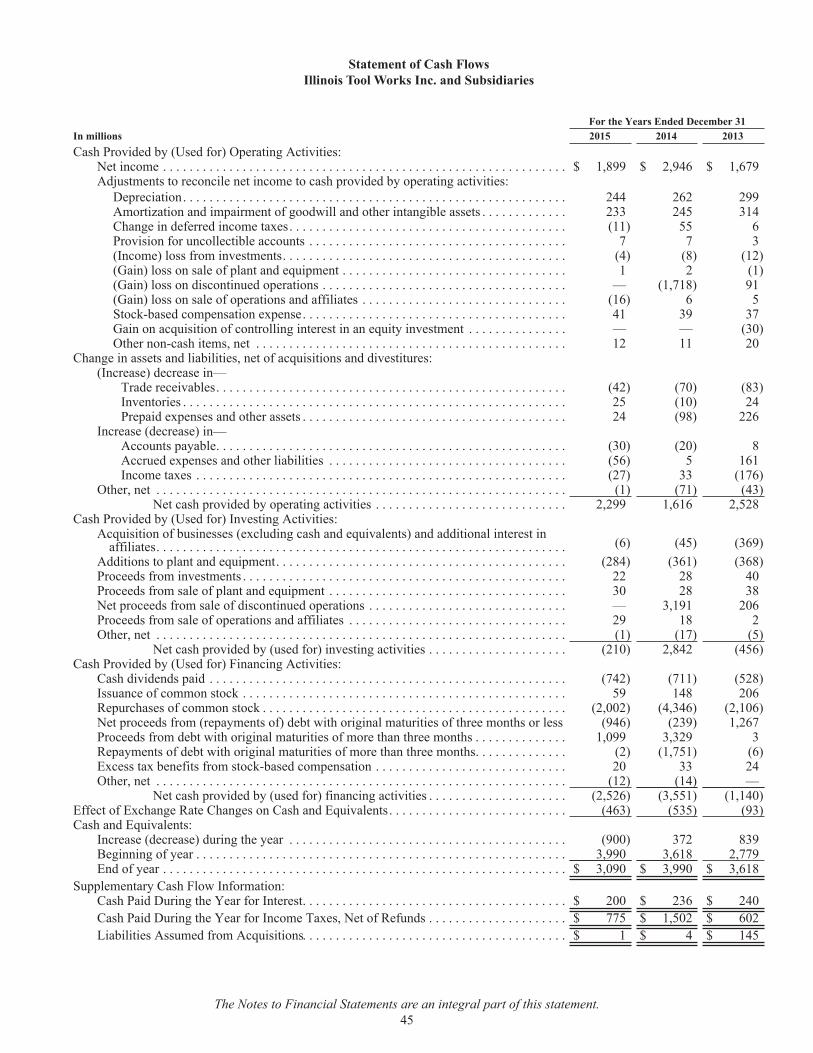
The Notes to Financial Statements are an integral part of this statement.45
Statement of Cash FlowsIllinois Tool Works Inc. and Subsidiaries
For the Years Ended December 31In millions 2015 2014 2013Cash Provided by (Used for) Operating Activities:
Net income . . . . . . . . . . . . . . . . . . . . . . . . . . . . . . . . . . . . . . . . . . . . . . . . . . . . . . . . . . . . . $ 1,899 $ 2,946 $ 1,679Adjustments to reconcile net income to cash provided by operating activities:
Depreciation. . . . . . . . . . . . . . . . . . . . . . . . . . . . . . . . . . . . . . . . . . . . . . . . . . . . . . . . . . 244 262 299Amortization and impairment of goodwill and other intangible assets . . . . . . . . . . . . . 233 245 314Change in deferred income taxes. . . . . . . . . . . . . . . . . . . . . . . . . . . . . . . . . . . . . . . . . . (11) 55 6Provision for uncollectible accounts . . . . . . . . . . . . . . . . . . . . . . . . . . . . . . . . . . . . . . . 7 7 3(Income) loss from investments. . . . . . . . . . . . . . . . . . . . . . . . . . . . . . . . . . . . . . . . . . . (4) (8) (12)(Gain) loss on sale of plant and equipment . . . . . . . . . . . . . . . . . . . . . . . . . . . . . . . . . . 1 2 (1)(Gain) loss on discontinued operations . . . . . . . . . . . . . . . . . . . . . . . . . . . . . . . . . . . . . — (1,718) 91(Gain) loss on sale of operations and affiliates . . . . . . . . . . . . . . . . . . . . . . . . . . . . . . . (16) 6 5Stock-based compensation expense. . . . . . . . . . . . . . . . . . . . . . . . . . . . . . . . . . . . . . . . 41 39 37Gain on acquisition of controlling interest in an equity investment . . . . . . . . . . . . . . . — — (30)Other non-cash items, net . . . . . . . . . . . . . . . . . . . . . . . . . . . . . . . . . . . . . . . . . . . . . . . 12 11 20
Change in assets and liabilities, net of acquisitions and divestitures:(Increase) decrease in—
Trade receivables. . . . . . . . . . . . . . . . . . . . . . . . . . . . . . . . . . . . . . . . . . . . . . . . . . . . . (42) (70) (83)Inventories . . . . . . . . . . . . . . . . . . . . . . . . . . . . . . . . . . . . . . . . . . . . . . . . . . . . . . . . . . 25 (10) 24Prepaid expenses and other assets . . . . . . . . . . . . . . . . . . . . . . . . . . . . . . . . . . . . . . . . 24 (98) 226
Increase (decrease) in—Accounts payable. . . . . . . . . . . . . . . . . . . . . . . . . . . . . . . . . . . . . . . . . . . . . . . . . . . . . (30) (20) 8Accrued expenses and other liabilities . . . . . . . . . . . . . . . . . . . . . . . . . . . . . . . . . . . . (56) 5 161Income taxes . . . . . . . . . . . . . . . . . . . . . . . . . . . . . . . . . . . . . . . . . . . . . . . . . . . . . . . . (27) 33 (176)
Other, net . . . . . . . . . . . . . . . . . . . . . . . . . . . . . . . . . . . . . . . . . . . . . . . . . . . . . . . . . . . . . . (1) (71) (43)Net cash provided by operating activities . . . . . . . . . . . . . . . . . . . . . . . . . . . . . 2,299 1,616 2,528
Cash Provided by (Used for) Investing Activities:Acquisition of businesses (excluding cash and equivalents) and additional interest in
affiliates. . . . . . . . . . . . . . . . . . . . . . . . . . . . . . . . . . . . . . . . . . . . . . . . . . . . . . . . . . . . . . (6) (45) (369)Additions to plant and equipment. . . . . . . . . . . . . . . . . . . . . . . . . . . . . . . . . . . . . . . . . . . . (284) (361) (368)Proceeds from investments . . . . . . . . . . . . . . . . . . . . . . . . . . . . . . . . . . . . . . . . . . . . . . . . . 22 28 40Proceeds from sale of plant and equipment . . . . . . . . . . . . . . . . . . . . . . . . . . . . . . . . . . . . 30 28 38Net proceeds from sale of discontinued operations . . . . . . . . . . . . . . . . . . . . . . . . . . . . . . — 3,191 206Proceeds from sale of operations and affiliates . . . . . . . . . . . . . . . . . . . . . . . . . . . . . . . . . 29 18 2Other, net . . . . . . . . . . . . . . . . . . . . . . . . . . . . . . . . . . . . . . . . . . . . . . . . . . . . . . . . . . . . . . (1) (17) (5)
Net cash provided by (used for) investing activities . . . . . . . . . . . . . . . . . . . . . (210) 2,842 (456)Cash Provided by (Used for) Financing Activities:
Cash dividends paid . . . . . . . . . . . . . . . . . . . . . . . . . . . . . . . . . . . . . . . . . . . . . . . . . . . . . . (742) (711) (528)Issuance of common stock . . . . . . . . . . . . . . . . . . . . . . . . . . . . . . . . . . . . . . . . . . . . . . . . . 59 148 206Repurchases of common stock . . . . . . . . . . . . . . . . . . . . . . . . . . . . . . . . . . . . . . . . . . . . . . (2,002) (4,346) (2,106)Net proceeds from (repayments of) debt with original maturities of three months or less (946) (239) 1,267Proceeds from debt with original maturities of more than three months . . . . . . . . . . . . . . 1,099 3,329 3Repayments of debt with original maturities of more than three months. . . . . . . . . . . . . . (2) (1,751) (6)Excess tax benefits from stock-based compensation . . . . . . . . . . . . . . . . . . . . . . . . . . . . . 20 33 24Other, net . . . . . . . . . . . . . . . . . . . . . . . . . . . . . . . . . . . . . . . . . . . . . . . . . . . . . . . . . . . . . . (12) (14) —
Net cash provided by (used for) financing activities . . . . . . . . . . . . . . . . . . . . . (2,526) (3,551) (1,140)Effect of Exchange Rate Changes on Cash and Equivalents. . . . . . . . . . . . . . . . . . . . . . . . . . . (463) (535) (93)Cash and Equivalents:
Increase (decrease) during the year . . . . . . . . . . . . . . . . . . . . . . . . . . . . . . . . . . . . . . . . . . (900) 372 839Beginning of year . . . . . . . . . . . . . . . . . . . . . . . . . . . . . . . . . . . . . . . . . . . . . . . . . . . . . . . . 3,990 3,618 2,779End of year . . . . . . . . . . . . . . . . . . . . . . . . . . . . . . . . . . . . . . . . . . . . . . . . . . . . . . . . . . . . . $ 3,090 $ 3,990 $ 3,618
Supplementary Cash Flow Information:Cash Paid During the Year for Interest. . . . . . . . . . . . . . . . . . . . . . . . . . . . . . . . . . . . . . . . $ 200 $ 236 $ 240Cash Paid During the Year for Income Taxes, Net of Refunds . . . . . . . . . . . . . . . . . . . . . $ 775 $ 1,502 $ 602Liabilities Assumed from Acquisitions. . . . . . . . . . . . . . . . . . . . . . . . . . . . . . . . . . . . . . . . $ 1 $ 4 $ 145
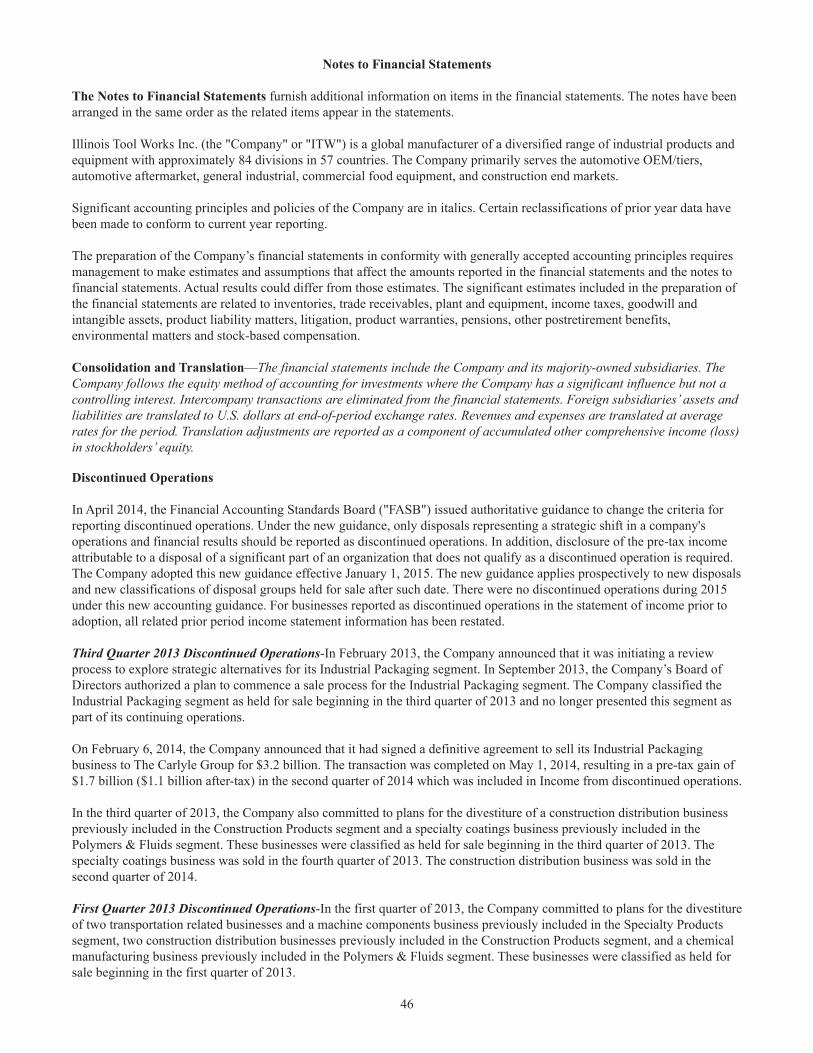
46
Notes to Financial Statements
The Notes to Financial Statements furnish additional information on items in the financial statements. The notes have been arranged in the same order as the related items appear in the statements.
Illinois Tool Works Inc. (the "Company" or "ITW") is a global manufacturer of a diversified range of industrial products and equipment with approximately 84 divisions in 57 countries. The Company primarily serves the automotive OEM/tiers, automotive aftermarket, general industrial, commercial food equipment, and construction end markets.
Significant accounting principles and policies of the Company are in italics. Certain reclassifications of prior year data have been made to conform to current year reporting.
The preparation of the Company’s financial statements in conformity with generally accepted accounting principles requires management to make estimates and assumptions that affect the amounts reported in the financial statements and the notes to financial statements. Actual results could differ from those estimates. The significant estimates included in the preparation of the financial statements are related to inventories, trade receivables, plant and equipment, income taxes, goodwill and intangible assets, product liability matters, litigation, product warranties, pensions, other postretirement benefits, environmental matters and stock-based compensation.
Consolidation and Translation—The financial statements include the Company and its majority-owned subsidiaries. The Company follows the equity method of accounting for investments where the Company has a significant influence but not a controlling interest. Intercompany transactions are eliminated from the financial statements. Foreign subsidiaries’ assets and liabilities are translated to U.S. dollars at end-of-period exchange rates. Revenues and expenses are translated at average rates for the period. Translation adjustments are reported as a component of accumulated other comprehensive income (loss) in stockholders’ equity.
Discontinued Operations
In April 2014, the Financial Accounting Standards Board ("FASB") issued authoritative guidance to change the criteria for reporting discontinued operations. Under the new guidance, only disposals representing a strategic shift in a company's operations and financial results should be reported as discontinued operations. In addition, disclosure of the pre-tax income attributable to a disposal of a significant part of an organization that does not qualify as a discontinued operation is required. The Company adopted this new guidance effective January 1, 2015. The new guidance applies prospectively to new disposals and new classifications of disposal groups held for sale after such date. There were no discontinued operations during 2015 under this new accounting guidance. For businesses reported as discontinued operations in the statement of income prior to adoption, all related prior period income statement information has been restated.
Third Quarter 2013 Discontinued Operations-In February 2013, the Company announced that it was initiating a review process to explore strategic alternatives for its Industrial Packaging segment. In September 2013, the Company’s Board of Directors authorized a plan to commence a sale process for the Industrial Packaging segment. The Company classified the Industrial Packaging segment as held for sale beginning in the third quarter of 2013 and no longer presented this segment as part of its continuing operations.
On February 6, 2014, the Company announced that it had signed a definitive agreement to sell its Industrial Packaging business to The Carlyle Group for $3.2 billion. The transaction was completed on May 1, 2014, resulting in a pre-tax gain of $1.7 billion ($1.1 billion after-tax) in the second quarter of 2014 which was included in Income from discontinued operations.
In the third quarter of 2013, the Company also committed to plans for the divestiture of a construction distribution business previously included in the Construction Products segment and a specialty coatings business previously included in the Polymers & Fluids segment. These businesses were classified as held for sale beginning in the third quarter of 2013. Thespecialty coatings business was sold in the fourth quarter of 2013. The construction distribution business was sold in the second quarter of 2014.
First Quarter 2013 Discontinued Operations-In the first quarter of 2013, the Company committed to plans for the divestiture of two transportation related businesses and a machine components business previously included in the Specialty Products segment, two construction distribution businesses previously included in the Construction Products segment, and a chemical manufacturing business previously included in the Polymers & Fluids segment. These businesses were classified as held for sale beginning in the first quarter of 2013.
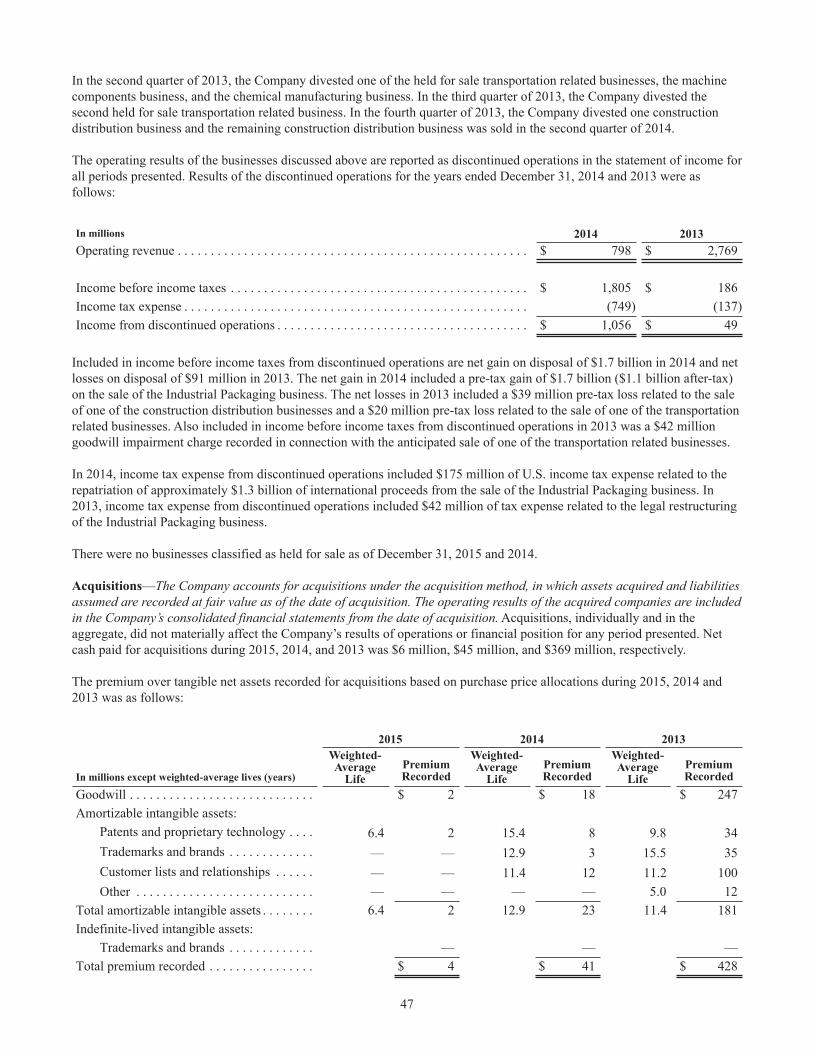
47
In the second quarter of 2013, the Company divested one of the held for sale transportation related businesses, the machine components business, and the chemical manufacturing business. In the third quarter of 2013, the Company divested the second held for sale transportation related business. In the fourth quarter of 2013, the Company divested one construction distribution business and the remaining construction distribution business was sold in the second quarter of 2014.
The operating results of the businesses discussed above are reported as discontinued operations in the statement of income for all periods presented. Results of the discontinued operations for the years ended December 31, 2014 and 2013 were as follows:
In millions 2014 2013Operating revenue . . . . . . . . . . . . . . . . . . . . . . . . . . . . . . . . . . . . . . . . . . . . . . . . . . . . . $ 798 $ 2,769
Income before income taxes . . . . . . . . . . . . . . . . . . . . . . . . . . . . . . . . . . . . . . . . . . . . . $ 1,805 $ 186Income tax expense . . . . . . . . . . . . . . . . . . . . . . . . . . . . . . . . . . . . . . . . . . . . . . . . . . . . (749) (137)Income from discontinued operations . . . . . . . . . . . . . . . . . . . . . . . . . . . . . . . . . . . . . . $ 1,056 $ 49
Included in income before income taxes from discontinued operations are net gain on disposal of $1.7 billion in 2014 and net losses on disposal of $91 million in 2013. The net gain in 2014 included a pre-tax gain of $1.7 billion ($1.1 billion after-tax)on the sale of the Industrial Packaging business. The net losses in 2013 included a $39 million pre-tax loss related to the sale of one of the construction distribution businesses and a $20 million pre-tax loss related to the sale of one of the transportation related businesses. Also included in income before income taxes from discontinued operations in 2013 was a $42 milliongoodwill impairment charge recorded in connection with the anticipated sale of one of the transportation related businesses.
In 2014, income tax expense from discontinued operations included $175 million of U.S. income tax expense related to the repatriation of approximately $1.3 billion of international proceeds from the sale of the Industrial Packaging business. In 2013, income tax expense from discontinued operations included $42 million of tax expense related to the legal restructuring of the Industrial Packaging business.
There were no businesses classified as held for sale as of December 31, 2015 and 2014.
Acquisitions—The Company accounts for acquisitions under the acquisition method, in which assets acquired and liabilities assumed are recorded at fair value as of the date of acquisition. The operating results of the acquired companies are included in the Company’s consolidated financial statements from the date of acquisition. Acquisitions, individually and in the aggregate, did not materially affect the Company’s results of operations or financial position for any period presented. Net cash paid for acquisitions during 2015, 2014, and 2013 was $6 million, $45 million, and $369 million, respectively.
The premium over tangible net assets recorded for acquisitions based on purchase price allocations during 2015, 2014 and 2013 was as follows:
2015 2014 2013
In millions except weighted-average lives (years)
Weighted-Average
LifePremiumRecorded
Weighted-Average
LifePremiumRecorded
Weighted-Average
LifePremiumRecorded
Goodwill . . . . . . . . . . . . . . . . . . . . . . . . . . . . $ 2 $ 18 $ 247Amortizable intangible assets:
Patents and proprietary technology . . . . 6.4 2 15.4 8 9.8 34Trademarks and brands . . . . . . . . . . . . . — — 12.9 3 15.5 35Customer lists and relationships . . . . . . — — 11.4 12 11.2 100Other . . . . . . . . . . . . . . . . . . . . . . . . . . . — — — — 5.0 12
Total amortizable intangible assets . . . . . . . . 6.4 2 12.9 23 11.4 181Indefinite-lived intangible assets:
Trademarks and brands . . . . . . . . . . . . . — — —Total premium recorded . . . . . . . . . . . . . . . . $ 4 $ 41 $ 428
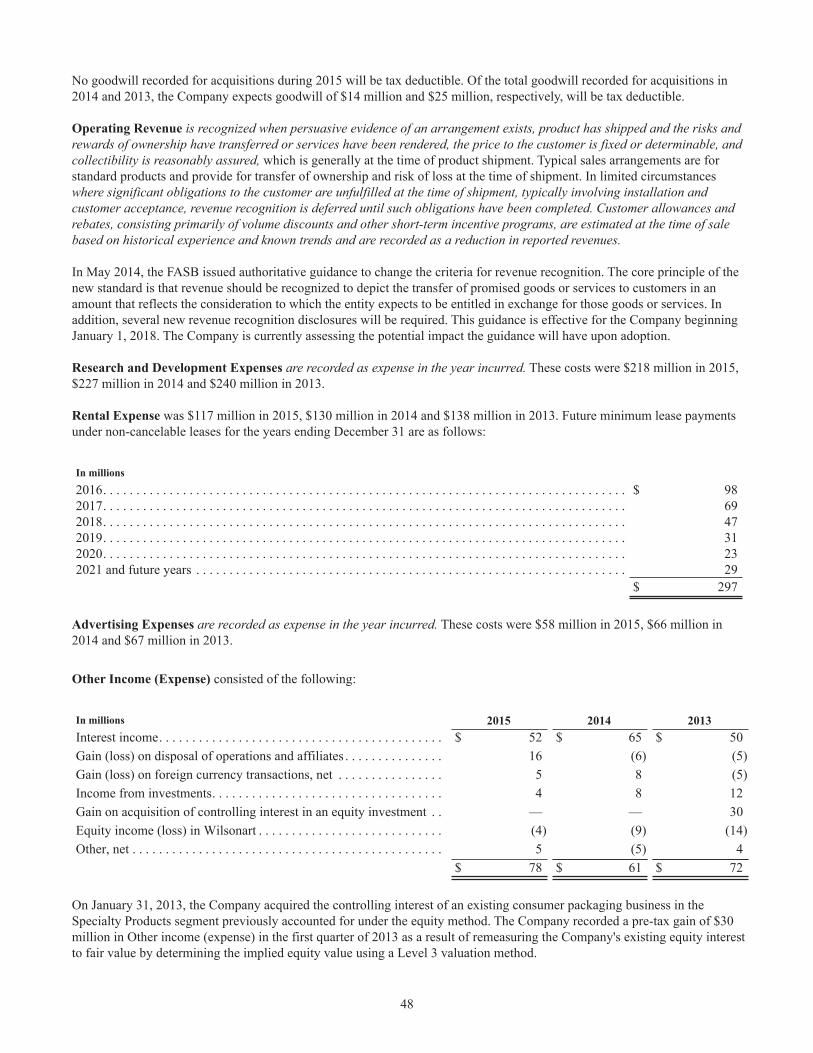
48
No goodwill recorded for acquisitions during 2015 will be tax deductible. Of the total goodwill recorded for acquisitions in 2014 and 2013, the Company expects goodwill of $14 million and $25 million, respectively, will be tax deductible.
Operating Revenue is recognized when persuasive evidence of an arrangement exists, product has shipped and the risks and rewards of ownership have transferred or services have been rendered, the price to the customer is fixed or determinable, and collectibility is reasonably assured, which is generally at the time of product shipment. Typical sales arrangements are for standard products and provide for transfer of ownership and risk of loss at the time of shipment. In limited circumstanceswhere significant obligations to the customer are unfulfilled at the time of shipment, typically involving installation and customer acceptance, revenue recognition is deferred until such obligations have been completed. Customer allowances and rebates, consisting primarily of volume discounts and other short-term incentive programs, are estimated at the time of sale based on historical experience and known trends and are recorded as a reduction in reported revenues.
In May 2014, the FASB issued authoritative guidance to change the criteria for revenue recognition. The core principle of the new standard is that revenue should be recognized to depict the transfer of promised goods or services to customers in an amount that reflects the consideration to which the entity expects to be entitled in exchange for those goods or services. In addition, several new revenue recognition disclosures will be required. This guidance is effective for the Company beginning January 1, 2018. The Company is currently assessing the potential impact the guidance will have upon adoption.
Research and Development Expenses are recorded as expense in the year incurred. These costs were $218 million in 2015,$227 million in 2014 and $240 million in 2013.
Rental Expense was $117 million in 2015, $130 million in 2014 and $138 million in 2013. Future minimum lease payments under non-cancelable leases for the years ending December 31 are as follows:
In millions
2016. . . . . . . . . . . . . . . . . . . . . . . . . . . . . . . . . . . . . . . . . . . . . . . . . . . . . . . . . . . . . . . . . . . . . . . . . . . . . . . $ 982017. . . . . . . . . . . . . . . . . . . . . . . . . . . . . . . . . . . . . . . . . . . . . . . . . . . . . . . . . . . . . . . . . . . . . . . . . . . . . . . 692018. . . . . . . . . . . . . . . . . . . . . . . . . . . . . . . . . . . . . . . . . . . . . . . . . . . . . . . . . . . . . . . . . . . . . . . . . . . . . . . 472019. . . . . . . . . . . . . . . . . . . . . . . . . . . . . . . . . . . . . . . . . . . . . . . . . . . . . . . . . . . . . . . . . . . . . . . . . . . . . . . 312020. . . . . . . . . . . . . . . . . . . . . . . . . . . . . . . . . . . . . . . . . . . . . . . . . . . . . . . . . . . . . . . . . . . . . . . . . . . . . . . 232021 and future years . . . . . . . . . . . . . . . . . . . . . . . . . . . . . . . . . . . . . . . . . . . . . . . . . . . . . . . . . . . . . . . . . 29
$ 297
Advertising Expenses are recorded as expense in the year incurred. These costs were $58 million in 2015, $66 million in 2014 and $67 million in 2013.
Other Income (Expense) consisted of the following:
In millions 2015 2014 2013Interest income. . . . . . . . . . . . . . . . . . . . . . . . . . . . . . . . . . . . . . . . . . . $ 52 $ 65 $ 50Gain (loss) on disposal of operations and affiliates . . . . . . . . . . . . . . . 16 (6) (5)Gain (loss) on foreign currency transactions, net . . . . . . . . . . . . . . . . 5 8 (5)Income from investments. . . . . . . . . . . . . . . . . . . . . . . . . . . . . . . . . . . 4 8 12Gain on acquisition of controlling interest in an equity investment . . — — 30Equity income (loss) in Wilsonart . . . . . . . . . . . . . . . . . . . . . . . . . . . . (4) (9) (14)Other, net . . . . . . . . . . . . . . . . . . . . . . . . . . . . . . . . . . . . . . . . . . . . . . . 5 (5) 4
$ 78 $ 61 $ 72
On January 31, 2013, the Company acquired the controlling interest of an existing consumer packaging business in the Specialty Products segment previously accounted for under the equity method. The Company recorded a pre-tax gain of $30million in Other income (expense) in the first quarter of 2013 as a result of remeasuring the Company's existing equity interest to fair value by determining the implied equity value using a Level 3 valuation method.
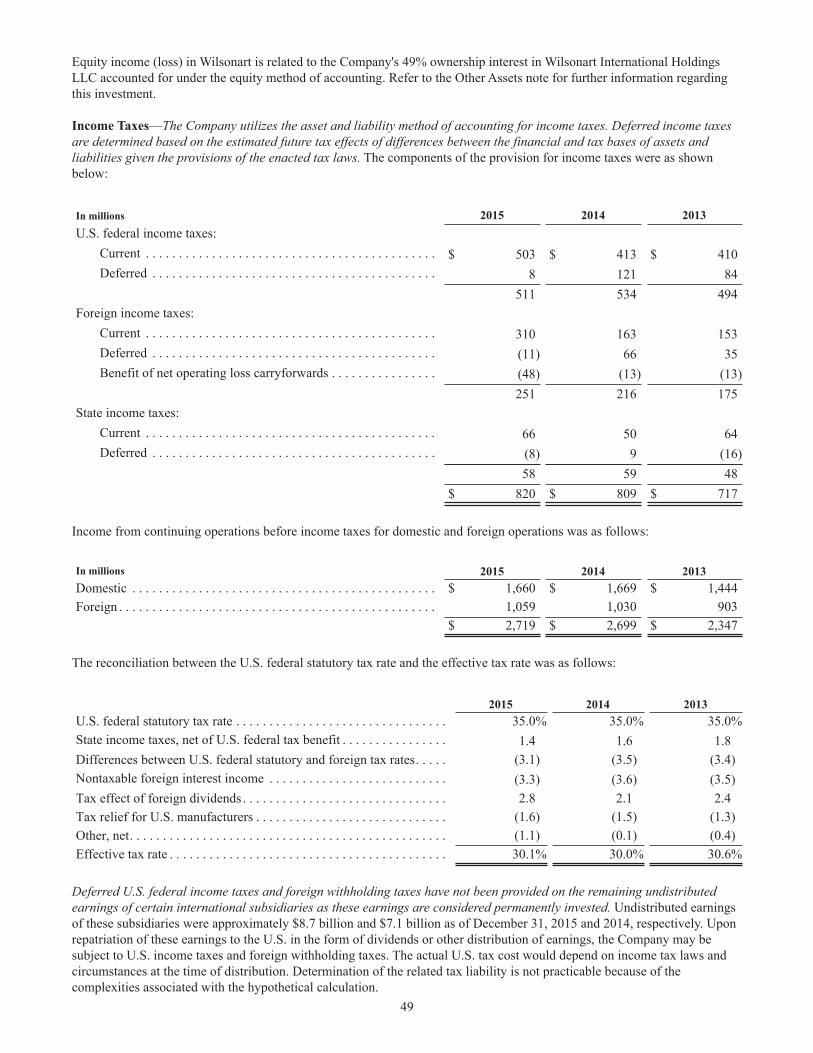
49
Equity income (loss) in Wilsonart is related to the Company's 49% ownership interest in Wilsonart International Holdings LLC accounted for under the equity method of accounting. Refer to the Other Assets note for further information regarding this investment.
Income Taxes—The Company utilizes the asset and liability method of accounting for income taxes. Deferred income taxes are determined based on the estimated future tax effects of differences between the financial and tax bases of assets and liabilities given the provisions of the enacted tax laws. The components of the provision for income taxes were as shown below:
In millions 2015 2014 2013U.S. federal income taxes:
Current . . . . . . . . . . . . . . . . . . . . . . . . . . . . . . . . . . . . . . . . . . . . $ 503 $ 413 $ 410Deferred . . . . . . . . . . . . . . . . . . . . . . . . . . . . . . . . . . . . . . . . . . . 8 121 84
511 534 494Foreign income taxes:
Current . . . . . . . . . . . . . . . . . . . . . . . . . . . . . . . . . . . . . . . . . . . . 310 163 153Deferred . . . . . . . . . . . . . . . . . . . . . . . . . . . . . . . . . . . . . . . . . . . (11) 66 35Benefit of net operating loss carryforwards . . . . . . . . . . . . . . . . (48) (13) (13)
251 216 175State income taxes:
Current . . . . . . . . . . . . . . . . . . . . . . . . . . . . . . . . . . . . . . . . . . . . 66 50 64Deferred . . . . . . . . . . . . . . . . . . . . . . . . . . . . . . . . . . . . . . . . . . . (8) 9 (16)
58 59 48$ 820 $ 809 $ 717
Income from continuing operations before income taxes for domestic and foreign operations was as follows:
In millions 2015 2014 2013Domestic . . . . . . . . . . . . . . . . . . . . . . . . . . . . . . . . . . . . . . . . . . . . . . $ 1,660 $ 1,669 $ 1,444Foreign . . . . . . . . . . . . . . . . . . . . . . . . . . . . . . . . . . . . . . . . . . . . . . . . 1,059 1,030 903
$ 2,719 $ 2,699 $ 2,347
The reconciliation between the U.S. federal statutory tax rate and the effective tax rate was as follows:
2015 2014 2013U.S. federal statutory tax rate . . . . . . . . . . . . . . . . . . . . . . . . . . . . . . . . 35.0% 35.0% 35.0%State income taxes, net of U.S. federal tax benefit . . . . . . . . . . . . . . . . 1.4 1.6 1.8Differences between U.S. federal statutory and foreign tax rates. . . . . (3.1) (3.5) (3.4)Nontaxable foreign interest income . . . . . . . . . . . . . . . . . . . . . . . . . . . (3.3) (3.6) (3.5)Tax effect of foreign dividends . . . . . . . . . . . . . . . . . . . . . . . . . . . . . . . 2.8 2.1 2.4Tax relief for U.S. manufacturers . . . . . . . . . . . . . . . . . . . . . . . . . . . . . (1.6) (1.5) (1.3)Other, net. . . . . . . . . . . . . . . . . . . . . . . . . . . . . . . . . . . . . . . . . . . . . . . . (1.1) (0.1) (0.4)Effective tax rate . . . . . . . . . . . . . . . . . . . . . . . . . . . . . . . . . . . . . . . . . . 30.1% 30.0% 30.6%
Deferred U.S. federal income taxes and foreign withholding taxes have not been provided on the remaining undistributed earnings of certain international subsidiaries as these earnings are considered permanently invested. Undistributed earnings of these subsidiaries were approximately $8.7 billion and $7.1 billion as of December 31, 2015 and 2014, respectively. Upon repatriation of these earnings to the U.S. in the form of dividends or other distribution of earnings, the Company may be subject to U.S. income taxes and foreign withholding taxes. The actual U.S. tax cost would depend on income tax laws and circumstances at the time of distribution. Determination of the related tax liability is not practicable because of the complexities associated with the hypothetical calculation.
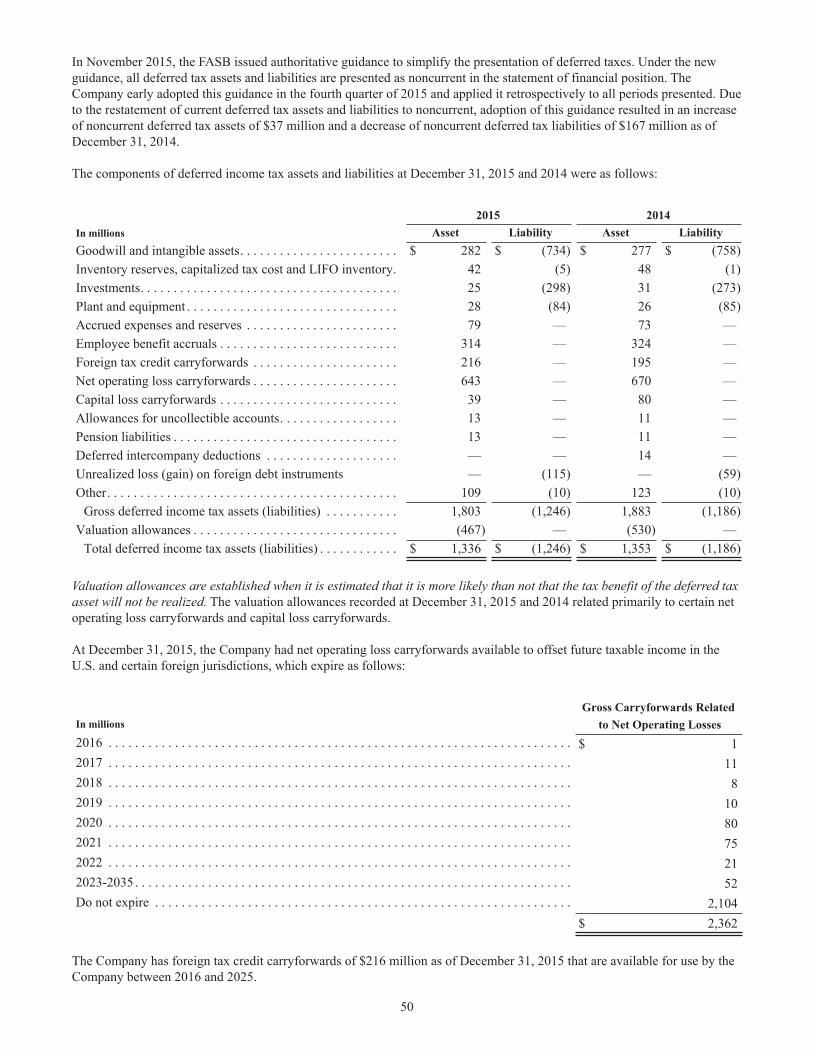
50
In November 2015, the FASB issued authoritative guidance to simplify the presentation of deferred taxes. Under the new guidance, all deferred tax assets and liabilities are presented as noncurrent in the statement of financial position. TheCompany early adopted this guidance in the fourth quarter of 2015 and applied it retrospectively to all periods presented. Due to the restatement of current deferred tax assets and liabilities to noncurrent, adoption of this guidance resulted in an increase of noncurrent deferred tax assets of $37 million and a decrease of noncurrent deferred tax liabilities of $167 million as of December 31, 2014.
The components of deferred income tax assets and liabilities at December 31, 2015 and 2014 were as follows:
2015 2014In millions Asset Liability Asset Liability Goodwill and intangible assets. . . . . . . . . . . . . . . . . . . . . . . . $ 282 $ (734) $ 277 $ (758)Inventory reserves, capitalized tax cost and LIFO inventory. 42 (5) 48 (1)Investments. . . . . . . . . . . . . . . . . . . . . . . . . . . . . . . . . . . . . . . 25 (298) 31 (273)Plant and equipment . . . . . . . . . . . . . . . . . . . . . . . . . . . . . . . . 28 (84) 26 (85)Accrued expenses and reserves . . . . . . . . . . . . . . . . . . . . . . . 79 — 73 —Employee benefit accruals . . . . . . . . . . . . . . . . . . . . . . . . . . . 314 — 324 —Foreign tax credit carryforwards . . . . . . . . . . . . . . . . . . . . . . 216 — 195 —Net operating loss carryforwards . . . . . . . . . . . . . . . . . . . . . . 643 — 670 —Capital loss carryforwards . . . . . . . . . . . . . . . . . . . . . . . . . . . 39 — 80 —Allowances for uncollectible accounts. . . . . . . . . . . . . . . . . . 13 — 11 —Pension liabilities . . . . . . . . . . . . . . . . . . . . . . . . . . . . . . . . . . 13 — 11 —Deferred intercompany deductions . . . . . . . . . . . . . . . . . . . . — — 14 —Unrealized loss (gain) on foreign debt instruments — (115) — (59)Other. . . . . . . . . . . . . . . . . . . . . . . . . . . . . . . . . . . . . . . . . . . . 109 (10) 123 (10)
Gross deferred income tax assets (liabilities) . . . . . . . . . . . 1,803 (1,246) 1,883 (1,186)Valuation allowances . . . . . . . . . . . . . . . . . . . . . . . . . . . . . . . (467) — (530) —
Total deferred income tax assets (liabilities) . . . . . . . . . . . . $ 1,336 $ (1,246) $ 1,353 $ (1,186)
Valuation allowances are established when it is estimated that it is more likely than not that the tax benefit of the deferred tax asset will not be realized. The valuation allowances recorded at December 31, 2015 and 2014 related primarily to certain net operating loss carryforwards and capital loss carryforwards.
At December 31, 2015, the Company had net operating loss carryforwards available to offset future taxable income in the U.S. and certain foreign jurisdictions, which expire as follows:
Gross Carryforwards RelatedIn millions to Net Operating Losses2016 . . . . . . . . . . . . . . . . . . . . . . . . . . . . . . . . . . . . . . . . . . . . . . . . . . . . . . . . . . . . . . . . . . . . . . $ 12017 . . . . . . . . . . . . . . . . . . . . . . . . . . . . . . . . . . . . . . . . . . . . . . . . . . . . . . . . . . . . . . . . . . . . . . 112018 . . . . . . . . . . . . . . . . . . . . . . . . . . . . . . . . . . . . . . . . . . . . . . . . . . . . . . . . . . . . . . . . . . . . . . 82019 . . . . . . . . . . . . . . . . . . . . . . . . . . . . . . . . . . . . . . . . . . . . . . . . . . . . . . . . . . . . . . . . . . . . . . 102020 . . . . . . . . . . . . . . . . . . . . . . . . . . . . . . . . . . . . . . . . . . . . . . . . . . . . . . . . . . . . . . . . . . . . . . 802021 . . . . . . . . . . . . . . . . . . . . . . . . . . . . . . . . . . . . . . . . . . . . . . . . . . . . . . . . . . . . . . . . . . . . . . 752022 . . . . . . . . . . . . . . . . . . . . . . . . . . . . . . . . . . . . . . . . . . . . . . . . . . . . . . . . . . . . . . . . . . . . . . 212023-2035 . . . . . . . . . . . . . . . . . . . . . . . . . . . . . . . . . . . . . . . . . . . . . . . . . . . . . . . . . . . . . . . . . . 52Do not expire . . . . . . . . . . . . . . . . . . . . . . . . . . . . . . . . . . . . . . . . . . . . . . . . . . . . . . . . . . . . . . . 2,104
$ 2,362
The Company has foreign tax credit carryforwards of $216 million as of December 31, 2015 that are available for use by the Company between 2016 and 2025.
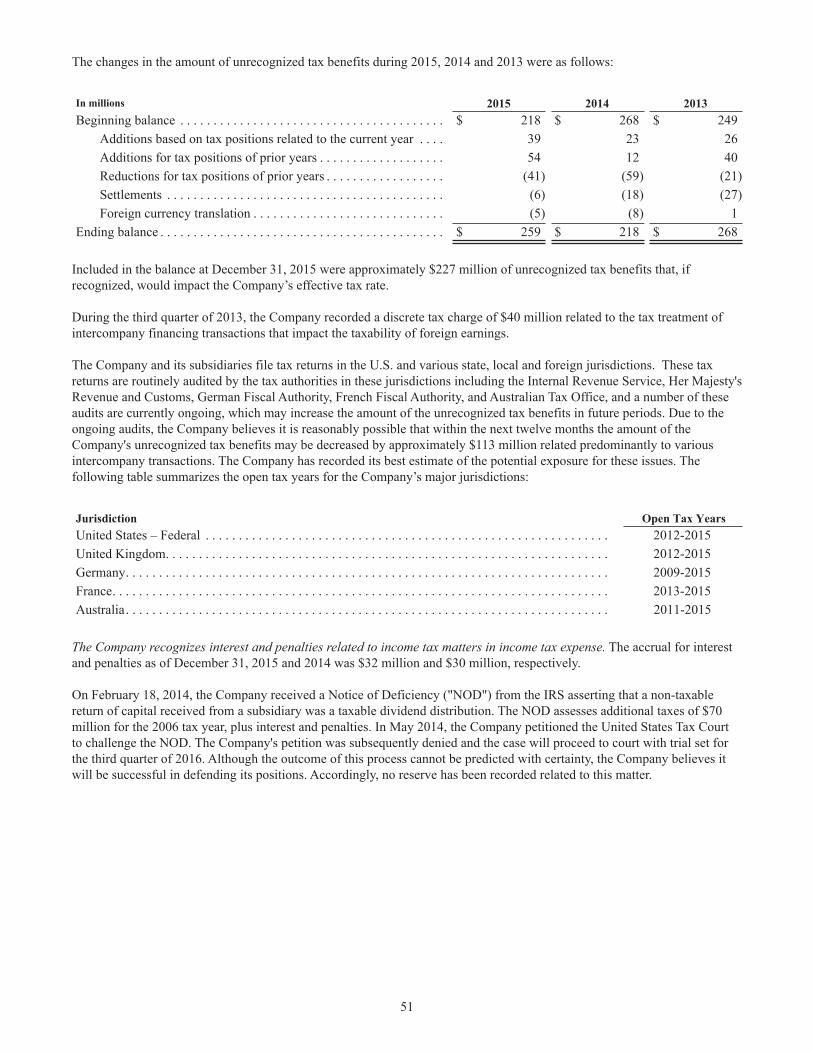
51
The changes in the amount of unrecognized tax benefits during 2015, 2014 and 2013 were as follows:
In millions 2015 2014 2013Beginning balance . . . . . . . . . . . . . . . . . . . . . . . . . . . . . . . . . . . . . . . . $ 218 $ 268 $ 249
Additions based on tax positions related to the current year . . . . 39 23 26Additions for tax positions of prior years . . . . . . . . . . . . . . . . . . . 54 12 40Reductions for tax positions of prior years . . . . . . . . . . . . . . . . . . (41) (59) (21)Settlements . . . . . . . . . . . . . . . . . . . . . . . . . . . . . . . . . . . . . . . . . . (6) (18) (27)Foreign currency translation . . . . . . . . . . . . . . . . . . . . . . . . . . . . . (5) (8) 1
Ending balance . . . . . . . . . . . . . . . . . . . . . . . . . . . . . . . . . . . . . . . . . . . $ 259 $ 218 $ 268
Included in the balance at December 31, 2015 were approximately $227 million of unrecognized tax benefits that, if recognized, would impact the Company’s effective tax rate.
During the third quarter of 2013, the Company recorded a discrete tax charge of $40 million related to the tax treatment of intercompany financing transactions that impact the taxability of foreign earnings.
The Company and its subsidiaries file tax returns in the U.S. and various state, local and foreign jurisdictions. These tax returns are routinely audited by the tax authorities in these jurisdictions including the Internal Revenue Service, Her Majesty's Revenue and Customs, German Fiscal Authority, French Fiscal Authority, and Australian Tax Office, and a number of these audits are currently ongoing, which may increase the amount of the unrecognized tax benefits in future periods. Due to the ongoing audits, the Company believes it is reasonably possible that within the next twelve months the amount of the Company's unrecognized tax benefits may be decreased by approximately $113 million related predominantly to various intercompany transactions. The Company has recorded its best estimate of the potential exposure for these issues. Thefollowing table summarizes the open tax years for the Company’s major jurisdictions:
Jurisdiction Open Tax YearsUnited States – Federal . . . . . . . . . . . . . . . . . . . . . . . . . . . . . . . . . . . . . . . . . . . . . . . . . . . . . . . . . . . . . 2012-2015United Kingdom. . . . . . . . . . . . . . . . . . . . . . . . . . . . . . . . . . . . . . . . . . . . . . . . . . . . . . . . . . . . . . . . . . . 2012-2015Germany. . . . . . . . . . . . . . . . . . . . . . . . . . . . . . . . . . . . . . . . . . . . . . . . . . . . . . . . . . . . . . . . . . . . . . . . . 2009-2015France. . . . . . . . . . . . . . . . . . . . . . . . . . . . . . . . . . . . . . . . . . . . . . . . . . . . . . . . . . . . . . . . . . . . . . . . . . . 2013-2015Australia. . . . . . . . . . . . . . . . . . . . . . . . . . . . . . . . . . . . . . . . . . . . . . . . . . . . . . . . . . . . . . . . . . . . . . . . . 2011-2015
The Company recognizes interest and penalties related to income tax matters in income tax expense. The accrual for interest and penalties as of December 31, 2015 and 2014 was $32 million and $30 million, respectively.
On February 18, 2014, the Company received a Notice of Deficiency ("NOD") from the IRS asserting that a non-taxable return of capital received from a subsidiary was a taxable dividend distribution. The NOD assesses additional taxes of $70million for the 2006 tax year, plus interest and penalties. In May 2014, the Company petitioned the United States Tax Court to challenge the NOD. The Company's petition was subsequently denied and the case will proceed to court with trial set for the third quarter of 2016. Although the outcome of this process cannot be predicted with certainty, the Company believes it will be successful in defending its positions. Accordingly, no reserve has been recorded related to this matter.
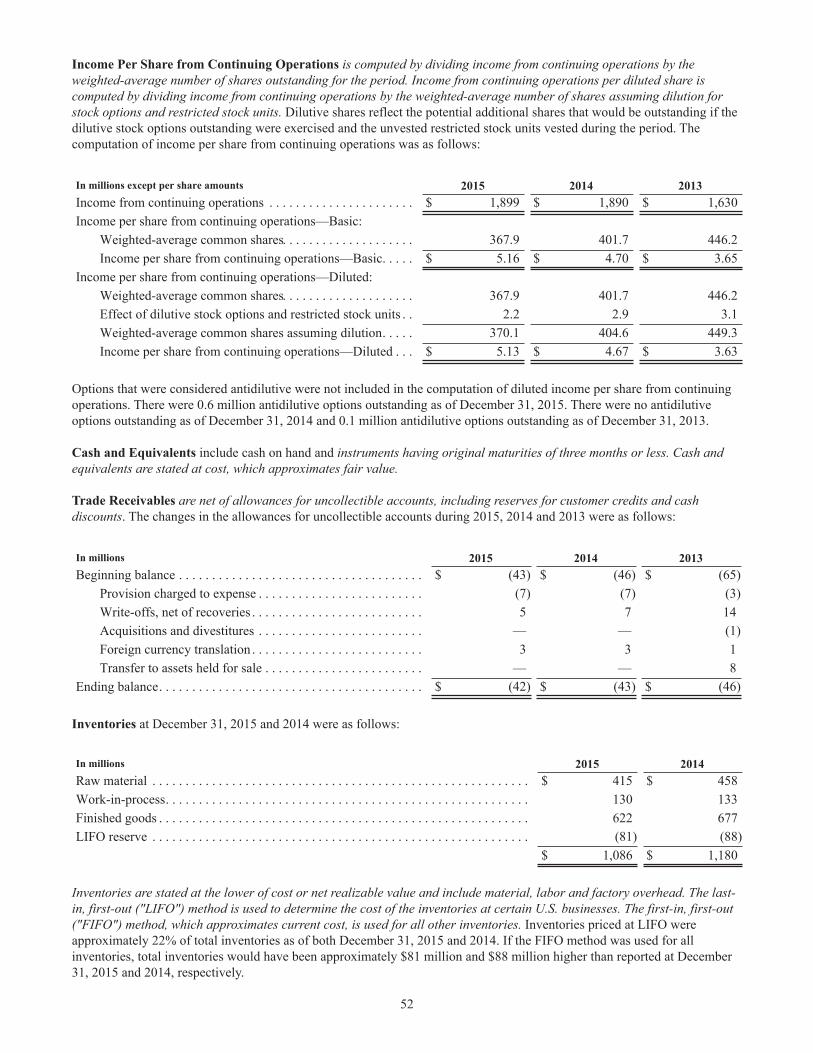
52
Income Per Share from Continuing Operations is computed by dividing income from continuing operations by the weighted-average number of shares outstanding for the period. Income from continuing operations per diluted share is computed by dividing income from continuing operations by the weighted-average number of shares assuming dilution for stock options and restricted stock units. Dilutive shares reflect the potential additional shares that would be outstanding if the dilutive stock options outstanding were exercised and the unvested restricted stock units vested during the period. Thecomputation of income per share from continuing operations was as follows:
In millions except per share amounts 2015 2014 2013Income from continuing operations . . . . . . . . . . . . . . . . . . . . . . $ 1,899 $ 1,890 $ 1,630Income per share from continuing operations—Basic:
Weighted-average common shares. . . . . . . . . . . . . . . . . . . . 367.9 401.7 446.2Income per share from continuing operations—Basic. . . . . $ 5.16 $ 4.70 $ 3.65
Income per share from continuing operations—Diluted:Weighted-average common shares. . . . . . . . . . . . . . . . . . . . 367.9 401.7 446.2Effect of dilutive stock options and restricted stock units . . 2.2 2.9 3.1Weighted-average common shares assuming dilution. . . . . 370.1 404.6 449.3Income per share from continuing operations—Diluted . . . $ 5.13 $ 4.67 $ 3.63
Options that were considered antidilutive were not included in the computation of diluted income per share from continuing operations. There were 0.6 million antidilutive options outstanding as of December 31, 2015. There were no antidilutive options outstanding as of December 31, 2014 and 0.1 million antidilutive options outstanding as of December 31, 2013.
Cash and Equivalents include cash on hand and instruments having original maturities of three months or less. Cash and equivalents are stated at cost, which approximates fair value.
Trade Receivables are net of allowances for uncollectible accounts, including reserves for customer credits and cash discounts. The changes in the allowances for uncollectible accounts during 2015, 2014 and 2013 were as follows:
In millions 2015 2014 2013Beginning balance . . . . . . . . . . . . . . . . . . . . . . . . . . . . . . . . . . . . . $ (43) $ (46) $ (65)
Provision charged to expense . . . . . . . . . . . . . . . . . . . . . . . . . (7) (7) (3)Write-offs, net of recoveries . . . . . . . . . . . . . . . . . . . . . . . . . . 5 7 14Acquisitions and divestitures . . . . . . . . . . . . . . . . . . . . . . . . . — — (1)Foreign currency translation . . . . . . . . . . . . . . . . . . . . . . . . . . 3 3 1Transfer to assets held for sale . . . . . . . . . . . . . . . . . . . . . . . . — — 8
Ending balance. . . . . . . . . . . . . . . . . . . . . . . . . . . . . . . . . . . . . . . . $ (42) $ (43) $ (46)
Inventories at December 31, 2015 and 2014 were as follows:
In millions 2015 2014Raw material . . . . . . . . . . . . . . . . . . . . . . . . . . . . . . . . . . . . . . . . . . . . . . . . . . . . . . . . . $ 415 $ 458Work-in-process. . . . . . . . . . . . . . . . . . . . . . . . . . . . . . . . . . . . . . . . . . . . . . . . . . . . . . . 130 133Finished goods . . . . . . . . . . . . . . . . . . . . . . . . . . . . . . . . . . . . . . . . . . . . . . . . . . . . . . . . 622 677LIFO reserve . . . . . . . . . . . . . . . . . . . . . . . . . . . . . . . . . . . . . . . . . . . . . . . . . . . . . . . . . (81) (88)
$ 1,086 $ 1,180
Inventories are stated at the lower of cost or net realizable value and include material, labor and factory overhead. The last-in, first-out ("LIFO") method is used to determine the cost of the inventories at certain U.S. businesses. The first-in, first-out ("FIFO") method, which approximates current cost, is used for all other inventories. Inventories priced at LIFO were approximately 22% of total inventories as of both December 31, 2015 and 2014. If the FIFO method was used for all inventories, total inventories would have been approximately $81 million and $88 million higher than reported at December 31, 2015 and 2014, respectively.
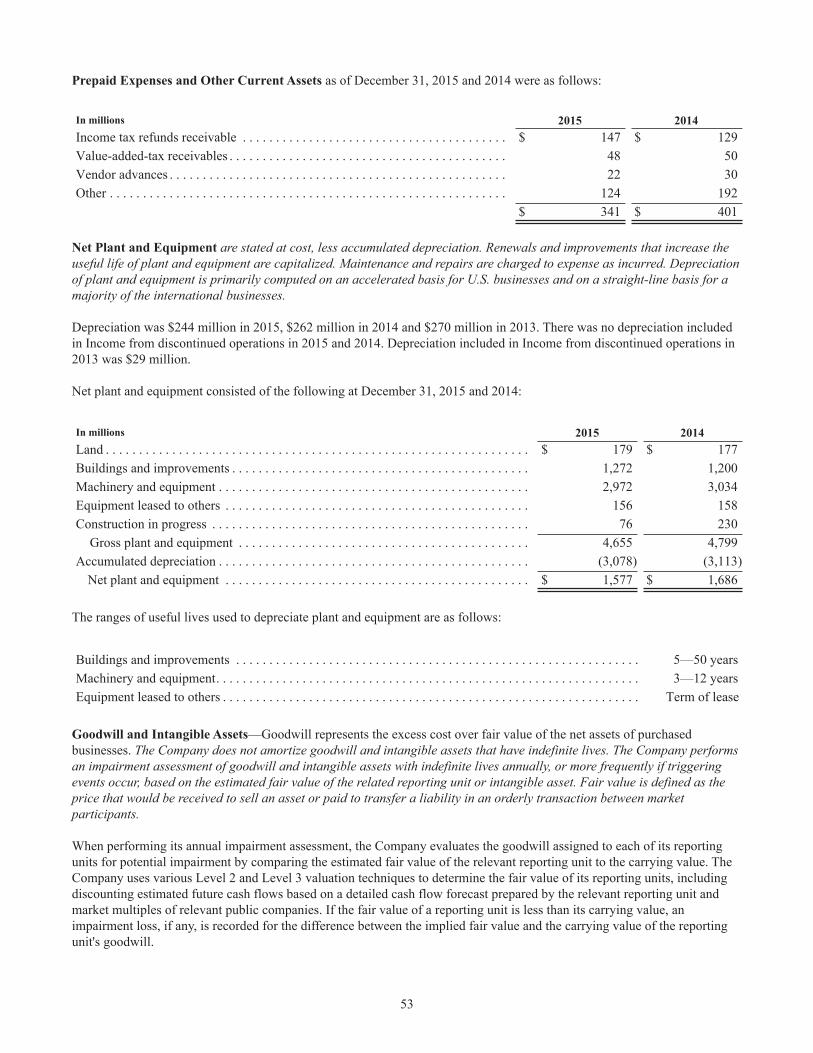
53
Prepaid Expenses and Other Current Assets as of December 31, 2015 and 2014 were as follows:
In millions 2015 2014Income tax refunds receivable . . . . . . . . . . . . . . . . . . . . . . . . . . . . . . . . . . . . . . . . $ 147 $ 129Value-added-tax receivables . . . . . . . . . . . . . . . . . . . . . . . . . . . . . . . . . . . . . . . . . . 48 50Vendor advances . . . . . . . . . . . . . . . . . . . . . . . . . . . . . . . . . . . . . . . . . . . . . . . . . . . 22 30Other . . . . . . . . . . . . . . . . . . . . . . . . . . . . . . . . . . . . . . . . . . . . . . . . . . . . . . . . . . . . 124 192
$ 341 $ 401
Net Plant and Equipment are stated at cost, less accumulated depreciation. Renewals and improvements that increase the useful life of plant and equipment are capitalized. Maintenance and repairs are charged to expense as incurred. Depreciationof plant and equipment is primarily computed on an accelerated basis for U.S. businesses and on a straight-line basis for a majority of the international businesses.
Depreciation was $244 million in 2015, $262 million in 2014 and $270 million in 2013. There was no depreciation included in Income from discontinued operations in 2015 and 2014. Depreciation included in Income from discontinued operations in 2013 was $29 million.
Net plant and equipment consisted of the following at December 31, 2015 and 2014:
In millions 2015 2014Land . . . . . . . . . . . . . . . . . . . . . . . . . . . . . . . . . . . . . . . . . . . . . . . . . . . . . . . . . . . . . . . . $ 179 $ 177Buildings and improvements . . . . . . . . . . . . . . . . . . . . . . . . . . . . . . . . . . . . . . . . . . . . . 1,272 1,200Machinery and equipment . . . . . . . . . . . . . . . . . . . . . . . . . . . . . . . . . . . . . . . . . . . . . . . 2,972 3,034Equipment leased to others . . . . . . . . . . . . . . . . . . . . . . . . . . . . . . . . . . . . . . . . . . . . . . 156 158Construction in progress . . . . . . . . . . . . . . . . . . . . . . . . . . . . . . . . . . . . . . . . . . . . . . . . 76 230
Gross plant and equipment . . . . . . . . . . . . . . . . . . . . . . . . . . . . . . . . . . . . . . . . . . . . 4,655 4,799Accumulated depreciation . . . . . . . . . . . . . . . . . . . . . . . . . . . . . . . . . . . . . . . . . . . . . . . (3,078) (3,113)
Net plant and equipment . . . . . . . . . . . . . . . . . . . . . . . . . . . . . . . . . . . . . . . . . . . . . . $ 1,577 $ 1,686
The ranges of useful lives used to depreciate plant and equipment are as follows:
Buildings and improvements . . . . . . . . . . . . . . . . . . . . . . . . . . . . . . . . . . . . . . . . . . . . . . . . . . . . . . . . . . . . . 5—50 yearsMachinery and equipment. . . . . . . . . . . . . . . . . . . . . . . . . . . . . . . . . . . . . . . . . . . . . . . . . . . . . . . . . . . . . . . . 3—12 yearsEquipment leased to others . . . . . . . . . . . . . . . . . . . . . . . . . . . . . . . . . . . . . . . . . . . . . . . . . . . . . . . . . . . . . . . Term of lease
Goodwill and Intangible Assets—Goodwill represents the excess cost over fair value of the net assets of purchased businesses. The Company does not amortize goodwill and intangible assets that have indefinite lives. The Company performs an impairment assessment of goodwill and intangible assets with indefinite lives annually, or more frequently if triggering events occur, based on the estimated fair value of the related reporting unit or intangible asset. Fair value is defined as the price that would be received to sell an asset or paid to transfer a liability in an orderly transaction between market participants.
When performing its annual impairment assessment, the Company evaluates the goodwill assigned to each of its reporting units for potential impairment by comparing the estimated fair value of the relevant reporting unit to the carrying value. TheCompany uses various Level 2 and Level 3 valuation techniques to determine the fair value of its reporting units, including discounting estimated future cash flows based on a detailed cash flow forecast prepared by the relevant reporting unit and market multiples of relevant public companies. If the fair value of a reporting unit is less than its carrying value, an impairment loss, if any, is recorded for the difference between the implied fair value and the carrying value of the reporting unit's goodwill.
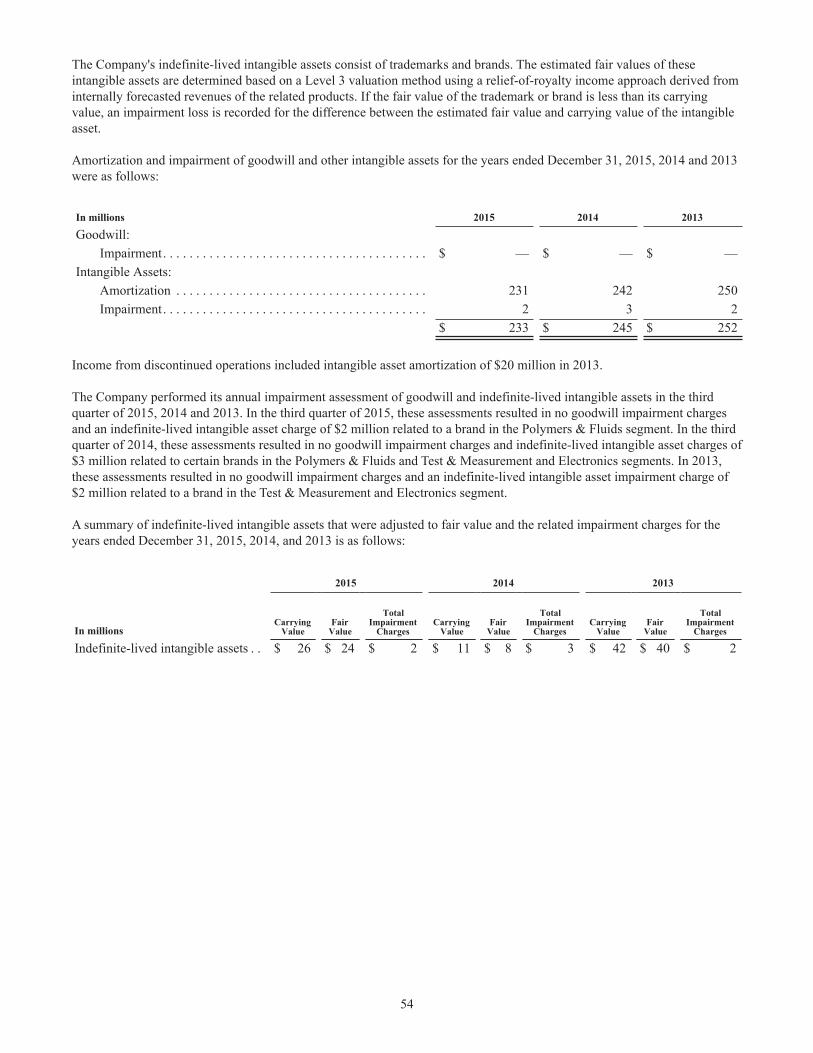
54
The Company's indefinite-lived intangible assets consist of trademarks and brands. The estimated fair values of these intangible assets are determined based on a Level 3 valuation method using a relief-of-royalty income approach derived from internally forecasted revenues of the related products. If the fair value of the trademark or brand is less than its carrying value, an impairment loss is recorded for the difference between the estimated fair value and carrying value of the intangible asset.
Amortization and impairment of goodwill and other intangible assets for the years ended December 31, 2015, 2014 and 2013were as follows:
In millions 2015 2014 2013
Goodwill:Impairment. . . . . . . . . . . . . . . . . . . . . . . . . . . . . . . . . . . . . . . . $ — $ — $ —
Intangible Assets:Amortization . . . . . . . . . . . . . . . . . . . . . . . . . . . . . . . . . . . . . . 231 242 250Impairment. . . . . . . . . . . . . . . . . . . . . . . . . . . . . . . . . . . . . . . . 2 3 2
$ 233 $ 245 $ 252
Income from discontinued operations included intangible asset amortization of $20 million in 2013.
The Company performed its annual impairment assessment of goodwill and indefinite-lived intangible assets in the third quarter of 2015, 2014 and 2013. In the third quarter of 2015, these assessments resulted in no goodwill impairment chargesand an indefinite-lived intangible asset charge of $2 million related to a brand in the Polymers & Fluids segment. In the third quarter of 2014, these assessments resulted in no goodwill impairment charges and indefinite-lived intangible asset charges of $3 million related to certain brands in the Polymers & Fluids and Test & Measurement and Electronics segments. In 2013,these assessments resulted in no goodwill impairment charges and an indefinite-lived intangible asset impairment charge of $2 million related to a brand in the Test & Measurement and Electronics segment.
A summary of indefinite-lived intangible assets that were adjusted to fair value and the related impairment charges for the years ended December 31, 2015, 2014, and 2013 is as follows:
2015 2014 2013
In millionsCarrying
ValueFair
Value
TotalImpairment
ChargesCarrying
ValueFair
Value
TotalImpairment
ChargesCarrying
ValueFair
Value
TotalImpairment
Charges
Indefinite-lived intangible assets . . $ 26 $ 24 $ 2 $ 11 $ 8 $ 3 $ 42 $ 40 $ 2
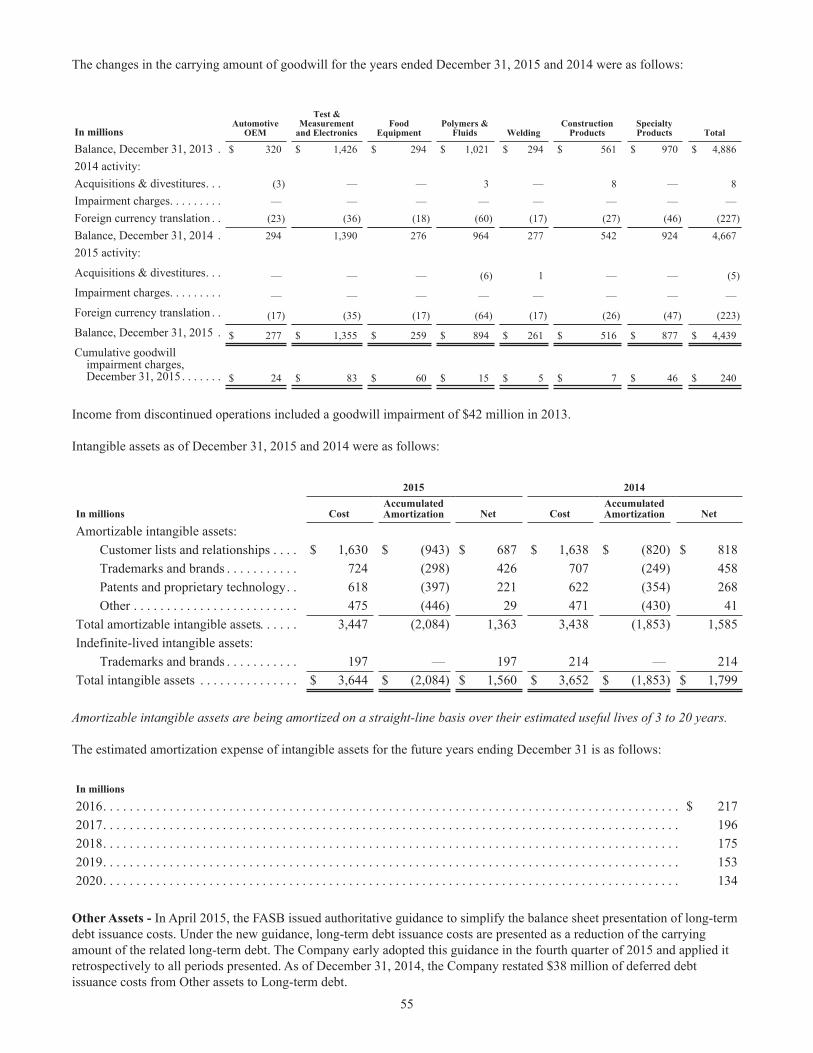
55
The changes in the carrying amount of goodwill for the years ended December 31, 2015 and 2014 were as follows:
In millionsAutomotive
OEM
Test &Measurement
and ElectronicsFood
EquipmentPolymers &
Fluids WeldingConstruction
ProductsSpecialtyProducts Total
Balance, December 31, 2013 . $ 320 $ 1,426 $ 294 $ 1,021 $ 294 $ 561 $ 970 $ 4,8862014 activity:Acquisitions & divestitures. . . (3) — — 3 — 8 — 8Impairment charges. . . . . . . . . — — — — — — — —Foreign currency translation . . (23) (36) (18) (60) (17) (27) (46) (227)Balance, December 31, 2014 . 294 1,390 276 964 277 542 924 4,6672015 activity:
Acquisitions & divestitures. . . — — — (6) 1 — — (5)Impairment charges. . . . . . . . . — — — — — — — —Foreign currency translation . . (17) (35) (17) (64) (17) (26) (47) (223)Balance, December 31, 2015 . $ 277 $ 1,355 $ 259 $ 894 $ 261 $ 516 $ 877 $ 4,439Cumulative goodwill
impairment charges,December 31, 2015 . . . . . . . $ 24 $ 83 $ 60 $ 15 $ 5 $ 7 $ 46 $ 240
Income from discontinued operations included a goodwill impairment of $42 million in 2013.
Intangible assets as of December 31, 2015 and 2014 were as follows:
2015 2014
In millions CostAccumulatedAmortization Net Cost
AccumulatedAmortization Net
Amortizable intangible assets:Customer lists and relationships . . . . $ 1,630 $ (943) $ 687 $ 1,638 $ (820) $ 818Trademarks and brands . . . . . . . . . . . 724 (298) 426 707 (249) 458Patents and proprietary technology. . 618 (397) 221 622 (354) 268Other . . . . . . . . . . . . . . . . . . . . . . . . . 475 (446) 29 471 (430) 41
Total amortizable intangible assets. . . . . . 3,447 (2,084) 1,363 3,438 (1,853) 1,585Indefinite-lived intangible assets:
Trademarks and brands . . . . . . . . . . . 197 — 197 214 — 214Total intangible assets . . . . . . . . . . . . . . . $ 3,644 $ (2,084) $ 1,560 $ 3,652 $ (1,853) $ 1,799
Amortizable intangible assets are being amortized on a straight-line basis over their estimated useful lives of 3 to 20 years.
The estimated amortization expense of intangible assets for the future years ending December 31 is as follows:
In millions
2016. . . . . . . . . . . . . . . . . . . . . . . . . . . . . . . . . . . . . . . . . . . . . . . . . . . . . . . . . . . . . . . . . . . . . . . . . . . . . . . . . . . . . . . $ 2172017. . . . . . . . . . . . . . . . . . . . . . . . . . . . . . . . . . . . . . . . . . . . . . . . . . . . . . . . . . . . . . . . . . . . . . . . . . . . . . . . . . . . . . . 1962018. . . . . . . . . . . . . . . . . . . . . . . . . . . . . . . . . . . . . . . . . . . . . . . . . . . . . . . . . . . . . . . . . . . . . . . . . . . . . . . . . . . . . . . 1752019. . . . . . . . . . . . . . . . . . . . . . . . . . . . . . . . . . . . . . . . . . . . . . . . . . . . . . . . . . . . . . . . . . . . . . . . . . . . . . . . . . . . . . . 1532020. . . . . . . . . . . . . . . . . . . . . . . . . . . . . . . . . . . . . . . . . . . . . . . . . . . . . . . . . . . . . . . . . . . . . . . . . . . . . . . . . . . . . . . 134
Other Assets - In April 2015, the FASB issued authoritative guidance to simplify the balance sheet presentation of long-term debt issuance costs. Under the new guidance, long-term debt issuance costs are presented as a reduction of the carrying amount of the related long-term debt. The Company early adopted this guidance in the fourth quarter of 2015 and applied it retrospectively to all periods presented. As of December 31, 2014, the Company restated $38 million of deferred debt issuance costs from Other assets to Long-term debt.
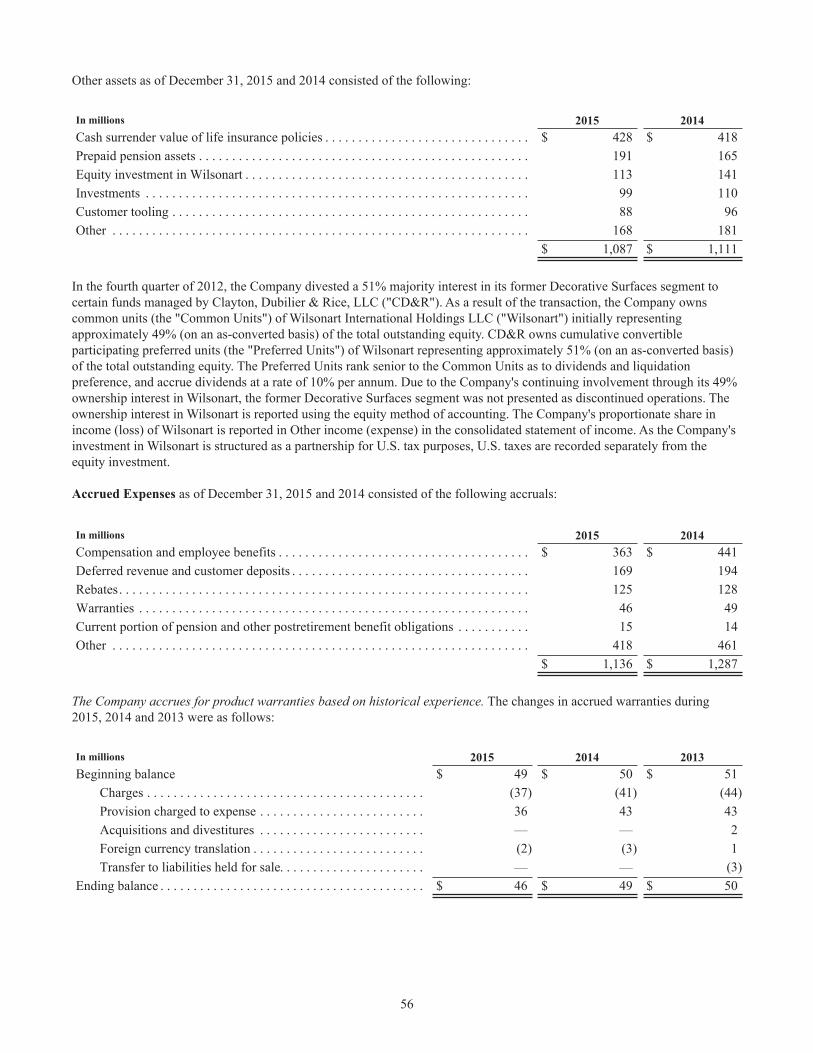
56
Other assets as of December 31, 2015 and 2014 consisted of the following:
In millions 2015 2014Cash surrender value of life insurance policies . . . . . . . . . . . . . . . . . . . . . . . . . . . . . . . $ 428 $ 418Prepaid pension assets . . . . . . . . . . . . . . . . . . . . . . . . . . . . . . . . . . . . . . . . . . . . . . . . . . 191 165Equity investment in Wilsonart . . . . . . . . . . . . . . . . . . . . . . . . . . . . . . . . . . . . . . . . . . . 113 141Investments . . . . . . . . . . . . . . . . . . . . . . . . . . . . . . . . . . . . . . . . . . . . . . . . . . . . . . . . . . 99 110Customer tooling . . . . . . . . . . . . . . . . . . . . . . . . . . . . . . . . . . . . . . . . . . . . . . . . . . . . . . 88 96Other . . . . . . . . . . . . . . . . . . . . . . . . . . . . . . . . . . . . . . . . . . . . . . . . . . . . . . . . . . . . . . . 168 181
$ 1,087 $ 1,111
In the fourth quarter of 2012, the Company divested a 51% majority interest in its former Decorative Surfaces segment to certain funds managed by Clayton, Dubilier & Rice, LLC ("CD&R"). As a result of the transaction, the Company owns common units (the "Common Units") of Wilsonart International Holdings LLC ("Wilsonart") initially representing approximately 49% (on an as-converted basis) of the total outstanding equity. CD&R owns cumulative convertible participating preferred units (the "Preferred Units") of Wilsonart representing approximately 51% (on an as-converted basis) of the total outstanding equity. The Preferred Units rank senior to the Common Units as to dividends and liquidation preference, and accrue dividends at a rate of 10% per annum. Due to the Company's continuing involvement through its 49%ownership interest in Wilsonart, the former Decorative Surfaces segment was not presented as discontinued operations. Theownership interest in Wilsonart is reported using the equity method of accounting. The Company's proportionate share in income (loss) of Wilsonart is reported in Other income (expense) in the consolidated statement of income. As the Company's investment in Wilsonart is structured as a partnership for U.S. tax purposes, U.S. taxes are recorded separately from the equity investment.
Accrued Expenses as of December 31, 2015 and 2014 consisted of the following accruals:
In millions 2015 2014Compensation and employee benefits . . . . . . . . . . . . . . . . . . . . . . . . . . . . . . . . . . . . . . $ 363 $ 441Deferred revenue and customer deposits . . . . . . . . . . . . . . . . . . . . . . . . . . . . . . . . . . . . 169 194Rebates. . . . . . . . . . . . . . . . . . . . . . . . . . . . . . . . . . . . . . . . . . . . . . . . . . . . . . . . . . . . . . 125 128Warranties . . . . . . . . . . . . . . . . . . . . . . . . . . . . . . . . . . . . . . . . . . . . . . . . . . . . . . . . . . . 46 49Current portion of pension and other postretirement benefit obligations . . . . . . . . . . . 15 14Other . . . . . . . . . . . . . . . . . . . . . . . . . . . . . . . . . . . . . . . . . . . . . . . . . . . . . . . . . . . . . . . 418 461
$ 1,136 $ 1,287
The Company accrues for product warranties based on historical experience. The changes in accrued warranties during 2015, 2014 and 2013 were as follows:
In millions 2015 2014 2013Beginning balance $ 49 $ 50 $ 51
Charges . . . . . . . . . . . . . . . . . . . . . . . . . . . . . . . . . . . . . . . . . . (37) (41) (44)Provision charged to expense . . . . . . . . . . . . . . . . . . . . . . . . . 36 43 43Acquisitions and divestitures . . . . . . . . . . . . . . . . . . . . . . . . . — — 2Foreign currency translation . . . . . . . . . . . . . . . . . . . . . . . . . . (2) (3) 1Transfer to liabilities held for sale. . . . . . . . . . . . . . . . . . . . . . — — (3)
Ending balance . . . . . . . . . . . . . . . . . . . . . . . . . . . . . . . . . . . . . . . . $ 46 $ 49 $ 50
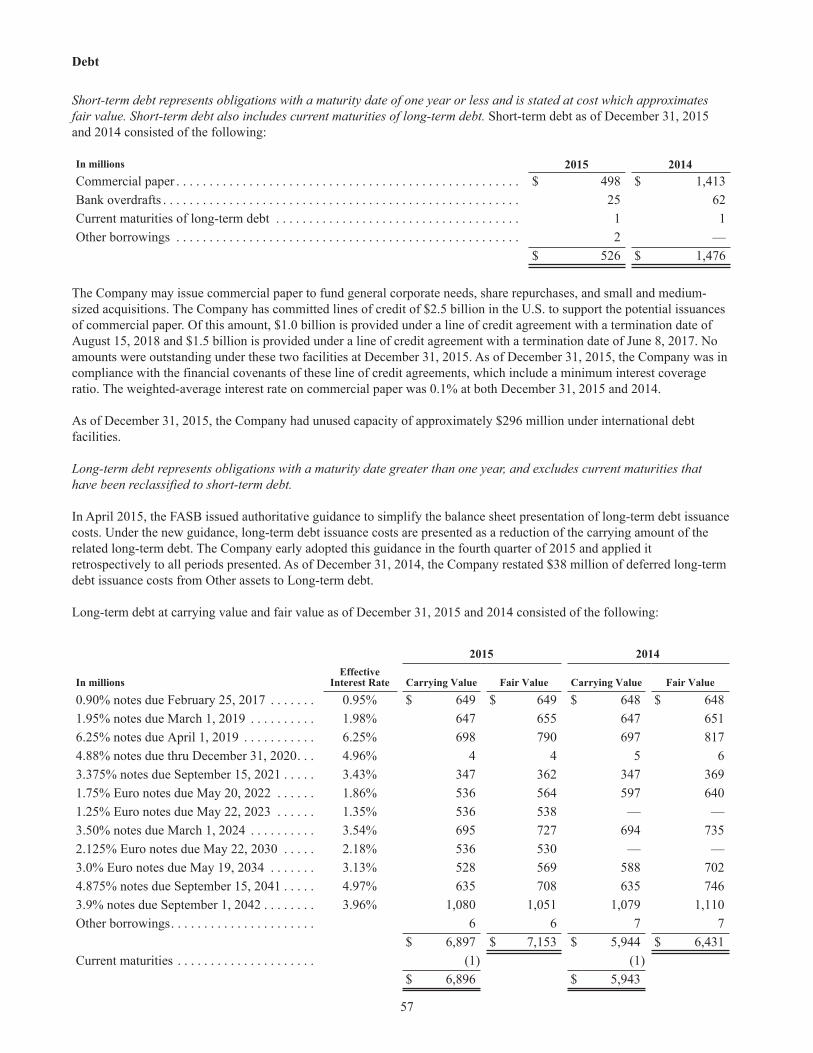
57
Debt
Short-term debt represents obligations with a maturity date of one year or less and is stated at cost which approximatesfair value. Short-term debt also includes current maturities of long-term debt. Short-term debt as of December 31, 2015and 2014 consisted of the following:
In millions 2015 2014Commercial paper . . . . . . . . . . . . . . . . . . . . . . . . . . . . . . . . . . . . . . . . . . . . . . . . . . . . $ 498 $ 1,413Bank overdrafts . . . . . . . . . . . . . . . . . . . . . . . . . . . . . . . . . . . . . . . . . . . . . . . . . . . . . . 25 62Current maturities of long-term debt . . . . . . . . . . . . . . . . . . . . . . . . . . . . . . . . . . . . . 1 1Other borrowings . . . . . . . . . . . . . . . . . . . . . . . . . . . . . . . . . . . . . . . . . . . . . . . . . . . . 2 —
$ 526 $ 1,476
The Company may issue commercial paper to fund general corporate needs, share repurchases, and small and medium-sized acquisitions. The Company has committed lines of credit of $2.5 billion in the U.S. to support the potential issuances of commercial paper. Of this amount, $1.0 billion is provided under a line of credit agreement with a termination date of August 15, 2018 and $1.5 billion is provided under a line of credit agreement with a termination date of June 8, 2017. Noamounts were outstanding under these two facilities at December 31, 2015. As of December 31, 2015, the Company was in compliance with the financial covenants of these line of credit agreements, which include a minimum interest coverage ratio. The weighted-average interest rate on commercial paper was 0.1% at both December 31, 2015 and 2014.
As of December 31, 2015, the Company had unused capacity of approximately $296 million under international debt facilities.
Long-term debt represents obligations with a maturity date greater than one year, and excludes current maturities that have been reclassified to short-term debt.
In April 2015, the FASB issued authoritative guidance to simplify the balance sheet presentation of long-term debt issuance costs. Under the new guidance, long-term debt issuance costs are presented as a reduction of the carrying amount of the related long-term debt. The Company early adopted this guidance in the fourth quarter of 2015 and applied it retrospectively to all periods presented. As of December 31, 2014, the Company restated $38 million of deferred long-term debt issuance costs from Other assets to Long-term debt.
Long-term debt at carrying value and fair value as of December 31, 2015 and 2014 consisted of the following:
2015 2014
In millionsEffective
Interest Rate Carrying Value Fair Value Carrying Value Fair Value
0.90% notes due February 25, 2017 . . . . . . . 0.95% $ 649 $ 649 $ 648 $ 6481.95% notes due March 1, 2019 . . . . . . . . . . 1.98% 647 655 647 6516.25% notes due April 1, 2019 . . . . . . . . . . . 6.25% 698 790 697 8174.88% notes due thru December 31, 2020. . . 4.96% 4 4 5 63.375% notes due September 15, 2021 . . . . . 3.43% 347 362 347 3691.75% Euro notes due May 20, 2022 . . . . . . 1.86% 536 564 597 6401.25% Euro notes due May 22, 2023 . . . . . . 1.35% 536 538 — —3.50% notes due March 1, 2024 . . . . . . . . . . 3.54% 695 727 694 7352.125% Euro notes due May 22, 2030 . . . . . 2.18% 536 530 — —3.0% Euro notes due May 19, 2034 . . . . . . . 3.13% 528 569 588 7024.875% notes due September 15, 2041 . . . . . 4.97% 635 708 635 7463.9% notes due September 1, 2042 . . . . . . . . 3.96% 1,080 1,051 1,079 1,110Other borrowings. . . . . . . . . . . . . . . . . . . . . . 6 6 7 7
$ 6,897 $ 7,153 $ 5,944 $ 6,431Current maturities . . . . . . . . . . . . . . . . . . . . . (1) (1)
$ 6,896 $ 5,943
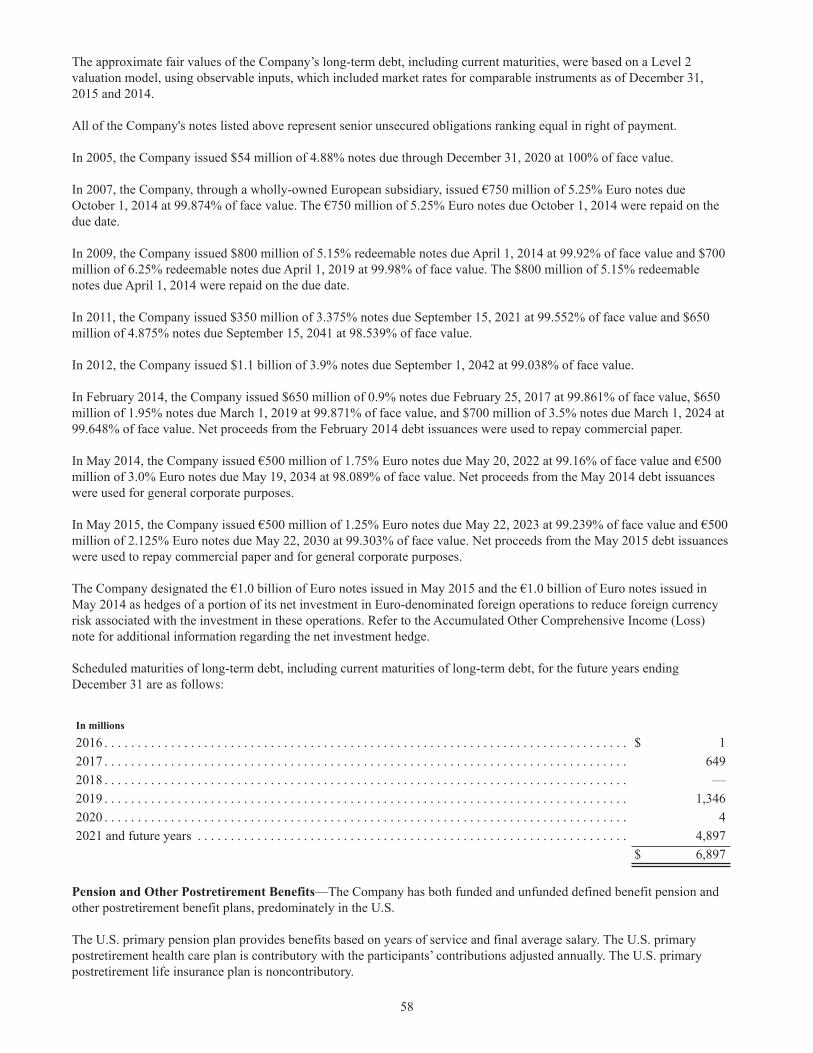
58
The approximate fair values of the Company’s long-term debt, including current maturities, were based on a Level 2 valuation model, using observable inputs, which included market rates for comparable instruments as of December 31, 2015 and 2014.
All of the Company's notes listed above represent senior unsecured obligations ranking equal in right of payment.
In 2005, the Company issued $54 million of 4.88% notes due through December 31, 2020 at 100% of face value.
In 2007, the Company, through a wholly-owned European subsidiary, issued €750 million of 5.25% Euro notes due October 1, 2014 at 99.874% of face value. The €750 million of 5.25% Euro notes due October 1, 2014 were repaid on the due date.
In 2009, the Company issued $800 million of 5.15% redeemable notes due April 1, 2014 at 99.92% of face value and $700million of 6.25% redeemable notes due April 1, 2019 at 99.98% of face value. The $800 million of 5.15% redeemable notes due April 1, 2014 were repaid on the due date.
In 2011, the Company issued $350 million of 3.375% notes due September 15, 2021 at 99.552% of face value and $650million of 4.875% notes due September 15, 2041 at 98.539% of face value.
In 2012, the Company issued $1.1 billion of 3.9% notes due September 1, 2042 at 99.038% of face value.
In February 2014, the Company issued $650 million of 0.9% notes due February 25, 2017 at 99.861% of face value, $650million of 1.95% notes due March 1, 2019 at 99.871% of face value, and $700 million of 3.5% notes due March 1, 2024 at 99.648% of face value. Net proceeds from the February 2014 debt issuances were used to repay commercial paper.
In May 2014, the Company issued €500 million of 1.75% Euro notes due May 20, 2022 at 99.16% of face value and €500million of 3.0% Euro notes due May 19, 2034 at 98.089% of face value. Net proceeds from the May 2014 debt issuances were used for general corporate purposes.
In May 2015, the Company issued €500 million of 1.25% Euro notes due May 22, 2023 at 99.239% of face value and €500million of 2.125% Euro notes due May 22, 2030 at 99.303% of face value. Net proceeds from the May 2015 debt issuances were used to repay commercial paper and for general corporate purposes.
The Company designated the €1.0 billion of Euro notes issued in May 2015 and the €1.0 billion of Euro notes issued in May 2014 as hedges of a portion of its net investment in Euro-denominated foreign operations to reduce foreign currency risk associated with the investment in these operations. Refer to the Accumulated Other Comprehensive Income (Loss) note for additional information regarding the net investment hedge.
Scheduled maturities of long-term debt, including current maturities of long-term debt, for the future years ending December 31 are as follows:
In millions
2016 . . . . . . . . . . . . . . . . . . . . . . . . . . . . . . . . . . . . . . . . . . . . . . . . . . . . . . . . . . . . . . . . . . . . . . . . . . . . . . . $ 12017 . . . . . . . . . . . . . . . . . . . . . . . . . . . . . . . . . . . . . . . . . . . . . . . . . . . . . . . . . . . . . . . . . . . . . . . . . . . . . . . 6492018 . . . . . . . . . . . . . . . . . . . . . . . . . . . . . . . . . . . . . . . . . . . . . . . . . . . . . . . . . . . . . . . . . . . . . . . . . . . . . . . —2019 . . . . . . . . . . . . . . . . . . . . . . . . . . . . . . . . . . . . . . . . . . . . . . . . . . . . . . . . . . . . . . . . . . . . . . . . . . . . . . . 1,3462020 . . . . . . . . . . . . . . . . . . . . . . . . . . . . . . . . . . . . . . . . . . . . . . . . . . . . . . . . . . . . . . . . . . . . . . . . . . . . . . . 42021 and future years . . . . . . . . . . . . . . . . . . . . . . . . . . . . . . . . . . . . . . . . . . . . . . . . . . . . . . . . . . . . . . . . . 4,897
$ 6,897
Pension and Other Postretirement Benefits—The Company has both funded and unfunded defined benefit pension and other postretirement benefit plans, predominately in the U.S.
The U.S. primary pension plan provides benefits based on years of service and final average salary. The U.S. primary postretirement health care plan is contributory with the participants’ contributions adjusted annually. The U.S. primary postretirement life insurance plan is noncontributory.
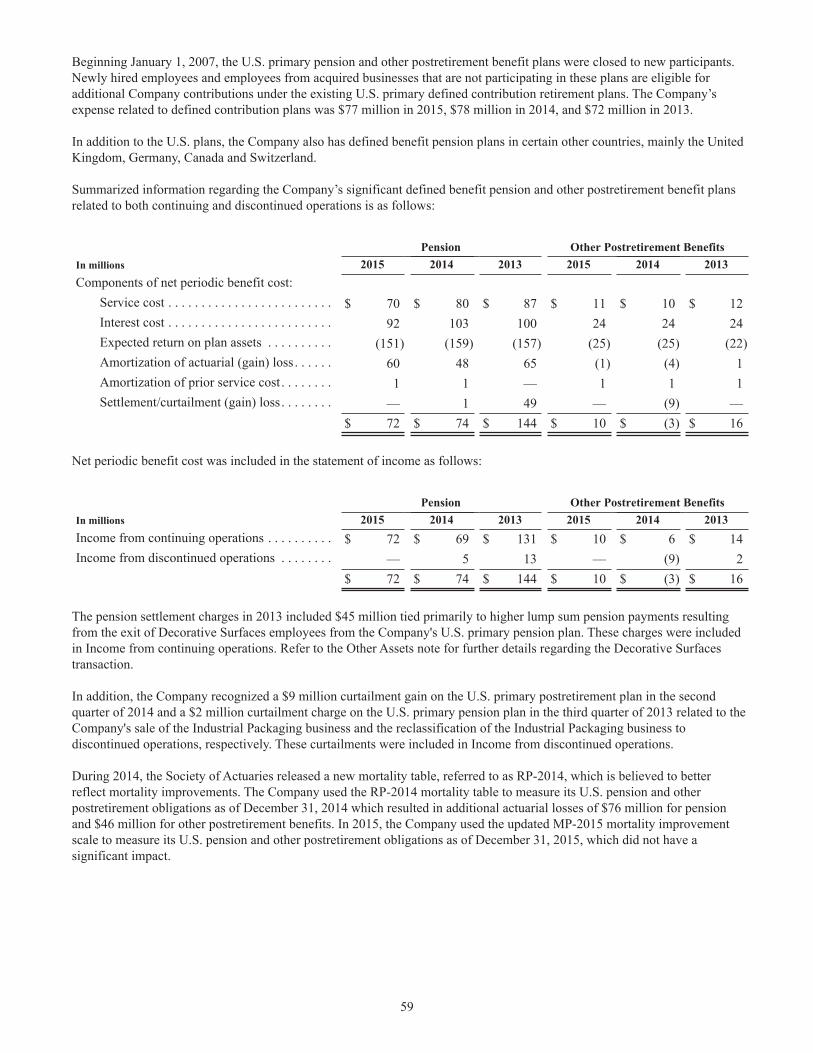
59
Beginning January 1, 2007, the U.S. primary pension and other postretirement benefit plans were closed to new participants. Newly hired employees and employees from acquired businesses that are not participating in these plans are eligible for additional Company contributions under the existing U.S. primary defined contribution retirement plans. The Company’sexpense related to defined contribution plans was $77 million in 2015, $78 million in 2014, and $72 million in 2013.
In addition to the U.S. plans, the Company also has defined benefit pension plans in certain other countries, mainly the United Kingdom, Germany, Canada and Switzerland.
Summarized information regarding the Company’s significant defined benefit pension and other postretirement benefit plans related to both continuing and discontinued operations is as follows:
Pension Other Postretirement BenefitsIn millions 2015 2014 2013 2015 2014 2013Components of net periodic benefit cost:
Service cost . . . . . . . . . . . . . . . . . . . . . . . . . $ 70 $ 80 $ 87 $ 11 $ 10 $ 12Interest cost . . . . . . . . . . . . . . . . . . . . . . . . . 92 103 100 24 24 24Expected return on plan assets . . . . . . . . . . (151) (159) (157) (25) (25) (22)Amortization of actuarial (gain) loss . . . . . . 60 48 65 (1) (4) 1Amortization of prior service cost . . . . . . . . 1 1 — 1 1 1Settlement/curtailment (gain) loss. . . . . . . . — 1 49 — (9) —
$ 72 $ 74 $ 144 $ 10 $ (3) $ 16
Net periodic benefit cost was included in the statement of income as follows:
Pension Other Postretirement BenefitsIn millions 2015 2014 2013 2015 2014 2013Income from continuing operations . . . . . . . . . . $ 72 $ 69 $ 131 $ 10 $ 6 $ 14Income from discontinued operations . . . . . . . . — 5 13 — (9) 2
$ 72 $ 74 $ 144 $ 10 $ (3) $ 16
The pension settlement charges in 2013 included $45 million tied primarily to higher lump sum pension payments resulting from the exit of Decorative Surfaces employees from the Company's U.S. primary pension plan. These charges were included in Income from continuing operations. Refer to the Other Assets note for further details regarding the Decorative Surfaces transaction.
In addition, the Company recognized a $9 million curtailment gain on the U.S. primary postretirement plan in the second quarter of 2014 and a $2 million curtailment charge on the U.S. primary pension plan in the third quarter of 2013 related to the Company's sale of the Industrial Packaging business and the reclassification of the Industrial Packaging business to discontinued operations, respectively. These curtailments were included in Income from discontinued operations.
During 2014, the Society of Actuaries released a new mortality table, referred to as RP-2014, which is believed to better reflect mortality improvements. The Company used the RP-2014 mortality table to measure its U.S. pension and other postretirement obligations as of December 31, 2014 which resulted in additional actuarial losses of $76 million for pension and $46 million for other postretirement benefits. In 2015, the Company used the updated MP-2015 mortality improvement scale to measure its U.S. pension and other postretirement obligations as of December 31, 2015, which did not have a significant impact.
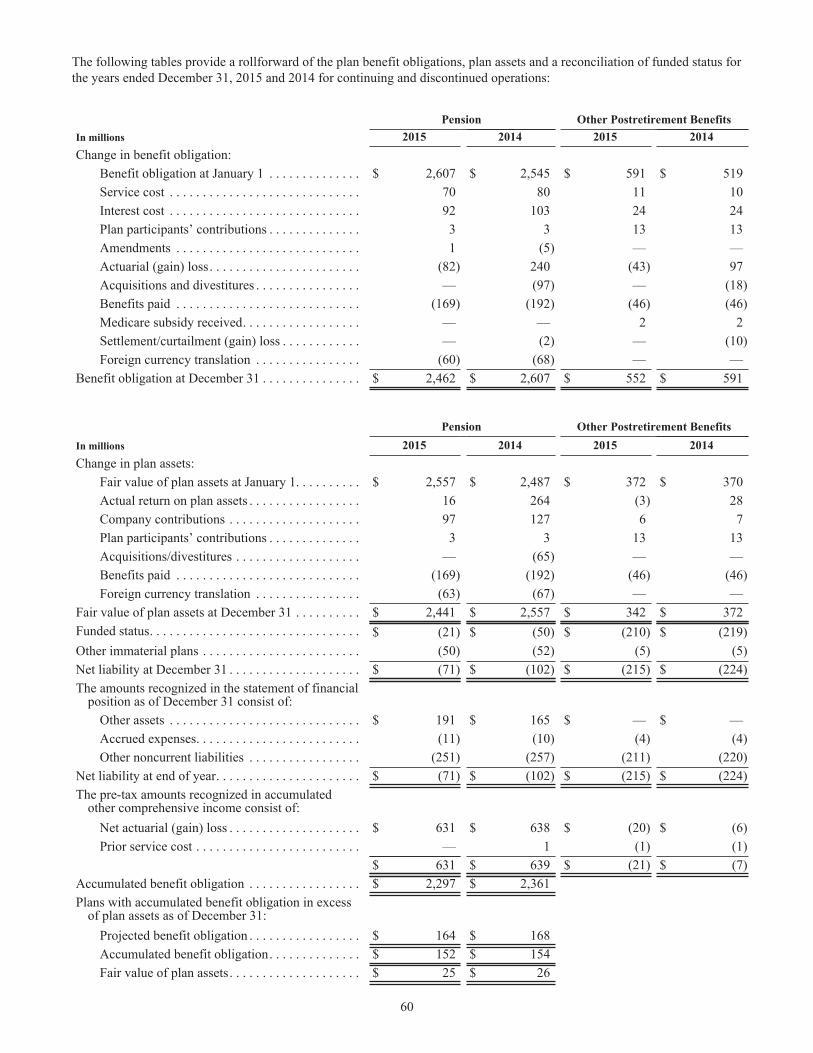
60
The following tables provide a rollforward of the plan benefit obligations, plan assets and a reconciliation of funded status for the years ended December 31, 2015 and 2014 for continuing and discontinued operations:
Pension Other Postretirement BenefitsIn millions 2015 2014 2015 2014Change in benefit obligation:
Benefit obligation at January 1 . . . . . . . . . . . . . . $ 2,607 $ 2,545 $ 591 $ 519Service cost . . . . . . . . . . . . . . . . . . . . . . . . . . . . . 70 80 11 10Interest cost . . . . . . . . . . . . . . . . . . . . . . . . . . . . . 92 103 24 24Plan participants’ contributions . . . . . . . . . . . . . . 3 3 13 13Amendments . . . . . . . . . . . . . . . . . . . . . . . . . . . . 1 (5) — —Actuarial (gain) loss. . . . . . . . . . . . . . . . . . . . . . . (82) 240 (43) 97Acquisitions and divestitures . . . . . . . . . . . . . . . . — (97) — (18)Benefits paid . . . . . . . . . . . . . . . . . . . . . . . . . . . . (169) (192) (46) (46)Medicare subsidy received. . . . . . . . . . . . . . . . . . — — 2 2Settlement/curtailment (gain) loss . . . . . . . . . . . . — (2) — (10)Foreign currency translation . . . . . . . . . . . . . . . . (60) (68) — —
Benefit obligation at December 31 . . . . . . . . . . . . . . . $ 2,462 $ 2,607 $ 552 $ 591
Pension Other Postretirement BenefitsIn millions 2015 2014 2015 2014Change in plan assets:
Fair value of plan assets at January 1. . . . . . . . . . $ 2,557 $ 2,487 $ 372 $ 370Actual return on plan assets . . . . . . . . . . . . . . . . . 16 264 (3) 28Company contributions . . . . . . . . . . . . . . . . . . . . 97 127 6 7Plan participants’ contributions . . . . . . . . . . . . . . 3 3 13 13Acquisitions/divestitures . . . . . . . . . . . . . . . . . . . — (65) — —Benefits paid . . . . . . . . . . . . . . . . . . . . . . . . . . . . (169) (192) (46) (46)Foreign currency translation . . . . . . . . . . . . . . . . (63) (67) — —
Fair value of plan assets at December 31 . . . . . . . . . . $ 2,441 $ 2,557 $ 342 $ 372Funded status. . . . . . . . . . . . . . . . . . . . . . . . . . . . . . . . $ (21) $ (50) $ (210) $ (219)Other immaterial plans . . . . . . . . . . . . . . . . . . . . . . . . (50) (52) (5) (5)Net liability at December 31 . . . . . . . . . . . . . . . . . . . . $ (71) $ (102) $ (215) $ (224)The amounts recognized in the statement of financial
position as of December 31 consist of:Other assets . . . . . . . . . . . . . . . . . . . . . . . . . . . . . $ 191 $ 165 $ — $ —Accrued expenses. . . . . . . . . . . . . . . . . . . . . . . . . (11) (10) (4) (4)Other noncurrent liabilities . . . . . . . . . . . . . . . . . (251) (257) (211) (220)
Net liability at end of year. . . . . . . . . . . . . . . . . . . . . . $ (71) $ (102) $ (215) $ (224)The pre-tax amounts recognized in accumulated
other comprehensive income consist of:Net actuarial (gain) loss . . . . . . . . . . . . . . . . . . . . $ 631 $ 638 $ (20) $ (6)Prior service cost . . . . . . . . . . . . . . . . . . . . . . . . . — 1 (1) (1)
$ 631 $ 639 $ (21) $ (7)Accumulated benefit obligation . . . . . . . . . . . . . . . . . $ 2,297 $ 2,361Plans with accumulated benefit obligation in excess
of plan assets as of December 31:Projected benefit obligation . . . . . . . . . . . . . . . . . $ 164 $ 168Accumulated benefit obligation. . . . . . . . . . . . . . $ 152 $ 154Fair value of plan assets. . . . . . . . . . . . . . . . . . . . $ 25 $ 26
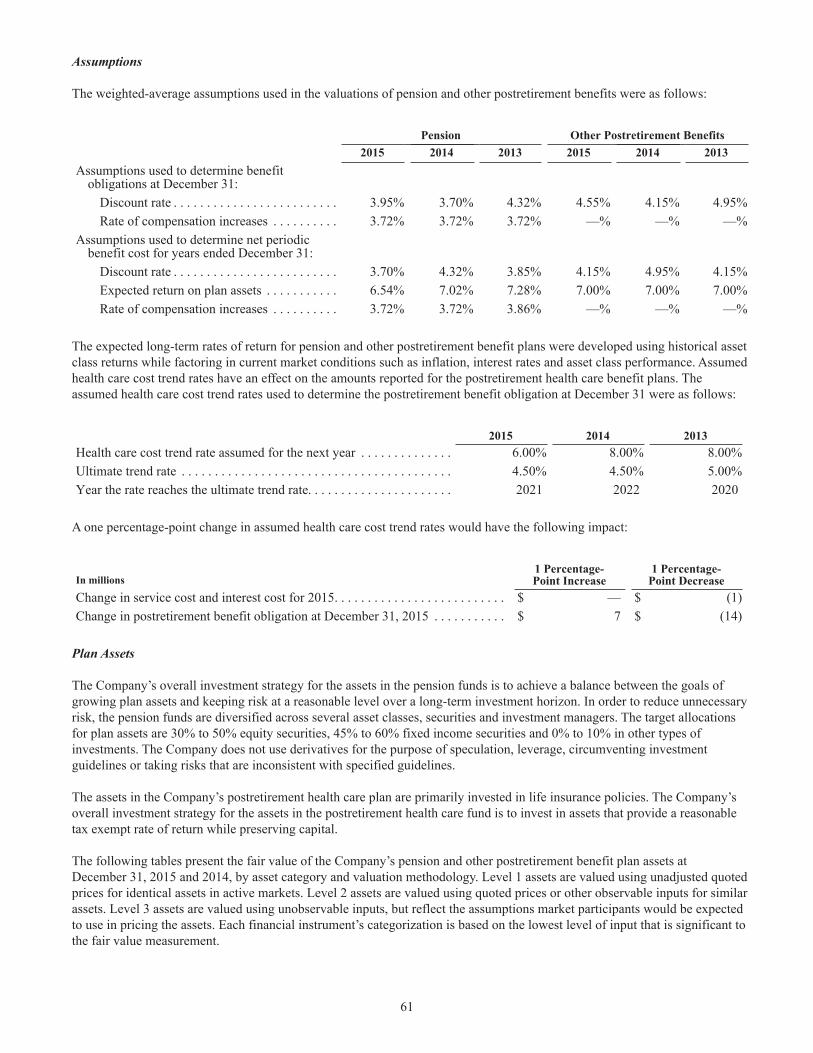
61
Assumptions
The weighted-average assumptions used in the valuations of pension and other postretirement benefits were as follows:
Pension Other Postretirement Benefits 2015 2014 2013 2015 2014 2013Assumptions used to determine benefit
obligations at December 31:Discount rate . . . . . . . . . . . . . . . . . . . . . . . . . 3.95% 3.70% 4.32% 4.55% 4.15% 4.95%Rate of compensation increases . . . . . . . . . . 3.72% 3.72% 3.72% —% —% —%
Assumptions used to determine net periodicbenefit cost for years ended December 31:
Discount rate . . . . . . . . . . . . . . . . . . . . . . . . . 3.70% 4.32% 3.85% 4.15% 4.95% 4.15%Expected return on plan assets . . . . . . . . . . . 6.54% 7.02% 7.28% 7.00% 7.00% 7.00%Rate of compensation increases . . . . . . . . . . 3.72% 3.72% 3.86% —% —% —%
The expected long-term rates of return for pension and other postretirement benefit plans were developed using historical asset class returns while factoring in current market conditions such as inflation, interest rates and asset class performance. Assumedhealth care cost trend rates have an effect on the amounts reported for the postretirement health care benefit plans. Theassumed health care cost trend rates used to determine the postretirement benefit obligation at December 31 were as follows:
2015 2014 2013Health care cost trend rate assumed for the next year . . . . . . . . . . . . . . 6.00% 8.00% 8.00%Ultimate trend rate . . . . . . . . . . . . . . . . . . . . . . . . . . . . . . . . . . . . . . . . . 4.50% 4.50% 5.00%Year the rate reaches the ultimate trend rate. . . . . . . . . . . . . . . . . . . . . . 2021 2022 2020
A one percentage-point change in assumed health care cost trend rates would have the following impact:
In millions1 Percentage-Point Increase
1 Percentage-Point Decrease
Change in service cost and interest cost for 2015. . . . . . . . . . . . . . . . . . . . . . . . . . $ — $ (1)Change in postretirement benefit obligation at December 31, 2015 . . . . . . . . . . . $ 7 $ (14)
Plan Assets
The Company’s overall investment strategy for the assets in the pension funds is to achieve a balance between the goals of growing plan assets and keeping risk at a reasonable level over a long-term investment horizon. In order to reduce unnecessary risk, the pension funds are diversified across several asset classes, securities and investment managers. The target allocations for plan assets are 30% to 50% equity securities, 45% to 60% fixed income securities and 0% to 10% in other types of investments. The Company does not use derivatives for the purpose of speculation, leverage, circumventing investment guidelines or taking risks that are inconsistent with specified guidelines.
The assets in the Company’s postretirement health care plan are primarily invested in life insurance policies. The Company’soverall investment strategy for the assets in the postretirement health care fund is to invest in assets that provide a reasonable tax exempt rate of return while preserving capital.
The following tables present the fair value of the Company’s pension and other postretirement benefit plan assets at December 31, 2015 and 2014, by asset category and valuation methodology. Level 1 assets are valued using unadjusted quoted prices for identical assets in active markets. Level 2 assets are valued using quoted prices or other observable inputs for similar assets. Level 3 assets are valued using unobservable inputs, but reflect the assumptions market participants would be expected to use in pricing the assets. Each financial instrument’s categorization is based on the lowest level of input that is significant to the fair value measurement.
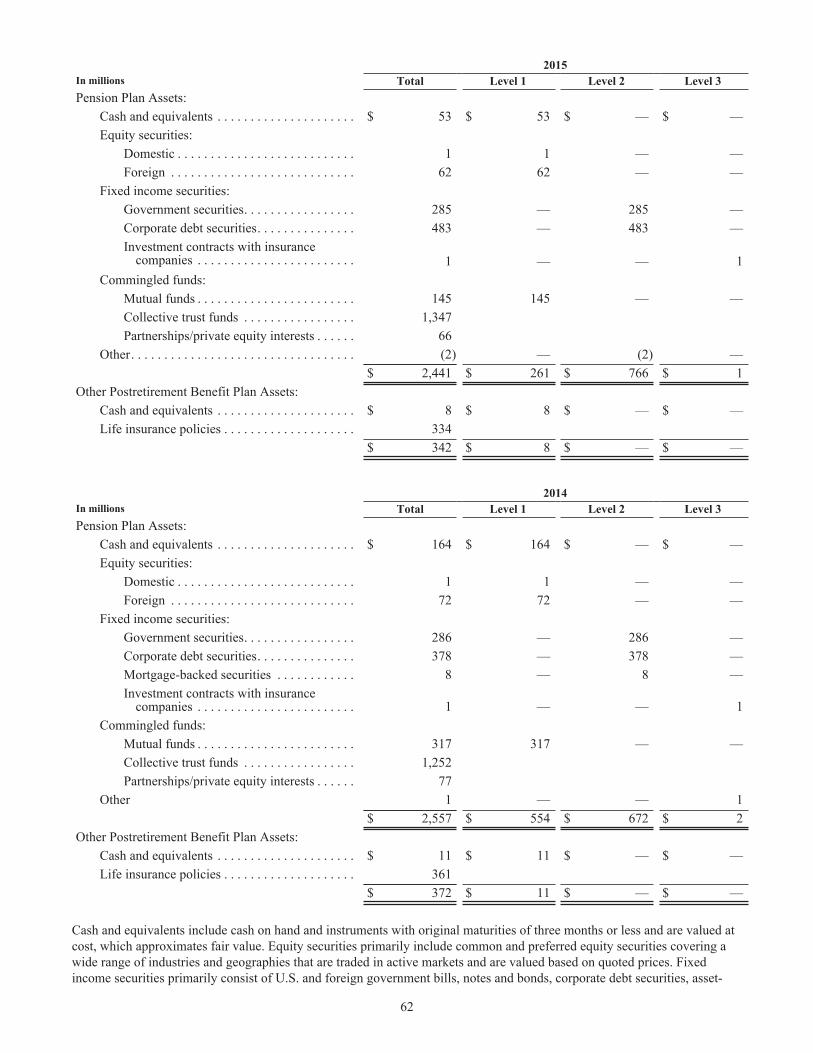
62
2015In millions Total Level 1 Level 2 Level 3Pension Plan Assets:
Cash and equivalents . . . . . . . . . . . . . . . . . . . . . $ 53 $ 53 $ — $ —Equity securities:
Domestic . . . . . . . . . . . . . . . . . . . . . . . . . . . 1 1 — —Foreign . . . . . . . . . . . . . . . . . . . . . . . . . . . . 62 62 — —
Fixed income securities:Government securities. . . . . . . . . . . . . . . . . 285 — 285 —Corporate debt securities. . . . . . . . . . . . . . . 483 — 483 —Investment contracts with insurance
companies . . . . . . . . . . . . . . . . . . . . . . . . 1 — — 1Commingled funds:
Mutual funds . . . . . . . . . . . . . . . . . . . . . . . . 145 145 — —Collective trust funds . . . . . . . . . . . . . . . . . 1,347Partnerships/private equity interests . . . . . . 66
Other. . . . . . . . . . . . . . . . . . . . . . . . . . . . . . . . . . (2) — (2) —$ 2,441 $ 261 $ 766 $ 1
Other Postretirement Benefit Plan Assets:Cash and equivalents . . . . . . . . . . . . . . . . . . . . . $ 8 $ 8 $ — $ —Life insurance policies . . . . . . . . . . . . . . . . . . . . 334
$ 342 $ 8 $ — $ —
2014In millions Total Level 1 Level 2 Level 3Pension Plan Assets:
Cash and equivalents . . . . . . . . . . . . . . . . . . . . . $ 164 $ 164 $ — $ —Equity securities:
Domestic . . . . . . . . . . . . . . . . . . . . . . . . . . . 1 1 — —Foreign . . . . . . . . . . . . . . . . . . . . . . . . . . . . 72 72 — —
Fixed income securities:Government securities. . . . . . . . . . . . . . . . . 286 — 286 —Corporate debt securities. . . . . . . . . . . . . . . 378 — 378 —Mortgage-backed securities . . . . . . . . . . . . 8 — 8 —Investment contracts with insurance
companies . . . . . . . . . . . . . . . . . . . . . . . . 1 — — 1Commingled funds:
Mutual funds . . . . . . . . . . . . . . . . . . . . . . . . 317 317 — —Collective trust funds . . . . . . . . . . . . . . . . . 1,252Partnerships/private equity interests . . . . . . 77
Other 1 — — 1$ 2,557 $ 554 $ 672 $ 2
Other Postretirement Benefit Plan Assets:Cash and equivalents . . . . . . . . . . . . . . . . . . . . . $ 11 $ 11 $ — $ —Life insurance policies . . . . . . . . . . . . . . . . . . . . 361
$ 372 $ 11 $ — $ —
Cash and equivalents include cash on hand and instruments with original maturities of three months or less and are valued at cost, which approximates fair value. Equity securities primarily include common and preferred equity securities covering a wide range of industries and geographies that are traded in active markets and are valued based on quoted prices. Fixed income securities primarily consist of U.S. and foreign government bills, notes and bonds, corporate debt securities, asset-
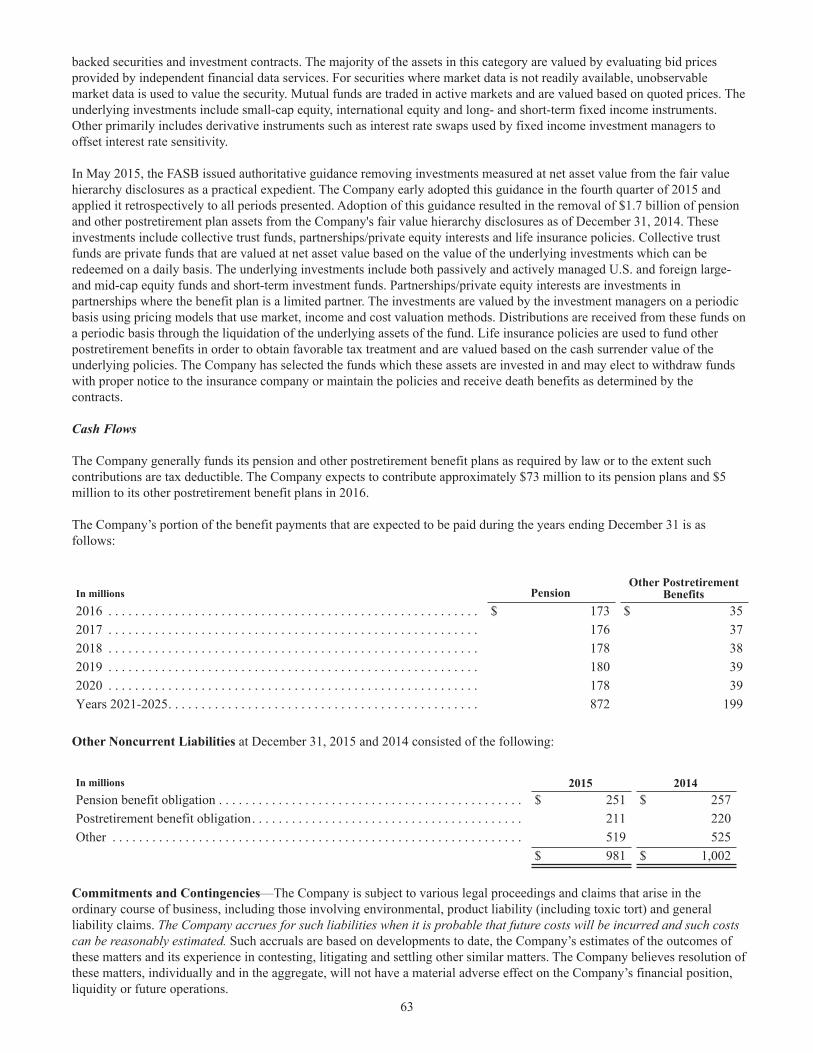
63
backed securities and investment contracts. The majority of the assets in this category are valued by evaluating bid prices provided by independent financial data services. For securities where market data is not readily available, unobservable market data is used to value the security. Mutual funds are traded in active markets and are valued based on quoted prices. Theunderlying investments include small-cap equity, international equity and long- and short-term fixed income instruments. Other primarily includes derivative instruments such as interest rate swaps used by fixed income investment managers to offset interest rate sensitivity.
In May 2015, the FASB issued authoritative guidance removing investments measured at net asset value from the fair value hierarchy disclosures as a practical expedient. The Company early adopted this guidance in the fourth quarter of 2015 and applied it retrospectively to all periods presented. Adoption of this guidance resulted in the removal of $1.7 billion of pension and other postretirement plan assets from the Company's fair value hierarchy disclosures as of December 31, 2014. Theseinvestments include collective trust funds, partnerships/private equity interests and life insurance policies. Collective trust funds are private funds that are valued at net asset value based on the value of the underlying investments which can be redeemed on a daily basis. The underlying investments include both passively and actively managed U.S. and foreign large-and mid-cap equity funds and short-term investment funds. Partnerships/private equity interests are investments in partnerships where the benefit plan is a limited partner. The investments are valued by the investment managers on a periodic basis using pricing models that use market, income and cost valuation methods. Distributions are received from these funds on a periodic basis through the liquidation of the underlying assets of the fund. Life insurance policies are used to fund other postretirement benefits in order to obtain favorable tax treatment and are valued based on the cash surrender value of the underlying policies. The Company has selected the funds which these assets are invested in and may elect to withdraw funds with proper notice to the insurance company or maintain the policies and receive death benefits as determined by the contracts.
Cash Flows
The Company generally funds its pension and other postretirement benefit plans as required by law or to the extent such contributions are tax deductible. The Company expects to contribute approximately $73 million to its pension plans and $5million to its other postretirement benefit plans in 2016.
The Company’s portion of the benefit payments that are expected to be paid during the years ending December 31 is as follows:
In millions PensionOther Postretirement
Benefits2016 . . . . . . . . . . . . . . . . . . . . . . . . . . . . . . . . . . . . . . . . . . . . . . . . . . . . . . . . $ 173 $ 352017 . . . . . . . . . . . . . . . . . . . . . . . . . . . . . . . . . . . . . . . . . . . . . . . . . . . . . . . . 176 372018 . . . . . . . . . . . . . . . . . . . . . . . . . . . . . . . . . . . . . . . . . . . . . . . . . . . . . . . . 178 382019 . . . . . . . . . . . . . . . . . . . . . . . . . . . . . . . . . . . . . . . . . . . . . . . . . . . . . . . . 180 392020 . . . . . . . . . . . . . . . . . . . . . . . . . . . . . . . . . . . . . . . . . . . . . . . . . . . . . . . . 178 39Years 2021-2025. . . . . . . . . . . . . . . . . . . . . . . . . . . . . . . . . . . . . . . . . . . . . . . 872 199
Other Noncurrent Liabilities at December 31, 2015 and 2014 consisted of the following:
In millions 2015 2014Pension benefit obligation . . . . . . . . . . . . . . . . . . . . . . . . . . . . . . . . . . . . . . . . . . . . . . $ 251 $ 257Postretirement benefit obligation. . . . . . . . . . . . . . . . . . . . . . . . . . . . . . . . . . . . . . . . . 211 220Other . . . . . . . . . . . . . . . . . . . . . . . . . . . . . . . . . . . . . . . . . . . . . . . . . . . . . . . . . . . . . . 519 525
$ 981 $ 1,002
Commitments and Contingencies—The Company is subject to various legal proceedings and claims that arise in the ordinary course of business, including those involving environmental, product liability (including toxic tort) and general liability claims. The Company accrues for such liabilities when it is probable that future costs will be incurred and such costs can be reasonably estimated. Such accruals are based on developments to date, the Company’s estimates of the outcomes of these matters and its experience in contesting, litigating and settling other similar matters. The Company believes resolution of these matters, individually and in the aggregate, will not have a material adverse effect on the Company’s financial position, liquidity or future operations.
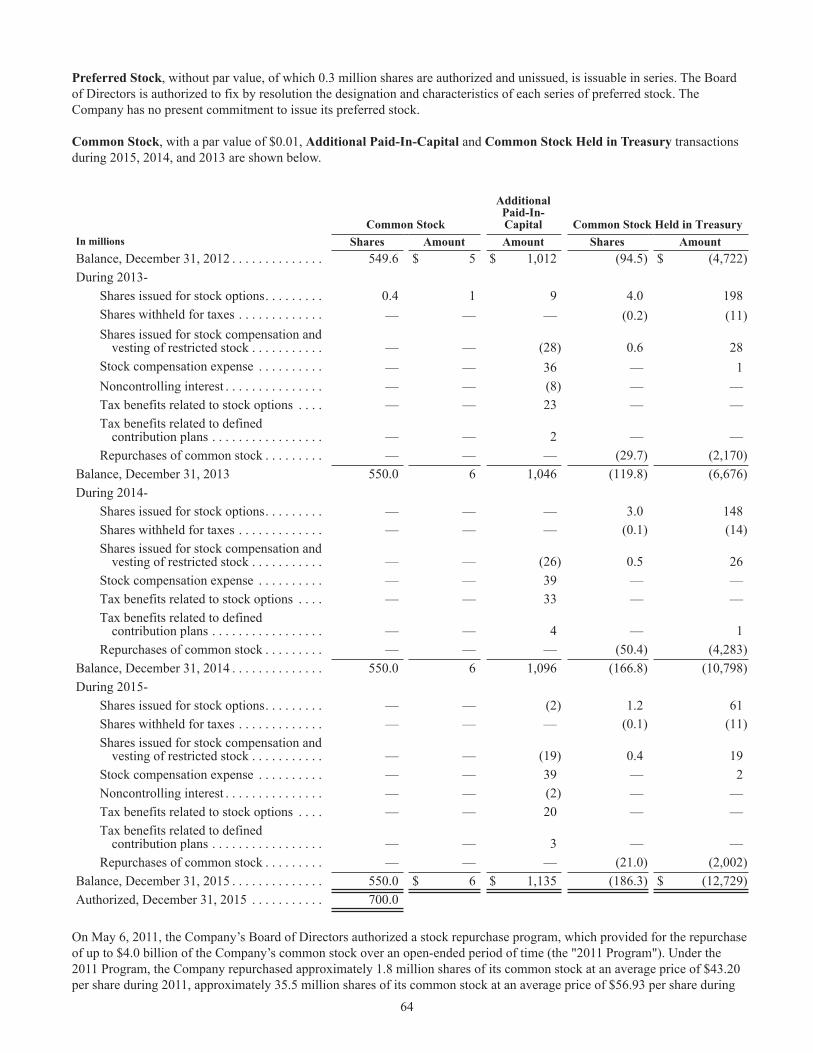
64
Preferred Stock, without par value, of which 0.3 million shares are authorized and unissued, is issuable in series. The Board of Directors is authorized to fix by resolution the designation and characteristics of each series of preferred stock. TheCompany has no present commitment to issue its preferred stock.
Common Stock, with a par value of $0.01, Additional Paid-In-Capital and Common Stock Held in Treasury transactions during 2015, 2014, and 2013 are shown below.
Common Stock
AdditionalPaid-In-Capital Common Stock Held in Treasury
In millions Shares Amount Amount Shares AmountBalance, December 31, 2012 . . . . . . . . . . . . . . 549.6 $ 5 $ 1,012 (94.5) $ (4,722)During 2013-
Shares issued for stock options. . . . . . . . . 0.4 1 9 4.0 198Shares withheld for taxes . . . . . . . . . . . . . — — — (0.2) (11)Shares issued for stock compensation and
vesting of restricted stock . . . . . . . . . . . — — (28) 0.6 28Stock compensation expense . . . . . . . . . . — — 36 — 1Noncontrolling interest . . . . . . . . . . . . . . . — — (8) — —Tax benefits related to stock options . . . . — — 23 — —Tax benefits related to defined
contribution plans . . . . . . . . . . . . . . . . . — — 2 — —Repurchases of common stock . . . . . . . . . — — — (29.7) (2,170)
Balance, December 31, 2013 550.0 6 1,046 (119.8) (6,676)During 2014-
Shares issued for stock options. . . . . . . . . — — — 3.0 148Shares withheld for taxes . . . . . . . . . . . . . — — — (0.1) (14)Shares issued for stock compensation and
vesting of restricted stock . . . . . . . . . . . — — (26) 0.5 26Stock compensation expense . . . . . . . . . . — — 39 — —Tax benefits related to stock options . . . . — — 33 — —Tax benefits related to defined
contribution plans . . . . . . . . . . . . . . . . . — — 4 — 1Repurchases of common stock . . . . . . . . . — — — (50.4) (4,283)
Balance, December 31, 2014 . . . . . . . . . . . . . . 550.0 6 1,096 (166.8) (10,798)During 2015-
Shares issued for stock options. . . . . . . . . — — (2) 1.2 61Shares withheld for taxes . . . . . . . . . . . . . — — — (0.1) (11)Shares issued for stock compensation and
vesting of restricted stock . . . . . . . . . . . — — (19) 0.4 19Stock compensation expense . . . . . . . . . . — — 39 — 2Noncontrolling interest . . . . . . . . . . . . . . . — — (2) — —Tax benefits related to stock options . . . . — — 20 — —Tax benefits related to defined
contribution plans . . . . . . . . . . . . . . . . . — — 3 — —Repurchases of common stock . . . . . . . . . — — — (21.0) (2,002)
Balance, December 31, 2015 . . . . . . . . . . . . . . 550.0 $ 6 $ 1,135 (186.3) $ (12,729)Authorized, December 31, 2015 . . . . . . . . . . . 700.0
On May 6, 2011, the Company’s Board of Directors authorized a stock repurchase program, which provided for the repurchase of up to $4.0 billion of the Company’s common stock over an open-ended period of time (the "2011 Program"). Under the 2011 Program, the Company repurchased approximately 1.8 million shares of its common stock at an average price of $43.20per share during 2011, approximately 35.5 million shares of its common stock at an average price of $56.93 per share during
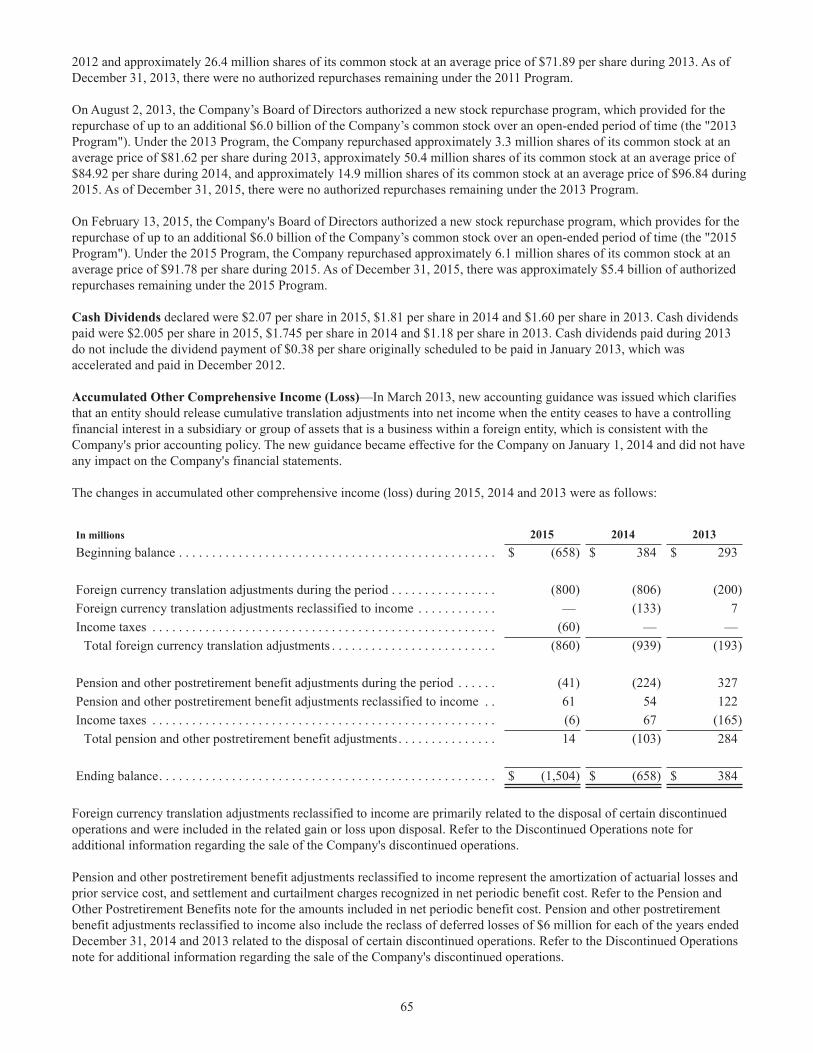
65
2012 and approximately 26.4 million shares of its common stock at an average price of $71.89 per share during 2013. As of December 31, 2013, there were no authorized repurchases remaining under the 2011 Program.
On August 2, 2013, the Company’s Board of Directors authorized a new stock repurchase program, which provided for the repurchase of up to an additional $6.0 billion of the Company’s common stock over an open-ended period of time (the "2013 Program"). Under the 2013 Program, the Company repurchased approximately 3.3 million shares of its common stock at an average price of $81.62 per share during 2013, approximately 50.4 million shares of its common stock at an average price of $84.92 per share during 2014, and approximately 14.9 million shares of its common stock at an average price of $96.84 during 2015. As of December 31, 2015, there were no authorized repurchases remaining under the 2013 Program.
On February 13, 2015, the Company's Board of Directors authorized a new stock repurchase program, which provides for the repurchase of up to an additional $6.0 billion of the Company’s common stock over an open-ended period of time (the "2015 Program"). Under the 2015 Program, the Company repurchased approximately 6.1 million shares of its common stock at an average price of $91.78 per share during 2015. As of December 31, 2015, there was approximately $5.4 billion of authorized repurchases remaining under the 2015 Program.
Cash Dividends declared were $2.07 per share in 2015, $1.81 per share in 2014 and $1.60 per share in 2013. Cash dividends paid were $2.005 per share in 2015, $1.745 per share in 2014 and $1.18 per share in 2013. Cash dividends paid during 2013 do not include the dividend payment of $0.38 per share originally scheduled to be paid in January 2013, which was accelerated and paid in December 2012.
Accumulated Other Comprehensive Income (Loss)—In March 2013, new accounting guidance was issued which clarifies that an entity should release cumulative translation adjustments into net income when the entity ceases to have a controlling financial interest in a subsidiary or group of assets that is a business within a foreign entity, which is consistent with the Company's prior accounting policy. The new guidance became effective for the Company on January 1, 2014 and did not have any impact on the Company's financial statements.
The changes in accumulated other comprehensive income (loss) during 2015, 2014 and 2013 were as follows:
In millions 2015 2014 2013Beginning balance . . . . . . . . . . . . . . . . . . . . . . . . . . . . . . . . . . . . . . . . . . . . . . . . $ (658) $ 384 $ 293
Foreign currency translation adjustments during the period . . . . . . . . . . . . . . . . (800) (806) (200)Foreign currency translation adjustments reclassified to income . . . . . . . . . . . . — (133) 7Income taxes . . . . . . . . . . . . . . . . . . . . . . . . . . . . . . . . . . . . . . . . . . . . . . . . . . . . (60) — —
Total foreign currency translation adjustments . . . . . . . . . . . . . . . . . . . . . . . . . (860) (939) (193)
Pension and other postretirement benefit adjustments during the period . . . . . . (41) (224) 327Pension and other postretirement benefit adjustments reclassified to income . . 61 54 122Income taxes . . . . . . . . . . . . . . . . . . . . . . . . . . . . . . . . . . . . . . . . . . . . . . . . . . . . (6) 67 (165)
Total pension and other postretirement benefit adjustments . . . . . . . . . . . . . . . 14 (103) 284
Ending balance. . . . . . . . . . . . . . . . . . . . . . . . . . . . . . . . . . . . . . . . . . . . . . . . . . . $ (1,504) $ (658) $ 384
Foreign currency translation adjustments reclassified to income are primarily related to the disposal of certain discontinued operations and were included in the related gain or loss upon disposal. Refer to the Discontinued Operations note for additional information regarding the sale of the Company's discontinued operations.
Pension and other postretirement benefit adjustments reclassified to income represent the amortization of actuarial losses and prior service cost, and settlement and curtailment charges recognized in net periodic benefit cost. Refer to the Pension and Other Postretirement Benefits note for the amounts included in net periodic benefit cost. Pension and other postretirement benefit adjustments reclassified to income also include the reclass of deferred losses of $6 million for each of the years ended December 31, 2014 and 2013 related to the disposal of certain discontinued operations. Refer to the Discontinued Operations note for additional information regarding the sale of the Company's discontinued operations.
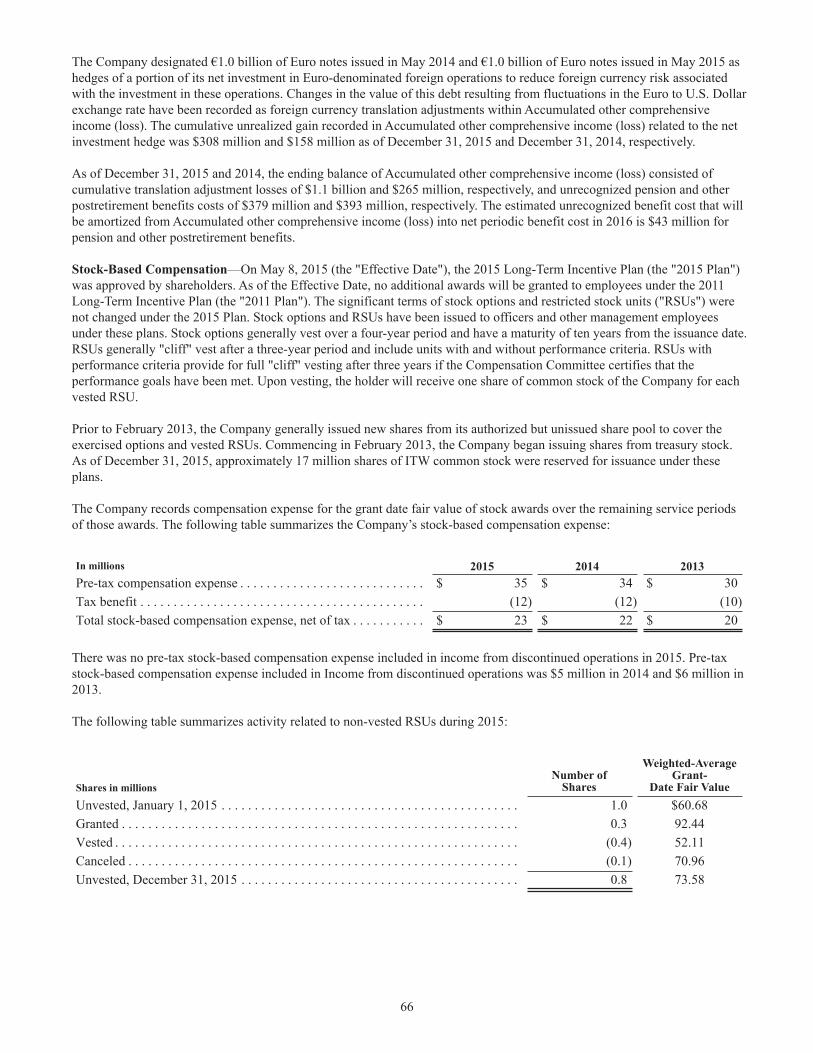
66
The Company designated €1.0 billion of Euro notes issued in May 2014 and €1.0 billion of Euro notes issued in May 2015 as hedges of a portion of its net investment in Euro-denominated foreign operations to reduce foreign currency risk associated with the investment in these operations. Changes in the value of this debt resulting from fluctuations in the Euro to U.S. Dollar exchange rate have been recorded as foreign currency translation adjustments within Accumulated other comprehensive income (loss). The cumulative unrealized gain recorded in Accumulated other comprehensive income (loss) related to the net investment hedge was $308 million and $158 million as of December 31, 2015 and December 31, 2014, respectively.
As of December 31, 2015 and 2014, the ending balance of Accumulated other comprehensive income (loss) consisted of cumulative translation adjustment losses of $1.1 billion and $265 million, respectively, and unrecognized pension and other postretirement benefits costs of $379 million and $393 million, respectively. The estimated unrecognized benefit cost that will be amortized from Accumulated other comprehensive income (loss) into net periodic benefit cost in 2016 is $43 million for pension and other postretirement benefits.
Stock-Based Compensation—On May 8, 2015 (the "Effective Date"), the 2015 Long-Term Incentive Plan (the "2015 Plan") was approved by shareholders. As of the Effective Date, no additional awards will be granted to employees under the 2011Long-Term Incentive Plan (the "2011 Plan"). The significant terms of stock options and restricted stock units ("RSUs") were not changed under the 2015 Plan. Stock options and RSUs have been issued to officers and other management employees under these plans. Stock options generally vest over a four-year period and have a maturity of ten years from the issuance date. RSUs generally "cliff" vest after a three-year period and include units with and without performance criteria. RSUs with performance criteria provide for full "cliff" vesting after three years if the Compensation Committee certifies that the performance goals have been met. Upon vesting, the holder will receive one share of common stock of the Company for each vested RSU.
Prior to February 2013, the Company generally issued new shares from its authorized but unissued share pool to cover the exercised options and vested RSUs. Commencing in February 2013, the Company began issuing shares from treasury stock. As of December 31, 2015, approximately 17 million shares of ITW common stock were reserved for issuance under these plans.
The Company records compensation expense for the grant date fair value of stock awards over the remaining service periods of those awards. The following table summarizes the Company’s stock-based compensation expense:
In millions 2015 2014 2013Pre-tax compensation expense . . . . . . . . . . . . . . . . . . . . . . . . . . . . $ 35 $ 34 $ 30Tax benefit . . . . . . . . . . . . . . . . . . . . . . . . . . . . . . . . . . . . . . . . . . . (12) (12) (10)Total stock-based compensation expense, net of tax . . . . . . . . . . . $ 23 $ 22 $ 20
There was no pre-tax stock-based compensation expense included in income from discontinued operations in 2015. Pre-tax stock-based compensation expense included in Income from discontinued operations was $5 million in 2014 and $6 million in 2013.
The following table summarizes activity related to non-vested RSUs during 2015:
Shares in millionsNumber of
Shares
Weighted-AverageGrant-
Date Fair ValueUnvested, January 1, 2015 . . . . . . . . . . . . . . . . . . . . . . . . . . . . . . . . . . . . . . . . . . . . . 1.0 $60.68Granted . . . . . . . . . . . . . . . . . . . . . . . . . . . . . . . . . . . . . . . . . . . . . . . . . . . . . . . . . . . . 0.3 92.44Vested . . . . . . . . . . . . . . . . . . . . . . . . . . . . . . . . . . . . . . . . . . . . . . . . . . . . . . . . . . . . . (0.4) 52.11Canceled . . . . . . . . . . . . . . . . . . . . . . . . . . . . . . . . . . . . . . . . . . . . . . . . . . . . . . . . . . . (0.1) 70.96Unvested, December 31, 2015 . . . . . . . . . . . . . . . . . . . . . . . . . . . . . . . . . . . . . . . . . . 0.8 73.58
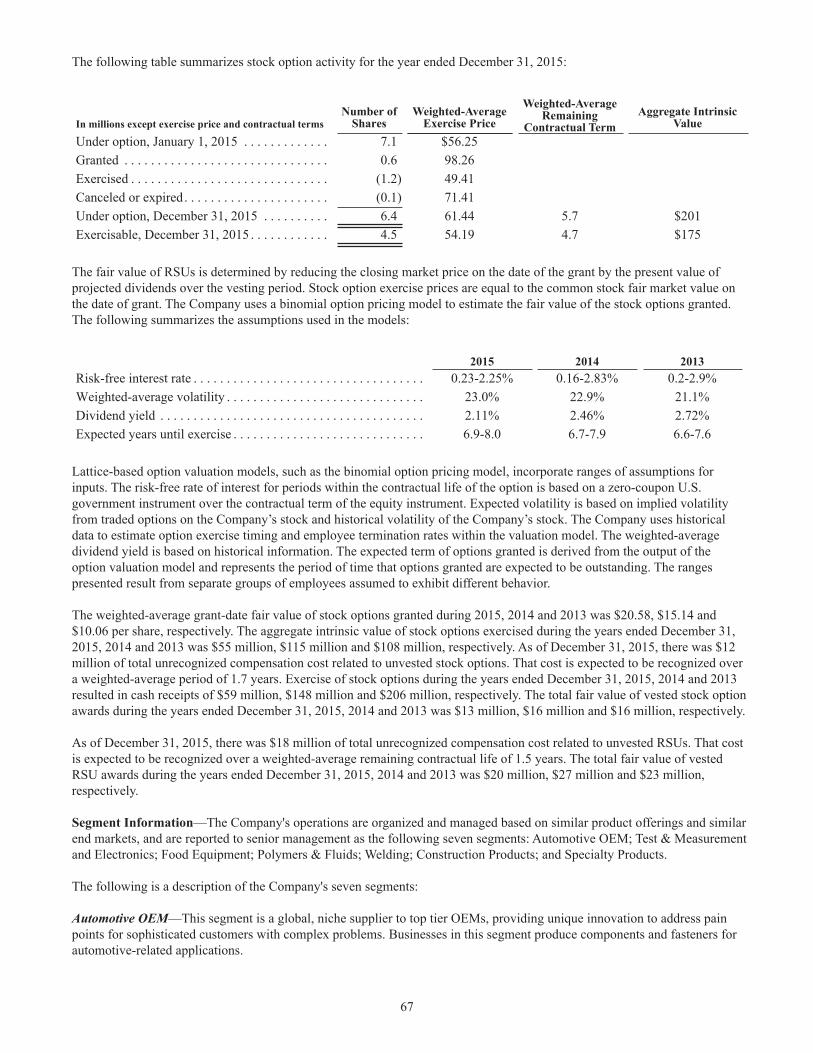
67
The following table summarizes stock option activity for the year ended December 31, 2015:
In millions except exercise price and contractual termsNumber of
SharesWeighted-Average
Exercise Price
Weighted-AverageRemaining
Contractual TermAggregate Intrinsic
ValueUnder option, January 1, 2015 . . . . . . . . . . . . . 7.1 $56.25Granted . . . . . . . . . . . . . . . . . . . . . . . . . . . . . . . 0.6 98.26Exercised . . . . . . . . . . . . . . . . . . . . . . . . . . . . . . (1.2) 49.41Canceled or expired. . . . . . . . . . . . . . . . . . . . . . (0.1) 71.41Under option, December 31, 2015 . . . . . . . . . . 6.4 61.44 5.7 $201Exercisable, December 31, 2015 . . . . . . . . . . . . 4.5 54.19 4.7 $175
The fair value of RSUs is determined by reducing the closing market price on the date of the grant by the present value of projected dividends over the vesting period. Stock option exercise prices are equal to the common stock fair market value on the date of grant. The Company uses a binomial option pricing model to estimate the fair value of the stock options granted. The following summarizes the assumptions used in the models:
2015 2014 2013Risk-free interest rate . . . . . . . . . . . . . . . . . . . . . . . . . . . . . . . . . . . 0.23-2.25% 0.16-2.83% 0.2-2.9%Weighted-average volatility . . . . . . . . . . . . . . . . . . . . . . . . . . . . . . 23.0% 22.9% 21.1%Dividend yield . . . . . . . . . . . . . . . . . . . . . . . . . . . . . . . . . . . . . . . . 2.11% 2.46% 2.72%Expected years until exercise . . . . . . . . . . . . . . . . . . . . . . . . . . . . . 6.9-8.0 6.7-7.9 6.6-7.6
Lattice-based option valuation models, such as the binomial option pricing model, incorporate ranges of assumptions for inputs. The risk-free rate of interest for periods within the contractual life of the option is based on a zero-coupon U.S. government instrument over the contractual term of the equity instrument. Expected volatility is based on implied volatility from traded options on the Company’s stock and historical volatility of the Company’s stock. The Company uses historical data to estimate option exercise timing and employee termination rates within the valuation model. The weighted-average dividend yield is based on historical information. The expected term of options granted is derived from the output of the option valuation model and represents the period of time that options granted are expected to be outstanding. The ranges presented result from separate groups of employees assumed to exhibit different behavior.
The weighted-average grant-date fair value of stock options granted during 2015, 2014 and 2013 was $20.58, $15.14 and $10.06 per share, respectively. The aggregate intrinsic value of stock options exercised during the years ended December 31, 2015, 2014 and 2013 was $55 million, $115 million and $108 million, respectively. As of December 31, 2015, there was $12million of total unrecognized compensation cost related to unvested stock options. That cost is expected to be recognized over a weighted-average period of 1.7 years. Exercise of stock options during the years ended December 31, 2015, 2014 and 2013resulted in cash receipts of $59 million, $148 million and $206 million, respectively. The total fair value of vested stock option awards during the years ended December 31, 2015, 2014 and 2013 was $13 million, $16 million and $16 million, respectively.
As of December 31, 2015, there was $18 million of total unrecognized compensation cost related to unvested RSUs. That cost is expected to be recognized over a weighted-average remaining contractual life of 1.5 years. The total fair value of vested RSU awards during the years ended December 31, 2015, 2014 and 2013 was $20 million, $27 million and $23 million,respectively.
Segment Information—The Company's operations are organized and managed based on similar product offerings and similar end markets, and are reported to senior management as the following seven segments: Automotive OEM; Test & Measurement and Electronics; Food Equipment; Polymers & Fluids; Welding; Construction Products; and Specialty Products.
The following is a description of the Company's seven segments:
Automotive OEM—This segment is a global, niche supplier to top tier OEMs, providing unique innovation to address pain points for sophisticated customers with complex problems. Businesses in this segment produce components and fasteners for automotive-related applications.
68
Test & Measurement and Electronics—This segment is a branded and innovative producer of test and measurement and electronic manufacturing and MRO solutions that improve efficiency and quality for customers in diverse end markets. Businesses in this segment produce equipment, consumables, and related software for testing and measuring of materials and structures, as well as equipment and consumables used in the production of electronic subassemblies and microelectronics.
Food Equipment—This segment is a highly focused and branded industry-leader in commercial food equipment differentiatedby innovation and integrated service offerings.
Polymers & Fluids—This segment is a highly branded supplier to niche markets that require value-added, differentiatedproducts. Businesses in this segment produce adhesives, sealants, lubrication and cutting fluids, and fluids and polymers for auto aftermarket maintenance and appearance.
Welding—This segment is a branded value-added equipment and specialty consumable manufacturer with innovative and leading technology. Businesses in this segment produce arc welding equipment, consumables and accessories for a wide array of industrial and commercial applications.
Construction Products—This segment is a branded supplier of innovative engineered fastening systems and solutions.
Specialty Products—This segment is focused on diversified niche market opportunities that deliver strong operating results with substantial patent protection producing beverage packaging equipment and consumables, product coding and marking equipment and consumables, and appliance components and fasteners.
Segments are allocated a fixed overhead charge based on the segment's revenue. Expenses not charged to the segments are reported separately as Unallocated. Because the Unallocated category includes a variety of items, it is subject to fluctuations on a quarterly and annual basis.

69
Segment information for 2015, 2014 and 2013 was as follows:
In millions 2015 2014 2013Operating revenue:
Automotive OEM. . . . . . . . . . . . . . . . . . . . . . . . . . . . . . . $ 2,529 $ 2,590 $ 2,396Test & Measurement and Electronics . . . . . . . . . . . . . . . 1,969 2,204 2,176Food Equipment. . . . . . . . . . . . . . . . . . . . . . . . . . . . . . . . 2,096 2,177 2,047Polymers & Fluids . . . . . . . . . . . . . . . . . . . . . . . . . . . . . . 1,712 1,927 1,993Welding . . . . . . . . . . . . . . . . . . . . . . . . . . . . . . . . . . . . . . 1,650 1,850 1,837Construction Products . . . . . . . . . . . . . . . . . . . . . . . . . . . 1,587 1,707 1,717Specialty Products . . . . . . . . . . . . . . . . . . . . . . . . . . . . . . 1,885 2,055 2,007Intersegment revenue . . . . . . . . . . . . . . . . . . . . . . . . . . . . (23) (26) (38)
Total . . . . . . . . . . . . . . . . . . . . . . . . . . . . . . . . . . . . . . . $ 13,405 $ 14,484 $ 14,135Operating income:
Automotive OEM. . . . . . . . . . . . . . . . . . . . . . . . . . . . . . . $ 613 $ 600 $ 490Test & Measurement and Electronics . . . . . . . . . . . . . . . 322 340 321Food Equipment. . . . . . . . . . . . . . . . . . . . . . . . . . . . . . . . 498 453 385Polymers & Fluids . . . . . . . . . . . . . . . . . . . . . . . . . . . . . . 335 357 335Welding . . . . . . . . . . . . . . . . . . . . . . . . . . . . . . . . . . . . . . 415 479 464Construction Products . . . . . . . . . . . . . . . . . . . . . . . . . . . 316 289 238Specialty Products . . . . . . . . . . . . . . . . . . . . . . . . . . . . . . 439 440 408
Total Segments. . . . . . . . . . . . . . . . . . . . . . . . . . . . . . . 2,938 2,958 2,641 Unallocated . . . . . . . . . . . . . . . . . . . . . . . . . . . . . . . . . . . (71) (70) (127) Total . . . . . . . . . . . . . . . . . . . . . . . . . . . . . . . . . . . . . . . $ 2,867 $ 2,888 $ 2,514Depreciation and amortization and impairment of goodwill and intangible assets:
Automotive OEM. . . . . . . . . . . . . . . . . . . . . . . . . . . . . . . $ 76 $ 79 $ 80Test & Measurement and Electronics . . . . . . . . . . . . . . . 110 115 119Food Equipment. . . . . . . . . . . . . . . . . . . . . . . . . . . . . . . . 48 52 50Polymers & Fluids . . . . . . . . . . . . . . . . . . . . . . . . . . . . . . 95 99 103Welding . . . . . . . . . . . . . . . . . . . . . . . . . . . . . . . . . . . . . . 37 38 37Construction Products . . . . . . . . . . . . . . . . . . . . . . . . . . . 36 43 49Specialty Products . . . . . . . . . . . . . . . . . . . . . . . . . . . . . . 75 81 84
Total Segments. . . . . . . . . . . . . . . . . . . . . . . . . . . . . . . 477 507 522Discontinued Operations . . . . . . . . . . . . . . . . . . . . . . . . . — — 91
Total . . . . . . . . . . . . . . . . . . . . . . . . . . . . . . . . . . . . . . . $ 477 $ 507 $ 613Plant and equipment additions:
Automotive OEM. . . . . . . . . . . . . . . . . . . . . . . . . . . . . . . $ 106 $ 96 $ 119Test & Measurement and Electronics . . . . . . . . . . . . . . . 32 56 39Food Equipment. . . . . . . . . . . . . . . . . . . . . . . . . . . . . . . . 37 47 37Polymers & Fluids . . . . . . . . . . . . . . . . . . . . . . . . . . . . . . 20 28 28Welding . . . . . . . . . . . . . . . . . . . . . . . . . . . . . . . . . . . . . . 23 36 35Construction Products . . . . . . . . . . . . . . . . . . . . . . . . . . . 26 41 32Specialty Products . . . . . . . . . . . . . . . . . . . . . . . . . . . . . . 40 54 47
Total Segments. . . . . . . . . . . . . . . . . . . . . . . . . . . . . . . 284 358 337Discontinued Operations . . . . . . . . . . . . . . . . . . . . . . . . . — 3 31
Total . . . . . . . . . . . . . . . . . . . . . . . . . . . . . . . . . . . . . . . $ 284 $ 361 $ 368Identifiable assets:
Automotive OEM. . . . . . . . . . . . . . . . . . . . . . . . . . . . . . . $ 1,419 $ 1,454 $ 1,571Test & Measurement and Electronics . . . . . . . . . . . . . . . 2,448 2,615 2,772Food Equipment. . . . . . . . . . . . . . . . . . . . . . . . . . . . . . . . 1,054 1,123 1,184Polymers & Fluids . . . . . . . . . . . . . . . . . . . . . . . . . . . . . . 2,034 2,257 2,420Welding . . . . . . . . . . . . . . . . . . . . . . . . . . . . . . . . . . . . . . 747 879 936Construction Products . . . . . . . . . . . . . . . . . . . . . . . . . . . 1,129 1,249 1,309Specialty Products . . . . . . . . . . . . . . . . . . . . . . . . . . . . . . 1,659 1,798 1,939 Total Segments. . . . . . . . . . . . . . . . . . . . . . . . . . . . . . . 10,490 11,375 12,131Corporate . . . . . . . . . . . . . . . . . . . . . . . . . . . . . . . . . . . . . 5,239 6,090 5,632Assets held for sale . . . . . . . . . . . . . . . . . . . . . . . . . . . . . — — 1,836
Total . . . . . . . . . . . . . . . . . . . . . . . . . . . . . . . . . . . . . . . $ 15,729 $ 17,465 $ 19,599
Identifiable assets by segment are those assets that are specifically used in that segment. Corporate assets are principally cash and equivalents, investments and other general corporate assets.
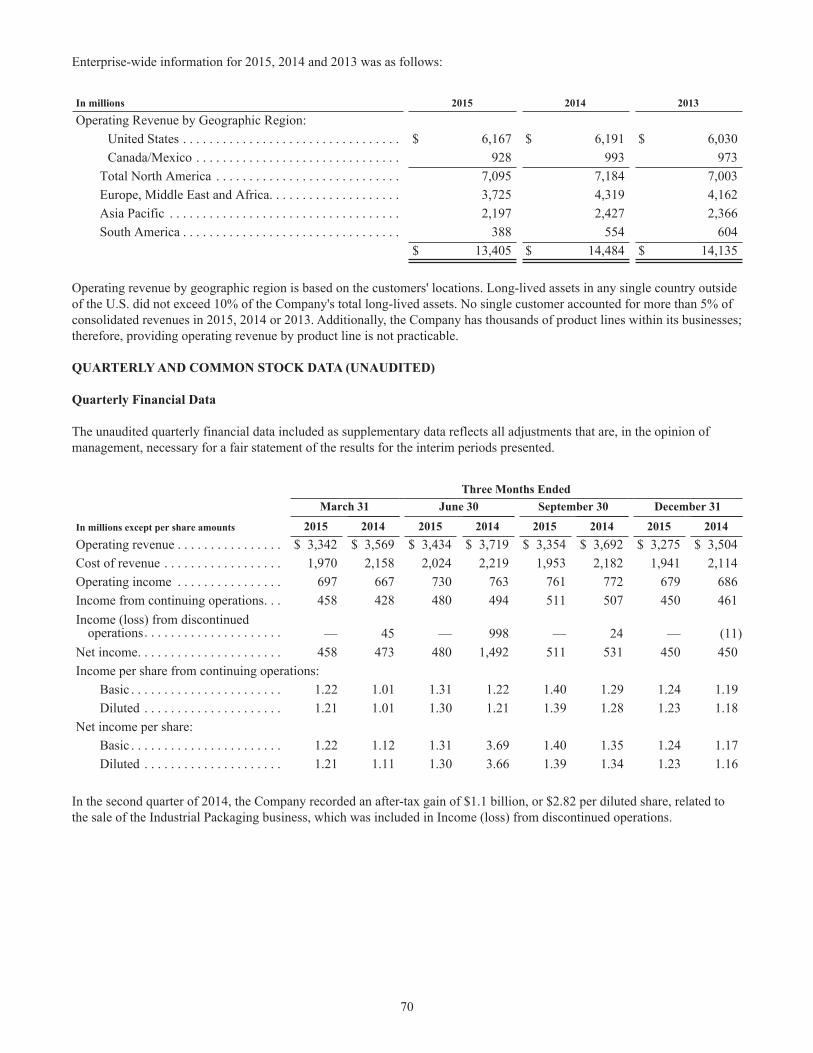
70
Enterprise-wide information for 2015, 2014 and 2013 was as follows:
In millions 2015 2014 2013
Operating Revenue by Geographic Region:United States . . . . . . . . . . . . . . . . . . . . . . . . . . . . . . . . . $ 6,167 $ 6,191 $ 6,030Canada/Mexico . . . . . . . . . . . . . . . . . . . . . . . . . . . . . . . 928 993 973
Total North America . . . . . . . . . . . . . . . . . . . . . . . . . . . . 7,095 7,184 7,003Europe, Middle East and Africa. . . . . . . . . . . . . . . . . . . . 3,725 4,319 4,162Asia Pacific . . . . . . . . . . . . . . . . . . . . . . . . . . . . . . . . . . . 2,197 2,427 2,366South America . . . . . . . . . . . . . . . . . . . . . . . . . . . . . . . . . 388 554 604
$ 13,405 $ 14,484 $ 14,135
Operating revenue by geographic region is based on the customers' locations. Long-lived assets in any single country outside of the U.S. did not exceed 10% of the Company's total long-lived assets. No single customer accounted for more than 5% of consolidated revenues in 2015, 2014 or 2013. Additionally, the Company has thousands of product lines within its businesses; therefore, providing operating revenue by product line is not practicable.
QUARTERLY AND COMMON STOCK DATA (UNAUDITED)
Quarterly Financial Data
The unaudited quarterly financial data included as supplementary data reflects all adjustments that are, in the opinion of management, necessary for a fair statement of the results for the interim periods presented.
Three Months EndedMarch 31 June 30 September 30 December 31
In millions except per share amounts 2015 2014 2015 2014 2015 2014 2015 2014Operating revenue . . . . . . . . . . . . . . . . $ 3,342 $ 3,569 $ 3,434 $ 3,719 $ 3,354 $ 3,692 $ 3,275 $ 3,504Cost of revenue . . . . . . . . . . . . . . . . . . 1,970 2,158 2,024 2,219 1,953 2,182 1,941 2,114Operating income . . . . . . . . . . . . . . . . 697 667 730 763 761 772 679 686Income from continuing operations. . . 458 428 480 494 511 507 450 461Income (loss) from discontinued
operations. . . . . . . . . . . . . . . . . . . . . — 45 — 998 — 24 — (11)Net income. . . . . . . . . . . . . . . . . . . . . . 458 473 480 1,492 511 531 450 450Income per share from continuing operations:
Basic . . . . . . . . . . . . . . . . . . . . . . . 1.22 1.01 1.31 1.22 1.40 1.29 1.24 1.19Diluted . . . . . . . . . . . . . . . . . . . . . 1.21 1.01 1.30 1.21 1.39 1.28 1.23 1.18
Net income per share:Basic . . . . . . . . . . . . . . . . . . . . . . . 1.22 1.12 1.31 3.69 1.40 1.35 1.24 1.17Diluted . . . . . . . . . . . . . . . . . . . . . 1.21 1.11 1.30 3.66 1.39 1.34 1.23 1.16
In the second quarter of 2014, the Company recorded an after-tax gain of $1.1 billion, or $2.82 per diluted share, related to the sale of the Industrial Packaging business, which was included in Income (loss) from discontinued operations.
71
ITEM 9. Changes in and Disagreements With Accountants on Accounting and Financial Disclosure
Not applicable.
ITEM 9A. Controls and Procedures
Controls and Procedures
The Company’s management, with the participation of the Company’s Chairman & Chief Executive Officer and Senior VicePresident & Chief Financial Officer, has evaluated the effectiveness of the Company’s disclosure controls and procedures (as defined in Exchange Act Rule 13a-15(e)) as of December 31, 2015. Based on such evaluation, the Company’s Chairman & Chief Executive Officer and Senior Vice President & Chief Financial Officer have concluded that, as of December 31, 2015,the Company’s disclosure controls and procedures were effective.
Management Report on Internal Control over Financial Reporting
The Management Report on Internal Control over Financial Reporting and the Report of Independent Registered Public Accounting Firm are found in Item 8. Financial Statements and Supplementary Data.
In connection with the evaluation by management, including the Company’s Chairman & Chief Executive Officer and Senior Vice President & Chief Financial Officer, no changes in the Company’s internal control over financial reporting (as defined in Exchange Act Rule 13a-15(f)) during the quarter ended December 31, 2015 were identified that have materially affected or are reasonably likely to materially affect the Company’s internal control over financial reporting.
ITEM 9B. Other Information
Not applicable.
72
PART III
ITEM 10. Directors, Executive Officers and Corporate Governance
Information regarding the Directors of the Company is incorporated by reference from the information under the captions "Election of Directors" and "Corporate Governance Policies and Practices" in the Company’s Proxy Statement for the 2016Annual Meeting of Stockholders.
Information regarding the Audit Committee and its Financial Experts is incorporated by reference from the information under the captions "Board of Directors and Its Committees" and "Audit Committee Report" in the Company’s Proxy Statement for the 2016 Annual Meeting of Stockholders.
Information regarding the Executive Officers of the Company can be found in Part I of this Annual Report on Form 10-K under the caption "Executive Officers."
Information regarding compliance with Section 16(a) of the Exchange Act is incorporated by reference from the information under the caption "Section 16(a) Beneficial Ownership Reporting Compliance" in the Company’s Proxy Statement for the 2016 Annual Meeting of Stockholders.
Information regarding the Company’s code of ethics that applies to the Company’s Chairman & Chief Executive Officer,Senior Vice President & Chief Financial Officer, and key financial and accounting personnel is incorporated by reference from the information under the caption "Corporate Governance Policies and Practices" in the Company’s Proxy Statement for the 2016 Annual Meeting of Stockholders.
ITEM 11. Executive Compensation
This information is incorporated by reference from the information under the captions "NEO Compensation," "Director Compensation," "Compensation Discussion and Analysis" and "Compensation Committee Report" in the Company’s Proxy Statement for the 2016 Annual Meeting of Stockholders.
ITEM 12. Security Ownership of Certain Beneficial Owners and Management and Related Stockholder Matters
This information is incorporated by reference from the information under the captions "Ownership of ITW Stock" and "Equity Compensation Plan Information" in the Company’s Proxy Statement for the 2016 Annual Meeting of Stockholders.
ITEM 13. Certain Relationships and Related Transactions, and Director Independence
Information regarding certain relationships and related transactions is incorporated by reference from the information under the captions "Ownership of ITW Stock," "Certain Relationships and Related Transactions" and "Corporate Governance Policies and Practices" in the Company’s Proxy Statement for the 2016 Annual Meeting of Stockholders.
Information regarding director independence is incorporated by reference from the information under the captions "Corporate Governance Policies and Practices" and "Categorical Standards for Director Independence" in the Company’s Proxy Statement for the 2016 Annual Meeting of Stockholders.
ITEM 14. Principal Accounting Fees and Services
This information is incorporated by reference from the information under the captions "Ratification of the Appointment of Independent Registered Public Accounting Firm" and "Audit Fees" in the Company’s Proxy Statement for the 2016 AnnualMeeting of Stockholders.
73
PART IV
ITEM 15. Exhibits and Financial Statement Schedules
(a)(1) Financial Statements
The following information is included as part of Item 8. Financial Statements and Supplementary Data:
Management Report on Internal Control over Financial ReportingReport of Independent Registered Public Accounting FirmStatement of IncomeStatement of Comprehensive IncomeStatement of Income Reinvested in the BusinessStatement of Financial PositionStatement of Cash FlowsNotes to Financial Statements
(2) Financial Statement SchedulesNot applicable.
(3) Exhibits
(i) See the Exhibit Index within this Annual Report on Form 10-K.
(ii) Pursuant to Regulation S-K, Item 601(b)(4)(iii), the Company has not filed with Exhibit 4 any debt instruments for which the total amount of securities authorized thereunder is less than 10% of the total assets of the Company and its subsidiaries on a consolidated basis as of December 31, 2015, with the exception of the Officers'Certificates related to the 0.90% Notes due 2017, the 1.95% Notes due 2019, the 6.25% Notes due 2019, the 3.375% Notes due 2021, the 1.75% Euro Notes due 2022, the 1.25% Euro Notes due 2023, the 3.50% Notes due 2024, the 2.125% Euro Notes due 2030, the 3.00% Euro Notes due 2034, the 4.875% Notes due 2041, and the 3.90% Notes due 2042, which are described as Exhibit numbers 4(a) through (h) in the Exhibit Index. TheCompany agrees to furnish a copy of the agreement related to the debt instruments which have not been filed with Exhibit 4 to the Securities and Exchange Commission upon request.
74
SIGNATURES
Pursuant to the requirements of Section 13 or 15(d) of the Securities Exchange Act of 1934, the registrant has duly caused this report to be signed on its behalf by the undersigned, thereunto duly authorized on this 11th day of February 2016.
ILLINOIS TOOL WORKS INC.
By: /s/ E. SCOTT SANTIE. Scott Santi
Chairman & Chief Executive Officer
Pursuant to the requirements of the Securities Exchange Act of 1934, this report has been signed by the following persons on behalf of the registrant and in the capacities indicated on this 11th day of February 2016.
Signatures Title
/s/ E. SCOTT SANTI Chairman & Chief Executive Officer, DirectorE. Scott Santi (Principal Executive Officer)
/s/ MICHAEL M. LARSEN Senior Vice President & Chief Financial OfficerMichael M. Larsen (Principal Financial Officer)
/s/ RANDALL J. SCHEUNEMAN Vice President & Chief Accounting OfficerRandall J. Scheuneman (Principal Accounting Officer)
DANIEL J. BRUTTO Director
SUSAN CROWN Director
JAMES W. GRIFFITH Director
RICHARD H. LENNY Director
ROBERT S. MORRISON Director
JAMES A. SKINNER Director
DAVID B. SMITH, JR. Director
PAMELA B. STROBEL Director
KEVIN M. WARREN Director
ANRÉ D. WILLIAMS Director
By: /s/ E. SCOTT SANTI(E. Scott Santi, as Attorney-in-Fact)
Original powers of attorney authorizing E. Scott Santi to sign the Company’s Annual Report on Form 10-K and amendments thereto on behalf of the above-named directors of the registrant have been filed with the Securities and Exchange Commission as part of this Annual Report on Form 10-K (Exhibit 24).
75
Exhibit IndexAnnual Report on Form 10-K
2015
ExhibitNumber Description
2.1(a) Investment Agreement, dated as of August 15, 2012, among CD&R Wimbledon Holdings III, L.P., a CaymanIslands limited partnership; Illinois Tool Works Inc.; ITW DS Investments Inc., a Delaware corporation; andWilsonart International Holdings LLC, a Delaware limited liability company, filed as Exhibit 2.1 to theCompany's Current Report on Form 8-K filed on August 17, 2012 (Commission File No. 1-4797) andincorporated herein by reference. (Certain of the schedules and similar attachments have been omitted pursuantto Item 601(b)(2) of Regulation S-K, but the Company undertakes to furnish a copy of the schedules or similarattachments to the Securities and Exchange Committee upon request.)
2.1(b) Stock Purchase Agreement, dated as of February 6, 2014, between Illinois Tool Works Inc. and certain of itssubsidiaries and Vault Bermuda Holding Co. Ltd., filed as Exhibit 2.1 to the Company’s Current Report onForm 8-K filed on February 12, 2014. (Commission File No. 1-4797) and incorporated herein by reference.(Certain of the schedules and similar attachments have been omitted pursuant to Item 601(b)(2) of RegulationS-K, but the Company undertakes to furnish a copy of the schedules or similar attachments to the Securitiesand Exchange Commission upon request).
3(a) Amended and Restated Certificate of Incorporation of Illinois Tool Works Inc., filed as Exhibit 3.1 to theCompany’s Quarterly Report on Form 10-Q for the quarterly period ended June 30, 2014 (Commission FileNo. 1-4797) and incorporated herein by reference.
3(b) By-laws of Illinois Tool Works Inc., as amended and restated as of December 11, 2015, filed as Exhibit 3(b)(ii)to the Company’s Form 8-K filed on December 17, 2015 (Commission File No. 1-4797) and incorporatedherein by reference.
4(a) Indenture between Illinois Tool Works Inc. and The First National Bank of Chicago, as Trustee, dated as ofNovember 1, 1986, filed as Exhibit 4.1 to the Company’s Registration Statement on Form S-3 filed on January15, 1999 (Commission File No. 333-70691) and incorporated herein by reference.
4(b) First Supplemental Indenture between Illinois Tool Works Inc. and Harris Trust and Savings Bank, as Trustee,dated as of May 1, 1990, filed as Exhibit 4.2 to the Company’s Registration Statement on Form S-3 filed onJanuary 15, 1999 (Commission File No. 333-70691) and incorporated herein by reference.
4(c) Officers’ Certificate dated March 26, 2009 establishing the terms, and setting forth the forms, of the 5.15%Notes due 2014 and the 6.25% Notes due 2019, filed as Exhibit 4.3 to the Company’s Current Report on Form8-K filed on March 27, 2009 (Commission File No. 1-4797) and incorporated herein by reference.
4(d) Officers’ Certificate dated August 31, 2011, establishing the terms, and setting forth the forms, of the 3.375%Notes due 2021 and the 4.875% Notes due 2041, filed as Exhibit 4.3 to the Company’s Form 8-K filed onSeptember 1, 2011 (Commission File No. 001-04797) and incorporated herein by reference.
4(e) Officers' Certificate dated August 28, 2012, establishing the terms, and setting forth the forms, of the 3.9%Notes due 2042, filed as Exhibit 4.1 to the Company's Current Report on Form 8-K filed on August 28, 2012(Commission File No. 001-4797) and incorporated herein by reference.
4(f) Officers’ Certificate dated February 25, 2014, establishing the terms, and setting forth the forms, of the 0.9%Notes due 2017, the 1.95% Notes due 2019, and the 3.5% Notes due 2024, filed as Exhibit 4.1 to theCompany’s Form 8-K filed on February 26, 2014 (Commission File No. 001-04797) and incorporated hereinby reference.
4(g) Officers’ Certificate dated May 20, 2014, establishing the terms, and setting forth the forms, of the 1.75% EuroNotes due 2022 and the 3.0% Euro Notes due 2034, filed as Exhibit 4.1 to the Company’s Form 8-K filed onMay 22, 2014 (Commission File No. 001-04797) and incorporated herein by reference.
4(h) Officers’ Certificate dated May 19, 2015, establishing the terms, and setting forth the forms, of the 1.25% EuroNotes due 2023 and the 2.125% Euro Notes due 2030, filed as Exhibit 4.1 to the Company’s Form 8-K filed onMay 22, 2015 (Commission File No. 001-04797) and incorporated herein by reference.
10(a)* Illinois Tool Works Inc. 2006 Stock Incentive Plan dated February 10, 2006, as amended on May 5, 2006, filedas Exhibit 10(a) to the Company’s Quarterly Report on Form 10-Q for the quarterly period ended March 31,2006 (Commission File No. 1-4797) and incorporated herein by reference.
10(b)* Amendment to Illinois Tool Works Inc. 2006 Stock Incentive Plan dated February 8, 2008, filed as Exhibit 10(q) to the Company’s Annual Report on Form 10-K for the fiscal year ended December 31, 2007 (CommissionFile No. 1-4797) and incorporated herein by reference.
76
ExhibitNumber Description
10(c)* Second Amendment to Illinois Tool Works Inc. 2006 Stock Incentive Plan dated February 13, 2009, filed asExhibit 10(d) to the Company’s Annual Report on Form 10-K for the fiscal year ended December 31, 2008(Commission File No. 1-4797) and incorporated herein by reference.
10(d)* Illinois Tool Works Inc. 2011 Long-Term Incentive Plan, filed as Exhibit 99.2 to the Company’s CurrentReport on Form 8-K filed on December 16, 2010 (Commission File No. 1-4797) and incorporated herein byreference.
10(e)* Illinois Tool Works Inc. 2015 Long-Term Incentive Plan effective May 8, 2015, filed as Exhibit 10.1 to theCompany's Quarterly Report on Form 10-Q for the quarterly period ended March 31, 2015 (Commission FileNo. 1-4797) and incorporated herein by reference.
10(f)* Form of stock option terms filed as Exhibit 10(o) to the Company’s Annual Report on Form 10-K for the fiscalyear ended December 31, 2007 (Commission File No. 1-4797) and incorporated herein by reference.
10(g)* Form of stock option terms filed as Exhibit 99.1 to the Company’s Current Report on Form 8-K filed onFebruary 5, 2009 (Commission File No. 1-4797) and incorporated herein by reference.
10(h)* Form of stock option terms filed as Exhibit 99.1 to the Company’s Current Report on Form 8-K filed onFebruary 9, 2011 (Commission File No. 1-4797) and incorporated herein by reference.
10(i)* Form of stock option terms filed as Exhibit 99.1 to the Company’s Current Report on Form 8-K filed onFebruary 7, 2012 (Commission File No. 1-4797) and incorporated herein by reference.
10(j)* Form of stock option terms filed as Exhibit 99.1 to the Company’s Current Report on Form 8-K filed onFebruary 13, 2014 (Commission File No. 1-4797) and incorporated herein by reference.
10(k)* Form of restricted stock unit terms filed as Exhibit 99.2 to the Company’s Current Report on Form 8-K filedon February 13, 2014 (Commission File No. 1-4797) and incorporated herein by reference.
10(l)* Form of performance restricted stock unit terms filed as Exhibit 99.3 to the Company’s Current Report onForm 8-K filed on February 13, 2014 (Commission File No. 1-4797) and incorporated herein by reference.
10(m)* Form of Long-Term Incentive Cash Grant filed as Exhibit 99.4 to the Company’s Current Report on Form 8-Kfiled on February 13, 2014 (Commission File No. 1-4797) and incorporated herein by reference.
10(n)* Form of stock option terms filed as Exhibit 99.1 to the Company's Current Report on Form 8-K filed onFebruary 9, 2016 (Commission File No. 1-4797) and incorporated herein by reference.
10(o)* Form of restricted stock unit terms filed as Exhibit 99.2 to the Company's Current Report on Form 8-K filed onFebruary 9, 2016 (Commission File No. 1-4797) and incorporated herein by reference.
10(p)* Form of performance restricted stock unit terms filed as Exhibit 99.3 to the Company's Current Report onForm 8-K filed on February 9, 2016 (Commission File No. 1-4797) and incorporated herein by reference.
10(q)* Form of Long-Term Incentive Cash Grant filed as Exhibit 99.4 to the Company's Current Report on Form 8-Kfiled on February 9, 2016 (Commission File No. 1-4797) and incorporated herein by reference.
10(r)* Illinois Tool Works Inc. 2011 Executive Incentive Plan, filed as Exhibit 99.1 to the Company’s Current Reporton Form 8-K filed on December 16, 2010 (Commission File No. 1-4797) and incorporated herein by reference.
10(s)* Illinois Tool Works Inc. Executive Contributory Retirement Income Plan as amended and restated, effectiveJanuary 1, 2010, filed as exhibit 10 to the Company’s Current Report on Form 8-K filed on November 5, 2009(Commission File No. 1-4797) and incorporated herein by reference.
10(t)* Illinois Tool Works Inc. Nonqualified Pension Plan, effective January 1, 2008, as amended and approved bythe Board of Directors on December 22, 2008, filed as Exhibit 10(p) to the Company’s Annual Report on Form10-K for the fiscal year ended December 31, 2008 (Commission File No. 1-4797) and incorporated herein byreference.
10(u)* Illinois Tool Works Inc. 2011 Change-in-Control Severance Compensation Policy, filed as Exhibit 99.3 to theCompany’s Current Report on Form 8-K filed on December 16, 2010 (Commission File No. 1-4797) andincorporated herein by reference.
10(v)* Illinois Tool Works Inc. Amended and Restated Directors’ Deferred Fee Plan effective May 2, 2014, filed asExhibit 10.1 to the Company’s Quarterly Report on Form 10-Q for the quarterly period ended June 30, 2014(Commission File No. 1-4797) and incorporated herein by reference.
10(w)* Illinois Tool Works Inc. 2011 Cash Incentive Plan, filed as Exhibit 99.1 to the Company’s Form 8-K filed onMay 12, 2011 (Commission File No. 1-4797) and incorporated herein by reference.
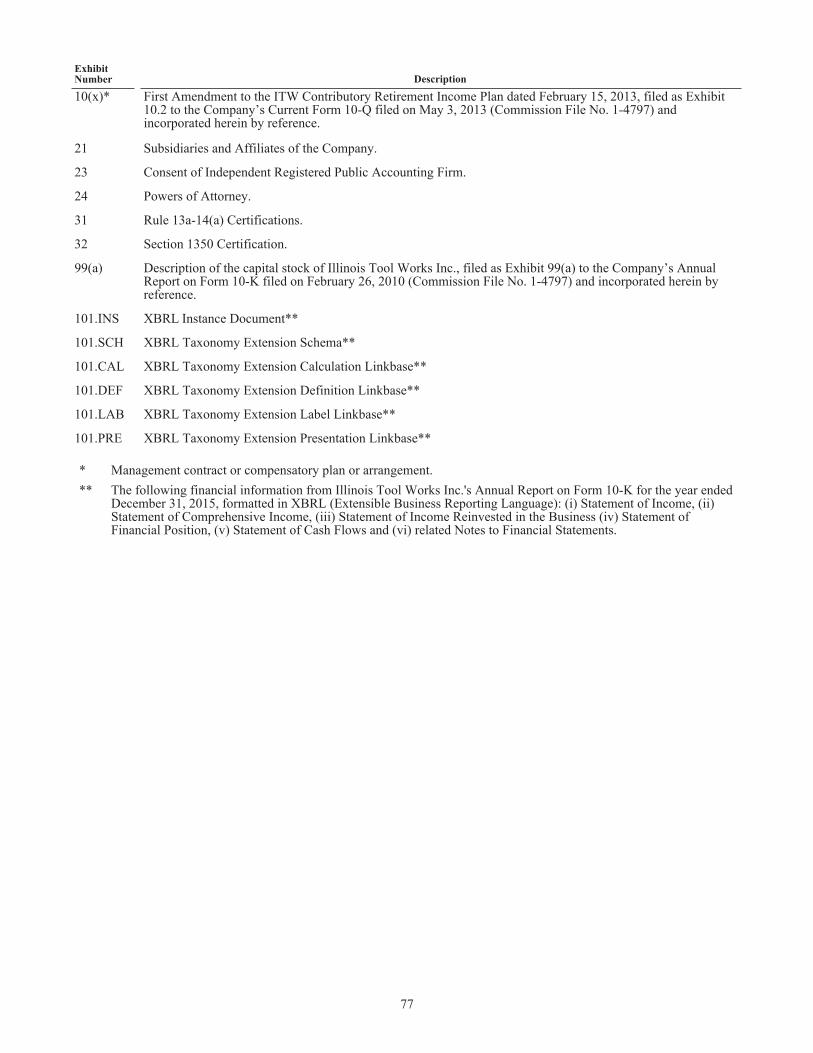
77
ExhibitNumber Description
10(x)* First Amendment to the ITW Contributory Retirement Income Plan dated February 15, 2013, filed as Exhibit10.2 to the Company’s Current Form 10-Q filed on May 3, 2013 (Commission File No. 1-4797) andincorporated herein by reference.
21 Subsidiaries and Affiliates of the Company.
23 Consent of Independent Registered Public Accounting Firm.
24 Powers of Attorney.
31 Rule 13a-14(a) Certifications.
32 Section 1350 Certification.
99(a) Description of the capital stock of Illinois Tool Works Inc., filed as Exhibit 99(a) to the Company’s AnnualReport on Form 10-K filed on February 26, 2010 (Commission File No. 1-4797) and incorporated herein byreference.
101.INS XBRL Instance Document**
101.SCH XBRL Taxonomy Extension Schema**
101.CAL XBRL Taxonomy Extension Calculation Linkbase**
101.DEF XBRL Taxonomy Extension Definition Linkbase**
101.LAB XBRL Taxonomy Extension Label Linkbase**
101.PRE XBRL Taxonomy Extension Presentation Linkbase**
* Management contract or compensatory plan or arrangement.** The following financial information from Illinois Tool Works Inc.'s Annual Report on Form 10-K for the year ended
December 31, 2015, formatted in XBRL (Extensible Business Reporting Language): (i) Statement of Income, (ii)Statement of Comprehensive Income, (iii) Statement of Income Reinvested in the Business (iv) Statement ofFinancial Position, (v) Statement of Cash Flows and (vi) related Notes to Financial Statements.

ANNUAL REPORT APPENDIX
Twelve Months EndedDollars in millions December 31, 2015Net cash provided by operating activities 2,299$ Less: Additions to plant and equipment (284) Free cash flow 2,015$
Net income 1,899$
Free Cash Flow Conversion 106%
Twelve Months EndedDollars in millions December 31, 2012Operating income 2,475$ Adjustment for Decorative Surfaces (143) Adjusted operating income 2,332 Tax rate (as adjusted for discrete tax charge) 29.2%Income taxes (681) Adjusted operating income after taxes 1,651$
Invested capital: Trade receivables 2,742$ Inventories 1,585 Net plant and equipment 1,994 Goodwill and intangible assets 7,788 Accounts payable and accrued expenses (2,068) Other, net 773
Total invested capital 12,814$
Average invested capital 13,140$ Adjustment for Wilsonart (formerly the Decorative Surfaces segment) (274) Adjustment for Industrial Packaging (1,504) Adjusted average invested capital 11,362$
Annualized adjusted after-tax return on average invested capital 14.5%
A reconciliation of the effective tax rate to the adjusted tax rate excluding the 2012 discrete tax item is as follows:
Dollars in millions Income Taxes Tax RateAs reported 973$ 30.3%Discrete tax charge (36) (1.1) As adjusted 937$ 29.2%
Twelve Months EndedDecember 31, 2012
As reported 4.72$ Decorative Surfaces net gain 1.34 Decorative Surfaces equity interest (0.04) Decorative Surfaces operating results 0.21 As adjusted for the Decorative Surfaces business 3.21$
2012 ADJUSTED INCOME PER SHARE FROM CONTINUING OPERATIONS - DILUTED (UNAUDITED)
2012 ADJUSTED AFTER-TAX RETURN ON AVERAGE INVESTED CAPITAL (UNAUDITED)
2015 FREE CASH FLOW CONVERSION (UNAUDITED)
ILLINOIS TOOL WORKS INC. and SUBSIDIARIESGAAP TO NON-GAAP RECONCILIATIONS (UNAUDITED)
Twelve Months EndedDecember 31, 2012

Founded in 1912, ITW (NYSE: ITW) is a global industrial company
centered on a differentiated and proprietary business model.
The company’s seven industry-leading segments leverage the
ITW Business Model to generate solid growth with best-in-class
margins and returns in markets where highly innovative, customer-
focused solutions are required. ITW’s more than 48,000 dedicated
colleagues around the world thrive in our decentralized, entrepreneurial
culture. In 2015, the company achieved revenues of $13.4 billion,
with roughly half coming from outside North America.
To learn more, please visit www.itw.com.
1 L E T T E R T O S H A R E H O L D E R S 5 2 0 1 5 F I N A N C I A L H I G H L I G H T S A N D E N T E R P R I S E S T R A T E G Y P E R F O R M A N C E P R O G R E S S
6 I T W B U S I N E S S M O D E L 7 C U S T O M E R - B A C K I N N O V A T I O N 8 O V E R V I E W O F I T W ’ S B U S I N E S S S E G M E N T S
12 C O R P O R A T E E X E C U T I V E S A N D B O A R D O F D I R E C T O R S INSIDE BACK COVER S H A R E H O L D E R I N F O R M A T I O N
About ITW
CONTENTS
TR ANSFER AGENT AND REGISTR AR
Questions regarding stock ownership, dividend payments or change of address should be directed to the company’s transfer agent: Computershare Trust Company, N.A.P.O. Box 30170College Station, TX 77842-3170www.computershare.com/investorPhone Toll Free: 888.829.7424International: +1.312.360.5155
COMMON STOCK
New York Stock Exchange Symbol: ITW
TR ADEMARKS
Certain trademarks in this publication are owned or licensed by Illinois Tool Works Inc. or its wholly owned subsidiaries.
CONTACT INVESTOR REL ATIONS
For additional assistance, including media inquiries: 224.661.7427 or [email protected]
VISIT US ON THE WEB
www.itw.com
COMMIT TED TO SOCIAL RESPONSIBIL IT Y
Learn about our CSR activities and goals in our 2015 report:workingtogether.itw-csr.com
STOCK AND DIV IDEND ACTION
Effective with the October 6, 2015 payment, the quarterly cash dividend on ITW common stock was increased to 55 cents per share. ITW’s annual dividend payment has increased for more than 50 consecutive years, except during a period of government controls in 1971.
The ITW Common Stock Dividend Reinvestment Plan enables registered shareholders to reinvest the ITW dividends they receive in additional shares of common stock of the company at no additional cost. Participation in the plan is voluntary, and shareholders may join or withdraw at any time. The plan also allows for additional voluntary cash investments in any amount from $100 to $10,000 per month. For a brochure and full details of the program, please direct inquiries to the company’s transfer agent, Computershare Trust Company, N.A.
Friday, May 6, 2016, 9:00 a.m.Illinois Tool Works Inc.155 Harlem AvenueGlenview, Illinois 60025
ANNUAL MEETING
The patent wall at ITW’s corporate headquarters displays a subset of our more than 16,000 patents.
SHAREHOLDER INFORMATION
ITW2015AR_COVER.indd 4-6 2/26/16 4:46 PM
I L L I N O I S T O O L W O R K S I N C .
1 5 5 H A R L E M A V E N U E
G L E N V I E W , I L L I N O I S 6 0 0 2 5
W W W . I T W . C O M
2 0 1 5 A N N U A L R E P O R T
Di� erentiatedBusiness Model Di� erentiated Performance
ITW2015AR_COVER.indd 1-3 2/26/16 4:47 PM