Embed Size (px)
Citation preview

1
Illinois Salary and Staffing Survey of
Licensed Child Care Facilities
Fiscal Year 2019
Prepared by:
Jordan Norton
Joellyn Whitehead
Illinois Network of Child Care Resource and Referral Agencies
For
Illinois Department of Human Services
2
Executive Summary .........................................................................................................................4
Child Care Centers – Highlights and Key Findings.........................................................................5
Family Child Care Homes – Highlights and Key Findings .............................................................8
Introduction ....................................................................................................................................10
Methods..........................................................................................................................................10
Survey Development ..........................................................................................................10
Respondents .......................................................................................................................11
Administration of Surveys .................................................................................................11
Survey Data ........................................................................................................................12
Profile of Child Care Centers: Key Findings .................................................................................13
Respondent Role ................................................................................................................14
Types of Centers ......................................................................................................... 14
Accreditation & ExceleRate Illinois Status ................................................................ 15
Center Program Revenue ...................................................................................................17
Capacity and Enrollment Patterns ......................................................................................20
Ethnicity of Children in Programs .....................................................................................22
Staffing Patterns .................................................................................................................22
Male Staff.................................................................................................................... 24
Non-English Fluency of Staff ..................................................................................... 25
Professional Development .................................................................................................28
Illinois State Professional Development Programs..................................................... 28
Professional Development Plan .................................................................................. 29
Peer Support .......................................................................................................................31
Staff Turnover ....................................................................................................................31
Turnover Rates ............................................................................................................ 31
Turnover Reasons ....................................................................................................... 34
Applicants for Vacant Positions.................................................................................. 36
Hires for Vacant Positions .......................................................................................... 38
Attraction to Child Care Careers and Employment .................................................... 42
Center Turnover .................................................................................................................44
Staff Demographics ...........................................................................................................44
Education and Credentials .......................................................................................... 46
Duration of Employment with Current Employer ...................................................... 48
Salary and Wages ...............................................................................................................49
Salary Scale ................................................................................................................. 49
Hourly Wage by Position ............................................................................................ 50
Comparison of Hourly Wages from FY 2013-FY 2017 ............................................. 51
Hourly Wage by Full- Versus Part-Time Status ......................................................... 53
Staff Experience and Education .................................................................................. 54
Center Characteristics and Hourly Wage .................................................................... 56
3
Benefits ..............................................................................................................................60
Profile of Family Child Care Home Providers: Key Findings .......................................................63
Completed Surveys ............................................................................................................63
Demographics ....................................................................................................................64
Gender ......................................................................................................................... 64
Age .............................................................................................................................. 64
Ethnicity ...................................................................................................................... 64
Experience................................................................................................................... 65
Education .................................................................................................................... 65
Accreditation and ExceleRate Illinois Status .....................................................................66
Demographics of Children Served .....................................................................................67
Professional Development .................................................................................................68
Program Awareness and Participation ........................................................................ 68
Training and Training Opportunities .......................................................................... 69
Capacity and Enrollment....................................................................................................70
Assistants ...........................................................................................................................71
Business Characteristics.....................................................................................................72
Hours ........................................................................................................................... 72
Earnings and Operating Expenses .............................................................................. 73
Other Income Sources ................................................................................................. 74
Fee Policies ................................................................................................................. 74
Financial Assistance.................................................................................................... 76
Benefits ....................................................................................................................... 76
Professional Support ..........................................................................................................77
Turnover .............................................................................................................................77
Motivations and Perceptions about Providing Child Care .................................................80
Conclusion .....................................................................................................................................83
Appendix A: Survey Instruments...................................................................................................86
Child Care Center Survey ..................................................................................................86
Family Child Care Survey ...............................................................................................103
Appendix B: Child Care Resource and Referral System Map .....................................................115
Appendix C: Licensing Standards for Center Staffing ................................................................116
Appendix D: Acknowledgements ................................................................................................123
4
Executive Summary
High quality child care improves children’s experiences and developmental outcomes and also
contributes to a prepared, productive, and stable current and future workforce. Practitioners who
work in child care settings are responsible for the quality of care and early education provided to
children and their families.
The Illinois Department of Human Services (IDHS) is mandated by legislative rule 20 ILCS
505/5.151, to conduct a survey of the workforce in licensed child care facilities every two years.
The survey summarized in this report meets that mandate by documenting the following: (1) the
number of qualified caregivers attracted to vacant positions and any problems encountered by
facilities in attracting and retaining capable caregivers; (2) the qualifications of new caregivers
hired at licensed child care facilities during the previous two-year period; and (3) the average
wages and salaries and fringe benefits paid to caregivers throughout the State computed on a
regional basis.
Collection of survey data began with the list of 9,979 licensed child care programs in Illinois
(2,973 licensed child care centers and 7,006 licensed day care homes) obtained through the
Illinois Network of Child Care Resource and Referral Agencies (INCCRRA). On April 17, 2019,
providers with email addresses were sent an invitation to participate in the survey. This was
followed by a letter mailed to all providers (including those that already received an email) on
May 3, 2019. The survey was available in two formats: on-line and a paper document. Out of the
9,979 licensed programs, 499 child care centers (response rate = 16.8 percent) and 970 family
child care home providers (response rate = 13.9 percent) completed the survey.
In addition, the 2019 report includes administrative data from the Gateways to Opportunity
Registry. Because of the substantial population of licensed child care center staff and licensed
family child care providers in the Registry, these administrative data are the best source for
analysis of staff qualifications and salaries.
The findings of this 2019 survey and analysis of administrative data profile the qualifications,
salary and benefits, and turnover rates from the sample of licensed child care programs operating
in Illinois as of December 31, 2018.
1 The entire bill is located on the Illinois General Assembly website: http://www.ilga.gov/legislation/ilcs/ilcs3.asp?ActID=242&ChapterID=5
5
Child Care Centers – Highlights and Key
Findings
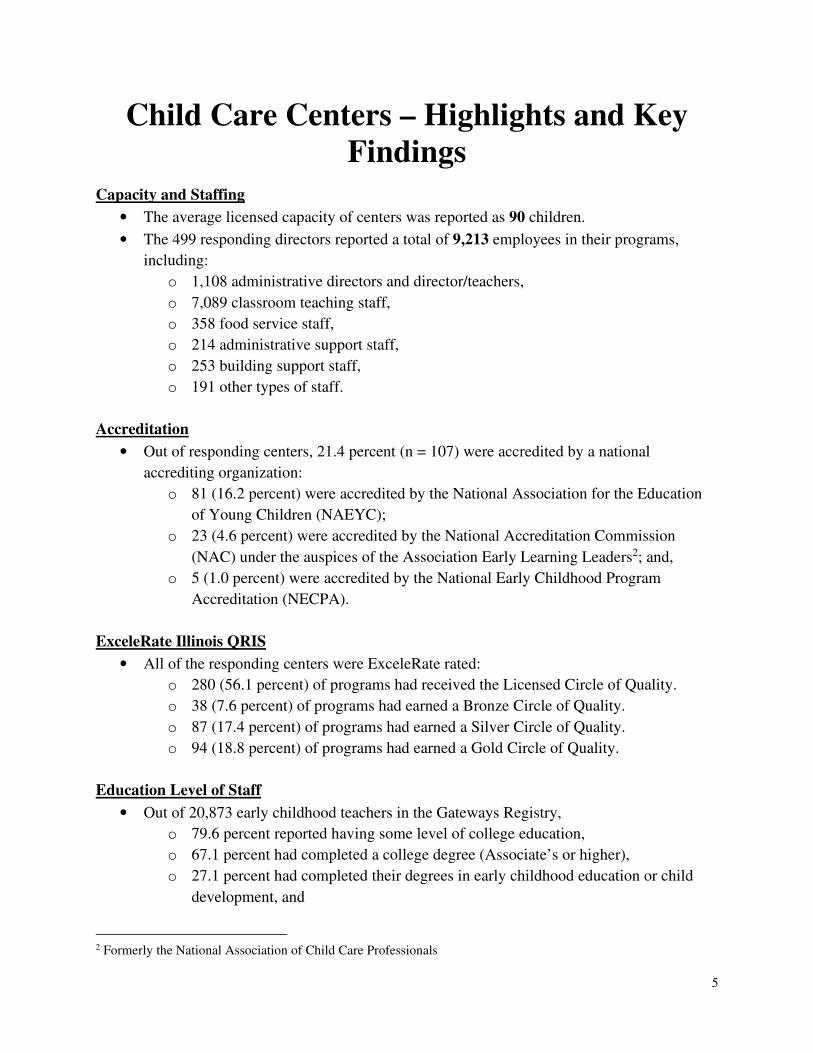
Capacity and Staffing
• The average licensed capacity of centers was reported as 90 children.
• The 499 responding directors reported a total of 9,213 employees in their programs,
including:
o 1,108 administrative directors and director/teachers,
o 7,089 classroom teaching staff,
o 358 food service staff,
o 214 administrative support staff,
o 253 building support staff,
o 191 other types of staff.
Accreditation
• Out of responding centers, 21.4 percent (n = 107) were accredited by a national
accrediting organization:
o 81 (16.2 percent) were accredited by the National Association for the Education
of Young Children (NAEYC);
o 23 (4.6 percent) were accredited by the National Accreditation Commission
(NAC) under the auspices of the Association Early Learning Leaders2; and,
o 5 (1.0 percent) were accredited by the National Early Childhood Program
Accreditation (NECPA).
ExceleRate Illinois QRIS
• All of the responding centers were ExceleRate rated:
o 280 (56.1 percent) of programs had received the Licensed Circle of Quality.
o 38 (7.6 percent) of programs had earned a Bronze Circle of Quality.
o 87 (17.4 percent) of programs had earned a Silver Circle of Quality.
o 94 (18.8 percent) of programs had earned a Gold Circle of Quality.
Education Level of Staff
• Out of 20,873 early childhood teachers in the Gateways Registry,
o 79.6 percent reported having some level of college education,
o 67.1 percent had completed a college degree (Associate’s or higher),
o 27.1 percent had completed their degrees in early childhood education or child
development, and
2 Formerly the National Association of Child Care Professionals
6
o 2.4 percent had completed a Child Development Associate (CDA) or Child Care
Professional (CCP) credential.
• 7.4 percent of early childhood teachers with a bachelor’s degree or higher reported they
also held a Professional Educator License (PEL) with an early childhood endorsement.
Salary
• The median hourly wage for a full-time administrative director was $17.79 per hour,
which is approximately equal to $37,003 per year.3
• The median hourly wage for a full-time early childhood teacher was $13.00 per hour,
which is approximately equal to $27,040 per year.
• The median hourly wage for a full-time early childhood assistant teacher was $10.71 per
hour, which is approximately equal to $22,277 per year.
Benefits
• Most centers did not offer insurance to most of their staff:
o 51.7 percent of centers offered health insurance for their staff.
o 45.7 percent of centers offered retirement/pension coverage for their employees.
o 45.8 percent of centers offered life insurance.
o 44.9 percent of centers offered dental insurance.
o 39.2 percent of centers offered disability insurance.
• Most centers did provide time off benefits:
o 92.9 percent of centers provided paid vacation leave to personnel.
o 90.7 percent of centers provided paid holiday leave for staff.
o 77.3 percent of centers provided paid sick leave for employees.
Turnover
• The turnover rate for early childhood teachers over the last two years decreased from
33.6 percent in 2017 to 32.1 percent in 2019.
• The turnover rate for early childhood assistant teachers over the last two years increased
from 39.1 percent in 2017 to 46.1 percent in 2019.
• Administrative directors had been employed at their current program an average of 9.5
years and early childhood teachers had been employed an average of 4.9 years.
• The top reason for early childhood teachers to leave their jobs willingly was
dissatisfaction with wages or benefits, followed by personal/family issues, and being
unhappy with job duties.
• The least important reasons for an early childhood teacher to leave their job willingly
were retirement and not enough opportunities for professional development or growth.
3 Assumes 40 hours per week, 52 weeks per year.

7
• Directors reported that it often took more than 4 weeks to fill IDCFS positions; there was
very little difference by type of position being filled.
8
Family Child Care Homes – Highlights and
Key Findings
Capacity and Enrollment
• The average licensed capacity reported for family child care homes was 10 children, with
providers reporting that they care for an average of 8.2 children in a typical week.
Accreditation
• 4.4 percent (n = 43 out of 970) of family child care providers were accredited through the
National Association of Family Child Care (NAFCC).
ExceleRate Illinois QRIS
• All responding family child care providers participated in ExceleRate.
o 89.8 percent (n = 871) had received the Licensed Circle of Quality.
o 5.1 percent (n = 49) had earned the Bronze Circle of Quality.
o 4.4 percent (n = 43) had earned the Silver Circle of Quality.
o 0.5 percent (n = 5) had earned the Gold Circle of Quality.
Education Level
• Data from the Gateways to Opportunity Registry show that of all licensed family child
care providers in the registry:
o 43.4 percent had some form of college education.
o 32.6 percent had an Associate’s degree or higher.
o 9.1 percent had an Associate’s degree or higher in either early childhood
education or child development.
o 2.9 percent reported that they had a public school early childhood professional
educator license (PEL).
Salary and Benefits
• Licensed family child care providers reported an average annual net income of
$14,868.33 per year:
o 25 percent of family child care providers make less than $4,975.50.
o 50 percent of family child care providers make less than $12,000.
o 75 percent of family child care providers make less than $22,000.
• 75.4 percent of family child care providers required payment when closed for holidays,
49.9 percent required payment when closed for vacation, 31.4 percent when closed for
sickness, and 18.5 percent when closed for training.
• 91.9 percent of family child care providers were covered by some form of health
insurance.

9
• 61.2 percent of family child care providers contributed to Social Security and 29.8
percent set aside money for retirement.
• 22.6 percent of family child care providers had received some form of public assistance
in the preceding two years.
Years of Experience/Turnover
• Family child care home providers reported an average of 16.9 years of experience taking
care of children in their homes.
• 31.2 percent of licensed family child care providers reported that they had been
previously employed in a child care center or public school.
• 38.9 percent of family child care providers considered quitting providing care in the
preceding two years. Too little respect for what child care providers do was the primary
reason endorsed.
• 37.8 percent of family child care providers report they plan to leave child care within an
average of 13.12 years.
Working Hours
• On average, family child care providers were paid to care for children 51.0 hours per
week.
• On average, family child providers spent an additional 17.7 hours per week on aspects
related to their child care business (preparing food, shopping, cleaning, record keeping
and lesson planning).
Motivation for Providing Child Care
• Family child care practitioners endorsed “enjoy teaching children” and “I consider myself
a small business owner” as their two primary motivating factors for providing child care.
10
Introduction
Legislative rule 20 ILCS 505/5.15 mandates a statewide survey of the workforce of licensed
child care facilities be conducted every two years by the Illinois Department of Human Services
(IDHS). This survey evaluates:
• the number of qualified caregivers attracted to vacant positions and any problems
encountered by facilities in attracting and retaining capable caregivers;
• the qualifications of new caregivers hired at licensed day care facilities during the
previous two-year period; and
• the average wages and salaries and fringe benefits paid to caregivers throughout the State
computed on a regional basis.
Other areas assessed by the survey include information pertaining to fiscal management,
enrollment patterns, staffing patterns, staff turnover rates, and professional development.
IDHS contracted with the Illinois Network of Child Care Resource and Referral Agencies
(INCCRRA) to conduct the Fiscal Year 2019 (FY 2019) survey.
Methods
Survey Development
One version of the Salary and Staffing Survey was constructed for licensed child care centers,
and a separate version was used for licensed family child care providers. To allow for the
comparison of 2019 survey results with those from past survey years, questions from past
surveys were retained with some minor changes in formatting and wording.
Respondents could opt to take the survey either on-line, via the internet, or as a mailed paper
document. Formatting and instructions differed slightly between the two forms of administration;
survey content remained the same.
To create the on-line version of each survey, the paper versions were directly transcribed on-line,
using the web-based SurveyMonkey product (surveymonkey.com). Respondents could access
the surveys through a link on the INCCRRA website. The Salary and Staffing Survey web page
contained links for both the licensed child care center and licensed family child care home
surveys. It also included information on how to access both the online and paper versions of the
survey, “Frequently Asked Questions” about the survey, and a link to “Previous Survey
Highlights.” To maintain confidentiality, respondents were assigned a user code (a randomly
11
generated ten-character code). This code was required to enter in order to access the survey.
With their unique code information, respondents could enter and exit the survey at their
convenience, take the survey at their own pace, and make changes to responses prior to
submission.
Respondents could request a paper copy of either the licensed child care center survey or the
licensed family child care home survey by emailing or calling INCCRRA. Along with the
requested survey, respondents would receive a self-addressed stamped envelope in which to
return the survey. Appendix A contains the paper versions of both the licensed child care center
and licensed family child care home surveys.
Respondents
There are sixteen Child Care Resource and Referral (CCR&R) agencies in Illinois (see Appendix
B) which together serve all 102 counties in Illinois. Each CCR&R is assigned one or more
counties to cover (referred to as their Service Delivery Area or SDA). All CCR&R agencies are
partners with INCCRRA, which provides coordination and supports for the Illinois CCR&R
System. CCR&Rs support licensed and license-exempt child care centers and family child care
homes in their assigned areas. Child care facilities in Illinois are licensed by the Illinois
Department of Children and Family Services (IDCFS).
Local CCR&Rs list these IDCFS licensed child care facilities on a provider database called
NACCRRAware. INCCRRA maintains this database for Illinois. All 9,979 facilities in Illinois
(2,973 licensed child care centers and 7,006 licensed family child care homes listed in the
database as providing care as of December 31, 2018) were invited to participate in the survey.
Administration of Surveys
On April 17, 2019, an email blast was sent to 7,748 providers with emails listed in the database
(5,367 family child care providers, 2,381 centers) inviting them to participate in the Salary and
Staffing Survey. On May 3, 2019, a letter was mailed to all centers (n = 2,973) in care of the
center director and all family home providers (n = 7,006), including those who had already been
sent an email. Both notifications delineated the purpose of the study and invited the providers to
participate in it, either by completing the survey online or via a mailed paper questionnaire.4
On June 10, 2019, reminder postcards were sent to 9,023 providers (6,369 family child care
home providers, 2,654 centers). These postcards thanked providers who had completed the
4 Copies of both surveys are included in Appendix A
12
survey, reminded providers of the survey’s availability both online and as a paper document, and
provided the contact information necessary for providers to obtain the paper copy of the survey if
so desired. Analyses were based on all completed surveys returned by August 30, 2019.
A total of 7,007 IDCFS licensed family child care home and group home providers and 2,974
centers were invited to complete the Salary and Staffing Survey. Out of these, 970 family child
care/group home providers (890 online; 80 paper) and 499 center directors (493 online and 6
paper) completed and returned the survey. The response rates for each type of program were 13.9
percent and 16.8 percent respectively.
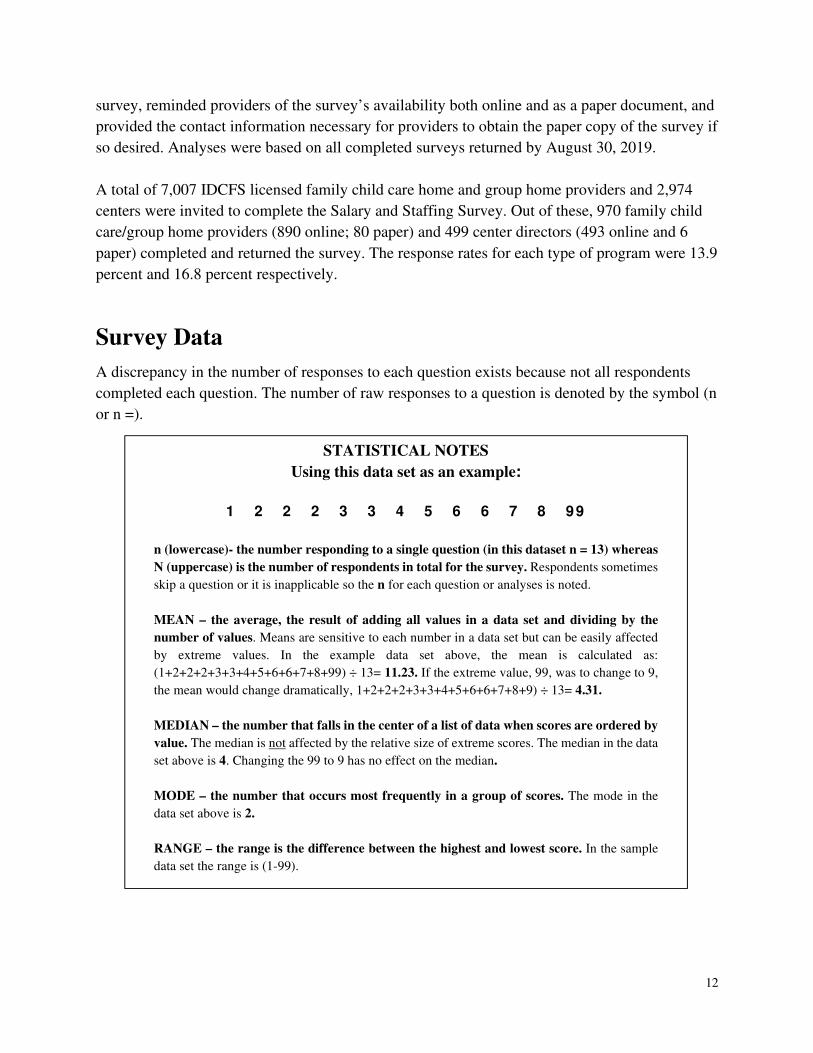
Survey Data
A discrepancy in the number of responses to each question exists because not all respondents
completed each question. The number of raw responses to a question is denoted by the symbol (n
or n =).
STATISTICAL NOTES
Using this data set as an example:
1 2 2 2 3 3 4 5 6 6 7 8 99
n (lowercase)- the number responding to a single question (in this dataset n = 13) whereas
N (uppercase) is the number of respondents in total for the survey. Respondents sometimes
skip a question or it is inapplicable so the n for each question or analyses is noted.
MEAN – the average, the result of adding all values in a data set and dividing by the
number of values. Means are sensitive to each number in a data set but can be easily affected
by extreme values. In the example data set above, the mean is calculated as:
(1+2+2+2+3+3+4+5+6+6+7+8+99) ÷ 13= 11.23. If the extreme value, 99, was to change to 9,
the mean would change dramatically, 1+2+2+2+3+3+4+5+6+6+7+8+9) ÷ 13= 4.31.
MEDIAN – the number that falls in the center of a list of data when scores are ordered by
value. The median is not affected by the relative size of extreme scores. The median in the data
set above is 4. Changing the 99 to 9 has no effect on the median.
MODE – the number that occurs most frequently in a group of scores. The mode in the
data set above is 2.
RANGE – the range is the difference between the highest and lowest score. In the sample
data set the range is (1-99).
13
Profile of Child Care Centers: Key Findings
The term “child care center” encompasses an assortment of programs that have their own legal
and regulatory status as well as funding sources. Types of programs include full-day/full-year
center-based child care programs, preschool programs, nursery schools, state-funded Preschool
for All pre-kindergarten programs, Head Start/Early Head Start programs, and school-age care
programs. Staff qualifications and training requirements vary with the type of program.
“Legal status” indicates for-profit or not-for-profit; “regulatory status” refers to licensed or
license-exempt. Source of capital includes public and/or private funding sources. Public funding
sources include, but are not limited to: Illinois Department of Human Services (IDHS) vouchers,
certificates or site contracts, the Chicago Department of Family Support Services site contracts,
Illinois Department of Children and Family Service (IDCFS) vouchers or certificates, Head Start,
State Board of Education (ISBE)/Preschool for All (PFA), Child and Adult Child Care Food
Program, and municipal, state or federal grants. Examples of private funding sources include
tuition-based (parent fees), private donations, grants from foundations or agencies such as the
United Way, corporate or employer subsidies and fundraisers.
Some centers are independent and stand-alone enterprises – either for-profit or non-profit; some
are part of a corporation or chain (or are corporate-sponsored), and some are affiliated with a
social service agency, hospital, or college or university. Others are sponsored through funds from
the federal, state, or local government or are affiliated with the public school system. Some are
single-site programs and others are multi-site programs.
All of these types of centers represent variation in child care delivery that is considered in the
survey analyses.
From the 2,973 invitations sent to child care centers, 493 online surveys were completed and an
additional 6 paper surveys were completed. Thus, 499 center surveys were completed out of
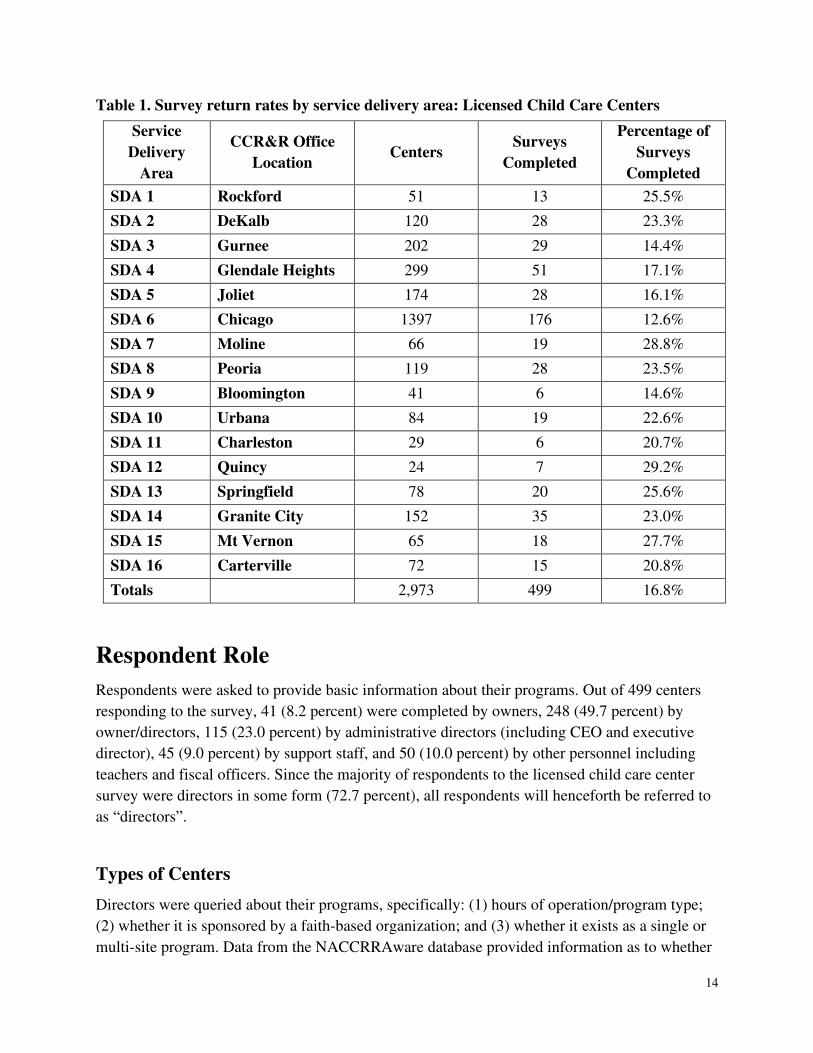
2,973 delivered invitations, for a response rate of 16.8 percent. Table 1 presents the response
rates by CCR&R service delivery area (SDA) (see Appendix B).
14
Table 1. Survey return rates by service delivery area: Licensed Child Care Centers
Service
Delivery
Area
CCR&R Office
Location Centers
Surveys
Completed
Percentage of
Surveys
Completed
SDA 1 Rockford 51 13 25.5%
SDA 2 DeKalb 120 28 23.3%
SDA 3 Gurnee 202 29 14.4%
SDA 4 Glendale Heights 299 51 17.1%
SDA 5 Joliet 174 28 16.1%
SDA 6 Chicago 1397 176 12.6%
SDA 7 Moline 66 19 28.8%
SDA 8 Peoria 119 28 23.5%
SDA 9 Bloomington 41 6 14.6%
SDA 10 Urbana 84 19 22.6%
SDA 11 Charleston 29 6 20.7%
SDA 12 Quincy 24 7 29.2%
SDA 13 Springfield 78 20 25.6%
SDA 14 Granite City 152 35 23.0%
SDA 15 Mt Vernon 65 18 27.7%
SDA 16 Carterville 72 15 20.8%
Totals 2,973 499 16.8%
Respondent Role
Respondents were asked to provide basic information about their programs. Out of 499 centers
responding to the survey, 41 (8.2 percent) were completed by owners, 248 (49.7 percent) by
owner/directors, 115 (23.0 percent) by administrative directors (including CEO and executive
director), 45 (9.0 percent) by support staff, and 50 (10.0 percent) by other personnel including
teachers and fiscal officers. Since the majority of respondents to the licensed child care center
survey were directors in some form (72.7 percent), all respondents will henceforth be referred to
as “directors”.
Types of Centers
Directors were queried about their programs, specifically: (1) hours of operation/program type;
(2) whether it is sponsored by a faith-based organization; and (3) whether it exists as a single or
multi-site program. Data from the NACCRRAware database provided information as to whether
15
the center was an accredited program and whether it has been awarded a Circle of Quality in the
ExceleRate Illinois Quality Recognition and Improvement System (QRIS).
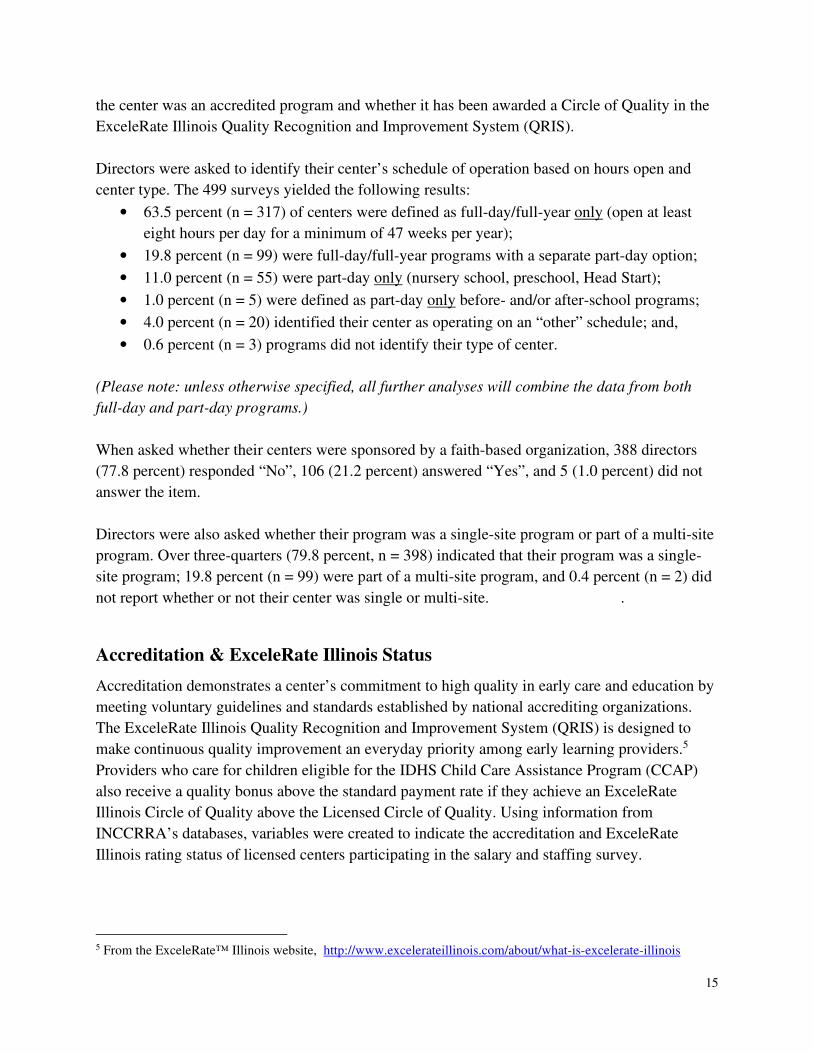
Directors were asked to identify their center’s schedule of operation based on hours open and
center type. The 499 surveys yielded the following results:
• 63.5 percent (n = 317) of centers were defined as full-day/full-year only (open at least
eight hours per day for a minimum of 47 weeks per year);
• 19.8 percent (n = 99) were full-day/full-year programs with a separate part-day option;
• 11.0 percent (n = 55) were part-day only (nursery school, preschool, Head Start);
• 1.0 percent (n = 5) were defined as part-day only before- and/or after-school programs;
• 4.0 percent (n = 20) identified their center as operating on an “other” schedule; and,
• 0.6 percent (n = 3) programs did not identify their type of center.
(Please note: unless otherwise specified, all further analyses will combine the data from both
full-day and part-day programs.)
When asked whether their centers were sponsored by a faith-based organization, 388 directors
(77.8 percent) responded “No”, 106 (21.2 percent) answered “Yes”, and 5 (1.0 percent) did not
answer the item.
Directors were also asked whether their program was a single-site program or part of a multi-site
program. Over three-quarters (79.8 percent, n = 398) indicated that their program was a single-
site program; 19.8 percent (n = 99) were part of a multi-site program, and 0.4 percent (n = 2) did
not report whether or not their center was single or multi-site. .
Accreditation & ExceleRate Illinois Status
Accreditation demonstrates a center’s commitment to high quality in early care and education by
meeting voluntary guidelines and standards established by national accrediting organizations.
The ExceleRate Illinois Quality Recognition and Improvement System (QRIS) is designed to
make continuous quality improvement an everyday priority among early learning providers.5
Providers who care for children eligible for the IDHS Child Care Assistance Program (CCAP)
also receive a quality bonus above the standard payment rate if they achieve an ExceleRate
Illinois Circle of Quality above the Licensed Circle of Quality. Using information from
INCCRRA’s databases, variables were created to indicate the accreditation and ExceleRate
Illinois rating status of licensed centers participating in the salary and staffing survey.
5 From the ExceleRate™ Illinois website, http://www.excelerateillinois.com/about/what-is-excelerate-illinois

16
Of all 499 programs responding to the FY 2019 survey, 21.4 percent (n = 107) were accredited:
• 16.2 percent (n = 81) of programs were accredited by the National Association for the
Education of Young Children (NAEYC);
• 4.6 percent (n = 23) were accredited by the National Accreditation Commission (NAC)
under the auspices of the Association for Early Learning Leaders; and,
• 1.0 percent (n = 5) of programs were accredited through NECPA (National Early
Childhood Program Accreditation).6
In FY 2019, all 499 centers responding to the survey participated in ExceleRate Illinois, with
56.1 percent (n = 280) being at the Licensed Circle of Quality and 43.9 percent (n = 219) having
a higher Circle of Quality. Of those 219 programs, 17.4 percent (n = 38) of programs earned a
Bronze Circle of Quality, 39.7 percent (n = 87) of programs earned a Silver Circle of Quality,
and 42.9 percent (n = 94) of programs earned the Gold Circle of Quality.7
Please note that centers can simultaneously hold a Circle of Quality and be nationally accredited.
Of the 219 centers that had achieved a rating above the Licensed Circle of Quality, 41.6 percent
(n = 91) were also nationally accredited.
6 To further identify the prevalence of accredited centers in Illinois, data were accessed from NACCRRAware in July 2019 and showed that: 378 (12.7 percent of all Illinois centers) are NAEYC accredited, 100 (3.4 percent of all Illinois centers) are NAC accredited, 23 (0.8 percent of all Illinois centers) are NECPA accredited, and 4 (0.1 percent of all Illinois centers) are NAA accredited. Overall, 16.6 percent of all center programs in Illinois have been accredited by national organizations and meet nationally recognized standards for high quality. 7 According to data retrieved for all programs from INCCRRA’s Data Tracking Program (DTP), on July 1, 2019: 67.7 percent of centers were at the Licensed Circle of Quality, 4.5 percent were at Bronze, 12.1 percent were at Silver, and 15.7 percent were at the Gold Circle of Quality.
17
Center Program Revenue
To assess center program revenues, directors were asked to describe the legal status of their
center, list center funding sources, estimate the contribution of each funding source to the
center’s overall budget, and provide totals on center revenue, operating budget, and net profit.
First, directors were asked to delineate the legal status of their program (profit or non-profit).
The legal status of a program influences the types of revenue available to the program as well as
a host of other factors that define or affect the program. Of the 499 centers who participated in
the survey:
• 230 (47.7 percent) reported their centers as for-profit enterprises:
o 26.9 percent (n = 134) reported their center as a for-profit private proprietary or
partnership;
o 19.0 percent (n = 95) reported their center as a for-profit corporation or chain;
o 1.8 percent (n = 9) reported their center as a for profit corporate sponsored;
• 190 (38.1 percent) described their centers as a private non-profit:
o 31.1 percent (n = 155) described their center as an independent private non-profit;
o 7.0 percent (n = 35) described their center as a private non-profit affiliated with a
social service agency or hospital;
• 53 (10.6 percent) identified their centers as a public non-profit- sponsored by federal,
state, or local government;
• 11 (2.2 percent) identified their centers as college or university affiliated;
• 3 (0.6 percent) identified their centers as a public school; and
• 4 (0.8 percent) of center directors did not respond to this item.
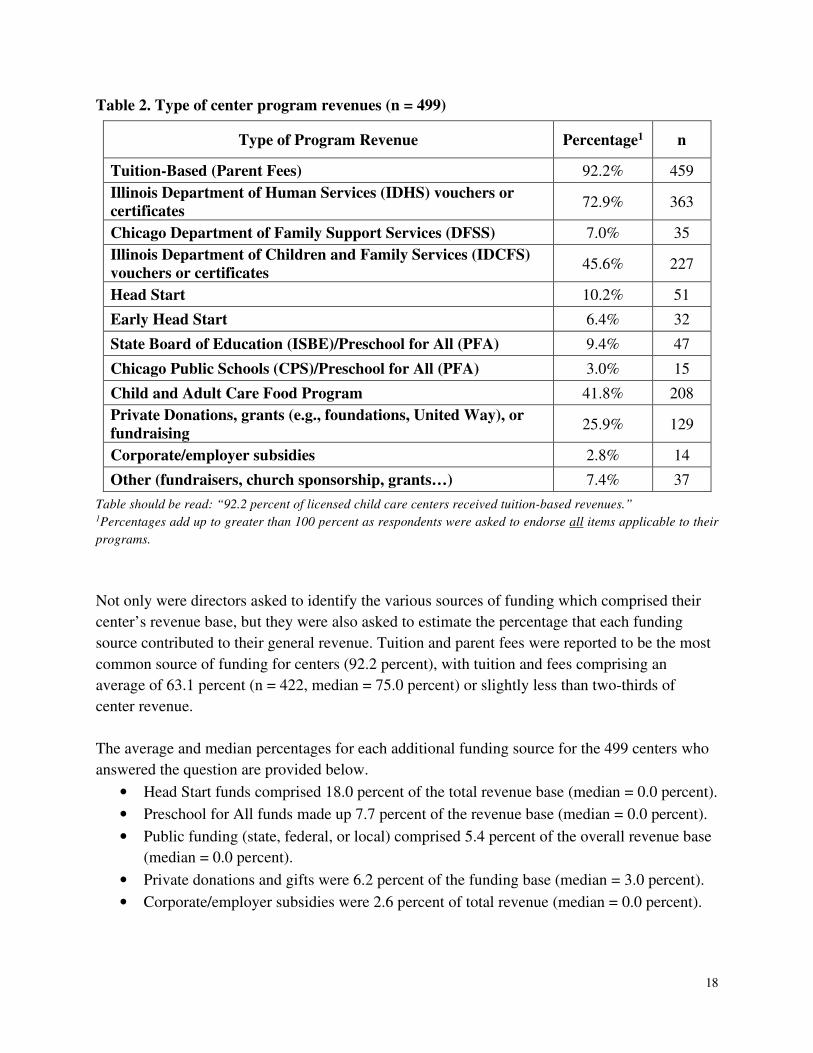
Next, center directors were provided a list of funding sources and asked to indicate which ones
their center currently received. Table 2 identifies each revenue source and the percentage and
number of centers who reported receiving it. As Table 2 reveals, 92.2 percent of all centers stated
a portion of their funding base was comprised of tuition-based/parent fees. Illinois Department of
Human Services (IDHS) vouchers or certificates were the second most common source of
funding (72.9 percent).
18
Table 2. Type of center program revenues (n = 499)
Type of Program Revenue Percentage1 n
Tuition-Based (Parent Fees) 92.2% 459
Illinois Department of Human Services (IDHS) vouchers or
certificates 72.9% 363
Chicago Department of Family Support Services (DFSS) 7.0% 35
Illinois Department of Children and Family Services (IDCFS)
vouchers or certificates 45.6% 227
Head Start 10.2% 51
Early Head Start 6.4% 32
State Board of Education (ISBE)/Preschool for All (PFA) 9.4% 47
Chicago Public Schools (CPS)/Preschool for All (PFA) 3.0% 15
Child and Adult Care Food Program 41.8% 208
Private Donations, grants (e.g., foundations, United Way), or
fundraising 25.9% 129
Corporate/employer subsidies 2.8% 14
Other (fundraisers, church sponsorship, grants…) 7.4% 37
Table should be read: “92.2 percent of licensed child care centers received tuition-based revenues.” 1Percentages add up to greater than 100 percent as respondents were asked to endorse all items applicable to their
programs.
Not only were directors asked to identify the various sources of funding which comprised their
center’s revenue base, but they were also asked to estimate the percentage that each funding
source contributed to their general revenue. Tuition and parent fees were reported to be the most
common source of funding for centers (92.2 percent), with tuition and fees comprising an
average of 63.1 percent (n = 422, median = 75.0 percent) or slightly less than two-thirds of
center revenue.
The average and median percentages for each additional funding source for the 499 centers who
answered the question are provided below.
• Head Start funds comprised 18.0 percent of the total revenue base (median = 0.0 percent).
• Preschool for All funds made up 7.7 percent of the revenue base (median = 0.0 percent).
• Public funding (state, federal, or local) comprised 5.4 percent of the overall revenue base
(median = 0.0 percent).
• Private donations and gifts were 6.2 percent of the funding base (median = 3.0 percent).
• Corporate/employer subsidies were 2.6 percent of total revenue (median = 0.0 percent).
19
Directors were asked to approximate both the annual operating costs and annual income for their
centers. A wide range of budgets emerged. Annual operating expenses averaged $506,202.52 (n=
324), with a median of $400,000. Annual revenues averaged $542,289.50 (n = 324) with a
median of $430,000. To calculate net profit, annual expenses were subtracted from annual
revenues. Again, a notable range in net-profit existed between the centers; however, the average
profit per center was $36,086.98 (n = 324).
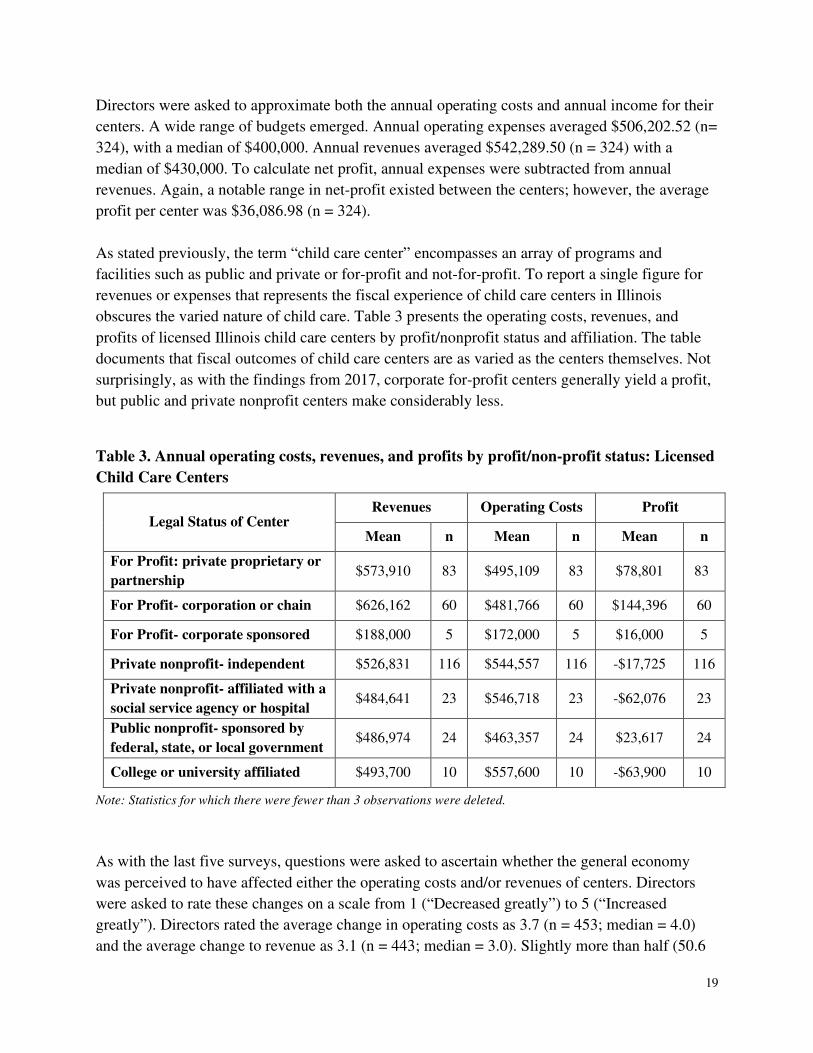
As stated previously, the term “child care center” encompasses an array of programs and
facilities such as public and private or for-profit and not-for-profit. To report a single figure for
revenues or expenses that represents the fiscal experience of child care centers in Illinois
obscures the varied nature of child care. Table 3 presents the operating costs, revenues, and
profits of licensed Illinois child care centers by profit/nonprofit status and affiliation. The table
documents that fiscal outcomes of child care centers are as varied as the centers themselves. Not
surprisingly, as with the findings from 2017, corporate for-profit centers generally yield a profit,
but public and private nonprofit centers make considerably less.
Table 3. Annual operating costs, revenues, and profits by profit/non-profit status: Licensed
Child Care Centers
Legal Status of Center Revenues Operating Costs Profit
Mean n Mean n Mean n
For Profit: private proprietary or
partnership $573,910 83 $495,109 83 $78,801 83
For Profit- corporation or chain $626,162 60 $481,766 60 $144,396 60
For Profit- corporate sponsored $188,000 5 $172,000 5 $16,000 5
Private nonprofit- independent $526,831 116 $544,557 116 -$17,725 116
Private nonprofit- affiliated with a
social service agency or hospital $484,641 23 $546,718 23 -$62,076 23
Public nonprofit- sponsored by
federal, state, or local government $486,974 24 $463,357 24 $23,617 24
College or university affiliated $493,700 10 $557,600 10 -$63,900 10
Note: Statistics for which there were fewer than 3 observations were deleted.
As with the last five surveys, questions were asked to ascertain whether the general economy
was perceived to have affected either the operating costs and/or revenues of centers. Directors
were asked to rate these changes on a scale from 1 (“Decreased greatly”) to 5 (“Increased
greatly”). Directors rated the average change in operating costs as 3.7 (n = 453; median = 4.0)
and the average change to revenue as 3.1 (n = 443; median = 3.0). Slightly more than half (50.6
20
percent) of the directors that indicated revenues “stayed about the same” noted that operating
costs had increased in the last two years.
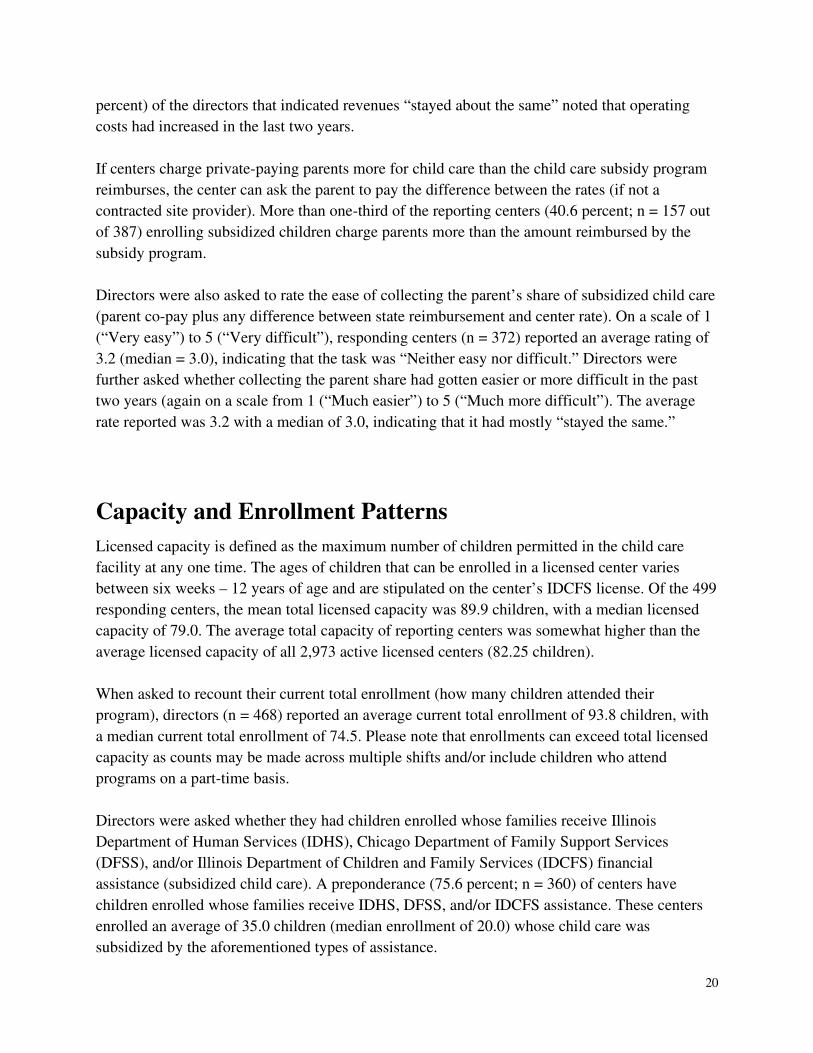
If centers charge private-paying parents more for child care than the child care subsidy program
reimburses, the center can ask the parent to pay the difference between the rates (if not a
contracted site provider). More than one-third of the reporting centers (40.6 percent; n = 157 out
of 387) enrolling subsidized children charge parents more than the amount reimbursed by the
subsidy program.
Directors were also asked to rate the ease of collecting the parent’s share of subsidized child care
(parent co-pay plus any difference between state reimbursement and center rate). On a scale of 1
(“Very easy”) to 5 (“Very difficult”), responding centers (n = 372) reported an average rating of
3.2 (median = 3.0), indicating that the task was “Neither easy nor difficult.” Directors were
further asked whether collecting the parent share had gotten easier or more difficult in the past
two years (again on a scale from 1 (“Much easier”) to 5 (“Much more difficult”). The average
rate reported was 3.2 with a median of 3.0, indicating that it had mostly “stayed the same.”
Capacity and Enrollment Patterns
Licensed capacity is defined as the maximum number of children permitted in the child care
facility at any one time. The ages of children that can be enrolled in a licensed center varies
between six weeks – 12 years of age and are stipulated on the center’s IDCFS license. Of the 499
responding centers, the mean total licensed capacity was 89.9 children, with a median licensed
capacity of 79.0. The average total capacity of reporting centers was somewhat higher than the
average licensed capacity of all 2,973 active licensed centers (82.25 children).
When asked to recount their current total enrollment (how many children attended their
program), directors (n = 468) reported an average current total enrollment of 93.8 children, with
a median current total enrollment of 74.5. Please note that enrollments can exceed total licensed
capacity as counts may be made across multiple shifts and/or include children who attend
programs on a part-time basis.
Directors were asked whether they had children enrolled whose families receive Illinois
Department of Human Services (IDHS), Chicago Department of Family Support Services
(DFSS), and/or Illinois Department of Children and Family Services (IDCFS) financial
assistance (subsidized child care). A preponderance (75.6 percent; n = 360) of centers have
children enrolled whose families receive IDHS, DFSS, and/or IDCFS assistance. These centers
enrolled an average of 35.0 children (median enrollment of 20.0) whose child care was
subsidized by the aforementioned types of assistance.
21
To calculate the percentage of subsidized children enrolled in a center, the number of subsidized
children enrolled was divided by the center’s current total enrollment (n = 330). On average, 37.7
percent (median = 30.0 percent, with a range of from 0 to 100 percent) or, about four out of
every ten children enrolled in licensed child care centers, had child care paid through IDHS,
DFSS, and/or IDCFS public financial assistance. This was 0.7 percent higher than the FY 2017
Salary and Staffing Survey report of 37.0 percent, and 1.2 percent lower than the FY 2015 report
of 38.9 percent.
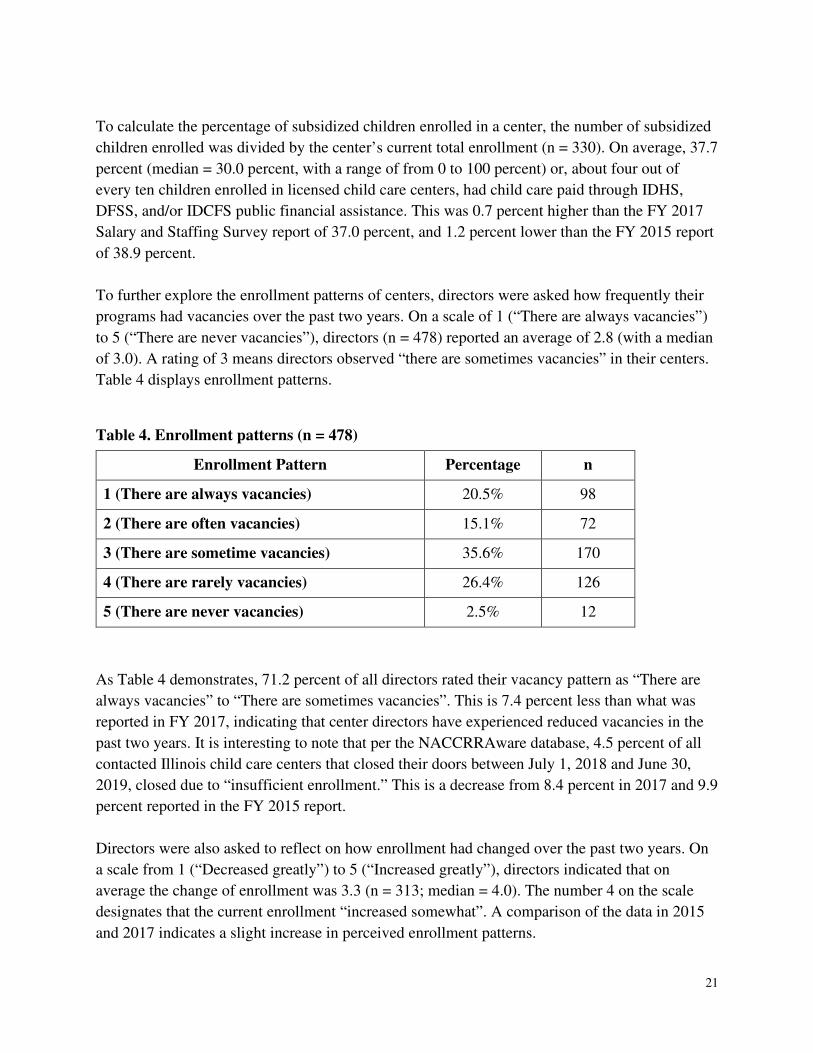
To further explore the enrollment patterns of centers, directors were asked how frequently their
programs had vacancies over the past two years. On a scale of 1 (“There are always vacancies”)
to 5 (“There are never vacancies”), directors (n = 478) reported an average of 2.8 (with a median
of 3.0). A rating of 3 means directors observed “there are sometimes vacancies” in their centers.
Table 4 displays enrollment patterns.
Table 4. Enrollment patterns (n = 478)
Enrollment Pattern Percentage n
1 (There are always vacancies) 20.5% 98
2 (There are often vacancies) 15.1% 72
3 (There are sometime vacancies) 35.6% 170
4 (There are rarely vacancies) 26.4% 126
5 (There are never vacancies) 2.5% 12
As Table 4 demonstrates, 71.2 percent of all directors rated their vacancy pattern as “There are
always vacancies” to “There are sometimes vacancies”. This is 7.4 percent less than what was
reported in FY 2017, indicating that center directors have experienced reduced vacancies in the
past two years. It is interesting to note that per the NACCRRAware database, 4.5 percent of all
contacted Illinois child care centers that closed their doors between July 1, 2018 and June 30,
2019, closed due to “insufficient enrollment.” This is a decrease from 8.4 percent in 2017 and 9.9
percent reported in the FY 2015 report.
Directors were also asked to reflect on how enrollment had changed over the past two years. On
a scale from 1 (“Decreased greatly”) to 5 (“Increased greatly”), directors indicated that on
average the change of enrollment was 3.3 (n = 313; median = 4.0). The number 4 on the scale
designates that the current enrollment “increased somewhat”. A comparison of the data in 2015
and 2017 indicates a slight increase in perceived enrollment patterns.
22
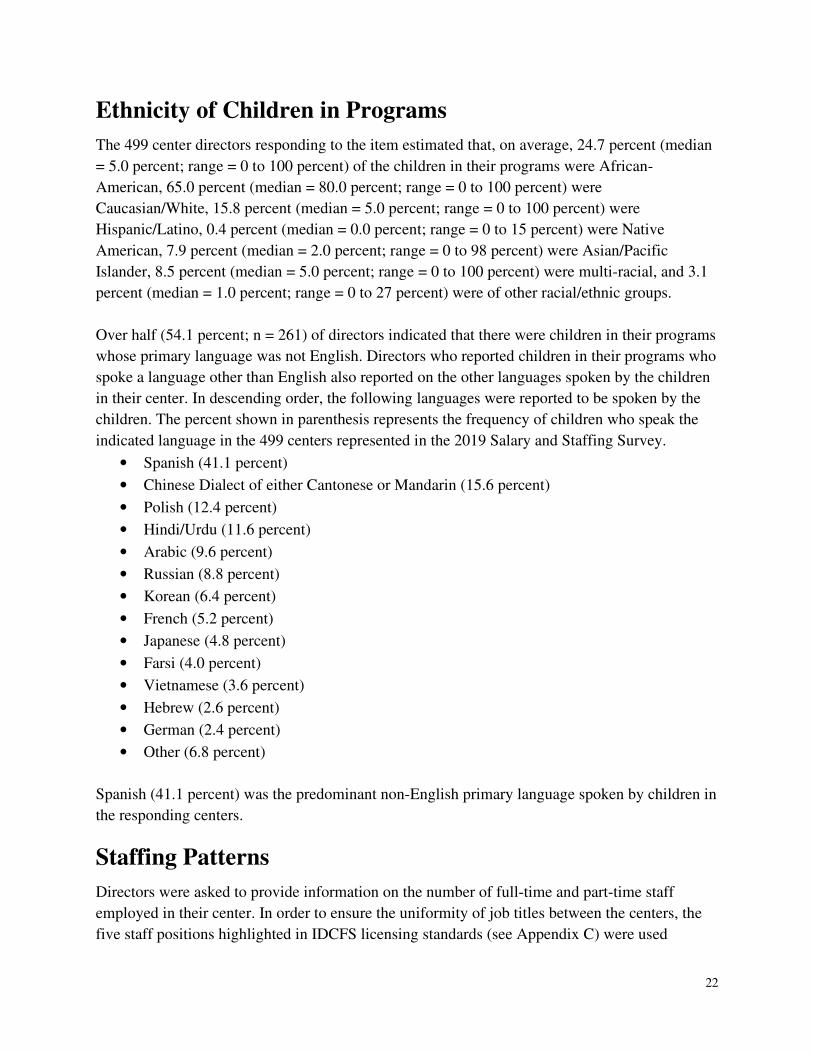
Ethnicity of Children in Programs
The 499 center directors responding to the item estimated that, on average, 24.7 percent (median
= 5.0 percent; range = 0 to 100 percent) of the children in their programs were African-
American, 65.0 percent (median = 80.0 percent; range = 0 to 100 percent) were
Caucasian/White, 15.8 percent (median = 5.0 percent; range = 0 to 100 percent) were
Hispanic/Latino, 0.4 percent (median = 0.0 percent; range = 0 to 15 percent) were Native
American, 7.9 percent (median = 2.0 percent; range = 0 to 98 percent) were Asian/Pacific
Islander, 8.5 percent (median = 5.0 percent; range = 0 to 100 percent) were multi-racial, and 3.1
percent (median = 1.0 percent; range = 0 to 27 percent) were of other racial/ethnic groups.
Over half (54.1 percent; n = 261) of directors indicated that there were children in their programs
whose primary language was not English. Directors who reported children in their programs who
spoke a language other than English also reported on the other languages spoken by the children
in their center. In descending order, the following languages were reported to be spoken by the
children. The percent shown in parenthesis represents the frequency of children who speak the
indicated language in the 499 centers represented in the 2019 Salary and Staffing Survey.
• Spanish (41.1 percent)
• Chinese Dialect of either Cantonese or Mandarin (15.6 percent)
• Polish (12.4 percent)
• Hindi/Urdu (11.6 percent)
• Arabic (9.6 percent)
• Russian (8.8 percent)
• Korean (6.4 percent)
• French (5.2 percent)
• Japanese (4.8 percent)
• Farsi (4.0 percent)
• Vietnamese (3.6 percent)
• Hebrew (2.6 percent)
• German (2.4 percent)
• Other (6.8 percent)
Spanish (41.1 percent) was the predominant non-English primary language spoken by children in
the responding centers.
Staffing Patterns
Directors were asked to provide information on the number of full-time and part-time staff
employed in their center. In order to ensure the uniformity of job titles between the centers, the
five staff positions highlighted in IDCFS licensing standards (see Appendix C) were used
23
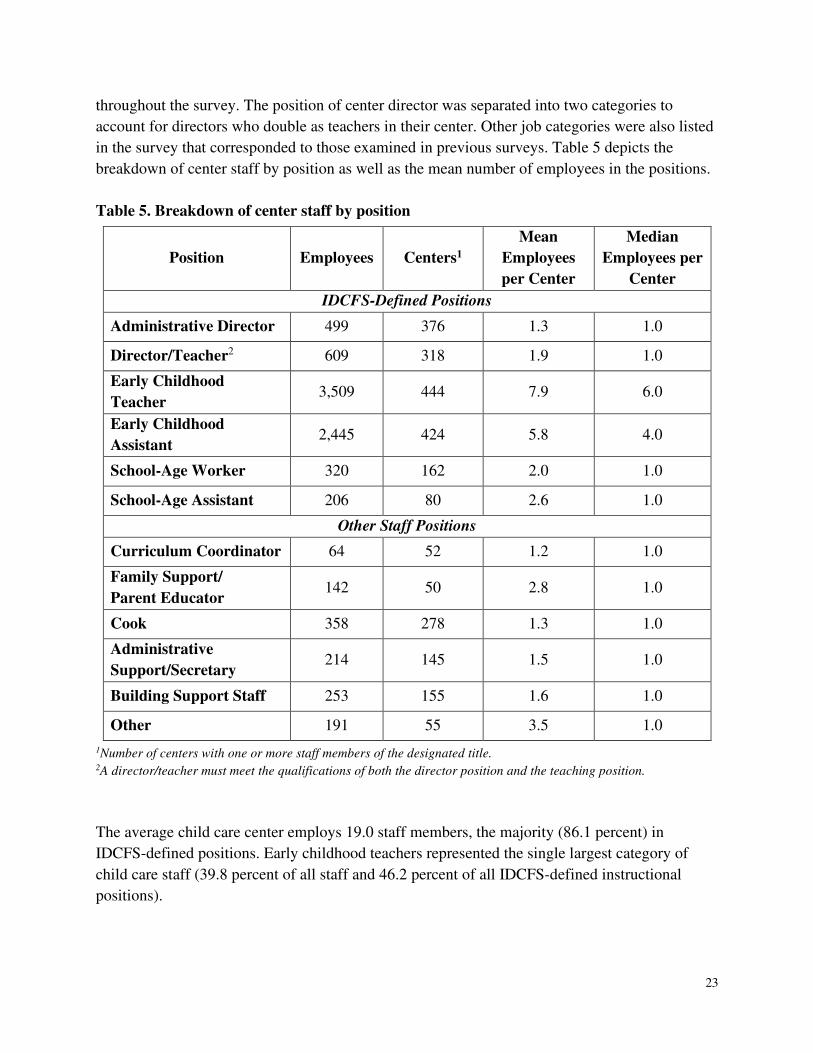
throughout the survey. The position of center director was separated into two categories to
account for directors who double as teachers in their center. Other job categories were also listed
in the survey that corresponded to those examined in previous surveys. Table 5 depicts the
breakdown of center staff by position as well as the mean number of employees in the positions.
Table 5. Breakdown of center staff by position
Position Employees Centers1
Mean
Employees
per Center
Median
Employees per
Center
IDCFS-Defined Positions
Administrative Director 499 376 1.3 1.0
Director/Teacher2 609 318 1.9 1.0
Early Childhood
Teacher 3,509 444 7.9 6.0
Early Childhood
Assistant 2,445 424 5.8 4.0
School-Age Worker 320 162 2.0 1.0
School-Age Assistant 206 80 2.6 1.0
Other Staff Positions
Curriculum Coordinator 64 52 1.2 1.0
Family Support/
Parent Educator 142 50 2.8 1.0
Cook 358 278 1.3 1.0
Administrative
Support/Secretary 214 145 1.5 1.0
Building Support Staff 253 155 1.6 1.0
Other 191 55 3.5 1.0
1Number of centers with one or more staff members of the designated title. 2A director/teacher must meet the qualifications of both the director position and the teaching position.
The average child care center employs 19.0 staff members, the majority (86.1 percent) in
IDCFS-defined positions. Early childhood teachers represented the single largest category of
child care staff (39.8 percent of all staff and 46.2 percent of all IDCFS-defined instructional
positions).
24
Directors were also asked to report on how many of their staff were lead teachers.8 Lead teachers
were defined as follows:
The lead teacher is the individual with the highest educational qualifications assigned to
teach a group/classroom of children and who is responsible for daily lesson planning,
parent conferences, child assessment, and curriculum planning.
• Depending on the program, this individual may be called a head teacher,
master teacher, or teacher.
• Each group/classroom will have one, and only one, lead teacher.
A total of 450 centers provided information about lead teachers. Child care centers averaged 6.0
lead teachers, with a median of 5.0. This figure remains consistent with findings from 2017
(mean = 6.1; median = 5.0) and 2015 (mean = 6.0; median = 5.0).
Table 5 indicates that on average most centers employ one cook and one or two building support
person in their program; however, not all centers have these employees on their regular staff. Of
the 499 directors who responded to the survey, 30.1 percent indicated that they contracted for
food service, 36.3 percent contracted for building cleaning, 35.1 percent contracted for grounds
maintenance, and 6.8 percent indicated that they contracted for other services such as pest
control, accounting, and office equipment.
To further explore staffing patterns, directors were asked to identify the number of instructional
staff with a second-paying job outside of their center. Out of 450 responses to this question, 209
directors answered “I don’t know” and 242 (53.7 percent) indicated that at least one member of
their instructional staff had a second paying outside job. These directors reported that on average,
three (mean = 3.2; median = 2.0; range = from 1 to 20) of their instructional staff had a second-
paying job outside their center. The average number of staff reported to have an outside paying
job is consistent with the findings from the last several surveys.
Male Staff
Men continue to be underrepresented when it comes to employment in the field of early care and
education. According to the U.S. Bureau of Labor Statistics, the 2019 national percentage of men
employed as child care workers was 6.6 percent, employed as teacher assistants was 10.3 percent
8 The position “Lead Teacher” is not an IDCFS-defined position. However, a recommendation to revise IDCFS Licensing Standards for Day Care Centers to add “lead teacher” as a separate role category for teaching staff, appeared in the publication: “Who’s Caring for the Kids? The Status of the Early Childhood Workforce – 2008,” a joint project by the McCormick Tribune Center for Early Childhood Leadership at National-Louis University and the Early Childhood Parenting Collaborative at the University of Illinois. This report combined statistical data from IDHS, ISBE and INCCRRA to summarize the status of early child care education in Illinois and to make recommendations. The report proposed a definition of a “lead teacher” and the ECE credential levels which would be required for personnel hired as lead teachers in a child care center and/or Preschool for All program.
25
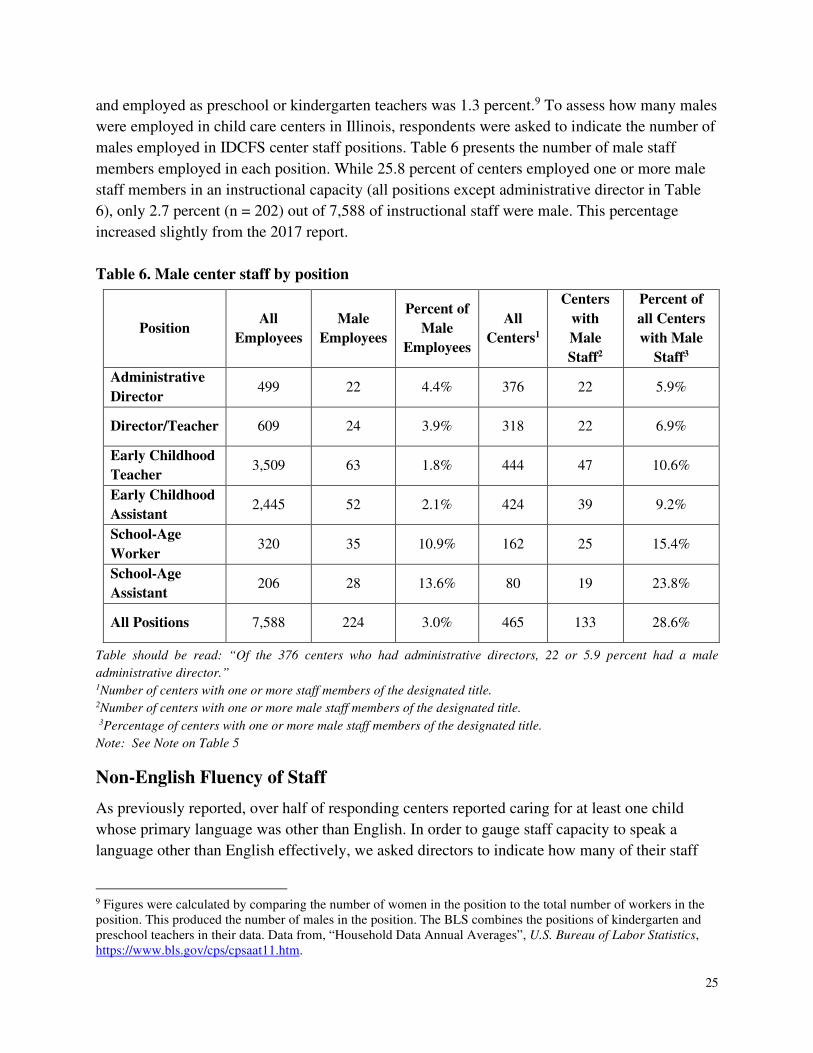
and employed as preschool or kindergarten teachers was 1.3 percent.9 To assess how many males
were employed in child care centers in Illinois, respondents were asked to indicate the number of
males employed in IDCFS center staff positions. Table 6 presents the number of male staff
members employed in each position. While 25.8 percent of centers employed one or more male
staff members in an instructional capacity (all positions except administrative director in Table
6), only 2.7 percent (n = 202) out of 7,588 of instructional staff were male. This percentage
increased slightly from the 2017 report.
Table 6. Male center staff by position
Position All
Employees
Male
Employees
Percent of
Male
Employees
All
Centers1
Centers
with
Male
Staff2
Percent of
all Centers
with Male
Staff3
Administrative
Director 499 22 4.4% 376 22 5.9%
Director/Teacher 609 24 3.9% 318 22 6.9%
Early Childhood
Teacher 3,509 63 1.8% 444 47 10.6%
Early Childhood
Assistant 2,445 52 2.1% 424 39 9.2%
School-Age
Worker 320 35 10.9% 162 25 15.4%
School-Age
Assistant 206 28 13.6% 80 19 23.8%
All Positions 7,588 224 3.0% 465 133 28.6%
Table should be read: “Of the 376 centers who had administrative directors, 22 or 5.9 percent had a male
administrative director.” 1Number of centers with one or more staff members of the designated title. 2Number of centers with one or more male staff members of the designated title.
3Percentage of centers with one or more male staff members of the designated title.
Note: See Note on Table 5
Non-English Fluency of Staff
As previously reported, over half of responding centers reported caring for at least one child
whose primary language was other than English. In order to gauge staff capacity to speak a
language other than English effectively, we asked directors to indicate how many of their staff
9 Figures were calculated by comparing the number of women in the position to the total number of workers in the position. This produced the number of males in the position. The BLS combines the positions of kindergarten and preschool teachers in their data. Data from, “Household Data Annual Averages”, U.S. Bureau of Labor Statistics, https://www.bls.gov/cps/cpsaat11.htm.

26
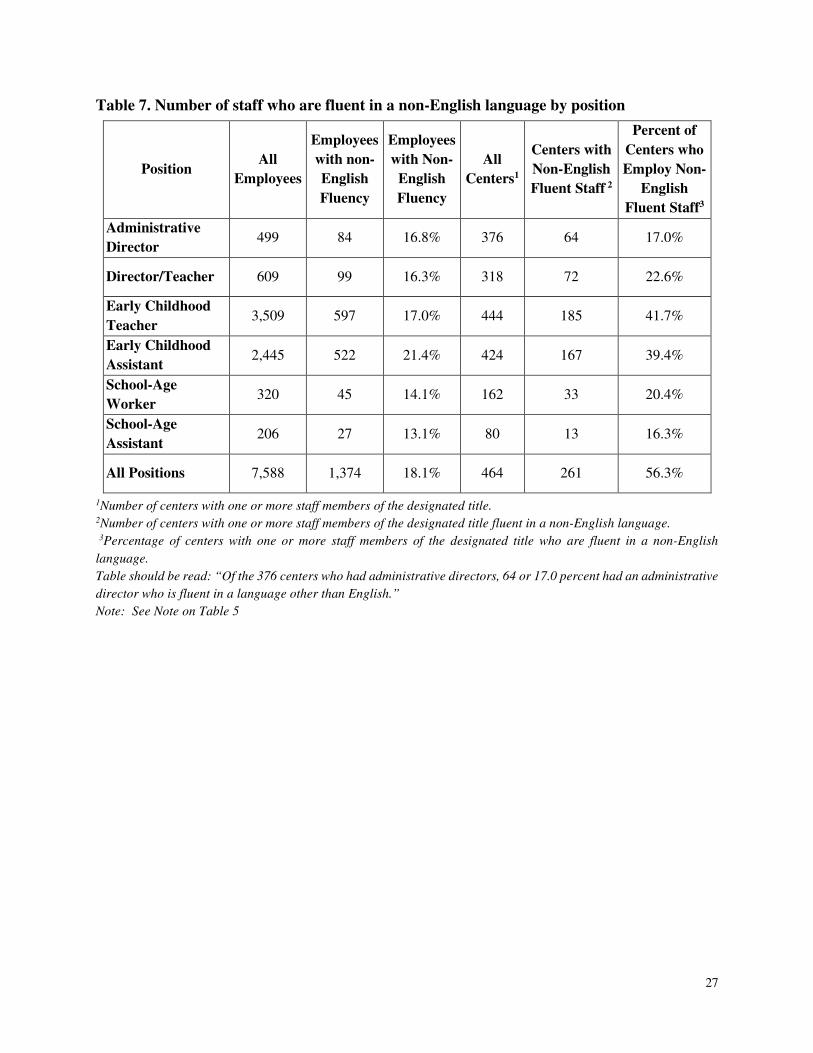
were fluent in a non-English language. Table 7 presents the results of this inquiry. Just over 18
percent of the 7,588 instructional staff were reported to be fluent in a language other than
English (this is an increase from what was reported in 2017 and 2015, a continuation of the
increase from the 14.1 percent reported in 2013 and 10.5 percent reported in 2011). Almost half
of all centers (46.1 percent) had at least one instructional staff member who was fluent in a non-
English language. This is a slight decrease from the 51.1 percent in 2017 and 48.9 percent in
2015.
In descending order, the following languages were reported as spoken fluently by center staff.
The percentage of all programs represented in the survey that have staff who speaks that
language appears in parentheses.
• Spanish (44.7 percent)
• Polish (8.4 percent)
• Hindi/Urdu (7.2 percent)
• Arabic (5.6 percent)
• Chinese dialect of either Cantonese or Mandarin (3.4 percent)
• French (3.0 percent)
• Russian (2.4 percent)
• Farsi (2.0 percent)
• German (1.8 percent)
• Korean (1.8 percent)
• Hebrew (1.8 percent)
• Vietnamese (0.8 percent)
• Japanese (0.8 percent)
27
Table 7. Number of staff who are fluent in a non-English language by position
Position All
Employees
Employees
with non-
English
Fluency
Employees
with Non-
English
Fluency
All
Centers1
Centers with
Non-English
Fluent Staff 2
Percent of
Centers who
Employ Non-
English
Fluent Staff3
Administrative
Director 499 84 16.8% 376 64 17.0%
Director/Teacher 609 99 16.3% 318 72 22.6%
Early Childhood
Teacher 3,509 597 17.0% 444 185 41.7%
Early Childhood
Assistant 2,445 522 21.4% 424 167 39.4%
School-Age
Worker 320 45 14.1% 162 33 20.4%
School-Age
Assistant 206 27 13.1% 80 13 16.3%
All Positions 7,588 1,374 18.1% 464 261 56.3%
1Number of centers with one or more staff members of the designated title. 2Number of centers with one or more staff members of the designated title fluent in a non-English language.
3Percentage of centers with one or more staff members of the designated title who are fluent in a non-English
language.
Table should be read: “Of the 376 centers who had administrative directors, 64 or 17.0 percent had an administrative
director who is fluent in a language other than English.”
Note: See Note on Table 5

28
Professional Development
Illinois State Professional Development Programs
Directors were asked about their awareness of and staff awareness of professional development
opportunities and programs available in Illinois. Several programs exist including:
• The Gateways to Opportunity Illinois Professional Development System is recognized for
promoting quality and professionalism for early care and education, school-age, and
youth practitioners.
o The Gateways to Opportunity Registry is available for practitioners to track their
training and professional development.
o Great START (Strategy to Attract and Retain Teachers) is a wage supplement
program that aims to increase child care practitioner retention while encouraging
increased levels of education.
o The Gateways to Opportunity Scholarship Program provides partial funding for
college scholarships for both center and family child care providers in an effort to
increase the educational levels of practitioners, promote increased practitioner
compensation, and improve the consistency of care for children.
o Gateways to Opportunity awards credentials to practitioners in the field of early
care and education, school-age and youth development. The various credentials
that can be earned are the ECE Credential, Infant Toddler Credential (ITC),
Illinois Director Credential (IDC), Family Child Care Credential (FCCC), School-
Age and Youth Development Credential (SAYD), Family Specialist Credential
(FSC), and the Technical Assistance Credential. Achievement of these credentials
is based on educational level, professional development background and work
experience in the field of early care and education.
o The Professional Development Advisor (PDA) Program pairs experienced
mentors with less experienced practitioners to assist the latter in meeting their
professional development goals.
o The Gateways i-learning System is a web-based platform that provides online
training opportunities to early care and education professionals. Online trainings
offered include those required for IDCFS licensing, ExceleRate Illinois, and
Gateways to Opportunity Credentials.
• ExceleRate Illinois is a statewide quality recognition and improvement system (QRIS)
designed to make continuous quality improvement an everyday priority among early
learning providers. The program establishes standards for helping children develop
intellectually, physically, socially, and emotionally.
• Local Child Care Resource and Referral Agencies offer various services for child care
providers, parents and communities. Services for child care providers include technical
assistance, training and consultation from specialists including Quality and Infant
Toddler Specialists, and Mental Health Consultants.
29
Directors’ awareness of the various professional development opportunities are reported below.
• 99.6 percent (n = 460) of the 462 responding centers knew of the Gateways to
Opportunity Registry;
• 91.7 percent (n = 398) of the 434 responding center directors reported knowing of the
Great START Program;
• 93.2 percent (n = 400) of the 429 responding centers reported they had heard of the
Gateways to Opportunity Scholarship Program;
• 96.4 percent (n = 433) of the 449 responding centers had heard of Gateways to
Opportunity Credentials;
• 63.8 percent (n = 252) of the 395 responding center directors reported they had heard of
the Professional Development Advisor Program;
• 94.5 percent (n = 411) of the 435 responding centers knew of the ExceleRate Illinois
Quality Recognition and Improvement System (QRIS);
• 81.9 percent (n = 343) of the 419 responding center directors knew of the
consultants/specialists available through their local Child Care Resource & Referral
agency.
• 93.6 percent (n=410) of the 438 responding center directors knew of the online training
opportunities available through the Gateways i-learning System.
• 57.3 percent (n = 286) of all 499 responding centers had at least one Great START
recipient in the past two years. Those 286 programs had a total of 971 recipients.
• 29.1 percent (n = 145) of all 499 responding centers had at least one Gateways to
Opportunity Scholarship participant for a total of 291 participants.
Some directors provided written feedback about these professional development opportunities.
Below are representative comments.
• “We have our silver circle of excellence for ExceleRate and the requirements for staff are
really tough. Although I think it's a good idea to encourage teachers to further their
educations and I would like to see higher qualified teachers, I don't think it is realistic.
The pay is too low and I can't pay more and still keep the center running.”
• “I believe the increasing demand for higher educational levels is excellent, but parents
are not willing or committed to pay for the increased level of staff qualifications.”
Professional Development Plan
According to IDCFS Center Licensing Standards, center directors are responsible for ensuring
that each child care staff member receives 15 hours of training each year. Programs that are
accredited may have additional requirements beyond the 15 hours of training. A series of
questions were devoted to finding out whether a center had a professional development (PD)
30
plan for staff to meet this requirement, and the modes in which staff received training. The
surveys gathered for this report have indicated that professional development plans have
continued to be part of the directors’ continuous quality improvement. The 2017 report showed
that 79.0 percent of the responding centers has professional development plans, and 67.1 percent
had professional development plans for their staff. This compared to the 78.6 percent and 70.2
percent respectively, in this report. This continues a trend that began with marked increases in
the percent for the 2015 report (the 2013 report showed 71.0 percent of centers had PD plans for
their center and 56.7 had plans for individual staff compared to 80.3 and 67.1 percent
respectively in 2015).
Professional Development Plan for Staff
• 78.6 percent (n = 359) of the 457 directors who responded to the question reported they
have a staff professional development plan for their center.
• 70.2 percent (n = 321) of the 457 directors who responded reported they have an
individual staff professional development plan for their teaching/instruction staff.
• 95.6 percent (n = 439) of the 459 directors who responded to the question reported they
have in-service training opportunities for their instructional staff.
• 86.9 percent (n = 399) of the 459 directors who responded to the question reported they
pay for conference training or registration.
Training Received
Of the 499 directors who responded to the question concerning training in early childhood
education, child development, or health education:
• 63.9 percent (n = 319) reported their staff had received training from a Child Care
Resource and Referral agency;
• 49.3 percent (n = 246) reported their staff had received training from a local community
training; and
• 55.3 percent (n = 276) reported their staff had received training at a professional
association meeting or conference.
• 83.2 percent (n= 415) reported their staff had received training through an online training
source.
Directors were also asked whether they believe there are adequate training opportunities
available to them and their staff. Of the 463 directors who responded, 78.0 percent believe there
are adequate training opportunities available to them and their staff. This is consistent with the
responses from 2017 (79.0 percent) and 2015 (79.2 percent), which was a large increase over the
60.7 percent who had responded favorably to this question in 2013. A possible explanation may
be an increase in the amount of online training that has been made available and/or the use of it.
For example, several new trainings were made available in the past several years through the
Gateways to Opportunity i-learning System.
31
Peer Support
It is the director’s responsibility to ensure center compliance with IDCFS licensing and other
regulations, manage the day-to-day operations of the center, be its overall manager, and deal
with various challenges on a daily basis. To measure the director’s resilience to the nature and
scope of issues inherent in his or her position, directors were queried about their support system
(contact with other child care professionals).
When asked, “Approximately how many other child care professionals in addition to your
immediate staff did you speak to last week?”, 48.4 percent (n = 169) of the 349 responding
directors reported that in the past week they spoke to no more than two additional child care
professionals in addition to their immediate center staff, 25.5 percent (n = 89) reported that they
spoke to between three and five additional child care professionals, and 26.0 percent (n = 91)
reported that they spoke to six or more additional child care professionals.
Directors were also asked to indicate how many other center professionals they know personally,
in addition to their immediate center staff. Of the 416 directors who responded:
• 66.6 percent (n = 277) reported knowing at least six other child care professionals;
• 20.0 percent (n = 83) reported knowing three to five child care professionals; and
• 13.5 percent (n = 56) directors reported knowing two or fewer child care professionals.
Staff Turnover
Turnover Rates
When searching for a quality child care arrangement in a center, parents are advised to ask,
“What is your staff turnover rate?” A consistent, nurturing caregiver is essential to creating a
positive, trusting learning environment for children. That is why a stable workforce is paramount
to providing quality child care. In order to understand the factors that comprise a stable
workforce, questions concerning turnover rate, applicants, and new hires were posed.
Directors were asked to report the number of full-time and part-time staff members who left their
program within the past two years. Temporary, substitute, and seasonal staff were excluded. To
determine the percentage of turnover rate at the center level, the number of centers with staff
exits within the past two years was compared to the number of centers employing staff with the
given position. Staff turnover rates at the center level are presented in Table 8.
32
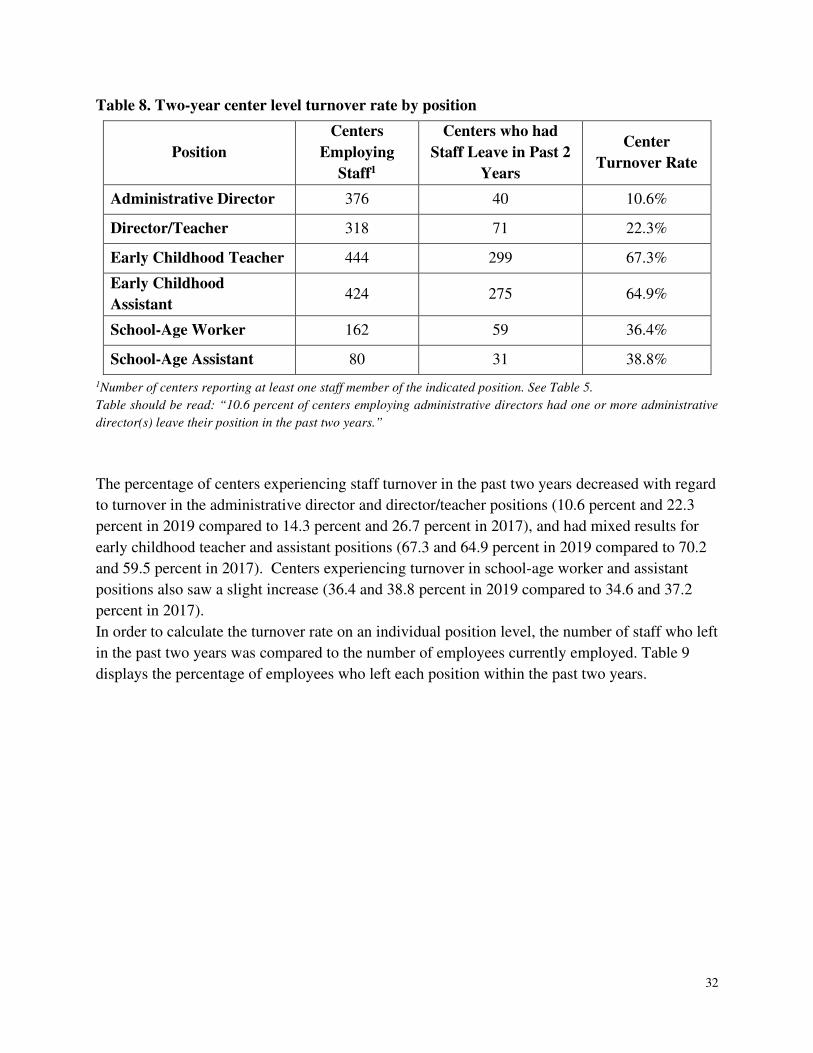
Table 8. Two-year center level turnover rate by position
Position
Centers
Employing
Staff1
Centers who had
Staff Leave in Past 2
Years
Center
Turnover Rate
Administrative Director 376 40 10.6%
Director/Teacher 318 71 22.3%
Early Childhood Teacher 444 299 67.3%
Early Childhood
Assistant 424 275 64.9%
School-Age Worker 162 59 36.4%
School-Age Assistant 80 31 38.8%
1Number of centers reporting at least one staff member of the indicated position. See Table 5.
Table should be read: “10.6 percent of centers employing administrative directors had one or more administrative
director(s) leave their position in the past two years.”
The percentage of centers experiencing staff turnover in the past two years decreased with regard
to turnover in the administrative director and director/teacher positions (10.6 percent and 22.3
percent in 2019 compared to 14.3 percent and 26.7 percent in 2017), and had mixed results for
early childhood teacher and assistant positions (67.3 and 64.9 percent in 2019 compared to 70.2
and 59.5 percent in 2017). Centers experiencing turnover in school-age worker and assistant
positions also saw a slight increase (36.4 and 38.8 percent in 2019 compared to 34.6 and 37.2
percent in 2017).
In order to calculate the turnover rate on an individual position level, the number of staff who left
in the past two years was compared to the number of employees currently employed. Table 9
displays the percentage of employees who left each position within the past two years.
33
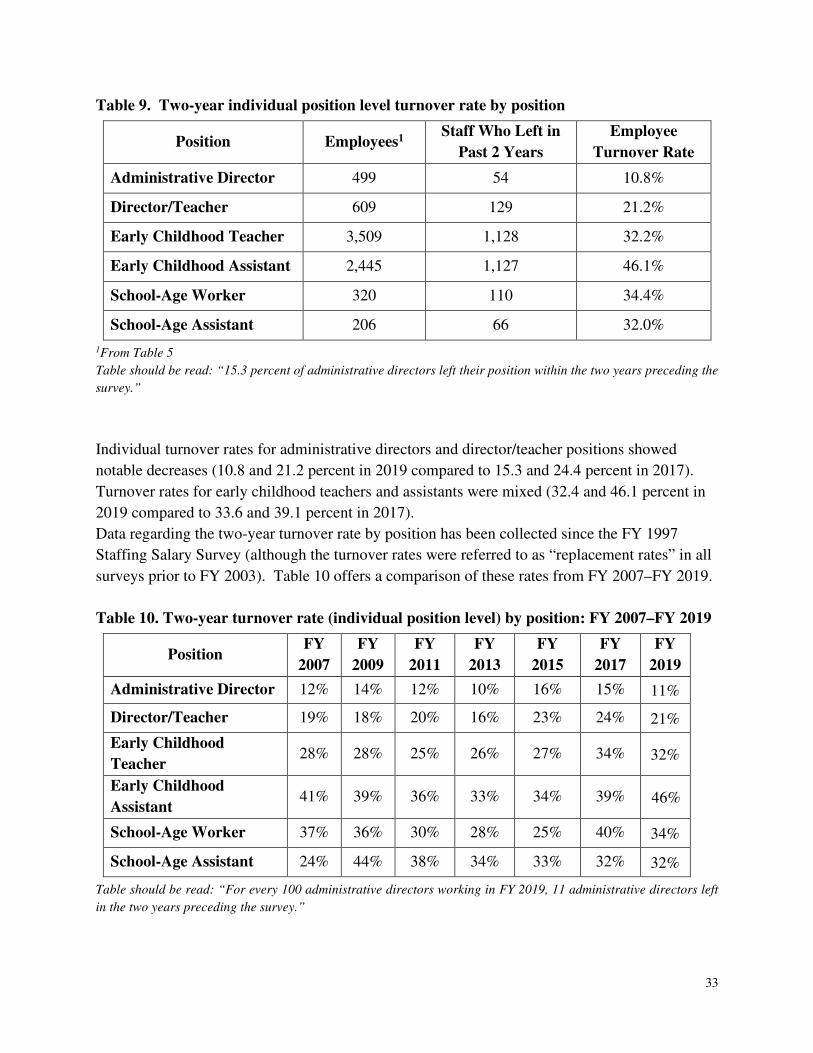
Table 9. Two-year individual position level turnover rate by position
Position Employees1 Staff Who Left in
Past 2 Years
Employee
Turnover Rate
Administrative Director 499 54 10.8%
Director/Teacher 609 129 21.2%
Early Childhood Teacher 3,509 1,128 32.2%
Early Childhood Assistant 2,445 1,127 46.1%
School-Age Worker 320 110 34.4%
School-Age Assistant 206 66 32.0%
1From Table 5
Table should be read: “15.3 percent of administrative directors left their position within the two years preceding the
survey.”
Individual turnover rates for administrative directors and director/teacher positions showed
notable decreases (10.8 and 21.2 percent in 2019 compared to 15.3 and 24.4 percent in 2017).
Turnover rates for early childhood teachers and assistants were mixed (32.4 and 46.1 percent in
2019 compared to 33.6 and 39.1 percent in 2017).
Data regarding the two-year turnover rate by position has been collected since the FY 1997
Staffing Salary Survey (although the turnover rates were referred to as “replacement rates” in all
surveys prior to FY 2003). Table 10 offers a comparison of these rates from FY 2007–FY 2019.
Table 10. Two-year turnover rate (individual position level) by position: FY 2007–FY 2019
Position FY
2007
FY
2009
FY
2011
FY
2013
FY
2015
FY
2017
FY
2019
Administrative Director 12% 14% 12% 10% 16% 15% 11%
Director/Teacher 19% 18% 20% 16% 23% 24% 21%
Early Childhood
Teacher 28% 28% 25% 26% 27% 34% 32%
Early Childhood
Assistant 41% 39% 36% 33% 34% 39% 46%
School-Age Worker 37% 36% 30% 28% 25% 40% 34%
School-Age Assistant 24% 44% 38% 34% 33% 32% 32%
Table should be read: “For every 100 administrative directors working in FY 2019, 11 administrative directors left
in the two years preceding the survey.”
34
Turnover rates have decreased for early childhood teacher positions and increased for early
childhood assistant positions since FY 2017, while turnover rates for other positions remained
largely the same or decreased.
Turnover Reasons
In this survey, we first asked how many staff turned over of their own choice and how many
were terminated. Directors reported that 85.8 percent of staff that left their program in the past
two years did so voluntarily.
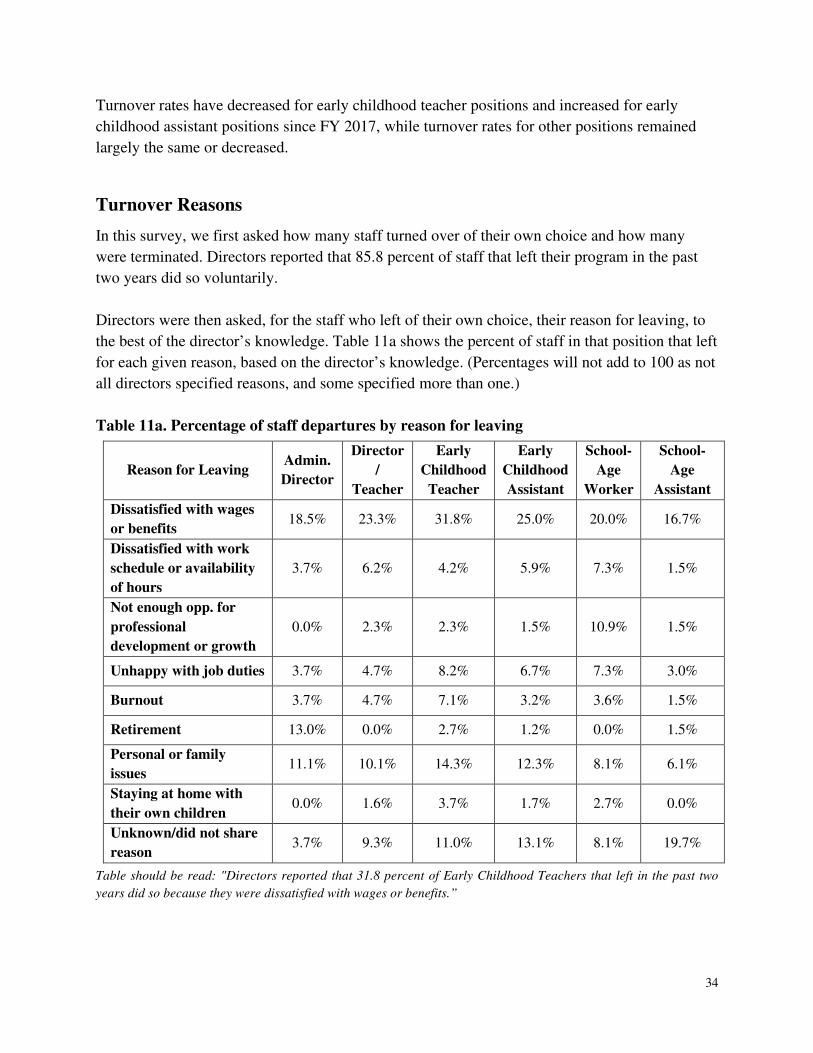
Directors were then asked, for the staff who left of their own choice, their reason for leaving, to
the best of the director’s knowledge. Table 11a shows the percent of staff in that position that left
for each given reason, based on the director’s knowledge. (Percentages will not add to 100 as not
all directors specified reasons, and some specified more than one.)
Table 11a. Percentage of staff departures by reason for leaving
Reason for Leaving Admin.
Director
Director
/
Teacher
Early
Childhood
Teacher
Early
Childhood
Assistant
School-
Age
Worker
School-
Age
Assistant
Dissatisfied with wages
or benefits 18.5% 23.3% 31.8% 25.0% 20.0% 16.7%
Dissatisfied with work
schedule or availability
of hours
3.7% 6.2% 4.2% 5.9% 7.3% 1.5%
Not enough opp. for
professional
development or growth
0.0% 2.3% 2.3% 1.5% 10.9% 1.5%
Unhappy with job duties 3.7% 4.7% 8.2% 6.7% 7.3% 3.0%
Burnout 3.7% 4.7% 7.1% 3.2% 3.6% 1.5%
Retirement 13.0% 0.0% 2.7% 1.2% 0.0% 1.5%
Personal or family
issues 11.1% 10.1% 14.3% 12.3% 8.1% 6.1%
Staying at home with
their own children 0.0% 1.6% 3.7% 1.7% 2.7% 0.0%
Unknown/did not share
reason 3.7% 9.3% 11.0% 13.1% 8.1% 19.7%
Table should be read: "Directors reported that 31.8 percent of Early Childhood Teachers that left in the past two
years did so because they were dissatisfied with wages or benefits.”
35
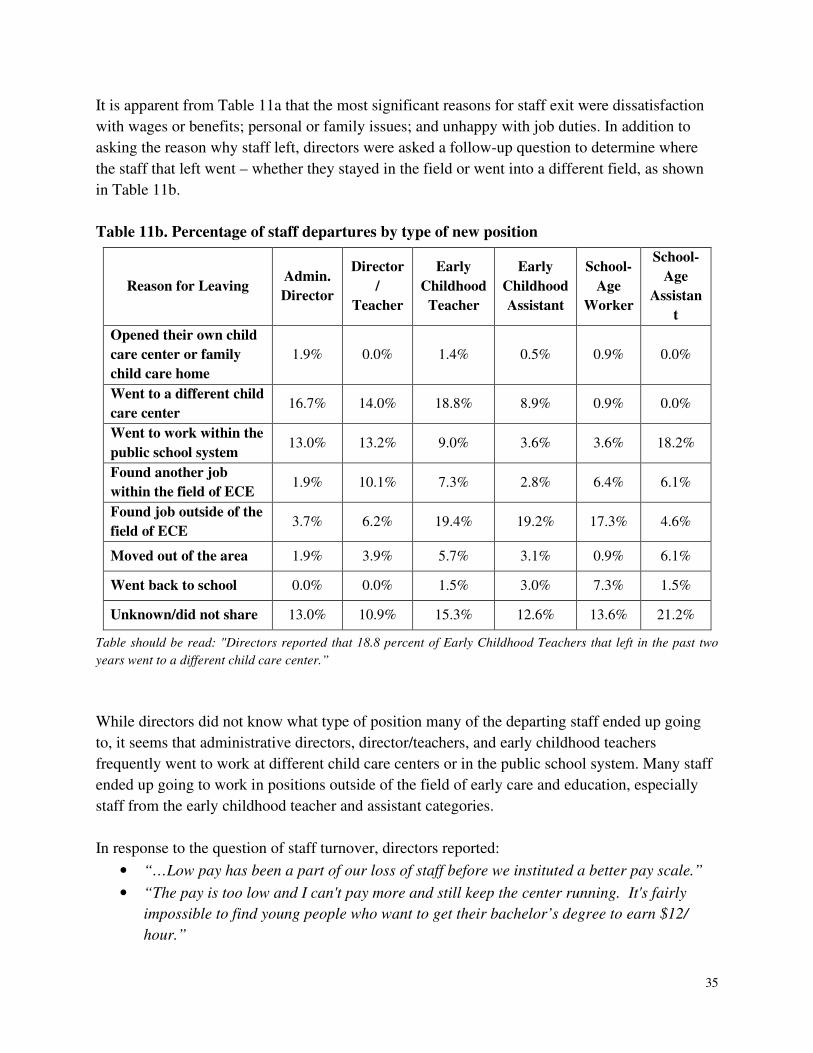
It is apparent from Table 11a that the most significant reasons for staff exit were dissatisfaction
with wages or benefits; personal or family issues; and unhappy with job duties. In addition to
asking the reason why staff left, directors were asked a follow-up question to determine where
the staff that left went – whether they stayed in the field or went into a different field, as shown
in Table 11b.
Table 11b. Percentage of staff departures by type of new position
Reason for Leaving Admin.
Director
Director
/
Teacher
Early
Childhood
Teacher
Early
Childhood
Assistant
School-
Age
Worker
School-
Age
Assistan
t
Opened their own child
care center or family
child care home
1.9% 0.0% 1.4% 0.5% 0.9% 0.0%
Went to a different child
care center 16.7% 14.0% 18.8% 8.9% 0.9% 0.0%
Went to work within the
public school system 13.0% 13.2% 9.0% 3.6% 3.6% 18.2%
Found another job
within the field of ECE 1.9% 10.1% 7.3% 2.8% 6.4% 6.1%
Found job outside of the
field of ECE 3.7% 6.2% 19.4% 19.2% 17.3% 4.6%
Moved out of the area 1.9% 3.9% 5.7% 3.1% 0.9% 6.1%
Went back to school 0.0% 0.0% 1.5% 3.0% 7.3% 1.5%
Unknown/did not share 13.0% 10.9% 15.3% 12.6% 13.6% 21.2%
Table should be read: "Directors reported that 18.8 percent of Early Childhood Teachers that left in the past two
years went to a different child care center.”
While directors did not know what type of position many of the departing staff ended up going
to, it seems that administrative directors, director/teachers, and early childhood teachers
frequently went to work at different child care centers or in the public school system. Many staff
ended up going to work in positions outside of the field of early care and education, especially
staff from the early childhood teacher and assistant categories.
In response to the question of staff turnover, directors reported:
• “…Low pay has been a part of our loss of staff before we instituted a better pay scale.”
• “The pay is too low and I can't pay more and still keep the center running. It's fairly
impossible to find young people who want to get their bachelor’s degree to earn $12/
hour.”
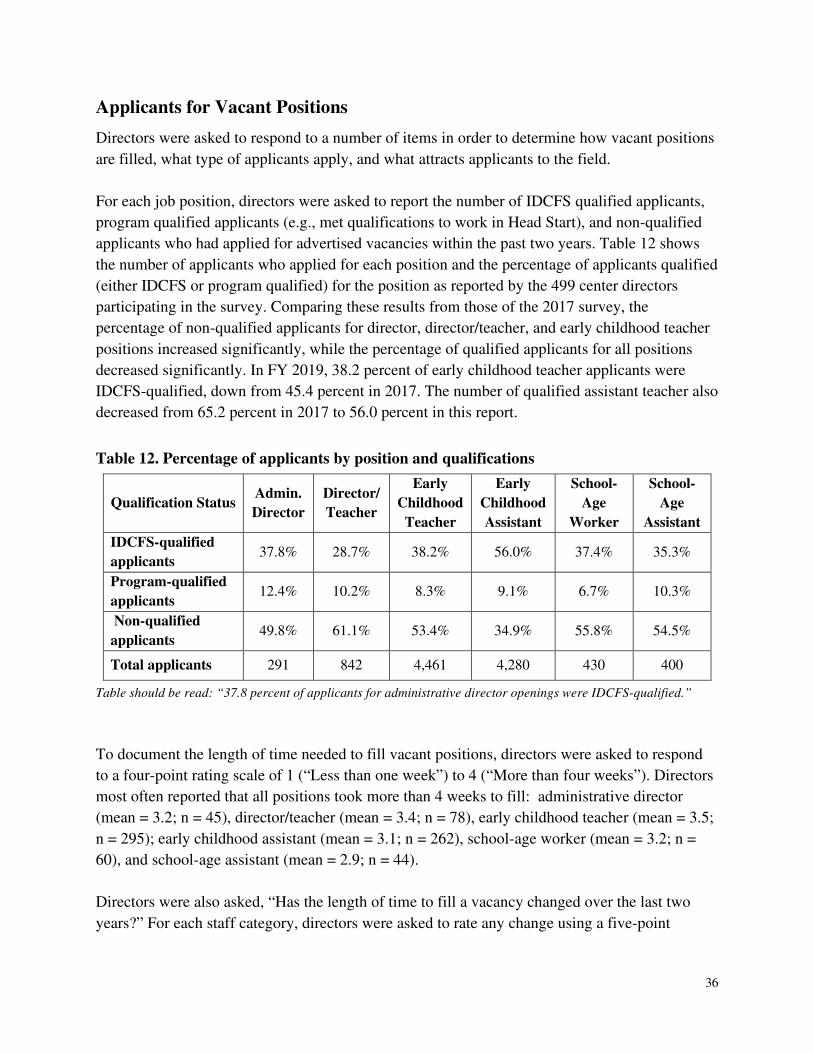
36
Applicants for Vacant Positions
Directors were asked to respond to a number of items in order to determine how vacant positions
are filled, what type of applicants apply, and what attracts applicants to the field.
For each job position, directors were asked to report the number of IDCFS qualified applicants,
program qualified applicants (e.g., met qualifications to work in Head Start), and non-qualified
applicants who had applied for advertised vacancies within the past two years. Table 12 shows
the number of applicants who applied for each position and the percentage of applicants qualified
(either IDCFS or program qualified) for the position as reported by the 499 center directors
participating in the survey. Comparing these results from those of the 2017 survey, the
percentage of non-qualified applicants for director, director/teacher, and early childhood teacher
positions increased significantly, while the percentage of qualified applicants for all positions
decreased significantly. In FY 2019, 38.2 percent of early childhood teacher applicants were
IDCFS-qualified, down from 45.4 percent in 2017. The number of qualified assistant teacher also
decreased from 65.2 percent in 2017 to 56.0 percent in this report.
Table 12. Percentage of applicants by position and qualifications
Qualification Status Admin.
Director
Director/
Teacher
Early
Childhood
Teacher
Early
Childhood
Assistant
School-
Age
Worker
School-
Age
Assistant
IDCFS-qualified
applicants 37.8% 28.7% 38.2% 56.0% 37.4% 35.3%
Program-qualified
applicants 12.4% 10.2% 8.3% 9.1% 6.7% 10.3%
Non-qualified
applicants 49.8% 61.1% 53.4% 34.9% 55.8% 54.5%
Total applicants 291 842 4,461 4,280 430 400
Table should be read: “37.8 percent of applicants for administrative director openings were IDCFS-qualified.”
To document the length of time needed to fill vacant positions, directors were asked to respond
to a four-point rating scale of 1 (“Less than one week”) to 4 (“More than four weeks”). Directors
most often reported that all positions took more than 4 weeks to fill: administrative director
(mean = 3.2; n = 45), director/teacher (mean = 3.4; n = 78), early childhood teacher (mean = 3.5;
n = 295); early childhood assistant (mean = 3.1; n = 262), school-age worker (mean = 3.2; n =
60), and school-age assistant (mean = 2.9; n = 44).
Directors were also asked, “Has the length of time to fill a vacancy changed over the last two
years?” For each staff category, directors were asked to rate any change using a five-point
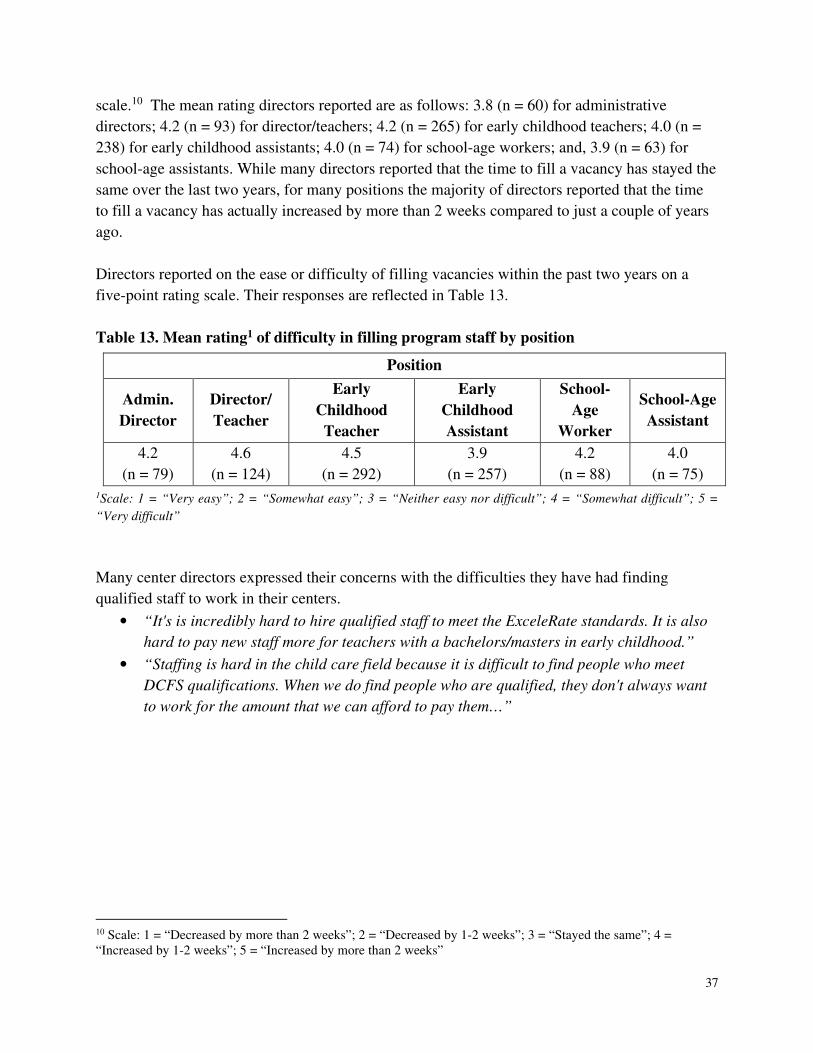
37
scale.10 The mean rating directors reported are as follows: 3.8 (n = 60) for administrative
directors; 4.2 (n = 93) for director/teachers; 4.2 (n = 265) for early childhood teachers; 4.0 (n =
238) for early childhood assistants; 4.0 (n = 74) for school-age workers; and, 3.9 (n = 63) for
school-age assistants. While many directors reported that the time to fill a vacancy has stayed the
same over the last two years, for many positions the majority of directors reported that the time
to fill a vacancy has actually increased by more than 2 weeks compared to just a couple of years
ago.
Directors reported on the ease or difficulty of filling vacancies within the past two years on a
five-point rating scale. Their responses are reflected in Table 13.
Table 13. Mean rating1 of difficulty in filling program staff by position
Position
Admin.
Director
Director/
Teacher
Early
Childhood
Teacher
Early
Childhood
Assistant
School-
Age
Worker
School-Age
Assistant
4.2
(n = 79)
4.6
(n = 124)
4.5
(n = 292)
3.9
(n = 257)
4.2
(n = 88)
4.0
(n = 75) 1Scale: 1 = “Very easy”; 2 = “Somewhat easy”; 3 = “Neither easy nor difficult”; 4 = “Somewhat difficult”; 5 =
“Very difficult”
Many center directors expressed their concerns with the difficulties they have had finding
qualified staff to work in their centers.
• “It's is incredibly hard to hire qualified staff to meet the ExceleRate standards. It is also
hard to pay new staff more for teachers with a bachelors/masters in early childhood.”
• “Staffing is hard in the child care field because it is difficult to find people who meet
DCFS qualifications. When we do find people who are qualified, they don't always want
to work for the amount that we can afford to pay them…”
10 Scale: 1 = “Decreased by more than 2 weeks”; 2 = “Decreased by 1-2 weeks”; 3 = “Stayed the same”; 4 = “Increased by 1-2 weeks”; 5 = “Increased by more than 2 weeks”
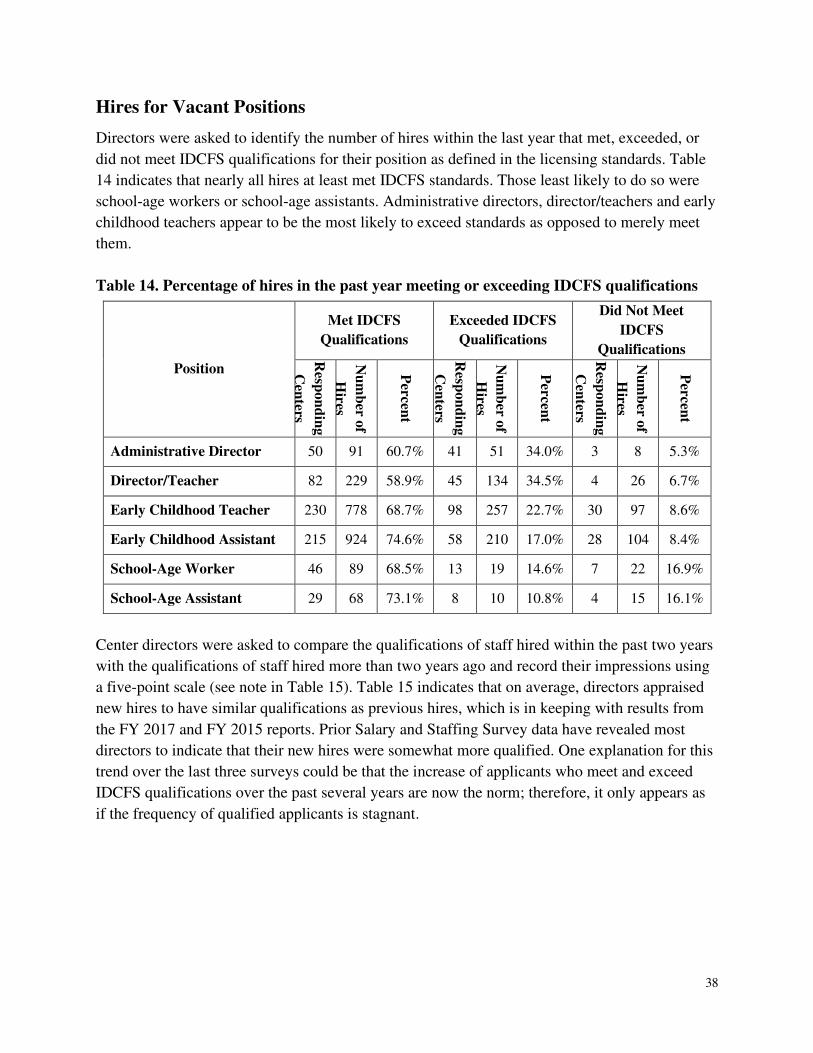
38
Hires for Vacant Positions
Directors were asked to identify the number of hires within the last year that met, exceeded, or
did not meet IDCFS qualifications for their position as defined in the licensing standards. Table
14 indicates that nearly all hires at least met IDCFS standards. Those least likely to do so were
school-age workers or school-age assistants. Administrative directors, director/teachers and early
childhood teachers appear to be the most likely to exceed standards as opposed to merely meet
them.
Table 14. Percentage of hires in the past year meeting or exceeding IDCFS qualifications
Position
Met IDCFS
Qualifications
Exceeded IDCFS
Qualifications
Did Not Meet
IDCFS
Qualifications
Resp
on
din
g
Cen
ters
Nu
mb
er of
Hires
Percen
t
Resp
on
din
g
Cen
ters
Nu
mb
er of
Hires
Percen
t
Resp
on
din
g
Cen
ters
Nu
mb
er of
Hires
Percen
t
Administrative Director 50 91 60.7% 41 51 34.0% 3 8 5.3%
Director/Teacher 82 229 58.9% 45 134 34.5% 4 26 6.7%
Early Childhood Teacher 230 778 68.7% 98 257 22.7% 30 97 8.6%
Early Childhood Assistant 215 924 74.6% 58 210 17.0% 28 104 8.4%
School-Age Worker 46 89 68.5% 13 19 14.6% 7 22 16.9%
School-Age Assistant 29 68 73.1% 8 10 10.8% 4 15 16.1%
Center directors were asked to compare the qualifications of staff hired within the past two years
with the qualifications of staff hired more than two years ago and record their impressions using
a five-point scale (see note in Table 15). Table 15 indicates that on average, directors appraised
new hires to have similar qualifications as previous hires, which is in keeping with results from
the FY 2017 and FY 2015 reports. Prior Salary and Staffing Survey data have revealed most
directors to indicate that their new hires were somewhat more qualified. One explanation for this
trend over the last three surveys could be that the increase of applicants who meet and exceed
IDCFS qualifications over the past several years are now the norm; therefore, it only appears as
if the frequency of qualified applicants is stagnant.
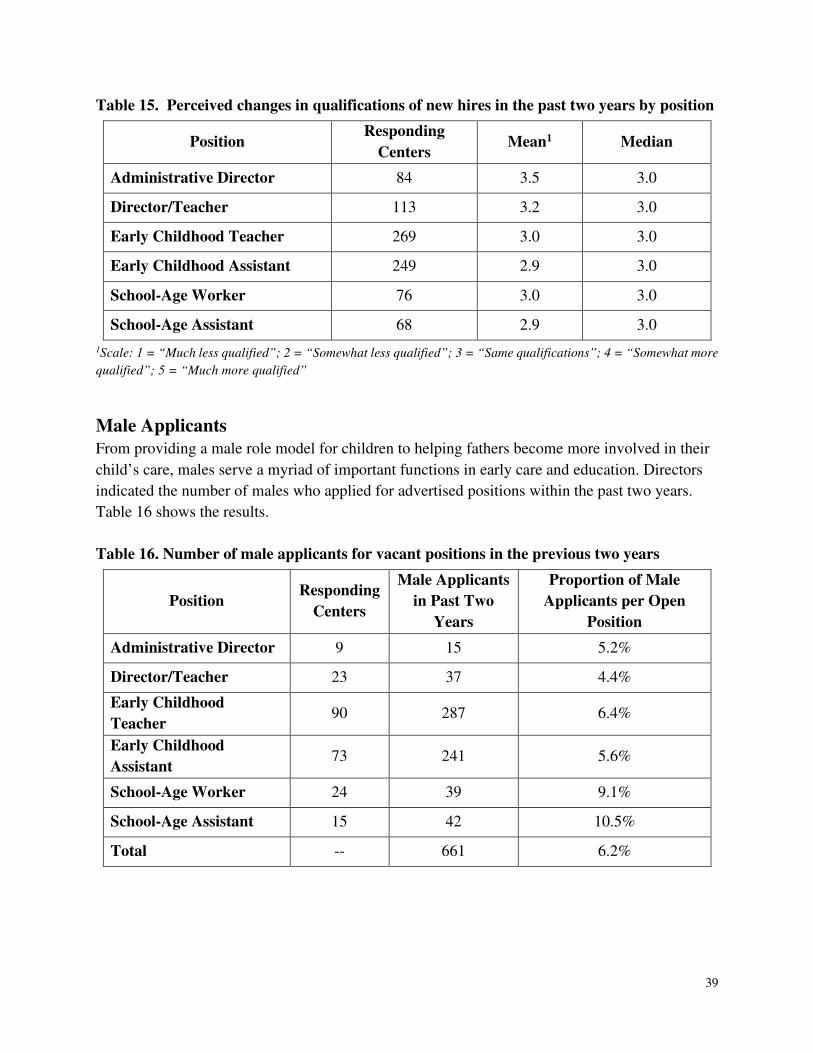
39
Table 15. Perceived changes in qualifications of new hires in the past two years by position
Position Responding
Centers Mean1 Median
Administrative Director 84 3.5 3.0
Director/Teacher 113 3.2 3.0
Early Childhood Teacher 269 3.0 3.0
Early Childhood Assistant 249 2.9 3.0
School-Age Worker 76 3.0 3.0
School-Age Assistant 68 2.9 3.0
1Scale: 1 = “Much less qualified”; 2 = “Somewhat less qualified”; 3 = “Same qualifications”; 4 = “Somewhat more
qualified”; 5 = “Much more qualified”
Male Applicants
From providing a male role model for children to helping fathers become more involved in their
child’s care, males serve a myriad of important functions in early care and education. Directors
indicated the number of males who applied for advertised positions within the past two years.
Table 16 shows the results.
Table 16. Number of male applicants for vacant positions in the previous two years
Position Responding
Centers
Male Applicants
in Past Two
Years
Proportion of Male
Applicants per Open
Position
Administrative Director 9 15 5.2%
Director/Teacher 23 37 4.4%
Early Childhood
Teacher 90 287 6.4%
Early Childhood
Assistant 73 241 5.6%
School-Age Worker 24 39 9.1%
School-Age Assistant 15 42 10.5%
Total -- 661 6.2%
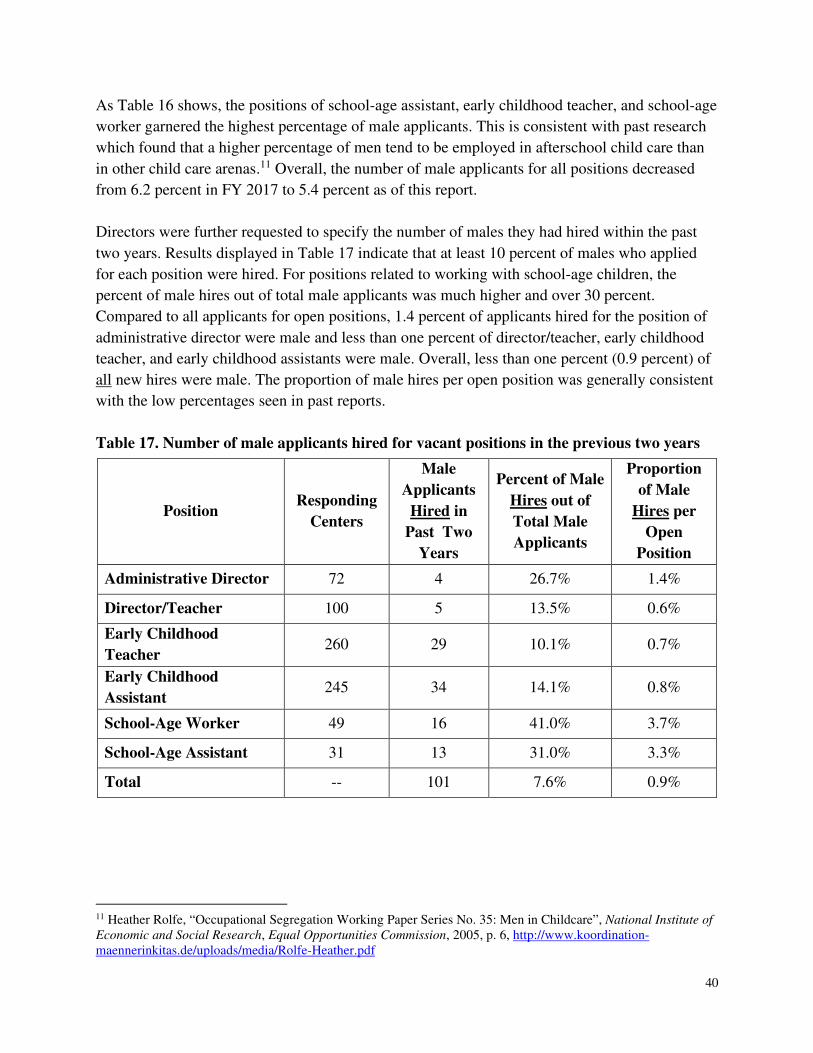
40
As Table 16 shows, the positions of school-age assistant, early childhood teacher, and school-age
worker garnered the highest percentage of male applicants. This is consistent with past research
which found that a higher percentage of men tend to be employed in afterschool child care than
in other child care arenas.11 Overall, the number of male applicants for all positions decreased
from 6.2 percent in FY 2017 to 5.4 percent as of this report.
Directors were further requested to specify the number of males they had hired within the past
two years. Results displayed in Table 17 indicate that at least 10 percent of males who applied
for each position were hired. For positions related to working with school-age children, the
percent of male hires out of total male applicants was much higher and over 30 percent.
Compared to all applicants for open positions, 1.4 percent of applicants hired for the position of
administrative director were male and less than one percent of director/teacher, early childhood
teacher, and early childhood assistants were male. Overall, less than one percent (0.9 percent) of
all new hires were male. The proportion of male hires per open position was generally consistent
with the low percentages seen in past reports.
Table 17. Number of male applicants hired for vacant positions in the previous two years
Position Responding
Centers
Male
Applicants
Hired in
Past Two
Years
Percent of Male
Hires out of
Total Male
Applicants
Proportion
of Male
Hires per
Open
Position
Administrative Director 72 4 26.7% 1.4%
Director/Teacher 100 5 13.5% 0.6%
Early Childhood
Teacher 260 29 10.1% 0.7%
Early Childhood
Assistant 245 34 14.1% 0.8%
School-Age Worker 49 16 41.0% 3.7%
School-Age Assistant 31 13 31.0% 3.3%
Total -- 101 7.6% 0.9%
11 Heather Rolfe, “Occupational Segregation Working Paper Series No. 35: Men in Childcare”, National Institute of Economic and Social Research, Equal Opportunities Commission, 2005, p. 6, http://www.koordination-maennerinkitas.de/uploads/media/Rolfe-Heather.pdf

41
Non-English Fluency of Applicants
As expressed previously in this report, the diversity of languages spoken by children in child care
centers suggests that centers have staff with which children can effectively communicate in their
primary language. Directors were asked to identify primary language information for applicants
and hired employees in the past two years, and the results are displayed in Table 18. More than
90 percent of the non-English fluent applicants applied for the position of early childhood
teacher or assistant. The proportion of applicants fluent in other languages was higher across all
roles than in the FY 2017 report.
Table 18. Number of applicants fluent in a language other than English who applied for
vacant positions in the previous two years
Position Responding
Centers
Applicants Fluent
in Other Language
in Past 2 Years
Proportion of
Applicants Fluent in
Other Language in
Past 2 Years
Administrative Director 122 14 4.8%
Director/Teacher 129 34 4.0%
Early Childhood Teacher 194 251 5.6%
Early Childhood Assistant 175 500 11.7%
School-Age Worker 113 12 2.8%
School-Age Assistant 107 30 7.5%
Total -- 841 7.9%
Directors also identified the languages spoken by primarily non-English speaking applicants:
• 108 reported applicants who were fluent in Spanish
• 15 directors reported applicants who were fluent in Polish
• 13 directors reported applicants who were fluent in Hindi/Urdu
• 12 directors reported applicants who were fluent in Chinese dialect
• 11 directors reported applicants who were fluent in Arabic
• 11 directors reported applicants who were fluent in Russian
• Less than ten directors reported applicants who were fluent in the following languages:
Korean, Vietnamese, Japanese, German, Farsi, French, Hebrew, and Other.
Directors were then asked to indicate how many applicants fluent in a non-English language that
had been hired as shown in Table 19. The percent of applicants fluent in other languages that
were hired increased from the 35.0 percent reported in FY 2017 to 40.3 percent in this report,
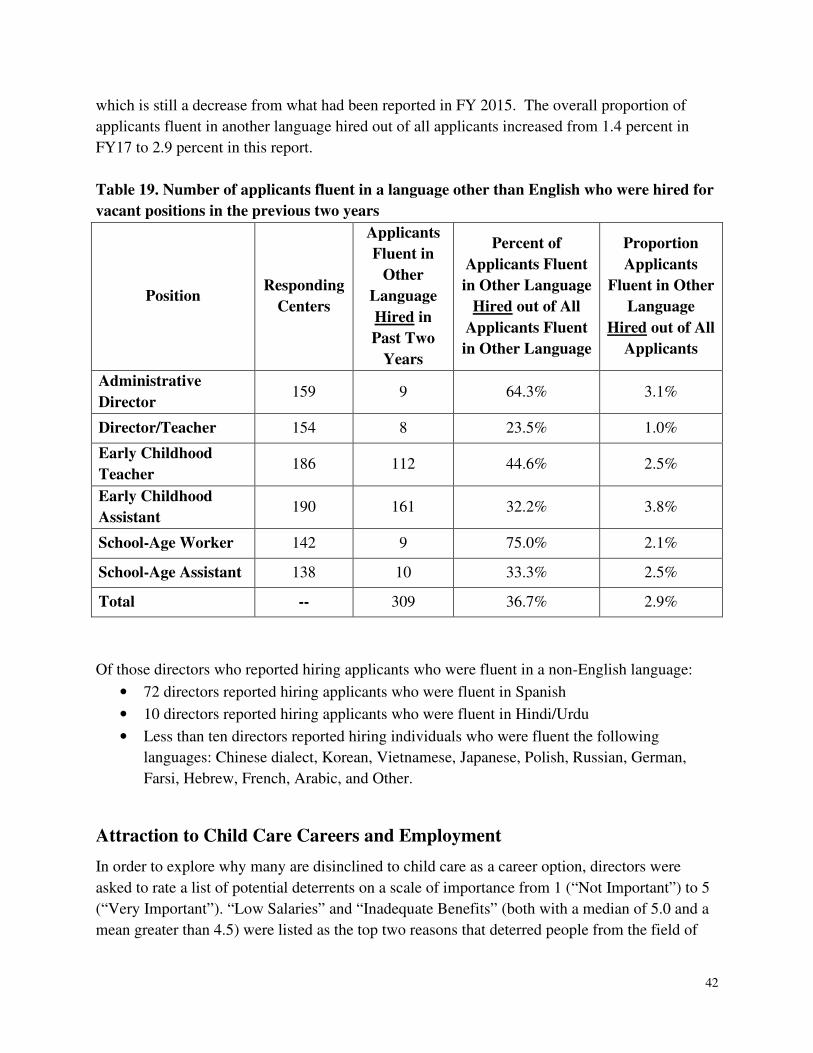
42
which is still a decrease from what had been reported in FY 2015. The overall proportion of
applicants fluent in another language hired out of all applicants increased from 1.4 percent in
FY17 to 2.9 percent in this report.
Table 19. Number of applicants fluent in a language other than English who were hired for
vacant positions in the previous two years
Position Responding
Centers
Applicants
Fluent in
Other
Language
Hired in
Past Two
Years
Percent of
Applicants Fluent
in Other Language
Hired out of All
Applicants Fluent
in Other Language
Proportion
Applicants
Fluent in Other
Language
Hired out of All
Applicants
Administrative
Director 159 9 64.3% 3.1%
Director/Teacher 154 8 23.5% 1.0%
Early Childhood
Teacher 186 112 44.6% 2.5%
Early Childhood
Assistant 190 161 32.2% 3.8%
School-Age Worker 142 9 75.0% 2.1%
School-Age Assistant 138 10 33.3% 2.5%
Total -- 309 36.7% 2.9%
Of those directors who reported hiring applicants who were fluent in a non-English language:
• 72 directors reported hiring applicants who were fluent in Spanish
• 10 directors reported hiring applicants who were fluent in Hindi/Urdu
• Less than ten directors reported hiring individuals who were fluent the following
languages: Chinese dialect, Korean, Vietnamese, Japanese, Polish, Russian, German,
Farsi, Hebrew, French, Arabic, and Other.
Attraction to Child Care Careers and Employment
In order to explore why many are disinclined to child care as a career option, directors were
asked to rate a list of potential deterrents on a scale of importance from 1 (“Not Important”) to 5
(“Very Important”). “Low Salaries” and “Inadequate Benefits” (both with a median of 5.0 and a
mean greater than 4.5) were listed as the top two reasons that deterred people from the field of
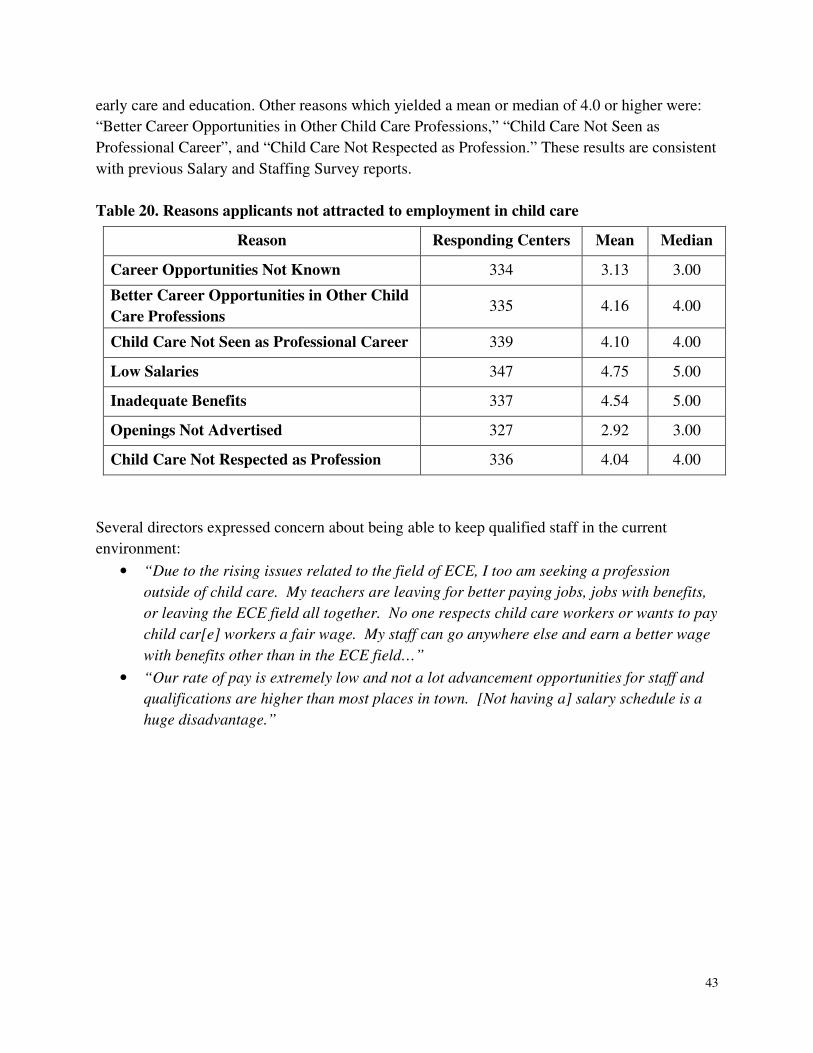
43
early care and education. Other reasons which yielded a mean or median of 4.0 or higher were:
“Better Career Opportunities in Other Child Care Professions,” “Child Care Not Seen as
Professional Career”, and “Child Care Not Respected as Profession.” These results are consistent
with previous Salary and Staffing Survey reports.
Table 20. Reasons applicants not attracted to employment in child care
Reason Responding Centers Mean Median
Career Opportunities Not Known 334 3.13 3.00
Better Career Opportunities in Other Child
Care Professions 335 4.16 4.00
Child Care Not Seen as Professional Career 339 4.10 4.00
Low Salaries 347 4.75 5.00
Inadequate Benefits 337 4.54 5.00
Openings Not Advertised 327 2.92 3.00
Child Care Not Respected as Profession 336 4.04 4.00
Several directors expressed concern about being able to keep qualified staff in the current
environment:
• “Due to the rising issues related to the field of ECE, I too am seeking a profession
outside of child care. My teachers are leaving for better paying jobs, jobs with benefits,
or leaving the ECE field all together. No one respects child care workers or wants to pay
child car[e] workers a fair wage. My staff can go anywhere else and earn a better wage
with benefits other than in the ECE field…”
• “Our rate of pay is extremely low and not a lot advancement opportunities for staff and
qualifications are higher than most places in town. [Not having a] salary schedule is a
huge disadvantage.”
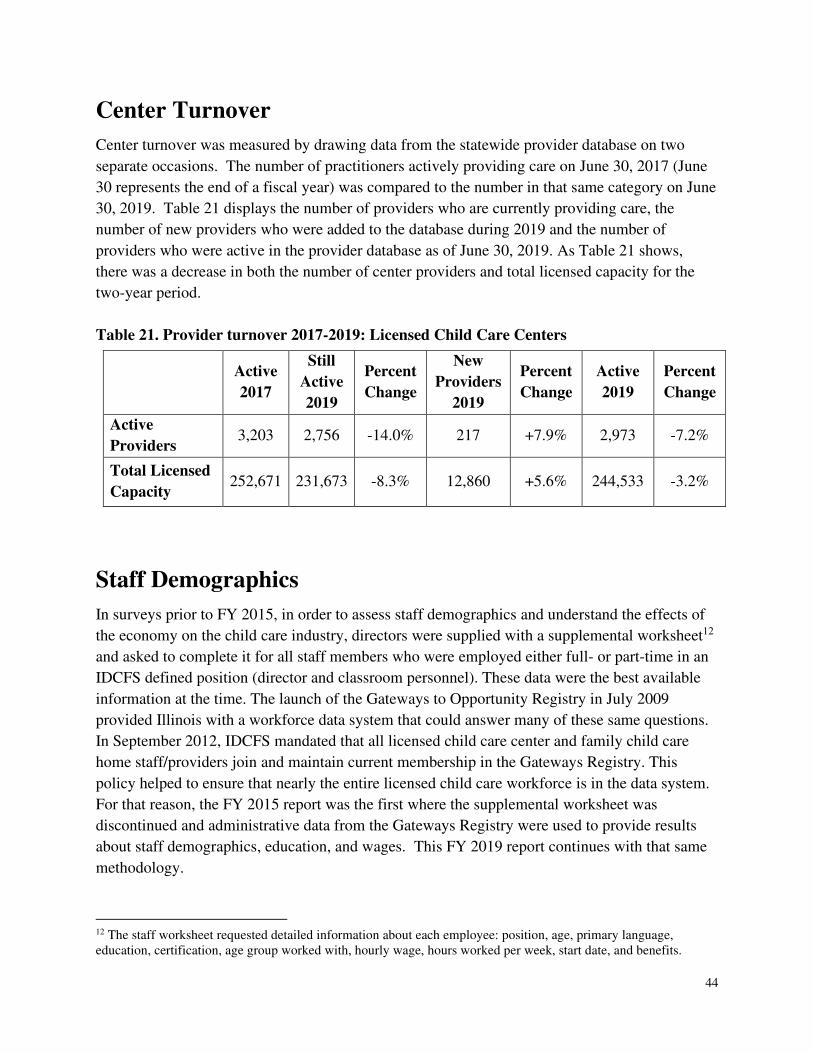
44
Center Turnover
Center turnover was measured by drawing data from the statewide provider database on two
separate occasions. The number of practitioners actively providing care on June 30, 2017 (June
30 represents the end of a fiscal year) was compared to the number in that same category on June
30, 2019. Table 21 displays the number of providers who are currently providing care, the
number of new providers who were added to the database during 2019 and the number of
providers who were active in the provider database as of June 30, 2019. As Table 21 shows,
there was a decrease in both the number of center providers and total licensed capacity for the
two-year period.
Table 21. Provider turnover 2017-2019: Licensed Child Care Centers
Active
2017
Still
Active
2019
Percent
Change
New
Providers
2019
Percent
Change
Active
2019
Percent
Change
Active
Providers 3,203 2,756 -14.0% 217 +7.9% 2,973 -7.2%
Total Licensed
Capacity 252,671 231,673 -8.3% 12,860 +5.6% 244,533 -3.2%
Staff Demographics
In surveys prior to FY 2015, in order to assess staff demographics and understand the effects of
the economy on the child care industry, directors were supplied with a supplemental worksheet12
and asked to complete it for all staff members who were employed either full- or part-time in an
IDCFS defined position (director and classroom personnel). These data were the best available
information at the time. The launch of the Gateways to Opportunity Registry in July 2009
provided Illinois with a workforce data system that could answer many of these same questions.
In September 2012, IDCFS mandated that all licensed child care center and family child care
home staff/providers join and maintain current membership in the Gateways Registry. This
policy helped to ensure that nearly the entire licensed child care workforce is in the data system.
For that reason, the FY 2015 report was the first where the supplemental worksheet was
discontinued and administrative data from the Gateways Registry were used to provide results
about staff demographics, education, and wages. This FY 2019 report continues with that same
methodology.
12 The staff worksheet requested detailed information about each employee: position, age, primary language, education, certification, age group worked with, hourly wage, hours worked per week, start date, and benefits.
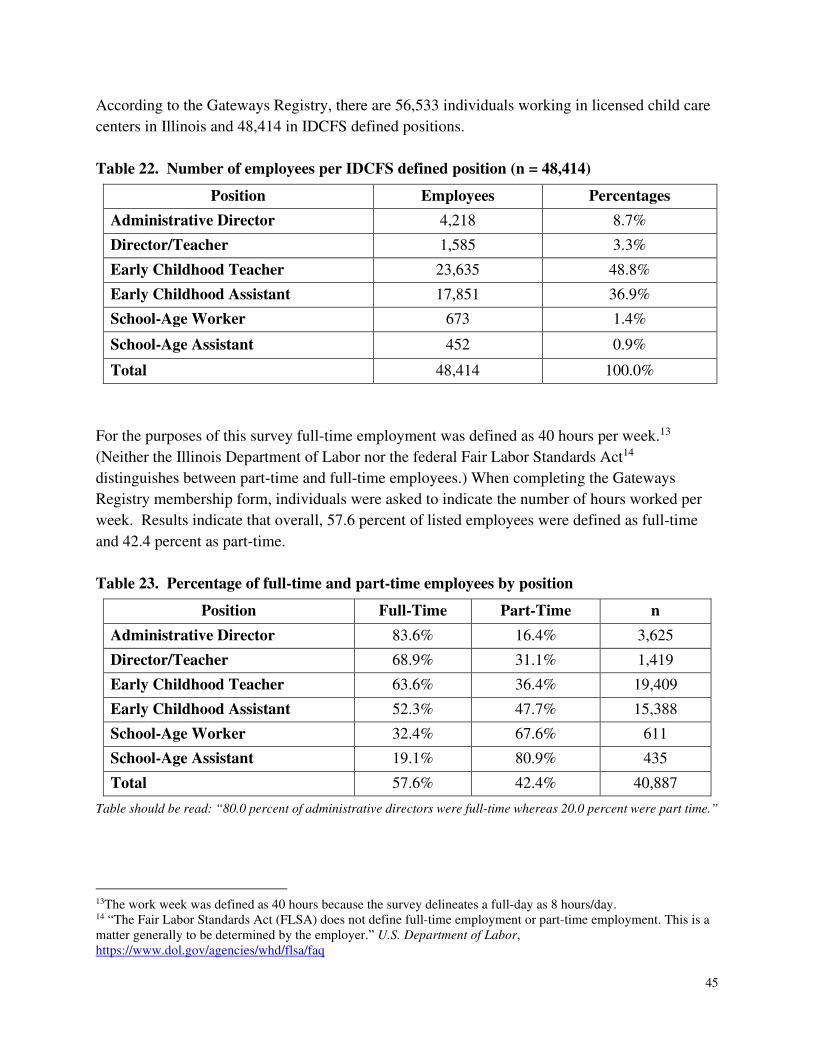
45
According to the Gateways Registry, there are 56,533 individuals working in licensed child care
centers in Illinois and 48,414 in IDCFS defined positions.
Table 22. Number of employees per IDCFS defined position (n = 48,414)
Position Employees Percentages
Administrative Director 4,218 8.7%
Director/Teacher 1,585 3.3%
Early Childhood Teacher 23,635 48.8%
Early Childhood Assistant 17,851 36.9%
School-Age Worker 673 1.4%
School-Age Assistant 452 0.9%
Total 48,414 100.0%
For the purposes of this survey full-time employment was defined as 40 hours per week.13
(Neither the Illinois Department of Labor nor the federal Fair Labor Standards Act14
distinguishes between part-time and full-time employees.) When completing the Gateways
Registry membership form, individuals were asked to indicate the number of hours worked per
week. Results indicate that overall, 57.6 percent of listed employees were defined as full-time
and 42.4 percent as part-time.
Table 23. Percentage of full-time and part-time employees by position
Position Full-Time Part-Time n
Administrative Director 83.6% 16.4% 3,625
Director/Teacher 68.9% 31.1% 1,419
Early Childhood Teacher 63.6% 36.4% 19,409
Early Childhood Assistant 52.3% 47.7% 15,388
School-Age Worker 32.4% 67.6% 611
School-Age Assistant 19.1% 80.9% 435
Total 57.6% 42.4% 40,887
Table should be read: “80.0 percent of administrative directors were full-time whereas 20.0 percent were part time.”
13The work week was defined as 40 hours because the survey delineates a full-day as 8 hours/day. 14 “The Fair Labor Standards Act (FLSA) does not define full-time employment or part-time employment. This is a matter generally to be determined by the employer.” U.S. Department of Labor, https://www.dol.gov/agencies/whd/flsa/faq
46
Education and Credentials
Individuals report their educational achievements in the Gateways Registry and can update their
record as they gain more education. In addition, they can also report credentials and certifications
they have earned, such as the Professional Educator License (PEL) with an early childhood
endorsement.15 The educational requirements necessary to be director or teacher-qualified (see
Appendix C) are stipulated in the IDCFS licensing standards for day care centers. In summary,
directors can qualify through 60 semester hours of coursework from an accredited college or
university [18 semester hours must be directly related to child care (ECE) or child development
(CD)], or can qualify through a combination of education and work experience. Similarly, early
childhood teachers can either complete 60 hours of coursework from an accredited college or
university (six semester hours must be directly related to ECE or CD) or qualify through a
combination of education and work experience. Directors of school-age programs and school-age
workers are required to have coursework directly related to school-age child care, child
development, elementary education, physical education, recreation, camping, or other related
fields.
Table 24 shows that over 85 percent of all directors attained some level of college education. A
large percent (67.6 percent) had earned their bachelor or master’s degree, which are educational
milestones that exceed IDCFS licensing standards. Nearly 80 percent of early childhood teachers
attained some level of college education; moreover, 19.5 percent had achieved an associate
degree and 48.4 percent a bachelor’s degree or higher (which also exceeds licensing standards
for that position). Of early childhood teachers with a bachelor’s degree or higher, 7.4 percent
reported having a Professional Educator License (PEL) with an early childhood endorsement.
More than one quarter of early childhood teachers (27.1 percent) had earned a degree in early
childhood education or child development (ECE/CD)16. 35.4 percent of early childhood
assistants and 24.1 percent of school-age assistants had received education beyond a high school
or GED degree.
There are also a number of Gateways to Opportunity Credentials that may be earned by
individuals working in the field of ECE, as shown in Table 25. These credentials recognize the
education, experience, and professional contributions of early childhood practitioners. Gateways
Credentials are also a key component of ExceleRate Illinois, the state’s Quality Recognition and
Improvement System (QRIS). The ExceleRate Circles of Quality, above the Licensed Circle,
require that a percentage of personnel have achieved a Gateways Credential.
15 Known previously as a Type 04 (early childhood) teaching certificate, the PEL with an early childhood endorsement is granted by the Illinois State Board of Education to educators who have earned a BA degree in early childhood and passed all state exams and requirements to teach in a publicly funded program serving children birth through age eight. 16 This figure is likely under-reported as records that did not have a major listed were coded as “other” for purposes of this analysis.
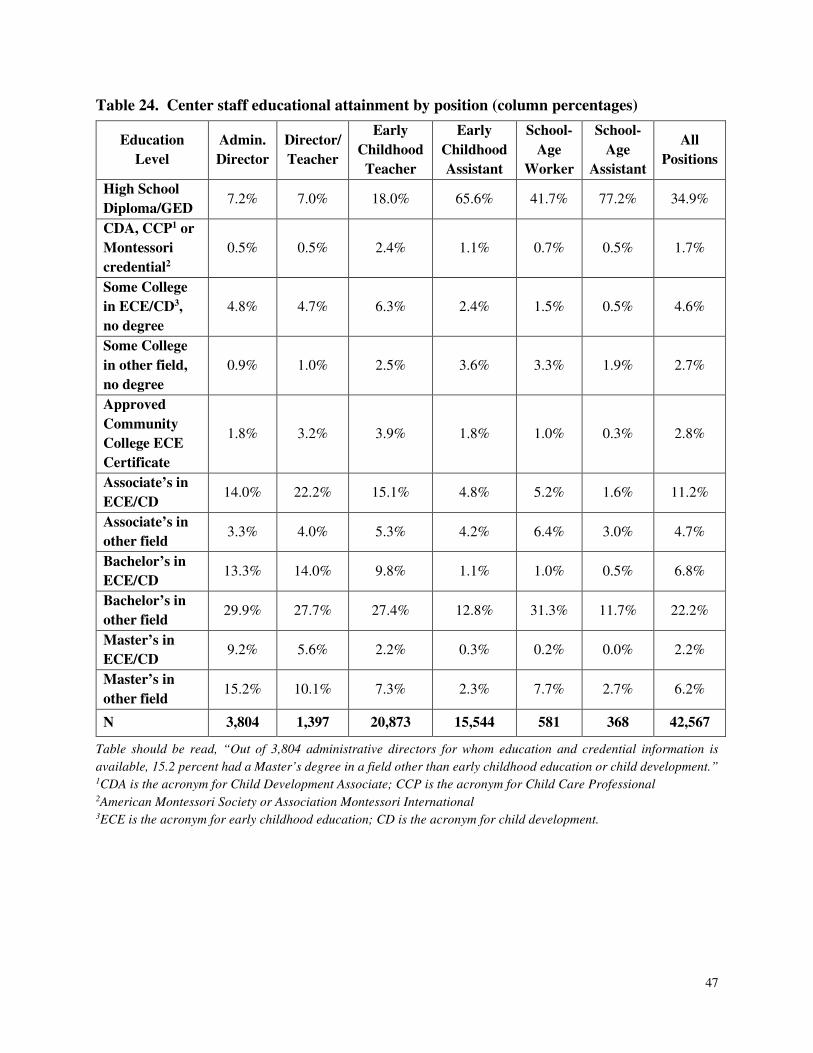
47
Table 24. Center staff educational attainment by position (column percentages)
Education
Level
Admin.
Director
Director/
Teacher
Early
Childhood
Teacher
Early
Childhood
Assistant
School-
Age
Worker
School-
Age
Assistant
All
Positions
High School
Diploma/GED 7.2% 7.0% 18.0% 65.6% 41.7% 77.2% 34.9%
CDA, CCP1 or
Montessori
credential2
0.5% 0.5% 2.4% 1.1% 0.7% 0.5% 1.7%
Some College
in ECE/CD3,
no degree
4.8% 4.7% 6.3% 2.4% 1.5% 0.5% 4.6%
Some College
in other field,
no degree
0.9% 1.0% 2.5% 3.6% 3.3% 1.9% 2.7%
Approved
Community
College ECE
Certificate
1.8% 3.2% 3.9% 1.8% 1.0% 0.3% 2.8%
Associate’s in
ECE/CD 14.0% 22.2% 15.1% 4.8% 5.2% 1.6% 11.2%
Associate’s in
other field 3.3% 4.0% 5.3% 4.2% 6.4% 3.0% 4.7%
Bachelor’s in
ECE/CD 13.3% 14.0% 9.8% 1.1% 1.0% 0.5% 6.8%
Bachelor’s in
other field 29.9% 27.7% 27.4% 12.8% 31.3% 11.7% 22.2%
Master’s in
ECE/CD 9.2% 5.6% 2.2% 0.3% 0.2% 0.0% 2.2%
Master’s in
other field 15.2% 10.1% 7.3% 2.3% 7.7% 2.7% 6.2%
N 3,804 1,397 20,873 15,544 581 368 42,567
Table should be read, “Out of 3,804 administrative directors for whom education and credential information is
available, 15.2 percent had a Master’s degree in a field other than early childhood education or child development.” 1CDA is the acronym for Child Development Associate; CCP is the acronym for Child Care Professional 2American Montessori Society or Association Montessori International 3ECE is the acronym for early childhood education; CD is the acronym for child development.
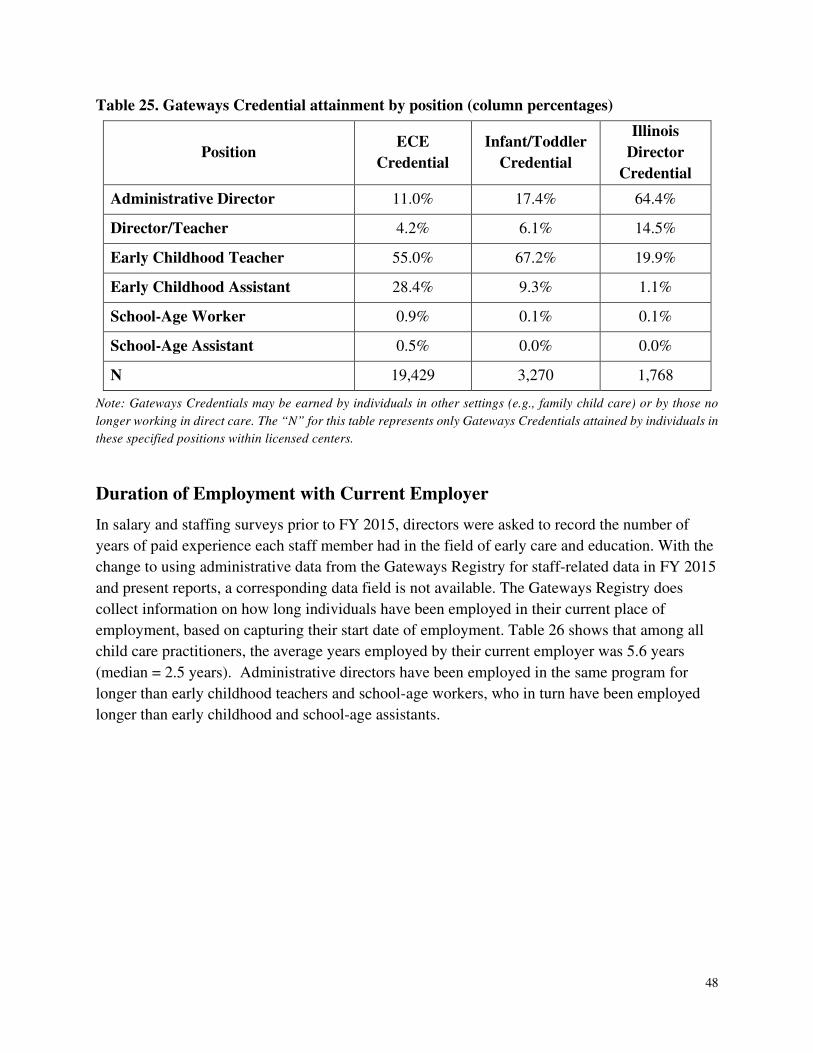
48
Table 25. Gateways Credential attainment by position (column percentages)
Position ECE
Credential
Infant/Toddler
Credential
Illinois
Director
Credential
Administrative Director 11.0% 17.4% 64.4%
Director/Teacher 4.2% 6.1% 14.5%
Early Childhood Teacher 55.0% 67.2% 19.9%
Early Childhood Assistant 28.4% 9.3% 1.1%
School-Age Worker 0.9% 0.1% 0.1%
School-Age Assistant 0.5% 0.0% 0.0%
N 19,429 3,270 1,768
Note: Gateways Credentials may be earned by individuals in other settings (e.g., family child care) or by those no
longer working in direct care. The “N” for this table represents only Gateways Credentials attained by individuals in
these specified positions within licensed centers.
Duration of Employment with Current Employer
In salary and staffing surveys prior to FY 2015, directors were asked to record the number of
years of paid experience each staff member had in the field of early care and education. With the
change to using administrative data from the Gateways Registry for staff-related data in FY 2015
and present reports, a corresponding data field is not available. The Gateways Registry does
collect information on how long individuals have been employed in their current place of
employment, based on capturing their start date of employment. Table 26 shows that among all
child care practitioners, the average years employed by their current employer was 5.6 years
(median = 2.5 years). Administrative directors have been employed in the same program for
longer than early childhood teachers and school-age workers, who in turn have been employed
longer than early childhood and school-age assistants.
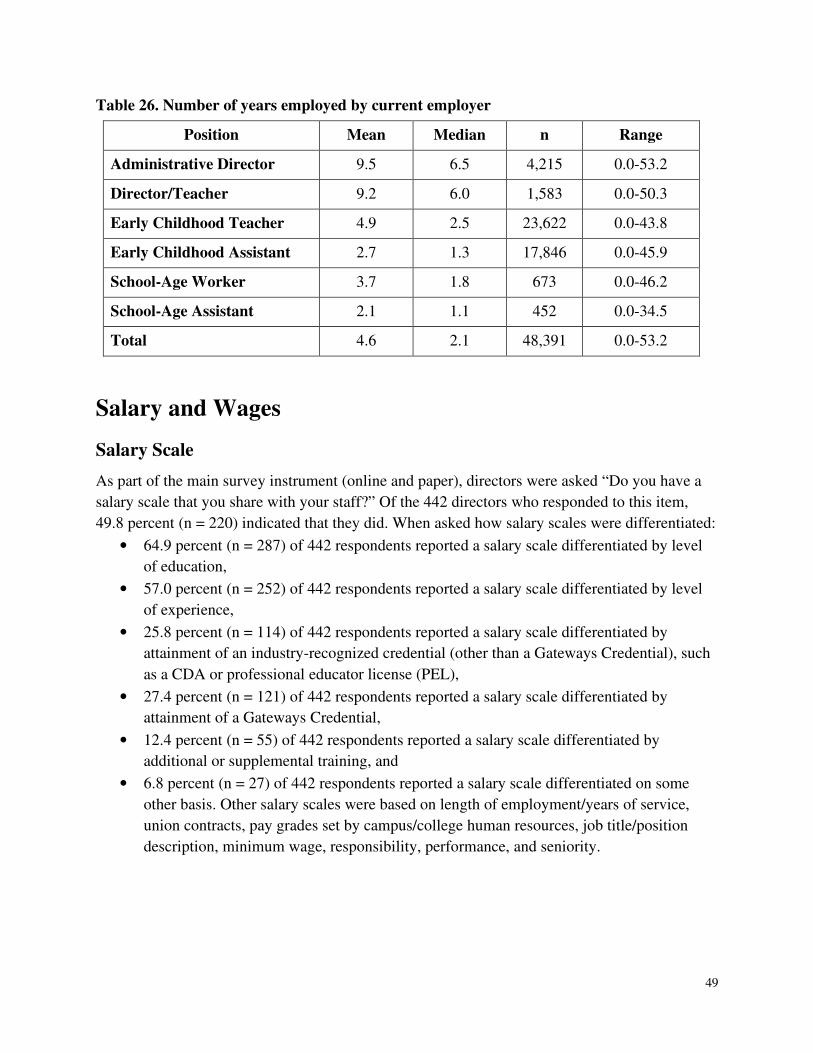
49
Table 26. Number of years employed by current employer
Position Mean Median n Range
Administrative Director 9.5 6.5 4,215 0.0-53.2
Director/Teacher 9.2 6.0 1,583 0.0-50.3
Early Childhood Teacher 4.9 2.5 23,622 0.0-43.8
Early Childhood Assistant 2.7 1.3 17,846 0.0-45.9
School-Age Worker 3.7 1.8 673 0.0-46.2
School-Age Assistant 2.1 1.1 452 0.0-34.5
Total 4.6 2.1 48,391 0.0-53.2
Salary and Wages
Salary Scale
As part of the main survey instrument (online and paper), directors were asked “Do you have a
salary scale that you share with your staff?” Of the 442 directors who responded to this item,
49.8 percent (n = 220) indicated that they did. When asked how salary scales were differentiated:
• 64.9 percent (n = 287) of 442 respondents reported a salary scale differentiated by level
of education,
• 57.0 percent (n = 252) of 442 respondents reported a salary scale differentiated by level
of experience,
• 25.8 percent (n = 114) of 442 respondents reported a salary scale differentiated by
attainment of an industry-recognized credential (other than a Gateways Credential), such
as a CDA or professional educator license (PEL),
• 27.4 percent (n = 121) of 442 respondents reported a salary scale differentiated by
attainment of a Gateways Credential,
• 12.4 percent (n = 55) of 442 respondents reported a salary scale differentiated by
additional or supplemental training, and
• 6.8 percent (n = 27) of 442 respondents reported a salary scale differentiated on some
other basis. Other salary scales were based on length of employment/years of service,
union contracts, pay grades set by campus/college human resources, job title/position
description, minimum wage, responsibility, performance, and seniority.
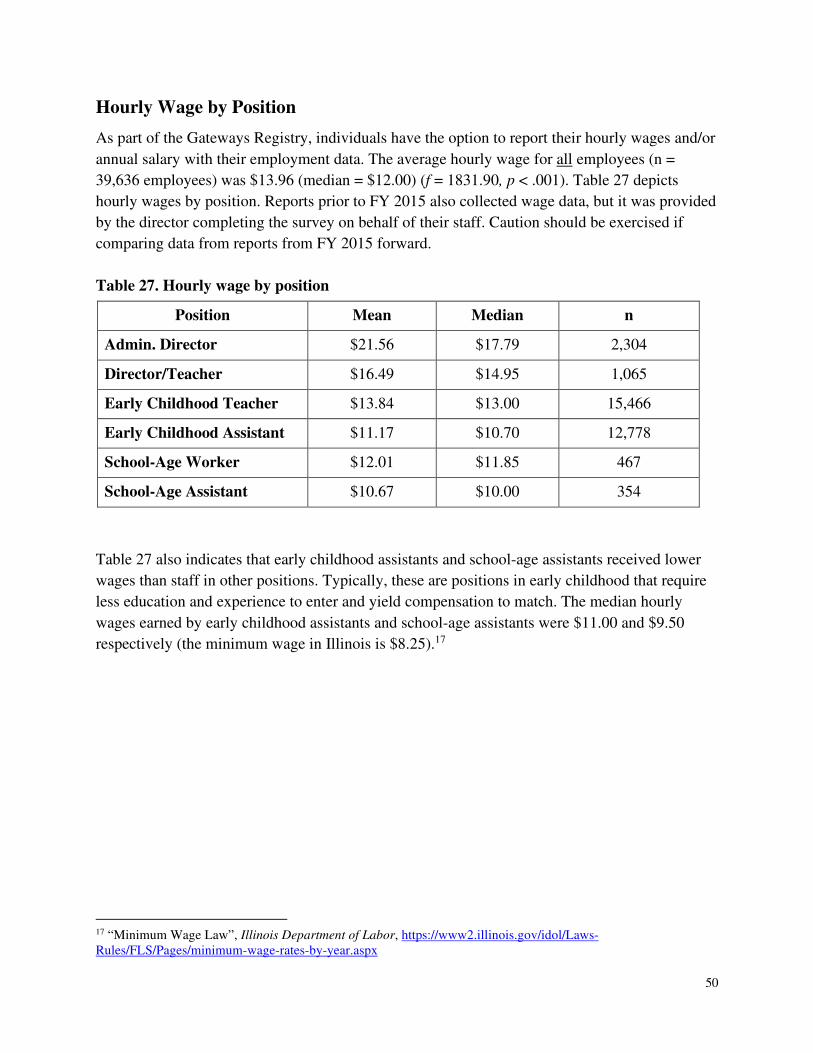
50
Hourly Wage by Position
As part of the Gateways Registry, individuals have the option to report their hourly wages and/or
annual salary with their employment data. The average hourly wage for all employees (n =
39,636 employees) was $13.96 (median = $12.00) (f = 1831.90, p < .001). Table 27 depicts
hourly wages by position. Reports prior to FY 2015 also collected wage data, but it was provided
by the director completing the survey on behalf of their staff. Caution should be exercised if
comparing data from reports from FY 2015 forward.
Table 27. Hourly wage by position
Position Mean Median n
Admin. Director $21.56 $17.79 2,304
Director/Teacher $16.49 $14.95 1,065
Early Childhood Teacher $13.84 $13.00 15,466
Early Childhood Assistant $11.17 $10.70 12,778
School-Age Worker $12.01 $11.85 467
School-Age Assistant $10.67 $10.00 354
Table 27 also indicates that early childhood assistants and school-age assistants received lower
wages than staff in other positions. Typically, these are positions in early childhood that require
less education and experience to enter and yield compensation to match. The median hourly
wages earned by early childhood assistants and school-age assistants were $11.00 and $9.50
respectively (the minimum wage in Illinois is $8.25).17
17 “Minimum Wage Law”, Illinois Department of Labor, https://www2.illinois.gov/idol/Laws-Rules/FLS/Pages/minimum-wage-rates-by-year.aspx
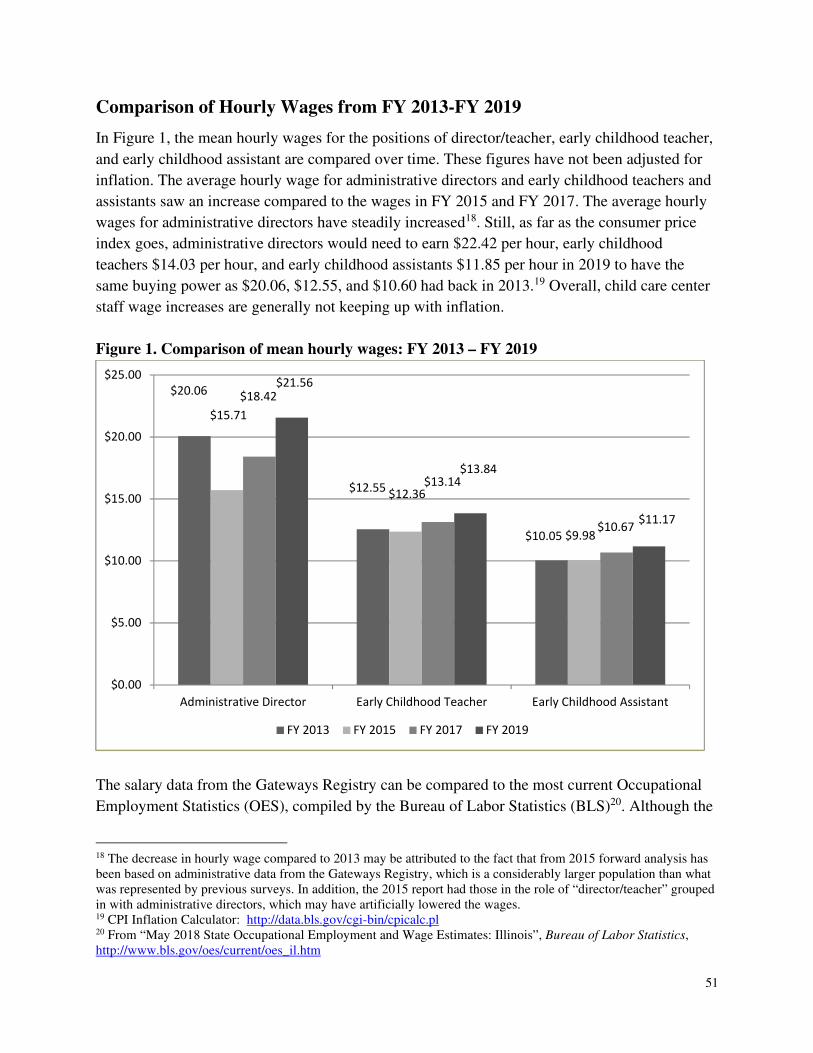
51
Comparison of Hourly Wages from FY 2013-FY 2019
In Figure 1, the mean hourly wages for the positions of director/teacher, early childhood teacher,
and early childhood assistant are compared over time. These figures have not been adjusted for
inflation. The average hourly wage for administrative directors and early childhood teachers and
assistants saw an increase compared to the wages in FY 2015 and FY 2017. The average hourly
wages for administrative directors have steadily increased18. Still, as far as the consumer price
index goes, administrative directors would need to earn $22.42 per hour, early childhood
teachers $14.03 per hour, and early childhood assistants $11.85 per hour in 2019 to have the
same buying power as $20.06, $12.55, and $10.60 had back in 2013.19 Overall, child care center
staff wage increases are generally not keeping up with inflation.
Figure 1. Comparison of mean hourly wages: FY 2013 – FY 2019
The salary data from the Gateways Registry can be compared to the most current Occupational
Employment Statistics (OES), compiled by the Bureau of Labor Statistics (BLS)20. Although the
18 The decrease in hourly wage compared to 2013 may be attributed to the fact that from 2015 forward analysis has been based on administrative data from the Gateways Registry, which is a considerably larger population than what was represented by previous surveys. In addition, the 2015 report had those in the role of “director/teacher” grouped in with administrative directors, which may have artificially lowered the wages. 19 CPI Inflation Calculator: http://data.bls.gov/cgi-bin/cpicalc.pl 20 From “May 2018 State Occupational Employment and Wage Estimates: Illinois”, Bureau of Labor Statistics, http://www.bls.gov/oes/current/oes_il.htm
$20.06
$12.55
$10.05
$15.71
$12.36
$9.98
$18.42
$13.14
$10.67
$21.56
$13.84
$11.17
$0.00
$5.00
$10.00
$15.00
$20.00
$25.00
Administrative Director Early Childhood Teacher Early Childhood Assistant
FY 2013 FY 2015 FY 2017 FY 2019
52
data may not be strictly comparable, the national figures provide some context for interpreting
the hourly wage of child care personnel in Illinois.
Three categories are primarily used by the BLS to include various child care positions. The
categories are listed below, along with the descriptions provided on the BLS website. The mean
and median hourly wages specified by the BSL are also included, followed in parenthesis by the
mean and median hourly wages from Table 27.
Category 1 (11-9031): Education Administrators, Preschool and Child Care
Center/Program. Description of position: “Plan, direct, or coordinate the academic and
non-academic activities of preschool and child care centers or programs.” As of May
2018, the mean hourly wage for this position was $27.67 and the median was $23.55
(mean = $21.56; median = $17.79).
Category 2 (25-2011): Preschool Teachers, Except Special Education. Description of
position: “Instruct preschool-aged children in activities designated to promote social,
physical, and intellectual growth needed for primary school in preschool, day care center,
or other child development facility.” As of May 2018, the mean hourly wage for a
preschool teacher was $15.14 and the median was $13.99 (mean = $13.84; median =
$13.00).
Depending on the responsibilities of an assistant teacher, the position could fall under either the
BLS category of Teacher Assistants or Child Care Workers.
Category 3 (25-9041): Teacher Assistants. Description of position: “Perform duties that
are instructional in nature… and serve in a position for which a teacher has ultimate
responsibility for the design and implementation of educational programs and services.”
As of May 2018, the mean hourly wage for an assistant teacher was $13.32.21
Category 4 (39-9011): Child Care Workers. Description of position: “Attend to children
at schools, businesses, private households, and child care institutions. Perform a variety
of tasks, such as dressing, feeding, bathing, and overseeing play.” As of May 2018, the
mean hourly wage for a child care worker was $11.66 and the median was $10.76 (mean
= $11.17; median = $10.70).
21 The annual mean wage listed in BLS was used to derive the hourly mean wage for Teacher Assistants. Comparison of median hourly wages are not available.
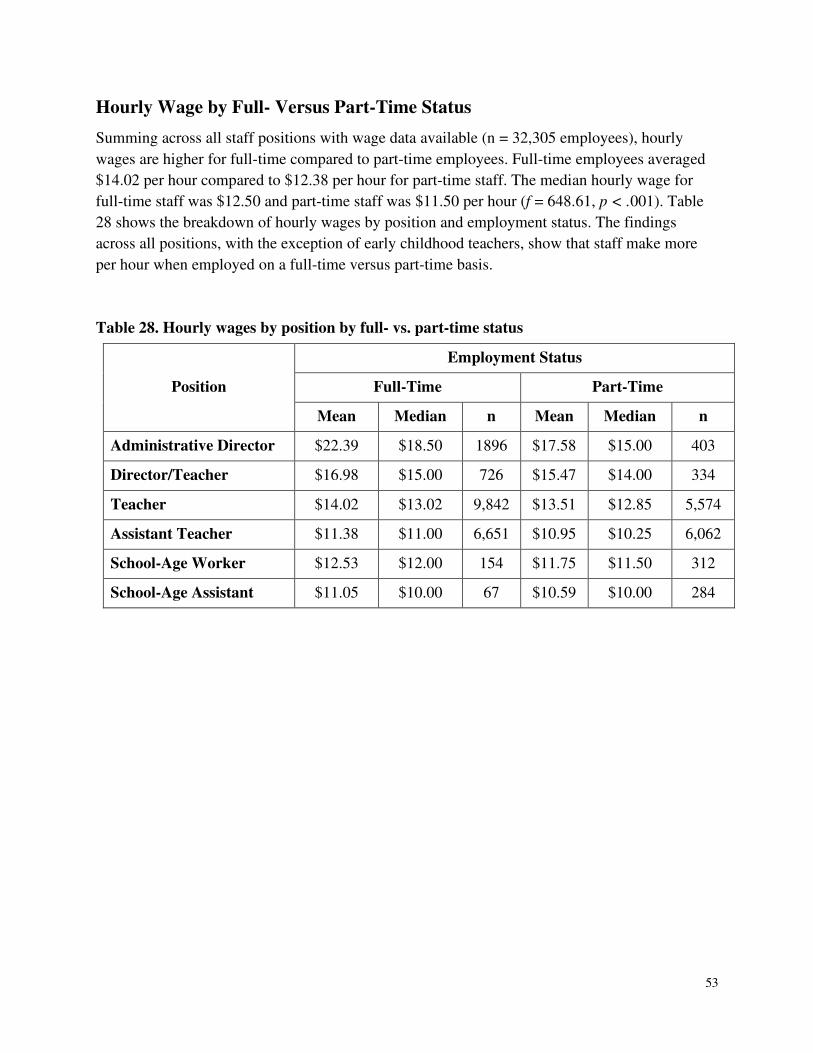
53
Hourly Wage by Full- Versus Part-Time Status
Summing across all staff positions with wage data available (n = 32,305 employees), hourly
wages are higher for full-time compared to part-time employees. Full-time employees averaged
$14.02 per hour compared to $12.38 per hour for part-time staff. The median hourly wage for
full-time staff was $12.50 and part-time staff was $11.50 per hour (f = 648.61, p < .001). Table
28 shows the breakdown of hourly wages by position and employment status. The findings
across all positions, with the exception of early childhood teachers, show that staff make more
per hour when employed on a full-time versus part-time basis.
Table 28. Hourly wages by position by full- vs. part-time status
Position
Employment Status
Full-Time Part-Time
Mean Median n Mean Median n
Administrative Director $22.39 $18.50 1896 $17.58 $15.00 403
Director/Teacher $16.98 $15.00 726 $15.47 $14.00 334
Teacher $14.02 $13.02 9,842 $13.51 $12.85 5,574
Assistant Teacher $11.38 $11.00 6,651 $10.95 $10.25 6,062
School-Age Worker $12.53 $12.00 154 $11.75 $11.50 312
School-Age Assistant $11.05 $10.00 67 $10.59 $10.00 284
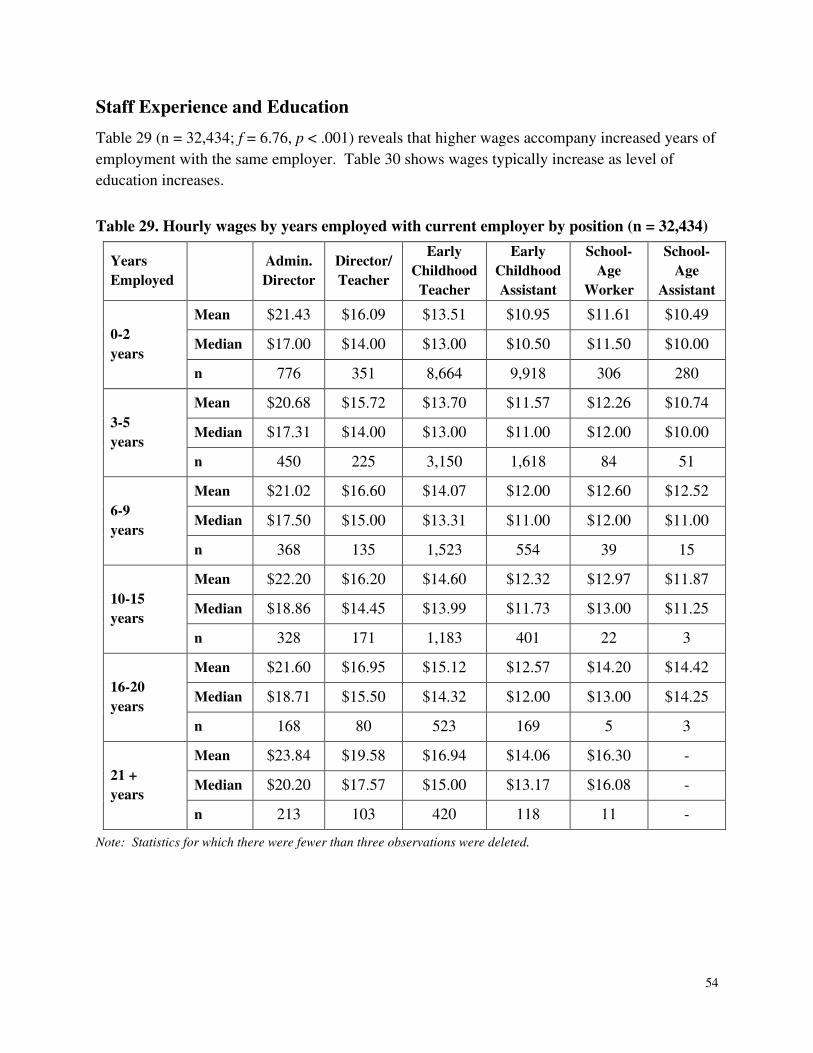
54
Staff Experience and Education
Table 29 (n = 32,434; f = 6.76, p < .001) reveals that higher wages accompany increased years of
employment with the same employer. Table 30 shows wages typically increase as level of
education increases.
Table 29. Hourly wages by years employed with current employer by position (n = 32,434)
Years
Employed
Admin.
Director
Director/
Teacher
Early
Childhood
Teacher
Early
Childhood
Assistant
School-
Age
Worker
School-
Age
Assistant
0-2
years
Mean $21.43 $16.09 $13.51 $10.95 $11.61 $10.49
Median $17.00 $14.00 $13.00 $10.50 $11.50 $10.00
n 776 351 8,664 9,918 306 280
3-5
years
Mean $20.68 $15.72 $13.70 $11.57 $12.26 $10.74
Median $17.31 $14.00 $13.00 $11.00 $12.00 $10.00
n 450 225 3,150 1,618 84 51
6-9
years
Mean $21.02 $16.60 $14.07 $12.00 $12.60 $12.52
Median $17.50 $15.00 $13.31 $11.00 $12.00 $11.00
n 368 135 1,523 554 39 15
10-15
years
Mean $22.20 $16.20 $14.60 $12.32 $12.97 $11.87
Median $18.86 $14.45 $13.99 $11.73 $13.00 $11.25
n 328 171 1,183 401 22 3
16-20
years
Mean $21.60 $16.95 $15.12 $12.57 $14.20 $14.42
Median $18.71 $15.50 $14.32 $12.00 $13.00 $14.25
n 168 80 523 169 5 3
21 +
years
Mean $23.84 $19.58 $16.94 $14.06 $16.30 -
Median $20.20 $17.57 $15.00 $13.17 $16.08 -
n 213 103 420 118 11 -
Note: Statistics for which there were fewer than three observations were deleted.
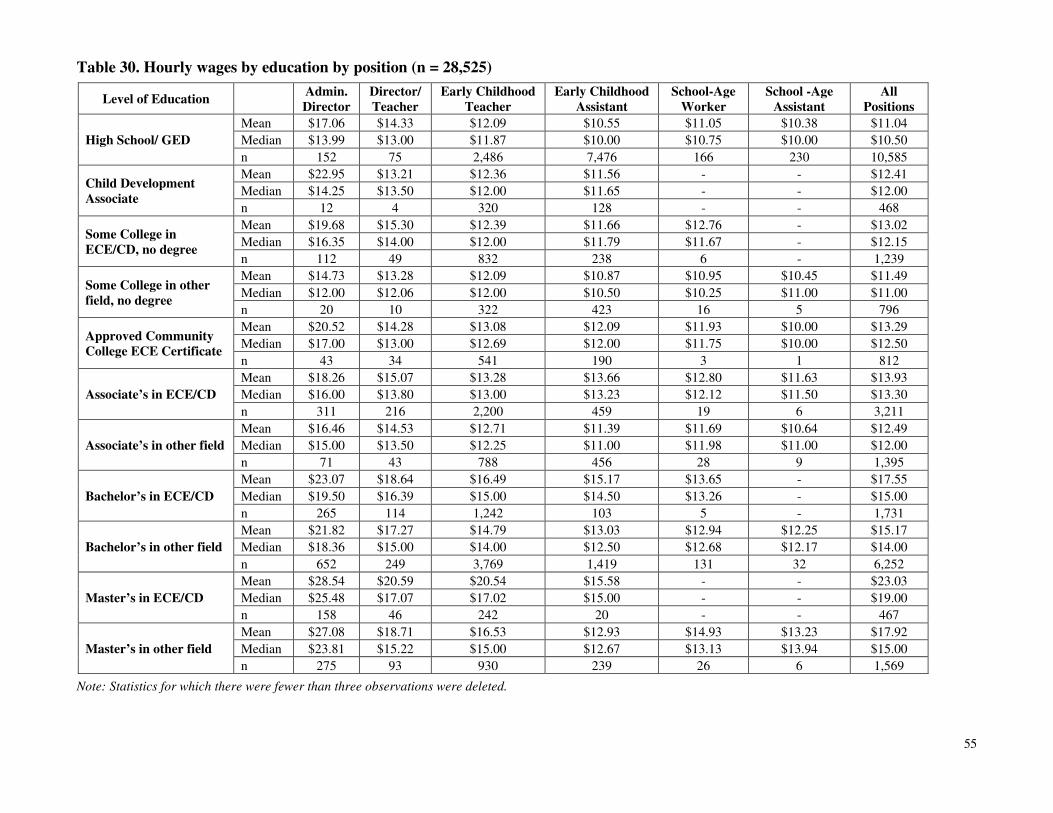
55
Table 30. Hourly wages by education by position (n = 28,525)
Level of Education Admin.
Director
Director/
Teacher
Early Childhood
Teacher
Early Childhood
Assistant
School-Age
Worker
School -Age
Assistant
All
Positions
High School/ GED
Mean $17.06 $14.33 $12.09 $10.55 $11.05 $10.38 $11.04
Median $13.99 $13.00 $11.87 $10.00 $10.75 $10.00 $10.50
n 152 75 2,486 7,476 166 230 10,585
Child Development
Associate
Mean $22.95 $13.21 $12.36 $11.56 - - $12.41
Median $14.25 $13.50 $12.00 $11.65 - - $12.00
n 12 4 320 128 - - 468
Some College in
ECE/CD, no degree
Mean $19.68 $15.30 $12.39 $11.66 $12.76 - $13.02
Median $16.35 $14.00 $12.00 $11.79 $11.67 - $12.15
n 112 49 832 238 6 - 1,239
Some College in other
field, no degree
Mean $14.73 $13.28 $12.09 $10.87 $10.95 $10.45 $11.49
Median $12.00 $12.06 $12.00 $10.50 $10.25 $11.00 $11.00
n 20 10 322 423 16 5 796
Approved Community
College ECE Certificate
Mean $20.52 $14.28 $13.08 $12.09 $11.93 $10.00 $13.29
Median $17.00 $13.00 $12.69 $12.00 $11.75 $10.00 $12.50
n 43 34 541 190 3 1 812
Associate’s in ECE/CD
Mean $18.26 $15.07 $13.28 $13.66 $12.80 $11.63 $13.93
Median $16.00 $13.80 $13.00 $13.23 $12.12 $11.50 $13.30
n 311 216 2,200 459 19 6 3,211
Associate’s in other field
Mean $16.46 $14.53 $12.71 $11.39 $11.69 $10.64 $12.49
Median $15.00 $13.50 $12.25 $11.00 $11.98 $11.00 $12.00
n 71 43 788 456 28 9 1,395
Bachelor’s in ECE/CD
Mean $23.07 $18.64 $16.49 $15.17 $13.65 - $17.55
Median $19.50 $16.39 $15.00 $14.50 $13.26 - $15.00
n 265 114 1,242 103 5 - 1,731
Bachelor’s in other field
Mean $21.82 $17.27 $14.79 $13.03 $12.94 $12.25 $15.17
Median $18.36 $15.00 $14.00 $12.50 $12.68 $12.17 $14.00
n 652 249 3,769 1,419 131 32 6,252
Master’s in ECE/CD
Mean $28.54 $20.59 $20.54 $15.58 - - $23.03
Median $25.48 $17.07 $17.02 $15.00 - - $19.00
n 158 46 242 20 - - 467
Master’s in other field
Mean $27.08 $18.71 $16.53 $12.93 $14.93 $13.23 $17.92
Median $23.81 $15.22 $15.00 $12.67 $13.13 $13.94 $15.00
n 275 93 930 239 26 6 1,569
Note: Statistics for which there were fewer than three observations were deleted.
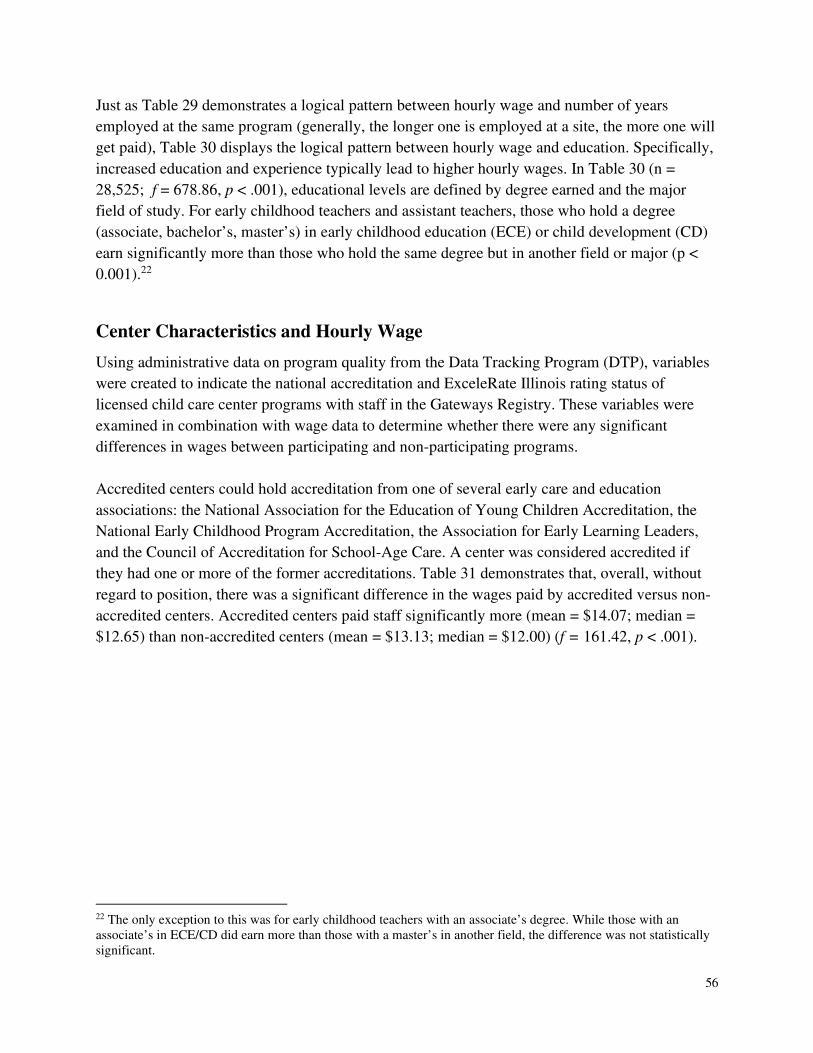
56
Just as Table 29 demonstrates a logical pattern between hourly wage and number of years
employed at the same program (generally, the longer one is employed at a site, the more one will
get paid), Table 30 displays the logical pattern between hourly wage and education. Specifically,
increased education and experience typically lead to higher hourly wages. In Table 30 (n =
28,525; f = 678.86, p < .001), educational levels are defined by degree earned and the major
field of study. For early childhood teachers and assistant teachers, those who hold a degree
(associate, bachelor’s, master’s) in early childhood education (ECE) or child development (CD)
earn significantly more than those who hold the same degree but in another field or major (p <
0.001).22
Center Characteristics and Hourly Wage
Using administrative data on program quality from the Data Tracking Program (DTP), variables
were created to indicate the national accreditation and ExceleRate Illinois rating status of
licensed child care center programs with staff in the Gateways Registry. These variables were
examined in combination with wage data to determine whether there were any significant
differences in wages between participating and non-participating programs.
Accredited centers could hold accreditation from one of several early care and education
associations: the National Association for the Education of Young Children Accreditation, the
National Early Childhood Program Accreditation, the Association for Early Learning Leaders,
and the Council of Accreditation for School-Age Care. A center was considered accredited if
they had one or more of the former accreditations. Table 31 demonstrates that, overall, without
regard to position, there was a significant difference in the wages paid by accredited versus non-
accredited centers. Accredited centers paid staff significantly more (mean = $14.07; median =
$12.65) than non-accredited centers (mean = $13.13; median = $12.00) (f = 161.42, p < .001).
22 The only exception to this was for early childhood teachers with an associate’s degree. While those with an associate’s in ECE/CD did earn more than those with a master’s in another field, the difference was not statistically significant.
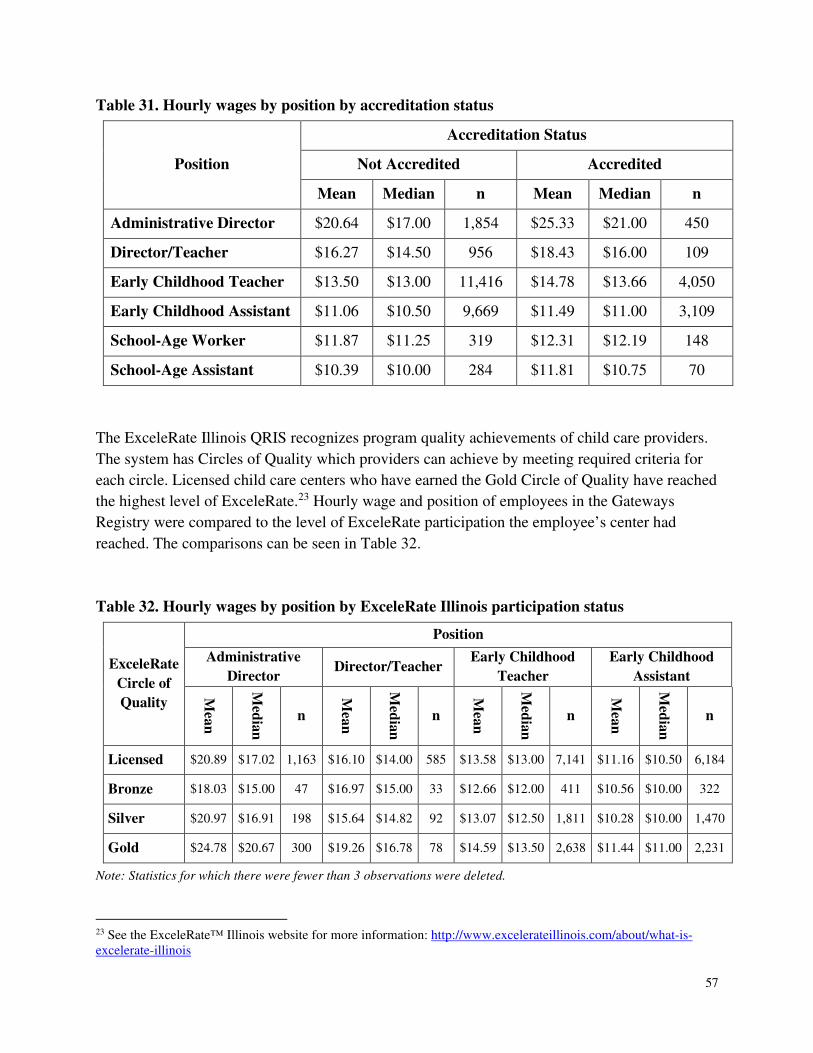
57
Table 31. Hourly wages by position by accreditation status
Position
Accreditation Status
Not Accredited Accredited
Mean Median n Mean Median n
Administrative Director $20.64 $17.00 1,854 $25.33 $21.00 450
Director/Teacher $16.27 $14.50 956 $18.43 $16.00 109
Early Childhood Teacher $13.50 $13.00 11,416 $14.78 $13.66 4,050
Early Childhood Assistant $11.06 $10.50 9,669 $11.49 $11.00 3,109
School-Age Worker $11.87 $11.25 319 $12.31 $12.19 148
School-Age Assistant $10.39 $10.00 284 $11.81 $10.75 70
The ExceleRate Illinois QRIS recognizes program quality achievements of child care providers.
The system has Circles of Quality which providers can achieve by meeting required criteria for
each circle. Licensed child care centers who have earned the Gold Circle of Quality have reached
the highest level of ExceleRate.23 Hourly wage and position of employees in the Gateways
Registry were compared to the level of ExceleRate participation the employee’s center had
reached. The comparisons can be seen in Table 32.
Table 32. Hourly wages by position by ExceleRate Illinois participation status
ExceleRate
Circle of
Quality
Position
Administrative
Director Director/Teacher
Early Childhood
Teacher
Early Childhood
Assistant
Mea
n
Med
ian
n
Mea
n
Med
ian
n
Mea
n
Med
ian
n
Mea
n
Med
ian
n
Licensed $20.89 $17.02 1,163 $16.10 $14.00 585 $13.58 $13.00 7,141 $11.16 $10.50 6,184
Bronze $18.03 $15.00 47 $16.97 $15.00 33 $12.66 $12.00 411 $10.56 $10.00 322
Silver $20.97 $16.91 198 $15.64 $14.82 92 $13.07 $12.50 1,811 $10.28 $10.00 1,470
Gold $24.78 $20.67 300 $19.26 $16.78 78 $14.59 $13.50 2,638 $11.44 $11.00 2,231
Note: Statistics for which there were fewer than 3 observations were deleted.
23 See the ExceleRate™ Illinois website for more information: http://www.excelerateillinois.com/about/what-is-excelerate-illinois
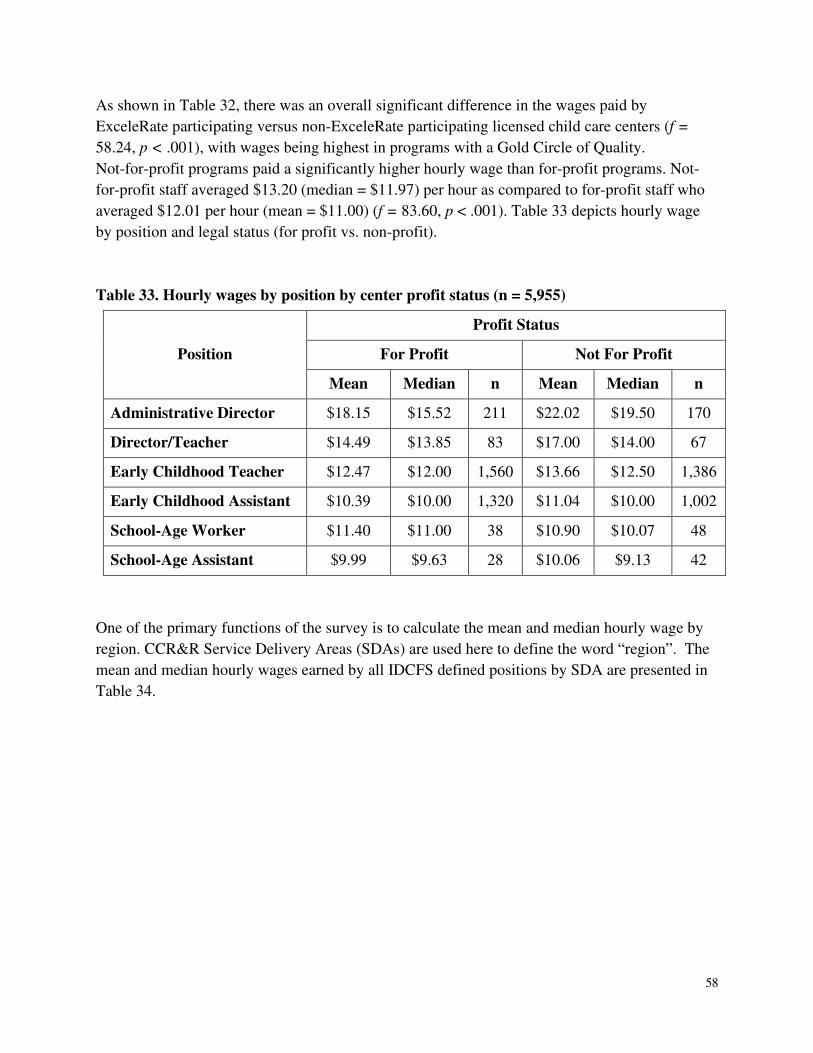
58
As shown in Table 32, there was an overall significant difference in the wages paid by
ExceleRate participating versus non-ExceleRate participating licensed child care centers (f =
58.24, p < .001), with wages being highest in programs with a Gold Circle of Quality.
Not-for-profit programs paid a significantly higher hourly wage than for-profit programs. Not-
for-profit staff averaged $13.20 (median = $11.97) per hour as compared to for-profit staff who
averaged $12.01 per hour (mean = $11.00) (f = 83.60, p < .001). Table 33 depicts hourly wage
by position and legal status (for profit vs. non-profit).
Table 33. Hourly wages by position by center profit status (n = 5,955)
Position
Profit Status
For Profit Not For Profit
Mean Median n Mean Median n
Administrative Director $18.15 $15.52 211 $22.02 $19.50 170
Director/Teacher $14.49 $13.85 83 $17.00 $14.00 67
Early Childhood Teacher $12.47 $12.00 1,560 $13.66 $12.50 1,386
Early Childhood Assistant $10.39 $10.00 1,320 $11.04 $10.00 1,002
School-Age Worker $11.40 $11.00 38 $10.90 $10.07 48
School-Age Assistant $9.99 $9.63 28 $10.06 $9.13 42
One of the primary functions of the survey is to calculate the mean and median hourly wage by
region. CCR&R Service Delivery Areas (SDAs) are used here to define the word “region”. The
mean and median hourly wages earned by all IDCFS defined positions by SDA are presented in
Table 34.
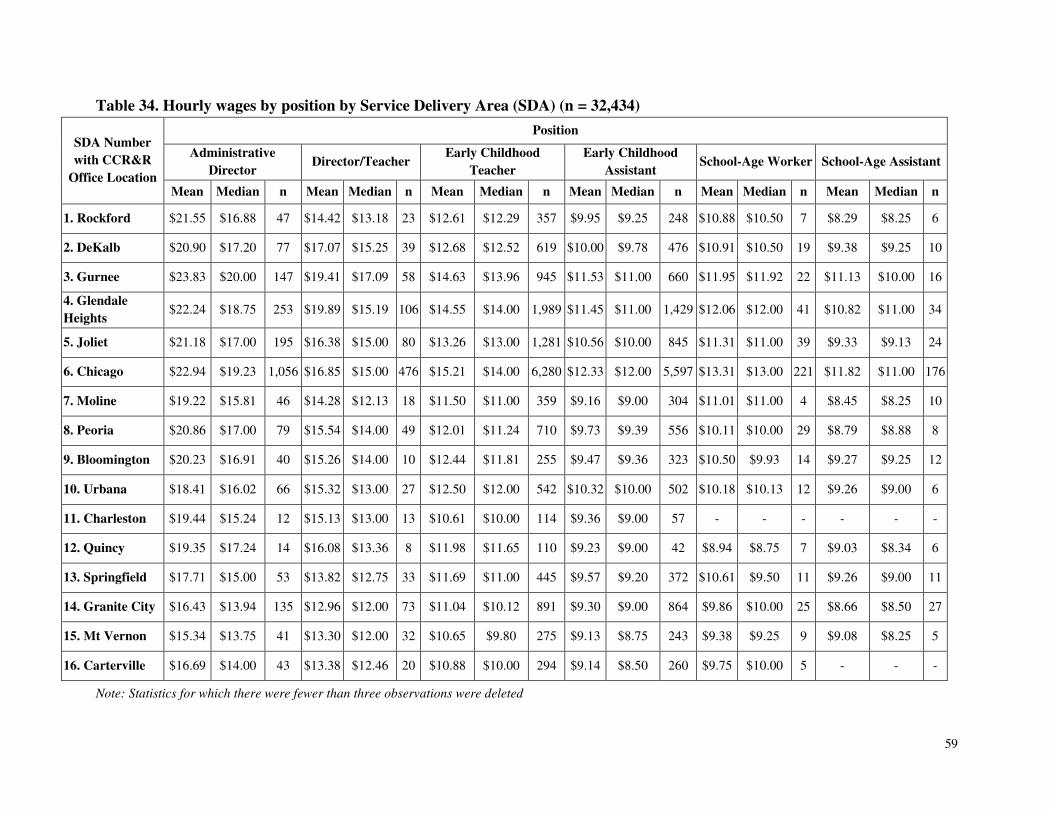
59
Table 34. Hourly wages by position by Service Delivery Area (SDA) (n = 32,434)
SDA Number
with CCR&R
Office Location
Position
Administrative
Director Director/Teacher
Early Childhood
Teacher
Early Childhood
Assistant School-Age Worker School-Age Assistant
Mean Median n Mean Median n Mean Median n Mean Median n Mean Median n Mean Median n
1. Rockford $21.55 $16.88 47 $14.42 $13.18 23 $12.61 $12.29 357 $9.95 $9.25 248 $10.88 $10.50 7 $8.29 $8.25 6
2. DeKalb $20.90 $17.20 77 $17.07 $15.25 39 $12.68 $12.52 619 $10.00 $9.78 476 $10.91 $10.50 19 $9.38 $9.25 10
3. Gurnee $23.83 $20.00 147 $19.41 $17.09 58 $14.63 $13.96 945 $11.53 $11.00 660 $11.95 $11.92 22 $11.13 $10.00 16
4. Glendale
Heights $22.24 $18.75 253 $19.89 $15.19 106 $14.55 $14.00 1,989 $11.45 $11.00 1,429 $12.06 $12.00 41 $10.82 $11.00 34
5. Joliet $21.18 $17.00 195 $16.38 $15.00 80 $13.26 $13.00 1,281 $10.56 $10.00 845 $11.31 $11.00 39 $9.33 $9.13 24
6. Chicago $22.94 $19.23 1,056 $16.85 $15.00 476 $15.21 $14.00 6,280 $12.33 $12.00 5,597 $13.31 $13.00 221 $11.82 $11.00 176
7. Moline $19.22 $15.81 46 $14.28 $12.13 18 $11.50 $11.00 359 $9.16 $9.00 304 $11.01 $11.00 4 $8.45 $8.25 10
8. Peoria $20.86 $17.00 79 $15.54 $14.00 49 $12.01 $11.24 710 $9.73 $9.39 556 $10.11 $10.00 29 $8.79 $8.88 8
9. Bloomington $20.23 $16.91 40 $15.26 $14.00 10 $12.44 $11.81 255 $9.47 $9.36 323 $10.50 $9.93 14 $9.27 $9.25 12
10. Urbana $18.41 $16.02 66 $15.32 $13.00 27 $12.50 $12.00 542 $10.32 $10.00 502 $10.18 $10.13 12 $9.26 $9.00 6
11. Charleston $19.44 $15.24 12 $15.13 $13.00 13 $10.61 $10.00 114 $9.36 $9.00 57 - - - - - -
12. Quincy $19.35 $17.24 14 $16.08 $13.36 8 $11.98 $11.65 110 $9.23 $9.00 42 $8.94 $8.75 7 $9.03 $8.34 6
13. Springfield $17.71 $15.00 53 $13.82 $12.75 33 $11.69 $11.00 445 $9.57 $9.20 372 $10.61 $9.50 11 $9.26 $9.00 11
14. Granite City $16.43 $13.94 135 $12.96 $12.00 73 $11.04 $10.12 891 $9.30 $9.00 864 $9.86 $10.00 25 $8.66 $8.50 27
15. Mt Vernon $15.34 $13.75 41 $13.30 $12.00 32 $10.65 $9.80 275 $9.13 $8.75 243 $9.38 $9.25 9 $9.08 $8.25 5
16. Carterville $16.69 $14.00 43 $13.38 $12.46 20 $10.88 $10.00 294 $9.14 $8.50 260 $9.75 $10.00 5 - - -
Note: Statistics for which there were fewer than three observations were deleted
60
Several directors commented about the inadequate salaries offered to child care personnel:
• “Since the recession I have not been able to offer vacation pay, sick leave pay, or other
nice benefits. I myself do not make much salary however, I enjoy this profession of
working with children. It is always a struggle to balance adequate staffing and to be able
to pay them.”
• “So difficult to find qualified people in the field of early childhood because of salary.
Especially when they can go to McDonalds and start out at more money with no
schooling and less stress.”
• “Until wages for early childhood teachers are not solely tied to tuition payments, there
will not be any changes in the salary structure.”
Benefits
Directors where asked about the types of benefits available to their employees. Beginning with
FY 2017, the survey included an expanded list of benefits to get a more complete picture of what
is offered in licensed center-based settings. In addition, the question was asked regarding
benefits offered to full-time staff vs. part-time staff. As Table 35 shows, over 90 percent of
responding centers offered paid holidays and vacation to its full-time employees. Additionally,
three-fourths offered paid sick days. In terms of wage increases, about three-fourths of centers
offered periodic increases in wages based on performance and educational attainment, while just
over half offered yearly cost-of-living increases. About three-quarters offered free or reduced fee
child care to their employees and close to 80 percent offered payment or reimbursement for
educational or training expenses.24 While over half of the responding centers offer health
insurance, less than half offer dental insurance, life insurance, or retirement plans/pensions.
24 Professionalizing the early childhood field and workforce is supported by various state initiatives. Center-paid educational stipends help staff meet their IDCFS requirement of 15 training hours per calendar year as well as assist centers to meet qualifications for an ExceleRate Circle of Quality. Some educational opportunities can be reimbursed through Professional Development and Improvement Funds. Money is also available through the Gateways to Opportunity Scholarship Program to help child care practitioners meet their educational goals.
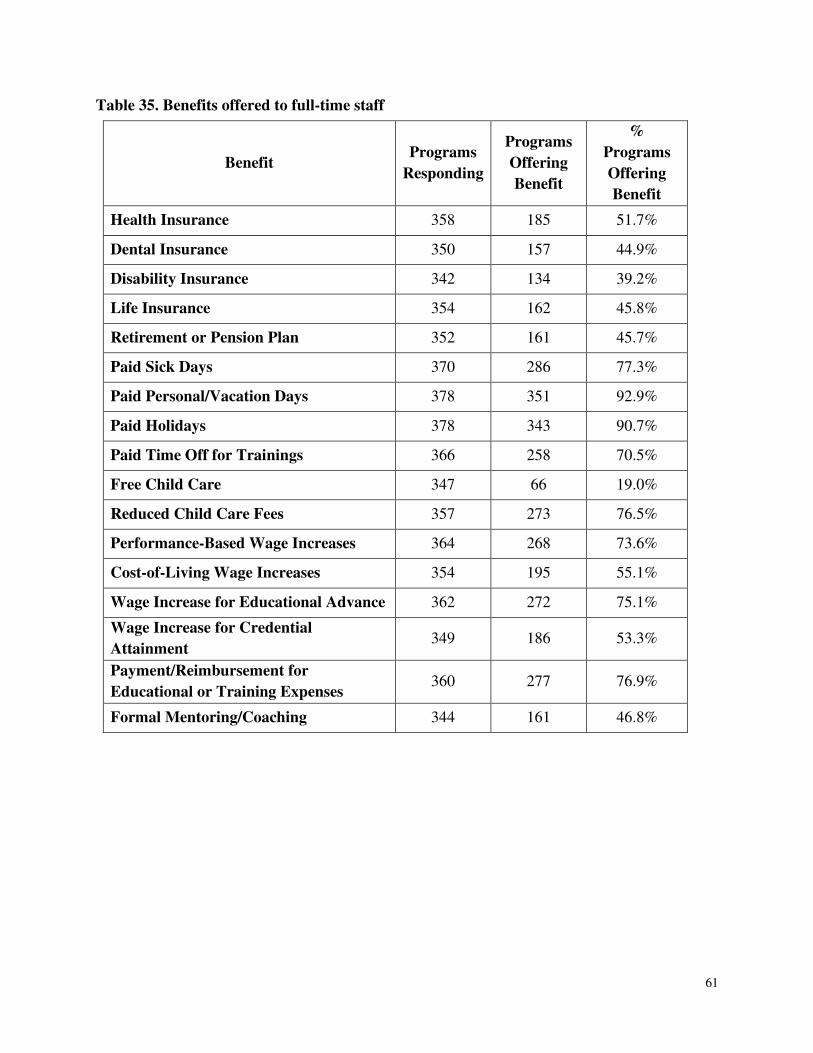
61
Table 35. Benefits offered to full-time staff
Benefit Programs
Responding
Programs
Offering
Benefit
%
Programs
Offering
Benefit
Health Insurance 358 185 51.7%
Dental Insurance 350 157 44.9%
Disability Insurance 342 134 39.2%
Life Insurance 354 162 45.8%
Retirement or Pension Plan 352 161 45.7%
Paid Sick Days 370 286 77.3%
Paid Personal/Vacation Days 378 351 92.9%
Paid Holidays 378 343 90.7%
Paid Time Off for Trainings 366 258 70.5%
Free Child Care 347 66 19.0%
Reduced Child Care Fees 357 273 76.5%
Performance-Based Wage Increases 364 268 73.6%
Cost-of-Living Wage Increases 354 195 55.1%
Wage Increase for Educational Advance 362 272 75.1%
Wage Increase for Credential
Attainment 349 186 53.3%
Payment/Reimbursement for
Educational or Training Expenses 360 277 76.9%
Formal Mentoring/Coaching 344 161 46.8%
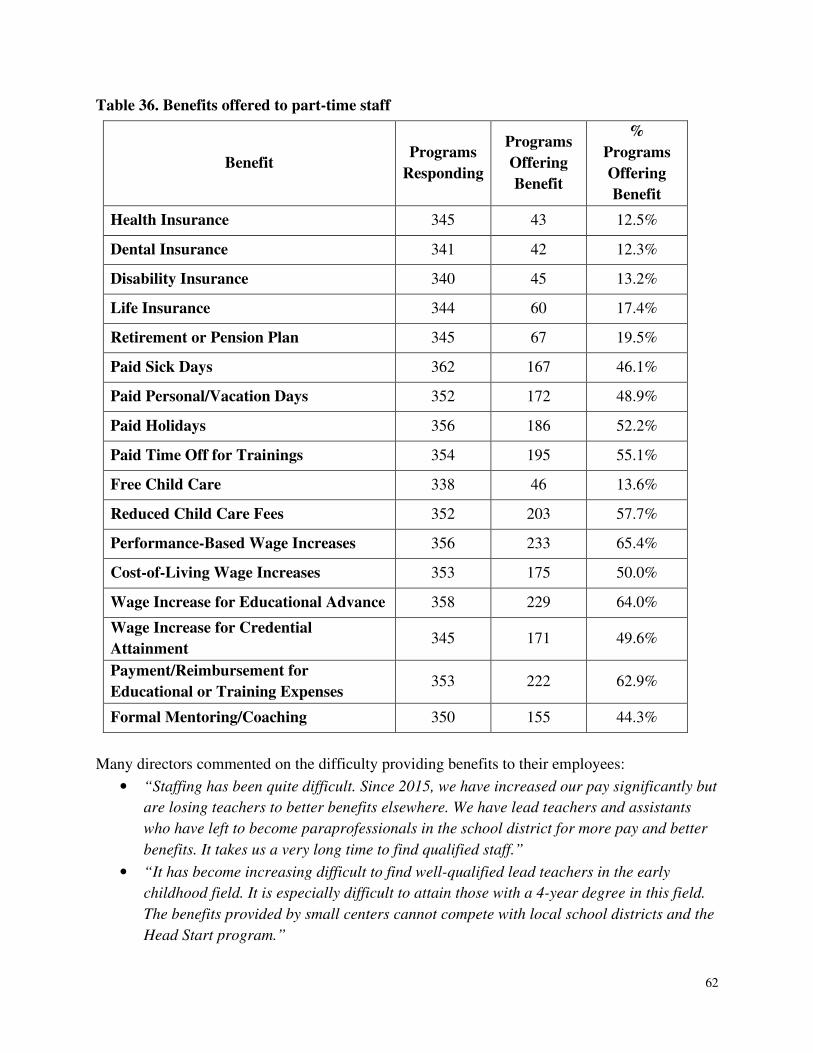
62
Table 36. Benefits offered to part-time staff
Benefit Programs
Responding
Programs
Offering
Benefit
%
Programs
Offering
Benefit
Health Insurance 345 43 12.5%
Dental Insurance 341 42 12.3%
Disability Insurance 340 45 13.2%
Life Insurance 344 60 17.4%
Retirement or Pension Plan 345 67 19.5%
Paid Sick Days 362 167 46.1%
Paid Personal/Vacation Days 352 172 48.9%
Paid Holidays 356 186 52.2%
Paid Time Off for Trainings 354 195 55.1%
Free Child Care 338 46 13.6%
Reduced Child Care Fees 352 203 57.7%
Performance-Based Wage Increases 356 233 65.4%
Cost-of-Living Wage Increases 353 175 50.0%
Wage Increase for Educational Advance 358 229 64.0%
Wage Increase for Credential
Attainment 345 171 49.6%
Payment/Reimbursement for
Educational or Training Expenses 353 222 62.9%
Formal Mentoring/Coaching 350 155 44.3%
Many directors commented on the difficulty providing benefits to their employees:
• “Staffing has been quite difficult. Since 2015, we have increased our pay significantly but
are losing teachers to better benefits elsewhere. We have lead teachers and assistants
who have left to become paraprofessionals in the school district for more pay and better
benefits. It takes us a very long time to find qualified staff.”
• “It has become increasing difficult to find well-qualified lead teachers in the early
childhood field. It is especially difficult to attain those with a 4-year degree in this field.
The benefits provided by small centers cannot compete with local school districts and the
Head Start program.”
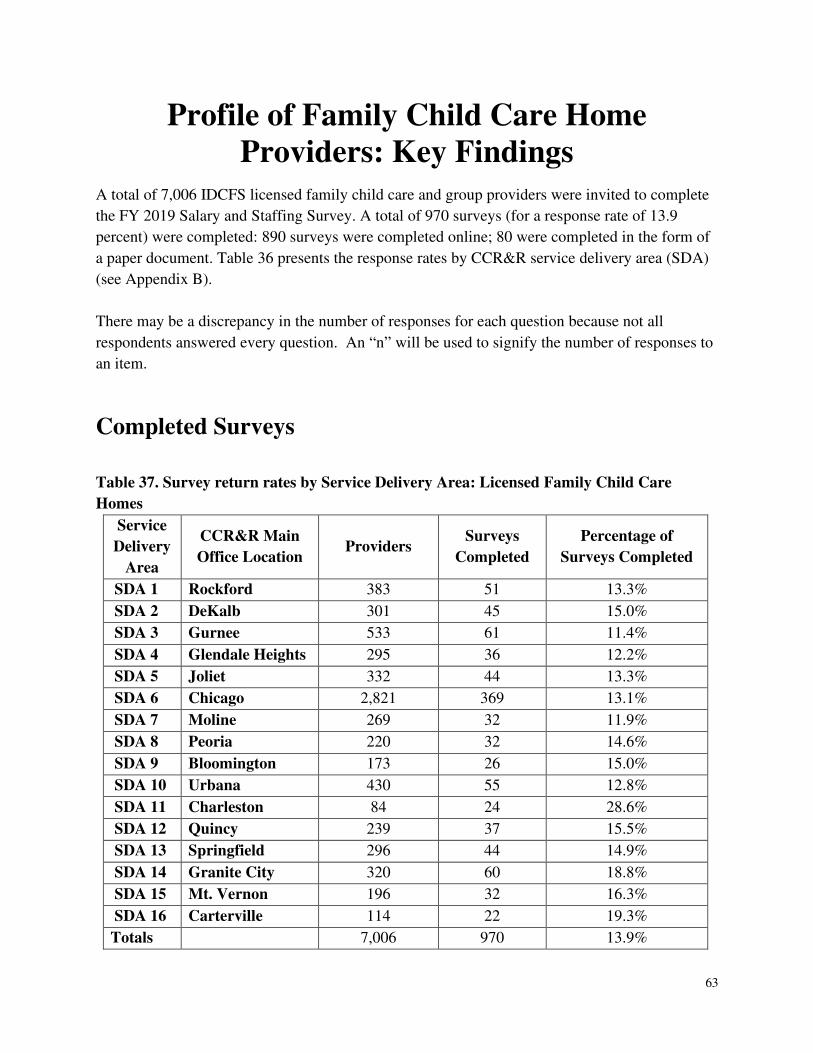
63
Profile of Family Child Care Home
Providers: Key Findings
A total of 7,006 IDCFS licensed family child care and group providers were invited to complete
the FY 2019 Salary and Staffing Survey. A total of 970 surveys (for a response rate of 13.9
percent) were completed: 890 surveys were completed online; 80 were completed in the form of
a paper document. Table 36 presents the response rates by CCR&R service delivery area (SDA)
(see Appendix B).
There may be a discrepancy in the number of responses for each question because not all
respondents answered every question. An “n” will be used to signify the number of responses to
an item.
Completed Surveys
Table 37. Survey return rates by Service Delivery Area: Licensed Family Child Care
Homes
Service
Delivery
Area
CCR&R Main
Office Location Providers
Surveys
Completed
Percentage of
Surveys Completed
SDA 1 Rockford 383 51 13.3%
SDA 2 DeKalb 301 45 15.0%
SDA 3 Gurnee 533 61 11.4%
SDA 4 Glendale Heights 295 36 12.2%
SDA 5 Joliet 332 44 13.3%
SDA 6 Chicago 2,821 369 13.1%
SDA 7 Moline 269 32 11.9%
SDA 8 Peoria 220 32 14.6%
SDA 9 Bloomington 173 26 15.0%
SDA 10 Urbana 430 55 12.8%
SDA 11 Charleston 84 24 28.6%
SDA 12 Quincy 239 37 15.5%
SDA 13 Springfield 296 44 14.9%
SDA 14 Granite City 320 60 18.8%
SDA 15 Mt. Vernon 196 32 16.3%
SDA 16 Carterville 114 22 19.3%
Totals 7,006 970 13.9%
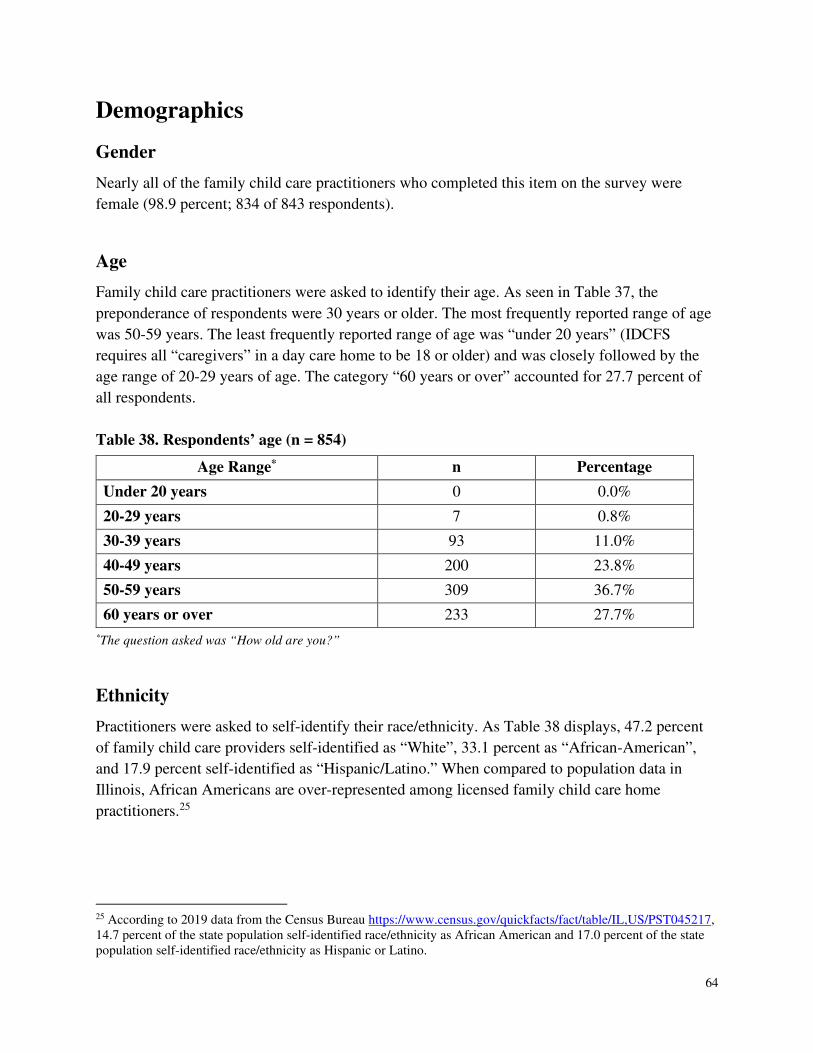
64
Demographics
Gender
Nearly all of the family child care practitioners who completed this item on the survey were
female (98.9 percent; 834 of 843 respondents).
Age
Family child care practitioners were asked to identify their age. As seen in Table 37, the
preponderance of respondents were 30 years or older. The most frequently reported range of age
was 50-59 years. The least frequently reported range of age was “under 20 years” (IDCFS
requires all “caregivers” in a day care home to be 18 or older) and was closely followed by the
age range of 20-29 years of age. The category “60 years or over” accounted for 27.7 percent of
all respondents.
Table 38. Respondents’ age (n = 854)
Age Range* n Percentage
Under 20 years 0 0.0%
20-29 years 7 0.8%
30-39 years 93 11.0%
40-49 years 200 23.8%
50-59 years 309 36.7%
60 years or over 233 27.7%
*The question asked was “How old are you?”
Ethnicity
Practitioners were asked to self-identify their race/ethnicity. As Table 38 displays, 47.2 percent
of family child care providers self-identified as “White”, 33.1 percent as “African-American”,
and 17.9 percent self-identified as “Hispanic/Latino.” When compared to population data in
Illinois, African Americans are over-represented among licensed family child care home
practitioners.25
25 According to 2019 data from the Census Bureau https://www.census.gov/quickfacts/fact/table/IL,US/PST045217, 14.7 percent of the state population self-identified race/ethnicity as African American and 17.0 percent of the state population self-identified race/ethnicity as Hispanic or Latino.
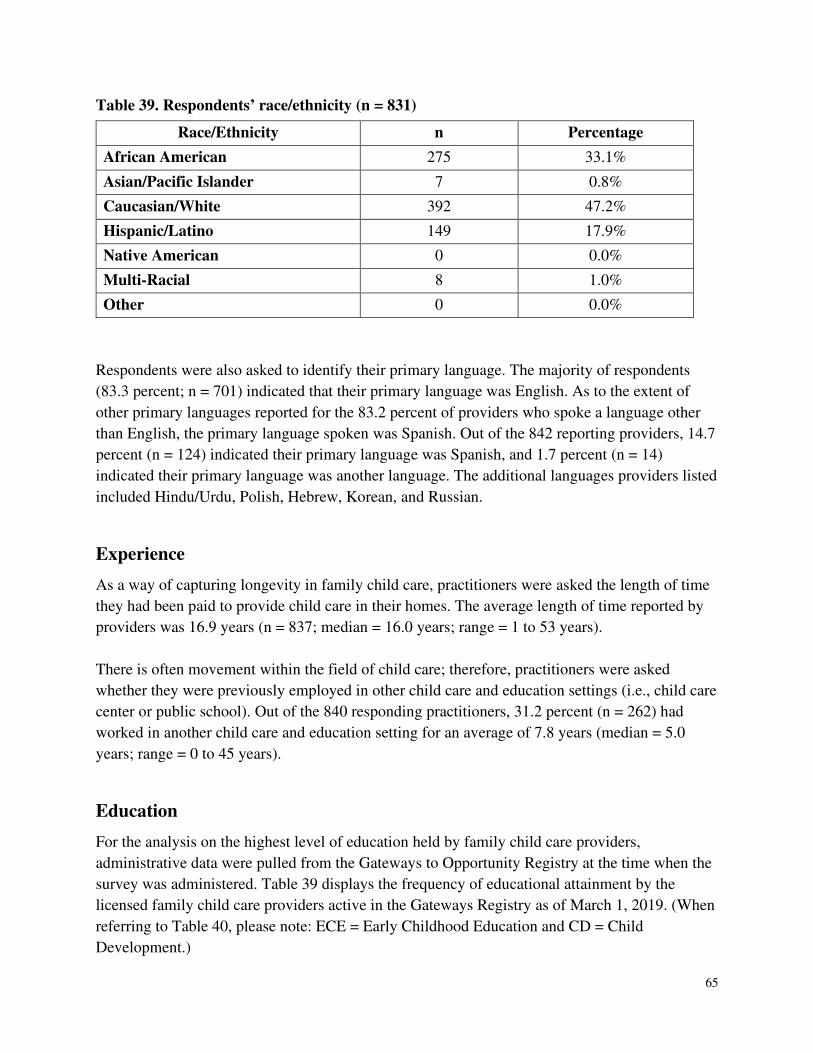
65
Table 39. Respondents’ race/ethnicity (n = 831)
Race/Ethnicity n Percentage
African American 275 33.1%
Asian/Pacific Islander 7 0.8%
Caucasian/White 392 47.2%
Hispanic/Latino 149 17.9%
Native American 0 0.0%
Multi-Racial 8 1.0%
Other 0 0.0%
Respondents were also asked to identify their primary language. The majority of respondents
(83.3 percent; n = 701) indicated that their primary language was English. As to the extent of
other primary languages reported for the 83.2 percent of providers who spoke a language other
than English, the primary language spoken was Spanish. Out of the 842 reporting providers, 14.7
percent (n = 124) indicated their primary language was Spanish, and 1.7 percent (n = 14)
indicated their primary language was another language. The additional languages providers listed
included Hindu/Urdu, Polish, Hebrew, Korean, and Russian.
Experience
As a way of capturing longevity in family child care, practitioners were asked the length of time
they had been paid to provide child care in their homes. The average length of time reported by
providers was 16.9 years (n = 837; median = 16.0 years; range = 1 to 53 years).
There is often movement within the field of child care; therefore, practitioners were asked
whether they were previously employed in other child care and education settings (i.e., child care
center or public school). Out of the 840 responding practitioners, 31.2 percent (n = 262) had
worked in another child care and education setting for an average of 7.8 years (median = 5.0
years; range = 0 to 45 years).
Education
For the analysis on the highest level of education held by family child care providers,
administrative data were pulled from the Gateways to Opportunity Registry at the time when the
survey was administered. Table 39 displays the frequency of educational attainment by the
licensed family child care providers active in the Gateways Registry as of March 1, 2019. (When
referring to Table 40, please note: ECE = Early Childhood Education and CD = Child
Development.)
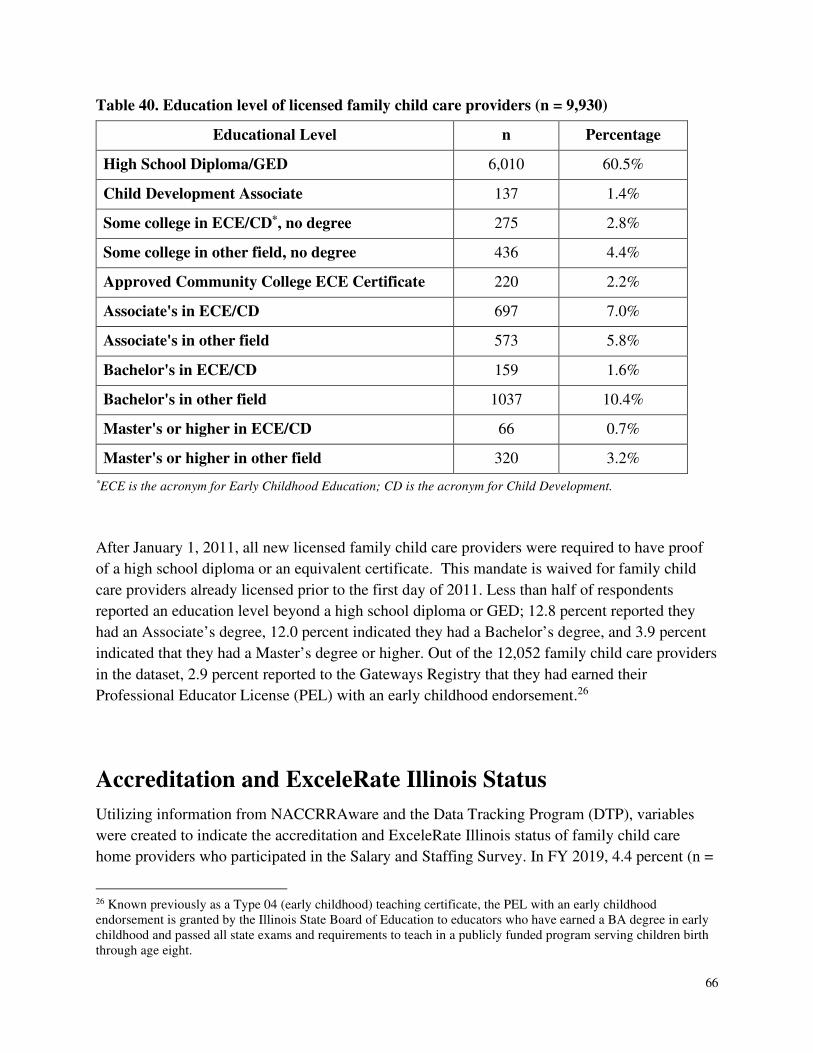
66
Table 40. Education level of licensed family child care providers (n = 9,930)
Educational Level n Percentage
High School Diploma/GED 6,010 60.5%
Child Development Associate 137 1.4%
Some college in ECE/CD*, no degree 275 2.8%
Some college in other field, no degree 436 4.4%
Approved Community College ECE Certificate 220 2.2%
Associate's in ECE/CD 697 7.0%
Associate's in other field 573 5.8%
Bachelor's in ECE/CD 159 1.6%
Bachelor's in other field 1037 10.4%
Master's or higher in ECE/CD 66 0.7%
Master's or higher in other field 320 3.2%
*ECE is the acronym for Early Childhood Education; CD is the acronym for Child Development.
After January 1, 2011, all new licensed family child care providers were required to have proof
of a high school diploma or an equivalent certificate. This mandate is waived for family child
care providers already licensed prior to the first day of 2011. Less than half of respondents
reported an education level beyond a high school diploma or GED; 12.8 percent reported they
had an Associate’s degree, 12.0 percent indicated they had a Bachelor’s degree, and 3.9 percent
indicated that they had a Master’s degree or higher. Out of the 12,052 family child care providers
in the dataset, 2.9 percent reported to the Gateways Registry that they had earned their
Professional Educator License (PEL) with an early childhood endorsement.26
Accreditation and ExceleRate Illinois Status
Utilizing information from NACCRRAware and the Data Tracking Program (DTP), variables
were created to indicate the accreditation and ExceleRate Illinois status of family child care
home providers who participated in the Salary and Staffing Survey. In FY 2019, 4.4 percent (n =
26 Known previously as a Type 04 (early childhood) teaching certificate, the PEL with an early childhood endorsement is granted by the Illinois State Board of Education to educators who have earned a BA degree in early childhood and passed all state exams and requirements to teach in a publicly funded program serving children birth through age eight.
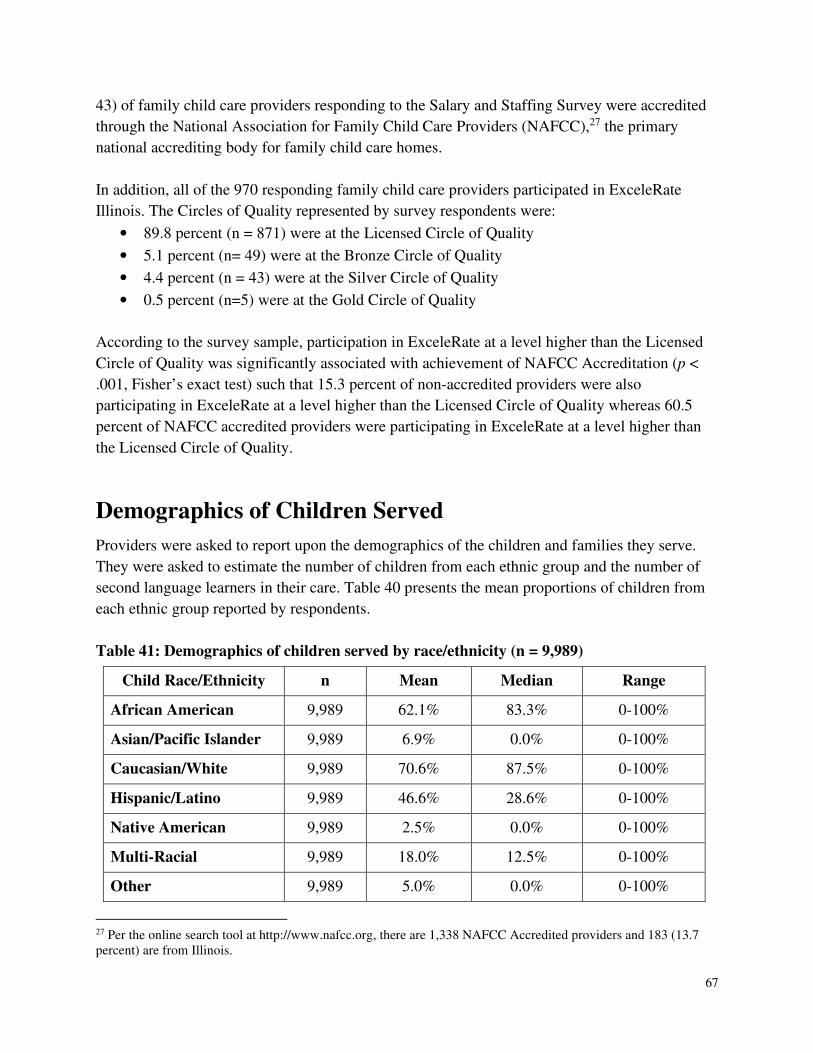
67
43) of family child care providers responding to the Salary and Staffing Survey were accredited
through the National Association for Family Child Care Providers (NAFCC),27 the primary
national accrediting body for family child care homes.
In addition, all of the 970 responding family child care providers participated in ExceleRate
Illinois. The Circles of Quality represented by survey respondents were:
• 89.8 percent (n = 871) were at the Licensed Circle of Quality
• 5.1 percent (n= 49) were at the Bronze Circle of Quality
• 4.4 percent (n = 43) were at the Silver Circle of Quality
• 0.5 percent (n=5) were at the Gold Circle of Quality
According to the survey sample, participation in ExceleRate at a level higher than the Licensed
Circle of Quality was significantly associated with achievement of NAFCC Accreditation (p <
.001, Fisher’s exact test) such that 15.3 percent of non-accredited providers were also
participating in ExceleRate at a level higher than the Licensed Circle of Quality whereas 60.5
percent of NAFCC accredited providers were participating in ExceleRate at a level higher than
the Licensed Circle of Quality.
Demographics of Children Served
Providers were asked to report upon the demographics of the children and families they serve.
They were asked to estimate the number of children from each ethnic group and the number of
second language learners in their care. Table 40 presents the mean proportions of children from
each ethnic group reported by respondents.
Table 41: Demographics of children served by race/ethnicity (n = 9,989)
Child Race/Ethnicity n Mean Median Range
African American 9,989 62.1% 83.3% 0-100%
Asian/Pacific Islander 9,989 6.9% 0.0% 0-100%
Caucasian/White 9,989 70.6% 87.5% 0-100%
Hispanic/Latino 9,989 46.6% 28.6% 0-100%
Native American 9,989 2.5% 0.0% 0-100%
Multi-Racial 9,989 18.0% 12.5% 0-100%
Other 9,989 5.0% 0.0% 0-100%
27 Per the online search tool at http://www.nafcc.org, there are 1,338 NAFCC Accredited providers and 183 (13.7 percent) are from Illinois.
68
Practitioners were asked to report whether or not they had English language learners (ELL)
enrolled in their programs. Of 960 respondents to this question, 16.8 percent (n = 161) indicated
they had second language learners enrolled in their programs. Of those with ELLs, 86.4 percent
(n= 142) reported having children whose primary language was Spanish as ELLs in their
programs. Many other languages were represented in the sample, each with less than ten
providers serving children who are ELLs of a particular language such as: Arabic, Chinese
dialects, Farsi, French, German, Greek, Hebrew, Hindi/Urdu, Japanese, Korean, Polish, Russian,
Serbian, and Vietnamese.
Professional Development
Program Awareness and Participation
Providers were asked about their awareness of professional development opportunities and
programs available in Illinois.
• Nearly all (99.7 percent; n = 862 of 865) knew of the Gateways to Opportunity Registry.
• More than three quarters (84.8 percent; n = 696 of 821) knew of the Great START
Program.
• Approximately the same (83.9 percent; n = 691 of 824) had heard of the Gateways to
Opportunity Scholarship Program.
• Over 80 percent (90.5 percent; n = 750 of 829) knew of Gateways to Opportunity
Credentials.
• Over half (57.3 percent; n = 453 of 791) knew of the Professional Development Advisor
Program.
• Over 80 percent (86.7 percent; n = 720 of 830) knew of ExceleRate Illinois.
• Almost two-thirds of participants (69.4 percent; n = 558 of 804) had heard of the
consultant/specialist (e.g. Mental Health Consultant, Quality Specialist, Infant/Toddler
Specialist) services offered by the CCR&Rs.
• Over 80 percent (87.5 percent; n = 728 of 832) knew of the online training opportunities
available through the Gateways i-learning System.
• 21.5 percent of family child care homes (n = 195 of 970) had at least one Great START
recipient in the past two years. Those 195 programs had a total of 202 recipients.
• 3.6 percent (n = 35 of 970) of family child care programs had at least one Gateways to
Opportunity Scholarship participant for a total of 35 participants.
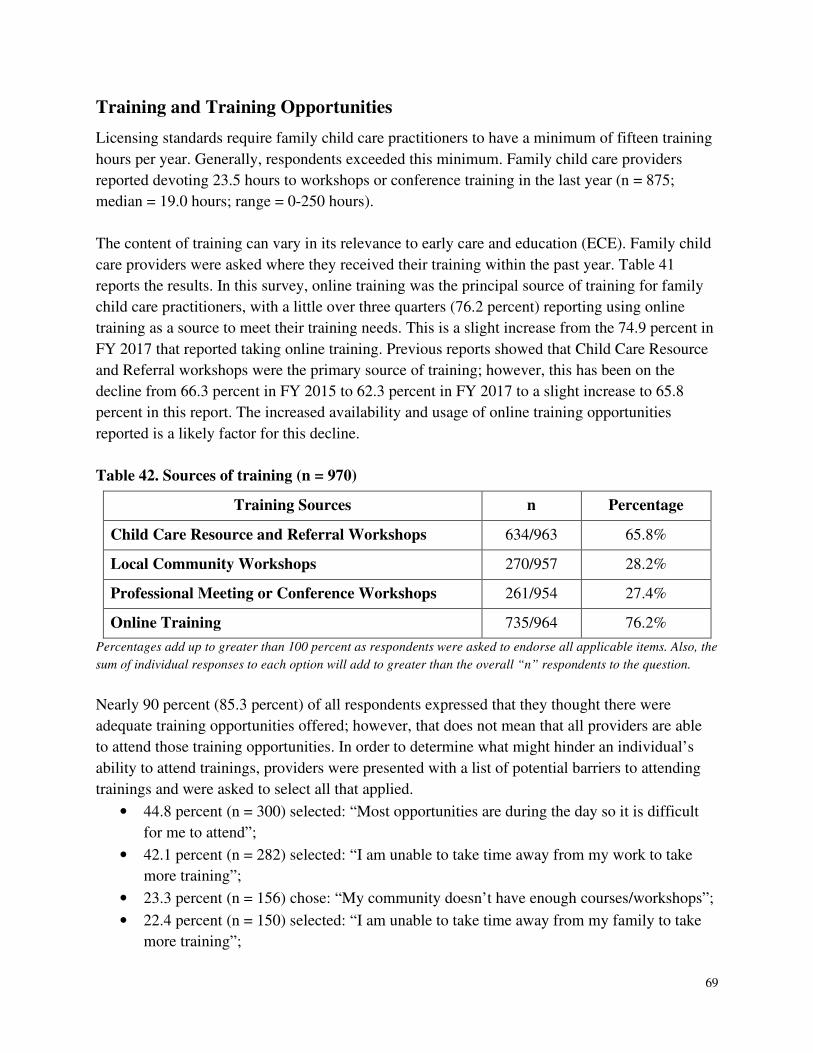
69
Training and Training Opportunities
Licensing standards require family child care practitioners to have a minimum of fifteen training
hours per year. Generally, respondents exceeded this minimum. Family child care providers
reported devoting 23.5 hours to workshops or conference training in the last year (n = 875;
median = 19.0 hours; range = 0-250 hours).
The content of training can vary in its relevance to early care and education (ECE). Family child
care providers were asked where they received their training within the past year. Table 41
reports the results. In this survey, online training was the principal source of training for family
child care practitioners, with a little over three quarters (76.2 percent) reporting using online
training as a source to meet their training needs. This is a slight increase from the 74.9 percent in
FY 2017 that reported taking online training. Previous reports showed that Child Care Resource
and Referral workshops were the primary source of training; however, this has been on the
decline from 66.3 percent in FY 2015 to 62.3 percent in FY 2017 to a slight increase to 65.8
percent in this report. The increased availability and usage of online training opportunities
reported is a likely factor for this decline.
Table 42. Sources of training (n = 970)
Training Sources n Percentage
Child Care Resource and Referral Workshops 634/963 65.8%
Local Community Workshops 270/957 28.2%
Professional Meeting or Conference Workshops 261/954 27.4%
Online Training 735/964 76.2%
Percentages add up to greater than 100 percent as respondents were asked to endorse all applicable items. Also, the
sum of individual responses to each option will add to greater than the overall “n” respondents to the question.
Nearly 90 percent (85.3 percent) of all respondents expressed that they thought there were
adequate training opportunities offered; however, that does not mean that all providers are able
to attend those training opportunities. In order to determine what might hinder an individual’s
ability to attend trainings, providers were presented with a list of potential barriers to attending
trainings and were asked to select all that applied.
• 44.8 percent (n = 300) selected: “Most opportunities are during the day so it is difficult
for me to attend”;
• 42.1 percent (n = 282) selected: “I am unable to take time away from my work to take
more training”;
• 23.3 percent (n = 156) chose: “My community doesn’t have enough courses/workshops”;
• 22.4 percent (n = 150) selected: “I am unable to take time away from my family to take
more training”;
70
• 23.7 percent (n = 159) selected the item: “Cost of training is too high”;
• 14.3 percent (n = 96) chose: “There is no reason to pursue more training”; and
• 4.9 percent (n = 33) selected the item “Quality of training is not good.”
Additionally, 6.4 percent (n = 43) selected the “Other” option and specified the following items
as barriers to attending trainings. Of the 43 providers that selected “Other”, 52.3 percent
indicated that the availability of trainings (timing of trainings, topic offerings, language barriers,
and enrollment capacity) was problematic. The remaining providers indicated that the trainings
were too far away (25.0 percent), they had financial barriers (16.7 percent), and had (5.6 percent)
personal circumstances that were preventing them from attending training.
Professional development is also available by taking coursework in early care and education at
higher education institutions. Practitioners were posed the question, “Have you completed any
ECE or CD coursework within the past two years?” Of the 923 practitioners who responded to
this survey question, 101 (10.9 percent) reported “yes” and reported an average of 34.8 semester
hours (median = 13.7) completed in the last two years.
Capacity and Enrollment
One aim of the Salary and Staffing Survey is to characterize the care environment of family child
care home practitioners. According to NACCRRAware, the average total licensed capacity of the
sample was approximately 10.0 (median = 9.0) children. The average licensed capacity of all
7,006 family child care providers on the database was 9.8 children.28
During a typical week, providers cared for an average of 8.2 (n = 958; median = 8.0) children
(excluding their own). 87.2 percent of providers indicated that they accept children whose
families receive IDHS or IDCFS financial assistance. Providers also responded that they have an
average of 4.9 (n = 846; median = 3.0) children in their program whose child care is being
funded through the Child Care Assistance Program (CCAP) or IDCFS vouchers.29 Providers
reported serving an average of 3.2 of all client families (n = 821; median = 2.0) who receive
financial assistance (from government, employers, local agencies) to subsidize child care costs.
28 Licensed capacity in NACCRRAware adds regular capacity and extended capacity together. Extended capacity signifies the number of before- and after-school children a provider may care for on top of their regular capacity. For any capacity typically over 8, an assistant is required to be present. 29 About 6.7 percent of providers indicated that they have had children/families on CCAP enrolled over the last 2 years but did not have any children on CCAP currently. Those providers were excluded from this analysis.
71
A greater proportion of respondents participating in ExceleRate Illinois at a level higher than the
Licensed Circle of Quality also served CCAP families in their programs. Participation in higher
levels of ExceleRate was not significantly associated with serving CCAP families (χ2 = 3.27, p =
.071) with 92.9 percent of providers higher than the Licensed Circle of Quality serving CCAP
families versus 7.1 percent of those providers not serving CCAP families in their programs.30
Family child care providers were also asked to rate the vacancies in their program on a scale
from 1 (“There are always vacancies”) to 5 (“There are never vacancies”). Out of 962 providers
answering this question, 42.2 percent of family child care providers felt that there were rarely or
never vacancies in their homes, 32.3 percent felt that there were sometimes vacancies, and 25.5
percent felt that there were always or often vacancies in their programs. Results from this survey
when compared to the 2017 survey results show a high degree of similarity. A provider shared
this perspective on having inconsistent enrollment:
• “Once I am able to find more children to enroll in my home daycare, I will be willing to
hire a qualified person to help me teach these growing minds.”
Assistants
IDCFS licensing requirement for staff in group homes and child care homes differ. Staff
employed in group homes must have a high school diploma or equivalent and be at least 18 years
of age if an on-site supervisor is present. If not, staff must be 21.31,32 Staff working in day care
homes are required to be at least 14 years of age, work under the direct supervision of the family
child care provider and be at least five years older than any child for which they provide care.33
In the 2019 Salary and Staffing Survey group family child care practitioners and family child
care practitioners reported on the assistants they employed. Of the 929 providers that responded
to the question, 36.3 percent (n = 337) indicated hiring paid assistants. Additionally, out of 854
respondents, 25.6 percent (n = 219) reported using unpaid assistants.
Paid family child care assistants received an average of $10.75 per hour (n = 308; median =
$10.00). Their typical work week averaged 19.4 hours (n = 480; median = 20.0).
30 Data from the Data Tracking Program (DTP) was used to obtain the ExceleRate™ Illinois status of all providers who participated in the Staffing and Salary Survey. 31 From Part 408 IDCFS Licensing Requirements for Group Day Care Homes, Section 408.45. All requirements can be found at http://www.ilga.gov/commission/jcar/admincode/089/089004080000450R.html 32 For employees 18 and older, the Illinois Internal Revenue Service requires the employer to withhold federal income tax from the employee’s paycheck plus the employers’ portion of Social Security and Medicare taxes. From the Internal Revenue Website: https://www2.illinois.gov/rev/research/publications/pubs/Documents/Pub-130.pdf 33From Part 406 IDCFS Licensing Requirements for Day Care Homes, part 406.10. All requirements can be found at http://www.ilga.gov/commission/jcar/admincode/089/08900406sections.html
72
There is a large discrepancy in the range of hourly wages reported for assistants. Since a minor
can work in a family day care, family child care providers can hire their own children. Although
minimum wage for youths under the age of 18 is $7.75,34 providers can hire their eligible teenage
children for less; however, with the exception of an employer’s parent, spouse, or child, or other
members of his or her immediate family, Minimum Wage Law requires an employer to pay an
employee 18 years of age or older at least $8.25 per hour (minimum wage).35, 36
Family child care practitioners were then asked to provide additional thoughts about staffing in
the comments section of the survey. The primary theme was about being able to afford to have
an assistant and to pay them a competitive wage. Below are some representative comments.
• “It is very difficult to attract and keep staff for extended periods of time, because of the
wage I am able to offer and still make enough to help support my husband and myself..”
• “I would like to offer more pay, but due to my expenses it is hard to increase their pay. In
order to increase wages, it would mean increasing the child care rate. I try to keep an
affordable rate, for my parents. I do offer an annual raise, but that is limited.”
Business Characteristics
Hours
Respondents (n = 801) indicated that they get paid to work an average of 51.0 hours per week
(median = 50.0 hours) taking care of children, and their child care home operates an average of
49.4 weeks per year (n = 823; median = 51.0 weeks).
In addition to hours spent directly with children, providers reported spending an average of 17.7
hours per week (n = 817; median = 12.0 hours) on various activities performed before or after
business hours. These activities include preparing food, shopping, cleaning, record keeping, and
preparing educational activities for the children.
Practitioners were also asked whether they ever closed for holidays, vacation, sick days, training,
or any other occasion. Out of 823 providers who responded, 95.4 percent (n = 823) responded
affirmatively; a slight decrease from the previous survey. The average number of days closed per
year was 15.0 days (median = 14.0 days, n = 823).
34 From ”State of Illinois – Department of Labor Hourly Minimum Wage Rates by Year”, Illinois Department of Labor, <https://www2.illinois.gov/idol/Laws-Rules/FLS/Pages/minimum-wage-rates-by-year.aspx> 35 From “Illinois Compiled Statutes (820 ILCS 105/) Minimum Wage Law”, Illinois General Assembly, http://www.ilga.gov/legislation/ilcs/ilcs3.asp?ActID=2400&ChapterID=68 36 Based on this rationale, all reported wages under $7.75 were excluded from this analysis.
73
Earnings and Operating Expenses
Practitioners were queried about their annual expenses for food, utilities, insurance, and
materials; all expenses except wages. Average annual expenses totaled $16,534.59 (median =
$13,281.68) for the 642 providers who responded to this question. Expenses in 2019 were
slightly higher compared to those reported in the past two surveys.
Licensed family child care providers were asked to report their gross and net annual earnings.
The average annual gross earning was $33,669.75 (n = 707; median = $30,000). FY 2019
reported earnings were slightly higher than those reported in FY 2015 and FY2017. This
survey’s reported annual net earnings (n = 654) averaged $14,868.33 (median = $12,000). In FY
2017, respondents reported average net earnings of $14,122, with a median of $11,000. In FY
2019:
• 25 percent of family child care providers netted less than $4,975.50;
• 50 percent of family child care providers netted less than $12,000; and
• 75 percent of family child care providers netted less than $22,000.
In FY 2019, the average hourly wage family child care providers earned was $8.81 (compared to
the state minimum wage of $8.25 per hour);37 however, this hourly wage only reflects the
average length of time that direct service is provided to children. When the average hours spent
cleaning, preparing food, shopping, recordkeeping, and preparing educational activities for
children (17.7 hours) are factored into the equation, child care providers work on average 68.7
hours per week and average $7.04 per hour.
As independent business owners, family child care providers set their own rates. Rates can
exceed the CCAP rates reimbursed by the state. Providers can choose to have parents pay the
difference between the CCAP reimbursement rates and their private rates. In FY 2019, providers
were asked to provide information about their experience with the IDHS subsidy program. These
questions specifically addressed whether providers charged parents more than their CCAP
copays, the difficulty they experience in collecting copays, and whether or not the difficulty in
collecting copays had changed in the past two years. Out of 825 respondents, 17.3 percent of
providers (n = 143) reported charging families more than their CCAP copay; 82.7 percent (n =
682) of providers reported charging families their CCAP copay only. Out of 752 practitioners
who rated the difficulty of collecting copays, 46.9 percent reported that collecting copays was
“very easy or somewhat easy,” 18.6 percent responded that it was “neither easy nor difficult”,
and 34.4 percent responded that collecting copays was “somewhat difficult or very difficult.” In
response to whether the difficulty in collecting copays had changed in the past two years, out of
750 respondents, 22.7 percent responded that collecting copays had become “much easier or
37 The average hourly wage of a family child care practitioner can be calculated using the formula: Average net income ÷ (average of hours worked per week X average number of weeks worked per year).
74
somewhat easier”, 58.3 percent responded the difficulty in collecting copays had “stayed about
the same”, and 19.1 percent responded that collecting copays had become “somewhat or much
more difficult.”
Providers were then asked to rate how their financial situation had changed in the past two years.
In response to changes in their gross annual earnings, out of 833 providers responding to the
question, 12.8 percent said their gross income had decreased greatly, 23.9 percent said their gross
income had decreased somewhat, 43.1 percent stated their gross income remained about the
same, 17.6 percent said their gross income had increased somewhat, and 2.5 percent responded
that their gross income had increased greatly.
In response to changes about their net annual earnings, out of 812 providers, 13.5 percent said
their net income had decreased greatly, 26.4 percent responded that their net income had
decreased somewhat, 44.3 percent stated their net income had remained about the same, 13.5
percent responded that their net income had increased somewhat, and 2.2 percent responded that
their net income had increased greatly.
When asked about changes in their annual expenses, out of 832 providers, 9.0 percent responded
that their annual expenses had increased greatly, 35.2 percent stated their annual expenses had
increased somewhat, 38.1 percent said their annual expenses remained about the same, 11.9
percent stated their annual expenses decreased somewhat, and 5.8 percent stated their annual
expensed had decreased greatly.
Other Income Sources
Providers were asked to report on other sources of income beyond their family child care
programs. Just under one tenth of providers (9.2 percent) reported having a second paid job.
Nearly 60 percent of providers (56.5 percent) indicated there was at least one other adult who
contributed to their household income. In addition, the Child and Adult Food Care Program38
was an income source identified the majority of providers (82.6 percent).
Fee Policies
Family child care homes are considered small businesses; therefore, fee policies are decided by
the owner(s). As Table 42 shows, the majority of family child care providers chose to be paid
when children are absent due to sickness. In addition, 75.4 percent of providers require parents to
38 The Child and Adult Care Food Program is a nutritional program funded through the USDA. In Illinois, this reimbursement program is administered by the Illinois State Board of Education. The program educates providers about proper nutrition and reimburses them for the meals and snacks they serve to children in care.
75
pay when the child care home is closed for holidays and 49.9 percent require payment when the
home is closed for vacation days. More than half of providers (58.2 percent) require parents to
pay for days the child is on vacation. The preponderance of providers do not require parents to
pay for days when the family child care home is closed due to provider illness or workshop
attendance. When day care homes are closed for other reasons (e.g., family emergencies,
bereavement, jury duty, doctor appointments, personal days, or inclement weather), 17.6 percent
of family child care practitioners require parents to pay for these days. Although no questions
specifically pertained to how providers construct their fee policies, the survey asked practitioners
to record any additional thoughts they had about compensation in the field of child care. Some
comments were:
• “With the new minimum wage laws, it is going to be hard to pay my helpers $15 an hour
and still be able to make my current wage. I will have to raise tuition for my clients in
order to keep my business at the same level without giving myself a raise.”
• “It would be great if the state would pay my going rate for CCAP kids. I don't feel that
they pay a living wage for taking a CCAP, and then waiting a full month or longer for
reimbursement for time.”
Table 43. Fee policies (n=667)
Provider is paid when… n Percentage
Children are absent because they are sick 494 76.9%
Children are on vacation 374 58.2%
You are closed for holidays 483 75.4%
You are closed for vacation days 320 49.9%
You are closed for sick days 202 31.4%
You are closed for training days 118 18.5%
Other reasons 108 17.6%
Note: Percentages add up to greater than 100 percent as respondents were asked to endorse all items applicable to
their programs.
IDCFS requires family child care homes to have a written policy that describes what will occur if
a child is picked-up late. This policy also includes information about any late fees that will
accrue. Out of 841 practitioners who responded to this question, 54.0 percent charged a late fee
(or early drop-off fee). The fee for late pick up or early drop off averaged $2.63 (median =
$1.00) per minute for family child care providers who stated their fee (n = 432).
76
Financial Assistance
Family child care practitioners were provided with a list of financial assistance resources and
asked the question: “In the past two years, have you received any types of financial assistance?”
Approximately one quarter of the total respondents selected one or more of the financial
assistance resources. Specifically:
• 14.3 percent selected “Medicaid/Medicare for yourself”;
• 7.5 percent selected “Medicaid for your children”;
• 5.0 percent selected “Food stamps/SNAP”;
• 5.6 percent selected “KidCare for your child(ren)”;
• 0.6 percent selected “Subsidized housing/Section 8”;
• 0.6 percent selected “FamilyCare for yourself”; and,
• 0.6 percent selected “TANF/AFDC”.
Benefits
Practitioners were asked whether they were currently covered by any health insurance or medical
plan. In response, 91.9 percent (n = 767) of the 835 child care practitioners that responded
reported having health care coverage. As with 2015 and 2017, this represents a significant
increase over the 80.4 percent reported in 2013 and is likely due to requirements of the
Affordable Care Act. Further analysis of health care coverage shows that 12.8 percent received
full coverage and 21.8 percent received partial coverage through their spouse’s employer, 24.8
percent purchased health insurance on their own, and 18.9 percent reported that they were
Medicaid/Medicare eligible. Of respondents, 21.0 percent had paid health care coverage received
through a variety of other sources, including as retirement benefits from previous employers,
community health services, and through SEIU (union for family child care providers). There
were 0.8 percent of respondents who indicated they have health care coverage but that did not
respond to one of the options displayed.
Over 60 percent of practitioners (61.2 percent) indicated that they contribute to Social Security
and Medicare. When asked the question, “In the last year, have you set aside any savings for
your retirement,” just over one quarter of the respondents (29.8 percent) said they had (slightly
up from 27.8 percent in the 2015 report and 29.4 in 2017).
Per the comment section of the survey, many practitioners expressed anxiety about the lack of
affordable health care insurance (including dental and vision care) available to child care
providers and their families. In addition, many acknowledged the need for retirement benefits.
One provider’s remarks are shown below.
• “Even though I am my own boss and I am self-employed, I feel like the state has more
control over my job than what I do. With that being said and with the state regulating
77
certain aspects of my job and controlling all the testing I have to do every year, every
other year and every 3 years, I feel as if Child Care Providers should be entitled to State
Benefits including insurance, Retirement Plans, Social Security, Paid time off, etc. As a
provider we work more hours than the average person and should be compensated for
it.”
Professional Support
Family child care practitioners often work alone and have no other adults within close proximity.
Research suggests that the lack of “social, instrumental, and problem-solving support over a long
workday as the only adult in the setting” and the lack of support when “having to play multiple
roles” are potential sources of stress for providers. One way to combat that stress is to use
support services such as participation in a professional organization or network with other
professionals. 39 Based on this rationale, providers were asked whether they had any contact with
any other child care professionals. A predominance of home-based practitioners (84.3 percent)
responding to the survey indicated that they have at least one other child care professional with
whom they can discuss a problem in their program.
There are national, state, regional and local child care associations that support the needs of
family child care providers. A little over half of respondents (51.6 percent; n = 429 of 832)
reported that they were members of a child care association. Two-thirds (66.8 percent; n = 564 of
844) indicated that they utilized their Child Care Resource and Referral (CCR&R) as a
professional support in the past two years. Local CCR&Rs provide various services to child care
professionals.
Turnover
Practitioners were asked to identify the length of time they would continue to operate their day
care home. Nearly two-thirds (62.2 percent; n = 526) of providers responded “I don’t know”; this
is similar to what was reported in FY 2017 and FY 2015, but is an increase from the 50.0 percent
reported in the FY 2013 survey report. The remainder of providers (n = 319) indicated they
would continue to provide child care in their homes for an average of thirteen years (mean = 13.1
years; median = 8.0 years). This is an increase from the previous survey, which reported a mean
of 8.4 years and median of 6.0 years.
39 Charlyn Harper Brown, “Strengthening Families: Almost Like Family: Family Child Care”, Center for the Study of Social Policy, October 2009. https://cssp.org/resource/almost-like-family-family-child-care/
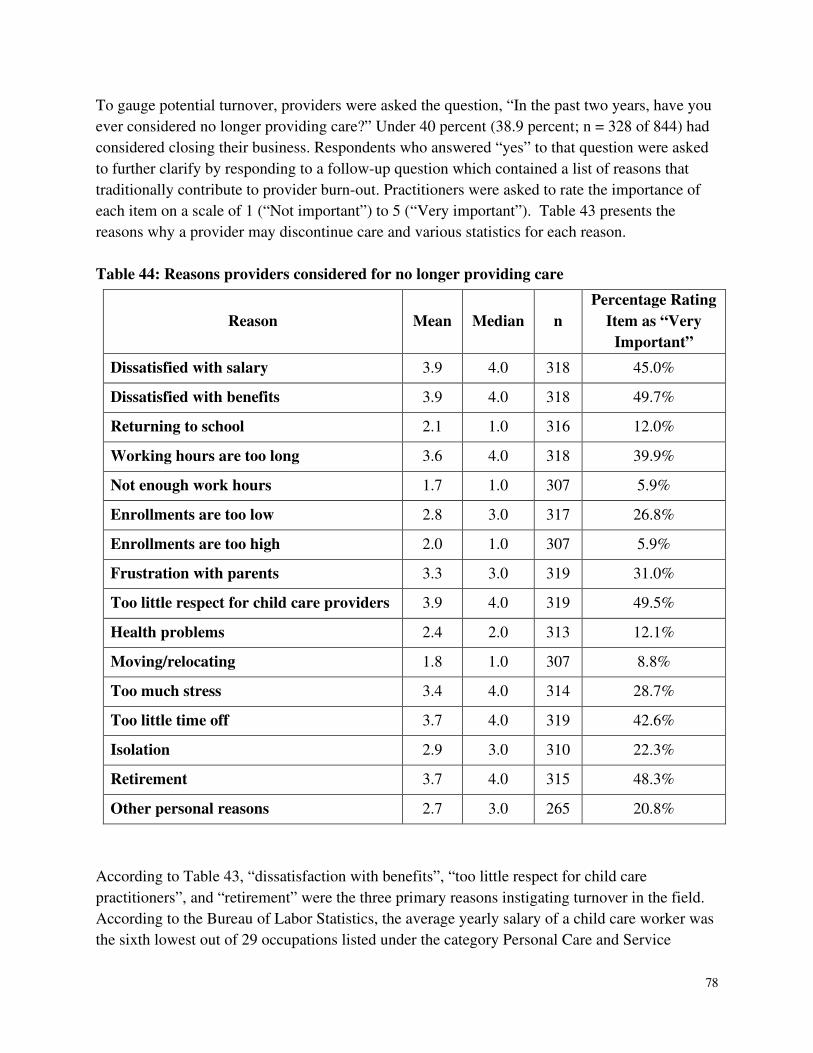
78
To gauge potential turnover, providers were asked the question, “In the past two years, have you
ever considered no longer providing care?” Under 40 percent (38.9 percent; n = 328 of 844) had
considered closing their business. Respondents who answered “yes” to that question were asked
to further clarify by responding to a follow-up question which contained a list of reasons that
traditionally contribute to provider burn-out. Practitioners were asked to rate the importance of
each item on a scale of 1 (“Not important”) to 5 (“Very important”). Table 43 presents the
reasons why a provider may discontinue care and various statistics for each reason.
Table 44: Reasons providers considered for no longer providing care
Reason Mean Median n
Percentage Rating
Item as “Very
Important”
Dissatisfied with salary 3.9 4.0 318 45.0%
Dissatisfied with benefits 3.9 4.0 318 49.7%
Returning to school 2.1 1.0 316 12.0%
Working hours are too long 3.6 4.0 318 39.9%
Not enough work hours 1.7 1.0 307 5.9%
Enrollments are too low 2.8 3.0 317 26.8%
Enrollments are too high 2.0 1.0 307 5.9%
Frustration with parents 3.3 3.0 319 31.0%
Too little respect for child care providers 3.9 4.0 319 49.5%
Health problems 2.4 2.0 313 12.1%
Moving/relocating 1.8 1.0 307 8.8%
Too much stress 3.4 4.0 314 28.7%
Too little time off 3.7 4.0 319 42.6%
Isolation 2.9 3.0 310 22.3%
Retirement 3.7 4.0 315 48.3%
Other personal reasons 2.7 3.0 265 20.8%
According to Table 43, “dissatisfaction with benefits”, “too little respect for child care
practitioners”, and “retirement” were the three primary reasons instigating turnover in the field.
According to the Bureau of Labor Statistics, the average yearly salary of a child care worker was
the sixth lowest out of 29 occupations listed under the category Personal Care and Service
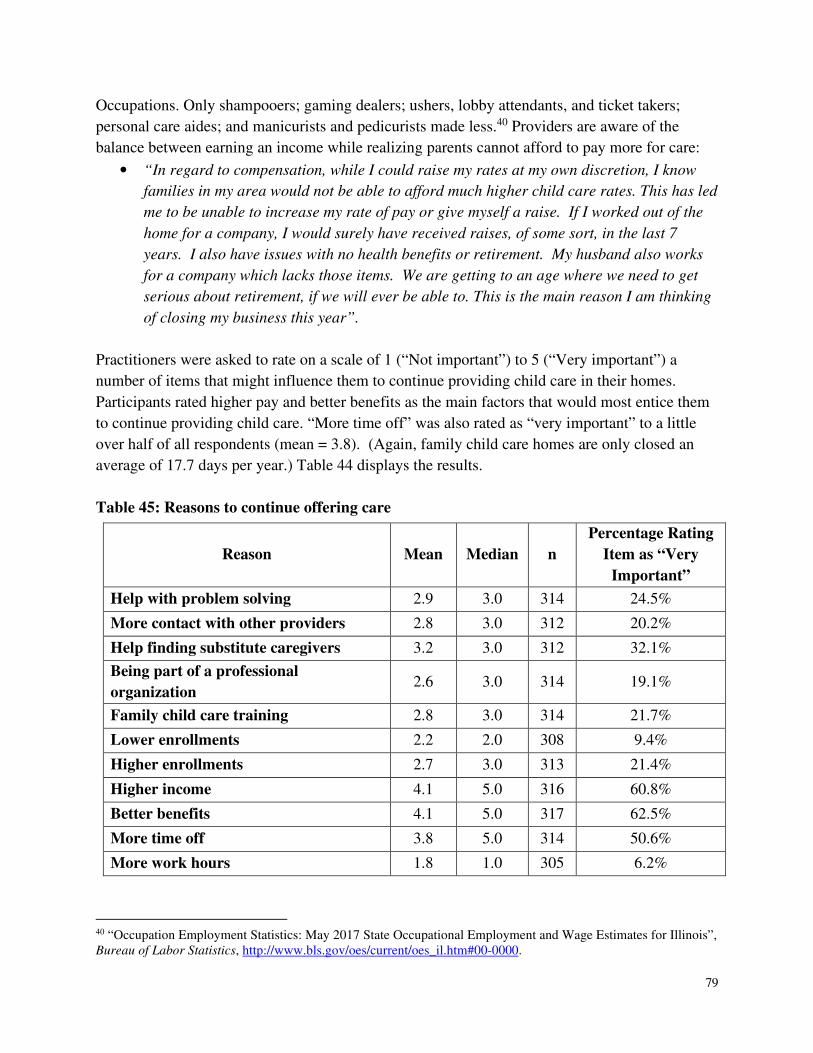
79
Occupations. Only shampooers; gaming dealers; ushers, lobby attendants, and ticket takers;
personal care aides; and manicurists and pedicurists made less.40 Providers are aware of the
balance between earning an income while realizing parents cannot afford to pay more for care:
• “In regard to compensation, while I could raise my rates at my own discretion, I know
families in my area would not be able to afford much higher child care rates. This has led
me to be unable to increase my rate of pay or give myself a raise. If I worked out of the
home for a company, I would surely have received raises, of some sort, in the last 7
years. I also have issues with no health benefits or retirement. My husband also works
for a company which lacks those items. We are getting to an age where we need to get
serious about retirement, if we will ever be able to. This is the main reason I am thinking
of closing my business this year”.
Practitioners were asked to rate on a scale of 1 (“Not important”) to 5 (“Very important”) a
number of items that might influence them to continue providing child care in their homes.
Participants rated higher pay and better benefits as the main factors that would most entice them
to continue providing child care. “More time off” was also rated as “very important” to a little
over half of all respondents (mean = 3.8). (Again, family child care homes are only closed an
average of 17.7 days per year.) Table 44 displays the results.
Table 45: Reasons to continue offering care
Reason Mean Median n
Percentage Rating
Item as “Very
Important”
Help with problem solving 2.9 3.0 314 24.5%
More contact with other providers 2.8 3.0 312 20.2%
Help finding substitute caregivers 3.2 3.0 312 32.1%
Being part of a professional
organization 2.6 3.0 314 19.1%
Family child care training 2.8 3.0 314 21.7%
Lower enrollments 2.2 2.0 308 9.4%
Higher enrollments 2.7 3.0 313 21.4%
Higher income 4.1 5.0 316 60.8%
Better benefits 4.1 5.0 317 62.5%
More time off 3.8 5.0 314 50.6%
More work hours 1.8 1.0 305 6.2%
40 “Occupation Employment Statistics: May 2017 State Occupational Employment and Wage Estimates for Illinois”, Bureau of Labor Statistics, http://www.bls.gov/oes/current/oes_il.htm#00-0000.
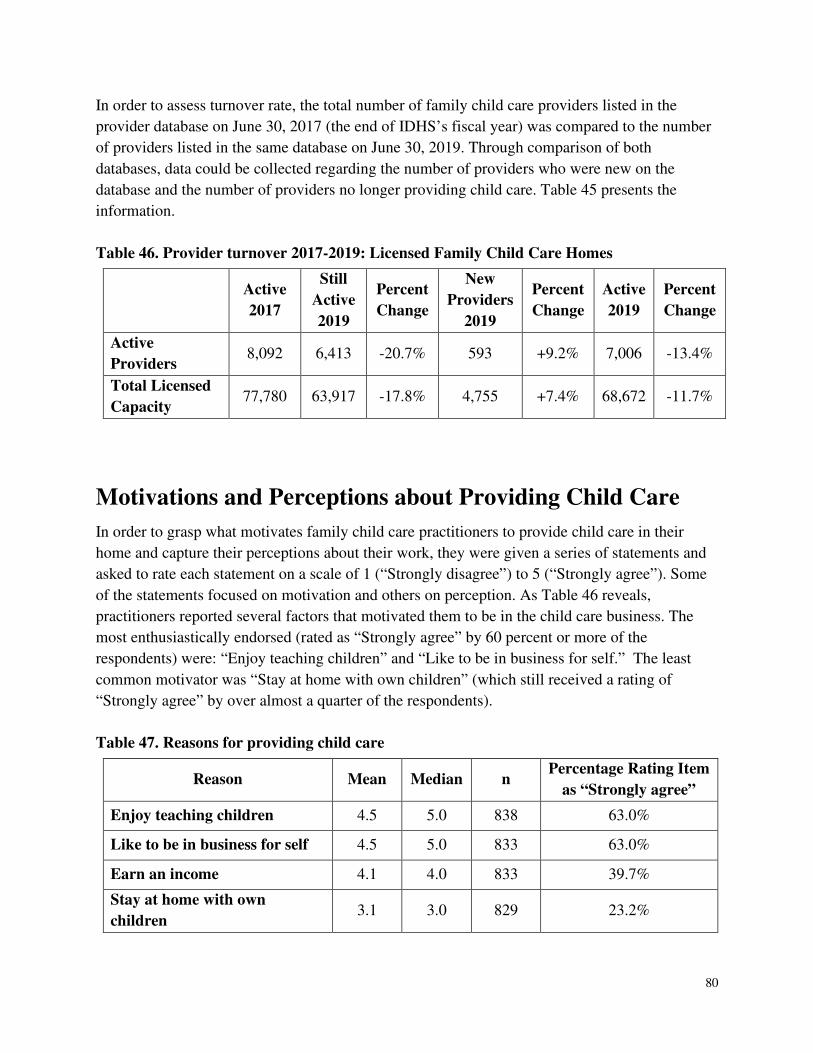
80
In order to assess turnover rate, the total number of family child care providers listed in the
provider database on June 30, 2017 (the end of IDHS’s fiscal year) was compared to the number
of providers listed in the same database on June 30, 2019. Through comparison of both
databases, data could be collected regarding the number of providers who were new on the
database and the number of providers no longer providing child care. Table 45 presents the
information.
Table 46. Provider turnover 2017-2019: Licensed Family Child Care Homes
Active
2017
Still
Active
2019
Percent
Change
New
Providers
2019
Percent
Change
Active
2019
Percent
Change
Active
Providers 8,092 6,413 -20.7% 593 +9.2% 7,006 -13.4%
Total Licensed
Capacity 77,780 63,917 -17.8% 4,755 +7.4% 68,672 -11.7%
Motivations and Perceptions about Providing Child Care
In order to grasp what motivates family child care practitioners to provide child care in their
home and capture their perceptions about their work, they were given a series of statements and
asked to rate each statement on a scale of 1 (“Strongly disagree”) to 5 (“Strongly agree”). Some
of the statements focused on motivation and others on perception. As Table 46 reveals,
practitioners reported several factors that motivated them to be in the child care business. The
most enthusiastically endorsed (rated as “Strongly agree” by 60 percent or more of the
respondents) were: “Enjoy teaching children” and “Like to be in business for self.” The least
common motivator was “Stay at home with own children” (which still received a rating of
“Strongly agree” by over almost a quarter of the respondents).
Table 47. Reasons for providing child care
Reason Mean Median n Percentage Rating Item
as “Strongly agree”
Enjoy teaching children 4.5 5.0 838 63.0%
Like to be in business for self 4.5 5.0 833 63.0%
Earn an income 4.1 4.0 833 39.7%
Stay at home with own
children 3.1 3.0 829 23.2%
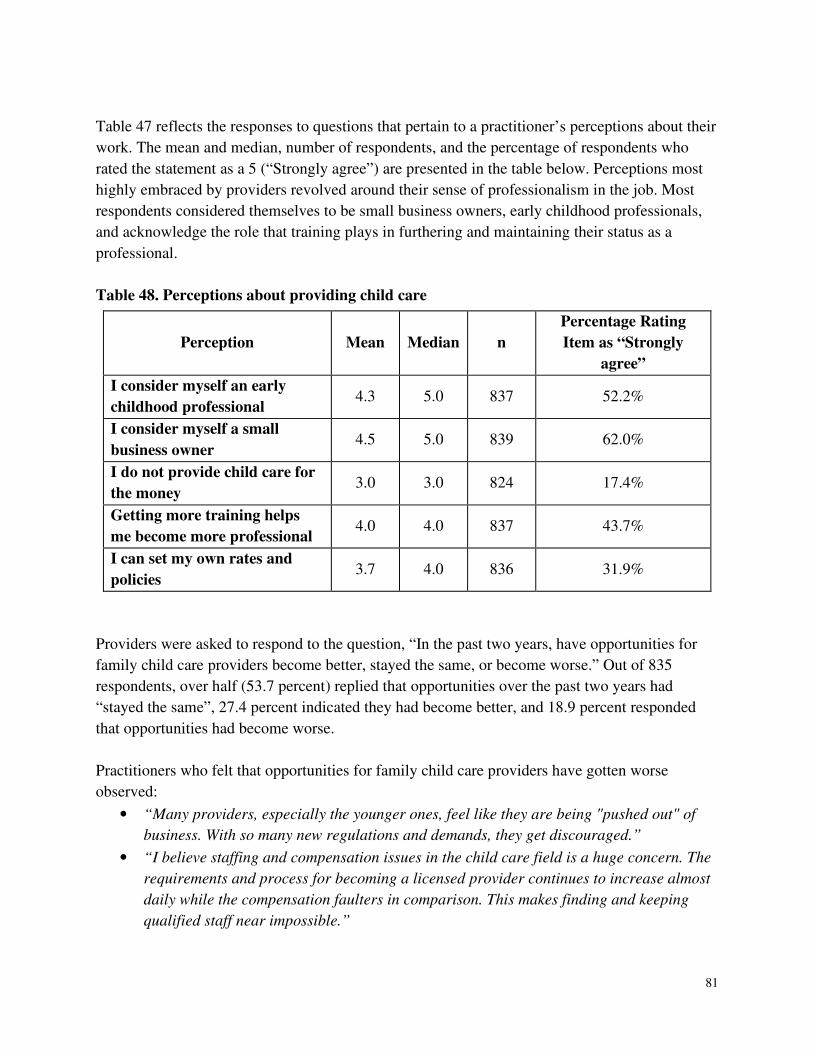
81
Table 47 reflects the responses to questions that pertain to a practitioner’s perceptions about their
work. The mean and median, number of respondents, and the percentage of respondents who
rated the statement as a 5 (“Strongly agree”) are presented in the table below. Perceptions most
highly embraced by providers revolved around their sense of professionalism in the job. Most
respondents considered themselves to be small business owners, early childhood professionals,
and acknowledge the role that training plays in furthering and maintaining their status as a
professional.
Table 48. Perceptions about providing child care
Perception Mean Median n
Percentage Rating
Item as “Strongly
agree”
I consider myself an early
childhood professional 4.3 5.0 837 52.2%
I consider myself a small
business owner 4.5 5.0 839 62.0%
I do not provide child care for
the money 3.0 3.0 824 17.4%
Getting more training helps
me become more professional 4.0 4.0 837 43.7%
I can set my own rates and
policies 3.7 4.0 836 31.9%
Providers were asked to respond to the question, “In the past two years, have opportunities for
family child care providers become better, stayed the same, or become worse.” Out of 835
respondents, over half (53.7 percent) replied that opportunities over the past two years had
“stayed the same”, 27.4 percent indicated they had become better, and 18.9 percent responded
that opportunities had become worse.
Practitioners who felt that opportunities for family child care providers have gotten worse
observed:
• “Many providers, especially the younger ones, feel like they are being "pushed out" of
business. With so many new regulations and demands, they get discouraged.”
• “I believe staffing and compensation issues in the child care field is a huge concern. The
requirements and process for becoming a licensed provider continues to increase almost
daily while the compensation faulters in comparison. This makes finding and keeping
qualified staff near impossible.”
82
• “Every year gets harder and harder to stay in business. Especially being financially
responsible on my own with no spouse. Every year I consider more and more about
quitting because it is almost impossible to do financially on my own.”
Practitioners who felt that opportunities for family child care providers had gotten better focused
solely on support, resources, and training opportunities.
• “Thank you for the Great START program. This helps out a lot. I appreciate the help that
INCCRRA offers to us providers.”
• “The Great START program and assistance for classes are great...I count on the Great
START program monies that are available. I appreciate the online classes as well.”
Providers offered a plethora of other comments which reflected the issues they were facing in
their child care programs. Some focused on the practitioner’s perceptions and feelings towards
the parents in their programs. Others commented about how the public continues to perceive the
profession as “babysitting”. There were concerns raised about the rules and regulations that must
be in compliance with in order to maintain a day care home license (conversely, some providers
stated the rules were not strict enough and were not adequately enforced). Some of the
practitioners voiced concern over unlicensed or “illegal” day care homes that exist and its impact
on their business. Moreover, many expressed the difficulties they have experienced due to the
state of the economy with many parents unemployed and therefore not needing child care
services. Many practitioners shared the various financial difficulties they experienced due to late
payments from the state and/or from parents.
• “I think that parents stress themselves out by waiting till the last moment to pay their
copay instead of breaking it down into weekly payment.
• “I live in an area struggling for employment opportunities, so I don't get to raise my
rates very often. I usually lose families due to loss of employment so I try to keep my rates
as affordable as I can. I do offer "payment arrangements" to help those who struggle,
especially with the co-payments.”
Despite the frustrations that family child care providers may face, there were many comments
describing their passion and love for early care and education and the children for which they
care.
• “I enjoy working with children and teaching them. It has given me rewarding experiences
and opportunities to help children learn and grow before they enter school.”
• “…I am happy with my number of kids I have and I do not want to watch more, I am
licensed for 8 and I care for 8, very rarely do I have all 8 at once, but it is a joyful job
and I am blessed by the families I help. Thanks.”
83
Conclusion
Child care is a vital foundational service that allows for employment and economic betterment
for families. Without affordable quality care options, parents are less likely to function
effectively in their jobs and children are less likely to receive the developmentally stimulating
environments proven to benefit them. Research has shown high quality child care contributes to
young children’s social competence and cognitive development.41 A nurturing and stable
relationship with a provider is one important component of high-quality care settings. According
to the National Association for the Education of Young Children, the education and stability of
the child care workforce are critical to the well-being of children and their working parents.
Young children have much to gain from a well-educated and stable child care workforce;
however, Child Care Aware of America asserts that the minimal requirements for education
(many states do not require any education beyond high school) and the high turnover rate among
child care practitioners (roughly one-third leave the field each year42) is challenging the
opportunity for quality child care to be achieved and maintained. In knowing the importance of
education and continuity in the care of children, it is important to learn more about the child care
workforce within the state of Illinois as a means of ensuring quality care for all children. As
such, the Illinois Salary and Staffing Survey provides in-depth information every two years about
wages, salaries and benefits, and other information pertinent to the child care work environment
in licensed child care centers and in licensed family child care homes. To complement the
Illinois Salary and Staffing Survey, the Gateways to Opportunity Registry can provide more
frequently collected and updated information regarding several workforce characteristics,
including qualifications and salaries.
The majority of the child care workforce in Illinois has attained formal education beyond high
school. Most practitioners in centers and homes had some college education. In addition, 67.1
percent of early childhood teachers and 28.7 percent of family child care practitioners had earned
an associate, bachelor’s, or master’s degree. Further, 27.1 percent of early childhood teachers
earned their degree in early childhood education (ECE) or child development (CD), and 9.3
percent of family child care providers earned their degree in ECE/CD.
As is the case at the national level, job turnover among child care providers in Illinois is a
continuing problem. The past two years showed a turnover rate of 32.1 percent for early
childhood teachers and a 46.1 percent turnover rate for early childhood teacher assistants, both
representing increases from the previous survey. The primary reason reported for early childhood
41 D. Vandell, J. Belsky, M. Burchinal, N. Vandergrift, & L. Steinberg. “Do effects of early child care extend to age 15 years? Results from the NICHD study of early child care and youth development.” Child Development, 2010, http://nieer.org/research-report/do-effects-of-early-child-care-extend-to-age-15-years-results-from-the-nichd-study-of-early-child-care-and-youth-development 42 Noriko Porter, “[USA] High Turnover among Early Childhood Educators in the United States.” Child Research Net, August 17, 2012, https://www.childresearch.net/projects/ecec/2012_04.html
84
teacher departure was “dissatisfied with pay”; which is consistent when compared to the
predominant reasons cited in past surveys (with the exception of FY11). Other principal reasons
reported for staff departure included dissatisfaction with schedule, personal or family issues, or
unhappy with job duties. As many of these reasons were endorsed at a similar rate by directors, it
suggests that the reasons for turnover are usually complicated, especially since many directors
also rated each reason for leaving by indicating there was a “personal reason” associated with the
staff departure. Since data for this survey are gathered from directors or other administrative staff
and not the departing staff member, having staff directly respond with their reasons for leaving
might yield richer findings.
In the past two years, 38.9 percent of family child care practitioners considered closing their
child care home; one in five did. Dissatisfaction with salary and benefits, and “too little respect
for child care providers” were the predominant reasons reported.
When it comes to compensation, patterns of compensation for center positions were varied. Per
the FY 2019 survey, the hourly wages of administrative directors saw an increase from the FY
2017 survey. Hourly wages for early childhood teachers, early childhood assistants, school-age
teachers, and school-age assistants had slight increases compared to the previous reporting
period.
The median hourly wage for an early childhood teacher in 2019 was $13.00, as compared to
$12.50 in 2017, $12.00 in 2015, $11.04 in 2013, $11.50 in 2011, and $11.00 reported in 2009.
Assuming a full-time early childhood teacher position equals 40 hours per week, 52 weeks per
year, gross annual salary would equal $27,040. This represents more than twice the median net
earnings of licensed family child care providers whose 2019 reported earnings were $12,000.
This is the same as reported in 2017 and lower than the $13,000 reported in 2013.
Wages differed substantially in centers around the state. Early childhood teachers employed in
Carterville (located in southern Illinois) earned a median hourly wage of $10.88 per hour
compared to early childhood teachers in Glendale Heights (located in northern Illinois) who
earned a median hourly wage of $14.61, a difference of nearly $4.00 per hour. Level of
education also mattered, as teachers with more education earned more than those without
degrees. Moreover, teachers who majored in early childhood education (ECE) or child
development (CD) and obtained an associate, bachelor’s, or master’s degree, earned more than
teachers with a degree in another field.
In addition to the low wages of the child care workforce, the benefits are also meager. Although
at least 77 percent of centers reported offering paid vacation, holidays and sick leave, only 51.7
percent offered health insurance, and 45.7 percent offered a retirement/pension plan. Life
insurance was offered by only 45.8 percent of centers. While centers may provide benefits to
85
employees as part of their compensation, family child care practitioners must pay for their own.
Although 91.9 percent of family child care providers were covered by a health plan, many
received coverage through their spouse’s employer. Other benefits are modest for family child
care providers who reported being closed only a median of 14 days per year. While 75.4 percent
charged when closed for holidays, only 49.9 percent charged when closed for vacation.
Substantially fewer charged when closed for sick days or training days. Providers indicated that
they did not charge when closed because they were sensitive to their clients’ financial situations
and they did not think their clients would pay.
As in past Salary and Staffing Surveys, low wages and poor benefits were voiced to be a major
concern by all survey respondents. Aside from the obvious financial stress these factors create
for providers, they underscore a lack of value and respect for the child care labor force. These
dynamics continue to be a driving force for turnover in the child care field. Throughout the
survey, while providers and administrators repeatedly described their love of and dedication to
children and their development, they also admitted that they need to make a living. In the end,
many expressed pessimism about the child care field and a plea for help to supplement income,
educate parents, and provide benefits. If these survey results and comments have any predictive
value, it may be to forecast a continuing ambivalence toward the profession among practitioners
at all levels of the child care workforce.
In spite of these somber findings, survey results also indicate there are some reasons for
optimism. The frequency of directors and family child care providers who are aware of
Gateways to Opportunity programs and other support programs suggests that there is more
awareness of the resources and options that some centers and providers are able to access that
provides some compensation for lower wages and benefits in the field of child care.
Several statewide programs support provider education and help reduce turnover. Survey
respondents acknowledged these to be valuable supports to the child care field. The Gateways to
Opportunity Scholarship Program awards partial college scholarships for both center and family
child care practitioners to further their education in early childhood or school-age care. The
Great START wage supplement program offers a stipend every six months to center and home-
based providers based on their educational achievements (as long as they remain at their present
place of employment). ExceleRate Illinois enhances the income of programs which provide
quality care to CCAP enrolled children by providing a supplemental add-on to the CCAP
reimbursement rate. Participating programs also receive support and recognition for their
commitment to providing quality child care. The Gateways to Opportunity Credentials recognize
the education, experience, and professional contributions of early childhood practitioners. The
ExceleRate Circles of Quality, above the Licensed Circle, require that a percentage of personnel
have achieved a Gateways Credential. Such programs can help improve the compensation
possibilities of practitioners, thus leading to lower turnover and ultimately higher quality of child
care in Illinois.

86
Appendix A: Survey Instruments
Child Care Center Survey
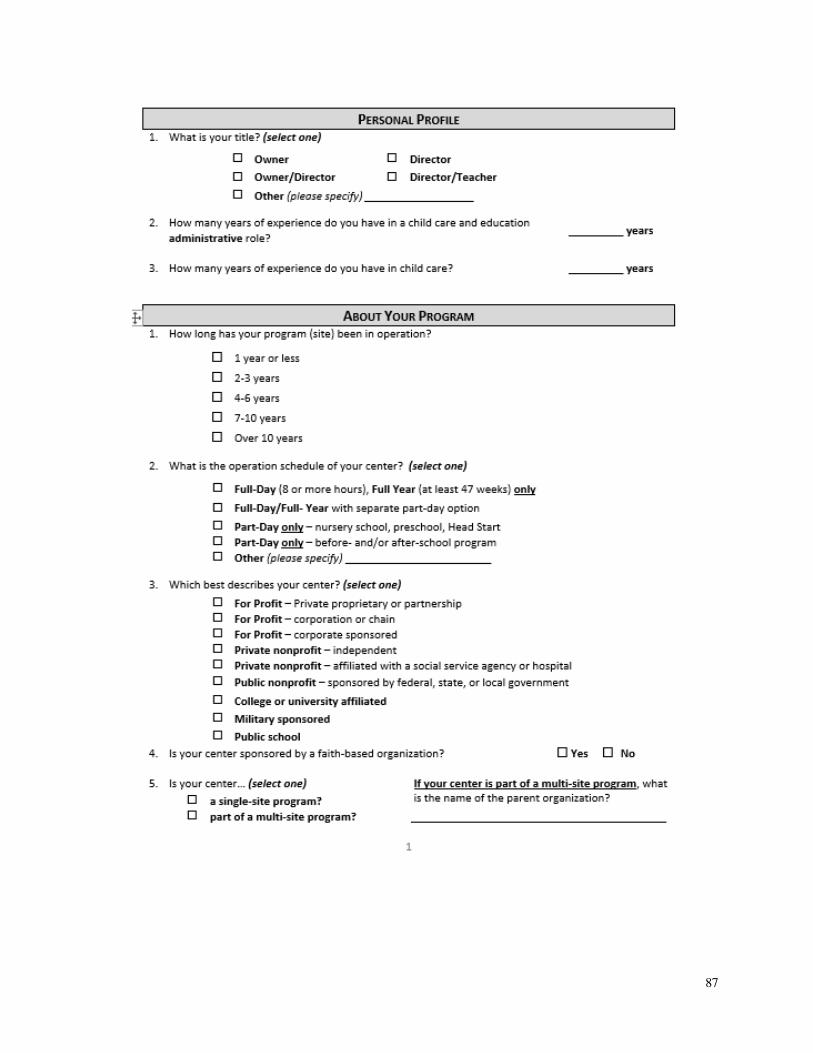
87
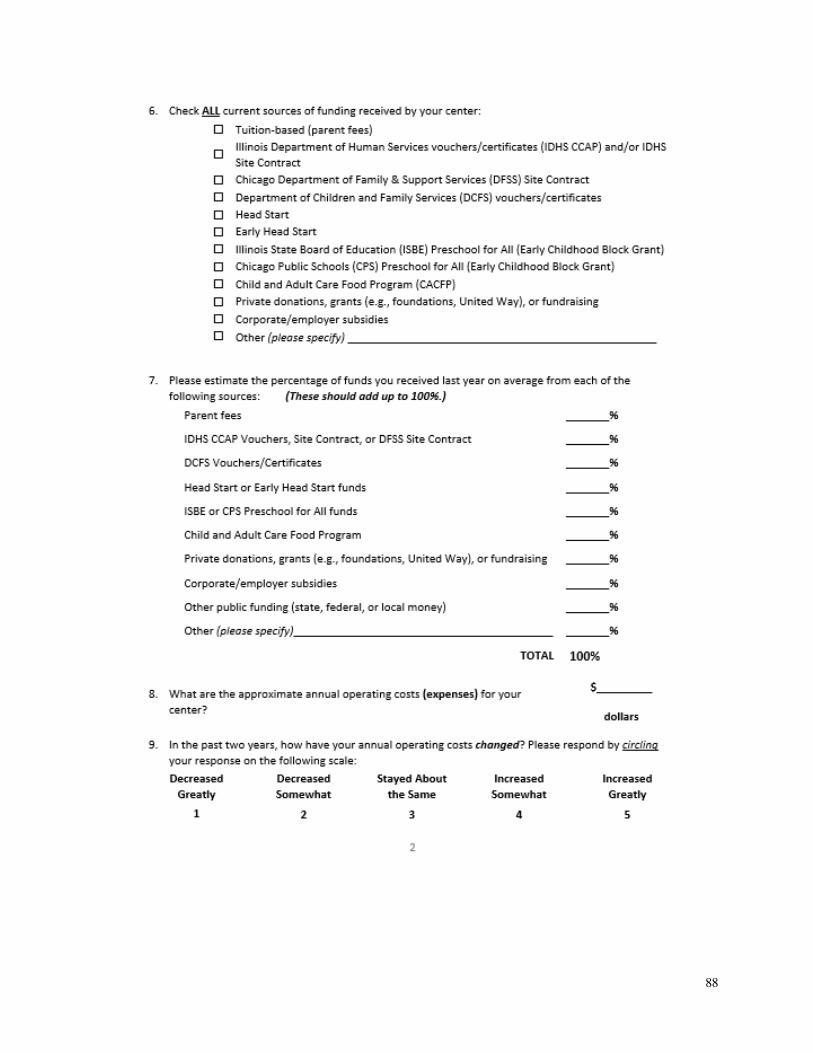
88
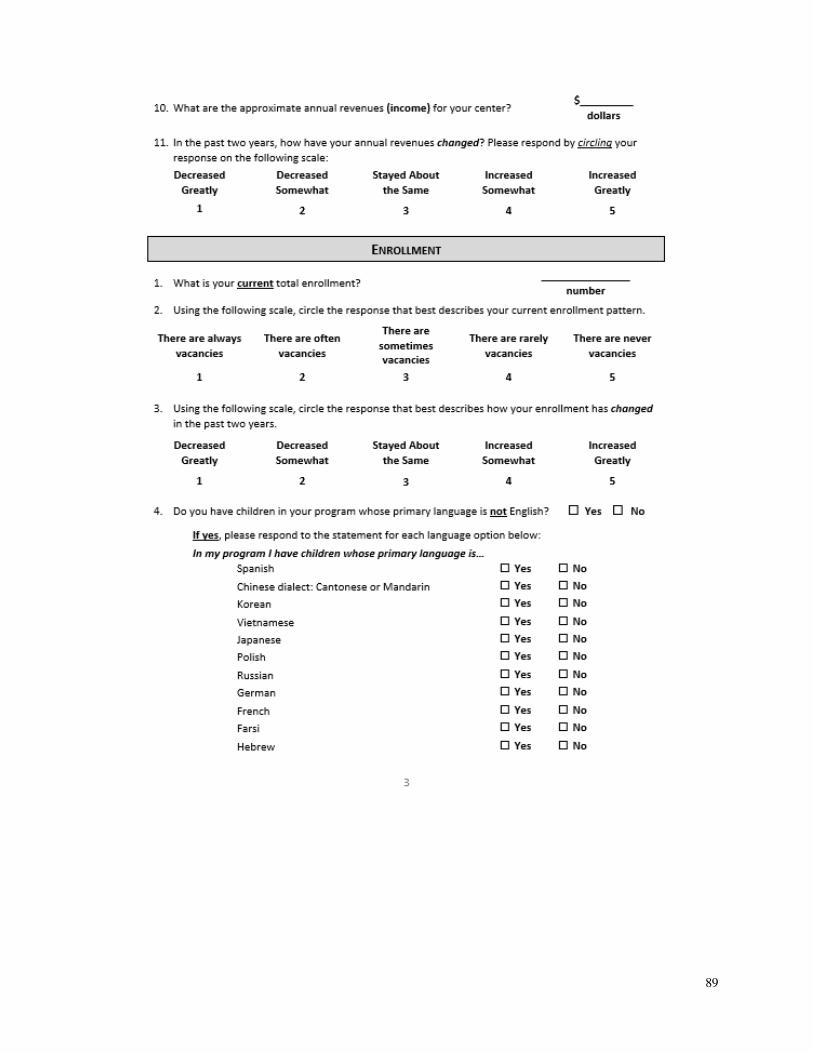
89

90
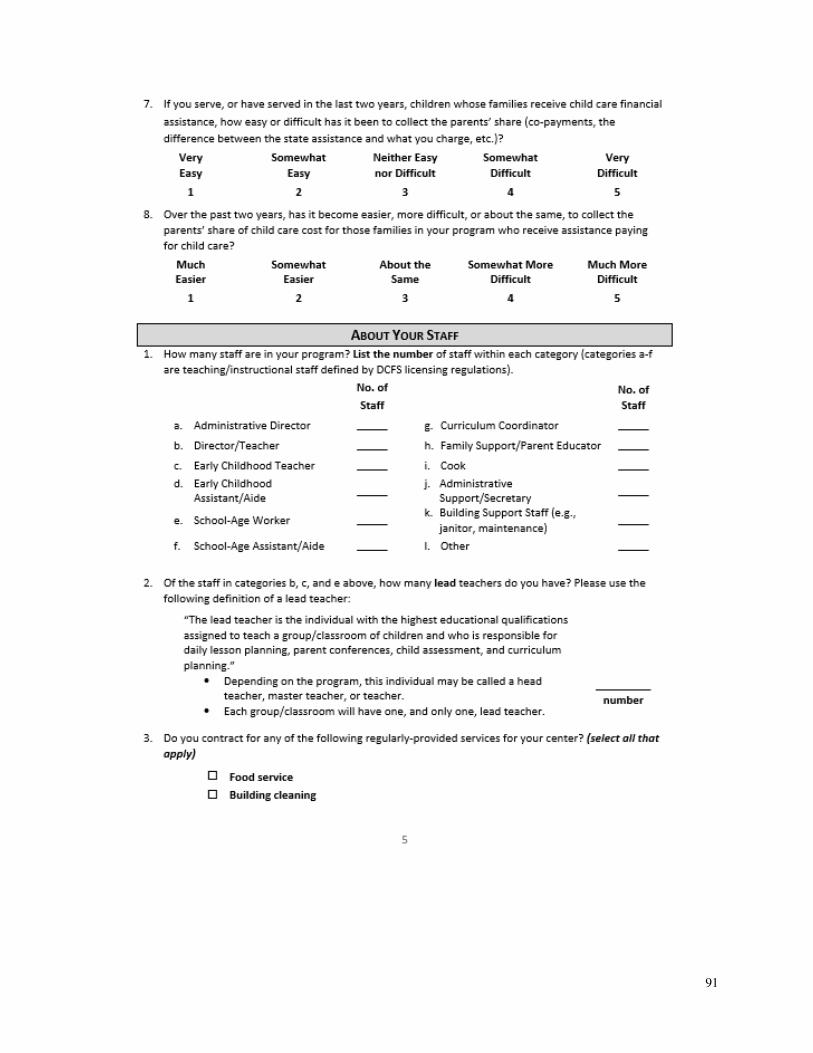
91

92
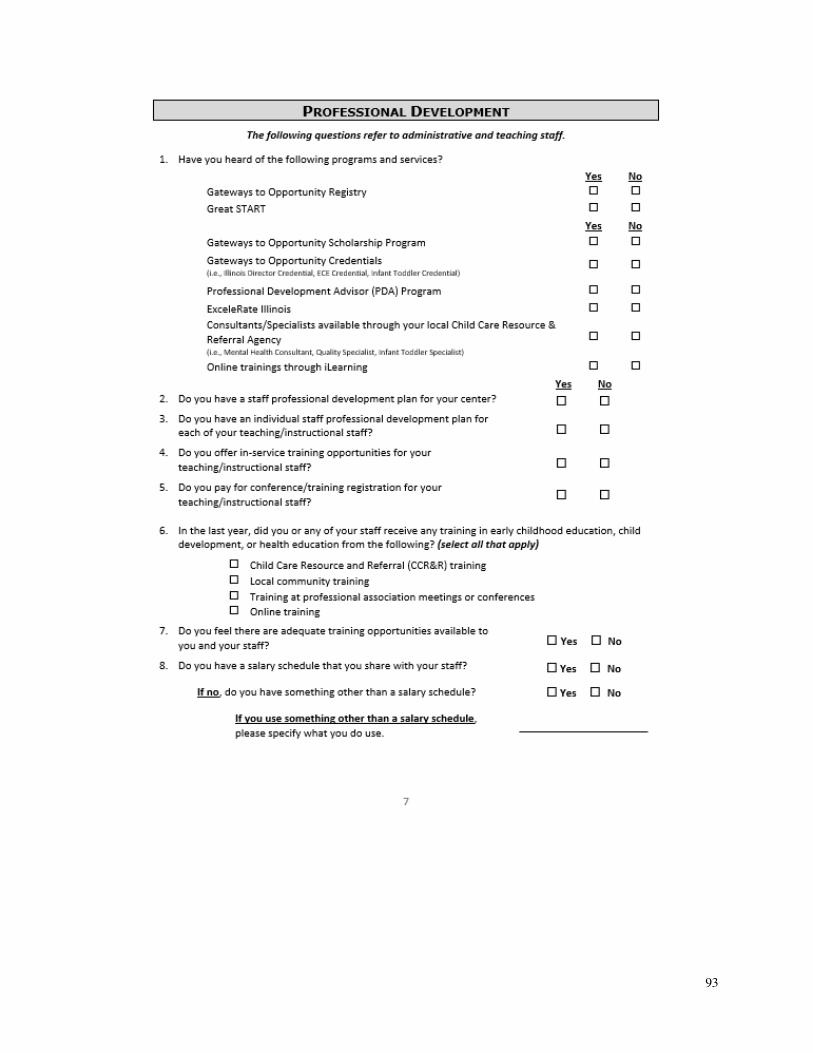
93
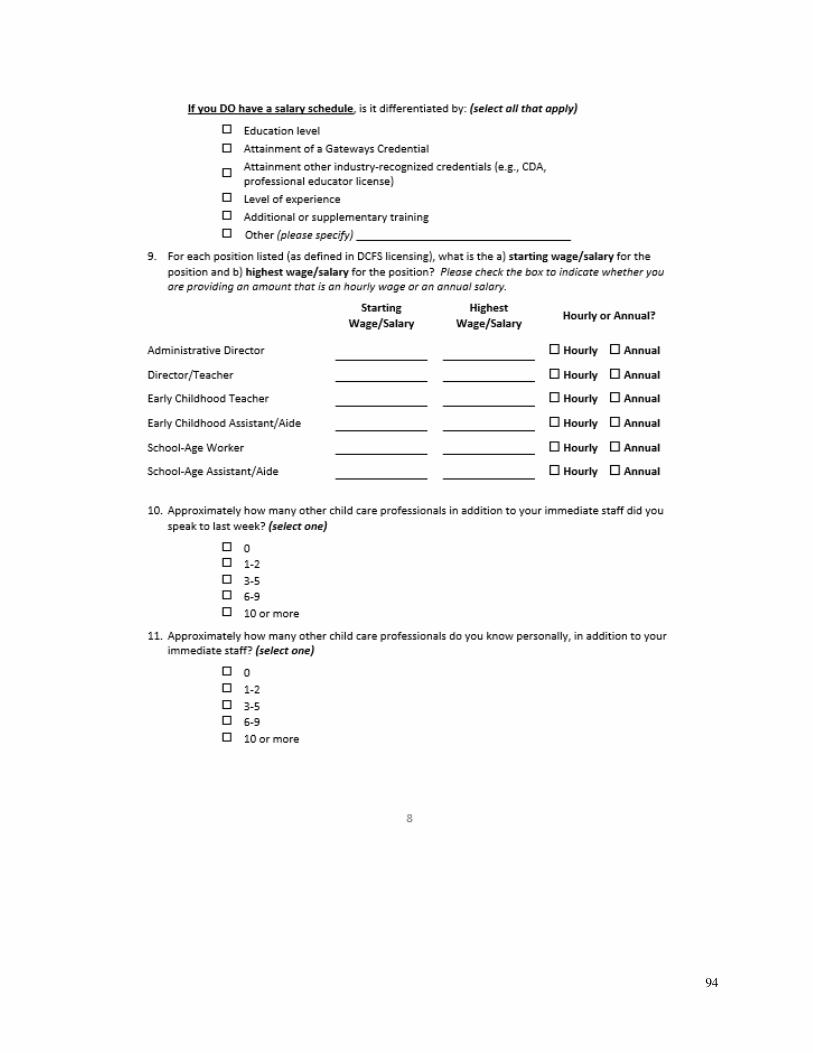
94
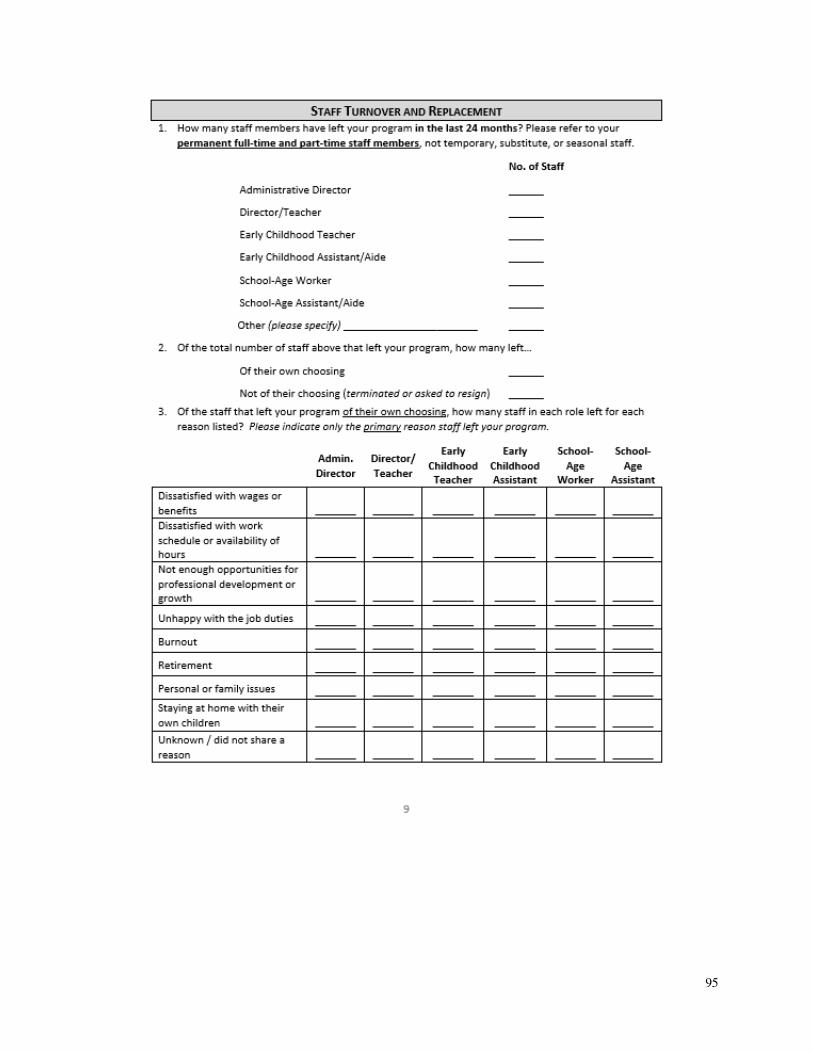
95
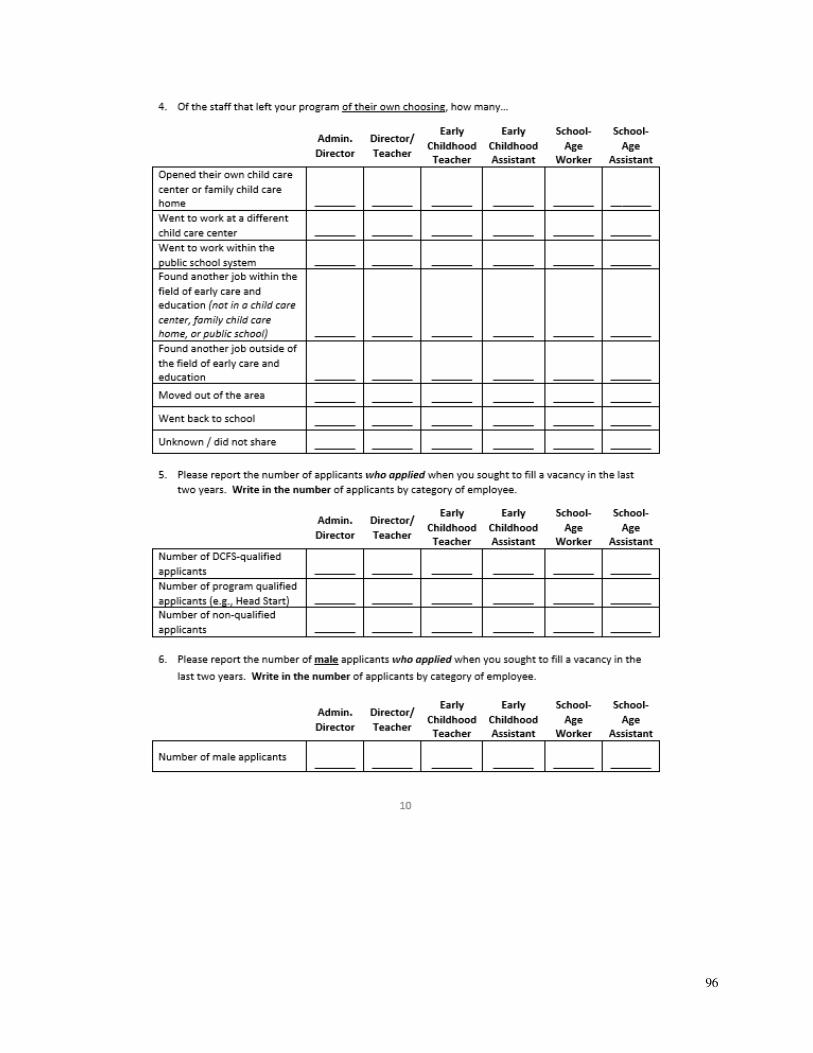
96
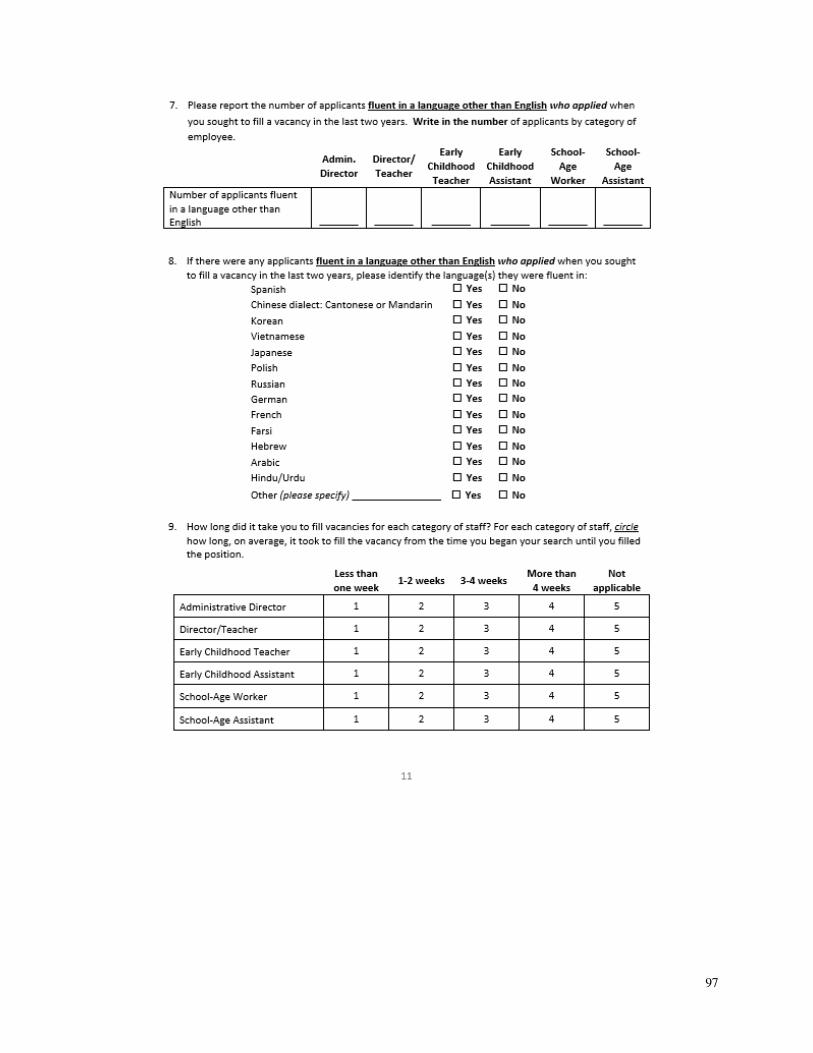
97
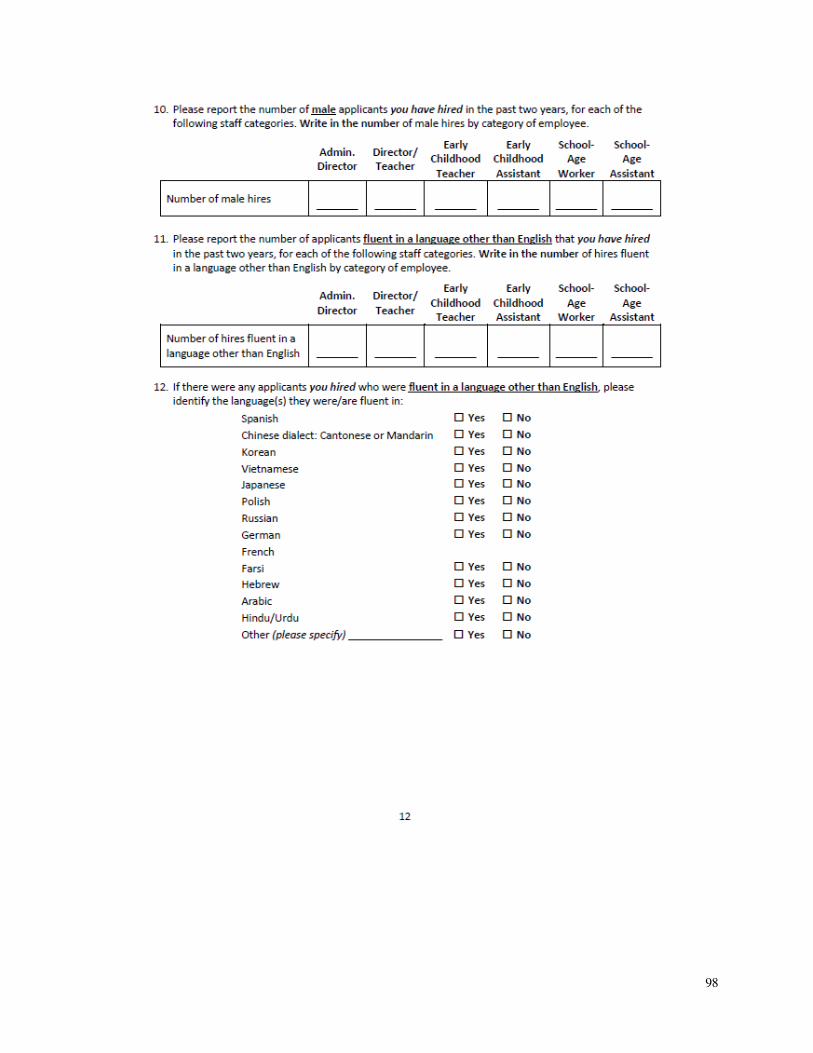
98
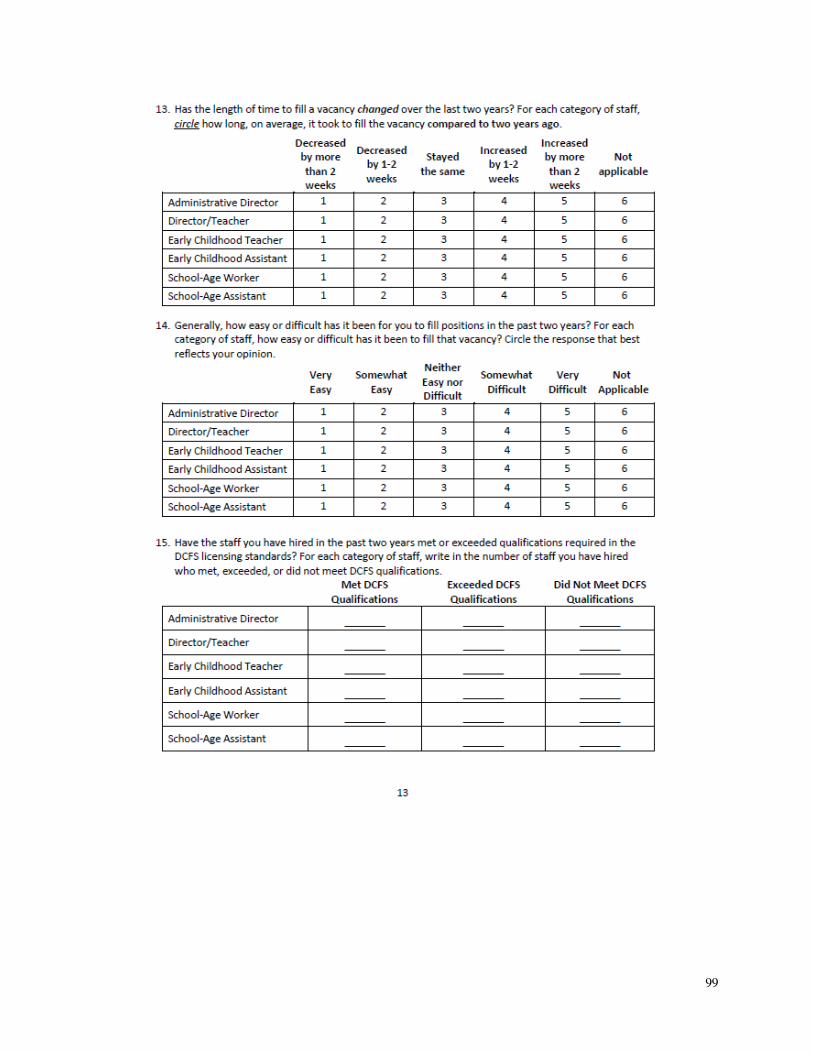
99
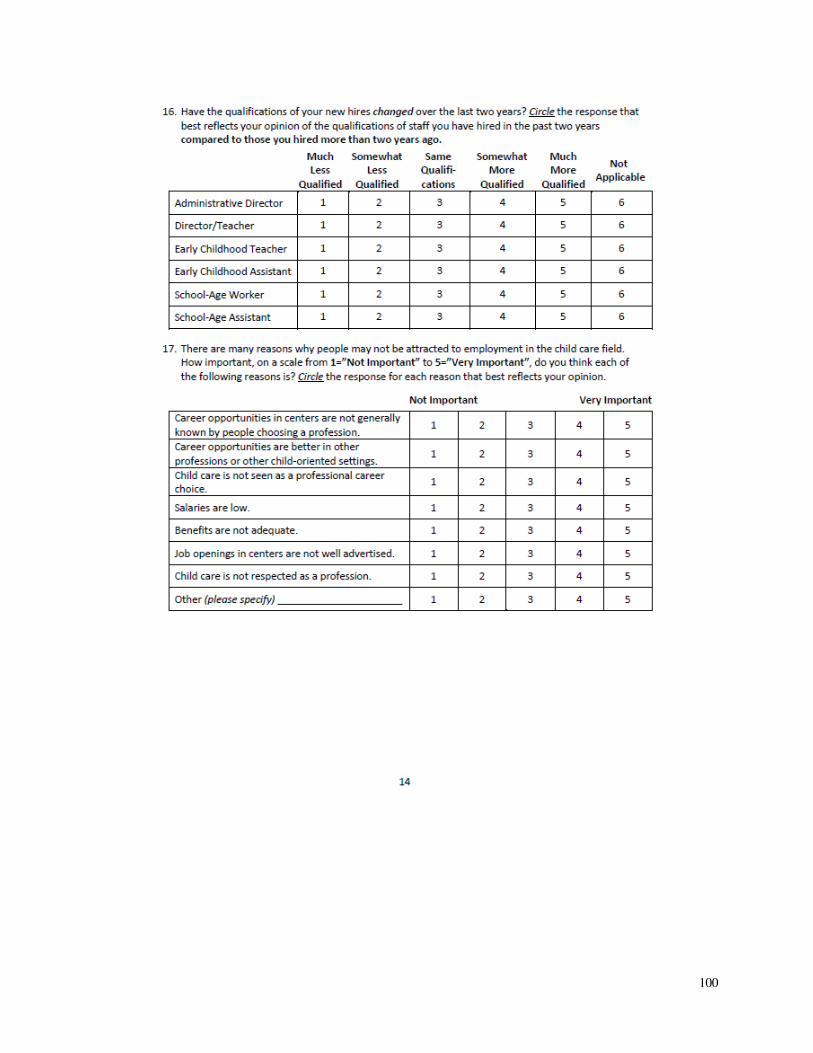
100
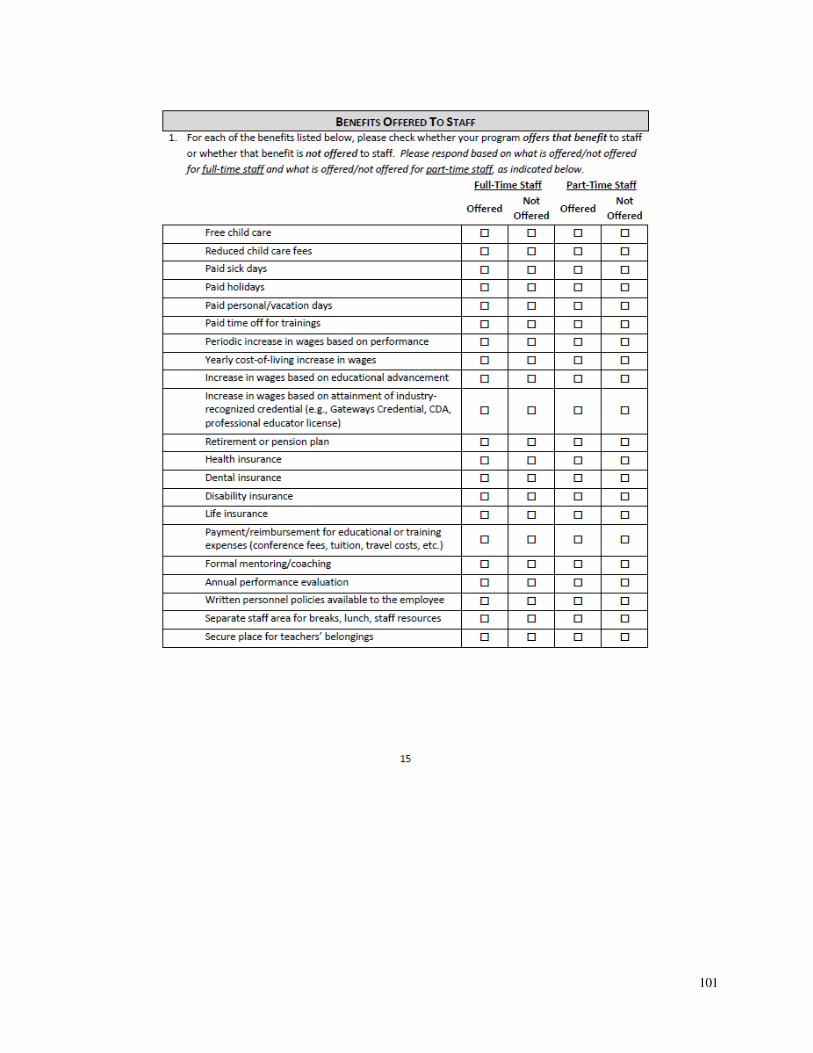
101

102

103
Family Child Care Survey

104
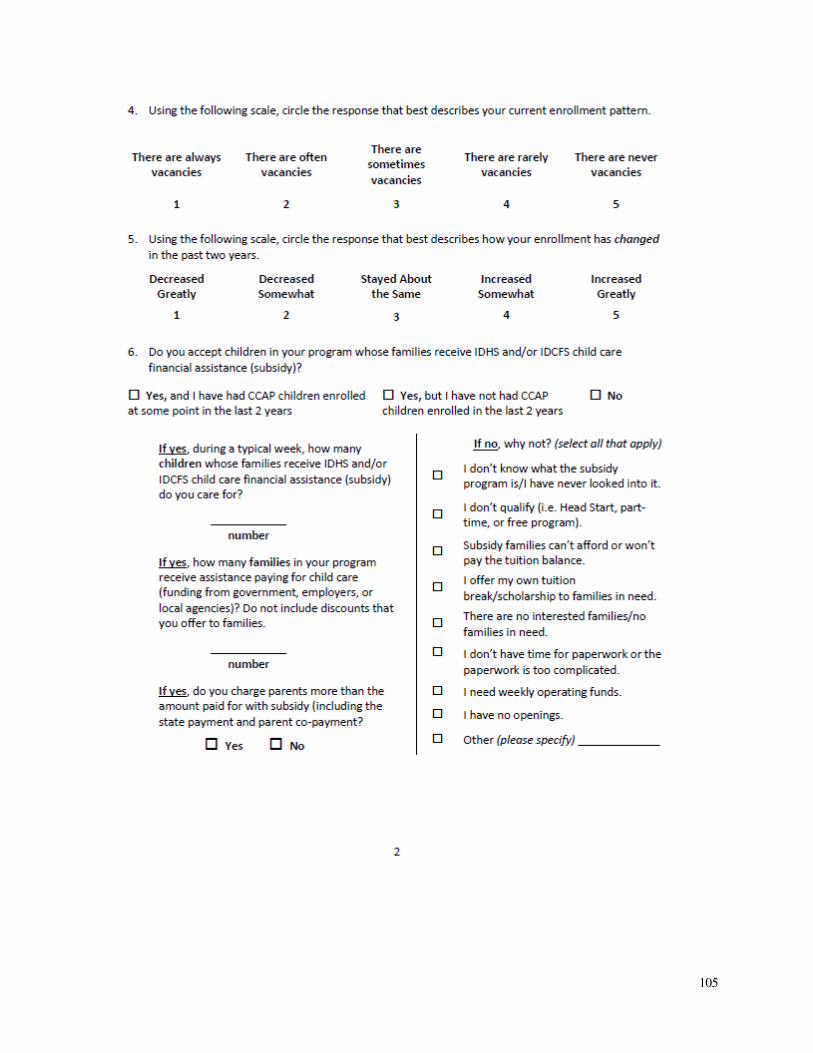
105
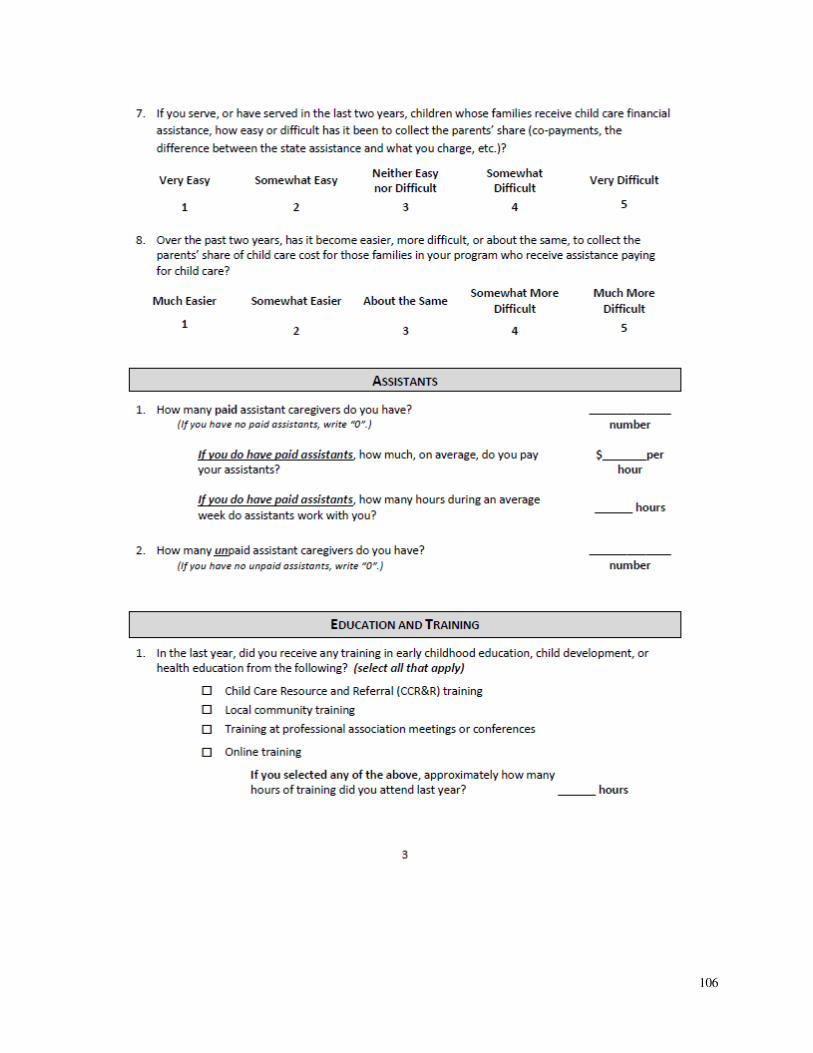
106
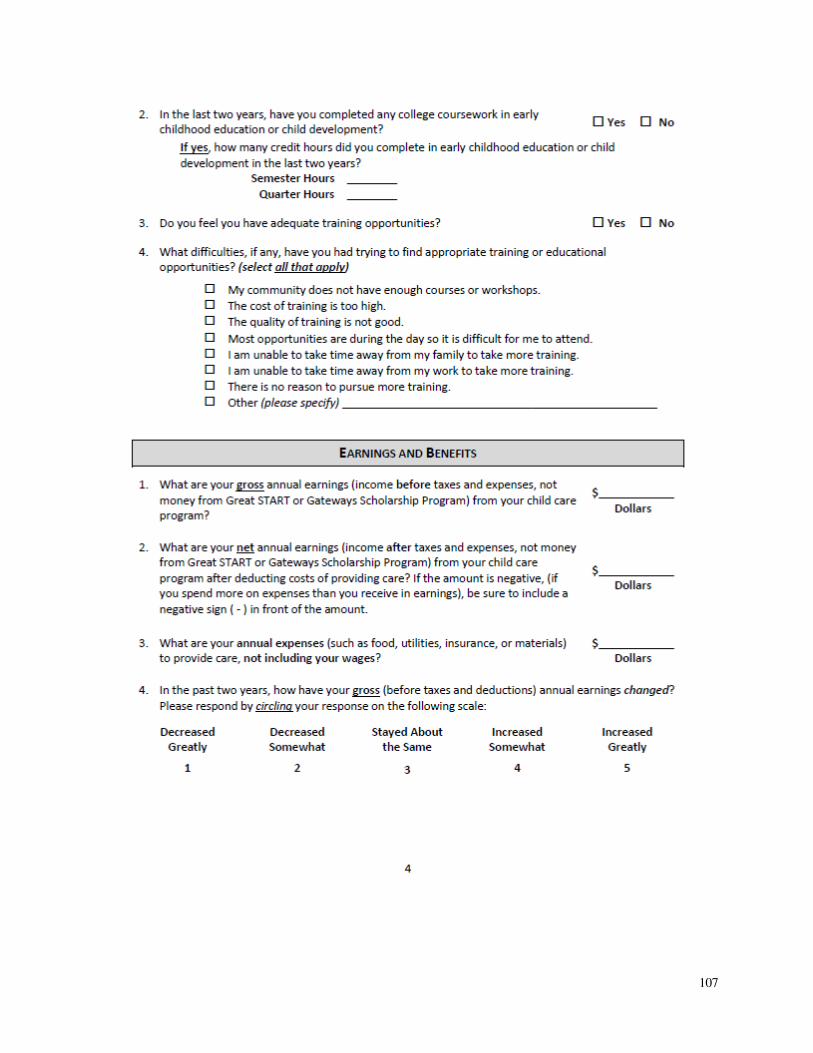
107

108
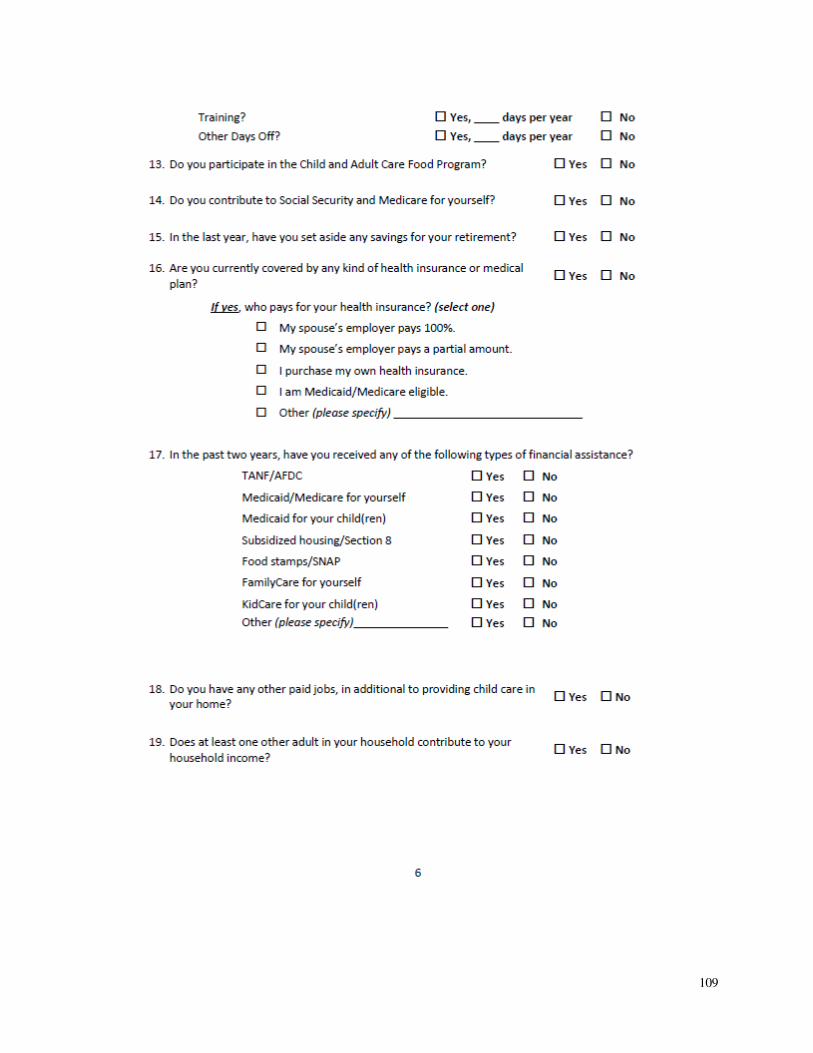
109

110
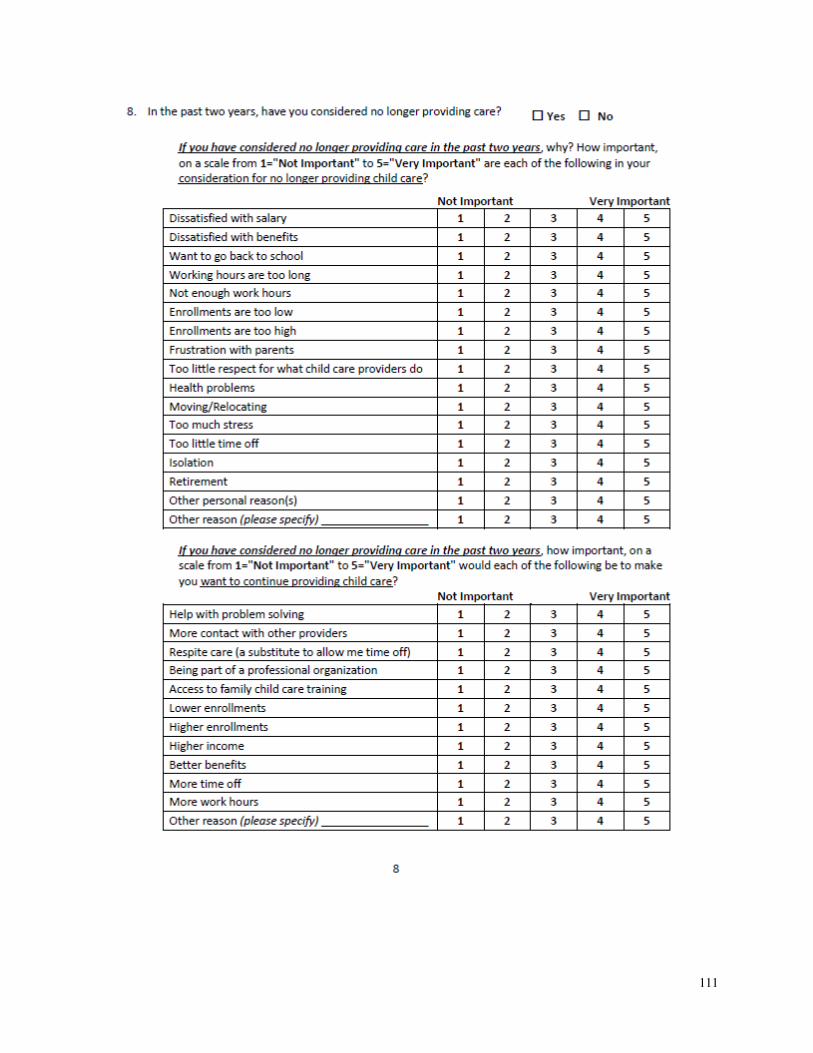
111
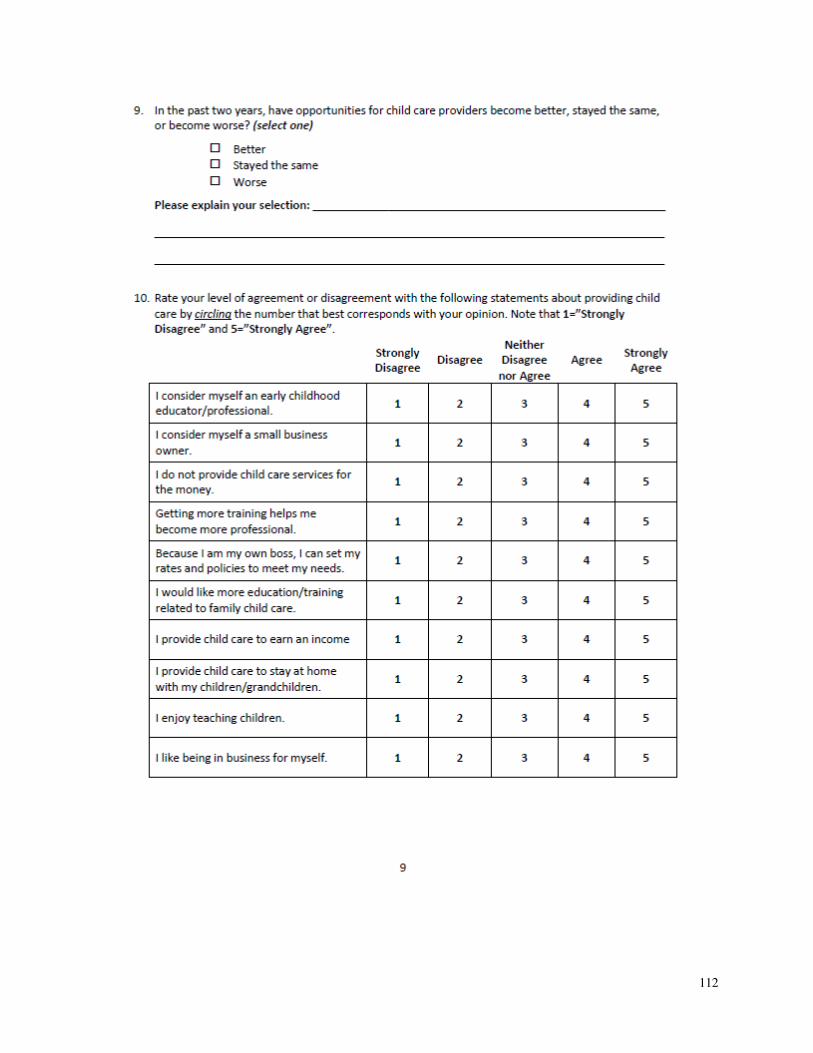
112

113

114
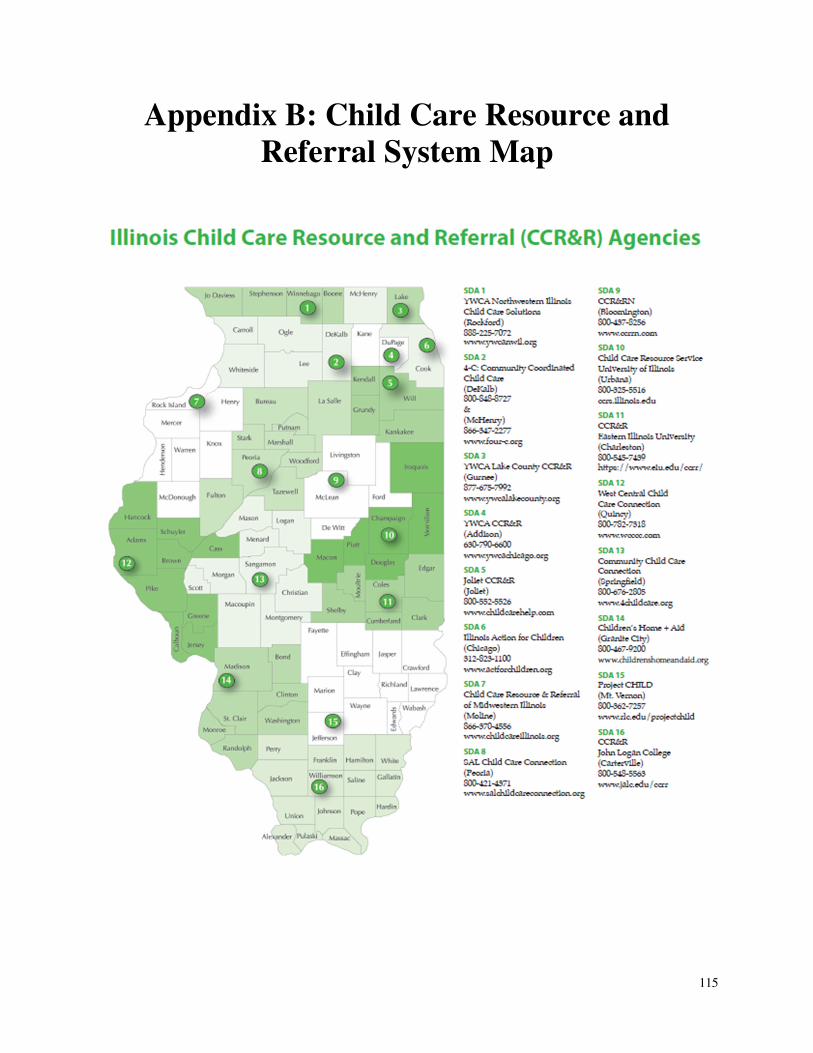
115
Appendix B: Child Care Resource and
Referral System Map
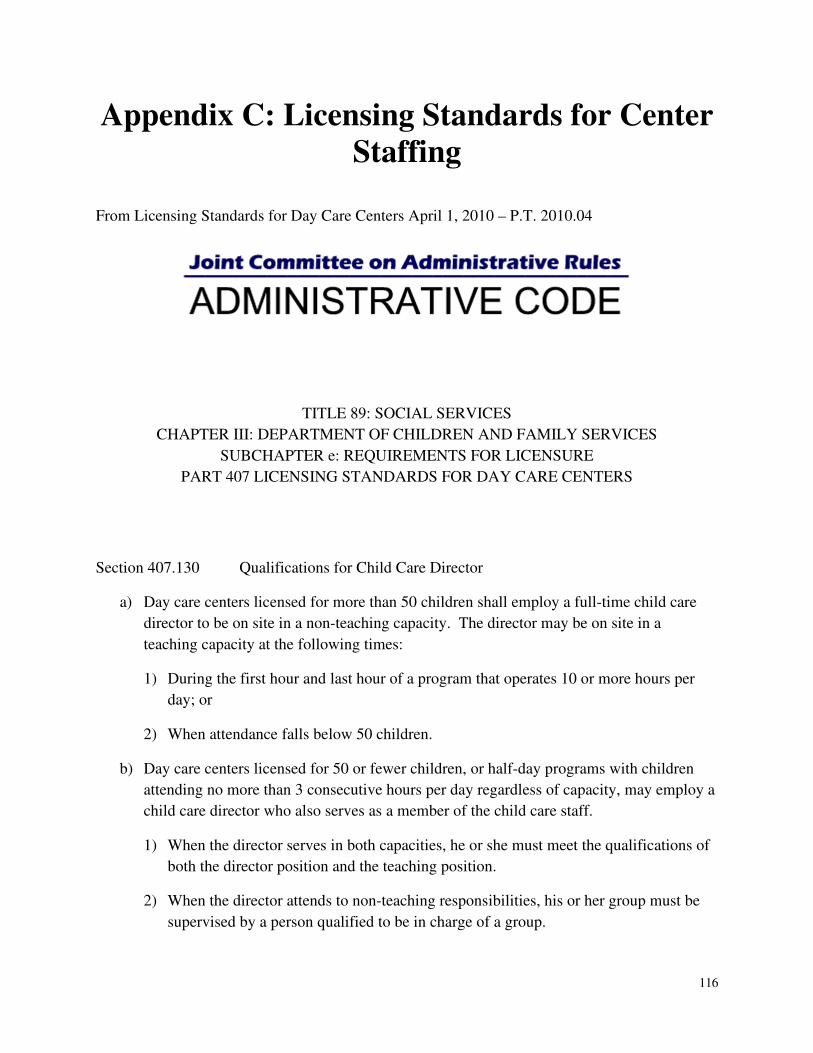
116
Appendix C: Licensing Standards for Center
Staffing
From Licensing Standards for Day Care Centers April 1, 2010 – P.T. 2010.04
TITLE 89: SOCIAL SERVICES
CHAPTER III: DEPARTMENT OF CHILDREN AND FAMILY SERVICES
SUBCHAPTER e: REQUIREMENTS FOR LICENSURE
PART 407 LICENSING STANDARDS FOR DAY CARE CENTERS
Section 407.130 Qualifications for Child Care Director
a) Day care centers licensed for more than 50 children shall employ a full-time child care
director to be on site in a non-teaching capacity. The director may be on site in a
teaching capacity at the following times:
1) During the first hour and last hour of a program that operates 10 or more hours per
day; or
2) When attendance falls below 50 children.
b) Day care centers licensed for 50 or fewer children, or half-day programs with children
attending no more than 3 consecutive hours per day regardless of capacity, may employ a
child care director who also serves as a member of the child care staff.
1) When the director serves in both capacities, he or she must meet the qualifications of
both the director position and the teaching position.
2) When the director attends to non-teaching responsibilities, his or her group must be
supervised by a person qualified to be in charge of a group.

117
c) The child care director shall be at least 21 years of age.
d) The child director shall have a high school diploma or equivalency certificate (GED).
e) In addition to meeting the requirements of Section 407.100, the child care director of a
facility serving the same number of groups of pre-school and school-age children or more
groups of pre-school children than groups of school-age children shall have achieved:
1) Sixty semester or 90 quarter hours of credit from an accredited college or university
with 18 semester or 27 quarter hours in courses related directly to child care and/or
child development from birth to age 6; or
2) Two years (3120 clock hours) of child development experience in a nursery school,
kindergarten, or licensed day care center, 30 semester or 45 quarter hours of college
credits with ten semester or 15 quarter hours in courses related directly to child care
and/or child development, and proof of enrollment in an accredited college or
university until two years of college credit have been achieved. A total of 18
semester or 27 quarter hours in courses related directly to child care and/or child
development is required to be obtained within the total two years of college credits; or
3) Completion of a credentialing program approved in accordance with Appendix G of
this Part, completion of 12 semester or 18 quarter hours in courses related to child
care and/or child development from birth to age 6 at an accredited college or
university, and 2 years (3120 clock hours) child development experience in a nursery
school, kindergarten or licensed day care center.
f) In addition to meeting the requirements of Section 407.100, the child care director of a
facility serving more groups of school-age children than groups of pre-school children
shall have achieved:
1) Sixty semester or 90 quarter hours of credit from an accredited college or university
with 18 semester or 27 quarter hours in courses related to child care and/or child
development, elementary education, physical education, recreation, camping, or other
related fields, including courses related to school-age children; or
2) Two years (3120 clock hours) of child development experience in a recreational
program, kindergarten, or licensed day care center serving school-age children, or
licensed exempt school-age child care program operated by a public or private school,
30 semester or 45 quarter hours of college credits with 10 semester or 15 quarter
hours in courses related directly to child care and/or child development, elementary
education, physical education, recreation, camping or other related fields, and proof
of enrollment in an accredited college or university until two years of college credit
have been achieved. A total of 18 semester or 27 quarter hours in courses related

118
directly to child care and/or child development, elementary education, physical
education, recreation, camping or other related fields, including courses related to
school-age children, is required to be obtained within the total two years of college
credits.
g) Completion of a training program accredited by the American Montessori Society or
Association of Montessori International may be substituted for the courses directly
related to child care and/or child development required by this Section. Persons holding
a Montessori pre-primary credential may serve as director to children through age six.
Persons holding a Montessori primary or elementary credential may serve as director to
children six years of age or older.
h) Persons who were deemed qualified to serve as a child care director prior to January 1,
1985, continue to be deemed qualified for their position.
i) When a program serves only school-age children and meets the criteria for Section
407.90(c), qualifications for the school-age director responsible for multiple sites and the
site coordinators shall be as follows:
1) The school-age director and each site coordinator shall be at least 21 years of age.
2) The school-age director shall meet both the following requirements for education and
experience:
A) Sixty semester or 90 quarter hours of credit from an accredited college or
university, with 18 semester or 27 quarter hours in courses related to school-age
child care, child development, elementary education, physical education,
recreation, camping or other related fields; and
B) At least 1560 clock hours of child development experience in a recreational
program or a licensed day care center serving school-age children.
3) The school-age site coordinators must meet one of the following qualifications:
A) Thirty semester or 45 quarter hours of credit from an accredited college or
university with 12 semester or 18 quarter hours related to school-age child care,
child development, elementary education, physical education, recreation, camping
or other related fields and 750 clock hours of experience in a recreational program
or a licensed day care center serving school-age children or in a license exempt
school-age child care program operated by a public or private school; or
B) 1560 clock hours of experience in a recreational program or licensed day care
center serving school-age children or license exempt school-age child care
program operated by a public or private school and either 6 semester hours or 9

119
quarter hours of credit from an accredited college or university related to school-
age child care, child development, elementary education, physical education,
recreation, camping or other related fields.
j) A staff member who meets the qualifications for a day care center director shall be
designated to assume decision-making responsibility whenever the child care director is
off-site. A record of employees who meet the qualifications for director and who have
been designated to assume decision-making responsibility in the director’s absence shall
be kept at the site. All day care staff shall be informed of the designated director at each
occurrence. The person designated as alternate director may be in the classroom and
counted in the staff/child ratio under the following circumstances:
1) When the center meets the criteria of Section 407.130(b); or
2) During the first hour and last hour of a program that operated 10 or more hours per
day; or
3) When attendance falls below 50 children.
k) The child care director must successfully complete a basic training course of 6 or more
clock hours on providing care to children with disabilities that has been approved by the
Department. The day care center shall have on file a certificate attesting to the training of
the child care director.
1) Persons employed as a child care director shall complete this training within 36
months from date appointed as child care director.
2) A child care director who has completed training prior to employment may have that
training approved as meeting the provisions of this subsection (k). A certificate of
training completion and a description of the course content must be submitted to the
Department for approval.
3) A child care director who obtains approved training and moves from one day care
facility to another shall not be required to take another training course as long as the
child care director can provide documentation in the form of a certificate that the
training was completed.
4) A training program approved by the Department in providing care for children with
disabilities must include the following components:
A) Introduction to Inclusive Child Care;
B) Understanding Child Development in Relation to Disabilities;
C) Building Relationships With Families;
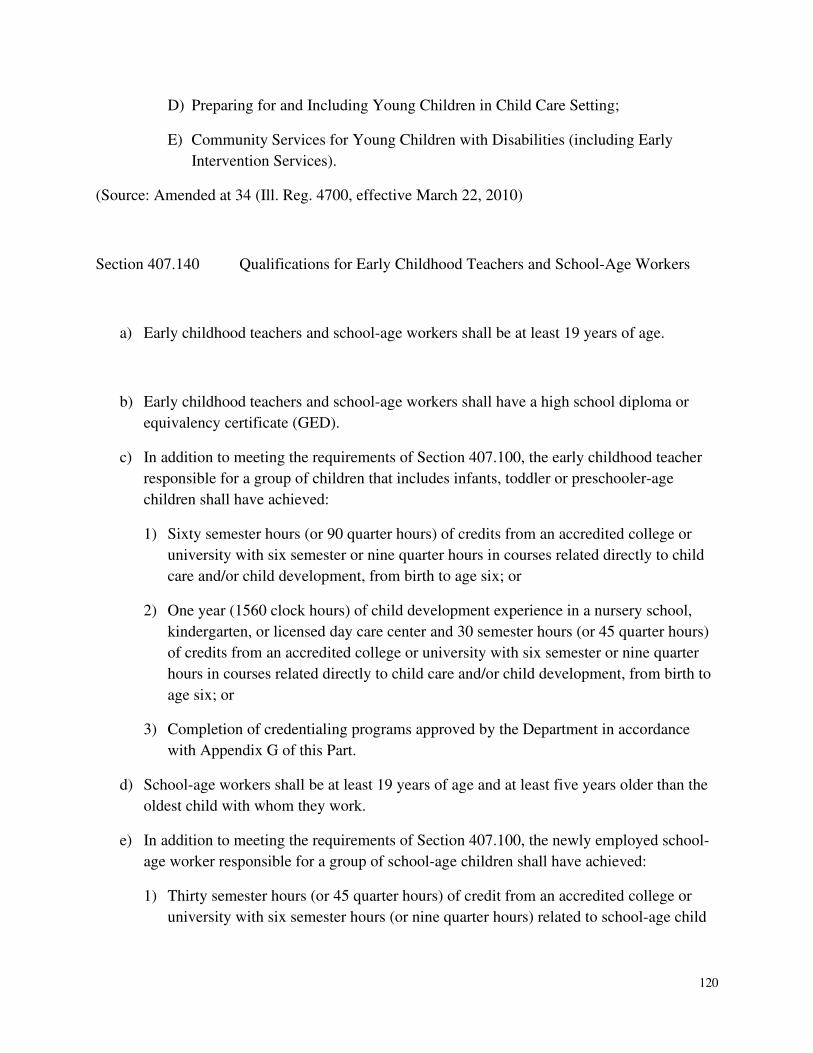
120
D) Preparing for and Including Young Children in Child Care Setting;
E) Community Services for Young Children with Disabilities (including Early
Intervention Services).
(Source: Amended at 34 (Ill. Reg. 4700, effective March 22, 2010)
Section 407.140 Qualifications for Early Childhood Teachers and School-Age Workers
a) Early childhood teachers and school-age workers shall be at least 19 years of age.
b) Early childhood teachers and school-age workers shall have a high school diploma or
equivalency certificate (GED).
c) In addition to meeting the requirements of Section 407.100, the early childhood teacher
responsible for a group of children that includes infants, toddler or preschooler-age
children shall have achieved:
1) Sixty semester hours (or 90 quarter hours) of credits from an accredited college or
university with six semester or nine quarter hours in courses related directly to child
care and/or child development, from birth to age six; or
2) One year (1560 clock hours) of child development experience in a nursery school,
kindergarten, or licensed day care center and 30 semester hours (or 45 quarter hours)
of credits from an accredited college or university with six semester or nine quarter
hours in courses related directly to child care and/or child development, from birth to
age six; or
3) Completion of credentialing programs approved by the Department in accordance
with Appendix G of this Part.
d) School-age workers shall be at least 19 years of age and at least five years older than the
oldest child with whom they work.
e) In addition to meeting the requirements of Section 407.100, the newly employed school-
age worker responsible for a group of school-age children shall have achieved:
1) Thirty semester hours (or 45 quarter hours) of credit from an accredited college or
university with six semester hours (or nine quarter hours) related to school-age child

121
care, child development, elementary education, physical education, recreation,
camping, or other related fields; or
2) 1560 clock hours of experience in a recreational program or licensed day care center
serving school-age children or a license exempt school-age child care program
operated by a public or private school, and six semester hours (or nine quarter hours)
of credit from an accredited college or university related to school-age child care,
child development, elementary education, physical education, recreation, camping or
other related fields; or
3) A high school diploma or equivalency certificate plus 3120 clock hours of experience
in a recreational program, kindergarten, or licensed day care center serving school-
age children or a license exempt school-age child care program operated by a public
or private school.
f) Completion of a training program accredited by the American Montessori Society or
Association Montessori International may be substituted for the courses directly related
to child care and/or child development required by this Section. Persons holding a
Montessori pre-primary credential may supervise children through age six. Persons
holding a Montessori primary or elementary credential may supervise children six years
of age or older.
g) Persons who were deemed qualified as a child care worker or school-age worker prior to
January 1, 1985, continue to be deemed qualified as an early childhood teacher or school-
age worker.
h) Early childhood teachers and school-age workers shall be responsible for the planning
and supervision of a group of children. Early childhood workers and school-age workers
shall also be responsible for supervising persons assigned to assist their group who are
not similarly qualified.
(Source: Amended at 28 Ill. Reg. 3011, effective February 15, 2004)
Section 407.150 Qualifications for Early Childhood Assistants and School-Age Worker
Assistants
a) Early childhood assistants shall meet the requirements of Section 407.100, with the
exception of subsection (b).
b) Early childhood and school-age assistants shall have a high school diploma or
equivalency certificate (GED).
122
c) Early childhood assistants shall work under the direct supervision of an early
childhood teacher or school-age worker and shall not assume full responsibility for a
group of children, except as allowed by Section 407.190(e)(2).
d) School-age assistants shall work under the direct supervision of a school-age worker
and shall not assume full responsibility for a group of children, except as allowed by
Section 407.90(e)(2).
(Source: Amended at 34 Ill. Reg. 4700, effective March 22, 2010)

123
Appendix D: Acknowledgements
We gratefully appreciate the support of the Illinois Department of Human Services and its Office of Early Childhood for the opportunity to conduct these analyses, and for proofreading earlier drafts of this report and making important editorial comments.


![MODEL PAY POLICY FOR MAINTAINED SCHOOLS … · Web viewThe governing body operates salary sacrifice schemes in relation to [Childcare Vouchers/Cycle to Work/other arrangements]. Staffing](https://img.pdfslide.us/doc/110x75/5e8e52884ee4bc64f3012661/model-pay-policy-for-maintained-schools-web-view-the-governing-body-operates-salary.jpg)