Embed Size (px)
Citation preview
ILLINOIS ECONOMIC and
FISCAL COMMISSION
Illinois’ Corporate Income Tax
JULY 2002 703 STRATTON BUILDING
SPRINGFIELD, ILLINOIS 62706
ILLINOIS ECONOMIC and FISCAL COMMISSION
COMMISSION CO-CHAIRS
Senator Patrick D. Welch Representative Terry R. Parke
SENATE HOUSE
Miguel del Valle Mark H. Beaubien, Jr. Ricky R. Hendon Judy Erwin
Chris Lauzen Frank J. Mautino Steven Rauschenberger Richard Myers
Jeffrey M. Schoenberg
EXECUTIVE DIRECTOR Dan R. Long
DEPUTY DIRECTOR
Trevor J. Clatfelter
UNIT MANAGER Jim Muschinske
AUTHOR OF REPORT
Eric Noggle
OFFICE ASSISTANT
Briana Stafford
TABLE OF CONTENTS
Illinois’ Corporate Income Tax
PAGE
Executive Summary i History of Tax 1 Rate and Base 3 Modifications to Base 3 Credits 4 Carryback/Carryover 5 Tax Expenditures 5 The Single-Sales Factor 6 Decoupling from Federal “Bonus Depreciation” Tax Cut 7 Revenue Collections History 9 Corporate Payment Methods 11 Corporate Income Tax Filing Data 12 Distribution 13 How Illinois Compares to Other States 14 Personal Property Replacement Tax 18 Corporate Franchise Tax 19 CHARTS/TABLES Table 1 Tax Expenditures of the Corporate Income Tax 5 Table 2 Corporate Income Tax Revenue Annual Percentage Changes 9 Table 3 Corporate Income Tax Percentage of General Funds 10 Table 4 Breakout of Corporate Tax Receipts by Type of Payment 11 Table 5 Corporate Liability Stratification for Income and Replacement Taxes-Tax Year 1998 12 Table 6 Illinois Corporate Income Tax Distribution: FY 2000-FY 2002 13 Table 7 State Corporate Income Tax Rates 14 Table 8 State Government Corporation Net Income Tax Revenue in 2000 16 Table 9 Per Capita State Government Corporation Net Income Tax Revenue in 2000 17 Chart 1 History of Corporate Income Tax Revenue 9 Chart 2 FY 2002 Total General Funds Revenue Breakout by Source 10 Chart 3 State Government Corporation Net Income Tax Revenue in 2000 15 Chart 4 Per Capita State Government Corporation Net Income Tax Revenue in 2000 15 Chart 5 History of Personal Property Tax Replacement Tax Revenue 18 Chart 6 History of Corporate Franchise Tax Revenue 19
i
EXECUTIVE SUMMARY The State’s corporate income tax is one of Illinois’ major general revenue sources, and one of the most volatile, generating between 3% and 6% of all General Funds. The following report takes a closer look at the State’s Corporate Income Tax, providing detailed summaries and charts of the components that make up this important revenue source. The report discusses the history of the income tax, including an analysis of the various rates and components that have accompanied the tax since its inception in 1969. The report summarizes the deductions and credits available to taxpayers to assist in lowering their tax burden. Included in this section is a listing of the source’s largest tax expenditures. An analysis of the recently established single-sales factor is also discussed, as well as a section on the recent legislation that decoupled the State from the federal bonus depreciation deduction. The report then details how the revenue from the corporate income tax is distributed. Also discussed are the two ways that payments are collected (estimated and final payments), and how much each portion makes up of the total amount. The report provides a summary of how Illinois compares with other states in taxing corporations, including several tables and graphs, and concludes by summarizing the personal property replacement tax and the corporate franchise tax. Highlights of the report are summarized below.
• Governor Richard Ogilvie initiated the first Illinois corporate income tax in 1969 at a rate of 4.0%. The tax rate has fluctuated between 4.0% and 4.8% since that time. The current rate of 4.8% has been in effect since July 1, 1989.
• The various credits and deductions available to taxpayers to help decrease their
tax burden cost the State $218.7 million in corporate income tax revenue in FY 2001. The largest expenditure came from the Illinois net operating loss deduction, which cost the State $141.8 million.
• Some argue that the positive effect that the single-sales factor has had on the
manufacturing industry has been offset by several factors, including an increase in smaller company taxes, similar tax changes in other states, and a lack of evidence of economic growth. The Department of Revenue estimates that the single-sales factor reduced State and local government revenues by approximately $96 million in 2001.
• On June 28, 2002, Governor Ryan approved P.A. 92-0603 (SB 1543), which
allows the State to decouple from the federal bonus depreciation deduction.
ii
This provision is expected to prevent an estimated $161 million net income tax revenue loss in FY 2003 and similar losses in FY 2004 and FY 2005.
• Since FY 1991, gross corporate income tax revenue increased from $761
million to $1.5 billion in FY 2000. However, these receipts have been on a downward trend since. In FY 2002, gross receipts fell to $1.0 billion, down 18.4% from FY 2001 receipts.
• Since FY 1994, the portion that corporate income tax net receipts have made up
of the State’s General Funds has ranged from 3.4% in FY 2002 to 5.8% in FY 1997.
• Of the two ways in which corporate income taxes were paid in FY 2001,
estimated payments made up the largest portion, 62%, while final payments made up 38%.
• In 1998, 91.4% of Illinois corporate tax filers had liability less than $5,000.
The remaining 8.6% of the filers, however, represented 96.8% of all corporate tax liabilities.
• In FY 2002, 23% of gross receipts were deposited into the Income Tax Refund
Fund. Of the remainder, 10% was deposited into the Local Government Distributive Fund, 7.3% into the Education Assistance Fund, and the remainder (82.7%) into the General Revenue Fund.
• Illinois is one of thirty-two states to have a flat corporate income tax rate.
Twelve states have graduated rates. Three states impose other types of corporate taxes, while Nevada, Washington, and Wyoming do not have state corporate income taxes.
• Illinois collected the 4th highest amount of corporate income tax revenue in the
United States, based on total collections in 2000, behind only California, New York, and Michigan. On a per-capita basis, Illinois ranked 7th.
• The personal property replacement tax is imposed on the net income of
corporations, business partnerships, trusts, and “S” corporations. The tax rate on corporations is 2.5% of federal taxable income, while the rate on partnerships, trusts, and “S” Corporations is 1.5%.
• There are three taxes that are included under the corporation franchise income
tax. They are the initial franchise tax, the additional franchise tax, and the annual franchise tax. In FY 2002, $159 million in General Funds was collected from these taxes.
Illinois’ Corporate Income Tax - 2002 Page 1
History of the Tax: When the Illinois Constitution was written in 1870, it authorized taxes on four categories: property, privileges, franchises and certain occupations. It also established that taxes on each category had to be uniform. There could not be varying rates of taxation for commercial and residential property, between real and personal property, or even between classifications of income. Up until the Great Depression, the general property tax was the primary means of financing government in Illinois, yielding nearly 70% of all State revenues in 1917. But after the stock market crash, the property tax system collapsed, leaving the State without a strong source of revenue. As a result, the General Assembly voted in 1932 to abolish the State property levy, leaving its use for the support of local governments. Without the property tax, the State had to scramble to find alternative revenue sources. In 1932, a progressive income tax was approved. However, the Illinois Supreme Court immediately voided this new tax, ruling that income must be considered property. Therefore, the provision in the tax law for graduated rates violated the rule of uniformity in the constitution’s revenue article. The court also ruled that the constitution prohibited the legislature from levying any new types of tax and that the General Assembly could only add to the list of occupations, franchises and privileges explicitly listed in the first section of Article IX of the Constitution. This ruling effectively blocked for more than thirty years moves to levy an income tax. Without an effective property or income tax, the State turned to consumption taxes, including the motor fuel tax, the liquor tax, and the public utility tax. However, none of these taxes was as profitable as the sales tax, which was approved in 1933. Between 1933 and 1969, the sales tax was Illinois’ largest source of revenue. The State enjoyed budgetary surpluses for much of the 1950s. However, economic changes and increased pressure for government services eroded the financial health of the State and the surpluses shrank steadily. Even with hikes in the State’s consumption taxes, it was apparent that Illinois was in need of another source of revenue. In the 1960s, a consensus began to build to overhaul the State’s fiscal system. Republican Richard Oglivie became governor of Illinois in 1969. Faced with the prospect of a $1-billion budget shortfall in FY 1970, Governor Oglivie recommended a 4.0% flat rate tax be levied on individuals and corporations. He also proposed that one-eighth of all revenues collected should be distributed to local governments. However, in order to reach agreement on the legislation, the Governor revised the rate on individuals downward to 2.5%, while leaving the proposed corporate income tax rate at 4.0%. This was a clear violation of the rule of uniformity. In spite of this violation, on July 1, 1969, the income tax was passed.
Illinois’ Corporate Income Tax - 2002 Page 2
The new tax immediately was denounced as unconstitutional and a suit was filed before the Illinois Supreme Court to prevent its application. However, on July 25, 1969, the justices overturned the Court’s ruling from thirty years prior regarding income taxes. The high court rejected the argument that the income tax was a property tax and thus could not be graduated. In the end, Governor Oglivie’s administration prevailed and the income tax became a reality. When the new Constitution was written in 1970, it specifically authorized the State to levy “a tax on or measured by income” which “shall be at a non-graduated rate.” The Constitution also was written to state “in any such tax imposed upon corporations the rate shall not exceed the rate imposed in individuals by more than a ratio of 8 to 5.” This was the corporate-to-personal ratio in 1969. Since the original rate was set at 4.0% in 1969, the corporate tax rate has fluctuated between 4.0% and 4.8%. The rate rose temporarily to 4.8% from January 1, 1983 to June 30, 1984, reverting to 4.0% on July 1, 1984. On July 1, 1989, the rate was again increased to 4.8%. It was scheduled to revert to 4.0% later; but on July 1, 1993, the 4.8% rate became permanent. In 1998, Governor George Ryan signed into law P.A. 90-0613, which created the single-sales factor. Under the single-sales factor, corporate income taxable in Illinois is determined solely on the basis of a company’s in-state sales. (A detailed analysis of the single-sales factor is discussed later on in the report). The process of phasing in the single-sales factor began in 1998 and was completed at the end of 2000. It was phased in using the following schedule.
Tax Year 1998: Sales: 1/3 Payroll: 1/3 Property: 1/3 Tax Year 1999: Sales: 2/3 Payroll: 1/6 Property: 1/6 Tax Year 2000: Sales: 5/6 Payroll: 1/12 Property: 1/12 Tax Year 2001: Sales Only
Illinois’ Corporate Income Tax - 2002 Page 3
Rate and Base: The State’s Corporate Income Tax is imposed on the taxable income of corporations, associations, joint-stock companies, and cooperatives. The tax is calculated by multiplying net income by a flat rate. For corporations, the rate is 4.8 percent of net income. The rate for trusts and estates is 3 percent of net income. A rate reduction is also available for qualified foreign insurers. The starting point for which the Illinois corporate income tax is imposed is based on the taxpayer’s federal taxable income, which is income minus federal deductions. Next, the federal taxable income is changed by adding back certain items (e.g., state, municipal, and other interest income excluded from federal taxable income) and subtracting others (e.g., interest income from U.S. Treasury obligations). The result is “base income.” Each corporate taxpayer then subtracts the $1,000 basic exemption (which is prorated if income is earned both inside and outside of Illinois) from income allocable to Illinois to arrive at net income. The rate is then applied against net income. Modifications to Base: As stated previously, the State taxes the taxpayer’s base income, which is federal-adjusted gross income with several modifications. Items that must be added to adjusted gross income include:
1. Amounts equal to all amounts paid or accrued to the taxpayer as interest and all distributions received from regulated investment companies during the taxable year to the extent excluded from gross income in the computation of taxable income.
2. The amount of State income taxes deducted from gross income in the computation of taxable income for the taxable year.
3. Certain capital gains in the case of a regulated investment company. 4. Unreimbursed costs of site remediation that were deducted in calculating federal
adjusted gross income and are claimed for an Environmental Remediation Tax Credit.
Items that can be subtracted from adjusted gross income include:
1. Interest income from Treasury bonds and notes. 2. State income tax refunds. 3. In the case of a regulated investment company, an amount of certain exempt
interest dividends paid to shareholders for the taxable year. 4. Dividends paid by corporations doing substantially all their business in an
enterprise zone or foreign trade zone.
Illinois’ Corporate Income Tax - 2002 Page 4
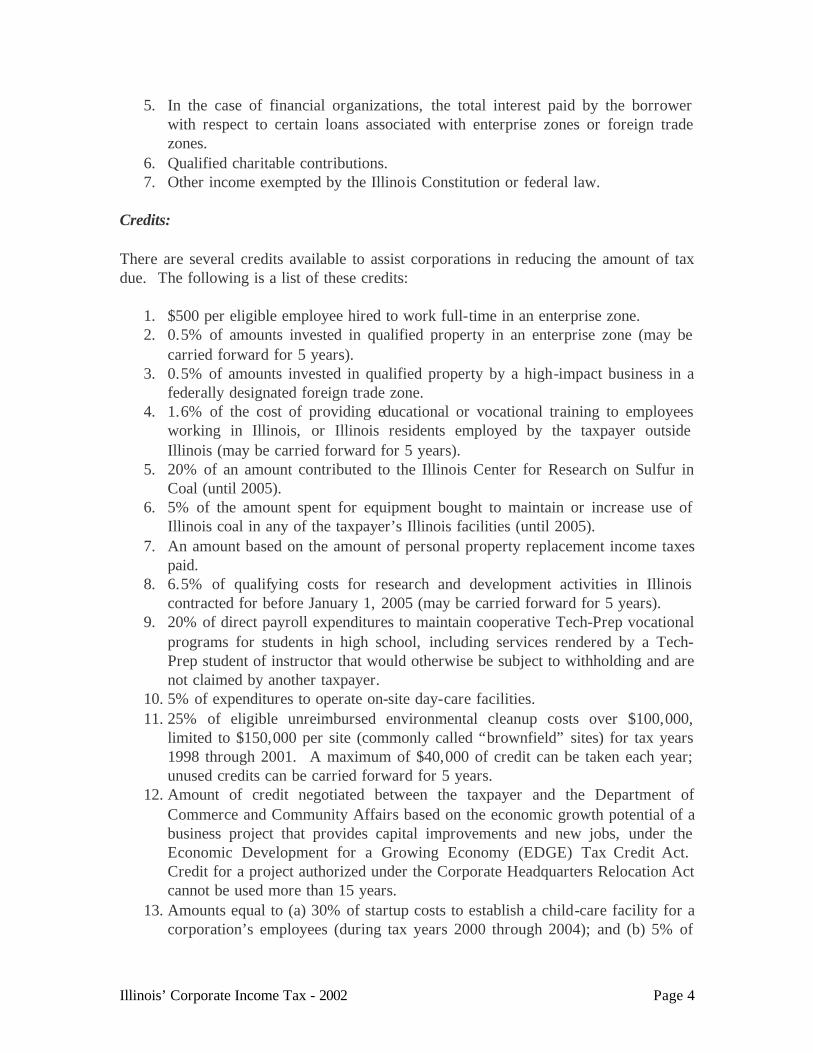
5. In the case of financial organizations, the total interest paid by the borrower with respect to certain loans associated with enterprise zones or foreign trade zones.
6. Qualified charitable contributions. 7. Other income exempted by the Illinois Constitution or federal law.
Credits: There are several credits available to assist corporations in reducing the amount of tax due. The following is a list of these credits:
1. $500 per eligible employee hired to work full-time in an enterprise zone. 2. 0.5% of amounts invested in qualified property in an enterprise zone (may be
carried forward for 5 years). 3. 0.5% of amounts invested in qualified property by a high-impact business in a
federally designated foreign trade zone. 4. 1.6% of the cost of providing educational or vocational training to employees
working in Illinois, or Illinois residents employed by the taxpayer outside Illinois (may be carried forward for 5 years).
5. 20% of an amount contributed to the Illinois Center for Research on Sulfur in Coal (until 2005).
6. 5% of the amount spent for equipment bought to maintain or increase use of Illinois coal in any of the taxpayer’s Illinois facilities (until 2005).
7. An amount based on the amount of personal property replacement income taxes paid.
8. 6.5% of qualifying costs for research and development activities in Illinois contracted for before January 1, 2005 (may be carried forward for 5 years).
9. 20% of direct payroll expenditures to maintain cooperative Tech-Prep vocational programs for students in high school, including services rendered by a Tech-Prep student of instructor that would otherwise be subject to withholding and are not claimed by another taxpayer.
10. 5% of expenditures to operate on-site day-care facilities. 11. 25% of eligible unreimbursed environmental cleanup costs over $100,000,
limited to $150,000 per site (commonly called “brownfield” sites) for tax years 1998 through 2001. A maximum of $40,000 of credit can be taken each year; unused credits can be carried forward for 5 years.
12. Amount of credit negotiated between the taxpayer and the Department of Commerce and Community Affairs based on the economic growth potential of a business project that provides capital improvements and new jobs, under the Economic Development for a Growing Economy (EDGE) Tax Credit Act. Credit for a project authorized under the Corporate Headquarters Relocation Act cannot be used more than 15 years.
13. Amounts equal to (a) 30% of startup costs to establish a child-care facility for a corporation’s employees (during tax years 2000 through 2004); and (b) 5% of
Illinois’ Corporate Income Tax - 2002 Page 5
the annual costs to provide a child-care facility for the corporation’s employees. This credit cannot be claimed if the corporation claims a credit for costs of operating an on-site day-care facility (item 10 above).
14. 50% of amounts donated to an affordable housing project authorized under the Illinois Housing Development Act. The credit ends on December 31, 2006.
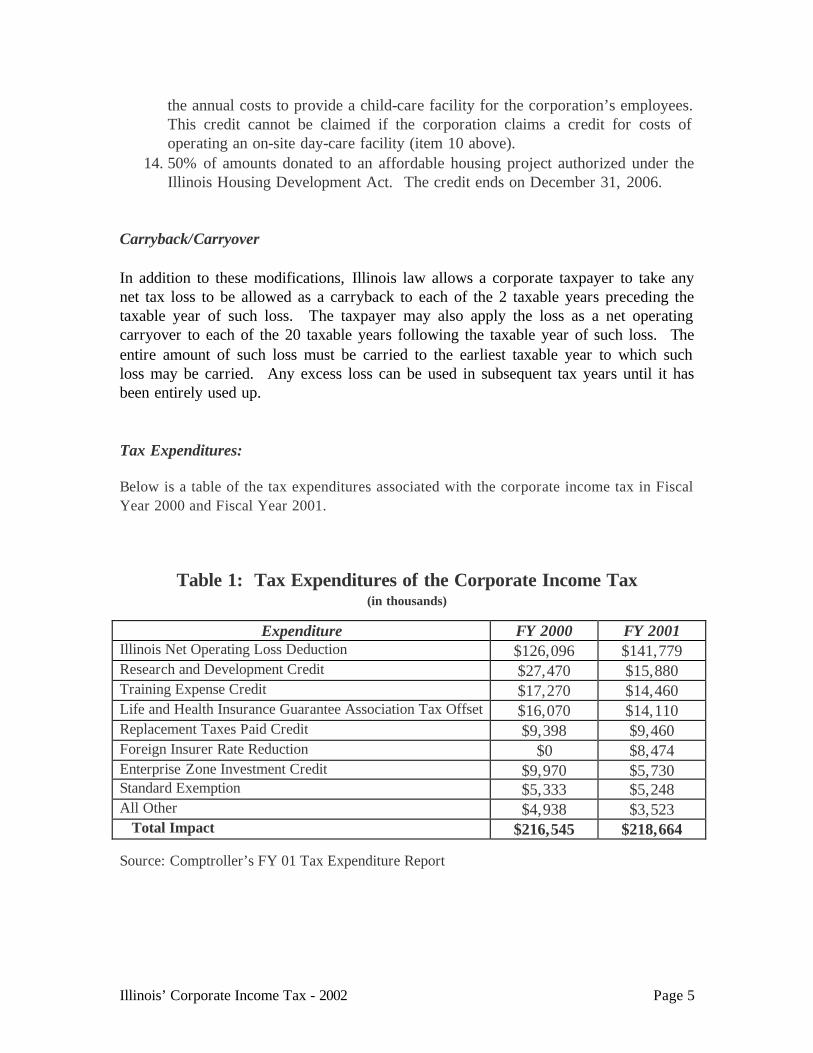
Carryback/Carryover In addition to these modifications, Illinois law allows a corporate taxpayer to take any net tax loss to be allowed as a carryback to each of the 2 taxable years preceding the taxable year of such loss. The taxpayer may also apply the loss as a net operating carryover to each of the 20 taxable years following the taxable year of such loss. The entire amount of such loss must be carried to the earliest taxable year to which such loss may be carried. Any excess loss can be used in subsequent tax years until it has been entirely used up. Tax Expenditures: Below is a table of the tax expenditures associated with the corporate income tax in Fiscal Year 2000 and Fiscal Year 2001.
Table 1: Tax Expenditures of the Corporate Income Tax (in thousands)
Expenditure FY 2000 FY 2001 Illinois Net Operating Loss Deduction $126,096 $141,779 Research and Development Credit $27,470 $15,880 Training Expense Credit $17,270 $14,460 Life and Health Insurance Guarantee Association Tax Offset $16,070 $14,110 Replacement Taxes Paid Credit $9,398 $9,460 Foreign Insurer Rate Reduction $0 $8,474 Enterprise Zone Investment Credit $9,970 $5,730 Standard Exemption $5,333 $5,248 All Other $4,938 $3,523 Total Impact $216,545 $218,664 Source: Comptroller’s FY 01 Tax Expenditure Report
Illinois’ Corporate Income Tax - 2002 Page 6
The Single-Sales Factor Recently, Illinois changed the method for determining the corporate income from a three-part formula to a single-sales factor. Under prior law, a company’s in-state sales, the value of a corporation’s property, and its payroll in Illinois were weighed in determining how much of that company’s income was subject to the State’s corporate income tax and the personal property replacement tax. But Public Act 90-0613 changed the law to state that in tax year 2000 and thereafter, corporate income taxable in Illinois would be determined solely on the basis of a company’s in-state sales. The intent of P.A. 90-0613 was to encourage the growth of manufacturing industries in the State. The single-sales factor reduces the income tax burden on firms that have a relatively large share of their property and payroll in Illinois, while making most of their sales out of state. However, some feel that the positive effect that this move has had on manufacturing industries may be offset by other factors. One factor is that for each corporation that benefits from the single-sales factor, because most of its sales are out of Illinois, there are other corporations that are punished by the factor because their sales are mostly in the State. Large multinational companies are the largest beneficiaries of the tax break, while small mom and pop shops, who make most, if not all, of their sales in the State, receive no benefit from this tax law change. Another offsetting factor is that every other neighboring state now applies a higher weight to the sales factor. As more and more states move toward the same single-sales factor that Illinois imposes, the incentive generated by the single-sales factor disappears. Because the other states are offering this same incentive, Illinois now has reduced corporate income tax revenues, but enjoys few of the locational incentives the single-sales factor was intended to offer. The Department of Revenue estimates that Illinois lost approximately $96 million in State and local tax revenues in 2001 due to the single-sales factor. Approximately $63 million of that was from State corporate income tax receipts, while an estimated $33 million was from personal property tax replacement receipts. Some argue that there is no compelling evidence that the single-sales factor has resulted in any economic growth. They point out that many of the companies benefiting from the single-sales factor have laid-off thousands of Illinois workers and/or have been purchased by out-of-state or foreign-owned companies. This may be true, however, had Illinois not changed to the single sales factor, the State would have risked losing additional large multinational corporations to other states that now have the single-sales factor incentive.
Illinois’ Corporate Income Tax - 2002 Page 7
Decoupling from Federal “Bonus Depreciation” Tax Cut In March of 2002, the federal government approved an economic stimulus package aimed at boosting the nation’s anemic economy. The President signed this legislation into law on March 9, 2002. Among the items included in the package is a tax deduction provision that allows an additional first-year depreciation deduction equal to 30 percent of the adjusted basis of certain qualified property. The deduction allows businesses to write-off more quickly the cost of various purchases and investments. The depreciation deduction is effective retroactive to September 11, 2001 and is set to expire in September of 2004. The additional depreciation deduction provision is estimated to cost the federal government approximately $96.6 billion over the three-year span of the provision. Not only will it affect federal revenues, but because most state corporate tax codes are tied to the federal code, this federal tax provision significantly impacts state revenues throughout the nation as well. Based on a state-by-state analysis from the Center on Budget and Policy Priorities (CBPP), it was estimated that the State of Illinois was in line to lose approximately $900 million over the three-year period of the provision due to the additional depreciation deduction. Depending on assumptions used, first-year cost estimates ranged from $300 to $400 million. Based on Illinois’ corporate income tax structure, nearly two-thirds of that loss would come from State revenues, with the remainder a loss to local governments. Already facing one of the worse fiscal situations in recent history, the State of Illinois could not afford further revenue losses. As a result, the State legislature quickly moved to “decouple” from the federal code – in effect, disallowing the new bonus depreciation. This legislative action came through SB 1543. The bill states that for taxable years 2001 and thereafter, an amount equal to the bonus depreciation deduction (30% of the adjusted basis of the qualified property) taken on the taxpayer’s federal income tax return must be added to the taxpayer’s adjusted gross income amount. The bill also states that if the taxpayer reports a capital gain or loss on the taxpayer’s federal income tax return for the taxable year based on a sale or transfer of property for which the taxpayer was required in any taxable year to make the addition modification mentioned above, then an amount equal to the aggregate amount of the deductions taken in all taxable years with respect to that property must be added to the taxpayer’s adjusted gross income amount. The taxpayer is required to make the addition modification only once with respect to any one piece of property. In addition, this legislation allows an income tax deduction in an amount equal to the amount of depreciation deductions that would have been taken under prior law, had the bonus depreciation provision not taken place. On June 5, 2002, the General Assembly
Illinois’ Corporate Income Tax - 2002 Page 8
passed SB 1543 and sent it to the governor. On June 28, 2002, Governor Ryan signed the bill into law as P.A. 92-0603. The signage of P.A. 92-0603 is expected to prevent an estimated $161 million net income tax revenue loss in FY 2003 and similar losses in FY 2004 and FY 2005. Illinois is not the only state to take legislative action to prevent significant revenue losses. According to the CBPP, as of the beginning of July 2002, the following decoupling moves have taken place.
• Twenty-six states that previously followed federal depreciation rules are now decoupled. In nineteen states – Arizona, Connecticut, Georgia, Hawaii, Illinois, Indiana, Iowa, Maryland, Massachusetts, Minnesota, Missouri (for one year), Nebraska, New Jersey, Ohio, Pennsylvania, Rhode Island, South Carolina, Vermont (for corporate income tax filers only) and Virginia – the decoupling resulted from, or was confirmed by, explicit legislative action following enactment of the federal law. Six other states, Arkansas, Idaho, Kentucky, New Hampshire, South Dakota, and Texas, decoupled automatically under pre-existing tax law. The twenty-sixth decoupled state is Mississippi, as a result of a ruling by the state tax commissioner.
• Two additional states, North Carolina and Wisconsin, are advancing
legislation to decouple from bonus depreciation. Two other states, Michigan and Tennessee, are still developing or revising their FY 2003 budgets and could choose to decouple in order to avert or reduce budget deficits.
• Among remaining states, California historically has not conformed to
federal depreciation rules; Nevada, Washington, and Wyoming do not have corporate or personal income taxes. Only a small number of states have enacted legislation to conform to the federal change. Florida, Maine, and West Virginia have passed laws to conform. Alabama, Alaska, Colorado, Delaware, Kansas, Louisiana, New Mexico, New York, Oklahoma, Oregon, and Utah, where legislative budget sessions have ended, and Montana and North Dakota, where there were no sessions this year, will conform automatically to the change.
Illinois’ Corporate Income Tax - 2002 Page 9
Revenue Collections History:
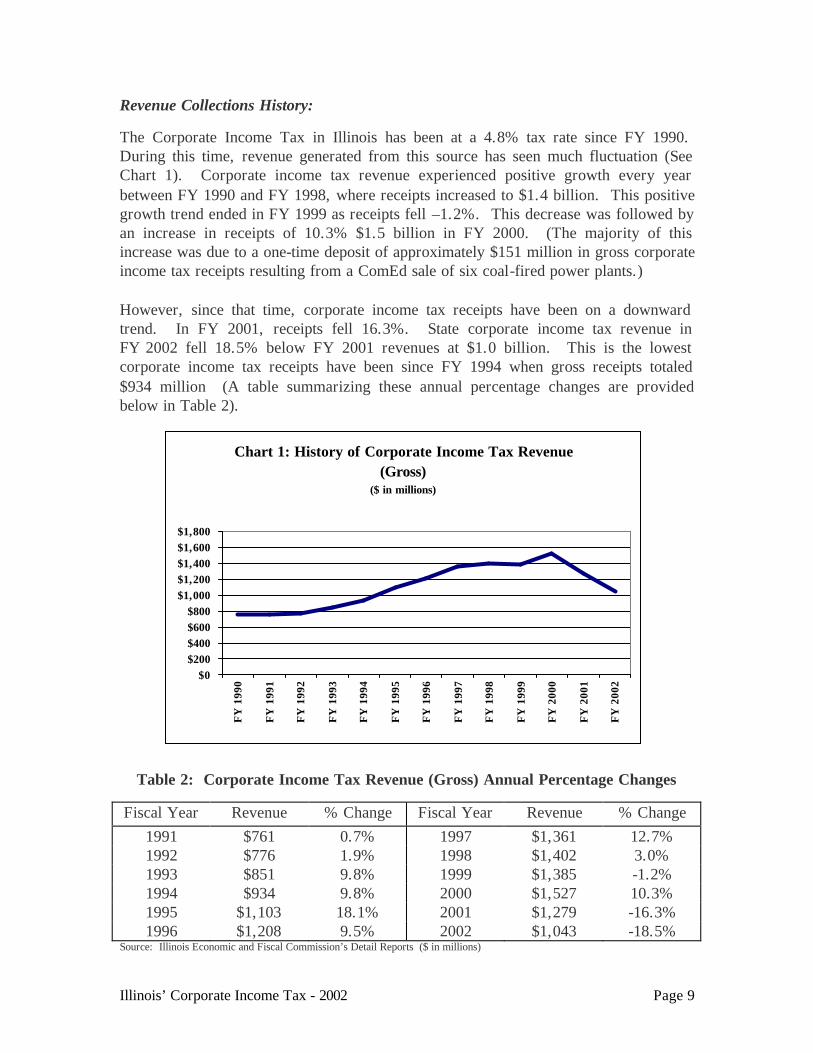
The Corporate Income Tax in Illinois has been at a 4.8% tax rate since FY 1990. During this time, revenue generated from this source has seen much fluctuation (See Chart 1). Corporate income tax revenue experienced positive growth every year between FY 1990 and FY 1998, where receipts increased to $1.4 billion. This positive growth trend ended in FY 1999 as receipts fell –1.2%. This decrease was followed by an increase in receipts of 10.3% $1.5 billion in FY 2000. (The majority of this increase was due to a one-time deposit of approximately $151 million in gross corporate income tax receipts resulting from a ComEd sale of six coal-fired power plants.) However, since that time, corporate income tax receipts have been on a downward trend. In FY 2001, receipts fell 16.3%. State corporate income tax revenue in FY 2002 fell 18.5% below FY 2001 revenues at $1.0 billion. This is the lowest corporate income tax receipts have been since FY 1994 when gross receipts totaled $934 million (A table summarizing these annual percentage changes are provided below in Table 2).
Table 2: Corporate Income Tax Revenue (Gross) Annual Percentage Changes
Fiscal Year Revenue % Change Fiscal Year Revenue % Change 1991 $761 0.7% 1997 $1,361 12.7% 1992 $776 1.9% 1998 $1,402 3.0% 1993 $851 9.8% 1999 $1,385 -1.2% 1994 $934 9.8% 2000 $1,527 10.3% 1995 $1,103 18.1% 2001 $1,279 -16.3% 1996 $1,208 9.5% 2002 $1,043 -18.5%
Source: Illinois Economic and Fiscal Commission’s Detail Reports ($ in millions)
Chart 1: History of Corporate Income Tax Revenue (Gross)
($ in millions)
$0$200$400$600$800
$1,000$1,200$1,400$1,600$1,800
FY
199
0
FY
199
1
FY
199
2
FY
199
3
FY
199
4
FY
199
5
FY
199
6
FY
199
7
FY
199
8
FY
199
9
FY
200
0
FY
200
1
FY
200
2
Illinois’ Corporate Income Tax - 2002 Page 10
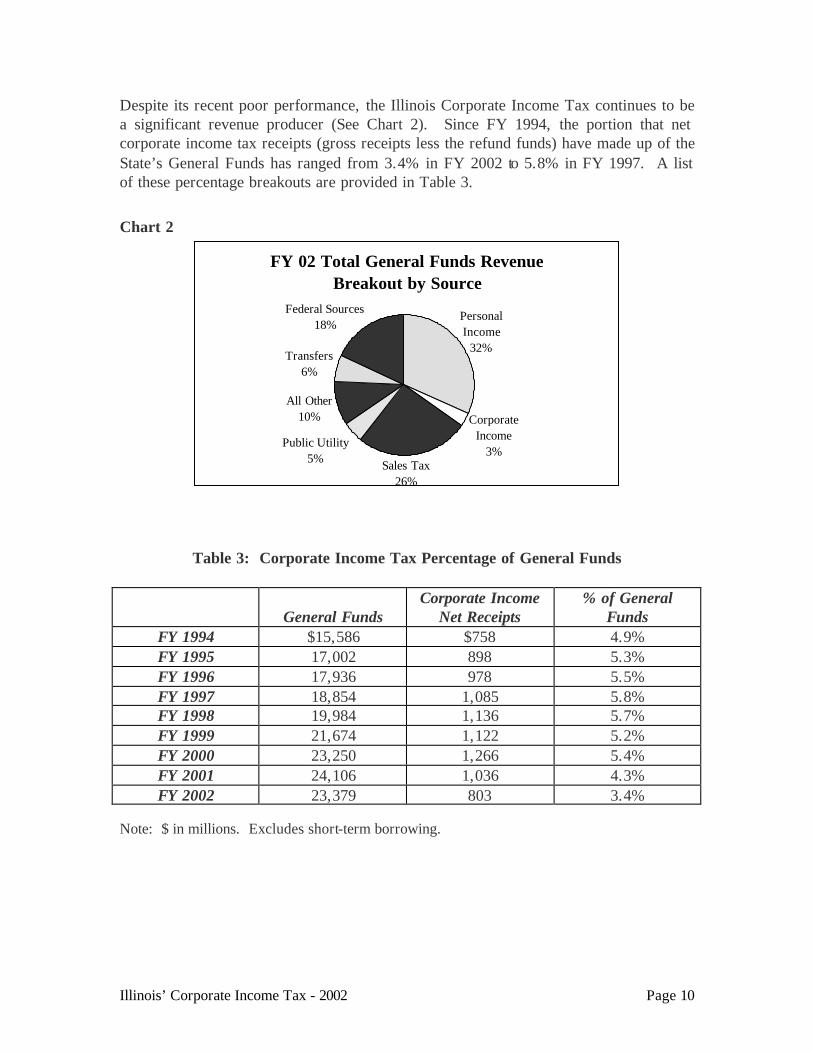
Despite its recent poor performance, the Illinois Corporate Income Tax continues to be a significant revenue producer (See Chart 2). Since FY 1994, the portion that net corporate income tax receipts (gross receipts less the refund funds) have made up of the State’s General Funds has ranged from 3.4% in FY 2002 to 5.8% in FY 1997. A list of these percentage breakouts are provided in Table 3. Chart 2
FY 02 Total General Funds Revenue Breakout by Source
Public Utility5%
All Other10%
Transfers6%
Personal Income32%
Federal Sources18%
Sales Tax26%
Corporate Income
3%
Table 3: Corporate Income Tax Percentage of General Funds
General Funds
Corporate Income Net Receipts
% of General Funds
FY 1994 $15,586 $758 4.9% FY 1995 17,002 898 5.3% FY 1996 17,936 978 5.5% FY 1997 18,854 1,085 5.8% FY 1998 19,984 1,136 5.7% FY 1999 21,674 1,122 5.2% FY 2000 23,250 1,266 5.4% FY 2001 24,106 1,036 4.3% FY 2002 23,379 803 3.4%
Note: $ in millions. Excludes short-term borrowing.
Illinois’ Corporate Income Tax - 2002 Page 11
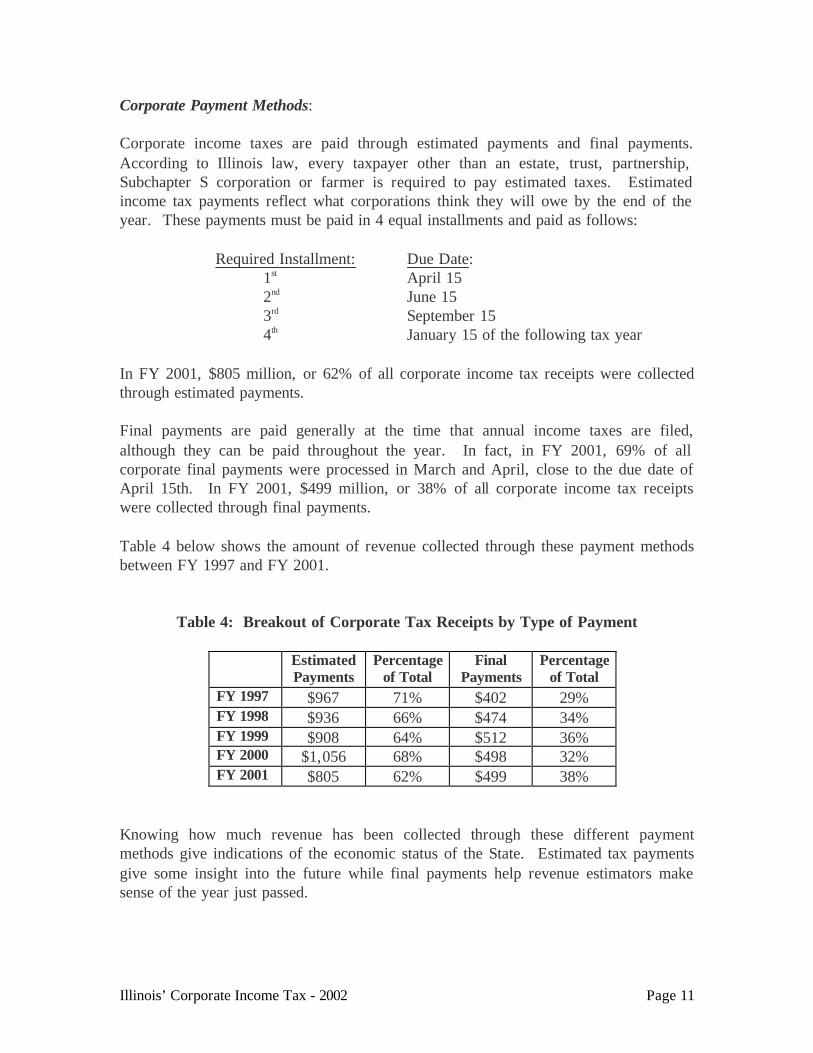
Corporate Payment Methods: Corporate income taxes are paid through estimated payments and final payments. According to Illinois law, every taxpayer other than an estate, trust, partnership, Subchapter S corporation or farmer is required to pay estimated taxes. Estimated income tax payments reflect what corporations think they will owe by the end of the year. These payments must be paid in 4 equal installments and paid as follows: Required Installment: Due Date: 1st April 15 2nd June 15 3rd September 15 4th January 15 of the following tax year In FY 2001, $805 million, or 62% of all corporate income tax receipts were collected through estimated payments. Final payments are paid generally at the time that annual income taxes are filed, although they can be paid throughout the year. In fact, in FY 2001, 69% of all corporate final payments were processed in March and April, close to the due date of April 15th. In FY 2001, $499 million, or 38% of all corporate income tax receipts were collected through final payments. Table 4 below shows the amount of revenue collected through these payment methods between FY 1997 and FY 2001.
Table 4: Breakout of Corporate Tax Receipts by Type of Payment
Estimated Payments
Percentage of Total
Final Payments
Percentage of Total
FY 1997 $967 71% $402 29% FY 1998 $936 66% $474 34% FY 1999 $908 64% $512 36% FY 2000 $1,056 68% $498 32% FY 2001 $805 62% $499 38%
Knowing how much revenue has been collected through these different payment methods give indications of the economic status of the State. Estimated tax payments give some insight into the future while final payments help revenue estimators make sense of the year just passed.
Illinois’ Corporate Income Tax - 2002 Page 12
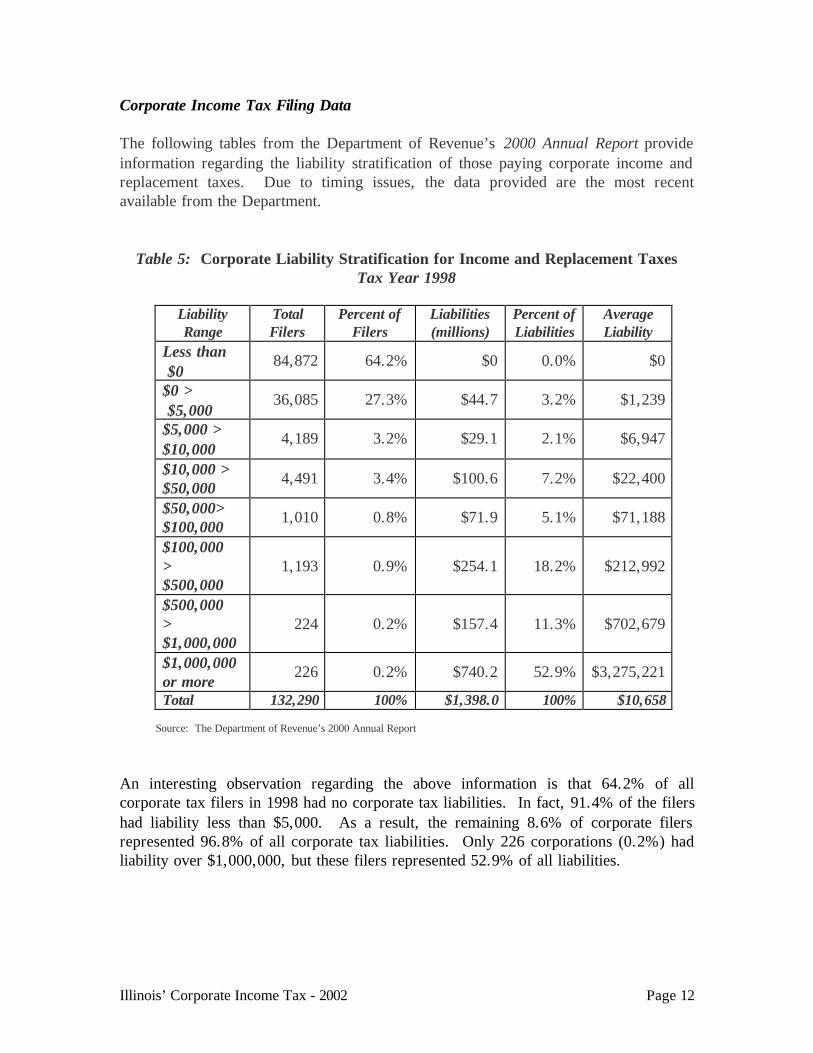
Corporate Income Tax Filing Data The following tables from the Department of Revenue’s 2000 Annual Report provide information regarding the liability stratification of those paying corporate income and replacement taxes. Due to timing issues, the data provided are the most recent available from the Department.
Table 5: Corporate Liability Stratification for Income and Replacement Taxes Tax Year 1998
Liability Range
Total Filers
Percent of Filers
Liabilities (millions)
Percent of Liabilities
Average Liability
Less than $0
84,872 64.2% $0 0.0% $0
$0 > $5,000
36,085 27.3% $44.7 3.2% $1,239
$5,000 > $10,000
4,189 3.2% $29.1 2.1% $6,947
$10,000 > $50,000
4,491 3.4% $100.6 7.2% $22,400
$50,000> $100,000
1,010 0.8% $71.9 5.1% $71,188
$100,000 > $500,000
1,193 0.9% $254.1 18.2% $212,992
$500,000 > $1,000,000
224 0.2% $157.4 11.3% $702,679
$1,000,000 or more
226 0.2% $740.2 52.9% $3,275,221
Total 132,290 100% $1,398.0 100% $10,658 Source: The Department of Revenue’s 2000 Annual Report
An interesting observation regarding the above information is that 64.2% of all corporate tax filers in 1998 had no corporate tax liabilities. In fact, 91.4% of the filers had liability less than $5,000. As a result, the remaining 8.6% of corporate filers represented 96.8% of all corporate tax liabilities. Only 226 corporations (0.2%) had liability over $1,000,000, but these filers represented 52.9% of all liabilities.
Illinois’ Corporate Income Tax - 2002 Page 13
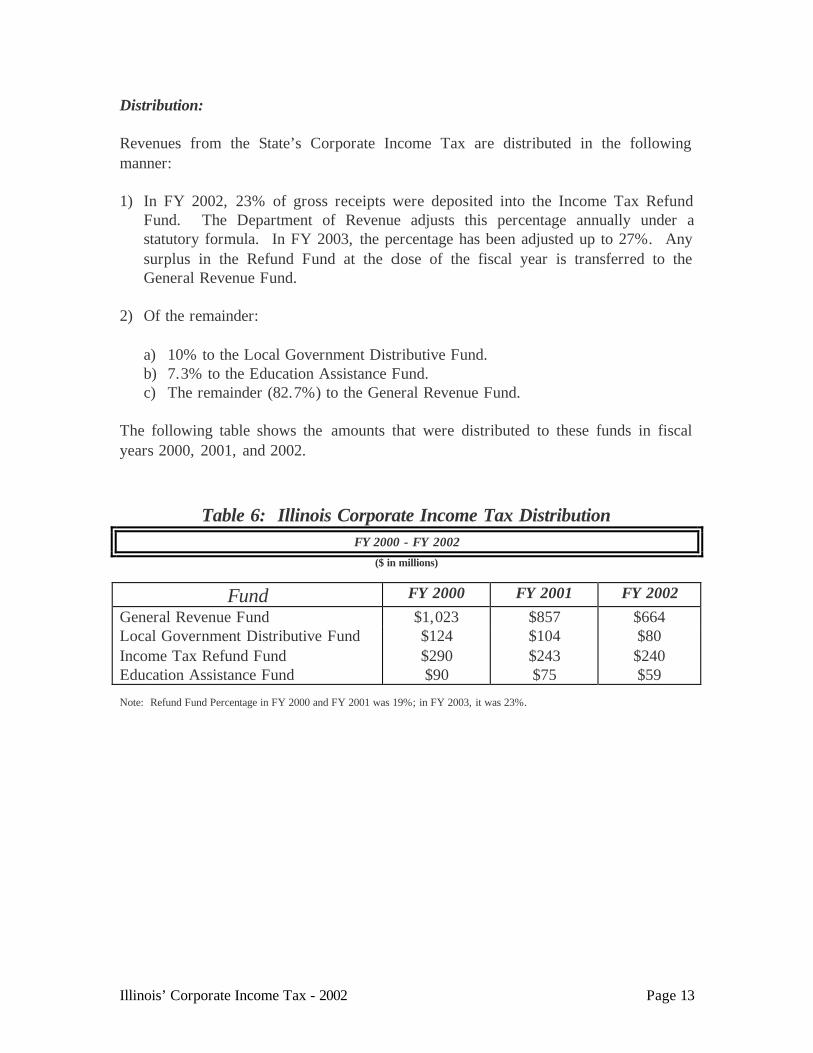
Distribution: Revenues from the State’s Corporate Income Tax are distributed in the following manner: 1) In FY 2002, 23% of gross receipts were deposited into the Income Tax Refund
Fund. The Department of Revenue adjusts this percentage annually under a statutory formula. In FY 2003, the percentage has been adjusted up to 27%. Any surplus in the Refund Fund at the close of the fiscal year is transferred to the General Revenue Fund.
2) Of the remainder:
a) 10% to the Local Government Distributive Fund. b) 7.3% to the Education Assistance Fund. c) The remainder (82.7%) to the General Revenue Fund.
The following table shows the amounts that were distributed to these funds in fiscal years 2000, 2001, and 2002.
Table 6: Illinois Corporate Income Tax Distribution FY 2000 - FY 2002
($ in millions)
Fund FY 2000 FY 2001 FY 2002 General Revenue Fund $1,023 $857 $664 Local Government Distributive Fund $124 $104 $80 Income Tax Refund Fund $290 $243 $240 Education Assistance Fund $90 $75 $59 Note: Refund Fund Percentage in FY 2000 and FY 2001 was 19%; in FY 2003, it was 23%.
Illinois’ Corporate Income Tax - 2002 Page 14
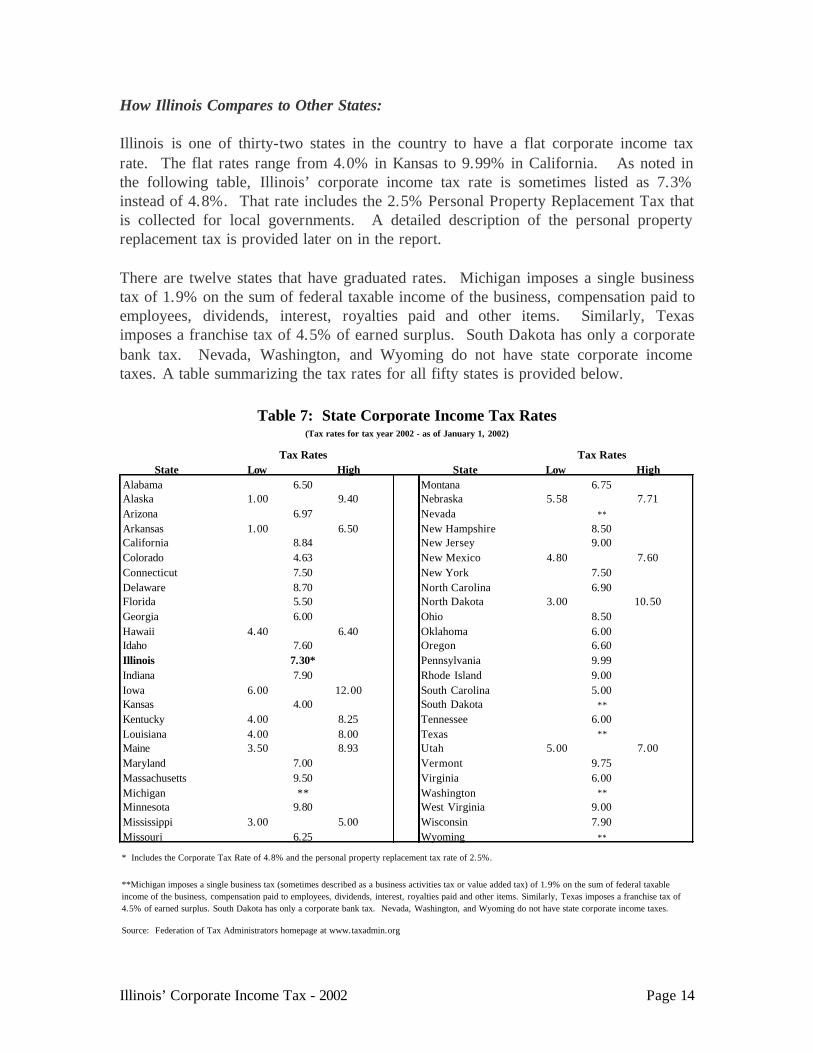
How Illinois Compares to Other States: Illinois is one of thirty-two states in the country to have a flat corporate income tax rate. The flat rates range from 4.0% in Kansas to 9.99% in California. As noted in the following table, Illinois’ corporate income tax rate is sometimes listed as 7.3% instead of 4.8%. That rate includes the 2.5% Personal Property Replacement Tax that is collected for local governments. A detailed description of the personal property replacement tax is provided later on in the report. There are twelve states that have graduated rates. Michigan imposes a single business tax of 1.9% on the sum of federal taxable income of the business, compensation paid to employees, dividends, interest, royalties paid and other items. Similarly, Texas imposes a franchise tax of 4.5% of earned surplus. South Dakota has only a corporate bank tax. Nevada, Washington, and Wyoming do not have state corporate income taxes. A table summarizing the tax rates for all fifty states is provided below.
State Low High State Low HighAlabama MontanaAlaska 1.00 9.40 Nebraska 5.58 7.71Arizona NevadaArkansas 1.00 6.50 New HampshireCalifornia New JerseyColorado New Mexico 4.80 7.60Connecticut New YorkDelaware North CarolinaFlorida North Dakota 3.00 10.50Georgia OhioHawaii 4.40 6.40 OklahomaIdaho OregonIllinois PennsylvaniaIndiana Rhode IslandIowa 6.00 12.00 South CarolinaKansas South DakotaKentucky 4.00 8.25 TennesseeLouisiana 4.00 8.00 TexasMaine 3.50 8.93 Utah 5.00 7.00Maryland VermontMassachusetts VirginiaMichigan WashingtonMinnesota West VirginiaMississippi 3.00 5.00 WisconsinMissouri Wyoming
* Includes the Corporate Tax Rate of 4.8% and the personal property replacement tax rate of 2.5%.
Source: Federation of Tax Administrators homepage at www.taxadmin.org
7.90
**
9.99
Tax Rates Tax Rates
**
**
**
8.50
7.60
4.00
7.00
6.00
Table 7: State Corporate Income Tax Rates(Tax rates for tax year 2002 - as of January 1, 2002)
4.63
9.50
6.50
6.97
8.84
7.508.70
6.00
6.75
9.80
6.25
8.506.006.60
5.00
6.00
9.007.90
**Michigan imposes a single business tax (sometimes described as a business activities tax or value added tax) of 1.9% on the sum of federal taxable income of the business, compensation paid to employees, dividends, interest, royalties paid and other items. Similarly, Texas imposes a franchise tax of 4.5% of earned surplus. South Dakota has only a corporate bank tax. Nevada, Washington, and Wyoming do not have state corporate income taxes.
7.506.90
9.00
**
9.75
5.50
**
9.007.30*
Illinois’ Corporate Income Tax - 2002 Page 15
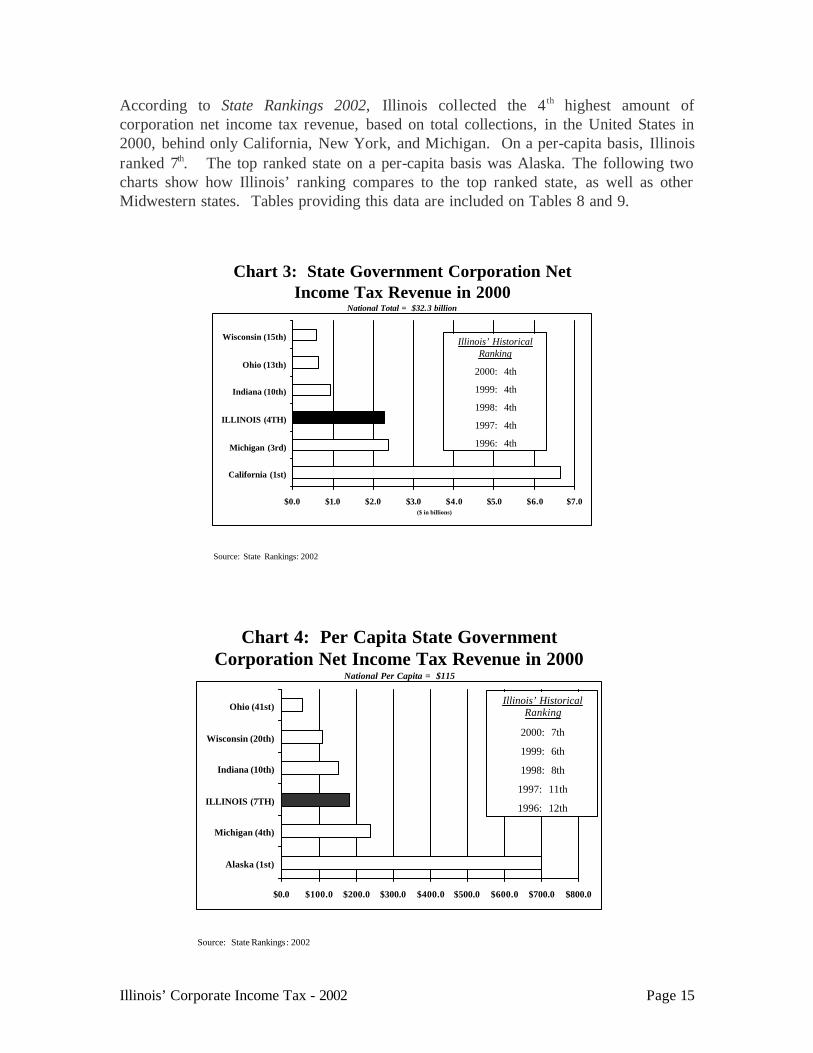
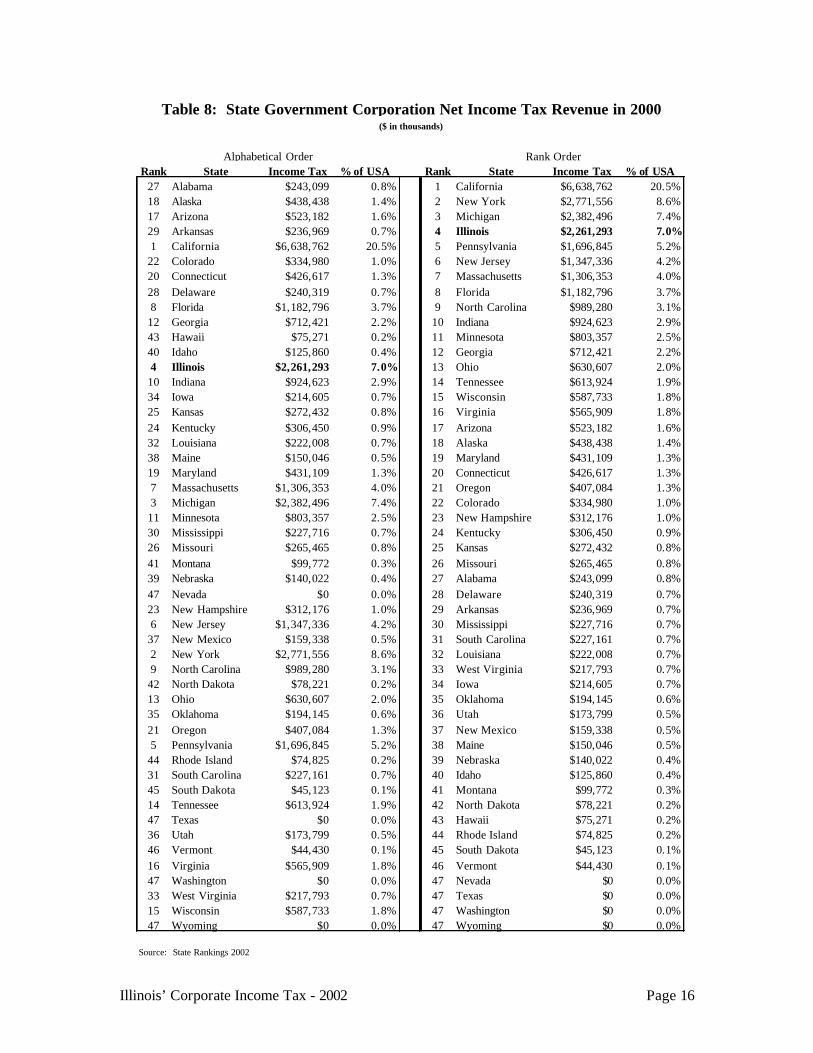
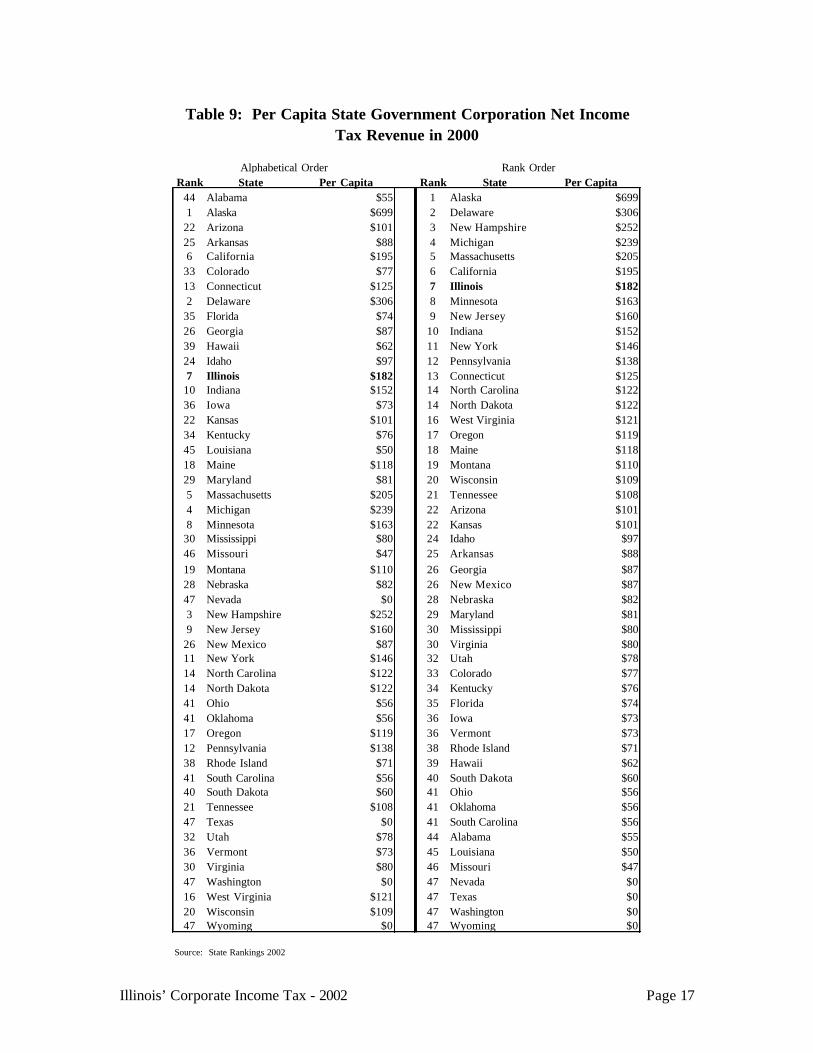
According to State Rankings 2002, Illinois collected the 4 th highest amount of corporation net income tax revenue, based on total collections, in the United States in 2000, behind only California, New York, and Michigan. On a per-capita basis, Illinois ranked 7th. The top ranked state on a per-capita basis was Alaska. The following two charts show how Illinois’ ranking compares to the top ranked state, as well as other Midwestern states. Tables providing this data are included on Tables 8 and 9.
Chart 3: State Government Corporation Net Income Tax Revenue in 2000
National Total = $32.3 billion
$0.0 $1.0 $2.0 $3.0 $4.0 $5.0 $6.0 $7.0
California (1st)
Michigan (3rd)
ILLINOIS (4TH)
Indiana (10th)
Ohio (13th)
Wisconsin (15th)
($ in billions)
Source: State Rankings: 2002
Illinois’ Historical Ranking
2000: 4th
1999: 4th
1998: 4th
1997: 4th
1996: 4th
Chart 4: Per Capita State Government Corporation Net Income Tax Revenue in 2000
National Per Capita = $115
$0.0 $100.0 $200.0 $300.0 $400.0 $500.0 $600.0 $700.0 $800.0
Alaska (1st)
Michigan (4th)
ILLINOIS (7TH)
Indiana (10th)
Wisconsin (20th)
Ohio (41st)
Source: State Rankings : 2002
Illinois’ Historical Ranking
2000: 7th
1999: 6th
1998: 8th
1997: 11th
1996: 12th
Illinois’ Corporate Income Tax - 2002 Page 16
Rank State Income Tax % of USA Rank State Income Tax % of USA27 Alabama $243,099 0.8% 1 California $6,638,762 20.5%18 Alaska $438,438 1.4% 2 New York $2,771,556 8.6%17 Arizona $523,182 1.6% 3 Michigan $2,382,496 7.4%29 Arkansas $236,969 0.7% 4 Illinois $2,261,293 7.0%1 California $6,638,762 20.5% 5 Pennsylvania $1,696,845 5.2%22 Colorado $334,980 1.0% 6 New Jersey $1,347,336 4.2%20 Connecticut $426,617 1.3% 7 Massachusetts $1,306,353 4.0%28 Delaware $240,319 0.7% 8 Florida $1,182,796 3.7%8 Florida $1,182,796 3.7% 9 North Carolina $989,280 3.1%12 Georgia $712,421 2.2% 10 Indiana $924,623 2.9%43 Hawaii $75,271 0.2% 11 Minnesota $803,357 2.5%40 Idaho $125,860 0.4% 12 Georgia $712,421 2.2%4 Illinois $2,261,293 7.0% 13 Ohio $630,607 2.0%10 Indiana $924,623 2.9% 14 Tennessee $613,924 1.9%34 Iowa $214,605 0.7% 15 Wisconsin $587,733 1.8%25 Kansas $272,432 0.8% 16 Virginia $565,909 1.8%24 Kentucky $306,450 0.9% 17 Arizona $523,182 1.6%32 Louisiana $222,008 0.7% 18 Alaska $438,438 1.4%38 Maine $150,046 0.5% 19 Maryland $431,109 1.3%19 Maryland $431,109 1.3% 20 Connecticut $426,617 1.3%7 Massachusetts $1,306,353 4.0% 21 Oregon $407,084 1.3%3 Michigan $2,382,496 7.4% 22 Colorado $334,980 1.0%11 Minnesota $803,357 2.5% 23 New Hampshire $312,176 1.0%30 Mississippi $227,716 0.7% 24 Kentucky $306,450 0.9%26 Missouri $265,465 0.8% 25 Kansas $272,432 0.8%41 Montana $99,772 0.3% 26 Missouri $265,465 0.8%39 Nebraska $140,022 0.4% 27 Alabama $243,099 0.8%47 Nevada $0 0.0% 28 Delaware $240,319 0.7%23 New Hampshire $312,176 1.0% 29 Arkansas $236,969 0.7%6 New Jersey $1,347,336 4.2% 30 Mississippi $227,716 0.7%37 New Mexico $159,338 0.5% 31 South Carolina $227,161 0.7%2 New York $2,771,556 8.6% 32 Louisiana $222,008 0.7%9 North Carolina $989,280 3.1% 33 West Virginia $217,793 0.7%42 North Dakota $78,221 0.2% 34 Iowa $214,605 0.7%13 Ohio $630,607 2.0% 35 Oklahoma $194,145 0.6%35 Oklahoma $194,145 0.6% 36 Utah $173,799 0.5%21 Oregon $407,084 1.3% 37 New Mexico $159,338 0.5%5 Pennsylvania $1,696,845 5.2% 38 Maine $150,046 0.5%44 Rhode Island $74,825 0.2% 39 Nebraska $140,022 0.4%31 South Carolina $227,161 0.7% 40 Idaho $125,860 0.4%45 South Dakota $45,123 0.1% 41 Montana $99,772 0.3%14 Tennessee $613,924 1.9% 42 North Dakota $78,221 0.2%47 Texas $0 0.0% 43 Hawaii $75,271 0.2%36 Utah $173,799 0.5% 44 Rhode Island $74,825 0.2%46 Vermont $44,430 0.1% 45 South Dakota $45,123 0.1%16 Virginia $565,909 1.8% 46 Vermont $44,430 0.1%47 Washington $0 0.0% 47 Nevada $0 0.0%33 West Virginia $217,793 0.7% 47 Texas $0 0.0%15 Wisconsin $587,733 1.8% 47 Washington $0 0.0%47 Wyoming $0 0.0% 47 Wyoming $0 0.0%
Source: State Rankings 2002
Table 8: State Government Corporation Net Income Tax Revenue in 2000($ in thousands)
Alphabetical Order Rank Order
Illinois’ Corporate Income Tax - 2002 Page 17
Rank State Per Capita Rank State Per Capita44 Alabama $55 1 Alaska $6991 Alaska $699 2 Delaware $30622 Arizona $101 3 New Hampshire $25225 Arkansas $88 4 Michigan $2396 California $195 5 Massachusetts $20533 Colorado $77 6 California $19513 Connecticut $125 7 Illinois $1822 Delaware $306 8 Minnesota $16335 Florida $74 9 New Jersey $16026 Georgia $87 10 Indiana $15239 Hawaii $62 11 New York $14624 Idaho $97 12 Pennsylvania $1387 Illinois $182 13 Connecticut $12510 Indiana $152 14 North Carolina $12236 Iowa $73 14 North Dakota $12222 Kansas $101 16 West Virginia $12134 Kentucky $76 17 Oregon $11945 Louisiana $50 18 Maine $11818 Maine $118 19 Montana $11029 Maryland $81 20 Wisconsin $1095 Massachusetts $205 21 Tennessee $1084 Michigan $239 22 Arizona $1018 Minnesota $163 22 Kansas $10130 Mississippi $80 24 Idaho $9746 Missouri $47 25 Arkansas $8819 Montana $110 26 Georgia $8728 Nebraska $82 26 New Mexico $8747 Nevada $0 28 Nebraska $823 New Hampshire $252 29 Maryland $819 New Jersey $160 30 Mississippi $8026 New Mexico $87 30 Virginia $8011 New York $146 32 Utah $7814 North Carolina $122 33 Colorado $7714 North Dakota $122 34 Kentucky $7641 Ohio $56 35 Florida $7441 Oklahoma $56 36 Iowa $7317 Oregon $119 36 Vermont $7312 Pennsylvania $138 38 Rhode Island $7138 Rhode Island $71 39 Hawaii $6241 South Carolina $56 40 South Dakota $6040 South Dakota $60 41 Ohio $5621 Tennessee $108 41 Oklahoma $5647 Texas $0 41 South Carolina $5632 Utah $78 44 Alabama $5536 Vermont $73 45 Louisiana $5030 Virginia $80 46 Missouri $4747 Washington $0 47 Nevada $016 West Virginia $121 47 Texas $020 Wisconsin $109 47 Washington $047 Wyoming $0 47 Wyoming $0
Source: State Rankings 2002
Table 9: Per Capita State Government Corporation Net Income Tax Revenue in 2000
Alphabetical Order Rank Order
Illinois’ Corporate Income Tax - 2002 Page 18
Personal Property Replacement Tax
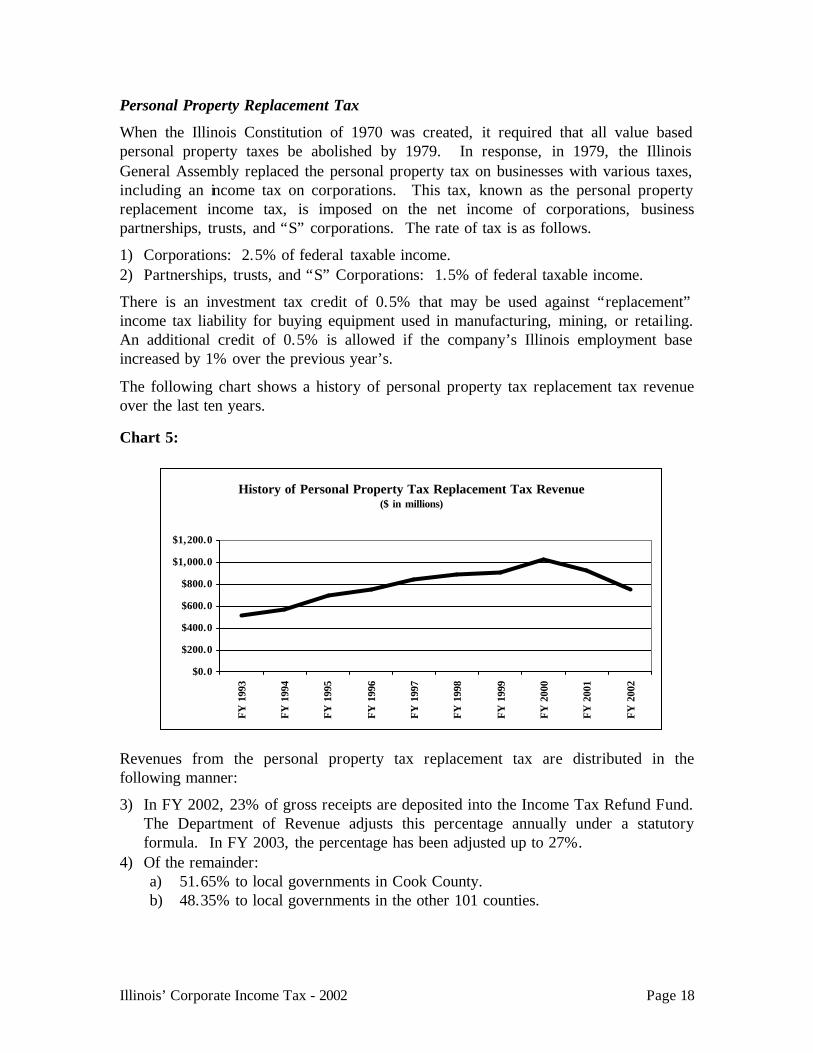
When the Illinois Constitution of 1970 was created, it required that all value based personal property taxes be abolished by 1979. In response, in 1979, the Illinois General Assembly replaced the personal property tax on businesses with various taxes, including an income tax on corporations. This tax, known as the personal property replacement income tax, is imposed on the net income of corporations, business partnerships, trusts, and “S” corporations. The rate of tax is as follows.
1) Corporations: 2.5% of federal taxable income. 2) Partnerships, trusts, and “S” Corporations: 1.5% of federal taxable income.
There is an investment tax credit of 0.5% that may be used against “replacement” income tax liability for buying equipment used in manufacturing, mining, or retailing. An additional credit of 0.5% is allowed if the company’s Illinois employment base increased by 1% over the previous year’s.
The following chart shows a history of personal property tax replacement tax revenue over the last ten years.
Chart 5:
Revenues from the personal property tax replacement tax are distributed in the following manner:
3) In FY 2002, 23% of gross receipts are deposited into the Income Tax Refund Fund. The Department of Revenue adjusts this percentage annually under a statutory formula. In FY 2003, the percentage has been adjusted up to 27%.
4) Of the remainder: a) 51.65% to local governments in Cook County. b) 48.35% to local governments in the other 101 counties.
History of Personal Property Tax Replacement Tax Revenue($ in millions)
$0.0
$200.0
$400.0
$600.0
$800.0
$1,000.0
$1,200.0
FY 1
993
FY 1
994
FY 1
995
FY 1
996
FY 1
997
FY 1
998
FY 1
999
FY 2
000
FY 2
001
FY 2
002
Illinois’ Corporate Income Tax - 2002 Page 19
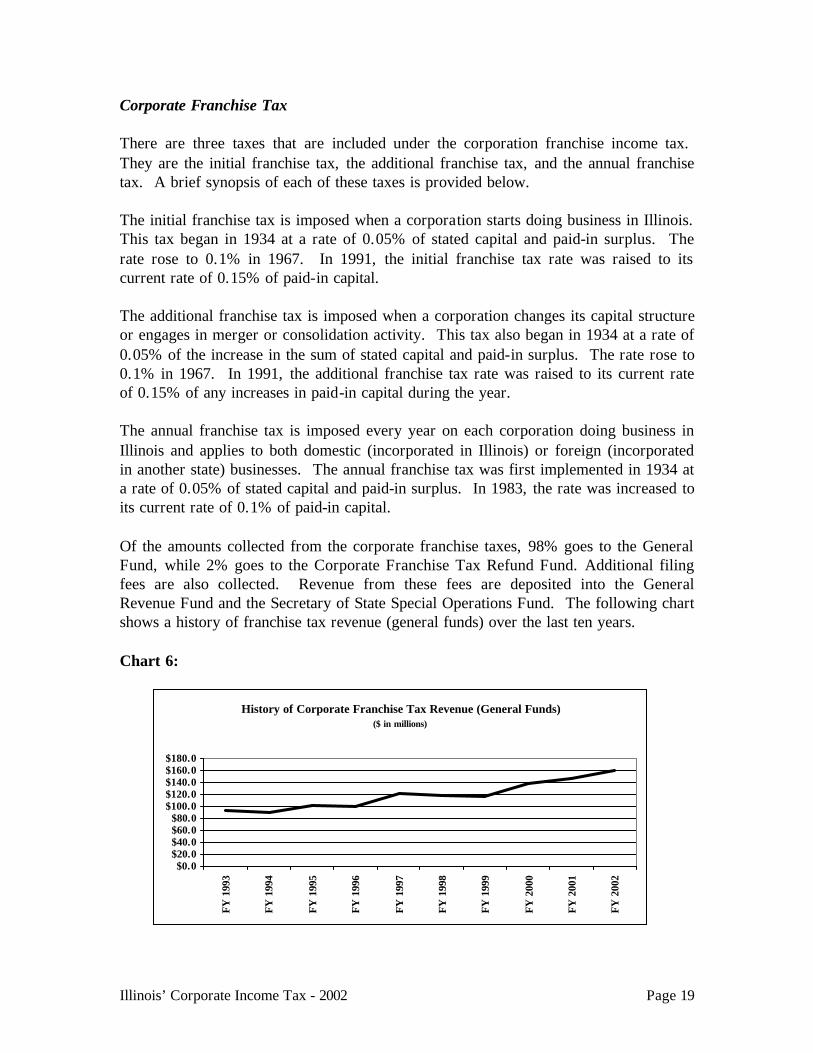
Corporate Franchise Tax There are three taxes that are included under the corporation franchise income tax. They are the initial franchise tax, the additional franchise tax, and the annual franchise tax. A brief synopsis of each of these taxes is provided below. The initial franchise tax is imposed when a corporation starts doing business in Illinois. This tax began in 1934 at a rate of 0.05% of stated capital and paid-in surplus. The rate rose to 0.1% in 1967. In 1991, the initial franchise tax rate was raised to its current rate of 0.15% of paid-in capital. The additional franchise tax is imposed when a corporation changes its capital structure or engages in merger or consolidation activity. This tax also began in 1934 at a rate of 0.05% of the increase in the sum of stated capital and paid-in surplus. The rate rose to 0.1% in 1967. In 1991, the additional franchise tax rate was raised to its current rate of 0.15% of any increases in paid-in capital during the year. The annual franchise tax is imposed every year on each corporation doing business in Illinois and applies to both domestic (incorporated in Illinois) or foreign (incorporated in another state) businesses. The annual franchise tax was first implemented in 1934 at a rate of 0.05% of stated capital and paid-in surplus. In 1983, the rate was increased to its current rate of 0.1% of paid-in capital. Of the amounts collected from the corporate franchise taxes, 98% goes to the General Fund, while 2% goes to the Corporate Franchise Tax Refund Fund. Additional filing fees are also collected. Revenue from these fees are deposited into the General Revenue Fund and the Secretary of State Special Operations Fund. The following chart shows a history of franchise tax revenue (general funds) over the last ten years. Chart 6:
History of Corporate Franchise Tax Revenue (General Funds)($ in millions)
$0.0$20.0$40.0$60.0$80.0
$100.0$120.0$140.0$160.0$180.0
FY 1
993
FY 1
994
FY 1
995
FY 1
996
FY 1
997
FY 1
998
FY 1
999
FY 2
000
FY 2
001
FY 2
002
BACKGROUND
The Illinois Economic and Fiscal Commission, a bipartisan, joint legislative commission, provides the General Assembly with information relevant to the Illinois economy, taxes and other sources of revenue and debt obligations of the State. The Commission's specific responsibilities include:
1) Preparation of annual revenue estimates with periodic updates; 2) Analysis of the fiscal impact of revenue bills;
3) Preparation of "State Debt Impact Notes" on legislation which would appropriate bond funds or increase bond authorization;
4) Periodic assessment of capital facility plans; and 5) Annual estimates of the liabilities of the State's group health
insurance program and approval of contract renewals promulgated by the Department of Central Management Services.
The Commission also has a mandate to report to the General Assembly ". . . on economic trends in relation to long-range planning and budgeting; and to study and make such recommendations as it deems appropriate on local and regional economic and fiscal policies and on federal fiscal policy as it may affect Illinois. . . ." This results in several reports on various economic issues throughout the year. The Commission publishes two primary reports. The "Revenue Estimate and Economic Outlook" describes and projects economic conditions and their impact on State revenues. "The Illinois Bond Watcher" examines the State's debt position as well as other issues directly related to conditions in the financial markets. The Commission also periodically publishes special topic reports that have or could have an impact on the economic well being of Illinois. These reports are available from: Illinois Economic and Fiscal Commission 703 Stratton Office Building Springfield, Illinois 62706 (217) 782-5320 (217) 782-3513 (FAX) Reports can also be accessed from our Webpage:
http://www.legis.state.il.us/commission/ecfisc/ecfisc_home.html