Embed Size (px)
Citation preview

VENTURE CAPITAL
VC ACTIVITY BY STAGE, MOST-FUNDED COMPANIES
ILLINOIS
IN REVIEW 2015
A DECADE HIGH IN CAPITAL INVESTED
Page 8»
Page 5»
Credits & ContactPitchBook Data, Inc.
JOHN GABBERT Founder, CEO
ADLEY BOWDEN Vice President
Market Development & Analysis
ContentGARRETT JAMES BLACK Senior Analyst
BRIAN LEE Data Analyst
JENNIFER SAM Senior Graphic Designer
Contact PitchBook pitchbook.com
RESEARCH
EDITORIAL
SALES
MAURA O’HARA
Executive Director, IVCA
www.illinoisVC.org
COPYRIGHT © 2016 by PitchBook Data, Inc. All rights reserved. No part of this publication may be reproduced in any form or by any means—graphic, electronic, or mechanical, including photocopying, recording, taping, and information storage and retrieval systems—without the express written permission of PitchBook Data, Inc. Contents are based on information from sources believed to be reliable, but accuracy and completeness cannot be guaranteed. Nothing herein should be construed as any past, current or future recommendation to buy or sell any security or an offer to sell, or a solicitation of an offer to buy any security. This material does not purport to contain all of the information that a prospective investor may wish to consider and is not to be relied upon as such or used in substitution for the exercise of independent judgment.
Contents
Welcome Letter 3
Introduction 4
Activity Overview 5
Activity by State 6
Activity by City & Sector 7
Activity by Stage & Most-funded
Companies8
Exits Overview 9
Most Active Investors in Illinois 10
2 ILLINOIS VENTURE CAPITAL 2015 IN REVIEW
Maura O’Hara
Executive Director, Illinois Venture Capital Association
www.illinoisVC.org
With thanks to our partners at PitchBook (which recently secured $10 Million in Series B Funding from Chicago investor
Morningstar), we can look back at a strong year for Great Lakes entrepreneurs, VCs and limited partners!
Pitchbook’s 2015 Illinois Venture Capital in Review tells a great story about the key role Chicago entrepreneurs play in the
Great Lakes region. With 40% of all 2015 Great Lakes venture dollars invested in Chicagoland companies, we are truly at
the vortex of Midwest venture investing.
The 2015 PitchBook report also clearly describes the impact of private investors in private companies and the sustainability
of the ecosystem we have developed over the past 15 years.
• Venture-backed exits hit an all-time high. This is important for our local ecosystem because as money is returned to
the Limited Partners that invest in venture funds, the dollars can be “recycled” into more/new investments.
• For growth equity (or later-stage VC) companies that have figured out the business model and are ready to rapidly
expand, 2015 was a banner year, with the second-most late-stage deals of the decade, tying 2011’s tally.
• Early-stage VC & angel/seed investments in Illinois were nearly 80% of deal flow and 50% of overall capital invested in
2015, thus ensuring a strong future flow of growth equity opportunities.
IVCA is proud to count Illinois’ most active VC investors (page 10) as members.
• Pritzker Group Venture Capital
• Hyde Park Angels
• Hyde Park Venture Partners
• OCA Ventures
• Dundee Venture Capital
• MATH Venture Partners
Welcome LetterA Great Time for Midwest Entrepreneurs
3 ILLINOIS VENTURE CAPITAL 2015 IN REVIEW
Introduction MAKE WAY FOR
SMARTER, ON-THE-FLY MEETING PREP
US +1 206.623.1986
UK +44 (0)207.190.9809
pitchbook.com
Introducing PitchBook
Mobile. The same
excellent data, technology
and service from the
PitchBook Platform, now
available on a mobile
device.
Search:
“PitchBook”
Available for
One of the more beneficial consequences of the venture capital boom over the
past half-decade has been the encouragement of more localized entrepreneurial
ecosystems. As the venture industry was awash in capital, investors naturally
sought outside of typical geographic realms for investment opportunities, while
limited partners seeking greater exposure to private equity also diversified their
range of commitments to domestic firms. At the same time, angel investing
grew more widespread and innovative with increased incidence of syndicates
and other, similar structures. These factors combined led to ramp-ups in venture
capital activity in fledgling startup hubs such as Denver and Austin, but also
helped promote higher rates of investment in already-substantial metros such as
Chicago.
The upshot of all the above, of course, along with the much-publicized wave of
late-stage round size and valuation inflation, is the massive rise in sums invested
as well as completed venture financings across the U.S. as a whole, and in nearly
every single U.S. region. 2015 may have been the high tide of venture investment,
given what has occurred across both private and public markets since, but it
is instructive to look back and break down the heights of VC trends, assessing
what appears most sustainable and consequently most likely to remain in
place as venture activity cools. Accordingly, in the following report we examine
VC investment across the Great Lakes region as a whole, as well as in Illinois
and the Chicago metro area in particular, seeking to provide context for your
decisionmaking over the coming months.
GARRETT JAMES BLACK
Senior Analyst
4 ILLINOIS VENTURE CAPITAL 2015 IN REVIEW
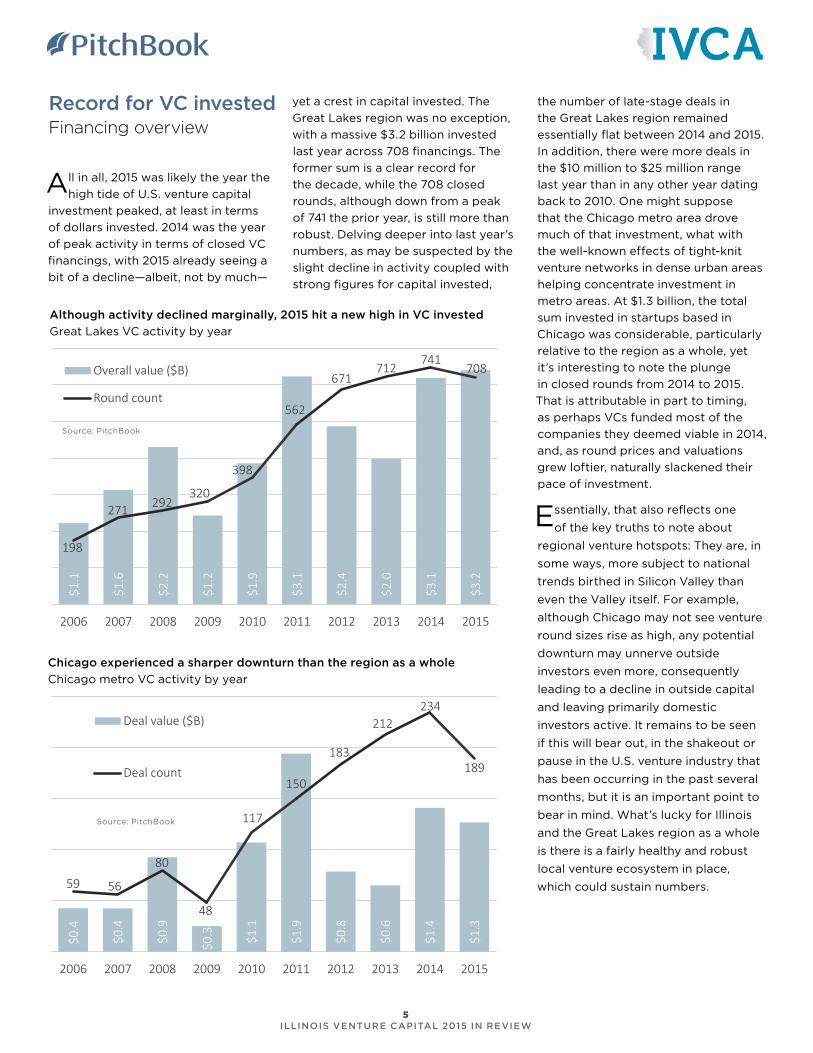
Although activity declined marginally, 2015 hit a new high in VC invested
Great Lakes VC activity by year
Record for VC investedFinancing overview
Source: PitchBook
Source: PitchBook
Chicago experienced a sharper downturn than the region as a whole
Chicago metro VC activity by year
$1.1
$1.6
$2.2
$1.2
$1.9
$3.1
$2.4
$2.0
$3.1
$3.2
198
271 292320
398
562
671712
741708
2006 2007 2008 2009 2010 2011 2012 2013 2014 2015
Overall value ($B)
Round count
$0.4
$0.4
$0.9
$0.3 $1
.1
$1.9
$0.8
$0.6
$1.4
$1.3
59 56
80
48
117
150
183
212234
189
2006 2007 2008 2009 2010 2011 2012 2013 2014 2015
Deal value ($B)
Deal count
All in all, 2015 was likely the year the
high tide of U.S. venture capital
investment peaked, at least in terms
of dollars invested. 2014 was the year
of peak activity in terms of closed VC
financings, with 2015 already seeing a
bit of a decline—albeit, not by much—
yet a crest in capital invested. The
Great Lakes region was no exception,
with a massive $3.2 billion invested
last year across 708 financings. The
former sum is a clear record for
the decade, while the 708 closed
rounds, although down from a peak
of 741 the prior year, is still more than
robust. Delving deeper into last year’s
numbers, as may be suspected by the
slight decline in activity coupled with
strong figures for capital invested,
the number of late-stage deals in
the Great Lakes region remained
essentially flat between 2014 and 2015.
In addition, there were more deals in
the $10 million to $25 million range
last year than in any other year dating
back to 2010. One might suppose
that the Chicago metro area drove
much of that investment, what with
the well-known effects of tight-knit
venture networks in dense urban areas
helping concentrate investment in
metro areas. At $1.3 billion, the total
sum invested in startups based in
Chicago was considerable, particularly
relative to the region as a whole, yet
it’s interesting to note the plunge
in closed rounds from 2014 to 2015.
That is attributable in part to timing,
as perhaps VCs funded most of the
companies they deemed viable in 2014,
and, as round prices and valuations
grew loftier, naturally slackened their
pace of investment.
Essentially, that also reflects one
of the key truths to note about
regional venture hotspots: They are, in
some ways, more subject to national
trends birthed in Silicon Valley than
even the Valley itself. For example,
although Chicago may not see venture
round sizes rise as high, any potential
downturn may unnerve outside
investors even more, consequently
leading to a decline in outside capital
and leaving primarily domestic
investors active. It remains to be seen
if this will bear out, in the shakeout or
pause in the U.S. venture industry that
has been occurring in the past several
months, but it is an important point to
bear in mind. What’s lucky for Illinois
and the Great Lakes region as a whole
is there is a fairly healthy and robust
local venture ecosystem in place,
which could sustain numbers.
5 ILLINOIS VENTURE CAPITAL 2015 IN REVIEW
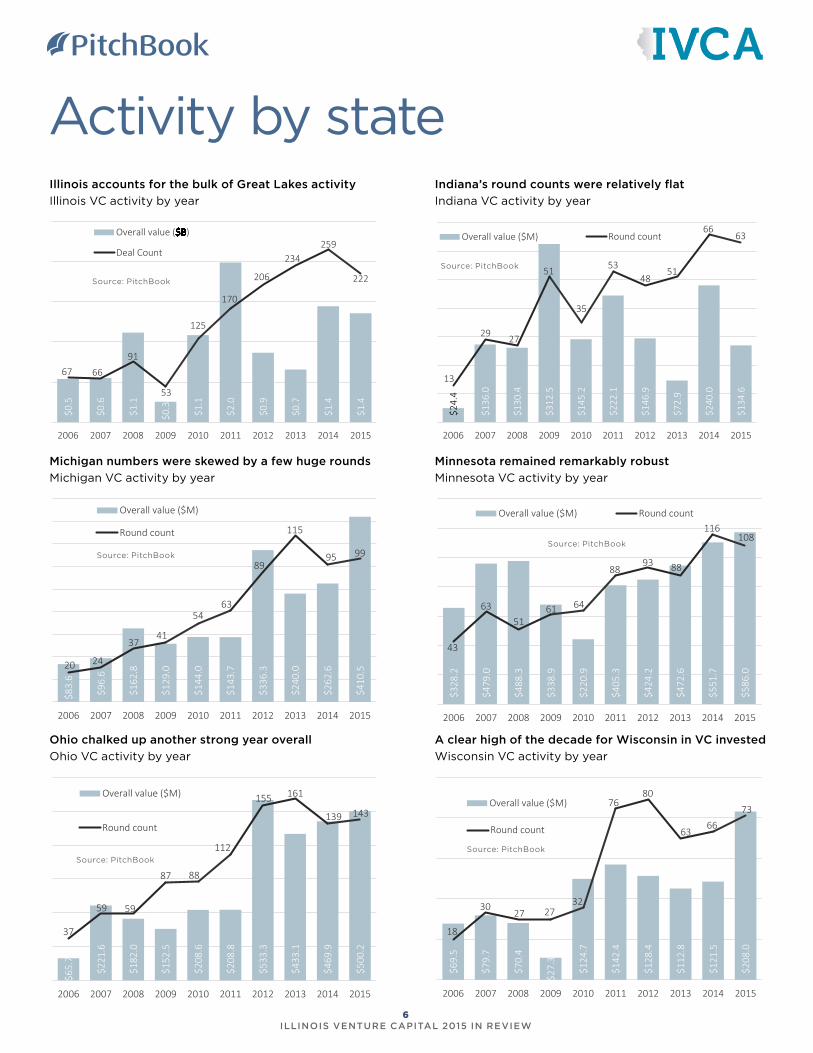
Activity by stateIllinois accounts for the bulk of Great Lakes activity
Illinois VC activity by year
$0.5
$0.6
$1.1
$0.3
$1.1
$2.0
$0.9
$0.7
$1.4
$1.4
67 66
91
53
125
170
206
234259
222
2006 2007 2008 2009 2010 2011 2012 2013 2014 2015
Overall value ($B)
Deal Count
Indiana’s round counts were relatively flat
Indiana VC activity by year
Source: PitchBook
$24.
4
$136
.0
$130
.4
$312
.5
$145
.2
$222
.1
$146
.9
$72.
9
$240
.0
$134
.6
13
29 27
51
35
5348
51
6663
2006 2007 2008 2009 2010 2011 2012 2013 2014 2015
Overall value ($M) Round count
Source: PitchBook
Michigan numbers were skewed by a few huge rounds
Michigan VC activity by year
Minnesota remained remarkably robust
Minnesota VC activity by year
$83.
6
$96.
6
$162
.8
$129
.0
$144
.0
$143
.7
$336
.3
$240
.0
$262
.6
$410
.520 24
3741
5463
89
115
95 99
2006 2007 2008 2009 2010 2011 2012 2013 2014 2015
Overall value ($M)
Round count
$328
.2
$479
.0
$488
.3
$338
.9
$220
.9
$405
.3
$424
.2
$472
.6
$551
.7
$586
.0
43
6351
61 64
8893 88
116108
2006 2007 2008 2009 2010 2011 2012 2013 2014 2015
Overall value ($M) Round count
Ohio chalked up another strong year overall
Ohio VC activity by year
A clear high of the decade for Wisconsin in VC invested
Wisconsin VC activity by year
$65.
7
$221
.6
$182
.0
$152
.5
$208
.6
$208
.8
$533
.3
$433
.1
$469
.9
$500
.2
37
59 59
87 88
112
155 161
139 143
2006 2007 2008 2009 2010 2011 2012 2013 2014 2015
Overall value ($M)
Round count
$69.
5
$79.
7
$70.
4
$27.
3
$124
.7
$142
.4
$128
.4
$112
.8
$121
.5
$208
.0
18
3027 27
32
7680
6366
73
2006 2007 2008 2009 2010 2011 2012 2013 2014 2015
Overall value ($M)
Round count
Source: PitchBook
Source: PitchBook
Source: PitchBookSource: PitchBook
6 ILLINOIS VENTURE CAPITAL 2015 IN REVIEW
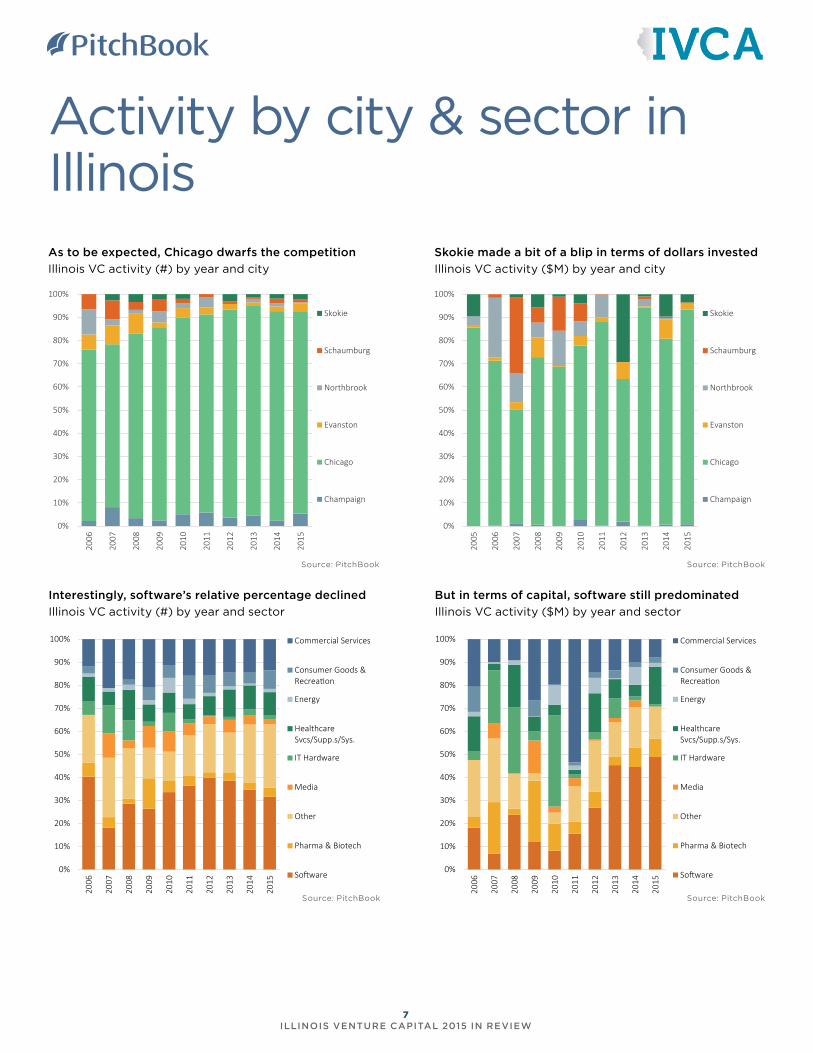
Activity by city & sector in IllinoisAs to be expected, Chicago dwarfs the competition
Illinois VC activity (#) by year and city
0%
10%
20%
30%
40%
50%
60%
70%
80%
90%
100%
2006
2007
2008
2009
2010
2011
2012
2013
2014
2015
Skokie
Schaumburg
Northbrook
Evanston
Chicago
Champaign
Skokie made a bit of a blip in terms of dollars invested
Illinois VC activity ($M) by year and city
0%
10%
20%
30%
40%
50%
60%
70%
80%
90%
100%
2005
2006
2007
2008
2009
2010
2011
2012
2013
2014
2015
Skokie
Schaumburg
Northbrook
Evanston
Chicago
Champaign
Interestingly, software’s relative percentage declined
Illinois VC activity (#) by year and sector
But in terms of capital, software still predominated
Illinois VC activity ($M) by year and sector
0%
10%
20%
30%
40%
50%
60%
70%
80%
90%
100%
2006
2007
2008
2009
2010
2011
2012
2013
2014
2015
Commercial Services
Consumer Goods &Recreation
Energy
HealthcareSvcs/Supp.s/Sys.
IT Hardware
Media
Other
Pharma & Biotech
Software0%
10%
20%
30%
40%
50%
60%
70%
80%
90%
100%
2006
2007
2008
2009
2010
2011
2012
2013
2014
2015
Commercial Services
Consumer Goods &Recreation
Energy
HealthcareSvcs/Supp.s/Sys.
IT Hardware
Media
Other
Pharma & Biotech
Software
Source: PitchBook Source: PitchBook
Source: PitchBook Source: PitchBook
7 ILLINOIS VENTURE CAPITAL 2015 IN REVIEW
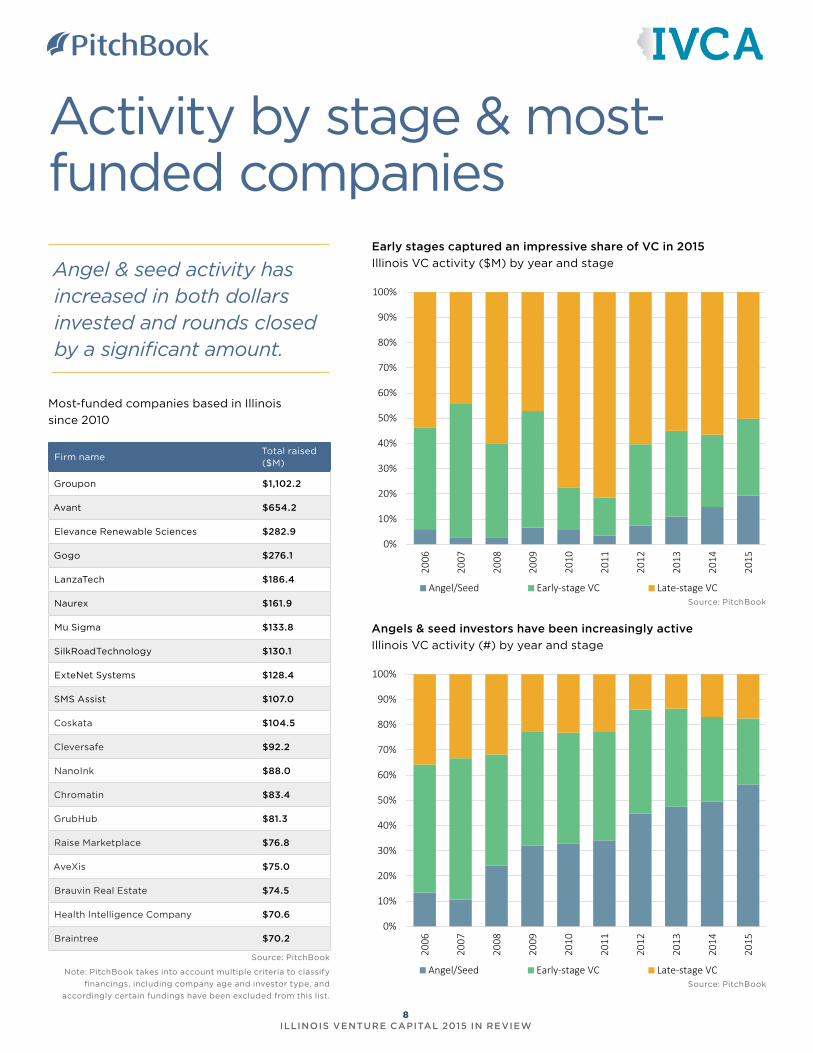
Activity by stage & most-funded companies
Angels & seed investors have been increasingly active
Illinois VC activity (#) by year and stage
Early stages captured an impressive share of VC in 2015
Illinois VC activity ($M) by year and stage
Source: PitchBook
Source: PitchBook
0%
10%
20%
30%
40%
50%
60%
70%
80%
90%
100%
2006
2007
2008
2009
2010
2011
2012
2013
2014
2015
Angel/Seed Early-stage VC Late-stage VC
0%
10%
20%
30%
40%
50%
60%
70%
80%
90%
100%
2006
2007
2008
2009
2010
2011
2012
2013
2014
2015
Angel/Seed Early-stage VC Late-stage VC
Firm nameTotal raised ($M)
Groupon $1,102.2
Avant $654.2
Elevance Renewable Sciences $282.9
Gogo $276.1
LanzaTech $186.4
Naurex $161.9
Mu Sigma $133.8
SilkRoadTechnology $130.1
ExteNet Systems $128.4
SMS Assist $107.0
Coskata $104.5
Cleversafe $92.2
NanoInk $88.0
Chromatin $83.4
GrubHub $81.3
Raise Marketplace $76.8
AveXis $75.0
Brauvin Real Estate $74.5
Health Intelligence Company $70.6
Braintree $70.2
Most-funded companies based in Illinois
since 2010
Source: PitchBook
Angel & seed activity has increased in both dollars invested and rounds closed by a significant amount.
Note: PitchBook takes into account multiple criteria to classify
financings, including company age and investor type, and
accordingly certain fundings have been excluded from this list.
8 ILLINOIS VENTURE CAPITAL 2015 IN REVIEW
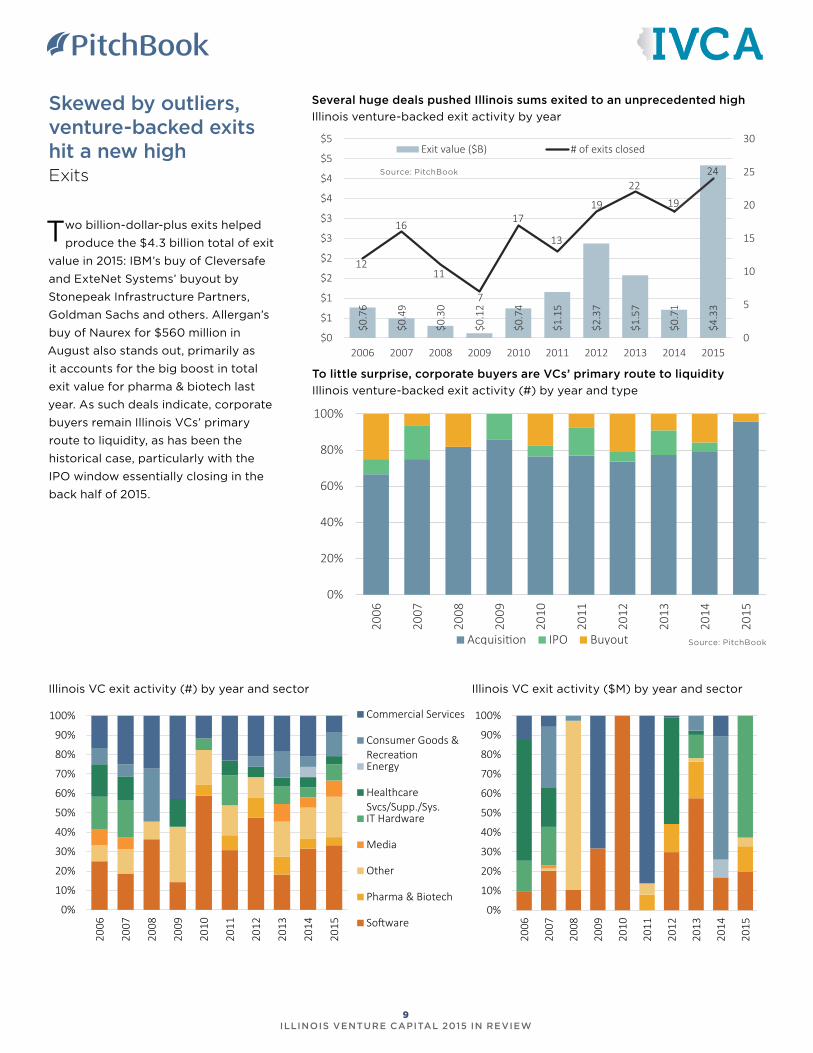
Skewed by outliers, venture-backed exits hit a new highExits
Source: PitchBook
Several huge deals pushed Illinois sums exited to an unprecedented high
Illinois venture-backed exit activity by year
$0.7
6
$0.4
9
$0.3
0
$0.1
2
$0.7
4
$1.1
5
$2.3
7
$1.5
7
$0.7
1
$4.3
3
12
16
11
7
17
13
19
2219
24
0
5
10
15
20
25
30
$0
$1
$1
$2
$2
$3
$3
$4
$4
$5
$5
2006 2007 2008 2009 2010 2011 2012 2013 2014 2015
Exit value ($B) # of exits closed
To little surprise, corporate buyers are VCs’ primary route to liquidity
Illinois venture-backed exit activity (#) by year and type
Source: PitchBook
0%
20%
40%
60%
80%
100%
2006
2007
2008
2009
2010
2011
2012
2013
2014
2015
Acquisition IPO Buyout
Illinois VC exit activity (#) by year and sector Illinois VC exit activity ($M) by year and sector
0%
10%
20%
30%
40%
50%
60%
70%
80%
90%
100%
2006
2007
2008
2009
2010
2011
2012
2013
2014
2015
Commercial Services
Consumer Goods &RecreationEnergy
HealthcareSvcs/Supp./Sys.IT Hardware
Media
Other
Pharma & Biotech
Software0%
10%
20%
30%
40%
50%
60%
70%
80%
90%
100%
2006
2007
2008
2009
2010
2011
2012
2013
2014
2015
Two billion-dollar-plus exits helped
produce the $4.3 billion total of exit
value in 2015: IBM’s buy of Cleversafe
and ExteNet Systems’ buyout by
Stonepeak Infrastructure Partners,
Goldman Sachs and others. Allergan’s
buy of Naurex for $560 million in
August also stands out, primarily as
it accounts for the big boost in total
exit value for pharma & biotech last
year. As such deals indicate, corporate
buyers remain Illinois VCs’ primary
route to liquidity, as has been the
historical case, particularly with the
IPO window essentially closing in the
back half of 2015.
9 ILLINOIS VENTURE CAPITAL 2015 IN REVIEW

League tables
Firm name Deal count
Pritzker Group Venture Capital
14
Hyde Park Angels 13
Serra Ventures 9
Chicago Ventures 8
Hyde Park Venture Partners 7
OCA Ventures 6
KGC Capital 6
Tribal Ventures 5
Dundee Venture Capital 4
Pallasite Ventures 4
Lightbank 4
Advantage Capital Partners 4
2015’s most active VC investors in
Illinois overall
Source: PitchBook
Firm name Deal count
Hyde Park Angels 5
Serra Ventures 4
New Media Ventures 2
G2T3V 2
KGC Capital 2
NewGen Venture Partners 2
Hyde Park Venture Partners 2
Marcin Kleczynski 2
Tribal Ventures 2
Kapor Capital 2
2015’s most active VC investors in
Illinois at seed/angel
Source: PitchBook
Firm name Deal count
Pritzker Group Venture Capital
6
OCA Ventures 3
Chicago Ventures 3
Hyde Park Angels 3
MATH Venture Partners 2
Amicus Capital 2
Great Oaks Venture Capital 2
Jumpstart Ventures 2
KGC Capital 2
Hyde Park Venture Partners 2
2015’s most active VC investors in
Illinois at Series A
Source: PitchBook
Firm name Deal count
Pritzker Group Venture Capital
3
Chicago Ventures 3
Serra Ventures 2
Draper Associates 2
Greycroft Partners 2
2015’s most active VC investors in
Illinois at Series B
Source: PitchBook
Firm name Deal count
Gates Ventures 5
Advantage Capital Partners 3
Pritzker Organization 3
Bessemer Venture Partners 3
Merrick Ventures 3
2015’s most active VC investors in
Illinois at Series C
Source: PitchBook
Firm name Deal count
Hyde Park Venture Partners 2
RA Capital Management 1
WhiteRock Capital Partners 1
August Capital 1
Balyasny Asset Management 1
Plymouth Ventures 1
Beringea 1
Rock Springs Capital 1
Deerfield Management 1
Tiger Global Management 1
DFJ Growth 1
Foresite Capital Management 1
QVT Financial 1
General Atlantic 1
Roche Venture Fund 1
Hyde Park Angels 1
RRE Ventures 1
RTW Investments 1
T. Rowe Price 1
Tavistock Group 1
J.P. Morgan 1
Venrock 1
Janus Capital Group 1
Adage Capital Management 1
JDH Investment Management 1
2015’s most active VC investors in
Illinois at Series D or later
Source: PitchBook
Note: For better clarity, these league tables only rank
institutional investors’ activity, so angel investors’
tallies are excluded.
10 ILLINOIS VENTURE CAPITAL 2015 IN REVIEW

Contact PitchBook
pitchbook.com
RESEARCH [email protected]
EDITORIAL [email protected]
SALES [email protected]