Embed Size (px)
Citation preview

Illicit Financial Flows to and from Developing Countries: 2005-2014
Global Financial IntegrityApril 2017

Illicit Financial Flows to and from Developing Countries: 2005-2014
Global Financial Integrity
April 2017
Global Financial Integrity wishes to thank the Government of Finland for supporting this project.
Copyright ©2017 by Global Financial Integrity®. Some rights reserved.
The report is published under a Creative Commons Attribution License (CC BY).
For more information on this license, visit: http://creativecommons.org.
Global Financial Integrity® and the Global Financial Integrity Logo are
registered trademarks of Global Financial Integrity.


iiiIllicit Financial Flows to and from Developing Countries: 2005-2014
We are pleased to present here our analysis of Illicit Financial Flows to and from Developing
Countries: 2005-2014. This is the seventh report in this series that we have provided since 2008.
These analyses have contributed to securing the illicit flows issue on the global development
agenda in the Financing for Development document, the Addis Tax Initiative, and the Sustainable
Development Goals.
While we have recognized illicit inflows in earlier reports, here we give this side of the equation
equal emphasis. Illicit inflows frequently occur when imports are under-invoiced for the purpose
of evading customs duties and VAT taxes. The magnitude of estimated illicit inflows in the latest
year (2014) ranges from $1.4 to $2.5 trillion. This large range reflects the fact that more precise
calculations are difficult to make using available data.
Years of experience with businesses and governments in the developing world have taught us
that the decision to bring illicit flows into a particular developing country often marks only the first
phase of a strategy to subsequently move funds out of the country. Additionally, such factors as
the misinvoicing of services and intangibles, same-invoice faking, and cash movements related
to many criminal activities tend to affect outflows from developing countries more than inflows
to those countries. If so, we might surmise that the omission of such factors from even the best
available data (used by GFI and other researchers) might mean that our figures on outflows are
underestimated to a larger degree than our inflows are overestimated. In other words, the excess of
estimated inflows over outflows might be exacerbated by limitations of the merchandise trade data
used here and in related research. Much work remains to be done in coming to grips with estimates
of both outflows and inflows.
In producing this year’s outflows data, we are again, as in earlier reports, employing a methodology
that leads to conservative estimates. Our traditional approach affords an outflows estimate of
$970 billion in 2014, consistent with rising figures in recent years. In addition, we have taken a
second approach, attempting to handle trade between developing countries more conservatively.
This approach produces an estimate of $620 billion for that year.
The combination of illicit outflows and inflows, arising from both balance of payments data and
direction of trade statistics, leads to an estimate of IFFs at 14 to 24 percent of total developing
country merchandise trade. This is a staggering figure, underlining the enormous harm done to
developing countries by illicit financial flows, however they are generated. The order of magnitude
of these estimates, much more so than their exactitude, warrants serious attention in both the

iv Global Financial Integrity
developing countries and in the wealthier world. Maximizing domestic resources and achieving
sustainable development goals is dependent upon substantially curtailing illicit financial flows.
GFI thanks Matt Salomon and Joe Spanjers for the very thoughtful analysis and presentation
embodied here. The continuing influence of Chief Economist Emeritus Dev Kar is gratefully
acknowledged.
We welcome opportunities to engage with governments, institutions, and scholars addressing illicit
financial flows and their impact on domestic resource mobilization, all undertaken for the benefit of
billions of people in emerging market and developing countries.
Raymond Baker
President
Global Financial Integrity
April 2017

vIllicit Financial Flows to and from Developing Countries: 2005-2014
Table of Contents
Executive Summary . . . . . . . . . . . . . . . . . . . . . . . . . . . . . . . . . . . . . . . . . . . . . . . . . . . . . . . . . . . . . . vii
I. Overview of the IFF Estimates for 2005-2014 . . . . . . . . . . . . . . . . . . . . . . . . . . . . . . . . . . . . . . 1
II. Estimates of Illicit Financial Outflows and Inflows . . . . . . . . . . . . . . . . . . . . . . . . . . . . . . . . . . . 5
A. Estimates of Outflows. . . . . . . . . . . . . . . . . . . . . . . . . . . . . . . . . . . . . . . . . . . . . . . . . . . . . 5
B. Estimates of Illicit Financial Inflows to Developing Countries . . . . . . . . . . . . . . . . . . . . . . 8
III. A Guide to Interpreting the Misinvoicing Estimates . . . . . . . . . . . . . . . . . . . . . . . . . . . . . . . . . 13
A. Overview of the Strengths and Limitations of the Trade Misinvoicing Estimates . . . . . . 14
B. Sensitivity of the Estimates to the Adjustment of CIF Basis Imports to FOB Basis. . . . . 17
IV. Policy Recommendations. . . . . . . . . . . . . . . . . . . . . . . . . . . . . . . . . . . . . . . . . . . . . . . . . . . . . 21
A. Overview . . . . . . . . . . . . . . . . . . . . . . . . . . . . . . . . . . . . . . . . . . . . . . . . . . . . . . . . . . . . . . 21
B. Anti-Money Laundering . . . . . . . . . . . . . . . . . . . . . . . . . . . . . . . . . . . . . . . . . . . . . . . . . . 21
C. Beneficial Ownership of Legal Entities . . . . . . . . . . . . . . . . . . . . . . . . . . . . . . . . . . . . . . . 21
D. Automatic Exchange of Financial Information . . . . . . . . . . . . . . . . . . . . . . . . . . . . . . . . . 22
E. Country-by-Country Reporting . . . . . . . . . . . . . . . . . . . . . . . . . . . . . . . . . . . . . . . . . . . . 22
F. Curtailing Trade Misinvoicing . . . . . . . . . . . . . . . . . . . . . . . . . . . . . . . . . . . . . . . . . . . . . . 23
G. Addis Tax Initiative . . . . . . . . . . . . . . . . . . . . . . . . . . . . . . . . . . . . . . . . . . . . . . . . . . . . . . 23
VI. Conclusions . . . . . . . . . . . . . . . . . . . . . . . . . . . . . . . . . . . . . . . . . . . . . . . . . . . . . . . . . . . . . . . . . 25
Appendix I. Tables . . . . . . . . . . . . . . . . . . . . . . . . . . . . . . . . . . . . . . . . . . . . . . . . . . . . . . . . . . . . . . . 27
Appendix II: Methods. . . . . . . . . . . . . . . . . . . . . . . . . . . . . . . . . . . . . . . . . . . . . . . . . . . . . . . . . . . . . 41
Glossary . . . . . . . . . . . . . . . . . . . . . . . . . . . . . . . . . . . . . . . . . . . . . . . . . . . . . . . . . . . . . . . . . . . . . . . 47
References . . . . . . . . . . . . . . . . . . . . . . . . . . . . . . . . . . . . . . . . . . . . . . . . . . . . . . . . . . . . . . . . . . . . . 49
About . . . . . . . . . . . . . . . . . . . . . . . . . . . . . . . . . . . . . . . . . . . . . . . . . . . . . . . . . . . . . . . . . . . . . . . . . 51

vi Global Financial Integrity
Tables and FiguresTable X-1. Estimated Illicit Financial Flows, All Developing Countries, 2005-2014. . . . . . . . . . . . . . . .viii
Table X-2. Estimated Composition of Illicit Financial Flows, All Developing Countries, 2005-2014. . .viii
Figure X-1. Estimates of Illicit Financial Outflows, 2005-2014 (Million of US dollars). . . . . . . . . . . . . . . . x
Figure I-1. Estimates of Illicit Financial Flows . . . . . . . . . . . . . . . . . . . . . . . . . . . . . . . . . . . . . . . . . . . . .3
Table II-1. Estimated Illicit Financial Outflows, All Developing Countries, 2005-2014 . . . . . . . . . . . . . .6
Figure II-1. Estimates of Illicit Financial Outflows, Selected Regions, 2005-2014. . . . . . . . . . . . . . . . . .7
Figure II-2. Estimates of Illicit Financial Outflows from Developing Countries, 2005-2014. . . . . . . . . . .8
Table II-2. Estimated Illicit Financial Inflows, All Developing Countries, 2005-2014. . . . . . . . . . . . . . . .9
Figure II-3. Estimates of Illicit Financial Inflows, Selected Regions, 2005-2014 . . . . . . . . . . . . . . . . . . 10
Figure II-4. Estimates of Illicit Financial Inflows to Developing Countries, 2005-2014 . . . . . . . . . . . . . 11
Figure III-1. Estimates of Trade Misinvoicing Flows Under Alternative Assumptions Regarding
the CIF/FOB Markup Rate . . . . . . . . . . . . . . . . . . . . . . . . . . . . . . . . . . . . . . . . . . . . . . . . . . . . . . 18
Appendix Table I-1. Geographical Regions . . . . . . . . . . . . . . . . . . . . . . . . . . . . . . . . . . . . . . . . . . . . . . 27
Appendix Table I-2. Estimated Ranges for Illicit Financial Flows, 2014. . . . . . . . . . . . . . . . . . . . . . . . . 28
Appendix Table I-3. Estimated Ranges for Illicit Financial Flows, 2005-2014. . . . . . . . . . . . . . . . . . . .32
Appendix Table I-4. Estimated Ranges for the Components of Trade Misinvoicing, 2005-2014 . . . . .36
Appendix Table II-1. . . . . . . . . . . . . . . . . . . . . . . . . . . . . . . . . . . . . . . . . . . . . . . . . . . . . . . . . . . . . . . . . 42

viiIllicit Financial Flows to and from Developing Countries: 2005-2014
Executive Summary
This report, the latest in a series of annual reports by Global Financial Integrity (GFI), provides
estimates of the illicit flow of money out of the developing world—hereafter referred to as illicit
financial flows (IFFs) or illicit outflows—from 2005 to 2014, the most recent ten years for which
data are available. In addition to the estimated outflows GFI has presented in the past, this report
highlights estimated illicit inflows to developing countries. It has become increasingly evident that
both types of illicit flows represent a challenge to economic and social progress in the developing
world. While GFI has regularly estimated both outflows and inflows in the past, it reports on both
measures on equal footing here. Additionally, GFI now reports ranges for its estimates: lower
estimates that conservatively accounts for trade between developing countries only and higher
estimates, also conservative, that adds into the account some portion of illicit flows between
developing countries.
Consistent with its reports, GFI finds that IFFs remain persistently high. The study finds
that over the period between 2005 and 2014, IFFs likely accounted for between about
14.1 percent and 24.0 percent of total developing country trade, on average, with outflows
estimated at 4.6 percent to 7.2 percent of total trade and inflows between 9.5 percent to
16.8 percent (see Table X-1). Total IFFs likely grew at an average rate of between 8.5 percent and
10.1 percent a year over the ten-year period. Outflows are estimated to have grown at an average
annual rate between 7.2 percent and 8.1 percent and inflows at a slightly faster pace, between
9.2 and 11.4 percent per year. Those growth rates translate to an estimated range for total IFFs of
$2 trillion to $3.5 trillion in 2014; outflows are estimated to have ranged between $620 billion and
$970 billion in that year, while inflows ranged between $1.4 trillion and $2.5 trillion (in 2014).
GFI’s measures of illicit financial flows stem from two sources: (1) deliberate misinvoicing in
merchandise trade (the source of GFI’s low and high estimates), and (2) leakages in the balance
of payments (also known as “hot money flows”). Of those two sources, trade misinvoicing is the
primary measurable means for shifting funds in and out of developing countries illicitly.
Even using the lower of GFI’s two estimates for trade misinvoicing, GFI finds that an average of
87 percent of illicit financial outflows were due to the fraudulent misinvoicing of trade
(see Table X-2).
viii Global Financial Integrity
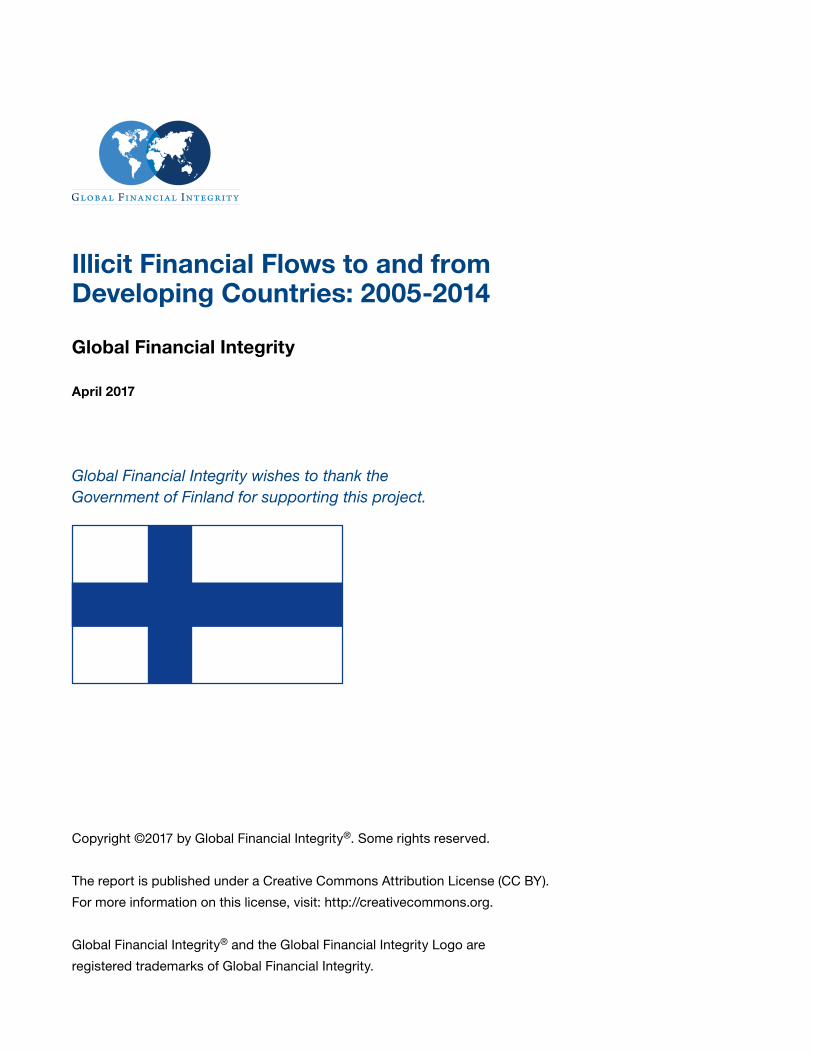
Table X-1. Estimated Illicit Financial Flows, All Developing Countries, 2005-2014 (Percent of total developing country trade except where noted)
2005 2006 2007 2008 2009 2010 2011 2012 2013 2014
Average, 2005- 2014
2014
Billions of US
dollars
Average annual percent change since
2005
A. Total (outflows plus inflows)
Low estimate 15.7 15.1 14.4 14.3 15.3 14.6 13.0 13.3 13.9 13.8 14.1 2,010 8.5
High estimate 23.5 24.0 23.7 23.4 25.7 24.8 23.8 23.3 24.5 24.0 24.0 3,507 10.4
Midpoint 19.6 19.6 19.0 18.9 20.5 19.7 18.4 18.3 19.2 18.9 19.1 2,759 9.7
B. Outflows
Low estimate 5.4 4.9 4.8 4.8 5.8 5.1 3.9 4.3 4.2 4.2 4.6 620 7.2
High estimate 7.8 7.4 7.5 7.5 8.9 7.6 6.6 6.7 6.7 6.6 7.2 970 8.1
Midpoint 6.6 6.1 6.1 6.1 7.4 6.4 5.3 5.5 5.4 5.4 5.9 795 7.7
C. Inflows
Low estimate 10.3 10.3 9.6 9.5 9.5 9.5 9.2 9.0 9.7 9.5 9.5 1,391 9.2
High estimate 15.6 16.6 16.2 15.9 16.8 17.2 17.2 16.6 17.8 17.4 16.8 2,537 11.4
Midpoint 12.9 13.4 12.9 12.7 13.1 13.3 13.2 12.8 13.7 13.4 13.2 1,964 10.6
Source: GFI staff estimates using data from the International Monetary Fund.Note: Estimates of total trade were calculated as an average of the magnitude reported by each developing country and the magnitude reported by that
country’s trade partners. Total trade is defined as the total exports plus imports for developing countries as provided by the compilers of the IMF’s Direction of Trade Statistics. The low estimates are based on bilateral trade data between developing countries and advanced countries only (details are provided in Appendix II). The high estimates scale up the low estimates country by couintry to account for misinvoicing between developing countries. The midpoint is the simple average of the low and high estimates.
Table X-2. Estimated Composition of Illicit Financial Flows, All Developing Countries, 2005-2014 (Percent of total developing country trade except where noted)
2005 2006 2007 2008 2009 2010 2011 2012 2013 2014
Average, 2005-2014
2014
Billions of US
dollars
Component as percent
of total
A. Total (outflows plus inflows)
Total 15.7 15.1 14.4 14.3 15.3 14.6 13.0 13.3 13.9 13.8 14.1 2,010 100
Trade misinvoicing (low estimate) 13.8 13.7 13.1 12.3 13.0 12.4 12.0 11.6 12.3 12.0 12.4 1,756 87
Unrecorded BOP flows 1.9 1.5 1.3 1.9 2.3 2.2 1.1 1.7 1.6 1.7 1.7 254 13
B. Outflows
Total 5.4 4.9 4.8 4.8 5.8 5.1 3.9 4.3 4.2 4.2 4.6 620 100
Trade misinvoicing (low estimate) 4.4 4.1 3.8 3.5 3.8 3.3 3.0 2.8 2.9 2.8 3.3 406 66
Unrecorded BOP flows 1.0 0.8 0.9 1.2 2.0 1.8 0.9 1.4 1.3 1.5 1.3 213 34
C. Inflows
Total 10.3 10.3 9.6 9.5 9.5 9.5 9.2 9.0 9.7 9.5 9.5 1,391 100
Trade misinvoicing (low estimate) 9.4 9.6 9.3 8.8 9.2 9.1 9.0 8.8 9.4 9.2 9.2 1,350 97
Unrecorded BOP flows 0.8 0.6 0.4 0.7 0.3 0.3 0.2 0.2 0.2 0.3 0.4 41 3
Source: GFI staff estimates using data from the International Monetary Fund.Note: Estimates of total trade were calculated as an average of the magnitude reported by each developing country and the magnitude reported by that
country’s trade partners. Total trade is defined as the total exports plus imports for developing countries as provided by the compilers of the IMF’s Direction of Trade Statistics. The trade misinvoicing flows reported here are the low estimates, based on bilateral trade data between developing countries and advanced countries only (details are provided in Appendix II).

ixIllicit Financial Flows to and from Developing Countries: 2005-2014
To enhance the accuracy of the estimates, GFI has made some changes to its procedures apart
from the inclusion of illicit inflows. Those include some changes in the way GFI implements the
matched-trade methods it continues to use to estimate misinvoicing, changes which are intended to
improve the accuracy of the estimates reported here. The basic data used to estimate misinvoicing
is regularly revised by the International Monetary Fund (IMF). The list of countries for which reliable
data are available has also changed somewhat to reflect both improved reporting by developing
countries to the IMF and to incorporate judgments by GFI’s analysts as to the reliability of data
from selected individual countries. Additionally, this report uses supplementary bilateral data now
published by Switzerland that permits a clearer identification of bilateral gold flows to and from that
country than was possible in previous years. (Details on all these changes as well as their effects on
the estimates are provided in Appendix II.)
Finally, in the interests of both transparency and continuity with GFI’s reporting practices in
previous years, the report presents a range of estimates of trade misinvoicing. Estimates at the
lower end of each reported range reflect estimated trade gaps between developing countries and
their advanced-country trade partners. Consistent with GFI’s reporting in earlier years, the higher
estimates are calculated by scaling up the low estimate for each developing county to account for
misinvoicing between that country and other developing countries, assuming that each country’s
propensity for misinvoicing with its developing country partners is the same as for its trade with
advanced countries (likely a conservative assumption). At the individual country level, these higher,
scaled-up estimates may be interpreted as an accurate estimate of that country’s misinvoicing
propensity in all of its trade. However, because these scaled-up estimates include trade gaps
between developing countries, adding the misinvoicing estimates for any two developing countries
may lead to overcounting in the total, with the likelihood of overcounting rising as the number of
countries being aggregated increases. By the same token, the lower estimate deliberately excludes
misinvoicing in trade between developing countries and, therefore, is likely to underestimate trade
misinvoicing at the individual country level.
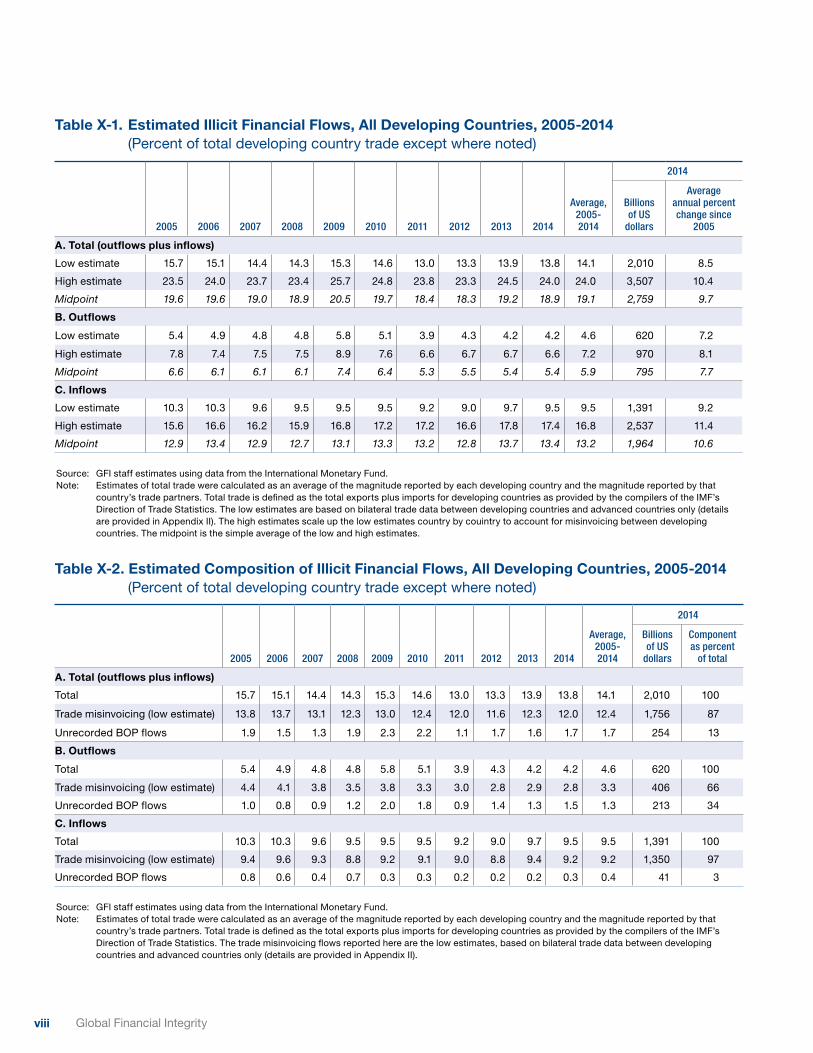
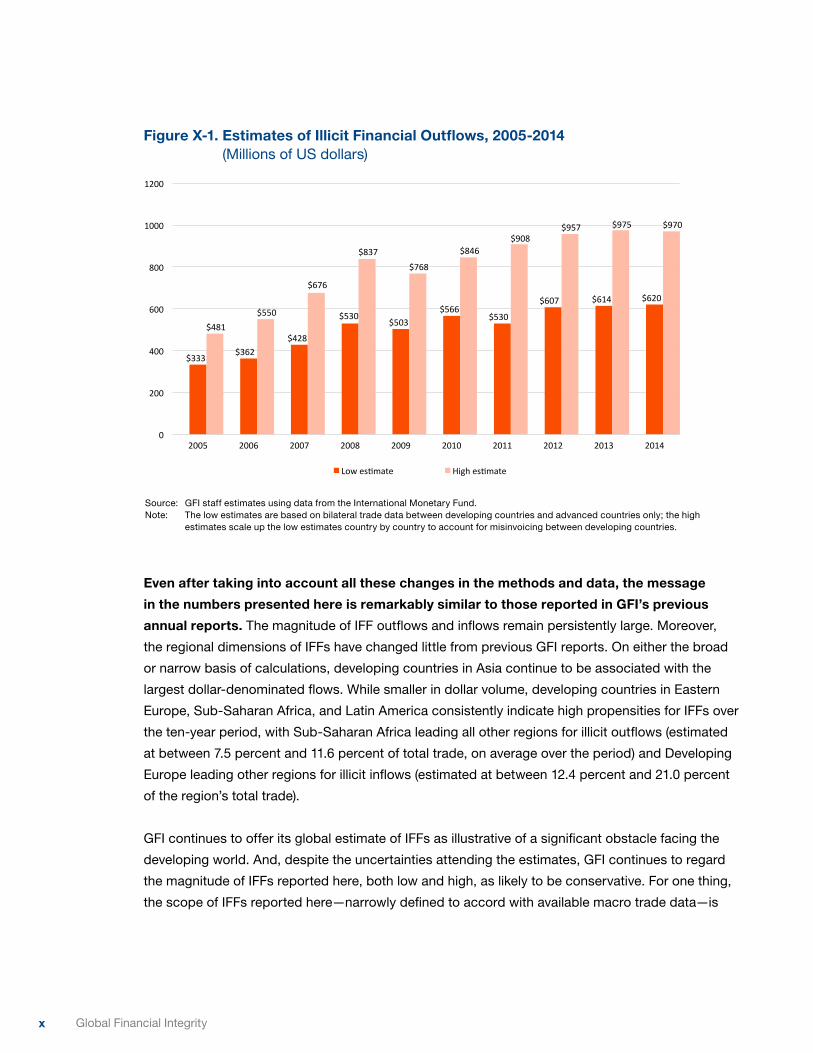
To facilitate comparison of GFI’s current estimates with those it reported in previous years, the
dollar volumes of estimated outflows are depicted in Figure X-1. In 2014, for example, the estimated
dollar magnitude of illicit financial outflows ranges from $620 billion to $970 billion. In the past,
GFI has reported only the higher of the two estimates. The current high-end estimate of $975 billion
of outflows in 2013 is comparable to the $1,090 billion reported for that year by GFI in 2015. The
difference between the two is largely attributable to data revisions by the IMF as well as several
methodological changes discussed more fully in Appendix II.
x Global Financial Integrity
Figure X-1. Estimates of Illicit Financial Outflows, 2005-2014 (Millions of US dollars)
$333$362
$428
$530$503
$566$530
$607 $614 $620
$481$550
$676
$837$768
$846$908
$957 $975 $970
0
200
400
600
800
1000
1200
2005 2006 2007 2008 2009 2010 2011 2012 2013 2014
Lowes2mate Highes2mate
Source: GFI staff estimates using data from the International Monetary Fund.Note: The low estimates are based on bilateral trade data between developing countries and advanced countries only; the high
estimates scale up the low estimates country by country to account for misinvoicing between developing countries.
Even after taking into account all these changes in the methods and data, the message
in the numbers presented here is remarkably similar to those reported in GFI’s previous
annual reports. The magnitude of IFF outflows and inflows remain persistently large. Moreover,
the regional dimensions of IFFs have changed little from previous GFI reports. On either the broad
or narrow basis of calculations, developing countries in Asia continue to be associated with the
largest dollar-denominated flows. While smaller in dollar volume, developing countries in Eastern
Europe, Sub-Saharan Africa, and Latin America consistently indicate high propensities for IFFs over
the ten-year period, with Sub-Saharan Africa leading all other regions for illicit outflows (estimated
at between 7.5 percent and 11.6 percent of total trade, on average over the period) and Developing
Europe leading other regions for illicit inflows (estimated at between 12.4 percent and 21.0 percent
of the region’s total trade).
GFI continues to offer its global estimate of IFFs as illustrative of a significant obstacle facing the
developing world. And, despite the uncertainties attending the estimates, GFI continues to regard
the magnitude of IFFs reported here, both low and high, as likely to be conservative. For one thing,
the scope of IFFs reported here—narrowly defined to accord with available macro trade data—is
xiIllicit Financial Flows to and from Developing Countries: 2005-2014
only a small part (but the most readily measurable part) of all illicit flows between states. Moreover,
the data available for estimating bilateral trade discrepancies are restricted to merchandise trade
alone, excluding trade in services and intangibles, surely a more attractive channel for trade
misinvoicing than trade in goods. Finally, collusive behavior by related parties on both sides of a
particular trade (e.g., same-invoice faking) would not likely show up as misinvoicing in the available
data. The lack of data that would shed light on services trade and same-invoice faking underscore
GFI’s view that its estimates of IFFs are conservative.1
In 2015, IFFs became part of development orthodoxy in the UN’s Sustainable Development Goals
and at the Financing for Development Conference in Addis Ababa in 2015. World leaders still have
much to do to curb the opacity in the global financial system that facilitates these outflows. GFI
recommends a number of steps that governments and other international regulators can take to
develop greater financial transparency and curtail illicit outflows, including:
Beneficial Ownership• Governments should establish public registries of verified beneficial ownership
information on all legal entities, and all banks should know the true beneficial owner(s) of
any account in their financial institution.
Anti-Money Laundering• Government authorities should adopt and fully implement all of the Financial Action Task
Force’s (FATF) anti-money laundering recommendations; laws already in place should be
strongly enforced.
Country-by-Country Reporting• Policymakers should require multinational companies to publicly disclose their revenues,
profits, losses, sales, taxes paid, subsidiaries, and staff levels on a country-by-country
basis.
Tax Information Exchange• All countries should actively participate in the worldwide movement towards the
automatic exchange of tax information as endorsed by the OECD and the G20.
1 Another important factor supports GFI’s interpretations of its estimates of IFFs as understated. To ensure the widest possible scope for its global estimates of illicit outflows, GFI uses country-level bilateral trade flows as reported in the IMF’s DOTS database. These data are highly aggregated, a fact that introduces imprecision to the calculations. While the alternative of using a data set with more refined commodity detail on bilateral trade flows between countries (such as the UN’s Comtrade database) might allow for more precise estimates for some (though not all) countries, the corresponding estimates of misinvoicing using finer commodity detail would also necessarily raise the overall estimate for trade-based misinvoicing.
xii Global Financial Integrity
Trade Misinvoicing• Customs agencies should treat trade transactions involving a tax haven with the highest
level of scrutiny.
• Governments should significantly boost their customs enforcement by equipping and
training officers to better detect intentional misinvoicing of trade transactions, particularly
through access to real-time world market pricing information at a detailed commodity
level.
• GFI has developed a product to assist governments in the detection of potential
misinvoicing in real time: GFTrade™ is a proprietary risk assessment application
developed to enable customs officials to determine if goods are priced outside typical
ranges for comparable products.2
Sustainable Development• Governments should sign on to the Addis Tax Initiative to further support efforts to curb
IFFs as a key component of the development agenda.
The massive flows of illicit capital shown in this study represent diversions of resources from their
most efficient social uses in developing economies and are likely to adversely impact domestic
resource mobilization and hamper sustainable economic growth. For example, some portion
of the illicit flows highlighted here may correspond to tax revenues lost by developing country
governments which would then be unavailable for use by those governments toward reducing
inequality, eliminating poverty, and, more generally, raising the quality of life for people living in
those countries. Whatever the source of the illicit flows, it is necessary to consider their role in any
discussion of the development equation. It is important to consider not only the volume of resources
legally flowing into and out of developing countries but also the illicit flows associated with leakages
of capital from the balance of payments and trade misinvoicing. Governments and international
organizations must strengthen policy and increase cooperation to combat this scourge.
2 Additional information on GFTrade™ is available on GFI’s website; see http://www.gfintegrity.org/gftrade/

1Illicit Financial Flows to and from Developing Countries: 2005-2014
I. Overview of the IFF Estimates for 2005-2014
The corrosive impact illicit financial flows (IFFs) can have on economic progress and poverty
alleviation efforts became part of development orthodoxy in 2015. In July of that year, the Addis
Ababa Action Agenda of the Third International Conference on Financing for Development was
adopted, committing all nations to “redouble efforts to substantially reduce illicit financial flows
by 2030, with a view to eventually eliminating them.”3 Furthermore, noting the report of the High
Level Panel on Illicit Financial Flows from Africa,4 the Addis Action Agenda invites “appropriate
international institutions and regional organizations to publish estimates of the volume and
composition of illicit financial flows.”5 As has been true in the past, Global Financial Integrity’s
Illicit Financial Flows from Developing Countries: 2005-2014 is just that: an estimate of the volume
and composition of illicit financial flows at the country level and disaggregated by type.
The United Nations adopted the Sustainable Development Goals (SDGs) in September 2015, which
include, in Goal 16.4, a target that countries will “by 2030, significantly reduce illicit financial and
arms flows, strengthen the recovery and return of stolen assets and combat all forms of organized
crime.”6 This statement, coupled with that seen in the Addis Action Agenda, underscores the
international community’s recognition of the severity of the illicit flows challenge and its embrace of
efforts to tackle illicit flows in order to promote development and vigorous societies.
IFFs are illegal movements of money or capital from one country to another. Institutions such as the
World Bank have used similar descriptions of IFFs in their publications. Broadly, GFI defines such
flows as illicit if the funds crossing borders are illegally earned, transferred, and/or utilized.7 If the
flow breaks a law at any point, it is illicit.
In constructing its global estimate of IFFs, GFI focuses on only those flows that may be inferred
from available global data: leakages from the IMF’s balance of payment accounts (BOP) and
misinvoicing in merchandise trade estimated from the IMF’s Direction of Trade Statistics (DOTS).
Of those two sources of IFFs, the dominant channel for IFFs moving in and out of the developing
world is trade misinvoicing—according to this report, trade misinvoicing accounted for at least
66 percent of measurable IFF outflows and 97 percent of measurable inflows in 2014.
3 “Resolution Adopted by the General Assembly on 27 July 2015: Addis Ababa Action Agenda of the Third International Conference on Financing for Development (Addis Ababa Action Agenda),” United Nations General Assembly Resolution (New York, NY: United Nations, August 17, 2015), 8, http://www.un.org/ga/search/view_doc.asp?symbol=A/RES/69/313.
4 “Report of the High Level Panel on Illicit Financial Flows from Africa” (UNECA, February 26, 2015), http://www.uneca.org/sites/default/files/publications/iff_main_report_english.pdf.
5 “Addis Ababa Action Agenda,” 8.6 “Goal 16: Promote Just, Peaceful and Inclusive Societies,” United Nations Sustainable Development Goals, 16, accessed November 1,
2015, http://www.un.org/sustainabledevelopment/peace-justice/.7 “Issues: Illicit Financial Flows,” Global Financial Integrity, November 2, 2015, http://www.gfintegrity.org/issue/illicit-financial-flows/.

2 Global Financial Integrity
The misinvoicing of trade is accomplished by misstating the value or volume of an export or import
on a customs invoice. Trade misinvoicing is a form of trade-based money laundering made possible
by the fact that trading partners write their own trade documents, or arrange to have the documents
prepared in a third country (typically a tax haven)—a method known as re-invoicing. Fraudulent
manipulation of the price, quantity, or quality of a good or service on an invoice allows criminals,
corrupt government officials, and commercial tax evaders to shift vast amounts of money across
international borders quickly, easily, and nearly always undetected.
By their nature, IFFs are typically intended to be hidden and unobservable. Accordingly,
measurements of illicit flows can only be made indirectly using related data. Such measurements
are necessarily imprecise. Additionally, there are many forms of illicit flows that cannot be picked up
using available economic data and methods. For example, cash transactions, same-invoice faking,
misinvoicing in services and intangibles, and hawala transactions are simply not registered directly
in available economic data.
For those reasons, GFI characterizes the estimates presented here as likely to be conservative.
Even so, they provide one measure of the largely unobservable IFFs problem. Moreover, GFI
believes that the numerical significance and persistence of its estimates amply demonstrate the
severity of the IFFs problem.
The estimated volume of illicit flows is staggering, ranging between $2 trillion and $3.5 trillion in
2014. Estimated illicit outflows from developing countries to the advanced world alone sum up
to $620 billion in 2014 in the most conservative calculation and illicit inflows from the advanced
countries into the developing world totaled more than $2.5 trillion.
In dollar terms, total IFFs are estimated to have grown at an average annual rate between
8.5 percent and 10.4 percent a year over the 2005-2014 period, with outflows estimated to have
risen between 7.2 percent and 8.1 percent a year and inflows at an even higher pace, between
9.2 percent and 11.4 percent annually. By comparison, inflation in advanced countries averaged
only 1.4 percent a year over that ten-year period.8
8 Inflation is here measured as the average annual change over the ten-year period in the price deflator for gross domestic product (GDP) for advanced countries as reported by International Monetary Fund in its October 2016, World Economic Outlook Database (https://www.imf.org/external/pubs/ft/weo/2016/02/weodata/index.aspx).
3Illicit Financial Flows to and from Developing Countries: 2005-2014
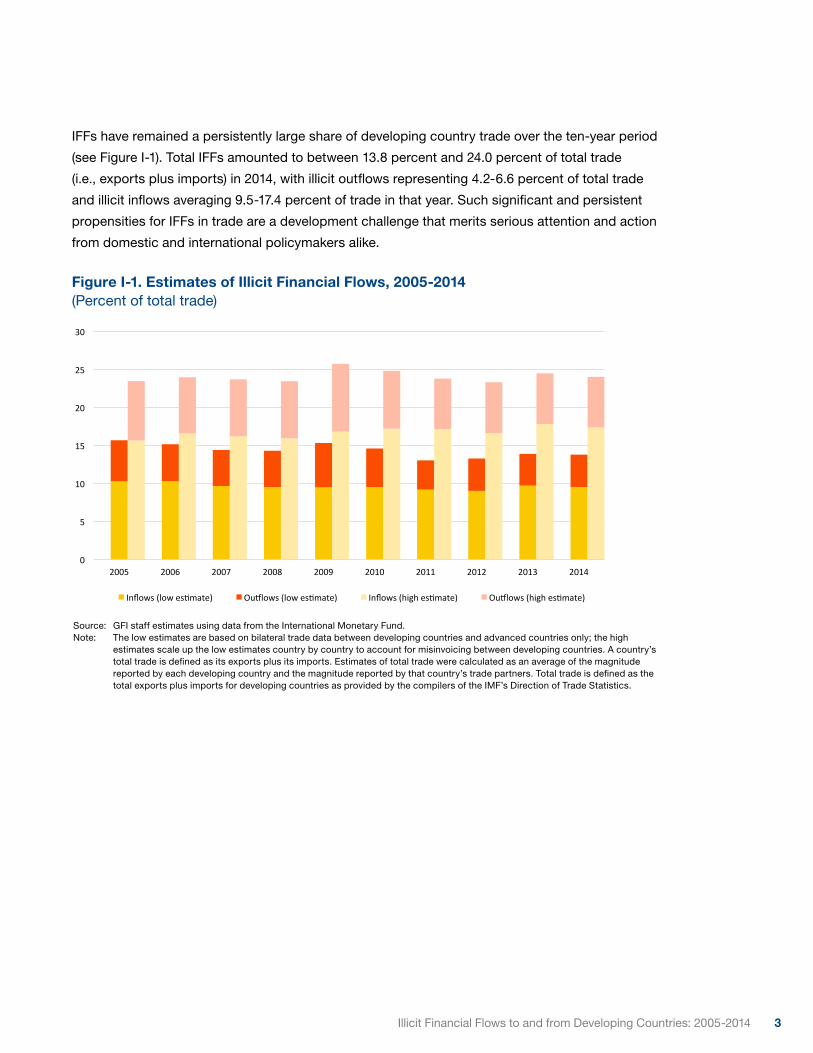
IFFs have remained a persistently large share of developing country trade over the ten-year period
(see Figure I-1). Total IFFs amounted to between 13.8 percent and 24.0 percent of total trade
(i.e., exports plus imports) in 2014, with illicit outflows representing 4.2-6.6 percent of total trade
and illicit inflows averaging 9.5-17.4 percent of trade in that year. Such significant and persistent
propensities for IFFs in trade are a development challenge that merits serious attention and action
from domestic and international policymakers alike.
Figure I-1. Estimates of Illicit Financial Flows, 2005-2014 (Percent of total trade)
0
5
10
15
20
25
30
2005 2006 2007 2008 2009 2010 2011 2012 2013 2014
Inflows(lowes5mate) Ou<lows(lowes5mate) Inflows(highes5mate) Ou<lows(highes5mate)
Source: GFI staff estimates using data from the International Monetary Fund.Note: The low estimates are based on bilateral trade data between developing countries and advanced countries only; the high
estimates scale up the low estimates country by country to account for misinvoicing between developing countries. A country’s total trade is defined as its exports plus its imports. Estimates of total trade were calculated as an average of the magnitude reported by each developing country and the magnitude reported by that country’s trade partners. Total trade is defined as the total exports plus imports for developing countries as provided by the compilers of the IMF’s Direction of Trade Statistics.

4 Global Financial Integrity
5Illicit Financial Flows to and from Developing Countries: 2005-2014
II. Estimates of Illicit Financial Outflows and Inflows
Total illicit financial flows to and from developing countries are estimated to have amounted to
between 13.8 percent and 24.0 percent of total developing country trade (exports plus imports) in
2014, a sizeable magnitude and close to the average for the entire 2005-2014 period. The significant
size and persistence of IFFs is the central theme of this report.
A. Estimates of OutflowsIn dollar terms, total Illicit financial outflows grew at an average annual rate between 7.2 percent and
8.1 percent over the years from 2005 to 2014, reaching estimated levels between $620 billion and
$970 billion in 2014 (Table II-1). Over that period, total developing country trade grew at an average
10.1 percent annual rate. Because growth in estimated outflows was less than growth in total trade,
outflows are likely to have declined slightly as a share of total developing country trade over the
ten-year period, from 5.4-7.9 percent in 2005 to 4.2-6.6 percent in 2014.
It would be a mistake, however, to read too much into that decline in the propensity for illicit
outflows between 2005 and 2014. For one thing, both the low and high estimates of the 2005
propensities were higher than for any other year in the sample except for 2009, largely due to
unusual volatility in trade growth in the years just prior to 2005. Following a 29 percent surge in
2004, total trade returned to more typical growth of over 20 percent in 2005. That unusual pattern of
trade growth in 2004 and 2005 is largely responsible for the unusually large estimated propensities
for illicit outflows in that year.
Furthermore, it would be a mistake to try to divine shifts in trends over a decade that was
dominated by the global financial crisis and its aftermath. Illicit outflows varied considerably relative
to total trade between 2005 and 2014 (Figure II-1). Most notably, the estimated range for illicit
outflows relative to total trade rose sharply in 2009, the year in which the economic impacts of
the financial crisis were most acutely felt. In 2009, estimated outflows were down by as much as
8.3 percent for all developing countries, while total trade for those countries is estimated to have
declined even more substantially, dropping by 22.6 percent. Since 2009, however, illicit outflows
relative to total trade appear to have remained remarkably stable despite considerable year-to-year
variation in the dollar volumes of both outflows and trade.
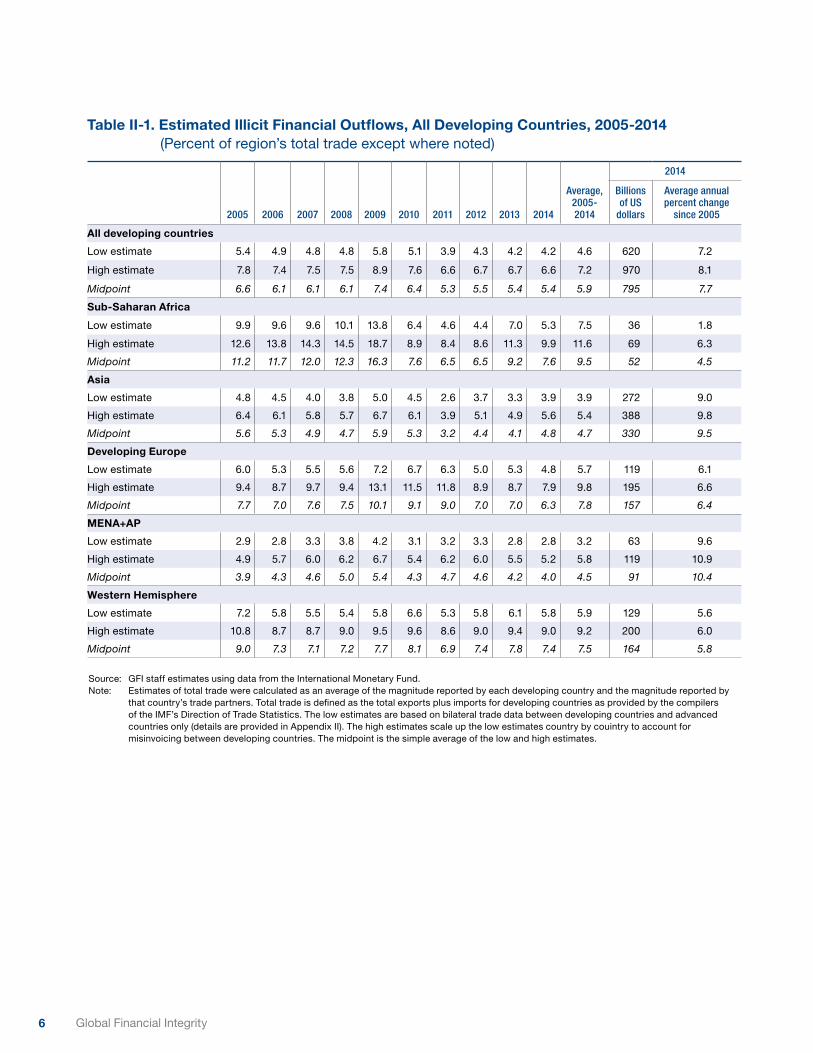
6 Global Financial Integrity
Table II-1. Estimated Illicit Financial Outflows, All Developing Countries, 2005-2014 (Percent of region’s total trade except where noted)
2005 2006 2007 2008 2009 2010 2011 2012 2013 2014
Average, 2005- 2014
2014
Billions of US
dollars
Average annual percent change
since 2005
All developing countries
Low estimate 5.4 4.9 4.8 4.8 5.8 5.1 3.9 4.3 4.2 4.2 4.6 620 7.2
High estimate 7.8 7.4 7.5 7.5 8.9 7.6 6.6 6.7 6.7 6.6 7.2 970 8.1
Midpoint 6.6 6.1 6.1 6.1 7.4 6.4 5.3 5.5 5.4 5.4 5.9 795 7.7
Sub-Saharan Africa
Low estimate 9.9 9.6 9.6 10.1 13.8 6.4 4.6 4.4 7.0 5.3 7.5 36 1.8
High estimate 12.6 13.8 14.3 14.5 18.7 8.9 8.4 8.6 11.3 9.9 11.6 69 6.3
Midpoint 11.2 11.7 12.0 12.3 16.3 7.6 6.5 6.5 9.2 7.6 9.5 52 4.5
Asia
Low estimate 4.8 4.5 4.0 3.8 5.0 4.5 2.6 3.7 3.3 3.9 3.9 272 9.0
High estimate 6.4 6.1 5.8 5.7 6.7 6.1 3.9 5.1 4.9 5.6 5.4 388 9.8
Midpoint 5.6 5.3 4.9 4.7 5.9 5.3 3.2 4.4 4.1 4.8 4.7 330 9.5
Developing Europe
Low estimate 6.0 5.3 5.5 5.6 7.2 6.7 6.3 5.0 5.3 4.8 5.7 119 6.1
High estimate 9.4 8.7 9.7 9.4 13.1 11.5 11.8 8.9 8.7 7.9 9.8 195 6.6
Midpoint 7.7 7.0 7.6 7.5 10.1 9.1 9.0 7.0 7.0 6.3 7.8 157 6.4
MENA+AP
Low estimate 2.9 2.8 3.3 3.8 4.2 3.1 3.2 3.3 2.8 2.8 3.2 63 9.6
High estimate 4.9 5.7 6.0 6.2 6.7 5.4 6.2 6.0 5.5 5.2 5.8 119 10.9
Midpoint 3.9 4.3 4.6 5.0 5.4 4.3 4.7 4.6 4.2 4.0 4.5 91 10.4
Western Hemisphere
Low estimate 7.2 5.8 5.5 5.4 5.8 6.6 5.3 5.8 6.1 5.8 5.9 129 5.6
High estimate 10.8 8.7 8.7 9.0 9.5 9.6 8.6 9.0 9.4 9.0 9.2 200 6.0
Midpoint 9.0 7.3 7.1 7.2 7.7 8.1 6.9 7.4 7.8 7.4 7.5 164 5.8
Source: GFI staff estimates using data from the International Monetary Fund.Note: Estimates of total trade were calculated as an average of the magnitude reported by each developing country and the magnitude reported by
that country’s trade partners. Total trade is defined as the total exports plus imports for developing countries as provided by the compilers of the IMF’s Direction of Trade Statistics. The low estimates are based on bilateral trade data between developing countries and advanced countries only (details are provided in Appendix II). The high estimates scale up the low estimates country by couintry to account for misinvoicing between developing countries. The midpoint is the simple average of the low and high estimates.

7Illicit Financial Flows to and from Developing Countries: 2005-2014
Figure II-1. Estimates of Illicit Financial Outflows, 2005-2014 (Percent of total trade)
0
1
2
3
4
5
6
7
8
9
10
2005 2006 2007 2008 2009 2010 2011 2012 2013 2014
Lowes1mate Highes1mate
Lowes1mateof$620bn
Highes1mateof$970bn
Source: GFI staff estimates using data from the International Monetary Fund.Note: The low estimates are based on bilateral trade data between developing countries and advanced countries only; the high
estimates scale up the low estimates country by country to account for misinvoicing between developing countries. A country’s total trade is defined as its exports plus its imports. Estimates of total trade were calculated as an average of the magnitude reported by each developing country and the magnitude reported by that country’s trade partners. Total trade is defined as the total exports plus imports for developing countries as provided by the compilers of the IMF’s Direction of Trade Statistics.
As in past GFI reports, illicit outflows continue to vary across major regions of the developing
world. The estimated dollar levels of illicit outflows continue to be largest in Asia (where outflows
are estimated to have grown between 9.0 percent and 9.8 percent a year over the decade, reaching
$272 billion to $388 billion in 2014) and lowest in Sub-Saharan Africa (where outflows grew
1.8 percent to 6.3 percent a year to levels in the $36 billion-$69 billion range by 2014).
The regional differences in dollar levels are greatly influenced by the scale of economic activity
(trade in particular) across the regions. Measured against the level of trade, Sub-Saharan Africa
ranked highest in illicit outflows, ranging from 5.3 percent to 9.9 percent of total trade in 2014, while
Asia ranked lowest of the major regions with estimated illicit outflows ranging from 3.9 percent to
5.6 percent of total trade (Figure II-2, low estimate). Developing Western Hemisphere countries
(i.e., Latin America) ranked relatively high on both the dollar volume of outflows in 2014 ($129 billion
to $200 billion) and in propensity (5.8 percent to 9.0 percent of total trade).

8 Global Financial Integrity
Figure II-2. Estimates of Illicit Financial Outflows from Developing Countries (Low estimate as percent of total trade, averaged over the 2005-2014 period)
7.5
3.9
5.7
3.2
5.9
4.6
0
1
2
3
4
5
6
7
8
Sub-SaharanAfrica
Asia DevelopingEurope
MENA+AP WesternHemisphere
Alldevelopingcountries
Source: GFI staff estimates using data from the International Monetary Fund.Note: The low estimates are based on bilateral trade data between developing countries and advanced countries only; the high
estimates scale up the low estimates country by country to account for misinvoicing between developing countries. A country’s total trade is defined as its exports plus its imports. Estimates of total trade were calculated as an average of the magnitude reported by each developing country and the magnitude reported by that country’s trade partners. Total trade is defined as the total exports plus imports for developing countries as provided by the compilers of the IMF’s Direction of Trade Statistics.
B. Estimates of Illicit Financial Inflows to Developing CountriesThe dollar volume of estimated inflows exceeded estimated outflows (by more than double in 2014)
as did the rate of growth over the 2005-2014 period. Moreover, the growth rate of dollar inflows has
exceeded that of dollar outflows, on average, for all developing countries in the sample. Finally, the
range of estimates (high versus low) for estimated inflows was wider than it was for outflows.
Illicit financial inflows are estimated to have grown at an average annual rate between 9.2 and
11.4 percent over the years from 2005 to 2014, reaching an estimated level between $1.4 trillion
and $2.6 trillion in 2014 (Table II-2). These growth ranges bracket the 10.1 percent increase in total
developing country trade over that period.
As was the case with outflows, interpreting trends in estimated inflow propensities over a decade
dominated by the disruptions of the global financial crisis is tenuous. That said, estimated inflows
appear to be a large and surprisingly stable portion of total developing country trade (Figure II-3).
Notably, the estimated propensities for inflows have not varied much since the worst of the global
downturn in 2009.

9Illicit Financial Flows to and from Developing Countries: 2005-2014
Table II-2. Estimated Illicit Financial Inflows to Developing Countries, 2005-2014 (Percent of region’s total trade except where noted)
2005 2006 2007 2008 2009 2010 2011 2012 2013 2014
Average, 2005- 2014
2014
Billions of US
dollars
Average annual percent change
since 2005
All developing countries
Low estimate 10.3 10.3 9.6 9.5 9.5 9.5 9.2 9.0 9.7 9.5 9.5 1,391 9.2
High estimate 15.6 16.6 16.2 15.9 16.8 17.2 17.2 16.6 17.8 17.4 16.8 2,537 11.4
Midpoint 12.9 13.4 12.9 12.7 13.1 13.3 13.2 12.8 13.7 13.4 13.2 1,964 10.6
Sub-Saharan Africa
Low estimate 9.4 6.3 5.9 7.1 8.0 8.6 7.9 7.2 7.5 6.3 7.4 44 4.5
High estimate 13.8 11.4 10.3 10.4 14.4 18.2 14.7 14.5 13.9 11.8 13.5 81 7.3
Midpoint 11.6 8.8 8.1 8.7 11.2 13.4 11.3 10.9 10.7 9.0 10.4 63 6.2
Asia
Low estimate 10.5 10.0 10.2 9.7 9.3 9.4 9.0 9.5 10.3 9.9 9.7 686 10.7
High estimate 14.9 15.6 16.2 14.8 15.7 16.6 16.2 16.7 18.2 17.7 16.5 1,229 13.6
Midpoint 12.7 12.8 13.2 12.3 12.5 13.0 12.6 13.1 14.3 13.8 13.1 958 12.5
Developing Europe
Low estimate 13.3 14.2 12.4 13.3 11.8 12.1 12.3 11.7 11.7 12.2 12.4 302 7.7
High estimate 21.3 21.5 20.5 22.5 20.1 20.6 22.7 20.5 20.2 19.9 21.0 495 8.1
Midpoint 17.3 17.8 16.4 17.9 16.0 16.3 17.5 16.1 15.9 16.0 16.7 398 7.9
MENA+AP
Low estimate 9.6 10.4 8.4 7.3 8.1 8.0 6.9 5.8 7.1 6.8 7.5 154 6.0
High estimate 16.5 18.9 16.5 14.4 17.2 15.6 15.2 12.8 16.4 16.6 15.7 377 10.2
Midpoint 13.0 14.7 12.4 10.8 12.7 11.8 11.0 9.3 11.7 11.7 11.6 265 8.8
Western Hemisphere
Low estimate 7.3 7.7 7.2 7.4 9.2 8.7 8.6 8.5 9.0 9.3 8.4 205 11.0
High estimate 11.3 12.9 12.3 13.4 16.5 16.4 16.5 16.5 16.7 16.0 15.2 355 12.3
Midpoint 9.3 10.3 9.7 10.4 12.9 12.6 12.5 12.5 12.9 12.6 11.8 280 11.8
Source: GFI staff estimates using data from the International Monetary Fund.Note: Estimates of total trade were calculated as an average of the magnitude reported by each developing country and the magnitude reported by
that country’s trade partners. Total trade is defined as the total exports plus imports for developing countries as provided by the compilers of the IMF’s Direction of Trade Statistics. The low estimates are based on bilateral trade data between developing countries and advanced countries only (details are provided in Appendix II). The high estimates scale up the low estimates country by couintry to account for misinvoicing between developing countries. The midpoint is the simple average of the low and high estimates.

10 Global Financial Integrity
Figure II-3. Estimates of Illicit Financial Inflows, 2005-2014 (Percent of total trade)
0
5
10
15
20
25
2005 2006 2007 2008 2009 2010 2011 2012 2013 2014
Lowes1mate Highes1mate
Highes1mateof$2,537bn
Lowes1mateof$1,391bn
Source: GFI staff estimates using data from the International Monetary Fund.Note: The low estimates are based on bilateral trade data between developing countries and advanced countries only; the high
estimates scale up the low estimates country by country to account for misinvoicing between developing countries. A country’s total trade is defined as its exports plus its imports. Estimates of total trade were calculated as an average of the magnitude reported by each developing country and the magnitude reported by that country’s trade partners. Total trade is defined as the total exports plus imports for developing countries as provided by the compilers of the IMF’s Direction of Trade Statistics.
Again, as with outflows, estimated inflows show considerable variation—in level and growth—across
major regions of the developing world. The estimated dollar levels of illicit inflows were largest
in Asia (where inflows are estimated to have grown at an average annual rate of 10.7 percent to
12.8 percent a year over the decade, reaching between $686 billion and over $1.2 trillion in 2014)
and lowest in Sub-Saharan Africa (where inflows grew between 4.5 percent and 7.3 percent a year
over the decade, reaching a level between $44 and $81 billion in 2014).
Developing countries in eastern Europe ranked highest in estimated illicit inflow propensities:
12.4 percent to 19.9 percent of total trade in 2014 (Chart II-4, low estimate). Sub-Saharan Africa,
which ranked highest for outflows in 2014, ranked lowest among the major regions on inflow
propensity for that year, with estimated inflows comprising between 6.3 percent and 13.1 percent of
total trade.
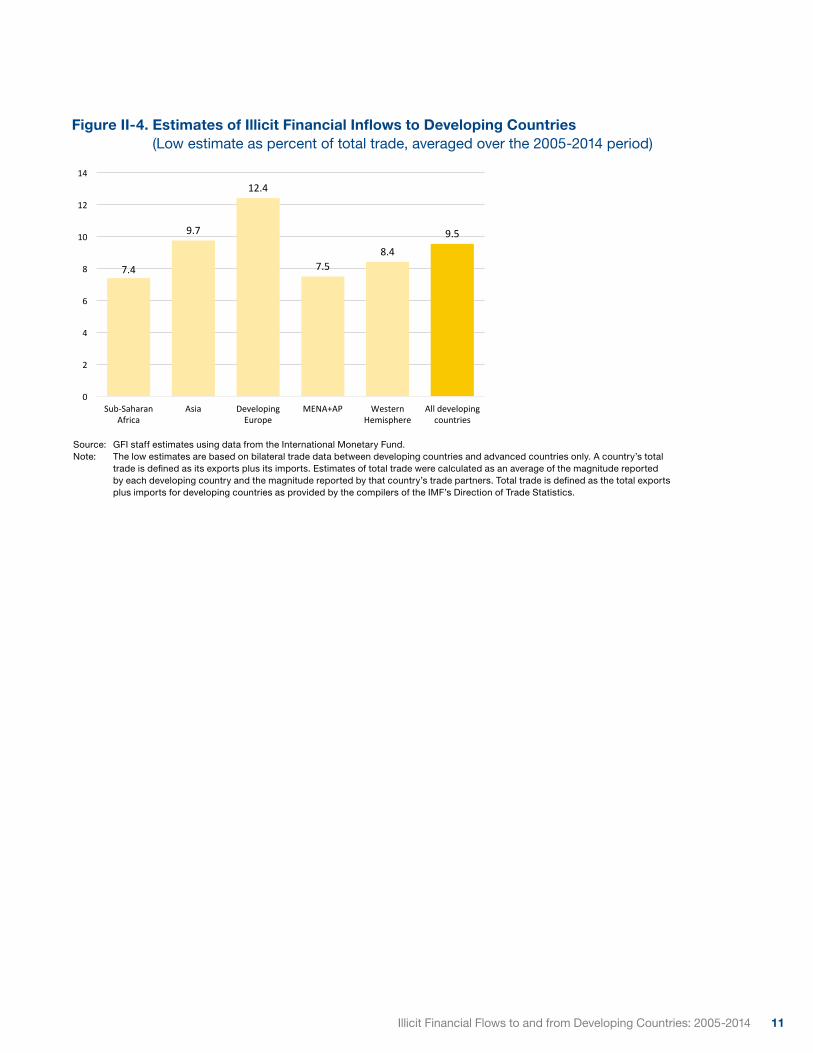
11Illicit Financial Flows to and from Developing Countries: 2005-2014
Figure II-4. Estimates of Illicit Financial Inflows to Developing Countries (Low estimate as percent of total trade, averaged over the 2005-2014 period)
7.4
9.7
12.4
7.58.4
9.5
0
2
4
6
8
10
12
14
Sub-SaharanAfrica
Asia DevelopingEurope
MENA+AP WesternHemisphere
Alldevelopingcountries
Source: GFI staff estimates using data from the International Monetary Fund.Note: The low estimates are based on bilateral trade data between developing countries and advanced countries only. A country’s total
trade is defined as its exports plus its imports. Estimates of total trade were calculated as an average of the magnitude reported by each developing country and the magnitude reported by that country’s trade partners. Total trade is defined as the total exports plus imports for developing countries as provided by the compilers of the IMF’s Direction of Trade Statistics.

12 Global Financial Integrity

13Illicit Financial Flows to and from Developing Countries: 2005-2014
III. A Guide to Interpreting theMisinvoicing Estimates
As stated at the outset, the IFF estimates reported here are imprecise. The main reason is that, by
their nature, IFFs are generally not observable so estimates must be measured indirectly using related
observed data. However the observed data are also imprecise. Furthermore, to draw inferences from
the observed data, analysts apply methods and enabling assumptions that are necessarily imperfect.
Facing such formidable measurement difficulties, therefore, researchers must take pains to clearly state
the objectives of the measurement exercise, to use the best data and most robust techniques available
in a manner consistent with the research objectives and, most important, to be absolutely clear on both
the strengths and limitations of the estimates they report.
This section of GFI’s report attempts to do just this. In the first subsection, GFI presents its research
objectives, and outlines the data and methods underlying its estimates of trade misinvoicing in
developing countries, identifying the main strengths and limitations of the estimates.9 (GFI’s methods
are discussed in greater detail in Appendix II). Given the objective of its research—to provide a
conservative global benchmark magnitude for trade misinvoicing—GFI strives to make the best use of
publicly available global data. The scope of GFI’s definition of IFFs is determined by the availability of
global data and is much narrower than what IFFs encompass, in principle. Even so, GFI’s estimates of
trade misinvoicing are large and persistent over time. Moreover, the steps governments could take to
curtail trade misinvoicing are relatively inexpensive. Accordingly, the expected benefits to countries that
undertake such policies seem worthwhile.
In the second subsection, GFI examines one of its key assumptions that allows reported imports to be
comparable with reported exports. GFI assesses the sensitivity of its misinvoicing estimates to changes
in the rate at which the conventional basis for evaluating imports (“cost, insurance, and freight” or CIF)
are marked up over the conventional accounting basis for evaluating exports (“free on board” or FOB).
The IMF data on imports are only reported on a CIF basis, so they must be converted to an FOB basis
to facilitate comparisons with corresponding export flows. The simple sensitivity analysis concludes that
changes in the assumed CIF-to-FOB markup rate does not change the overall estimate for total IFFs,
though it alters the mix between estimated outflows and inflows.
9 This section excludes discussion of the component of IFFs identified as unrecorded balance of payment (BOP) flows, sometimes referred to as “hot money narrow.” As presented earlier in the report, that component of IFFs (taken directly from the IMF’s estimates of “Net Errors and Omissions” (NEO) as published in its BOP database) tends to be relatively small: no more than 13 percent of the total IFF estimate in 2014, for example. Those unrecorded flows represent flows in and out of countries that cannot be definitively assigned to any of the major categories (the current, financial and capital accounts) which are estimated separately by the IMF, using independent sources. Because, as an accounting matter, the three major BOP accounts must balance, a residual magnitude (NEO) is a statistical inevitability. GFI’s use of this residual as a component of IFFs derives from its widespread use in earlier economic research as a component of capital flight (see, for example, Stijn Claessens and David Naudé, “Recent Estimates of Capital Flight” (Policy Research Working Paper no. 1186, International Economics Department, The World Bank, Washington, DC, September 1993), http://documents.worldbank.org/curated/en/878311468739518251/pdf/multi0page.pdf). GFI assumes that the entire magnitude of unrecorded flow is illicit. Because the magnitudes owing to this factor are small, changes in that assumption typically will have a relatively small impact on the IFF total.

14 Global Financial Integrity
A. Overview of the Strengths and Limitations of the Trade Misinvoicing Estimates
GFI defines IFFs broadly to be illegal movements of money or capital from one country to another—
such financial flows are considered to be illicit when the funds are illegally earned, transferred, or
utilized. The proliferation of such IFFs would clearly signal the presence of significant social costs,
a fact that gives rise to the question of measurement: how significant is the magnitude of IFFs?
In this report, as with its earlier reports, GFI addresses the question of the significance of the
magnitudes of IFFs in the context of social costs incurred by developing countries, those that,
because of their critical dependence on commerce with advanced countries, are generally most
vulnerable to the social costs associated with IFFs. In some cases, those social costs might easily
translate into revenue foregone by the governments of developing countries. In others, IFFs may
have no direct implications for public sector saving in the developing world. Whatever the factors
motivating IFFs, a proliferation of IFFs generally signals unproductive accumulations of wealth
that can have corrosive effects on developing countries. Countries that cannot (or will not) take
sufficient steps to curtail IFFs are more likely to face increased inequality and diminished credibility
in their institutions of governance, for example. Over time, such social corrosion exacerbates the
deterioration, making it more and more difficult for a country to achieve and sustain adequate living
standards for its citizens.
Because IFFs are unobserved, the question of measurement cannot be answered with precision.
But because the question is critical to the futures of a large chunk of the world’s population, any
indication of the collective significance of IFFs to the developing world is helpful to policymakers,
citizens, and other stakeholders in those countries. Many of these groups are already very well
aware of the problems created by IFFs, particularly misinvoicing. GFI believes that the availability
of more comprehensive estimates serves to support the cases they may be making within their
countries to take effective (and relatively inexpensive) steps to reduce the social costs of abiding
trade fraud.
GFI’s approach to estimating the significance of IFFs focuses primarily on trade misinvoicing.
While misinvoicing is only a small part of all IFFs as implied by GFI’s (or anyone’s) definition, it is a
portion for which some data exist, thereby allowing some indirect measurement of the issue. In its
country-focused research, GFI attempts to use all available data and techniques to make robust
inferences about IFFs. However, for the purposes of its annual reports, such use of country-specific
and commodity-specific bilateral trade is too unwieldy at this time (too unwieldy, for example, to
allow others to easily replicate GFI’s results); it is also not necessarily conducive to providing a
“conservative” estimate of trade misinvoicing that covers as large a swath of developing countries
as is desired.
15Illicit Financial Flows to and from Developing Countries: 2005-2014
The only data source currently available that is both sufficiently broad in its country coverage and
also consistent with GFI’s objective of providing a conservative illustration of the magnitude of
misinvoicing is the IMF’s Direction of Trade Statistics (DOTS). These data provide a comprehensive
mirror-trade accounting of annual trade flows between developing and advanced countries,
which allows for the identification of significant and persistent gaps between the trade reports of
developing countries and their advanced country trade partners.10
That said, the DOTS data are innately limited in what information they can yield for global estimates
of misinvoicing. Those limitations have been noted in recent critiques of the mirror-trade approach.11
A discussion of such limitations would include at least the following seven:
1. Unobserved transaction cost markups. Data on transactions costs of trade are not
generally available. Most notably, imports are conventionally reported as valued on a CIF
basis and must be converted to the FOB basis conventionally used for exports before mirror-
trade discrepancies can be identified.
2. Regional aggregation. Consistent bilateral trade data are not generally available for all
countries engaged in trade.
3. Commodity aggregation. Even when consistent bilateral trade data are available for a
selection of countries involved in trade, bilateral reporting may not be available for all goods
traded.
4. Timing of trade. Transactions take time to complete and countries on either side of a
transaction may record trade volumes in different years.
5. Entrepôt trade. Reported country sources and destinations for trade may reflect reporting
from intermediate ports where goods from an originating country are warehoused for a time
before they are shipped to the ultimate destination in other countries. The problem arises
when exports and imports passing through entrepôt ports are reported by both the entrepôt
countries and the source/destination countries, leading to over-counting in official data and
apparent trade gaps where none should be. We address this where possible.
10 The closest competitor to DOTS would be the United Nation’s Comtrade database. GFI regularly uses the Comtrade data in its country-specific research (along with other data when available including detailed trade data produced by some developing countries) because of the rich commodity-specific bilateral trade data available in Comtrade, but not DOTS. GFI is investigating the possibility of using Comtrade for its annual global estimates but at the moment, both retrieval and processing of the Comtrade data for all countries and commodities is not feasible for GFI. Moreover, while the Comtrade data would arguably permit GFI’s misinvoicing estimates to be more precise, the same limitations that attend the mirror-trade approach applied to DOTS data would also limit inferences from the more detailed Comtrade data. Moreover, if the Comtrade and DOTS data are broadly consistent with each other, using Comtrade would be very likely to increase (and certainly not decrease) the estimated magnitude of misinvoicing. That’s because trade gaps that offset each other when presented at the country level (DOTS), would not offset when presented at the commodity level (Comtrade).
11 For example, see Volker Nitsch, “Trade Mispricing and Illicit Flows,” in Draining Development? Controlling Flows of Illicit Funds from Developing Countries, ed. Peter Reuter (Washington, D.C.: World Bank, 2012), 309–34, https://openknowledge.worldbank.org/handle/10986/2242 and, most recently, Volker Nitsch, “Trade Misinvoiving in Developing Countries” (CGD Policy Paper 103, Washington, DC, February 2017), https://www.cgdev.org/sites/default/files/trade-misinvoicing-developing-countries.pdf .

16 Global Financial Integrity
6. Currency conversion. While much world trade is transacted in vehicle currencies (e.g., the
U.S. dollar) other trades are not. The exchange rates used by the official agencies to convert
trade data to dollars may differ from those that may have directly affected the choices made
by the parties to particular trades. For countries that maintain multiple exchange rate regimes,
the possibilities for such errors are magnified, as are the motivations for misinvoicing.
7. Country idiosyncrasies. Particular countries may not report bilateral trade flows for
particular goods for particular years for one reason or another.
Each one of those limitations does indeed work to undermine the precision of misinvoicing
estimates, and there are no remedies available to researchers that would completely mitigate any
such impediments to precision. Many observers have suggested that using better data would
improve the accuracy of the estimates. This is certainly true, but the kind of data that would allow
researchers to circumvent the kinds of limitations listed above unfortunately do not exist for all but
a few countries at this time. Moreover, an ideal data set (i.e., one containing enough information for
all countries to allow researchers to completely control for all of the seven distorting factors listed
above) would still not be able to identify misinvoicing with certainty: for example, the most precise
imaginable trade gap estimated from ideal data would still not allow researchers to distinguish illicit
misinvoicing from unintended human error, much less the direction of misinvoicing implicit in an
estimated trade gap.
As with all social measurement, additional assumptions are needed. In choosing such assumptions,
researchers must try to be as realistic as possible in the absence of additional information.
Moreover, in presenting their estimates, researchers must make decisions about presenting their
results in such a way that minimizes the likelihood of users misinterpreting their results. This
consideration accounts for much of the changes in the presentations in this report. GFI highlights
the misinvoicing estimates as averaged over the 2005-2014 period to minimize to some extent
the timing effects of trade reports that straddle a year. Furthermore, the emphasis on regional
averages of misinvoicing estimates mitigates to some degree the effects of entrepôt trade, as well
as pointing out that the results for individual countries are likely to be even less precise than for
regional and global aggregates. GFI includes adjustments to the DOTS data for all known country
data idiosyncrasies (see Appendix II for more details on the Hong Kong, Swiss, South Africa and
Zambia adjustments). GFI highlights its estimates over time as propensities (i.e., IFFs as a percent
of total trade) to limit the influence of other trends (such as globalization) that affect the year-to-
year dollar totals. This analysis presents a range of estimates to underscore uncertainties inherent
in the exercise. Finally, GFI constructs its estimates and makes them available to other interested
researchers in such a way as to keep the process as transparent as possible, to enable others to
easily replicate the work and, most importantly, to invite productive comments from the community
that will allow GFI to improve its estimates in a way that is consistent with its objective.
17Illicit Financial Flows to and from Developing Countries: 2005-2014
To sum up: with its annual global estimates, GFI is attempting to provide an indication of the overall
magnitude of misinvoicing, a measure that, by design, tends to understate the unobserved
overall magnitude.12 The result that a significant share of total developing country trade is potentially
misinvoiced is alarming. Fortunately, there are concrete (and relatively inexpensive) steps that
developing countries can take to reduce such misinvoicing. These measures will not eliminate all
illicit financial flows, but governments still have space to potentially significantly curtail misinvoicing,
thereby addressing to an extent the social, economic, and political ills this flows are causing.
The next subsection examines the sensitivity of the GFI misinvoicing estimates to changes in its
enabling assumption for the CIF/FOB markup.
B. Sensitivity of the Estimates to the Adjustment of CIF Basis Imports to FOB Basis
Because the DOTS data reports dollar volumes of exports on an FOB basis and associated imports
on an (inflated) CIF basis, the paired trade flows must be adjusted to a comparable basis. In its
estimates, GFI assumes that the FOB flows are marked up at a constant 10 percent rate over the
FOB basis. GFI implements this assumption by multiplying all reported import flows by a factor
equal to (1 + 0.1)-1 to put those import flows on an FOB basis, making them comparable with the
reported export flow.
GFI follows longstanding IMF usage (for example, in IMF’s imputations of missing data in DOTS) by
assuming an ad-valorem markup rate of 10 percent. While the 10 percent assumption is ultimately
an arbitrary choice (for GFI—as well as for the IMF and others—owing to the scarcity of consistent
data on the costs of transnational transport and other factors) it generally accords with previous
economic research practice and, for that reason, GFI has maintained this assumption in all of its
annual reports and continues to assume this here.
There are weaknesses to this assumption and approach, however, as one might expect CIF/FOB
markups to vary with the distances goods must travel from the exporting country to the importing
country. Moreover, the markup rate might also be expected to vary by the mode of transport
(e.g., truck, ship, or plane) used in shipping the goods and it might be expected to change over time
(as transport costs are generally believed to have been on declining trend). Finally, the markup rate
is assumed to be symmetric (i.e., imports by country B of a given FOB value of associated exports
12 Recall that the use of more commodity detail on goods trade is virtually guaranteed to raise the aggregate misinvoicing estimate (and certainly not lower it), and the inclusion of services trade fraud and same-invoice faking (were adequate data available) would further raise the total.

18 Global Financial Integrity
from country A necessarily equal the markup rate for a comparable shipment of the same goods
from country B to country A)—this need not hold in practice.13 However, detailed data on transport
costs have historically been hard to come by.
A natural question to ask, then, is: how sensitive are GFI’s baseline (10 percent) estimates to
changes in the CIF/FOB markup rate? To address this, GFI computed alternative estimates of
misinvoicing based on markup rates that bracket its baseline assumption of 10 percent. The results
are illustrated in Figure III-1.
The overall propensities for misinvoicing turn out to be relatively insensitive to the assumed CIF/FOB
markup rate (see Figure III-1). The baseline estimate of total misinvoicing (assuming a 10 percent
markup) is 12.5 percent and ranges from a low of 12.3 percent (assuming an 8 percent markup) to
13.2 percent (assuming a 15 percent markup).
Figure III-1. Estimates of Trade Misinvoicing Flows Under Alternative Assumptions Regarding the CIF/FOB Markup Rate (Low estimate as percent of total trade, averaged over the 2005-2014 period)
8.5 8.6 9.2 9.7 10.6
4.4 3.7 3.3 3.02.6
0
2
4
6
8
10
12
14
5% 8% 10%(baseline) 12% 15%
Ou5lows Inflows
Alterna4veassump4onsfortheCIF-to-FOBmarkuprate
Source: GFI staff estimates using data from the International Monetary Fund.Note: The low estimates are based on bilateral trade data between developing countries and advanced countries only. A country’s total
trade is defined as its exports plus its imports. Estimates of total trade were calculated as an average of the magnitude reported by each developing country and the magnitude reported by that country’s trade partners. Total trade is defined as the total exports plus imports for developing countries as provided by the compilers of the IMF’s Direction of Trade Statistics.
13 For example, think of country A being predominantly flat and country B being mountainous. All other things held equal, transporting goods imported by B over mountainous terrain might be expected to cost more than transporting the same goods imported by country A to some final interior destination.

19Illicit Financial Flows to and from Developing Countries: 2005-2014
That said, the distribution of misinvoicing by type exhibits some sensitivity to the assumed markup
rate. A higher assumed rate tends to lower outflows and increase inflows. Estimated misinvoicing
outflows (3.3 percent of total trade at 10 percent) vary between 4.4 percent (assuming an 8 percent
markup) and 2.6 percent of total trade (assuming a 15 percent markup rate). Conversely, estimated
inflows vary directly with the assumed markup rate: from a low of 8.5 percent of trade (assuming an
8 percent markup rate) to 10.6 percent (assuming a 10.6 percent markup rate).
What this means is that total misinvoicing is probably more robustly estimated by GFI’s method than
its components (i.e. outflows and inflows taken separately), other things being equal. This result is
not surprising, as changes in the markup rates, under the constancy and symmetry assumptions,
have predictable algebraic effects on the size and direction of the trade gaps underlying the
misinvoicing estimates (reflected in the direction in which the numerical estimates reported in
Figure III-1 change as the assumed markup rate changes).
The relative sensitivities reported are only illustrative, as they are critically dependent on the
constancy and symmetry that GFI assumes for the markup rates. In future work, GFI plans to test
this assumption further by calculating its misinvoicing estimates using research data that have
become available in recent years that allow for more realistic assumptions concerning the markup
rates on trade.14
14 Those data are described in Guillaume Gaulier and Soledad Zignago, “BACI: International Trade Database at the Product-Level, The 1994-2007 Version” CEPII Working Paper, No 2010-23, October 2010, http://www.cepii.fr/PDF_PUB/wp_nts/2010/wp2010-23.pdf

20 Global Financial Integrity

21Illicit Financial Flows to and from Developing Countries: 2005-2014
IV. Policy Recommendations
A. Overview Illicit financial flows from developing countries are facilitated by a lack of transparency in the global
financial system that encourages tax havens and secrecy jurisdictions, anonymous trusts and shell
companies, bribery, and corruption. There are countless techniques to illegally move funds out of
a country and/or to launder dirty money, including the misinvoicing of trade, which can be used to
shift proceeds of criminal activity across national borders.
Though policy environments vary from country to country, there are best practices that all countries
should adopt themselves and promote at international and regional forums and institutions,
including the G20 countries, the United Nations, the World Bank, the IMF, the OECD, and the
African Union. This section highlights these best practices and suggests further steps domestic and
international regulators could take to curtail illicit financial flows.
B. Anti-Money LaunderingAt a minimum, all countries should comply with the Financial Action Task Force (FATF)
Recommendations to combat money laundering and terrorist financing. The most recent update
to those recommendations was released in 2012, introducing new priority areas on corruption and
tax crimes.15
Despite good intentions and good policy, actually stopping money laundering often comes down
to enforcement. Regulators and law enforcement officials must strongly enforce all anti-money
laundering laws and regulations already on the books. This includes prosecuting criminal charges
against and imposing appropriate penalties upon employees of financial intuitions who are culpable
for allowing money laundering to occur as well as other culpable professional facilitators such as
lawyers, accountants, and corporate service providers.
C. Beneficial Ownership of Legal Entities Information on the ultimate, true, human owner(s) of all corporations and other legal entities, referred
to as “beneficial owners”, should be disclosed upon formation, updated regularly, and made freely
available to the public in central registries. Countries and international institutions should require
gatekeepers to the financial system—lawyers, accountants, corporate service providers, and
financial institutions—to identify the beneficial owners of their accounts and clients. In particular,
beneficial owners for all banking and securities accounts should be identified in order to address
the problems posed by anonymous companies and other legal entities.
15 Financial Action Task Force, “The FATF Recommendations: International Standards on Combating Money Laundering and the Financing of Terrorism & Proliferation” (Paris, France: FATF, February 2012), http://www.fatf-gafi.org/topics/fatfrecommendations/documents/ fatf-recommendations.html.

22 Global Financial Integrity
In 2015, the European Union adopted legislation requiring each EU Member State to create registers
of beneficial ownership information by May 2017 that are freely accessible by law enforcement
authorities and financial institutions, and available to third parties that can demonstrate a legitimate
interest in the information. Nothing prevents EU Member states from creating entirely open
registries, however, and a few countries both within and outside the EU have already committed
to doing so, including the UK, Denmark, Norway, Ukraine, Ghana, Kenya, Nigeria, and Colombia.
However, progress by G20 countries towards meeting even the less ambitious High Level Principles
on Beneficial Ownership Transparency (adopted by the G20 in November 2014) has been poor.16
GFI urges countries to commit to the creation of public registries of corporate beneficial ownership
information and to engage with countries already in the process of implementing public registers to
learn from their challenges and successes.
D. Automatic Exchange of Financial Information All countries should actively participate in the global movement toward the automatic exchange of
financial information. Ninety-six countries have committed to implementing the OECD/G20 standard
for this exchange by the end of 2018, which represents some progress from this time last year, when
only 89 countries had committed to the standard. Nonetheless, the OECD and G20 must ensure
that developing countries, and especially the least developed countries, are included in the process.
The system that has been established provides a necessary framework but allows countries to
“choose” one another for actual information exchange. This has so far resulted in the exclusion of
most developing countries from receiving information from partners. In addition, the system should
allow for a phase-in period for developing countries during which they can receive information from
other countries without needing to reciprocate right away. During this period, they could receive
technical assistance to help adapt their information collection and processing systems to be able to
provide the necessary information to their exchange partners.
E. Country-by-Country ReportingAll countries should require multinational corporations to publicly disclose their revenues, profits,
losses, sales, taxes paid, subsidiaries, and staff levels on a country-by-country basis as a means
of detecting and deterring abusive tax avoidance practices. As part of the Base Erosion and Profit
Shifting (BEPS) initiative, the G20 countries and the OECD countries agreed in November 2015
to take the necessary measures to require their large, multinational companies to provide such
reporting on a country-by-country basis. Unfortunately, the agreement only requires that the
information be provided by the parent of the multinational company to its home tax authority. Other
countries’ tax authorities will be able to access the information only through official treaty requests,
and therefore only where such treaties are in place. GFI strongly recommends that countries
require companies over which they have relevant jurisdiction to provide public country-by-country
16 “Just for Show? Reviewing G20 Promises on Beneficial Ownership” (Transparency International, November 12, 2015), https://www.transparency.org/whatwedo/publication/just_for_show_g20_promises.
23Illicit Financial Flows to and from Developing Countries: 2005-2014
reporting, so that the information can be analyzed by legislators responsible for fixing the
profit-shifting problems that such reporting will help identify. Since legislators alone will not have
enough qualified people to adequately analyze the information necessary to make informed policy
changes, publicly available country-by-country reporting would also allow experts from academia,
civil society, and the media to lend their analytical support to the problem.
F. Curtailing Trade MisinvoicingTrade misinvoicing accounts for a substantial majority of illicit flows over the time period of this study,
averaging upwards of 87 percent of IFFs (or 12.4 percent of developing country trade) over the 2005-2014
period. Curbing trade misinvoicing must necessarily be a major focus for policymakers around the world.
Governments should significantly boost customs enforcement by providing appropriate training and
equipment to better detect the intentional misinvoicing of trade transactions. One particularly important
tool for stopping trade misinvoicing as it happens is access to the most recently available, commodity-
level world market pricing information. This would allow customs officials to tell whether a particular good
may be significantly mis-priced relative to prevailing world trade pricing for that good. This variance could
then trigger further review for the transaction in some form, such as an audit. GFTrade™, a product of
GFI, is a proprietary risk assessment tool designed to allow customs departments to do just that.
Given the greater potential for abuse, trade transactions with secrecy jurisdictions should be treated with
the highest level of scrutiny by customs, tax, and law enforcement officials. Brazil is an excellent example
on this point, subjecting transactions with secrecy jurisdictions and tax havens to a higher tax rate.17
G. Addis Tax InitiativeThe Addis Tax Initiative (ATI), an agreement reached in 2015, attempts to focus the political will of
several countries to address the illicit flows menace.18 The ATI is the outcome of a side event at the most
recent Financing for Development Conference; it directly links illicit financial flows to domestic resource
mobilization, and in turn, to sustainable development.19 The more than 30 countries and international
organizations that have agreed to it thus far have acknowledged that curbing illicit flows is crucial to
achieving the SDGs. Germany, the United States, the United Kingdom, and the Netherlands are among
the developed governments taking part in the non-binding effort to seek ways to reduce IFFs. Ethiopia,
Indonesia, the Philippines, and Tanzania, as well as other developing countries, have said they will strive
to curb their losses of revenue (due to IFFs). GFI strongly encourages other countries to sign on to the
Addis Tax Initiative and has entered into discussions with numerous governments to determine how the
aspiration of the Addis Action Agenda, the SDGs, and the ATI can move to implementation.
17 Walter Stuber, “Brazil: Tax Haven Jurisdictions - Haven or Hell?,” Mondaq, January 8, 2013, http://www.mondaq.com/brazil/x/215184/
Income+Tax/Tax+Haven+Jurisdictions+Haven+Or+Hell.18 “Financing for Development Conference: The Addis Tax Initiative - Declaration” (Addis Ababa, Ethiopia: International Tax Compact,
July 15, 2015), http://www.taxcompact.net/documents/Addis-Tax-Initiative_Declaration.pdf.19 “Better Tax Systems Crucial for Development,” [Press Release] (Addis Ababa, Ethiopia: International Tax Compact, July 15, 2015),
http://www.taxcompact.net/documents/Addis-Tax-Initiative_Press-Release.pdf.

24 Global Financial Integrity

25Illicit Financial Flows to and from Developing Countries: 2005-2014
VI. Conclusions
The estimates presented in this report underscore the severity of the problem illicit financial lows
present to the developing world. Illicit flows in and out of the developing world amounted to at
least 13.8 percent of total trade (or $2 trillion) in 2014. The significant estimated propensities for
illicit flows in the developing world have not declined appreciably over the 2005-2014 period.
Propensities for nations to experience illicit financial outflows have been highest in Sub-Saharan
Africa, while propensities for illicit inflows have been highest in Eastern Europe and Asia.
The numerical estimates are intended to illustrate the magnitude of the problem of illicit financial
flows. Significant and persistent IFFs in and out of developing countries imply sizeable social costs
falling on the governments and citizens of those countries. The IMF data underlying the estimates
are the best available to GFI at this time. While GFI will continue to explore new data resources
and update its methods, complete precision in such research is not achievable. GFI believes that
identification of orders of magnitude more than establishes the need for policymakers to curtail
those flows and reduce their social costs.
GFI recommends a number of policy measures to curtail illicit flows. Broadly, they are related to
increasing transparency in the global financial system. Measures related to tax haven secrecy,
anonymous companies, and money laundering techniques are of particular importance.
Specifically, GFI’s major policy recommendations to world leaders include:
1. Beneficial Ownership. Governments should establish public registries of beneficial
ownership information on all legal entities, and all gatekeepers to the financial system should
know the true beneficial owner(s) of any account or client relationship they open.
2. Anti-Money Laundering. Government authorities should adopt and fully implement all of the
Financial Action Task Force’s (FATF) anti-money laundering recommendations; laws already in
place should be strongly enforced.
3. Country-by-Country Reporting. Policymakers should require multinational companies to
publicly disclose their revenues, profits, losses, sales, taxes paid, subsidiaries, and staff levels
on a country-by-country basis.
4. Tax Information Exchange. All countries should actively participate in the worldwide
movement towards the automatic exchange of tax information as endorsed by the OECD and
the G20.

26 Global Financial Integrity
5. Trade Misinvoicing. Customs agencies should treat trade transactions involving a tax
haven with the highest level of scrutiny. Moreover, governments should significantly boost
their customs enforcement by equipping and training officers to better detect intentional
misinvoicing of trade transactions, particularly through access to the most recently available
world market pricing information at a detailed commodity level.
6. Addis Tax Initiative. Governments should sign on to the Addis Tax Initiative to further
support efforts to curb illicit financial flows as a key component of the global development
agenda.
Illicit financial flows must be curtailed if domestic resource mobilization initiatives are to stand any
chance of succeeding. National and international policymakers must consider the outsized effect
of illicit financial flows on development and implement appropriate policies. GFI has a strong track
record of working with governments and stands ready to assist in this effort.

27Illicit Financial Flows to and from Developing Countries: 2005-2014
Appendix I. Tables
Full data sets are available in the online data appendix.
Appendix Table I-1. Geographical Regions
Sub-Saharan Africa (45) Asia (25) Developing Europe (24) MENA+AP (22) Western Hemisphere (33) Advanced Economies (35)
Angola Bangladesh* Albania Algeria*^ Antigua and Barbuda AustraliaBenin Bhutan Armenia, Republic of* Afghanistan Argentina* AustriaBotswana† Brunei Darussalam Azerbaijan, Republic of* Bahrain, Kingdom of Aruba* BelgiumBurkina Faso Cambodia Belarus* Djibouti^ Bahamas, The CanadaBurundi China, P.R.: Mainland* Bosnia and Herzegovina Egypt*^ Barbados CyprusCabo Verde Fiji Bulgaria* Iran, Islamic Republic of Belize Czech RepublicCameroon India* Croatia* Iraq Bolivia DenmarkCentral African Republic Indonesia* Georgia* Jordan* Brazil* EstoniaChad Kiribati Hungary* Kuwait Chile* Finland
Comoros Lao People's Democratic Republic Kazakhstan* Lebanon Colombia* France
Congo, Dem. Rep. of Malaysia* Kosovo, Republic of Libya^ Costa Rica* GermanyCongo, Republic of Maldives Kyrgyz Republic Morocco*^ Dominica GreeceCote d'Ivoire* Mongolia Macedonia, FYR Mauritania^ Dominican Republic Hong KongEquatorial Guinea Myanmar Moldova* Oman* Ecuador* IcelandEritrea Nepal Montenegro Pakistan El Salvador* IrelandEthiopia Papua New Guinea Poland* Qatar* Grenada IsraelGabon Philippines* Romania* Saudi Arabia Guatemala* ItalyGambia, The Samoa Russian Federation* Sudan*^ Guyana JapanGhana Solomon Islands Serbia, Republic of Syrian Arab Republic Haiti Korea, Republic ofGuinea Sri Lanka* Tajikistan Tunisia^ Honduras* LatviaGuinea-Bissau Thailand* Turkey* United Arab Emirates Jamaica* LithuaniaKenya Timor-Leste, Dem. Rep. of Turkmenistan Yemen, Republic of Mexico* LuxembourgLesotho† Tonga Ukraine* Nicaragua* MaltaLiberia Vanuatu Uzbekistan Panama* NetherlandsMadagascar Vietnam* Paraguay* New ZealandMalawi Peru* NorwayMali St. Kitts and Nevis PortugalMauritius* St. Lucia San Marino
Mozambique St. Vincent and the Grenadines Singapore
Namibia† Suriname Slovak RepublicNiger Trinidad and Tobago SloveniaNigeria Uruguay Spain
Rwanda Venezuela, Republica Bolivariana de* Sweden
Sao Tome and Principe SwitzerlandSenegal* United KingdomSeychelles United StatesSierra LeoneSomaliaSouth AfricaSwaziland†TanzaniaTogo*UgandaZambiaZimbabwe
* Denotes developing countries who report bilaterally to advanced countries (51 total)^ Denotes North African countries, which, when combined with Sub-Saharan Africa, can generate estimates for the African Continent as a whole. † Indicates a South African Customs Union country for which the trade misinvoicing calculation was estimated as a relative level of South Africa’s trade
misinvoicing outflows.Note 1: Advanced economies are used a baseline for calculating trade misinvoicing estimates. Note 2: Though it is possible to make a bilateral calculation using South African and Zambian data, this report makes a world aggregate calculation for
those two economies, due to idiosyncratic destination reporting of gold and copper exports, respectively. Source: IMF Direction of Trade Statistics
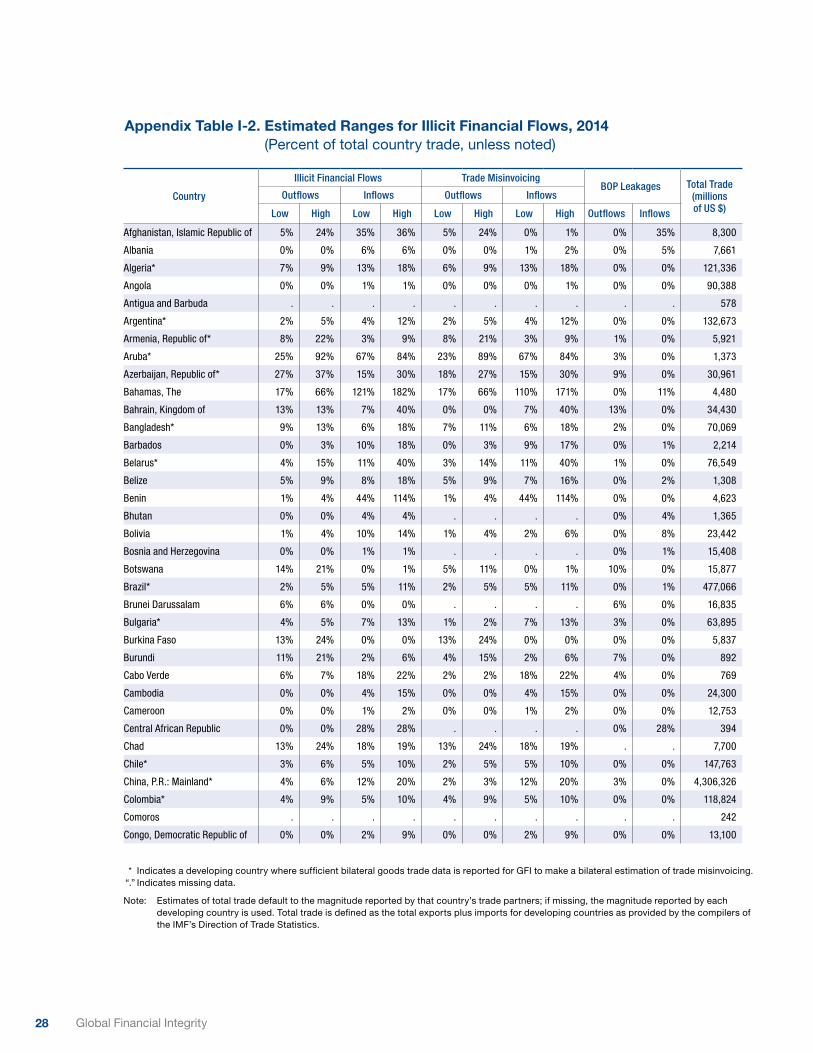
28 Global Financial Integrity
Country
Illicit Financial Flows Trade MisinvoicingBOP Leakages Total Trade
(millions of US $)
Outflows Inflows Outflows Inflows
Low High Low High Low High Low High Outflows Inflows
Afghanistan, Islamic Republic of 5% 24% 35% 36% 5% 24% 0% 1% 0% 35% 8,300
Albania 0% 0% 6% 6% 0% 0% 1% 2% 0% 5% 7,661
Algeria* 7% 9% 13% 18% 6% 9% 13% 18% 0% 0% 121,336
Angola 0% 0% 1% 1% 0% 0% 0% 1% 0% 0% 90,388
Antigua and Barbuda . . . . . . . . . . 578
Argentina* 2% 5% 4% 12% 2% 5% 4% 12% 0% 0% 132,673
Armenia, Republic of* 8% 22% 3% 9% 8% 21% 3% 9% 1% 0% 5,921
Aruba* 25% 92% 67% 84% 23% 89% 67% 84% 3% 0% 1,373
Azerbaijan, Republic of* 27% 37% 15% 30% 18% 27% 15% 30% 9% 0% 30,961
Bahamas, The 17% 66% 121% 182% 17% 66% 110% 171% 0% 11% 4,480
Bahrain, Kingdom of 13% 13% 7% 40% 0% 0% 7% 40% 13% 0% 34,430
Bangladesh* 9% 13% 6% 18% 7% 11% 6% 18% 2% 0% 70,069
Barbados 0% 3% 10% 18% 0% 3% 9% 17% 0% 1% 2,214
Belarus* 4% 15% 11% 40% 3% 14% 11% 40% 1% 0% 76,549
Belize 5% 9% 8% 18% 5% 9% 7% 16% 0% 2% 1,308
Benin 1% 4% 44% 114% 1% 4% 44% 114% 0% 0% 4,623
Bhutan 0% 0% 4% 4% . . . . 0% 4% 1,365
Bolivia 1% 4% 10% 14% 1% 4% 2% 6% 0% 8% 23,442
Bosnia and Herzegovina 0% 0% 1% 1% . . . . 0% 1% 15,408
Botswana 14% 21% 0% 1% 5% 11% 0% 1% 10% 0% 15,877
Brazil* 2% 5% 5% 11% 2% 5% 5% 11% 0% 1% 477,066
Brunei Darussalam 6% 6% 0% 0% . . . . 6% 0% 16,835
Bulgaria* 4% 5% 7% 13% 1% 2% 7% 13% 3% 0% 63,895
Burkina Faso 13% 24% 0% 0% 13% 24% 0% 0% 0% 0% 5,837
Burundi 11% 21% 2% 6% 4% 15% 2% 6% 7% 0% 892
Cabo Verde 6% 7% 18% 22% 2% 2% 18% 22% 4% 0% 769
Cambodia 0% 0% 4% 15% 0% 0% 4% 15% 0% 0% 24,300
Cameroon 0% 0% 1% 2% 0% 0% 1% 2% 0% 0% 12,753
Central African Republic 0% 0% 28% 28% . . . . 0% 28% 394
Chad 13% 24% 18% 19% 13% 24% 18% 19% . . 7,700
Chile* 3% 6% 5% 10% 2% 5% 5% 10% 0% 0% 147,763
China, P.R.: Mainland* 4% 6% 12% 20% 2% 3% 12% 20% 3% 0% 4,306,326
Colombia* 4% 9% 5% 10% 4% 9% 5% 10% 0% 0% 118,824
Comoros . . . . . . . . . . 242
Congo, Democratic Republic of 0% 0% 2% 9% 0% 0% 2% 9% 0% 0% 13,100
Appendix Table I-2. Estimated Ranges for Illicit Financial Flows, 2014 (Percent of total country trade, unless noted)
* Indicates a developing country where sufficient bilateral goods trade data is reported for GFI to make a bilateral estimation of trade misinvoicing. “.” Indicates missing data.
Note: Estimates of total trade default to the magnitude reported by that country’s trade partners; if missing, the magnitude reported by each developing country is used. Total trade is defined as the total exports plus imports for developing countries as provided by the compilers of the IMF’s Direction of Trade Statistics.

29Illicit Financial Flows to and from Developing Countries: 2005-2014
Country
Illicit Financial Flows Trade MisinvoicingBOP Leakages Total Trade
(millions of US $)
Outflows Inflows Outflows Inflows
Low High Low High Low High Low High Outflows Inflows
Congo, Republic of 5% 11% 0% 0% 5% 11% 0% 0% 0% 0% 14,814
Costa Rica* 35% 55% 2% 3% 34% 54% 2% 3% 1% 0% 28,436
Cote d'Ivoire* 3% 7% 6% 14% 3% 7% 6% 14% 0% 0% 23,879
Croatia* 4% 5% 8% 13% 2% 3% 8% 13% 2% 0% 36,196
Djibouti 5% 48% 43% 309% 2% 45% 43% 309% 3% 0% 932
Dominica 24% 57% 73% 121% 23% 56% 73% 121% 1% 0% 266
Dominican Republic 17% 23% 0% 0% 13% 19% 0% 0% 4% 0% 27,720
Ecuador* 4% 7% 4% 8% 4% 6% 4% 8% 0% 0% 53,237
Egypt* 6% 15% 11% 22% 6% 15% 9% 20% 0% 2% 94,881
El Salvador* 6% 12% 6% 9% 6% 12% 3% 6% 0% 3% 15,783
Equatorial Guinea 13% 19% 4% 4% 13% 19% 0% 0% 0% 4% 18,100
Eritrea . . . . . . . . . . 1,067
Ethiopia 8% 31% 5% 9% 8% 31% 4% 7% 0% 2% 23,460
Fiji 14% 17% 2% 5% 9% 12% 2% 5% 4% 0% 4,250
Gabon 0% 0% 8% 14% 0% 0% 8% 14% 0% 0% 12,071
Gambia, The 0% 0% 0% 0% . . . . 0% 0% 1,219
Georgia* 4% 13% 8% 28% 3% 12% 8% 28% 1% 0% 11,453
Ghana 1% 1% 4% 11% 0% 0% 4% 11% 1% 0% 27,230
Grenada 2% 19% 26% 60% 2% 19% 11% 45% 0% 15% 377
Guatemala* 7% 11% 1% 2% 5% 9% 1% 2% 2% 0% 28,932
Guinea 11% 20% 11% 47% 11% 20% 11% 47% . . 3,544
Guinea-Bissau . . . . . . . . . . 690
Guyana 9% 15% 1% 1% 9% 15% 0% 0% 0% 1% 2,940
Haiti 1% 1% 12% 30% 1% 1% 10% 28% 0% 1% 4,684
Honduras* 24% 39% 20% 36% 24% 39% 18% 34% 0% 2% 13,376
Hungary* 3% 4% 10% 14% 2% 3% 10% 14% 1% 0% 215,506
India* 1% 3% 5% 13% 1% 2% 5% 13% 0% 0% 778,246
Indonesia* 2% 4% 6% 12% 2% 3% 6% 12% 1% 0% 354,470
Iran, Islamic Republic of 0% 0% 7% 45% 0% 0% 7% 45% . . 142,369
Iraq 7% 11% 3% 6% 1% 5% 3% 6% 6% 0% 147,968
Jamaica* 6% 7% 7% 10% 2% 4% 7% 10% 3% 0% 7,272
Jordan* 2% 6% 14% 31% 2% 6% 9% 27% 0% 4% 30,182
Kazakhstan* 19% 25% 31% 47% 10% 16% 31% 47% 9% 0% 99,888
Kenya 1% 2% 11% 23% 1% 2% 7% 20% 0% 4% 23,862
Kiribati 0% 0% 22% 22% . . . . 0% 22% 100
Kosovo, Republic of 0% 0% 14% 14% . . . . 0% 14% 2,472
Kuwait 0% 0% 5% 9% 0% 0% 5% 9% 0% 0% 131,815
Kyrgyz Republic 0% 0% 11% 64% 0% 0% 5% 58% 0% 6% 7,629 Lao People’s Democratic Republic 9% 30% 8% 71% 2% 24% 8% 71% 6% 0% 5,950
Lebanon 1% 1% 3% 6% 0% 0% 3% 6% 1% 0% 23,807

30 Global Financial Integrity
Appendix Table I-2. Estimated Ranges for Illicit Financial Flows, 2014 (cont) (Percent of total country trade, unless noted)
Country
Illicit Financial Flows Trade MisinvoicingBOP Leakages Total Trade
(millions of US $)
Outflows Inflows Outflows Inflows
Low High Low High Low High Low High Outflows Inflows
Lesotho 3% 7% 1% 1% 3% 7% 0% 1% 0% 0% 3,133
Liberia 12% 25% 541% 693% 12% 25% 508% 660% 0% 33% 1,629
Libya 0% 0% 4% 5% 0% 0% 4% 5% . . 40,000
Macedonia, FYR 1% 1% 1% 2% 1% 1% 1% 2% 0% 0% 12,211
Madagascar 1% 1% 1% 2% 0% 0% 1% 2% 1% 0% 5,397
Malawi 7% 25% 4% 8% 5% 23% 4% 8% 2% 0% 4,116
Malaysia* 6% 10% 7% 13% 5% 9% 7% 13% 0% 0% 443,210
Maldives 15% 23% 0% 0% 6% 14% 0% 0% 8% 0% 2,137
Mali 7% 15% 9% 19% 4% 12% 9% 19% 3% 0% 6,056
Mauritania 1% 1% 0% 0% . . . . 1% 0% 6,515
Mauritius* 4% 9% 7% 16% 4% 9% 6% 14% 0% 1% 7,967
Mexico* 8% 9% 12% 15% 5% 7% 12% 15% 2% 0% 837,104
Moldova* 6% 14% 5% 15% 4% 13% 5% 15% 1% 0% 7,606
Mongolia 1% 1% 1% 7% 0% 0% 1% 7% 1% 0% 11,011
Montenegro 1% 3% 23% 29% 1% 3% 4% 10% 0% 19% 2,809
Morocco* 4% 6% 10% 15% 4% 6% 9% 14% 0% 2% 69,211
Mozambique 0% 1% 0% 0% 0% 1% 0% 0% 0% 0% 16,683
Myanmar 4% 39% 15% 35% 4% 39% 7% 27% 0% 8% 27,526
Namibia 6% 12% 0% 1% 4% 10% 0% 1% 2% 0% 14,148
Nepal 0% 0% 3% 16% 0% 0% 1% 14% 0% 2% 8,266
Nicaragua* 10% 16% 4% 14% 6% 12% 4% 14% 4% 0% 10,718
Niger 2% 4% 11% 18% 2% 4% 11% 18% . . 3,750
Nigeria 9% 9% 3% 8% 0% 0% 3% 8% 9% 0% 139,612
Oman* 4% 12% 4% 12% 3% 11% 4% 12% 2% 0% 82,526
Pakistan 0% 0% 4% 16% 0% 0% 4% 16% 0% 0% 72,140
Panama* 12% 20% 193% 422% 9% 16% 193% 422% 4% 0% 14,403
Papua New Guinea 2% 4% 5% 5% 2% 4% 0% 0% 0% 5% 15,865
Paraguay* 4% 14% 8% 38% 3% 13% 8% 38% 2% 0% 22,082
Peru* 4% 7% 4% 8% 3% 6% 4% 8% 1% 0% 84,965
Philippines* 5% 6% 18% 31% 2% 3% 18% 31% 3% 0% 132,772
Poland* 2% 2% 13% 17% 0% 1% 13% 17% 2% 0% 443,606
Qatar* 20% 36% 9% 17% 20% 36% 9% 17% . . 130,945
Romania* 1% 2% 8% 13% 1% 2% 8% 13% 0% 0% 147,460
Russian Federation* 7% 12% 16% 26% 7% 12% 15% 25% 0% 1% 783,458
Rwanda 2% 9% 4% 13% 2% 9% 3% 12% 0% 1% 2,370
Samoa 7% 7% 0% 0% . . . . 7% 0% 553
Sao Tome and Principe 18% 22% 49% 49% 18% 22% 1% 1% 0% 48% 189
Saudi Arabia 0% 0% 2% 4% 0% 0% 2% 4% . . 516,133

31Illicit Financial Flows to and from Developing Countries: 2005-2014
Country
Illicit Financial Flows Trade MisinvoicingBOP Leakages Total Trade
(millions of US $)
Outflows Inflows Outflows Inflows
Low High Low High Low High Low High Outflows Inflows
Senegal* 4% 9% 19% 40% 4% 9% 19% 40% 0% 0% 8,622
Serbia, Republic of 2% 5% 5% 8% 2% 5% 4% 7% 0% 1% 35,260
Seychelles 1% 2% 7% 8% 1% 2% 2% 3% 0% 5% 1,683
Sierra Leone 5% 22% 1% 1% 5% 22% 0% 0% 0% 1% 3,120
Solomon Islands 7% 22% 0% 0% 5% 21% 0% 0% 1% 0% 957
Somalia 0% 0% 0% 0% . . . . 0% 0% 2,837
South Africa 4% 11% 3% 3% 4% 11% 0% 1% 0% 2% 200,538
Sri Lanka* 1% 3% 8% 18% 1% 3% 7% 17% 0% 1% 30,110
St. Kitts and Nevis 12% 23% 73% 118% 12% 23% 73% 118% 0% 0% 320
St. Lucia 0% 0% 88% 289% 0% 0% 86% 287% 0% 2% 725
St. Vincent and the Grenadines 3% 15% 28% 54% 2% 14% 28% 54% 1% 0% 420
Sudan* 4% 52% 13% 26% 4% 52% 3% 15% 0% 11% 13,562
Suriname 13% 15% 0% 0% 3% 4% 0% 0% 10% 0% 4,095
Swaziland 0% 0% 2% 2% . . . . 0% 2% 4,051
Syrian Arab Republic . . . . . . . . . . 31,495
Tajikistan 4% 4% 0% 1% 0% 0% 0% 1% 4% 0% 6,170
Tanzania 0% 0% 7% 25% 0% 0% 5% 23% 0% 2% 17,044
Thailand* 2% 4% 5% 10% 2% 4% 5% 10% 0% 0% 453,190
Timor-Leste, Democratic Republic of 9% 9% 0% 0% . . . . 9% 0% 1,022
Togo* 2% 12% 26% 45% 2% 12% 26% 45% 0% 0% 14,872
Tonga 0% 0% 5% 11% 0% 0% 5% 11% . . 236
Trinidad and Tobago 25% 45% 0% 0% 18% 38% 0% 0% 7% 0% 20,350
Tunisia 0% 0% 4% 6% 0% 0% 4% 6% 0% 0% 41,583
Turkey* 1% 3% 6% 13% 1% 3% 6% 13% 0% 0% 399,787
Turkmenistan . . . . . . . . . . 22,194
Uganda 1% 6% 10% 17% 1% 6% 3% 11% 0% 7% 7,751
Ukraine* 3% 10% 3% 10% 3% 10% 3% 9% 0% 0% 108,293
United Arab Emirates 0% 0% 9% 23% 0% 0% 9% 23% . . 621,000
Uruguay 2% 7% 5% 18% 1% 7% 5% 18% 0% 0% 20,616
Uzbekistan . . . . . . . . . . 20,956
Vanuatu 24% 44% 46% 123% 14% 33% 46% 123% 11% 0% 363
Venezuela, Republica Bolivariana de* 5% 8% 5% 12% 2% 5% 5% 12% 3% 0% 126,972
Vietnam* 4% 4% 9% 17% 1% 2% 9% 17% 2% 0% 287,597
Yemen, Republic of 0% 0% 2% 2% . . . . 0% 2% 24,301
Zambia 2% 10% 10% 18% 2% 10% 10% 18% 0% 0% 19,400
Zimbabwe 1% 1% 4% 18% 0% 0% 4% 18% 1% 0% 7,638
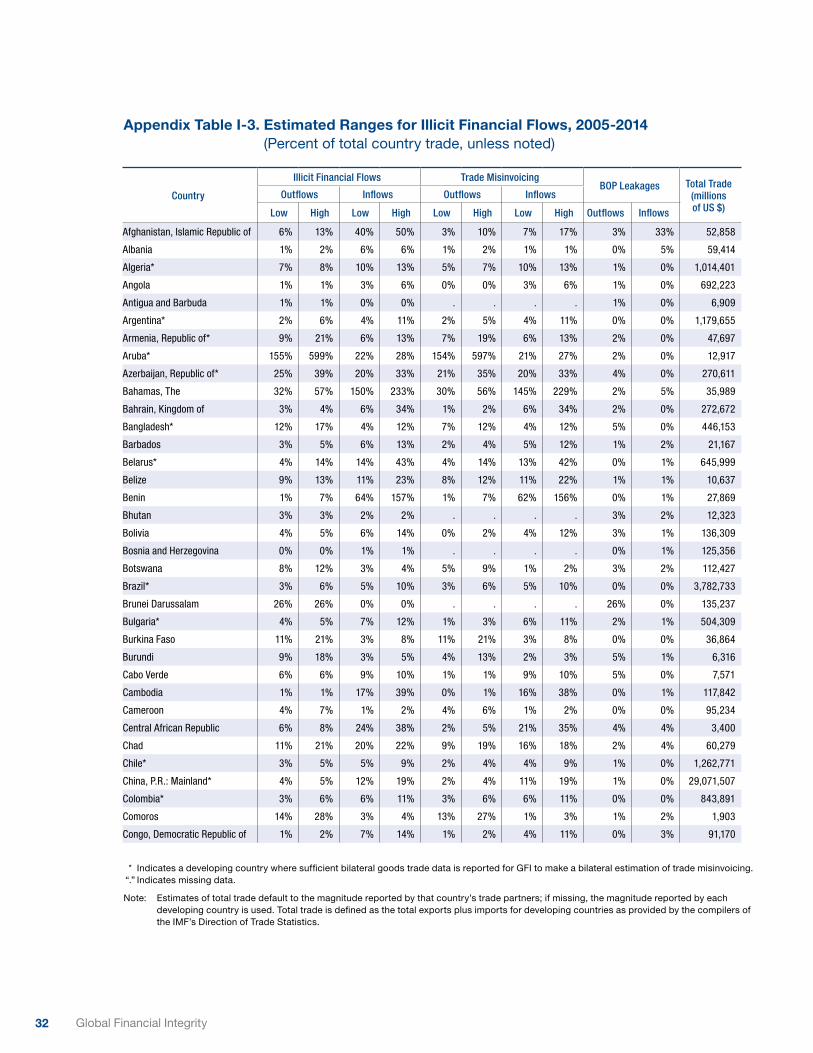
32 Global Financial Integrity
Appendix Table I-3. Estimated Ranges for Illicit Financial Flows, 2005-2014 (Percent of total country trade, unless noted)
* Indicates a developing country where sufficient bilateral goods trade data is reported for GFI to make a bilateral estimation of trade misinvoicing. “.” Indicates missing data.
Note: Estimates of total trade default to the magnitude reported by that country’s trade partners; if missing, the magnitude reported by each developing country is used. Total trade is defined as the total exports plus imports for developing countries as provided by the compilers of the IMF’s Direction of Trade Statistics.
Country
Illicit Financial Flows Trade MisinvoicingBOP Leakages Total Trade
(millions of US $)
Outflows Inflows Outflows Inflows
Low High Low High Low High Low High Outflows Inflows
Afghanistan, Islamic Republic of 6% 13% 40% 50% 3% 10% 7% 17% 3% 33% 52,858
Albania 1% 2% 6% 6% 1% 2% 1% 1% 0% 5% 59,414
Algeria* 7% 8% 10% 13% 5% 7% 10% 13% 1% 0% 1,014,401
Angola 1% 1% 3% 6% 0% 0% 3% 6% 1% 0% 692,223
Antigua and Barbuda 1% 1% 0% 0% . . . . 1% 0% 6,909
Argentina* 2% 6% 4% 11% 2% 5% 4% 11% 0% 0% 1,179,655
Armenia, Republic of* 9% 21% 6% 13% 7% 19% 6% 13% 2% 0% 47,697
Aruba* 155% 599% 22% 28% 154% 597% 21% 27% 2% 0% 12,917
Azerbaijan, Republic of* 25% 39% 20% 33% 21% 35% 20% 33% 4% 0% 270,611
Bahamas, The 32% 57% 150% 233% 30% 56% 145% 229% 2% 5% 35,989
Bahrain, Kingdom of 3% 4% 6% 34% 1% 2% 6% 34% 2% 0% 272,672
Bangladesh* 12% 17% 4% 12% 7% 12% 4% 12% 5% 0% 446,153
Barbados 3% 5% 6% 13% 2% 4% 5% 12% 1% 2% 21,167
Belarus* 4% 14% 14% 43% 4% 14% 13% 42% 0% 1% 645,999
Belize 9% 13% 11% 23% 8% 12% 11% 22% 1% 1% 10,637
Benin 1% 7% 64% 157% 1% 7% 62% 156% 0% 1% 27,869
Bhutan 3% 3% 2% 2% . . . . 3% 2% 12,323
Bolivia 4% 5% 6% 14% 0% 2% 4% 12% 3% 1% 136,309
Bosnia and Herzegovina 0% 0% 1% 1% . . . . 0% 1% 125,356
Botswana 8% 12% 3% 4% 5% 9% 1% 2% 3% 2% 112,427
Brazil* 3% 6% 5% 10% 3% 6% 5% 10% 0% 0% 3,782,733
Brunei Darussalam 26% 26% 0% 0% . . . . 26% 0% 135,237
Bulgaria* 4% 5% 7% 12% 1% 3% 6% 11% 2% 1% 504,309
Burkina Faso 11% 21% 3% 8% 11% 21% 3% 8% 0% 0% 36,864
Burundi 9% 18% 3% 5% 4% 13% 2% 3% 5% 1% 6,316
Cabo Verde 6% 6% 9% 10% 1% 1% 9% 10% 5% 0% 7,571
Cambodia 1% 1% 17% 39% 0% 1% 16% 38% 0% 1% 117,842
Cameroon 4% 7% 1% 2% 4% 6% 1% 2% 0% 0% 95,234
Central African Republic 6% 8% 24% 38% 2% 5% 21% 35% 4% 4% 3,400
Chad 11% 21% 20% 22% 9% 19% 16% 18% 2% 4% 60,279
Chile* 3% 5% 5% 9% 2% 4% 4% 9% 1% 0% 1,262,771
China, P.R.: Mainland* 4% 5% 12% 19% 2% 4% 11% 19% 1% 0% 29,071,507
Colombia* 3% 6% 6% 11% 3% 6% 6% 11% 0% 0% 843,891
Comoros 14% 28% 3% 4% 13% 27% 1% 3% 1% 2% 1,903
Congo, Democratic Republic of 1% 2% 7% 14% 1% 2% 4% 11% 0% 3% 91,170
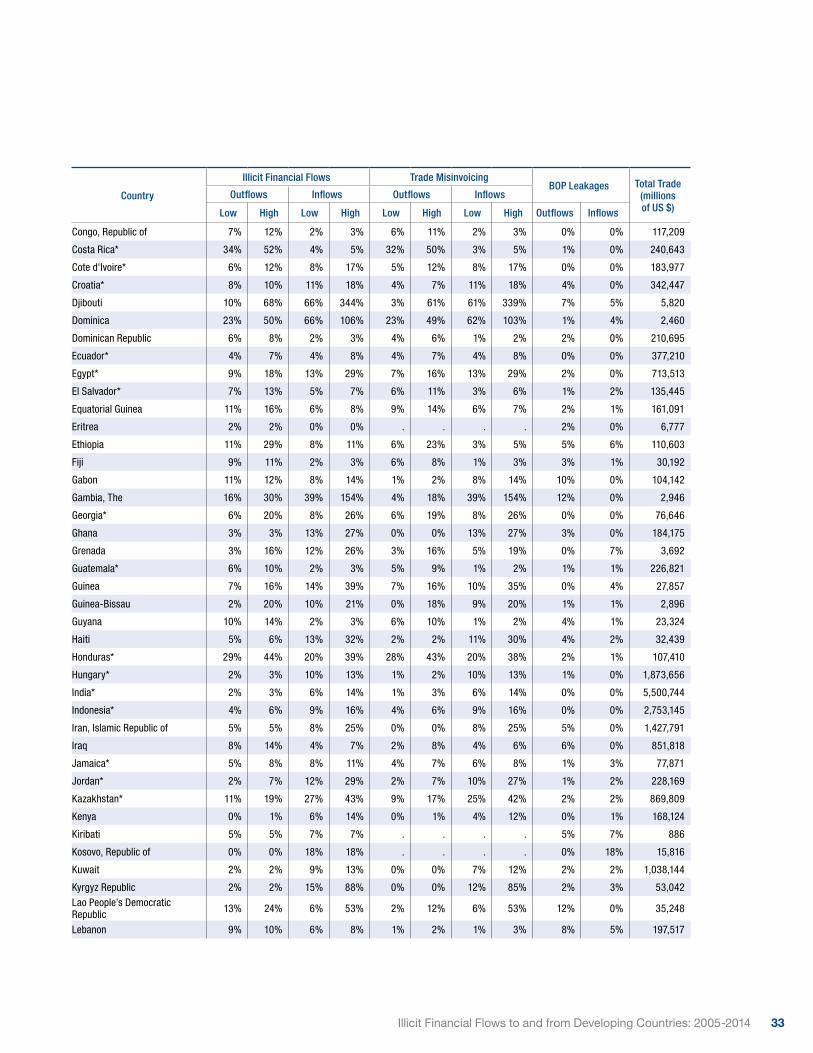
33Illicit Financial Flows to and from Developing Countries: 2005-2014
Country
Illicit Financial Flows Trade MisinvoicingBOP Leakages Total Trade
(millions of US $)
Outflows Inflows Outflows Inflows
Low High Low High Low High Low High Outflows Inflows
Congo, Republic of 7% 12% 2% 3% 6% 11% 2% 3% 0% 0% 117,209
Costa Rica* 34% 52% 4% 5% 32% 50% 3% 5% 1% 0% 240,643
Cote d'Ivoire* 6% 12% 8% 17% 5% 12% 8% 17% 0% 0% 183,977
Croatia* 8% 10% 11% 18% 4% 7% 11% 18% 4% 0% 342,447
Djibouti 10% 68% 66% 344% 3% 61% 61% 339% 7% 5% 5,820
Dominica 23% 50% 66% 106% 23% 49% 62% 103% 1% 4% 2,460
Dominican Republic 6% 8% 2% 3% 4% 6% 1% 2% 2% 0% 210,695
Ecuador* 4% 7% 4% 8% 4% 7% 4% 8% 0% 0% 377,210
Egypt* 9% 18% 13% 29% 7% 16% 13% 29% 2% 0% 713,513
El Salvador* 7% 13% 5% 7% 6% 11% 3% 6% 1% 2% 135,445
Equatorial Guinea 11% 16% 6% 8% 9% 14% 6% 7% 2% 1% 161,091
Eritrea 2% 2% 0% 0% . . . . 2% 0% 6,777
Ethiopia 11% 29% 8% 11% 6% 23% 3% 5% 5% 6% 110,603
Fiji 9% 11% 2% 3% 6% 8% 1% 3% 3% 1% 30,192
Gabon 11% 12% 8% 14% 1% 2% 8% 14% 10% 0% 104,142
Gambia, The 16% 30% 39% 154% 4% 18% 39% 154% 12% 0% 2,946
Georgia* 6% 20% 8% 26% 6% 19% 8% 26% 0% 0% 76,646
Ghana 3% 3% 13% 27% 0% 0% 13% 27% 3% 0% 184,175
Grenada 3% 16% 12% 26% 3% 16% 5% 19% 0% 7% 3,692
Guatemala* 6% 10% 2% 3% 5% 9% 1% 2% 1% 1% 226,821
Guinea 7% 16% 14% 39% 7% 16% 10% 35% 0% 4% 27,857
Guinea-Bissau 2% 20% 10% 21% 0% 18% 9% 20% 1% 1% 2,896
Guyana 10% 14% 2% 3% 6% 10% 1% 2% 4% 1% 23,324
Haiti 5% 6% 13% 32% 2% 2% 11% 30% 4% 2% 32,439
Honduras* 29% 44% 20% 39% 28% 43% 20% 38% 2% 1% 107,410
Hungary* 2% 3% 10% 13% 1% 2% 10% 13% 1% 0% 1,873,656
India* 2% 3% 6% 14% 1% 3% 6% 14% 0% 0% 5,500,744
Indonesia* 4% 6% 9% 16% 4% 6% 9% 16% 0% 0% 2,753,145
Iran, Islamic Republic of 5% 5% 8% 25% 0% 0% 8% 25% 5% 0% 1,427,791
Iraq 8% 14% 4% 7% 2% 8% 4% 6% 6% 0% 851,818
Jamaica* 5% 8% 8% 11% 4% 7% 6% 8% 1% 3% 77,871
Jordan* 2% 7% 12% 29% 2% 7% 10% 27% 1% 2% 228,169
Kazakhstan* 11% 19% 27% 43% 9% 17% 25% 42% 2% 2% 869,809
Kenya 0% 1% 6% 14% 0% 1% 4% 12% 0% 1% 168,124
Kiribati 5% 5% 7% 7% . . . . 5% 7% 886
Kosovo, Republic of 0% 0% 18% 18% . . . . 0% 18% 15,816
Kuwait 2% 2% 9% 13% 0% 0% 7% 12% 2% 2% 1,038,144
Kyrgyz Republic 2% 2% 15% 88% 0% 0% 12% 85% 2% 3% 53,042 Lao People’s Democratic Republic 13% 24% 6% 53% 2% 12% 6% 53% 12% 0% 35,248
Lebanon 9% 10% 6% 8% 1% 2% 1% 3% 8% 5% 197,517

34 Global Financial Integrity
Appendix Table I-3. Estimated Ranges for Illicit Financial Flows, 2005-2014 (cont) (Percent of total country trade, unless noted)
Country
Illicit Financial Flows Trade MisinvoicingBOP Leakages Total Trade
(millions of US $)
Outflows Inflows Outflows Inflows
Low High Low High Low High Low High Outflows Inflows
Lesotho 4% 7% 2% 3% 4% 6% 1% 1% 1% 2% 26,272
Liberia 66% 100% 783% 1051% 50% 84% 771% 1040% 16% 12% 10,549
Libya 2% 2% 10% 14% 0% 0% 8% 12% 2% 1% 531,383
Macedonia, FYR 3% 5% 2% 4% 3% 5% 2% 4% 0% 0% 91,801
Madagascar 5% 10% 2% 4% 2% 8% 2% 3% 2% 0% 42,562
Malawi 7% 24% 4% 7% 5% 22% 2% 5% 2% 2% 30,455
Malaysia* 8% 12% 8% 13% 6% 10% 8% 13% 2% 0% 3,587,978
Maldives 6% 10% 6% 7% 4% 8% 1% 1% 2% 6% 14,159
Mali 4% 11% 11% 30% 3% 10% 11% 30% 1% 0% 48,121
Mauritania 1% 1% 1% 1% . . . . 1% 1% 46,965
Mauritius* 5% 9% 10% 18% 4% 9% 7% 15% 1% 3% 65,692
Mexico* 7% 9% 9% 11% 6% 7% 9% 11% 2% 0% 6,470,686
Moldova* 5% 16% 7% 18% 5% 15% 5% 17% 0% 1% 58,919
Mongolia 2% 2% 3% 11% 0% 0% 3% 11% 2% 0% 69,268
Montenegro 5% 6% 11% 13% 4% 5% 3% 6% 1% 7% 28,543
Morocco* 6% 8% 9% 15% 5% 7% 9% 14% 1% 0% 532,212
Mozambique 2% 3% 3% 7% 1% 3% 3% 7% 0% 0% 86,657
Myanmar 7% 14% 15% 42% 1% 7% 9% 36% 6% 5% 144,916
Namibia 6% 11% 3% 3% 5% 9% 1% 2% 2% 2% 107,679
Nepal 2% 10% 3% 10% 1% 9% 1% 8% 1% 2% 52,596
Nicaragua* 26% 47% 7% 21% 22% 43% 6% 20% 4% 0% 63,918
Niger 3% 6% 15% 20% 2% 5% 8% 12% 1% 8% 25,488
Nigeria 14% 15% 4% 7% 1% 2% 4% 7% 13% 0% 1,213,949
Oman* 3% 9% 4% 11% 3% 8% 4% 10% 1% 0% 587,430
Pakistan 1% 1% 4% 13% 0% 0% 4% 13% 1% 0% 589,547
Panama* 16% 23% 288% 667% 15% 22% 285% 665% 1% 2% 99,968
Papua New Guinea 4% 7% 12% 15% 3% 5% 9% 12% 2% 4% 79,749
Paraguay* 5% 24% 11% 52% 4% 23% 10% 51% 1% 1% 154,093
Peru* 4% 7% 7% 12% 3% 6% 7% 12% 1% 0% 655,481
Philippines* 7% 8% 14% 23% 5% 6% 14% 23% 2% 0% 1,088,202
Poland* 2% 2% 12% 16% 0% 0% 12% 16% 2% 0% 3,380,489
Qatar* 15% 25% 8% 13% 15% 25% 8% 13% . . 908,091
Romania* 2% 2% 8% 13% 1% 2% 8% 12% 0% 1% 1,158,071
Russian Federation* 10% 17% 16% 28% 9% 16% 16% 28% 1% 0% 6,334,767
Rwanda 6% 16% 3% 9% 5% 16% 2% 8% 1% 1% 15,818
Samoa 29% 48% 23% 37% 23% 43% 23% 37% 5% 0% 3,141
Sao Tome and Principe 19% 22% 14% 15% 11% 13% 3% 4% 8% 11% 1,215
Saudi Arabia 0% 0% 4% 6% 0% 0% 4% 6% . . 3,993,554
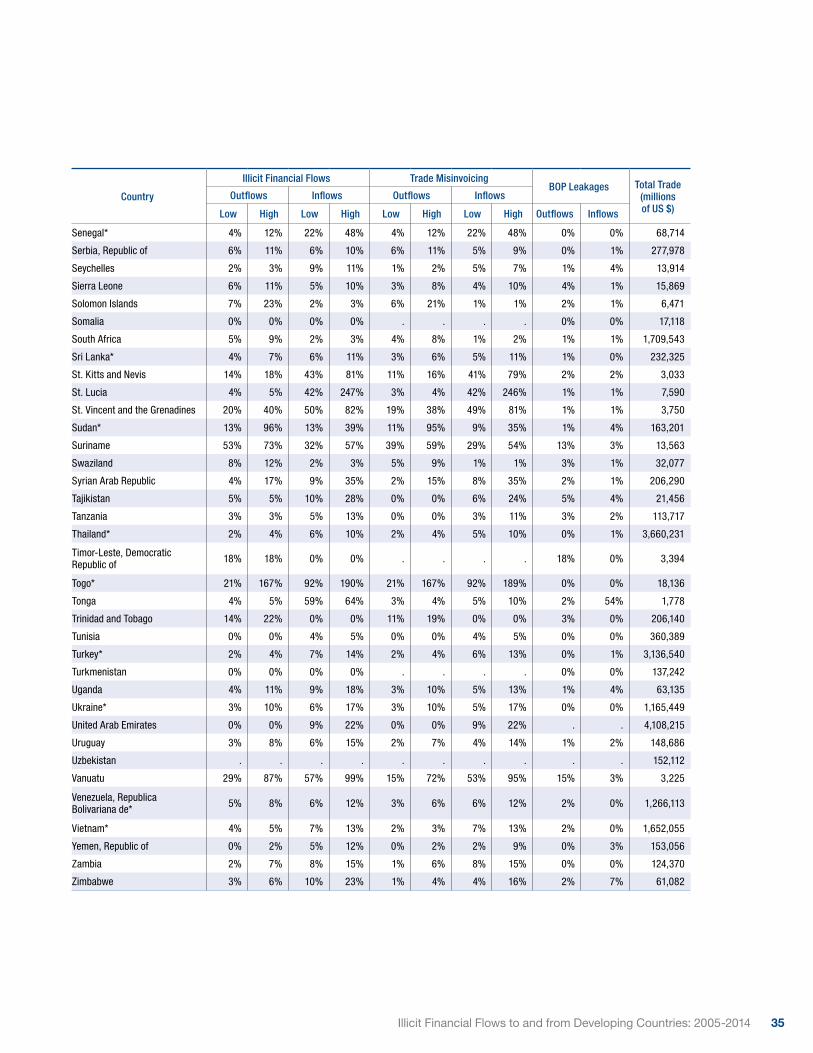
35Illicit Financial Flows to and from Developing Countries: 2005-2014
Country
Illicit Financial Flows Trade MisinvoicingBOP Leakages Total Trade
(millions of US $)
Outflows Inflows Outflows Inflows
Low High Low High Low High Low High Outflows Inflows
Senegal* 4% 12% 22% 48% 4% 12% 22% 48% 0% 0% 68,714
Serbia, Republic of 6% 11% 6% 10% 6% 11% 5% 9% 0% 1% 277,978
Seychelles 2% 3% 9% 11% 1% 2% 5% 7% 1% 4% 13,914
Sierra Leone 6% 11% 5% 10% 3% 8% 4% 10% 4% 1% 15,869
Solomon Islands 7% 23% 2% 3% 6% 21% 1% 1% 2% 1% 6,471
Somalia 0% 0% 0% 0% . . . . 0% 0% 17,118
South Africa 5% 9% 2% 3% 4% 8% 1% 2% 1% 1% 1,709,543
Sri Lanka* 4% 7% 6% 11% 3% 6% 5% 11% 1% 0% 232,325
St. Kitts and Nevis 14% 18% 43% 81% 11% 16% 41% 79% 2% 2% 3,033
St. Lucia 4% 5% 42% 247% 3% 4% 42% 246% 1% 1% 7,590
St. Vincent and the Grenadines 20% 40% 50% 82% 19% 38% 49% 81% 1% 1% 3,750
Sudan* 13% 96% 13% 39% 11% 95% 9% 35% 1% 4% 163,201
Suriname 53% 73% 32% 57% 39% 59% 29% 54% 13% 3% 13,563
Swaziland 8% 12% 2% 3% 5% 9% 1% 1% 3% 1% 32,077
Syrian Arab Republic 4% 17% 9% 35% 2% 15% 8% 35% 2% 1% 206,290
Tajikistan 5% 5% 10% 28% 0% 0% 6% 24% 5% 4% 21,456
Tanzania 3% 3% 5% 13% 0% 0% 3% 11% 3% 2% 113,717
Thailand* 2% 4% 6% 10% 2% 4% 5% 10% 0% 1% 3,660,231
Timor-Leste, Democratic Republic of 18% 18% 0% 0% . . . . 18% 0% 3,394
Togo* 21% 167% 92% 190% 21% 167% 92% 189% 0% 0% 18,136
Tonga 4% 5% 59% 64% 3% 4% 5% 10% 2% 54% 1,778
Trinidad and Tobago 14% 22% 0% 0% 11% 19% 0% 0% 3% 0% 206,140
Tunisia 0% 0% 4% 5% 0% 0% 4% 5% 0% 0% 360,389
Turkey* 2% 4% 7% 14% 2% 4% 6% 13% 0% 1% 3,136,540
Turkmenistan 0% 0% 0% 0% . . . . 0% 0% 137,242
Uganda 4% 11% 9% 18% 3% 10% 5% 13% 1% 4% 63,135
Ukraine* 3% 10% 6% 17% 3% 10% 5% 17% 0% 0% 1,165,449
United Arab Emirates 0% 0% 9% 22% 0% 0% 9% 22% . . 4,108,215
Uruguay 3% 8% 6% 15% 2% 7% 4% 14% 1% 2% 148,686
Uzbekistan . . . . . . . . . . 152,112
Vanuatu 29% 87% 57% 99% 15% 72% 53% 95% 15% 3% 3,225
Venezuela, Republica Bolivariana de* 5% 8% 6% 12% 3% 6% 6% 12% 2% 0% 1,266,113
Vietnam* 4% 5% 7% 13% 2% 3% 7% 13% 2% 0% 1,652,055
Yemen, Republic of 0% 2% 5% 12% 0% 2% 2% 9% 0% 3% 153,056
Zambia 2% 7% 8% 15% 1% 6% 8% 15% 0% 0% 124,370
Zimbabwe 3% 6% 10% 23% 1% 4% 4% 16% 2% 7% 61,082
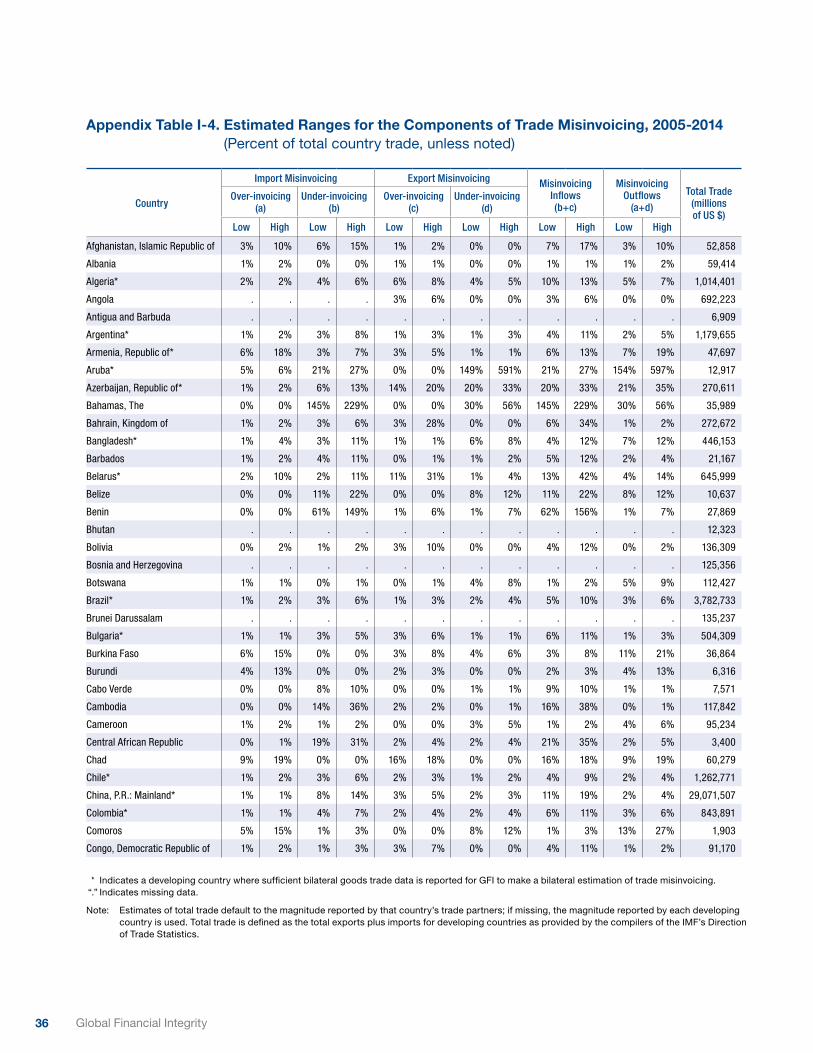
36 Global Financial Integrity
Appendix Table I-4. Estimated Ranges for the Components of Trade Misinvoicing, 2005-2014 (Percent of total country trade, unless noted)
Country
Import Misinvoicing Export Misinvoicing Misinvoicing Inflows (b+c)
Misinvoicing Outflows
(a+d)
Total Trade (millions of US $)
Over-invoicing (a)
Under-invoicing (b)
Over-invoicing (c)
Under-invoicing (d)
Low High Low High Low High Low High Low High Low High
Afghanistan, Islamic Republic of 3% 10% 6% 15% 1% 2% 0% 0% 7% 17% 3% 10% 52,858
Albania 1% 2% 0% 0% 1% 1% 0% 0% 1% 1% 1% 2% 59,414
Algeria* 2% 2% 4% 6% 6% 8% 4% 5% 10% 13% 5% 7% 1,014,401
Angola . . . . 3% 6% 0% 0% 3% 6% 0% 0% 692,223
Antigua and Barbuda . . . . . . . . . . . . 6,909
Argentina* 1% 2% 3% 8% 1% 3% 1% 3% 4% 11% 2% 5% 1,179,655
Armenia, Republic of* 6% 18% 3% 7% 3% 5% 1% 1% 6% 13% 7% 19% 47,697
Aruba* 5% 6% 21% 27% 0% 0% 149% 591% 21% 27% 154% 597% 12,917
Azerbaijan, Republic of* 1% 2% 6% 13% 14% 20% 20% 33% 20% 33% 21% 35% 270,611
Bahamas, The 0% 0% 145% 229% 0% 0% 30% 56% 145% 229% 30% 56% 35,989
Bahrain, Kingdom of 1% 2% 3% 6% 3% 28% 0% 0% 6% 34% 1% 2% 272,672
Bangladesh* 1% 4% 3% 11% 1% 1% 6% 8% 4% 12% 7% 12% 446,153
Barbados 1% 2% 4% 11% 0% 1% 1% 2% 5% 12% 2% 4% 21,167
Belarus* 2% 10% 2% 11% 11% 31% 1% 4% 13% 42% 4% 14% 645,999
Belize 0% 0% 11% 22% 0% 0% 8% 12% 11% 22% 8% 12% 10,637
Benin 0% 0% 61% 149% 1% 6% 1% 7% 62% 156% 1% 7% 27,869
Bhutan . . . . . . . . . . . . 12,323
Bolivia 0% 2% 1% 2% 3% 10% 0% 0% 4% 12% 0% 2% 136,309
Bosnia and Herzegovina . . . . . . . . . . . . 125,356
Botswana 1% 1% 0% 1% 0% 1% 4% 8% 1% 2% 5% 9% 112,427
Brazil* 1% 2% 3% 6% 1% 3% 2% 4% 5% 10% 3% 6% 3,782,733
Brunei Darussalam . . . . . . . . . . . . 135,237
Bulgaria* 1% 1% 3% 5% 3% 6% 1% 1% 6% 11% 1% 3% 504,309
Burkina Faso 6% 15% 0% 0% 3% 8% 4% 6% 3% 8% 11% 21% 36,864
Burundi 4% 13% 0% 0% 2% 3% 0% 0% 2% 3% 4% 13% 6,316
Cabo Verde 0% 0% 8% 10% 0% 0% 1% 1% 9% 10% 1% 1% 7,571
Cambodia 0% 0% 14% 36% 2% 2% 0% 1% 16% 38% 0% 1% 117,842
Cameroon 1% 2% 1% 2% 0% 0% 3% 5% 1% 2% 4% 6% 95,234
Central African Republic 0% 1% 19% 31% 2% 4% 2% 4% 21% 35% 2% 5% 3,400
Chad 9% 19% 0% 0% 16% 18% 0% 0% 16% 18% 9% 19% 60,279
Chile* 1% 2% 3% 6% 2% 3% 1% 2% 4% 9% 2% 4% 1,262,771
China, P.R.: Mainland* 1% 1% 8% 14% 3% 5% 2% 3% 11% 19% 2% 4% 29,071,507
Colombia* 1% 1% 4% 7% 2% 4% 2% 4% 6% 11% 3% 6% 843,891
Comoros 5% 15% 1% 3% 0% 0% 8% 12% 1% 3% 13% 27% 1,903
Congo, Democratic Republic of 1% 2% 1% 3% 3% 7% 0% 0% 4% 11% 1% 2% 91,170
* Indicates a developing country where sufficient bilateral goods trade data is reported for GFI to make a bilateral estimation of trade misinvoicing. “.” Indicates missing data.
Note: Estimates of total trade default to the magnitude reported by that country’s trade partners; if missing, the magnitude reported by each developing country is used. Total trade is defined as the total exports plus imports for developing countries as provided by the compilers of the IMF’s Direction of Trade Statistics.

37Illicit Financial Flows to and from Developing Countries: 2005-2014
Country
Import Misinvoicing Export Misinvoicing Misinvoicing Inflows (b+c)
Misinvoicing Outflows
(a+d)
Total Trade (millions of US $)
Over-invoicing (a)
Under-invoicing (b)
Over-invoicing (c)
Under-invoicing (d)
Low High Low High Low High Low High Low High Low High
Congo, Republic of 1% 3% 1% 2% 0% 1% 5% 9% 2% 3% 6% 11% 117,209
Costa Rica* 3% 4% 2% 3% 1% 2% 30% 46% 3% 5% 32% 50% 240,643
Cote d'Ivoire* 3% 7% 2% 7% 6% 10% 3% 5% 8% 17% 5% 12% 183,977
Croatia* 3% 5% 7% 11% 4% 7% 1% 2% 11% 18% 4% 7% 342,447
Djibouti 0% 0% 61% 339% 0% 0% 3% 61% 61% 339% 3% 61% 5,820
Dominica 0% 0% 62% 103% 0% 0% 23% 49% 62% 103% 23% 49% 2,460
Dominican Republic 2% 4% 0% 0% 1% 2% 2% 3% 1% 2% 4% 6% 210,695
Ecuador* 1% 2% 2% 5% 2% 3% 3% 5% 4% 8% 4% 7% 377,210
Egypt* 1% 2% 12% 27% 1% 2% 6% 14% 13% 29% 7% 16% 713,513
El Salvador* 5% 9% 2% 3% 1% 2% 1% 2% 3% 6% 6% 11% 135,445
Equatorial Guinea 9% 14% 0% 0% 6% 7% 0% 0% 6% 7% 9% 14% 161,091
Eritrea . . . . . . . . . . . . 6,777
Ethiopia 6% 23% 0% 0% 3% 5% 0% 0% 3% 5% 6% 23% 110,603
Fiji 6% 7% 0% 0% 1% 3% 0% 1% 1% 3% 6% 8% 30,192
Gabon 0% 0% 2% 3% 6% 11% 1% 1% 8% 14% 1% 2% 104,142
Gambia, The 0% 0% 39% 154% 0% 0% 4% 18% 39% 154% 4% 18% 2,946
Georgia* 1% 4% 8% 24% 1% 2% 4% 15% 8% 26% 6% 19% 76,646
Ghana 0% 0% 6% 15% 7% 12% 0% 0% 13% 27% 0% 0% 184,175
Grenada 0% 0% 5% 19% 0% 0% 3% 16% 5% 19% 3% 16% 3,692
Guatemala* 3% 5% 1% 1% 0% 1% 2% 4% 1% 2% 5% 9% 226,821
Guinea 0% 0% 10% 35% 0% 0% 7% 16% 10% 35% 7% 16% 27,857
Guinea-Bissau 0% 0% 9% 20% 0% 0% 0% 18% 9% 20% 0% 18% 2,896
Guyana 1% 3% 1% 2% 0% 0% 5% 8% 1% 2% 6% 10% 23,324
Haiti 0% 0% 11% 30% 0% 0% 2% 2% 11% 30% 2% 2% 32,439
Honduras* 1% 1% 19% 37% 0% 1% 27% 42% 20% 38% 28% 43% 107,410
Hungary* 1% 1% 4% 5% 6% 8% 1% 1% 10% 13% 1% 2% 1,873,656
India* 0% 1% 4% 10% 2% 4% 1% 2% 6% 14% 1% 3% 5,500,744
Indonesia* 1% 1% 8% 15% 1% 1% 3% 4% 9% 16% 4% 6% 2,753,145
Iran, Islamic Republic of 0% 0% 4% 14% 4% 11% 0% 0% 8% 25% 0% 0% 1,427,791
Iraq 2% 8% 0% 0% 4% 6% 0% 0% 4% 6% 2% 8% 851,818
Jamaica* 3% 5% 2% 3% 4% 5% 2% 2% 6% 8% 4% 7% 77,871
Jordan* 1% 2% 9% 26% 0% 2% 1% 5% 10% 27% 2% 7% 228,169
Kazakhstan* 2% 5% 2% 4% 24% 38% 7% 11% 25% 42% 9% 17% 869,809
Kenya 0% 0% 4% 11% 0% 1% 0% 1% 4% 12% 0% 1% 168,124
Kiribati . . . . . . . . . . . . 886
Kosovo, Republic of . . . . . . . . . . . . 15,816
Kuwait 0% 0% 0% 0% 7% 11% 0% 0% 7% 12% 0% 0% 1,038,144
Kyrgyz Republic 0% 0% 10% 77% 1% 8% 0% 0% 12% 85% 0% 0% 53,042 Lao People’s Democratic Republic 0% 0% 6% 53% 0% 0% 2% 12% 6% 53% 2% 12% 35,248
Lebanon 1% 2% 1% 2% 0% 2% 0% 0% 1% 3% 1% 2% 197,517

38 Global Financial Integrity
Appendix Table I-4. Estimated Ranges for the Components of Trade Misinvoicing, 2005-2014 (cont) (Percent of total country trade, unless noted)
Country
Import Misinvoicing Export Misinvoicing Misinvoicing Inflows (b+c)
Misinvoicing Outflows
(a+d)
Total Trade (millions of US $)
Over-invoicing (a)
Under-invoicing (b)
Over-invoicing (c)
Under-invoicing (d)
Low High Low High Low High Low High Low High Low High
Lesotho 1% 2% 0% 1% 0% 0% 3% 5% 1% 1% 4% 6% 26,272
Liberia 0% 0% 771% 1040% 0% 0% 50% 84% 771% 1040% 50% 84% 10,549
Libya 0% 0% 5% 8% 3% 4% 0% 0% 8% 12% 0% 0% 531,383
Macedonia, FYR 2% 5% 0% 0% 2% 4% 0% 0% 2% 4% 3% 5% 91,801
Madagascar 2% 6% 1% 2% 1% 1% 1% 1% 2% 3% 2% 8% 42,562
Malawi 5% 22% 0% 0% 2% 5% 0% 0% 2% 5% 5% 22% 30,455
Malaysia* 2% 3% 7% 12% 1% 1% 4% 7% 8% 13% 6% 10% 3,587,978
Maldives 2% 5% 1% 1% 0% 0% 2% 3% 1% 1% 4% 8% 14,159
Mali 3% 10% 0% 0% 11% 30% 0% 0% 11% 30% 3% 10% 48,121
Mauritania . . . . . . . . . . . . 46,965
Mauritius* 3% 7% 4% 11% 3% 4% 2% 2% 7% 15% 4% 9% 65,692
Mexico* 3% 4% 3% 5% 5% 6% 3% 3% 9% 11% 6% 7% 6,470,686
Moldova* 2% 8% 4% 13% 1% 4% 2% 8% 5% 17% 5% 15% 58,919
Mongolia 0% 0% 2% 6% 1% 5% 0% 0% 3% 11% 0% 0% 69,268
Montenegro 3% 4% 2% 4% 2% 3% 0% 1% 3% 6% 4% 5% 28,543
Morocco* 2% 3% 6% 11% 3% 4% 3% 4% 9% 14% 5% 7% 532,212
Mozambique 0% 1% 2% 5% 1% 2% 1% 2% 3% 7% 1% 3% 86,657
Myanmar 0% 0% 8% 28% 1% 8% 1% 7% 9% 36% 1% 7% 144,916
Namibia 1% 1% 0% 1% 0% 1% 4% 8% 1% 2% 5% 9% 107,679
Nepal 1% 9% 0% 6% 1% 2% 0% 0% 1% 8% 1% 9% 52,596
Nicaragua* 2% 5% 6% 20% 0% 0% 21% 37% 6% 20% 22% 43% 63,918
Niger 2% 5% 0% 0% 7% 12% 0% 0% 8% 12% 2% 5% 25,488
Nigeria 1% 2% 1% 3% 3% 4% 0% 0% 4% 7% 1% 2% 1,213,949
Oman* 0% 1% 3% 7% 1% 3% 2% 7% 4% 10% 3% 8% 587,430
Pakistan 0% 0% 3% 9% 2% 4% 0% 0% 4% 13% 0% 0% 589,547
Panama* 0% 0% 285% 664% 1% 1% 15% 22% 285% 665% 15% 22% 99,968
Papua New Guinea 0% 0% 8% 11% 0% 0% 3% 5% 9% 12% 3% 5% 79,749
Paraguay* 3% 13% 8% 43% 2% 8% 1% 9% 10% 51% 4% 23% 154,093
Peru* 1% 3% 2% 4% 5% 8% 1% 2% 7% 12% 3% 6% 655,481
Philippines* 0% 0% 11% 19% 3% 4% 4% 6% 14% 23% 5% 6% 1,088,202
Poland* 0% 0% 6% 9% 6% 7% 0% 0% 12% 16% 0% 0% 3,380,489
Qatar* 1% 1% 3% 6% 5% 8% 14% 23% 8% 13% 15% 25% 908,091
Romania* 1% 1% 3% 4% 5% 8% 1% 1% 8% 12% 1% 2% 1,158,071
Russian Federation* 1% 2% 6% 11% 10% 16% 8% 15% 16% 28% 9% 16% 6,334,767
Rwanda 5% 16% 0% 0% 2% 8% 0% 0% 2% 8% 5% 16% 15,818
Samoa 8% 10% 20% 33% 3% 3% 15% 33% 23% 37% 23% 43% 3,141
Sao Tome and Principe 8% 10% 2% 3% 1% 1% 2% 3% 3% 4% 11% 13% 1,215
Saudi Arabia 0% 0% 0% 0% 4% 6% 0% 0% 4% 6% 0% 0% 3,993,554
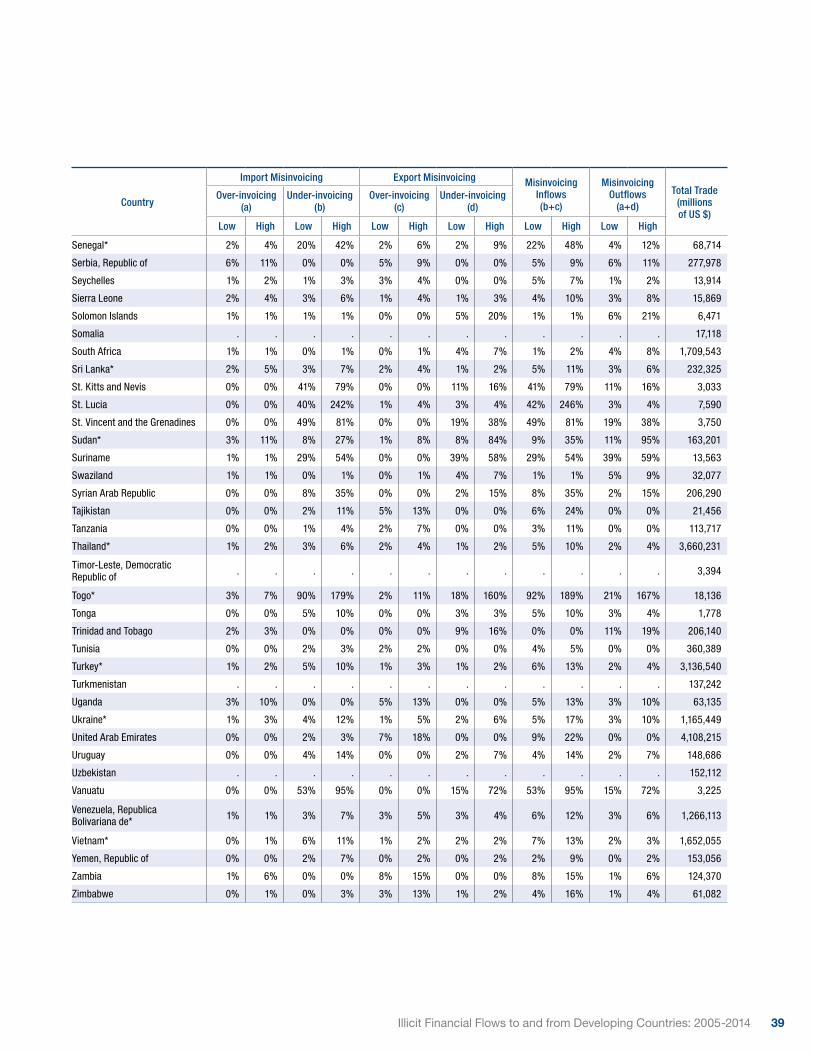
39Illicit Financial Flows to and from Developing Countries: 2005-2014
Country
Import Misinvoicing Export Misinvoicing Misinvoicing Inflows (b+c)
Misinvoicing Outflows
(a+d)
Total Trade (millions of US $)
Over-invoicing (a)
Under-invoicing (b)
Over-invoicing (c)
Under-invoicing (d)
Low High Low High Low High Low High Low High Low High
Senegal* 2% 4% 20% 42% 2% 6% 2% 9% 22% 48% 4% 12% 68,714
Serbia, Republic of 6% 11% 0% 0% 5% 9% 0% 0% 5% 9% 6% 11% 277,978
Seychelles 1% 2% 1% 3% 3% 4% 0% 0% 5% 7% 1% 2% 13,914
Sierra Leone 2% 4% 3% 6% 1% 4% 1% 3% 4% 10% 3% 8% 15,869
Solomon Islands 1% 1% 1% 1% 0% 0% 5% 20% 1% 1% 6% 21% 6,471
Somalia . . . . . . . . . . . . 17,118
South Africa 1% 1% 0% 1% 0% 1% 4% 7% 1% 2% 4% 8% 1,709,543
Sri Lanka* 2% 5% 3% 7% 2% 4% 1% 2% 5% 11% 3% 6% 232,325
St. Kitts and Nevis 0% 0% 41% 79% 0% 0% 11% 16% 41% 79% 11% 16% 3,033
St. Lucia 0% 0% 40% 242% 1% 4% 3% 4% 42% 246% 3% 4% 7,590
St. Vincent and the Grenadines 0% 0% 49% 81% 0% 0% 19% 38% 49% 81% 19% 38% 3,750
Sudan* 3% 11% 8% 27% 1% 8% 8% 84% 9% 35% 11% 95% 163,201
Suriname 1% 1% 29% 54% 0% 0% 39% 58% 29% 54% 39% 59% 13,563
Swaziland 1% 1% 0% 1% 0% 1% 4% 7% 1% 1% 5% 9% 32,077
Syrian Arab Republic 0% 0% 8% 35% 0% 0% 2% 15% 8% 35% 2% 15% 206,290
Tajikistan 0% 0% 2% 11% 5% 13% 0% 0% 6% 24% 0% 0% 21,456
Tanzania 0% 0% 1% 4% 2% 7% 0% 0% 3% 11% 0% 0% 113,717
Thailand* 1% 2% 3% 6% 2% 4% 1% 2% 5% 10% 2% 4% 3,660,231
Timor-Leste, Democratic Republic of . . . . . . . . . . . . 3,394
Togo* 3% 7% 90% 179% 2% 11% 18% 160% 92% 189% 21% 167% 18,136
Tonga 0% 0% 5% 10% 0% 0% 3% 3% 5% 10% 3% 4% 1,778
Trinidad and Tobago 2% 3% 0% 0% 0% 0% 9% 16% 0% 0% 11% 19% 206,140
Tunisia 0% 0% 2% 3% 2% 2% 0% 0% 4% 5% 0% 0% 360,389
Turkey* 1% 2% 5% 10% 1% 3% 1% 2% 6% 13% 2% 4% 3,136,540
Turkmenistan . . . . . . . . . . . . 137,242
Uganda 3% 10% 0% 0% 5% 13% 0% 0% 5% 13% 3% 10% 63,135
Ukraine* 1% 3% 4% 12% 1% 5% 2% 6% 5% 17% 3% 10% 1,165,449
United Arab Emirates 0% 0% 2% 3% 7% 18% 0% 0% 9% 22% 0% 0% 4,108,215
Uruguay 0% 0% 4% 14% 0% 0% 2% 7% 4% 14% 2% 7% 148,686
Uzbekistan . . . . . . . . . . . . 152,112
Vanuatu 0% 0% 53% 95% 0% 0% 15% 72% 53% 95% 15% 72% 3,225
Venezuela, Republica Bolivariana de* 1% 1% 3% 7% 3% 5% 3% 4% 6% 12% 3% 6% 1,266,113
Vietnam* 0% 1% 6% 11% 1% 2% 2% 2% 7% 13% 2% 3% 1,652,055
Yemen, Republic of 0% 0% 2% 7% 0% 2% 0% 2% 2% 9% 0% 2% 153,056
Zambia 1% 6% 0% 0% 8% 15% 0% 0% 8% 15% 1% 6% 124,370
Zimbabwe 0% 1% 0% 3% 3% 13% 1% 2% 4% 16% 1% 4% 61,082

40 Global Financial Integrity

41Illicit Financial Flows to and from Developing Countries: 2005-2014
Appendix II: Methods
This report provides estimates of IFFs due to trade misinvoicing using the standard scaled-up
methodology employed in Illicit Financial Flows from Developing Countries: 2004-2013. We provide
full documentation of that methodology in Section A. Section B describes adjustments to the
scaled-up “high” estimates to provide for a separate set of “low” narrow-basis estimates. Section
C discusses several refinements made to both the high and low estimates, such as the inclusion of
Swiss precious metals data in the calculation. Section D concludes with information on the estimates
of leakages from the balance of payments.
A. High EstimatesThe high estimates are calculated using a mixed approach, dependent on data availability. When
comprehensive bilateral trade data with advanced economies are available for the full 10 years of covered
in this report, the bilateral advanced economies calculation is employed. However, when such bilateral
trade data are not available for the full 10-year period, the world aggregate calculation is substituted.
Trade Misinvoicing: Bilateral Advanced Economies CalculationTrade misinvoicing is calculated by comparing a country’s reported trade statistics with those
of its “advanced economy” trading partners (as designated by the IMF). This approach was first
implemented by Bhagwati20 and is carried out in two steps. First, import c.i.f. data are converted
to an f.o.b. basis using a freight and insurance factor of 10 percent (r=1.1 in the equations below), a
standard factor used by the IMF’s Direction of Trade Statistics (DOTS).21 Once the conversion factor
has been applied, the import and export discrepancies (ID and ED, respectively) are calculated using
the following equations:
IDjp,t = Ijt/r – Xpt
EDjp,t = Ipt/r – Xjt
where:
Ijt : Imports by the developing country j from the partner country p at time t
Ipt : Partner country p’s imports from the developing country j at time t
Xjt : Developing country j’s exports to partner country p at time t
Xpt : Partner country p’s exports to developing country j at time t
A negative value of IDjp,t indicates import under-invoicing (illicit inflows), and a positive value
shows import over-invoicing (illicit outflows). Similarly, a negative value of EDjp,t represents export
over-invoicing (illicit inflows), while a positive value shows export under-invoicing (illicit outflows).
20 Jagdish N. Bhagwati, “On the Underinvoicing of Imports,” in Illegal Transactions in International Trade, ed. Jagdish N. Bhagwati (Amsterdam: North-Holland Publishing Company, 1974), 138–47.
21 International Monetary Fund, “Direction of Trade Statistics (DOTS),” [Online Database].

42 Global Financial Integrity
When data for countries are available that permits this calculation—51 developing countries in this
report, marked with one or two asterisks in Table A-I—GFI estimates makes this estimation using
bilateral trade data with individual advanced economies from the IMF’s Direction of Trade Statistics
(DOTS) to arrive at a total of misinvoicing vis-à-vis advanced countries. This is the point the
calculation stops for bilateral reporters for the “low estimate” (see Subsection B of this appendix).
Appendix Table II-1. Regional Breakdown of Comprehensive Bilateral Reporters
Sub-Saharan Africa Asia
Developing Europe MENA+AP
Western Hemisphere
All Developing Countries
Bilateral Reporters 4 9 14 7 17 51
Total Countries 45 25 24 22 33 149
Percent Reporting Bilaterally 9% 36% 58% 32% 52% 34%
Percent of Total IFFs from Bilateral Reporters, 2014 (Low Estimate) 16% 99% 99% 50% 94% 90%
Percent of Total Trade from Bilateral Reporters, 2014 6% 99% 97% 25% 96% 82%
Note: Estimates of total trade were calculated as an average of the magnitude reported by each developing country and the magnitude reported by that country’s trade partners. Total trade is defined as the total exports plus imports for developing countries as provided by the compilers of the IMF’s Direction of Trade Statistics.
For the high estimates, this total misinvoicing vis-à-vis advanced countries figure is then scaled
up to a world level, using the ratio at which the developing country traded with these economies
as compared to the world, under the assumption that traders misinvoice with other developing
countries at the same rate they misinvoice with advanced economies.
Trade misinvoicing estimates are adjusted for entrepôt trade through Hong Kong, using re-export
statistics from the Hong Kong Census and Statistics Department.22 This adjustment reduces trade
gaps between countries and prevents the mechanism of shipping goods through Hong Kong from
appearing as misinvoicing. Unfortunately, we are not aware of disaggregated re-export data from
any other major trade entrepôt (e.g. Singapore, Dubai) at this time.
22 The Government of Hong Kong Special Administrative Region, Census and Statistics Department, “Re-Export Trade Data, 2000-2014,” 2015.
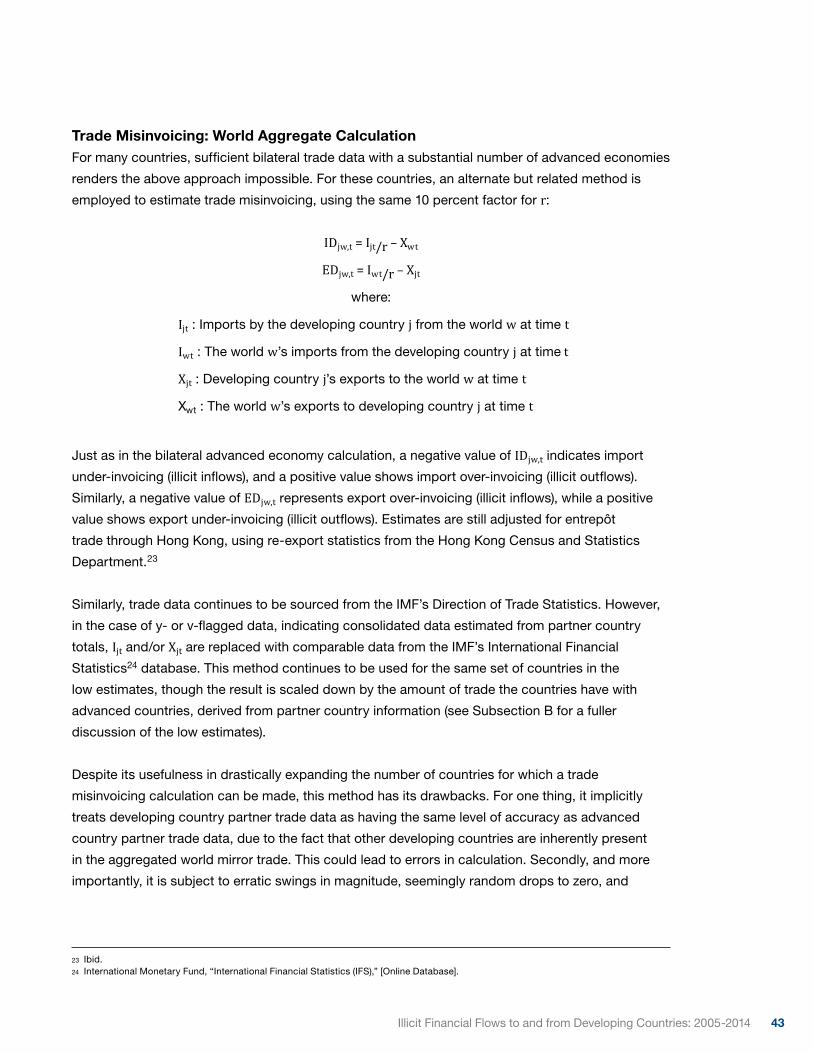
43Illicit Financial Flows to and from Developing Countries: 2005-2014
Trade Misinvoicing: World Aggregate CalculationFor many countries, sufficient bilateral trade data with a substantial number of advanced economies
renders the above approach impossible. For these countries, an alternate but related method is
employed to estimate trade misinvoicing, using the same 10 percent factor for r:
IDjw,t = Ijt/r – Xwt
EDjw,t = Iwt/r – Xjt
where:
Ijt : Imports by the developing country j from the world w at time t
Iwt : The world w’s imports from the developing country j at time t
Xjt : Developing country j’s exports to the world w at time t
Xwt : The world w’s exports to developing country j at time t
Just as in the bilateral advanced economy calculation, a negative value of IDjw,t indicates import
under-invoicing (illicit inflows), and a positive value shows import over-invoicing (illicit outflows).
Similarly, a negative value of EDjw,t represents export over-invoicing (illicit inflows), while a positive
value shows export under-invoicing (illicit outflows). Estimates are still adjusted for entrepôt
trade through Hong Kong, using re-export statistics from the Hong Kong Census and Statistics
Department.23
Similarly, trade data continues to be sourced from the IMF’s Direction of Trade Statistics. However,
in the case of y- or v-flagged data, indicating consolidated data estimated from partner country
totals, Ijt and/or Xjt are replaced with comparable data from the IMF’s International Financial
Statistics24 database. This method continues to be used for the same set of countries in the
low estimates, though the result is scaled down by the amount of trade the countries have with
advanced countries, derived from partner country information (see Subsection B for a fuller
discussion of the low estimates).
Despite its usefulness in drastically expanding the number of countries for which a trade
misinvoicing calculation can be made, this method has its drawbacks. For one thing, it implicitly
treats developing country partner trade data as having the same level of accuracy as advanced
country partner trade data, due to the fact that other developing countries are inherently present
in the aggregated world mirror trade. This could lead to errors in calculation. Secondly, and more
importantly, it is subject to erratic swings in magnitude, seemingly random drops to zero, and
23 Ibid.24 International Monetary Fund, “International Financial Statistics (IFS),” [Online Database].

44 Global Financial Integrity
general understatement. This is due to an aggregation problem. If, for example, there are high
levels of import under-invoicing outflows to Germany, an even higher level of import over-invoicing
inflows with the United Kingdom would completely swamp out the outflows to Germany. This
situation would register zero illicit outflows due to import over-invoicing in that year, though import
over-invoicing did indeed occur with Germany (and likely many other countries). Given that nearly
two-thirds of the countries in this report had trade misinvoicing calculated in this manner, it is yet
another reason to treat the estimates presented in this report as conservative.
B. Low EstimatesIn this report, we also present low estimates of trade misinvoicing, which follow the same basic
logic of what have been GFI’s standard estimates in previous reports (referred to in this report
as the high estimates). The low estimates are intended to present the volume of illicit financial
flows strictly between developing countries and advanced countries; that is, the low estimates
exclude that part of measurable IFFs moving between developing countries. At the individual
country level, the higher, scaled-up estimates may be interpreted as an accurate estimate of that
country’s misinvoicing propensity in all of its trade. However, because these scaled-up estimates
include trade gaps between developing countries, adding the misinvoicing estimates for any two
developing countries may lead to overcounting in the total, with the likelihood of overcounting rising
as the number of countries being aggregated increases. By the same token, the lower estimate
deliberately excludes misinvoicing in trade between developing countries and, therefore, is likely to
underestimate trade misinvoicing at the individual country level.
This is to avoid double-counting of flows between developing countries upon summing the totals of
developing country IFFs to create a total world figure.
The standard estimates are scaled downwards as follows. For bilateral reporters, we simply do
not adjust the figure upwards to a world level. In other words, the trade misinvoicing calculation is
complete once a country’s estimates of misinvoicing vis-à-vis advanced countries are summed.
For world reporters, the process is less direct. The totals from the standard estimates are scaled
downwards based on estimated partner-country DOTS data on the propensity of that country to
trade with advanced countries. For example, if a world reporter is estimated to conduct 70 percent
of its trade with advanced countries, the “high estimate” trade misinvoicing figure is multiplied
by 0.7.

45Illicit Financial Flows to and from Developing Countries: 2005-2014
C. Comparison with Estimates in Illicit Financial Flows from Developing Countries: 2004-201325
For the high estimates of trade misinvoicing, several new adjustments have been made since GFI’s
last global estimation of illicit financial flows. These methodological adjustments are also applied to
the low estimates.
Swiss Bilateral Gold & Precious Metals DataIn order to accurately estimate trade misinvoicing, we aim to close all legitimate gaps in trade
statistics not due to deliberate misinvoicing. We recently became aware that Swiss import and
export statistics in the IMF’s Direction of Trade Statistics are not inclusive of gold and other
precious metal trade prior to 2012.26 However, those missing data are available from the Federal
Customs Administration of the Swiss Confederation.27 In this report, the Swiss data is used to
supplement DOTS statistics, reducing trade gaps on many bilateral routes.
Countries Classified as “Bilateral Reporters”For a country to be treated as a “bilateral reporter,” it must report to at least 30 advanced
economies for each of the 10 years estimated in this report. Countries meeting these criteria are
calculated using the bilateral advanced economies method, save for exceptions in Southern Africa
noted below. These exceptions, along with changes in data coverage, have led to slight shifts in
which countries are classified as bilateral reporters and which are not.
Zambia and South African Customs Union (SACU) Countries Due to bilateral data availability, Zambia and South Africa (along with the SACU countries, for
which the trade misinvoicing calculation is estimated as a relative level of South Africa’s trade
misinvoicing) were calculated in our most recent report using the bilateral advanced economies
method.28 However, irreconcilable issues in the destination reporting of Zambia’s copper exports29
and South Africa’s gold exports30 distort bilateral estimates of misinvoicing to such a degree that
bilateral estimations of misinvoicing for these countries are of little practical use. To mitigate this
25 Dev Kar and Joseph Spanjers, Illicit Financial Flows from Developing Countries: 2004-2013 (Washington, DC: Global Financial Integrity, 2015).
26 GFI is grateful for helpful communications with India’s Directorate of Revenue Intelligence and the Swiss Directorate General of Customs regarding this issue.
27 “Trade in Gold, Silver and Coins,” [Online Database], Federal Customs Administration, Swiss Confederation, (March 3, 2015), http://www.ezv.admin.ch/themen/04096/04101/05233/05672/index.html?lang=en.
28 Kar and Spanjers, IFFs: 2004-2013, 27.29 Alex Cobham, “Tax Havens and Illicit Flows,” in Draining Development? Controlling Flows of Illicit Funds from Developing Countries, ed.
Peter Reuter (Washington, DC: The World Bank, 2012), 363, https://openknowledge.worldbank.org/bitstream/handle/10986/2242/668150PUB0EPI0067848B09780821388693.pdf; Mwanda Phiri and Shebo Nalishebo, “Do Zambia’s Copper Exports Disappear into Thin Air?,” The ZIPAR Quarterly (Lusaka, Zambia: Zambia Institute for Policy Analysis & Research (ZIPAR), April 2015), http://www.zipar.org.zm/publications/zipar-quarterly-magazine/34-zipar-quarterly-april-2015.
30 Kathy Nicolaou-Manias and Yuchen Wu, “Illicit Financial Flows Estimating Trade Mispricing and Trade-Based Money Laundering For Five African Countries,” GEG Africa Discussion Paper (Global Economic Governance Africa, October 2016), 42–43, http://www.gegafrica.org/publications/66-illicit-financial-flows-estimating-trade-mispricing-and-trade-based-money-laundering-for-five-african-countries; Léonce Ndikumana, “Trade Misinvoicing in Primary Commodities: The Cases of Chile, Côte d’Ivoire, Nigeria, South Africa and Zambia” (UNCTAD, December 2016), 1–4, http://unctad.org/en/PublicationsLibrary/suc2016d2_en.pdf.

46 Global Financial Integrity
destination reporting issue, we have decided to treat these countries as world reporters and apply
the world aggregate method. Utilizing this method, which is not distorted by issues in destination
reporting, we can have greater confidence that our trade misinvoicing estimates for these countries
are indeed conservative.
D. Balance of Payments Leakages Leakages from the balance of payments are the Net Errors and Omissions (NEO) term in the
IMF’s Balance of Payments Statistics31 (BOP) database. In economic research, those leakages
(when indicating an unaccountable outflow from developing to advanced countries) have been
regularly associated with capital flight (often termed “hot money narrow”). GFI assumes that
those unreported leakages (here representing potential inflows as well as outflows) represent
unrecorded and presumably illicit transactions. However, the BOP leakages to some extent also
represent legitimate reporting errors in the compilation of the BOP accounts. Even so, because the
BOP leakages are typically only a small fraction of total IFFs estimated by GFI, variations on that
assumption are not likely to appreciably affect the overall estimates presented here.
When there are missing values for NEO in the BOP database, GFI attempts to fill the gaps with
net errors and omissions data from various IMF country reports and the hard copy 2011 and 2012
Balance of Payments Yearbooks, converted at the appropriate exchange rate32 if necessary.
NEO values for Saudi Arabia, the United Arab Emirates, and Qatar are omitted due to potential
overstatement related to idiosyncratic accounting for sovereign wealth funds in those countries.
31 International Monetary Fund, “Balance of Payments Statistics (BOPS),” [Online Database].32 Period average exchange rate to U.S. dollars, using: International Monetary Fund, “International Financial Statistics.”

47Illicit Financial Flows to and from Developing Countries: 2005-2014
Glossary
ATI: Addis Tax Initiative.
BOPS: Balance of Payment Statistics, an IMF database that measures the balance of
payments between countries. The Net Errors and Omissions line is used to adjust
for when the other components of the balance of payments to not sum to zero.
DOTS: Direction of Trade Statistics, an IMF database with that measures countries’
external accounts.
EU: European Union.
FATF: Financial Action Task Force.
FfD: Financing for Development Conference.
G20: Group of 20 largest economies in the world.
GDP: Gross Domestic Product.
GFI: Global Financial Integrity.
IFFs: Illicit Financial Flows, illegal movements of money or capital from one country to
another. GFI classifies this movement as an illicit flow when the funds are illegally
earned, transferred, and/or utilized.
IFS: International Financial Statistics, an IMF database with a variety of financial
statistics, including reporting IMF-member countries exports to and imports from
the world as a whole.
Illicit Inflow: The gross amount of money or capital entering a country illicitly.
Illicit Outflow: The gross amount of money or capital exiting a country illicitly.
IMF: International Monetary Fund.
MENA+AP: Middle East, North Africa, Afghanistan, and Pakistan.
NEO: Net Errors and Omissions, representing leakages from the balance of payments.
OECD: Organization for Economic Cooperation and Development.
Re-Exports: Goods imported and then quickly exported to their final destination.
SDGs: Sustainable Development Goals.
Trade Entrepôt: A major trading zone and intermediary (e.g. Hong Kong, Singapore, Dubai).
Trade Misinvoicing: A method for moving money illicitly across borders which involves deliberately
misreporting the value of a commercial transaction on an invoice submitted to
customs.
UN: United Nations.

48 Global Financial Integrity
49Illicit Financial Flows to and from Developing Countries: 2005-2014
References
“Better Tax Systems Crucial for Development.” [Press Release]. Addis Ababa, Ethiopia: International
Tax Compact, July 15, 2015. http://www.taxcompact.net/documents/Addis-Tax-Initiative_
Press-Release.pdf.
Bhagwati, Jagdish N. “On the Underinvoicing of Imports.” In Illegal Transactions in International
Trade, edited by Jagdish N. Bhagwati, 138–47. Amsterdam: North-Holland Publishing
Company, 1974.
Claessens, Stijn, and David Naudé. “Recent Estimates of Capital Flight.” Policy Research Working
Paper no. 1186, International Economics Department, The World Bank. Washington, DC,
September 1993. http://documents.worldbank.org/curated/en/878311468739518251/pdf/
multi0page.pdf.
Cobham, Alex. “Tax Havens and Illicit Flows.” In Draining Development? Controlling Flows of Illicit
Funds from Developing Countries, edited by Peter Reuter, 337–72. Washington, DC: The
World Bank, 2012. https://openknowledge.worldbank.org/bitstream/handle/10986/2242/
668150PUB0EPI0067848B09780821388693.pdf.
Financial Action Task Force. “The FATF Recommendations: International Standards on Combating
Money Laundering and the Financing of Terrorism & Proliferation.” Paris, France: FATF,
February 2012. http://www.fatf-gafi.org/topics/fatfrecommendations/documents/
fatf-recommendations.html.
“Financing for Development Conference: The Addis Tax Initiative - Declaration.” Addis Ababa,
Ethiopia: International Tax Compact, July 15, 2015. http://www.taxcompact.net/documents/
Addis-Tax-Initiative_Declaration.pdf.
“Goal 16: Promote Just, Peaceful and Inclusive Societies.” United Nations Sustainable Development
Goals. Accessed November 1, 2015. http://www.un.org/sustainabledevelopment/peace-justice/.
International Monetary Fund. “Balance of Payments Statistics (BOPS).” [Online Database]. Accessed
March 24, 2015. http://elibrary-data.imf.org/FindDataReports.aspx?d=33061&e=170784.
———. “Direction of Trade Statistics (DOTS).” [Online Database]. Accessed October 10, 2015.
https://data.imf.org/?sk=9D6028D4-F14A-464C-A2F2-59B2CD424B85.
———. “International Financial Statistics (IFS).” [Online Database]. Accessed October 10, 2015.
http://elibrary-data.imf.org/FindDataReports.aspx?d=33061&e=169393.
“Issues: Illicit Financial Flows.” Global Financial Integrity, November 2, 2015.
http://www.gfintegrity.org/issue/illicit-financial-flows/.
“Just for Show? Reviewing G20 Promises on Beneficial Ownership.” Transparency International,
November 12, 2015. https://www.transparency.org/whatwedo/publication/
just_for_show_g20_promises.
Kar, Dev, and Joseph Spanjers. Illicit Financial Flows from Developing Countries: 2004-2013.
Washington, DC: Global Financial Integrity, 2015.

50 Global Financial Integrity
Ndikumana, Léonce. “Trade Misinvoicing in Primary Commodities: The Cases of Chile,
Côte d’Ivoire, Nigeria, South Africa and Zambia.” UNCTAD, December 2016.
http://unctad.org/en/PublicationsLibrary/suc2016d2_en.pdf.
Nicolaou-Manias, Kathy, and Yuchen Wu. “Illicit Financial Flows Estimating Trade Mispricing
and Trade-Based Money Laundering For Five African Countries.” GEG Africa Discussion
Paper. Global Economic Governance Africa, October 2016. http://www.gegafrica.org/
publications/66-illicit-financial-flows-estimating-trade-mispricing-and-trade-based-money-
laundering-for-five-african-countries.
Nitsch, Volker. “Trade Misinvoiving in Developing Countries.” CGD Policy Paper 103. Washington,
DC, February 2007. https://www.cgdev.org/sites/default/files/trade-misinvoicing-developing-
countries.pdf.
———. “Trade Mispricing and Illicit Flows.” In Draining Development? Controlling Flows of Illicit
Funds from Developing Countries, edited by Peter Reuter, 309–34. Washington, D.C.:
World Bank, 2012. https://openknowledge.worldbank.org/handle/10986/2242.
Phiri, Mwanda, and Shebo Nalishebo. “Do Zambia’s Copper Exports Disappear into Thin Air?”
The ZIPAR Quarterly. Lusaka, Zambia: Zambia Institute for Policy Analysis & Research
(ZIPAR), April 2015. http://www.zipar.org.zm/publications/zipar-quarterly-magazine/
34-zipar-quarterly-april-2015.
“Report of the High Level Panel on Illicit Financial Flows from Africa.” UNECA, February 26, 2015.
http://www.uneca.org/sites/default/files/publications/iff_main_report_english.pdf.
“Resolution Adopted by the General Assembly on 27 July 2015: Addis Ababa Action Agenda of the
Third International Conference on Financing for Development (Addis Ababa Action Agenda).”
United Nations General Assembly Resolution. New York, NY: United Nations, August 17, 2015.
http://www.un.org/ga/search/view_doc.asp?symbol=A/RES/69/313.
Stuber, Walter. “Brazil: Tax Haven Jurisdictions - Haven or Hell?” Mondaq, January 8, 2013.
http://www.mondaq.com/brazil/x/215184/Income+Tax/Tax+Haven+Jurisdictions+Haven+Or+Hell.
The Government of Hong Kong Special Administrative Region, Census and Statistics Department.
“Re-Export Trade Data, 2000-2014,” 2015.
“Trade in Gold, Silver and Coins.” [Online Database]. Federal Customs Administration, Swiss
Confederation, March 3, 2015. http://www.ezv.admin.ch/themen/04096/04101/05233/05672/
index.html?lang=en.

51Illicit Financial Flows to and from Developing Countries: 2005-2014
About
Founded in 2006, Global Financial Integrity (GFI) is a non-profit, Washington, DC-based research
and advisory organization, which produces high-caliber analyses of illicit financial flows,
advises developing country governments on effective policy solutions, and promotes pragmatic
transparency measures in the international financial system as a means to global development and
security.
AuthorsMatthew Salomon is Senior Economist at Global Financial Integrity. Prior to joining GFI in late
2015, Matthew served as Chief Economist with the U.S. Senate Budget Committee and the Joint
Economic Committee of the U.S. Congress.
Joseph Spanjers is an Economist at Global Financial Integrity. Joseph received a BS in Economics
and a BA in Global Studies from the University of Minnesota, and is currently an MA candidate at
Johns Hopkins-SAIS.
AcknowledgementsThe authors wish to thank and acknowledge Raymond Baker (President), Tom Cardamone
(Managing Director), Christine Clough (Program Manager), Heather Lowe (Legal Counsel & Director
of Government Affairs), Liz Confalone (Policy Counsel), and Samuel Romero Martinez (Economics
Intern) for their contributions to the production of this report. The authors extend special gratitude
to Dr. Dev Kar, now Chief Economist, Emeritus at GFI, for having pioneered GFI’s efforts in the
estimation of illicit financial flows.
GFI and the authors would also like to acknowledge Gil and Lynne Leigh of Modern Media for their
contributions to the layout and design of the publication.


1100 17th Street, NW, Suite 505 | Washington, DC | 20036 | USATel. +1 (202) 293-0740 | Fax. +1 (202) 293-1720 | www.gfintegrity.org
President: Raymond Baker Managing Director: Tom Cardamone
Board: Lord Daniel Brennan (Chair), Dr. Rafael Espada (Vice Chair), Dr. Huguette Labelle, Raymond Baker