Embed Size (px)
Citation preview

ILIAnalyst USER MANUAL
January 2014
Disclaimer: There will be differences between this manual and the version of the IRAS software being used because of application configuration that is specific to your environment. This document is always under active development and, as such, there may be mistakes or omissions. Please report any you find to [email protected]. Dynamic Risk Assessment Systems, Inc. Copyright ©2014

ILIAnalyst
Table of Contents
Section Page
1.0 INTRODUCTION ................................................................................................................. 1 2.0 ACCESSING THE DATABASE ......................................................................................... 2 3.0 ILIANALYST – APPLICATION OPTIONS ......................................................................... 5
3.1 APPLICATION OPTIONS – DISPLAY OPTIONS ................................................................... 6 3.2 APPLICATION OPTIONS - BEHAVIOR OPTIONS ................................................................. 6
4.0 DESCRIPTION OF THE SOFTWARE INTERFACE ........................................................ 14 4.1 ILI DATA BAND AND ILI CHART PANES ......................................................................... 19
4.1.1 ILI Data Band Toolbar Extras ................................................................................... 20 4.1.2 Zoom In .................................................................................................................... 21 4.1.3 Zoom Out.................................................................................................................. 21 4.1.4 Window Zoom with mouse ....................................................................................... 21 4.1.5 Dig Sheet .................................................................................................................. 23
5.0 PROJECT INSPECTOR PANE ........................................................................................ 25 5.1 SYSTEM HIERARCHY ................................................................................................... 25 5.2 ILI RUNS .................................................................................................................... 26 5.3 ANALYSIS TOOLS ........................................................................................................ 27
6.0 ILI DATA PANE ................................................................................................................ 30 6.1 MENU TOOLBAR ......................................................................................................... 30
6.1.1 Display ...................................................................................................................... 31 6.1.2 Display Options ........................................................................................................ 32
7.0 ILI CHARTS PANE ........................................................................................................... 34 7.1 MENU TOOLBAR ......................................................................................................... 35 7.2 DISPLAY CHART VIEW ................................................................................................. 36 7.3 DISPLAY LEGEND ........................................................................................................ 36 7.4 DISPLAY GRID VIEW .................................................................................................... 37
7.4.1 Grid View Toolbar ..................................................................................................... 37 8.0 PROJECT INSPECTOR PANE ........................................................................................ 42 9.0 STATUS AND PROGRESS BARS .................................................................................. 42 10.0 EXAMPLE OF AN ANALYSIS TOOL OUTPUT .............................................................. 43 11.0 INSPECTION SUMMARY................................................................................................. 44 12.0 METAL LOSS TYPE PLOT .............................................................................................. 45 13.0 ORIENTATION PLOT ....................................................................................................... 46 14.0 FACILITIES ....................................................................................................................... 47 15.0 CORROSION RATES PLOT ............................................................................................ 48
15.1 RUNNING A CORROSION RATES PLOT .......................................................................... 49 16.0 ANOMALY HISTOGRAM ................................................................................................. 50 17.0 FEATURE LIST ................................................................................................................ 51 18.0 SENTENCING PLOT ........................................................................................................ 52
18.1 RUNNING A SENTENCING PLOT .................................................................................... 52 19.0 GROW ANOMALY ........................................................................................................... 54
19.1 GROW ANOMALY OPTIONS .......................................................................................... 55 19.2 RUNNING A GROW ANOMALY SIMULATION .................................................................... 58 19.3 GROWN ANOMALIES ................................................................................................... 58
20.0 QC VENDOR DATA ......................................................................................................... 58 21.0 UNITY PLOT ..................................................................................................................... 61 22.0 POE PLOT ........................................................................................................................ 62

ILIAnalyst
23.0 POE SUMMARY PLOT .................................................................................................... 63 24.0 RUN COMPARISON CHART ........................................................................................... 64 25.0 PRESSURE PROFILE CHART ........................................................................................ 65 26.0 DIRECT EXAMINATION SITE CHART ............................................................................ 66
26.1 EXCAVATION REPORT ................................................................................................. 67 26.2 EDIT EXCAVATION DATA.............................................................................................. 68 26.3 EXCAVATION DATA [NEW] ........................................................................................... 71 26.4 DIG DATA COLLECTION SHEET .................................................................................... 71
27.0 REPORTS ......................................................................................................................... 73 27.1 RELATIVE DISTANCE REPORT ...................................................................................... 73
28.0 MAP .................................................................................................................................. 74 29.0 EXITING ILIANALYST ...................................................................................................... 76 30.0 TROUBLESHOOTING ...................................................................................................... 76 31.0 APPENDIX A .................................................................................................................... 77
31.1 ZOOM/PAN ................................................................................................................. 77 31.2 USING THE MAGNIFYING GLASS ZOOM ......................................................................... 77 31.3 WINDOW ZOOMING ..................................................................................................... 77 31.4 PANNING .................................................................................................................... 78 31.5 USING SCROLL BARS .................................................................................................. 78 31.6 MAP OPTIONS ............................................................................................................ 79
31.6.1 Map Information ....................................................................................................... 79 31.6.2 ARCGIS - Behavior .................................................................................................. 80 31.6.3 ARCGIS - Colors ...................................................................................................... 82 31.6.4 ARCGIS - Contours .................................................................................................. 82 31.6.5 MapObjects - Behavior ............................................................................................. 83 31.6.6 MapObjects - Colors ................................................................................................. 85 31.6.7 MapObjects - Contours ............................................................................................ 85

ILIAnalyst 1
1.0 Introduction
ILIAnalyst automates the analysis and management of ILI information, allowing the user to quickly review the current or historically stored ILI data sets, apply pre-defined acceptance criteria, select anomalies for investigation, and create your excavation site documentation – all within a few hours from receiving the vendor report. ILIAnalyst also records all the operational information about a tool run, such as tool specifications, contact details, inspection dates, inspected locations, inspected locations with bad data, tool velocity, interaction and burst-pressure algorithms used, and the pipe tally. It also allows the user to complete calculations such as burst pressure calculations (B31G, modified B31G and RSTRENG), generate a list of critical anomalies based on defined acceptance criteria and enable excavation results to be inputted to produce “predicted-vs-actual” plots. For ease of interpretation, bold-faced text is used in this user guide to highlight a feature or a component of the software.

ILIAnalyst 2
2.0 Accessing the Database
This application utilizes MicrosoftTM ActiveX data objects (ADO1) for database operations.
Upon launching ILIAnalyst, for the first time, the user will need to enter the database information via the Details Button in Figure 1 below.
Figure 1: Details - Database Configuration.
1 For technical information on ADO visit http://www.microsoft.com/data/ado/prodinfo.htm
ILIAnalyst 3
In Connection Details window the user must first choose the type of database it is (SQL Server as in Figure 2 or Oracle as in Figure 3). The user enters the appropriate information for their specific login type. SQL Server: Server, Database Oracle: Server, Username and Password Use the test connection button to verify that your login settings can actually talk to the database. Click OK to log into the database with the DataView application. If you are not sure what your database settings are, check with your DBA.
NOTE: If you type in the wrong connection simply click the New Connection button to start over.
Figure 2: Connection Details Window - SQL Server Configuration

ILIAnalyst 4
Figure 3: Connection Details - Oracle Database Configuration
. Click OK to log into the database with the ILIAnalyst application.
Figure 4: ILIAnalyst Main Window

ILIAnalyst 5
3.0 ILIAnalyst – Application Options
Once logged into ILIAnalyst, the user can configure specific application behavior, such as to use Imperial or Metric units, that are saved to a config file on that specific computer. Every time ILIAnalyst is run on this computer these configuration settings are applied.
To enter the configuration window, select Tools – Application Options from the Main Menu toolbar.
Figure 5: Tools – Application Options

ILIAnalyst 6
The Application Options window appears with four configuration categories to choose from on the left.
Figure 6: Application Options
3.1 Application Options – Display Options
Under the Display Options category, figure 6 above, the user can do the following:
1. Select Units (Metric or Imperial) from drop down boxes. These are set to Imperial by default.
2. Select to Show Hierarchy in the Inspector tool of the application. 3. Select to Show Station Series in the Inspector tool of the application. 4. Select how to setup the results grid with Auto Best Fit, Show Record Count. 5. Select pipeline selector Show Name and Search Mode within the system hierarchy.
When you are finished with this setup, click Apply if any changes have been made.
3.2 Application Options - Behavior Options
Click Here to access the sub-categories and update the options on the right-hand side of the window.

ILIAnalyst 7
Figure 7: Behavior Options
1. Use projects and setup how they behave:
When this option is turned on, the application will allow users to have more than one tab open with a separate project in each tab, and each project can have its selections configured independently of the other open projects. Also it allows users to save their selections into a project file, and to retrieve those selections again by opening the project file.
When this option is turned off, the application will allow only a single open project and will not support the saving and loading of projects. This behavior is similar to older versions of the IRAS applications and may be more familiar to users of the older software.
This option is turned on by default.
2. When starting the application,
This option is applicable when the “Use Projects” option is turned on.
It is a drop-down list with the following possible actions to take when the application is started: o Start with a new, blank project open.
The application will open a new project. It’s as if the application had started without a project and the user had pressed the “New Project” button. This is the default selection.
o Start with the latest project open. The application will open the last project that was closed the last time that the application was run. It’s as if the application had started without a project and the user had pressed the “Open Project” button and selected the last project the user had open.
o Start with no project open. The application will not open any projects. If the map is supported and visible then the map will fill the whole application space. Otherwise, the application space will show blue.

ILIAnalyst 8
o Ask the user for a project to open.
The application will open the “Open Project” dialog. It’s as if the application had started without a project and the user had pressed the “Open Project” button.
3. When closing a project,
This option is applicable when the “Use Projects” option is turned on.
It is a drop-down list with the following possible actions to take when closing a project (including when the application is closing): o Ask the user whether to save selection changes.
If any changes have been made to the project selections, then the application will ask the user whether to save those changes or not. This is the default selection.
o Automatically save selection changes. The application will automatically save the current project selections.
o Automatically discard selection changes The application will simply close the project, ignoring any changes made to the project selections.
4. Assign Project Folder Location:
This option is applicable when the “Use Projects” option is turned on.
This is the default location for all project files. When loading or saving project files, the user can navigate to other folders, but the open file and save file dialogs will open to this folder first.
The default location is “My Documents\Dynamic Risk Assessment Systems\Projects\”.
5. On application startup, load previous selections
If the “Use Projects” option is turned off, whenever the application closes, the current selections are stored for later use. If this option is turned on, then when the application starts it restores the settings from the previous session.
If the “Use Projects” option is turned on, whenever a project is opened, saved, or closed, its selections are stored for later use. If this option is turned on, then when a new, blank project is opened, the application applies the settings that were saved previously to the new project.
If the “When starting the application” option is set to “Start with a new, blank project open”, the application applies the settings that were saved previously to the new project.
This option is turned on by default.

ILIAnalyst 9
6. Ask for confirmation when closing the application
If this option is turned on, then when the application is closed, a message dialog appears asking “Are you sure you wish to exit the application?”
This option is turned on by default.
7. Show instructions when opening a new project
All application projects include a set of basic instructions for getting started. If this option is turned on, then new projects will automatically display the project instructions.
This option is turned on by default.
The project instructions form has a check-box where the user can choose to turn off this option.
8. Embed instructions in a project window
The project instructions are normally shown in a pop-up window that appears in front of the application.
If this option is turned on, then the project instructions will appear in a panel that is part of the project window.
This option is turned off by default.
9. Warn when the pipeline selection is changed while the project contains data.
Most IRAS applications require the user to select one or more pipelines from the hierarchy selector and then run a query to retrieve data based on that selection. When the hierarchy selection is changed by the user after querying the data, the data is then invalid and is cleared from the project.
If this option is turned on, then when the hierarchy selection is changed, a message dialog appears warning “Changing the project selection will clear the project data” and asking “Do you want to continue?”
If this option is turned off, then the data is cleared without warning.
This option is turned on by default.
When you are finished with this setup, click Apply if any changes have been made.

ILIAnalyst 10
Click on tab Map Options as shown in figure 8.
Figure 8: Map Options
1. DataView Location – Enter the path to the DataView application to activate the map in
this application. 2. Map Layout – choose to show the map on top or as a tab. 3. Map Workspace – choose to recreate map workspace files the next time the application
starts. When you are finished with this setup, click Apply if any changes have been made.
Click Here to Access Map options

ILIAnalyst 11
Click on tab Export Options as shown in figure 9.
Figure 9: Export Options
1. Default Export Target – Options to set default export to the following formats: Excel,
XML. HTML. Text, CSV, and Delimited Text. 2. Export to Excel – allows you to choose how to export numerical text.
When you are finished with this setup, click Apply if any changes have been made.
Click Here to Access Export options

ILIAnalyst 12
Click on tab Database Connections as shown in figure 10.
Figure 10: Database Options
1. The Database Connections option allows the user to edit database connection
information as explained at the beginning of the manual. In typical situations only a DBA would make changes here.
When you are finished with this setup, click Apply if any changes have been made.
ILIAnalyst 13
Click on tab Diagnostic Options as shown in figure 11.
Figure 11: Diagnostic Options
1. Diagnostic options – this option would only be used as instructed from a Dynamic Risk
employee when trying to support an application bug. It allows log files to be created to assist in determining the problem in the software.
When you are finished with this setup click Apply and OK or just OK and you will be prompted with a pop-up window that “One or more system option has been changed. These changes will take effect the next time the application is run.

ILIAnalyst 14
4.0 Description of the Software Interface
Figure 12: ILIAnalyst Main Interface
After a successful login, the main interface will appear as illustrated in figure 12. The interface consists of 5 main panes: The Project Pane The Map Pane The ILI Data Pane The ILI Charts Pane The Project Inspector Pane
IRAS System Hierarchy
ILI Summary
ILI Tools
A thumbtack button in the corner of a window, when selected, will hide the window. Once the window is hidden, when the mouse is placed over the area where the window was previously shown, the window will unhide.
IRAS System
Hierarchy
ILI Summary
ILI Tools
Shortcut Icon Menu
Main Menu
Project Inspector Pane
ILI Data Pane
Project Pane
ILI Charts Pane
Map Pane

ILIAnalyst 15

ILIAnalyst 16
Table 1: ILIAnalyst Main Window Drop-down Options
Main Menu Options
File
New Project - Opens a new ILIAnalyst Project (Default name is ILIAnalyst (n) where
(n) is an incremental number). Open Project… - Opens a browser window for the user to select a previous project that has been created and saved. Save Project - Saves the current project. Save Project As… - Allows the user to assign a name and description to the project they would like to save. Close Project - Closes the active open project. Close All Projects - Closes all open projects. Page Setup - Brings up the Print Setup dialog box. Print (CTRL-P) - The Print option will open the Print Setup dialog box. Print Preview - Opens a Print Preview window. Project Properties - Opens the Properties window of the Project displaying the Name and Description. Exit - Exits the application.
Edit
Clear Map Selection - Removes the check mark from the selected high level layers in the map and the map display window becomes blank. Clear Pipeline Selection - Removes the check mark from the selected levels in the System Hierarchy window. Clear All Selection - Automatically clears the System Hierarchy and Chart Selector check
marks.
ILIAnalyst 17
Map
Show Map - Toggles the map display window to appear or disappear within the application. Get Pipeline Selection From Map (ARCGIS Only) - Uses the selected pipeline from the map to populate the System Hierarchy tree. Send Pipeline Selection To Map (ARCGIS Only) - Uses the selected pipeline from the System Hierarchy tree to highlight the pipeline on the map.
Tools
Run (F9) - Loads the selected pipeline, charts and map chosen in the selections screen. Chainage Wand - Enables the Chainage Wand on the map. Application Options - Application Options Windows to configure displays discussed in previous section of the manual.
Window
Dock All Windows – Returns all floating windows into the main ILIAnalyst window Project Name – Shows the current ILIAnalyst Project accessed
Help
Show Instructions -Displays the instruction window for the user to follow. User Manual - Launches the user manual in your PDF viewer.
Contact Us - An email browser opens up to allow the user to request support from DRAS by composing an email describing the nature of the problem. About DataView - Displays general information about the program such as the version
number and the server accessed.

ILIAnalyst 18
Table 2: ILIAnalyst Main Toolbar
Shortcut Icons Options
New Project – create a new ILIAnalyst Project
Open Project – allows user to choose previous ILIAnalyst projects to open
Save Project – saves the current ILIAnalyst project to the default location
Close Project – Closes the Project Window.
Print (Ctrl + P) - Brings up a Print Setup window to print the current ILI Data band and Chart loaded to a printer
Print Preview – Allows the user to preview the page prior to printing.
Run (F9) – Initiates the selected Inline Inspection Run to Load
Show Map – turns the map pane on within the ILIAnalyst application.
Get Pipeline Selection From Map (ARCGIS Only) - Uses the selected pipeline from the map to populate the System Hierarchy tree.
Send Pipeline Selection To Map (ARCGIS Only) - Uses the selected pipeline from the System Hierarchy tree to highlight the pipeline on the map.
Chainage Wand – When activated a line will appear on the chart and map. The line represents distance from beginning of line.
Application Options – allows the user to change settings selected during configuration.
Show Instructions – Brings up a pop-up window with instructions on using the application.

ILIAnalyst 19
The Map, ILI Data Band, and Chart Panes are now loaded with specific information from the Inline Inspection run chosen. In the example below the Metal Loss Type Plot was selected as the chart to view.
Figure 13: Inline Inspection – Metal Loss Type Plot
4.1 ILI Data Band and ILI Chart Panes
Figure 14: ILI data band and ILI Chart Toolbar
There are several zoom options in the toolbars that allow the user to focus on a specific area of the data being displayed. There are two sets of independent toolbars, one for the ILI Data Band and the other for the ILI charts. Therefore the zoom level and focus area can be adjusted to analyze these datasets independently. All of the Centerline charts are synchronized by chainage so that they display information for the same chainage range. An option called Sync Zoom can be used to synchronize the chainage ranges displayed in the Data Band and the ILI charts.
Copy Chart - Creates a copy of the active chart for use in any Windows application that
permits pasting

ILIAnalyst 20
Zoom In - magnifies the chart, increasing the resolution.
Zoom Out - shrinks the chart, decreasing the resolution.
Full Extent - the Full Extent command displays the extent of the charts.
Extent Backward - the Extend Backward command displays the previous view of the charts.
Extent Forward - the Extend Forward command displays the subsequent view of the charts.
Inspector - The Inspector pop-up window will appear showing detailed information about a selected feature or attribute on the map.
Synch Zoom – Synch visibility in the ILI Data Band or Chart with the map.
4.1.1 ILI Data Band Toolbar Extras
Figure 15: ILI Data Band toolbar
Pull-down options include the following categories the user is able to select to filter what is being seen. Surface: All Surfaces, External, Internal, Mid-Wall Severity: All Anomalies, Most Severe Location: All Locations, HCA Locations Visible: Cluster data, Callbox data, NCD data, Crack Data
- Options: Allows user to configure data ranges and colors to display in chart.

ILIAnalyst 21
Figure 16: ILI Data Band Options
4.1.2 Zoom In
To use Zoom In :
- Click on the Zoom In button in the Centerline charts and the charted data will enlarge. It applies the command to all charts in the Centerline group. Use the Zoom In button, on the ILI shortcut toolbar, to visually enlarge the data in the ILI chart.
4.1.3 Zoom Out
To use Zoom Out :
- Click on the Zoom Out button in the Centerline charts and the charted data will shrink. It applies the command to all charts in the Centerline group. In the same way, use the Zoom Out button, on the ILI shortcut toolbar, to visually shrink the data in the ILI chart.
4.1.4 Window Zoom with mouse
To Zoom In do the following:
1. To specify the upper left corner, click and hold down the mouse left click button in the area to be zoomed in. Note: The mouse must be within the chart outline in order for this to work.
2. Then drag to specify the bottom right corner point and release to determine the window size.
To Zoom Out do the following:
1. Click and hold down the mouse left click button and drag until a square is produced
then release left click button of the mouse. Note: This zoom out function zooms out to the fullest extent always. Use the zoom out button for incremental zoom out.
The figure below shows an example of using Inspector for viewing data concerning the Wall Thickness of the pipeline at a particular point.

ILIAnalyst 22
Figure 17: Data Inspector Window
Open Inspector Window
Close Inspector Tracked Anomaly
Access the Dig Sheet here.

ILIAnalyst 23
4.1.5 Dig Sheet
Dig sheets are useful tools to quickly identify feature locations and pipe characteristics that can be forwarded to field personnel to aid them in locating anomalies during an excavation. The Inspector tool allows the user to hover over any anomaly, click a button and produce a dig sheet. Follow the directions laid out above regarding the Inspector Tool. Hover over any anomaly using the Inspector Tool. Once the Data Inspector window is open, simply select <Click Here> to open up the Dig Sheet window as shown in Figure 11 on the previous page. The dig sheet will appear in the Print Preview window. In the top left-hand corner of the window, the Print Preview Toolbar contains commands for viewing and printing the dig sheet.
Figure 18: Anomaly Dig Sheet
To access the second part of the Dig Sheet Simply click the close option in the top right hand corner of the Dig Sheet Window. Closing the Dig Sheet window will invoke another report that that contains a Summary of Features found within a certain distance of the Feature being dug.

ILIAnalyst 24
A list of anomalies and specific characteristics are listed that fall within the specified distance set.
Figure 19: Anomalies located near a particular feature
The Feature Location Summary lists specific details on features that are within a specified distance of the feature being dug.

ILIAnalyst 25
5.0 Project Inspector Pane
The Project Inspector Pane is made up of three parts: the System Hierarchy, ILI Runs, and buttons to access the analysis tools.
5.1 System Hierarchy
In order to retrieve and display data for a specific location, the user must create a data request from the System Hierarchy Selection window shown in Figure 16 below. The top half of the window controls are used to specify the Query Location that describes the start and end location of the area of interest. The bottom half of the pane contains a menu of the data series that are available for display.
Figure 20: IRAS System Hierarchy Selection window
Search Search Next (F3)
Hierarchy selections
Pin/Unpin Expand to First Selectable Level
Expand to Selected Nodes Expand All
System Hierarchy Selection Window
Get Pipeline Selection from Map (ARCObjects Only)
Send Pipeline Selection toMap (ARCObjects Only)

ILIAnalyst 26
Before the user can begin to display any data in ILIAnalyst, they must first establish their query criteria. An integral part of the criteria is the Query Location, which will define the start and end limits for the location of interest on the pipeline.
1) The first step is to find the first selectable level within the System Hierarchy Selection Window. This can be performed by:
a. Clicking on the (+) (-) will expand/compress the different pipeline hierarchy levels
located within the pipeline system. The user can use this method to find the appropriate Hierarchy level to query (i.e. Discharge System or MLV Section).
b. Click on the Expand to First Selectable Level button located within the
Hierarchy Selection Window. This will expand the Hierarchy tree to the first available query level within the Pipeline System. From here the user can further drill down by clicking on the (+) icon.
2) If the user knows the name or part of the name, of the system they wish to query, they can type part or the entire name within the search window and hit Enter on their keyboard. The search feature will navigate the user to the first match found. To keep searching the tree, simply select the Search Next button. Once the search feature has reached the end of the Hierarchy tree, or if the query cannot be found, the user will receive a message window informing them of this.
3) Once the user has located the section for their query, they simply click inside the
corresponding check box until they see a check mark.
4) To reduce the clutter that can occur in the System Hierarchy Selection Window, once a selection has been made, click on the Expand to Selected Nodes button. If you wish to expand the entire Hierarchy tree, simply click on Expand All.
5.2 ILI Runs
Once the query location has been selected, the ILI Runs window will populate with all ILI runs that have been aligned to the query location from the IRAS database.
Figure 21: ILI Runs window
ILI runs aligned with the selection made in the System Hierarchy will appear here.

ILIAnalyst 27
5.3 Analysis Tools
There are 13 analysis tools used to analyze an ILI dataset. They are located underneath the ILI Runs. The analysis tools and their functions are summarized in the following table. Table 3: Analysis Tool Buttons
Tool Buttons Function of the Tool
To view the inspection location as well as information about the ILI data set.
To display the anomalies by anomaly type.
To display anomalies by clock position and odometer.
Displays the location of facilities along the ILI run.
To perform a corrosion rate simulation.
To display the number of corrosion and non-corrosion anomalies found within a user specified increment shown in 3D bar graph format.
To display the ILI data set in grid format.
To display the anomalies that meets or does not meet the anomaly acceptance criteria on a depth by length plot.
To perform an anomaly growth simulation.
To examine the quality of an ILI data set supplied by an inspection vendor.
The Unity plot shows the ILI tool depth % versus the measurement taken at excavation to enable ILI error bands to be formulated and reviewed. NOTE: Excavation data must be entered in the IRAS database to see this.
To calculate the probability of failure of anomalies at a specified year in the future and to view calculated anomalies that exceed a user defined acceptance level
To calculate the overall probability of failure for the ILI data set over a specified number of years
To visually compare two ILI run data bands one on top of the other.
To examine the operating and design pressures according to the failure pressure in the cluster and callbox features.

ILIAnalyst 28
To examine features along a piece of a pipeline and create excavation reports for field staff.
The Report section allows the user to choose from a list of reports to run.
Once the user has selected the hierarchy criteria and clicked on the applicable ILI run within the ILI runs window then they can click on the Run button. All data is pre-loaded to the user needs only to click through the Analysis Tool Buttons to view the results. As the user clicks through the different buttons the header information that appears above the ILI runs window will display the current tool selected. In the example below Metal Loss Type Plot is selected and the header changes accordingly.
Figure 22: Analysis Tool Header

ILIAnalyst 29
The results are displayed in two different panes, the ILI Data Pane and the ILI Charts Pane.

ILIAnalyst 30
6.0 ILI Data Pane
There are three components to the ILI Data Pane: Menu toolbar, Display, Display Options.
6.1 Menu Toolbar
The menu toolbar within the ILI Data Pane affects the display of ILI results. Table 4 below explains the function of each of the menu options. Table 4 ILI Data Pane Menu Toolbar
Menu Option Function of the Option
Copy - Creates a copy of the ILI Data band for use in any Windows application that permits pasting
Zoom In - magnifies the ILI Data Band, increasing the resolution.
Zoom Out - shrinks the ILI Data Band, decreasing the resolution
The Full Extent command displays the extents of the entire ILI Run.
The Extend Backward command displays the previous view of the ILI Data Band.
The Forward Backward command displays the subsequent view of ILI Data Band.
Synch Zoom – Synch visibility in the ILI Data Band or Chart with the map.
Filters the anomalies surface displayed in the ILI Data band and the ILI Charts by All Surfaces, External, Internal, and Mid-Wall.
Filters the anomalies severity displayed in the ILI Data band and the ILI Charts by All Anomalies and Most Severe.
Filters the anomalies Location displayed in the ILI Data band and the ILI Charts by All Locations and HCA Locations.
Filters the anomalies in the ILI Data band and the ILI Charts by All Corrosion, Cluster Data, and Callbox Data, Crack Data
Options allow the user to set colors and categories for corrosion ranges and non-corrosion ranges, as well as, the chart loading option and the range for Dig Sheets.

ILIAnalyst 31
6.1.1 Display
Figure 23: ILI Data Pane
This chart is used to display the orientation, location of each defect, pressure and inspection range on the pipeline. The start and end positions of the inspection range are displayed by a green line at the beginning and end of the chart. Each button in the color scale has a range (between two values) for the Peak Depth Percent (PDP) or Rupture Pressure Ratio (RPR) associated with it. The third drop-down option is Anomaly Response. Anomaly Response is the results of Liquids 195.452 or Gas 193.233 rule sentencing performed by the Chainage Alignment Tool. The Box Color option is used to switch between the three plot types (display PDP or by RPR or by Anomaly Response). For example, in a RPR plot, as shown in Figure 18 above, the yellow button has an upper value of 1 and a lower value of 0.72. A defect appearing in yellow corresponds to a RPR value between the two values. The values in the color scale have been predetermined but can be changed manually by clicking on the ILI Option button. Detailed configurations of these values are discussed under Display Options. Inactive anomalies are always represented by a gray color in the legend. All inactive defects are displayed when the Inactive Data feature is enabled. The button will appear gray when the feature is enabled and defects are displayed in gray to indicate that they are inactive. Defects may be inactive due to a remedial measure completed after the inline inspection date, such as a pipe replacement, sleeve, clock spring, or re-coating. To plot only certain ranges in PDP or RPR, disable the range not to be plotted. To do this, click on the color button that corresponds to the range to be disabled. The range is disabled when the button is gray. To plot defects with the maximum RPR specified in the color scale enable toggle the Use Max Value.

ILIAnalyst 32
6.1.2 Display Options
The Dynamic Options within the ILI Data pane display sets up the defaults for values and colors that display here.
Figure 24: ILI Data Pane Display Options
Clicking on the Options button will bring up the Options window. This is where default color and category values are set up.
Figure 25: Options -> Corrosion Ranges
1. Corrosion Ranges:
For Box Color = RPR default colors can be set, RPR rate categories, max value, severity
threshold, and to show small features.
The drop-down option here allows the user to configure values for:
RPR
PDP
Anomaly Response
ILI Data Legend categories here are set through the Options button.

ILIAnalyst 33
For Box Color = Peak Depth % default colors can be set, Percentage rate categories, max
value, severity threshold, and to show small features.
For Box Color = Anomaly Response default colors can be set, Response names are
assigned through the Chainage Alignment Tool and loaded into IRAS (these cannot be
edited), max value, severity threshold, and to show small features.
2. Non-Corrosion Ranges:
For Box Color = Depth % NPS default colors can be set, Percentage rate categories, max
value, and severity threshold.
For Box Color = Anomaly Response default colors can be set, Response names are
assigned through the Chainage Alignment Tool and loaded into IRAS (these cannot be
edited), max value, and severity threshold.
Figure 26: Options -> Non-corrosion Ranges
3. General
Options to Load Selected Chart or all Charts when clicking Run. Choosing all will slow down performance.
Dig Sheet List Anomalies within range setting.
The drop-down option here allows the user to configure values for:
Depth % NPS
Anomaly Response

ILIAnalyst 34
Figure 27: Options -> General
7.0 ILI Charts Pane
There are three components to the ILI Charts Pane: Menu toolbar, Display Chart, Display Legend.
Figure 28: Charts with Analysis Tool Metal Type Plot Selected
Main Menu Toolbar
Display Chart
Display Legend

ILIAnalyst 35
7.1 Menu Toolbar
The ILI Charts menu toolbar has many of the same functions found in the ILI Data menu toolbar. Table 5: ILI Charts Menu Toolbar
Menu Option Function of the Option
Copy - Creates a copy of the ILI Display Chart for use in any Windows application that permits pasting.
Zoom In - magnifies the ILI Display Chart, increasing the resolution.
Zoom Out - shrinks the ILI Display Chart, decreasing the resolution
The Full Extent command displays the extents of the entire ILI Display Chart.
The Extend Backward command displays the previous resolution of ILI Display Chart.
The Extent Forward command displays the subsequent resolution of the ILI Display Chart.
The Synch Zoom command synchs the position of the ILI chart to the map. NOTE: This option is only available for charts with odometer values on the x-axis.
Orientation Plot
Facilities
Corrosion Rates
Anomaly Histogram
Grow Anomaly
QC Vendor Data
POE Plot
Run Comparison
Pressure Profile
Direct Examination Site
The Grid View button allows the user to see the information displayed as a graph in data grid format. From here the data can be sorted and exported. This button only appears if the current view is the Chart View.
The Chart View button allows the user to toggle back to the graphical chart from the Grid View. This button only appears if the current view is the Grid View.
NOTE: All Charts will load in the Chart View mode. To view the raw data select Grid View once loaded.

ILIAnalyst 36
7.2 Display Chart View
Figure 29: ILI Charts with Analysis Tool Metal Loss Type Plot Selected Chart View
The Display will show results based on what Analysis Tool option was selected, i.e. Figure 29 above shows the Metal Loss Type plot. Results are usually displayed in a graphical or tabular format, except for the Inline Inspection summary display. Graphical displays will have an x-axis and y-axis, with axis names and units specified. The title is also shown and matches the name as chosen on the Analysis Tool selection.
7.3 Display Legend
Additional information is displayed in the Display Legend portion and is dependent on what Analysis Tool was selected. Anomalies are grouped and summarized, and can be turned on and off to customize the Display. For the example, in Figure 29, metal loss types are broken down into surface types and then corrosion description, with a summarized count.

ILIAnalyst 37
7.4 Display Grid View
The Grid View shows the raw data in a spreadsheet format. Data can then be grouped analyzed and exported.
Figure 30: ILI Charts with Analysis Tool Metal Loss Type Plot Selected Grid View
7.4.1 Grid View Toolbar
Figure 31: Grid View Toolbar
Grid View Toolbar
Main Menu Toolbar
Data Grid
Grouping
Print Preview
Show Group Footer
Show Summary Footer
Show Indicator
Show Headers
Show Grid
Full Collapse
Full Expand
Auto Width

ILIAnalyst 38
1. Grouping: The button next to print preview is labeled Grouping. When toggled, this button displays a “Drag a column header here to group by that column” space at the top of the Tabular Grid View Panel. Simply drag the column heading into the grouping space below the toolbar. In the picture below, the results of our query have been grouped by Metal Loss Type.
Figure 32: ILI Grid View Group by Feature (Metal Loss Type)
2. Show Summary Footer: The button next to Grouping is labeled Show Summary Footer. When toggled, this button displays a footer field at the bottom of the Grid View window. The user can then use the footer to provide additional mathematical calculations on each column within the window. Any one of the following mathematical equations can be assigned to each column within the footer: Sum, Min, Max, Count, Average, or None. The user simply right clicks within the footer under the appropriate column to assign the function.
In Figure 29 below, we see the mathematical equations drop-down menu that appears when you right-click within the footer. Count assigned in the footer and brings back the total number of records. Max returns the maximum value found within all records. Min returns the minimum value found within all records. Average returns the average of all records in the selected column. Sum returns a total of all the records for that column. Choosing None will clear any operations assigned.
Group by Column

ILIAnalyst 39
Figure 33: Summary Footer and Mathematical Equations
Summary Footer
Right-click for mathematical equation menu.

ILIAnalyst 40
3. Show Group Footer: The button next to Show Summary Filter is labeled Show Group Footer. When toggled, this button displays a footer field at the bottom of the grouping within the Grid View window. The user can use the footer to provide additional mathematical calculations on each column.
Figure 34: Show Group Footer and Mathematical Equations
4. Show Indicator: The button next to Show Group Footer is labeled Show Indicator. When
toggled, this button displays a navigator bar on the left-hand side of the Grid View window.
5. Show Headers: The button next to Show Indicator is labeled Show Headers. When toggled, this button displays the headers of each column within the Grid View window.
6. Show Grid: The button next to Show Headers is labeled Show Grid. When toggled, this button displays the grid lines around all cells within the Grid View window.
Figure 35: Show Group Footer and Mathematical Equations
Summary Group Footer
Show Grid Show Headers
Show Indicator

ILIAnalyst 41
7. Full Collapse: The button next to Show Grid is labeled Full Collapse. When toggled, this button collapses the data within Grid View window to the first Grouped Level.
Figure 36: Grid View with Full Collapse
8. Full Expand: The button next to Full Collapse is labeled Full Expand. When toggled, this
button expands the data within Grid View window to the last Grouped Level.
Figure 37: Grid View with Full Expand
9. Auto Width: The button next to Full Expand is labeled Auto Width. When toggled, this
button collapses the data to fit within the Grid View window.
To change the width of a column, first point to the right edge of the column heading. This will change the mouse pointer to a vertical Resize Bar with an arrow on each side of the bar. When the Resize Bar is shown, click and hold the left mouse button and drag the mouse left or right to adjust the width of the column
Full Expand
Full Collapse

ILIAnalyst 42
10. The Export feature can be used to export the results to Microsoft Excel, XML, HTML, Text, CSV, or a Delimited file. To do this, click on the down arrow beside the button, and click the desired output format. Next, click on the Export button to save the output to file.
Figure 38: Export options in Grid View
8.0 Project Inspector Pane
Figure 39: Project Inspector Pane
The Project Inspector Pane allows the user to open several different ILIAnalyst projects and tabs simultaneously between different ILI runs. For every new project created, a tab will appear on the Project Inspector Pane. The user can click on any of the tabs to cycle between ILIAnalyst runs.
9.0 Status and Progress Bars
Figure 40:: Status and Progress Bars

ILIAnalyst 43
The description of the data loading or calculation process can be seen in the Status and Progress Bars, shown on a separate window. After selecting an ILI run to analyze and clicking on the Run button, a new window will appear that describes the calculation process.
10.0 Example of an Analysis Tool Output
Figure 41: Analyzing an Output Chart
Figure 41 illustrates an example of an output using the Orientation Plot tool where the y-axis represents the orientation of the anomalies (the o’clock position) with their odometer readings on the x-axis. The title of the chart identifies the information being plotted. The Display Legend Panel beside the chart describes the contents of the chart. Please refer to the Appendix to see descriptions of frequently used features that may be in a particular analysis tool.
Plot Area
Chart Title
Window Zoom

ILIAnalyst 44
11.0 Inspection Summary
The Inspection Summary tool will display the inspection location of the selected ILI dataset and information about the dataset in the text fields.
Figure 42: Inspection Summary Tool Chart
Inline Inspection Data – the data displayed on the line directly under the ILI Charts tool bar; displays information taken from the InlineInspection.txt file provided by the vendor describing the ILI run. Inspection Range – the data displayed here describes the range for a particular ILI run; information includes start and end valve section, survey stations and run status.
Inspection Range
Inline Inspection Data

ILIAnalyst 45
12.0 Metal Loss Type Plot
Figure 43: Metal Loss Type Plot Tool Chart
The Metal Loss Type Plot tool is used to plot cluster data by anomaly type. The chart is divided into areas by corrosion type based on the dimensions of the anomaly. These areas are labeled to identify the type of anomaly. A unique color is assigned to each anomaly type that corresponds to the colored boxes, located in the Display Legend Panel. The text field next to each color box displays the total number of anomalies by type. The following list shows the types of anomalies that may be present:
- Inactive - Pinhole - Pitting - General - Axial Pitting - Axial Slotting - Axial Grooving - Circumferential Pitting - Circumferential Slotting - Circumferential Grooving
The Display Controls Panel exhibits an anomaly count and is broken down by surface type and metal loss type. The width and length of each cluster can be determined by its position on the chart.
For example, the cluster as shown in the chart has an approximate width of 52 cm and a length of 35 cm and is categorized as General.
Cluster
Display Legend
Metal Loss Type Plot

ILIAnalyst 46
13.0 Orientation Plot
Figure 44: Orientation Plot Tool Chart
The Orientation Plot tool plots the anomalies by clock position (y-axis) and odometer (x-axis). The top of the pipe is at the 0:00 o’clock and returns to the top of the pipe at the 12:00 o’clock, moving around the circumference of the pipe in the clockwise direction. With every Analysis Tool selected, the ILI Data pane will always show the Peak Depth, RPR or Anomaly Sentencing of the anomalies. The displayed anomalies in the Orientation plot are colored to correspond to the color Peak Depth or RPR scale. This scale represents the incremental increase in Peak Depth or RPR values (from bottom to top). Running the Orientation Plot happens in the beginning after hitting the Run button. All Analysis Tools are run and therefore the user will not need to rerun when moving from one analysis tool to another.
Display Legend
Orientation Plot

ILIAnalyst 47
14.0 Facilities
This chart displays the facilities that were loaded with the ILI run. The facilities are displayed as non-oriented because these are not part of the pipeline. In conjunction with the ILI Data Band Chart, the user can see what facilities exist to nearby anomalies. Specific location and details information can be seen selecting Inspector tool.
Figure 45: Facilities Chart

ILIAnalyst 48
15.0 Corrosion Rates Plot
Figure 46: Corrosion Rates Plot Tool Chart
Figure 47: Corrosion Rate Options
The corrosion rate of call boxes can be simulated using this analysis tool. The results of the simulation will display the corrosion rate of each anomaly on the y-axis and its odometer reading on the x-axis. The corrosion rate of the call boxes is displayed as a scatter plot. Each individual corrosion rate is color-coded to match the colors as displayed on the ILI Data Pane.
Corrosion Rates Plot
Corrosion Rate Options
Numerical display of Corrosion Rates

ILIAnalyst 49
The Display Controls Pane shows a breakdown of the corrosion features and their corresponding minimum, maximum and average rate grouped by odometer distance and surface.
15.1 Running a Corrosion Rates Plot
To Perform a Corrosion Rate Simulation:
1) Select which Anomaly Type to display: Clusters, Call Boxes
2) Specify the number of Corrosion-Free Years. Enter number or select the Up and Down buttons.
3) Click Apply and OK and the new rates will calculate.
NOTE: When selecting Anomaly Type or Corrosion-Free Years, there is
no need to rerun to view the results.

ILIAnalyst 50
16.0 Anomaly Histogram
Figure 48: Anomaly Histogram Tool Chart
This bar graph chart displays the number of anomalies that exist within a given range. These anomalies are color coded according to the RPR of the corrosion and Depth % of the non-corrosion groups they represent. To change the increment value click within the field and type the new value. Use the Enter key to force the graph to refresh with the new values.
Select bar graph incremental number here
Display Legend

ILIAnalyst 51
17.0 Feature List
Figure 49: Feature List Tool Chart
The Feature List tool allows the user to view ILI data in a tabular format. The picture above shows an anomaly listing describing feature type, location, feature measurements and other information. If the information in the column is not clearly visible, adjust the column width by moving the mouse pointer to the edge of the column heading until resize handles appear, and then drag the handles to resize the column. Refer to the Grid View section of this User Manual for information regarding the options available for sorting data.

ILIAnalyst 52
18.0 Sentencing Plot
Figure 50: Sentencing Plot Tool Chart
The Sentencing Plot tool can be used to determine if clusters satisfy or fail to meet the acceptance criteria defined by the user. As shown in Figure 48, the clusters’ depth percentage and length are plotted with the acceptance line(s). Each acceptance line is plotted according to the user defined acceptance criteria and pipe attributes combination (i.e. NPS, WT, Grade and MOP). If clusters do not meet the acceptance criteria, they will appear above the acceptance line in the chart. Under the ILI Charts Menu Toolbar, the Acceptance Criteria option can be changed by selecting from the drop-down menu. The drop-down list box allows the user to define the acceptance criterion by RPR or MOP x the value entered (MOP*). The default setting for the PDP is 80 % and cannot be changed. The ILI dataset may contain pipe data with distinct combinations of nominal pipe size, wall thickness, grade and MOP. An acceptance line is plotted for each combination, and the details are outlined in the Sentencing Plot Legend on the right hand side of the screen. The colored buttons in this panel are active buttons and can be turned on and off simply by clicking on them. To unselect an option, click on the button and the corresponding Acceptance line will disappear. Click the button again to bring the line back. The acceptance criteria and the selected pipe attributes combination will determine the plot of the acceptance line and therefore determine the severe anomalies.
18.1 Running a Sentencing Plot
To Run Sentencing Plot:
Sentencing Plot
Sample pipe characteristic combination
Acceptance Criteria Specification

ILIAnalyst 53
1. Select RPR or MOP* from the Acceptance Criteria drop-down list box. 2. In the text box next to the list box, specify a value for the RPR or a value that is to be multiplied
by the MOP. 3. By default the acceptance lines for all pipe combinations are plotted when the data is first
loaded. After the data has been loaded, a different acceptance criterion can be specified by entering the new value in the text box. The graph will automatically update without having to select the Run button once again.

ILIAnalyst 54
19.0 Grow Anomaly
Figure 51: Grow Anomaly Tool Chart
This tool is used to perform a call box growth simulation, and the results of the simulation can be saved to the database. The original call boxes are grown and then clustered based on the criteria defined by the user. The diagram below illustrates how call boxes are grouped to form clusters. The original call boxes, grown call boxes, interaction rule applied, and new clusters can all be displayed simultaneously in the plot. Before results can be displayed in the plot, several inputs are required by selecting the Options tool in the ILI Charts Menu Bar. The following describes the steps to running the tool.
Grow Anomaly
Cluster
Cluster Edge
Interaction Area - Equal distance in each direction of the call box
Interaction Area – Equal distance in each direction of the call box
Call Box
Call Box
Clustering If the interaction areas intersect or touches (green areas), the call box is considered part of the cluster (orange area)
Options
Display Legend shows the values set in the Options.
Grid View
ILIAnalyst 55
19.1 Grow Anomaly Options
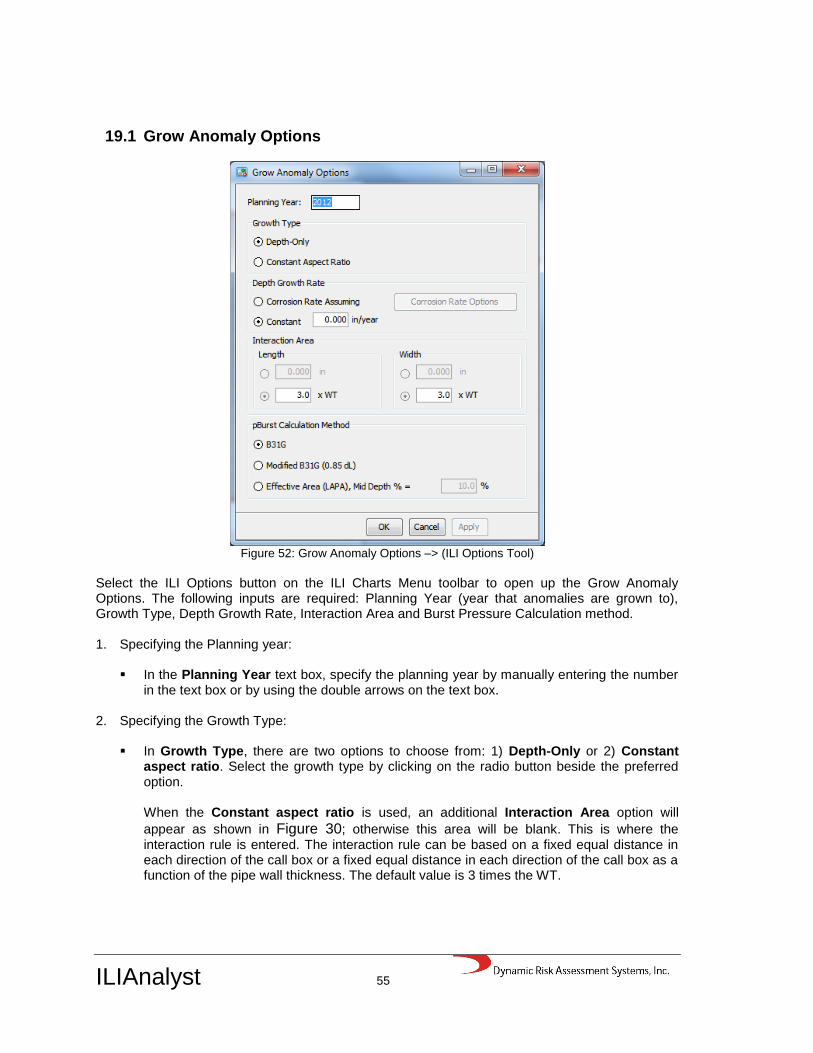
Figure 52: Grow Anomaly Options –> (ILI Options Tool)
Select the ILI Options button on the ILI Charts Menu toolbar to open up the Grow Anomaly Options. The following inputs are required: Planning Year (year that anomalies are grown to), Growth Type, Depth Growth Rate, Interaction Area and Burst Pressure Calculation method. 1. Specifying the Planning year:
In the Planning Year text box, specify the planning year by manually entering the number in the text box or by using the double arrows on the text box.
2. Specifying the Growth Type:
In Growth Type, there are two options to choose from: 1) Depth-Only or 2) Constant aspect ratio. Select the growth type by clicking on the radio button beside the preferred option.
When the Constant aspect ratio is used, an additional Interaction Area option will
appear as shown in Figure 30; otherwise this area will be blank. This is where the interaction rule is entered. The interaction rule can be based on a fixed equal distance in each direction of the call box or a fixed equal distance in each direction of the call box as a function of the pipe wall thickness. The default value is 3 times the WT.

ILIAnalyst 56
Figure 53: Interaction Area

ILIAnalyst 57
Selecting Depth-Only will simulate the depth of the clusters only, using the original cluster data. New clusters are not formed using this option since the depth is only simulated using the original clusters and no re-interaction is required.
3. Specifying the Depth Growth Rate:
There are two options in Depth Growth Rate: 1) Corrosion rate assuming years corrosion free or 2) Constant (mm/yr or mil/year). Click on the radio button next to the depth growth rate to be used. In Corrosion rate assuming years corrosion free, use the double arrows to specify the number of years corrosion free or manually enter the value in the text box. To simulate the growth rate based on a constant growth rate, enter the value in the Constant text box.
Figure 54: pBurst Calculation Method
4. Specifying the pBurst Calculation Method:
In the pBurst Calculation Method tab, the burst pressure calculation method is defined. The calculation methods are as follows:
B31G Modified B31G (0.85 dL) Effective Area, minimum depth %

ILIAnalyst 58
19.2 Running a Grow Anomaly Simulation
Once the above steps have been completed, the final step is to initiate the simulation. Click on the Apply button. The graph will dynamically update to show the grown corrosion anomalies.
19.3 Grown Anomalies
Figure 55: Grown Severe Anomalies Chart Grid View
Click on The Grid View button to view a list of grown anomalies as shown in the picture above. The table highlights the different properties associated with the grown corrosion, such as peak depth, surface, failure pressure, etc. Clusters are considered severe based on the severe anomalies criterion set in Preferences, as mentioned above in Grow Anomaly Options. In the screen, the table will display the anomalies and their attributes with a plot of the anomalies by odometer in the top half of the ILI Charts screen.
20.0 QC Vendor Data
Figure 56: QC Vendor Data Tool Chart
This analysis tool examines the quality of an ILI data set supplied by a vendor. It compares the data reported by the ILI tool to a calculated dataset based on the information in the database and the call box data. The calculated dataset is generated by re-interacting the call boxes. The cluster position, dimensions and burst pressures are compared to generate a suspect list showing
Points to the highlighted anomaly in the Severe Anomaly Summary Table

ILIAnalyst 59
mismatches between the two datasets using the user’s preferences for error tolerances. This ILIAnalyst feature relies upon high resolution tool data. To specify QC defaults, click on the Options button to open up the QC Vendor Data preferences window.
Figure 57: QC Vendor Data Options
Under Interaction Area, the user can specify a callbox interaction rule that can be defined as:
Constant – fixed distance in both the axial and circumferential direction, or Function of the wall thickness – WT x (ratio of WT) + (offset distance); i.e. 3T + 0.5in
Under pBurst Calculation Method, select the radio button that corresponds to the burst pressure calculation that the vendor used. Under Show suspect list where differences are greater than, the user can specify error tolerances for:
Table 6: Cluster Parameters
Length
Station
Width
Odometer
PDP
Orientation
pBurst (Burst Pressure)
Once all the parameters have been entered, a suspect list is generated that highlights mismatches between the data delivered by the vendor and the calculated dataset. The table is divided into 3 tabs: Matched Clusters, Mismatched Clusters – Vendor Data, Matched Clusters – Calculated Data.

ILIAnalyst 60
Figure 58: Grid View Suspect List Showing Mismatches
The ILIAnalyst QC window will appear once options have been applied. Click on the Grid View button for tabular lists. Each tab represents a different tabular set of data. The first tab will list all Matched Clusters between the vendor and calculated data. The second tab will list all Mismatched Cluster – Vendor Data, which shows all cluster information that did not match the calculated clusters. The final tab will list all Mismatched Clusters – Calculated Data, which shows all calculated clusters that did not match the vendor provided clusters. Plotting Mismatched Clusters Mismatched clusters can be plotted so that the user can analyze them graphically. Select Chart View. The elements such as the original call box, vendor cluster, interaction area, and calculated clusters in the chart are described in the Show in Chart option. These can be turned on or off by clicking on the color-coded icons in the legend panel. Whenever a mismatched cluster in the ILIAnalyst QC table is highlighted, the plot automatically zooms into that cluster. From the plot, the user can then graphically determine the location and length of the mismatched cluster and the reason for the incorrect interaction.

ILIAnalyst 61
21.0 Unity Plot
Figure 59: Unit Plot Tool Chart
The Unity Chart tool allows the user to perform POE (Probability of Exceedance) analysis, by supplying a statistical distribution of the ILI tool accuracy (predicted vs. actual). This distribution derived from these data points serves to characterize the measured size of the anomaly compared to the size as reported by the ILI tool. A confidence interval can also be applied to showcase whether the ILI tool calls are dominantly conservative, non-conservative or within specification. Typically, a tool’s accuracy for detecting corrosion depth will be at 80% of their calls within +/- 10% of the depth. There are four chart parameters for the user to set and they are marked as Chart criteria in the picture above.
1. Dataset: This Inspection, This ILI Vendor, This ILI Tool, This Vendor & Tool
2. Comparison Type: Length, Width, Depth(%)
3. Error Bands: supply a lower and upper percentage value here. To view the data, click on the Grid View option from the menu toolbar.
Chart criteria

ILIAnalyst 62
22.0 POE Plot
Figure 60: POE Plot Screen
The screen above is an example of an output from the POE Plot analysis tool. This tool calculates the POE (Probability of Exceedance) for each clustered anomaly in the ILI data set on a specified year. POE is expressed in terms of probability of failure. The POE calculation is done for both Leak and Rupture failure modes for each anomaly. The POE of the anomaly is displayed on the y-axis with its odometer position on the x-axis. Leak POE’s are displayed with red and blue points and rupture POE’s are displayed with darker red and darker blue points. The user can isolate which anomalies to showcase by clicking on the corresponding colored buttons located on the Display Control Pane. The plot is defaulted to calculate POE to an evaluation year of 2012 and an acceptance level of 0. The user can change the plotted results by entering a year in the Evaluate to box and entering a POE acceptance level number in the Acceptance Level box. The plot will change dynamically so there is no need to rerun the analysis. Click on Grid View to see the data.
Acceptance Line
Corrosion Failure Type and Acceptance Levels

ILIAnalyst 63
23.0 POE Summary Plot
Figure 61: POE Summary Plot Screen
The POE Summary Plot displays the total leak POE and the total rupture POE for all anomalies in a single inspection. POE values are reported for each year between the inspection date and the Analysis Year to establish trend lines. The chart will display the results for the Leak and/or Rupture scenarios according to the selections under the Display Legend. To perform a POE Summary calculation, enter a year in the Evaluate to box. The chart will automatically update after any changes in the user input. If necessary, use the magnify glass zoom controls to closely inspect the chart. Click on Grid View to see the data.

ILIAnalyst 64
24.0 Run Comparison Chart
This chart allows the user to compare two ILI runs by loading a second ILI Data band run here. The user can now see the changes between the two ILI runs.
Select ILI run to compare
Figure 62: Comparing two ILI runs
Select the ILI run to load in the chart by clicking on the drop-down arrow in the Select run to Compare option.

ILIAnalyst 65
25.0 Pressure Profile Chart
The Pressure Profile chart displays clusters with failure pressures that exceed Operating Pressure and Design Pressure by default. It also displays pressures within the limit. Operating and Design pressures are presented as horizontal colored lines on the chart. Deselecting the Failure Pressures button will display only clusters with failure pressures within operating or design parameters.
Figure 63: Pressure Profile Screen
Display Clusters whose failure pressure is higher than operating and design pressure Toggle Pressures on/off by clicking
the color in the legend.

ILIAnalyst 66
26.0 Direct Examination Site Chart
This chart displays digs that have occurred along the pipeline that the ILI run was performed on. Similar to the chart in our DataView application, the user can identify the sites and view the excavation report for more details or choose to edit excavation data. There are two extra buttons on the toolbar, Dig Data Collector and Dig Data Collector Sheet; these will be explained in detail below.
Figure 64: Direct Examination Site Chart
Dig Data Collector
Dig Data Collection Sheet
Toggle on/off the Direct
Examination Site categories in the
chart.

ILIAnalyst 67
26.1 Excavation Report
The excavation report can be launched from the <Click Here> in the Inspector Tool.
The Report Preview window will appear displaying the seven page report as seen in the figure below.
Figure 65: Excavation Report Preview
The Report Preview window gives the user the ability to search through pages, save and print the report.

ILIAnalyst 68
26.2 Edit Excavation Data
The Edit Excavation Data window can be launched from the <Click Here> in the Inspector Tool. The Excavation Data – [Editing] window will appear as seen in the figure below. The left-hand pane lists the Excavation site categories that can be selected and then edited within the right-hand pane of the Excavation Data – [Editing] window.
Figure 66: Excavation Data – [Editing]
Table 7: Excavation Categories
Main Categories Subcategories Editable Fields (Y/N)
Excavation Site Pipeline and General Location N (View Only)
Excavation Site Y
Pipe Condition Y
Soil Resistivity at Grade Y
Soil Resistivity at Pipe Depth Y
Terrain, Soil Type, Condition Y
Analysis Pipe-to-Soil Potential at Grade Y
Pipe-to-Soil Potential in Ditch Y
Soil Analysis Y
Water Analysis Y
MIC Analysis Y
Select a category to edit. The green arrow indicates current selection.
Edit data in this pane.
Site Diagram.
Collapse and Expand Categories

ILIAnalyst 69
pH test Y
Coating Coating Condition Y
Coating Thickness Y
Corrosion Deposit Y
Coating Defects Y
Defects Pipeline wall thickness from UT gage Y
Corrosion Defects Y
Mechanical Defects Y
Excavation Data – Editing: The right-hand side of this pane allows the user to edit data on the categories with Editable Fields = Y from Table 7. Bold parameters in the edit data pane indicate required fields. On the Site diagram NDE (Non Destructive Evaluation) to reference GW (Girth Weld) Start and End values set constraints for Distance from GW on other fields (must be within the range set there).
Figure 67: Editing Excavation Site \ Excavation Site
Site Diagram.
Edit data in this pane.

ILIAnalyst 70
- Exporting the data in the editing pane is performed by selecting the format for export and clicking on the export button.
- Print the data within the group displaying on the right-hand pane.
- Headers, display the Parameter headings i.e. Date, Excavation Site Name, etc.
- Show Grid: Display grid lines on the pane.
- Full Collapse: Collapse the parameters to the highest level.
- Full Expand: Expand the parameters to the lowest level.
- Show Orientation as clock position – in the data grid for display and editing.
- Show orientation degrees – in the data grid for display and editing.
- Show/Hide Range in Caption – Displays the data range for appropriate parameters being modified i.e. length, width, latitude, longitude etc.
- Set Data Edit Style - default data grid view for most subcategories.
- Set Data Edit Style - alternative editing style only available on Coating Thickness and Pipeline wall thickness from UT gage where the user can chose to enter data on the pipe diagram as opposed to a data grid.
- loads all the corrosion defects, that appear within the NDE to Reference GW range, for editing. This button is only available when the Subcategory Corrosion Defects is selected for editing.
- loads all the mechanical defects, that appear within the NDE to Reference GW range, for editing. This button is only available when the Subcategory Mechanical Defects is selected for editing.
- Shows the Site Diagram at the top of the Editing pane. Once edits are complete clicking Apply will save the changes without closing the editing window. Clicking OK will save the edits, but it will also close the editing window.

ILIAnalyst 71
26.3 Excavation Data [New]
Adding new excavation data into the database is performed by clicking on the tool from the toolbar as seen in the figure below. This will launch the editing window.
Figure 68: Excavation Data [New]
Please refer to Section 26.2 on how to enter data via the editing pane.
26.4 Dig Data Collection Sheet
Generating a report used for performing an excavation can be done via the Dig Data Collection Sheet tool on the Direct Examination Site toolbar.
Figure 69: Dig Data Collection Sheet

ILIAnalyst 72
Clicking the Dig Data Collection Sheet icon launches a report that can printed and sent to field staff to fill in.
Figure 70: Dig Data Collection Sheet Report

ILIAnalyst 73
27.0 Reports
27.1 Relative Distance Report
The relative distance report allows the user to Query ILI run data against either data in the GIS Facilities table or ILI Run Facilities. This report informs the user how many anomalies fall within a given proximity of a facility.
Figure 71: Relative distance Screen
The relative distance can be queried using two operations less than (<) and less than or equal to (<=). The left side of the report inputs allows the user to select Corrosions and Non-corrosion features against either the GIS facilities or this ILI run facilities. Once the report criteria have been selected then click on the Run Report button. Once the query is complete you will see the data in Grid View format.

ILIAnalyst 74
28.0 Map
The map feature for ILIAnalyst only becomes enabled if DataView has been installed on the same local machine.
Figure 72: Map Main Window
The map interface can be used to display spatial information. The images and vector layers consist of base data that the pipeline centerline is overlaid upon. To enable the map selections they first must be selected from the drop down then click on the Run button on the main toolbar. This will refresh the data. Select Map again and they will be there. If photo images or additional vectors are available they will now be in the drop down.
Main Toolbar
Legend
Spatial Information (coordinates and map projection)

ILIAnalyst 75
The following is a list of the features on the toolbar that can be used to view information in the map window. Table 8: Toolbar Features
Feature Button Feature Name Description of the Feature
Copy
The Copy option will allow the user to copy the current view in the Query Map windows and paste the copied current view into any Windows application that permits pasting.
Map Scale
The Map Scale allows the user to enter or select an appropriate distance ratio between the distance of the display map and the corresponding distance on earth.
Zoom In
To magnify the map, click on this button first to toggle it. Then specify the area to zoom to by clicking the left mouse button in the upper left corner of the area and hold down the button. Now move the mouse and a square will draw around the area to be queried, once satisfied, release the mouse button and the Map will zoom in.
Zoom Out
To shrink the map, click on this button first to toggle it. Then specify the area to zoom out of by clicking the left mouse button in the upper left corner of the area and hold down the button. Now move the mouse and a square will draw around the area to be queried, once satisfied, release the mouse button and the Map will zoom out.
Pan
The user can move the current view in any direction by using the Pan command. The scale of the map remains the same; only the position changes. To use Pan, click on the window and drag to change the view while holding down the mouse button.
Full Extent
The Full Extent command displays the extent of the entire map.
Extent Backward
The Extent Backward command displays the previous view of the map.
Extent Forward
The Extent Forward command displays the subsequent view of the map.
Pointer
The Pointer button lets the user reset any of the options that might be selected on the toolbar and allows the user to scroll freely without restrictions
Identify
The Inspector pop-up window will appear showing detailed information about a selected feature or attribute on the map.
Red Line
The Red Line indicator is used in conjunction between the map and the data band. When activated a red line will appear on the map indicating your position on the data band.
Map Selection
The Map Selections drop down window allows you choose what you would like displayed on the map.
Map Options
The Map options window is described in more detail within Appendix A.
Once the user has chosen a location on the map to view, the Identify tool can be used to retrieve information for a specific element in the window.
ILIAnalyst 76
29.0 Exiting ILIAnalyst
To exit the application, the user can do one of the following: 1. Click on the Exit button on the Window Bar, 2. Under the main drop-down menu, click on File and choose Exit, or 3. Click on the close window button.
30.0 Troubleshooting
If the program stops responding for any reason (such as the Oracle server or network temporarily going down), the user can try closing the application and restarting it.
If an Oracle error message is displayed, and the solution is not obvious, note the error and contact your DBA.

ILIAnalyst 77
31.0 APPENDIX A
Frequently Used Features
This section describes the features in ILIAnalyst that may be available in an analysis tools. These features allow the user to view or scroll through the data in a table or chart.
31.1 Zoom/Pan
Under the Zoom/Pan option group there are two options that control how the information in the chart is viewed when panning or zooming: 1) Horizontal Only or 2) 2D. The Horizontal Only option allows the user to move through information in the chart in the horizontal direction only when panning. Similarly, when zooming, only the horizontal axis will change and vertical axis will remain the same. The 2D option allows the user to pan in both the vertical and horizontal directions; thus the view in the chart will change in both directions.
31.2 Using the Magnifying Glass Zoom
Zoom In Magnifies the chart, increasing the resolution each time you click on the button.
Zoom Out Shrinks the chart, decreasing the resolution each time you click on the button.
31.3 Window Zooming
. Window Zoom - zooms to a specific location on a chart by dragging a rectangular area in any chart from the top left corner to the bottom right corner. The center of the dragged rectangle becomes the new display center, and the area inside the dragged rectangle is enlarged to fill the display area. Dragging a rectangle in the opposite direction from the bottom right to the top left will zoom out to display all of the data within the chart.

ILIAnalyst 78
31.4 Panning
To pan through the chart, click and hold down the secondary mouse button. Then drag to a desired location; this will not change the size of the chart but only the position.
31.5 Using Scroll Bars
When there are more choices or information that can fit in a list box or window, scroll bars are used to view through the items or information. To scroll through information displayed:
1. Drag the horizontal scroll box to scroll through all the information left or right. 2. Drag the vertical scroll box to scroll through all the information up or down.
The following techniques can be used to scroll: Table 9: Scrolling Techniques
To scroll Do this
One line up or down Click the up or down scroll arrow
Continuously Click on the scroll bar box and hold down the mouse button and then drag until the information you want comes into view
Up or down Use the track wheel on the mouse (If available)

ILIAnalyst 79
31.6 Map Options
In Map Options the user can customize the output. To access the Map Options dialog box, click
on the button within the Map toolbar ( ).
31.6.1 Map Information
This information window lets the user know whether they are using ESRI Map Objects or ARCGIS to display the map.
Figure 73: Map Information (MapObjects) Figure 74: Map Information (ARCGIS)
The options available for Behavior, Colors and Contours differ according to the Map Information being displayed. In version 4.3 applications the map uses a reference to an .mxd file it copies from the database to your local computer. Web Imagery and Specific imagery path locations are built by the Dynamic Risk team into the map that is then loaded into the IRAS database. As a result, we removed the Web Imagery, ARCSDE, and image path location setup windows as these are no longer utilized.

ILIAnalyst 80
31.6.2 ARCGIS - Behavior
Figure 75: Map Options – Behavior
Greyed out options are those available unavailable for ARCGIS map.
Include the map selections when selecting “Clear All Selections”. When this option is checked, then the map layers are cleared when the Clear All Selections option is used from the Edit drop-down on the main menu toolbar.
Multiple Pipeline Warning – When selected application will warn you when you have selected more than one pipeline from the map.
Figure 76: Map Options – Behavior – Warning
Map Refresh Delay – Allows the user to select a delay for the map progress bas in milli-seconds. A progress bar is displayed when the map is redrawing. For long updates is is helpful to know when the update is finished. For short updates it can de distracting. A delay can hide the progress bar for most of the short updates, but may appear to be unresponsive for longer updates if the delay is too long. We suggest leaving the default of 100 ms.

ILIAnalyst 81

ILIAnalyst 82
31.6.3 ARCGIS - Colors
Figure 77: Map Options – Colors
Chainage Wand - this feature allows you to select the color and size of the Chainage Wand for display on the map.
31.6.4 ARCGIS - Contours
Figure 78: Map Options – Contours

ILIAnalyst 83
Contour - The Contour options allow the user to enable contour(s), select the distance offset from the centerline and use the Change Color button to customized contour color(s) on the map.
HCA PIR - this option allows the user to select the distance offset from the centerline and use the Change Color button to customize HCA PIR color on the map.
Class CLU (Class Location Unit) – is the sliding mile used in calculating Class Areas and we can update the distance offset from the centerline, the length and the color for display on the map.
Class Circle - this option allows the user to select the distance offset from the centerline and use the Change Color button to customize Class Circle color on the map.
31.6.5 MapObjects - Behavior
Figure 79: Map Options – Behavior
Greyed out options are those available unavailable for MapObjects map. Map Selection:
Warn when selecting layers that layers will be drawn when the map is refreshed – this is a pop-up warning to the user. This is useful for large systems as it take time to display all the layers, OR
Automatically draw layers when selected – updates the map layers as they are selected from the legend.

ILIAnalyst 84
Include the map selections when selecting “Clear All Selections” - when this option is checked, then the map layers are cleared when the Clear All Selections option is used from the Edit drop-down on the main menu toolbar.
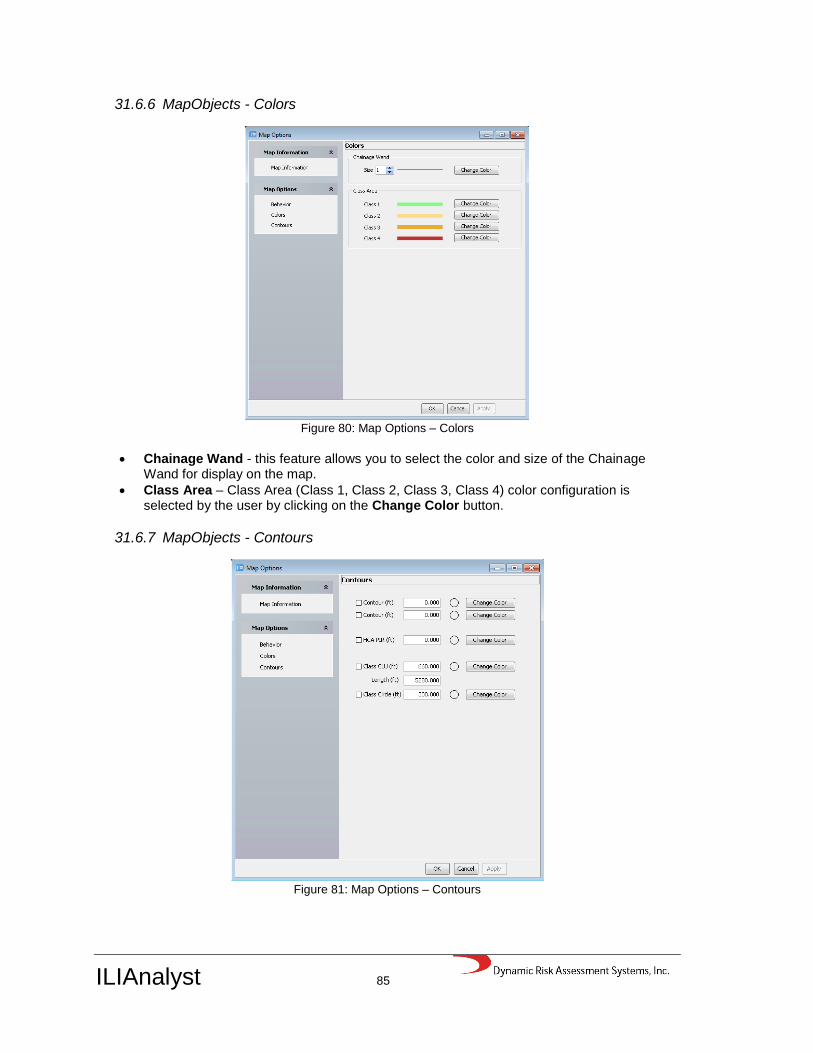
ILIAnalyst 85
31.6.6 MapObjects - Colors
Figure 80: Map Options – Colors
Chainage Wand - this feature allows you to select the color and size of the Chainage Wand for display on the map.
Class Area – Class Area (Class 1, Class 2, Class 3, Class 4) color configuration is selected by the user by clicking on the Change Color button.
31.6.7 MapObjects - Contours
Figure 81: Map Options – Contours

ILIAnalyst 86
Contour - The Contour options allow the user to enable contour(s), select the distance offset from the centerline and use the Change Color button to customized contour color(s) on the map.
HCA PIR - this option allows the user to select the distance offset from the centerline and use the Change Color button to customize HCA PIR color on the map.
Class CLU (Class Location Unit) – is the sliding mile used in calculating Class Areas and we can update the distance offset from the centerline, the length and the color for display on the map.
Class Circle - this option allows the user to select the distance offset from the centerline and use the Change Color button to customize Class Circle color on the map.


![Field Experience and Best Practices for Laser Assessment ... · in ASME B31G code [2] are well suited to both manual and automated analysis. An advantage of the laser scanning method](https://img.pdfslide.us/doc/110x75/5bc9f0f509d3f26d178b7e49/field-experience-and-best-practices-for-laser-assessment-in-asme-b31g-code.jpg)


![Fracture Control Strategy for the Conversion of Oil and ... · Fracture Control Strategy for the Conversion of Oil and Gas Pipelines to Transport CO2 ... B31G[ 20], modified ASME](https://img.pdfslide.us/doc/110x75/5b51ff647f8b9a7b648cbac0/fracture-control-strategy-for-the-conversion-of-oil-and-fracture-control.jpg)