Embed Size (px)
Citation preview
DIFFERENT STROKES: RESEARCHING THE UNUSUAL LIGHTNING DISCHARGES
ASSOCIATED WITH SPRITES AND JETS AND ATYPICAL METEOROLOGICAL REGIMES
Walter A. Lyons1*
, Tom A. Warner2, Steven A. Cummer
3, Steven A. Rutledge
4, Timothy J. Lang
4, Tiffany C. Meyer
4,
Gaopeng Lu3, Thomas E. Nelson
5 and Tim Samaras
6
1. FMA Research, Inc., Fort Collins, CO 2. Dept. of Atmospheric and Environmental Sciences, SD School of Mines and Technology, Rapid City, SD 3. Electrical and Computer Engineering Dept., Duke University, Durham, NC 4. Dept. of Atmospheric Sciences, Colorado State University, Fort Collins, CO 5. FMA Research, Inc., Tucson, AZ 6. Samaras Technologies, Bennett, CO
1. INTRODUCTION
It has often been quipped that thunderstorms are actually misnamed – after all, it is lightning that “does all the work.” In the first major investigation of deep convection, The Thunderstorm Project (Byers and Braham, 1949), lightning was barely addressed. This was, in large part, due to the lack of techniques and sensors suitable for synoptic characterization of lightning discharges on a storm scale. Though atmospheric electricity measurements date to the days of Benjamin Franklin, and the first lightning photograph was taken in 1876, for most of the 20
th century the
detection of audible thunder at a weather observation station was the primary determinant for a thunderstorm (with the resulting isoceraunic distributions serving as a surrogate lightning climatology). Direct measurements of lightning parameters were obtained using instruments on structures (McEachron, 1939), localized flash counters, streak cameras, and small-scale electric field mill networks which deduced in-cloud charge structures – all significant advances. Yet it remained for the introduction of the first lightning detection networks in the late 1970s (Krider et al., 1980; Cummins and Murphy, 2009), and 3-D lightning mapping technologies (Proctor, 1971), for science to begin a journey to obtain a fuller appreciation of the temporal and geographical variability of the lightning discharge and the range of meteorological environments (and even volcanic eruptions) which produce the massive electrical discharge we call lightning. The routine occurrence of positive polarity CG (+CG) strokes was not that long ago an object of speculation (Brook et al., 1980). In recent decades, the widespread deployment of operational 3-D lightning mapping arrays (LMAs), satellite borne sensors, and the availability of fixed and mobile low-light and high speed lightning imagers, in combination with
* Walter A. Lyons, CCM, FMA Research, Inc., Yucca Ridge Field Station, Fort Collins, CO 80524, [email protected]
GOES satellite and NEXRAD radar data, are allowing us to delve more deeply into the complexities of the lightning discharge - and its many impacts. This paper focuses on the unusual lightning discharges (or associated charge distributions in clouds), which result in a family of transient luminous events (TLEs) above storms. The most common of these, the sprite, was first documented using video in 1989 by Prof. Jack Winckler of the University of Minnesota (Franz et al., 1990). Since then, a variety of TLEs have been uncovered, with the attendant question of exactly what lightning or charge distributions give rise to these (relatively) rare events. These advances have led to an unexpected linkage between TLEs and some forms of upward lightning (Warner et al., 2012 - this volume) as well as the realization that extremely energetic lightning discharges can also occur within cold season precipitation systems. As the sophistication and coverage of our sensors improve, the more we investigate the lightning discharge, the more complexity and diversity we continue to find.
2. ENERGETIC LIGHTNING AND SPRITES
The discovery of sprites naturally led to investigations of their cause: (1) what characteristics of lightning induces these brief (1-100+ ms) discharges between 40 and 90 km altitude above storm tops, and (2) what type(s) of convective system(s) produce such unusual lightning? It quickly became apparent that a majority of sprites (at least in the U.S. High Plains) occurred above mature mesoscale convective systems (MCSs) (Lyons, 1994, 1996). Moreover, sprites were almost exclusively associated with energetic +CGs. These sprite parent +CGs (SP+CGs) tended to have larger peak currents (by 50%) than other +CGs in the stratiform region (Lyons, 1996; Boccippio et al., 1995).
Rapid advances in theory (see Pasko, 2010) confirmed long standing speculations that electrical breakdown could occur in the rarified air of the middle atmosphere if the electric field became momentarily
enhanced due to the removal of a large amount of charge to the ground by a CG. The key metric is called the charge moment change (CMC), defined as:
CMC(t) = Q(t) * Zq (1)
where Q(t) is the amount of charge (Coulombs) lowered to ground as a function of time (t), and Zq is the vertical extent of the lightning channel (km). By comparing optically confirmed observations of sprites to CMC values retrieved from sensors operating at extremely low and ultra low frequencies (ELF, ULF), various studies confirmed the apparent threshold range of CMC values required to induce a sprite to be on the order of 500 C km (Boccippio et al., 1995; Huang et al., 1999; Hu et al. 2002). Some of the charge appears to be lowered first by the return stroke, but to reach the sprite threshold value, usually a significant continuing current (CC) is required, thus favoring +CGs. We note, however, that theory suggests the triggering of a sprite should be largely CG polarity independent if the CMC is large enough. Yet, sprites induced by negative CGs have proven very rare.
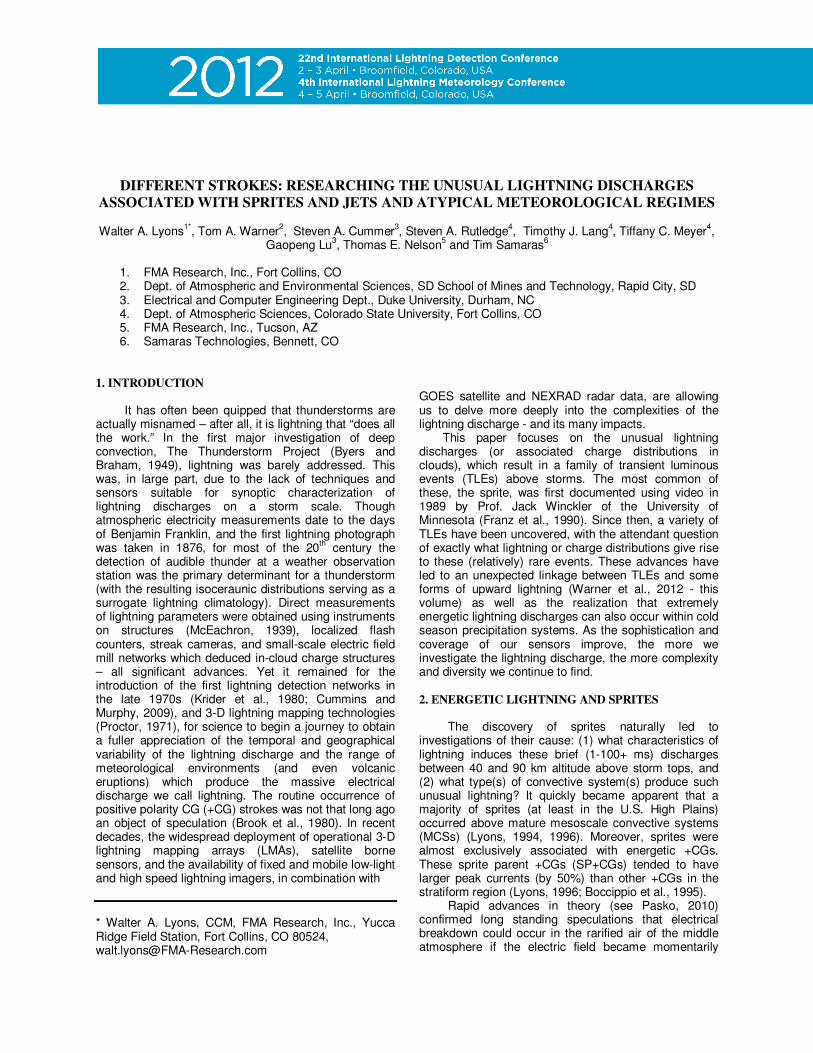
While energetic lightning is infrequent, it can occur in almost any type of electrically active system (Lyons, 2006), though by far the most prolific producers of sprites are large MCSs, in which the SP+CGs are often found near the secondary reflectivity maximum of the stratiform region (Lyons 1996, 2009; Lang et al., 2010.) Employing one or more low-light camera systems to
Figure 1. “Stereo” images of a sprite from SpriteNet cameras in Colorado and Texas, of an event over the Oklahoma LMA, with the in-cloud discharge mapping supplementing information from the NLDN and ULF/ELF receivers.
map sprites over LMAs and NEXRAD radar systems (Fig. 1) has revealed many SP+CG discharges actually begin in the convective core of the storm and then travel rearward into the stratiform, where they come to ground as +CGs (Lyons et al., 2011; Lang et al., 2011).
A requirement to forecast and then detect sprites in real-time over CONUS (initially in support of Space Shuttle operations and subsequently high altitude balloon and orbital missions) resulted in developing subjective criteria and objective forecast systems for predicting conditions that were the most favorable for
+CG sprite production (Lyons and Cummer, 2008; Lyons et al., 2009). Real-time sprite detection proved a challenge as ground-based cameras were limited by range (~900 km under ideal conditions) and variable local cloud cover, rendering this approach for operational sprite detection impractical.
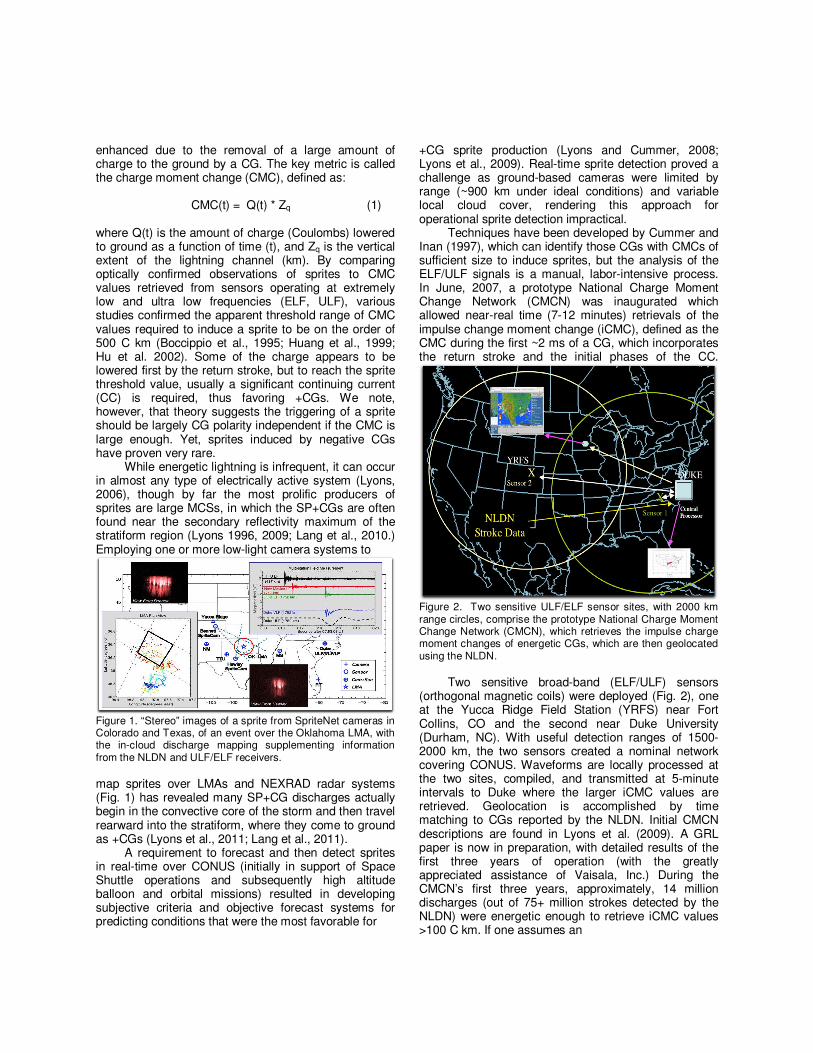
Techniques have been developed by Cummer and Inan (1997), which can identify those CGs with CMCs of sufficient size to induce sprites, but the analysis of the ELF/ULF signals is a manual, labor-intensive process. In June, 2007, a prototype National Charge Moment Change Network (CMCN) was inaugurated which allowed near-real time (7-12 minutes) retrievals of the impulse change moment change (iCMC), defined as the CMC during the first ~2 ms of a CG, which incorporates the return stroke and the initial phases of the CC.
Figure 2. Two sensitive ULF/ELF sensor sites, with 2000 km range circles, comprise the prototype National Charge Moment Change Network (CMCN), which retrieves the impulse charge moment changes of energetic CGs, which are then geolocated using the NLDN.
Two sensitive broad-band (ELF/ULF) sensors
(orthogonal magnetic coils) were deployed (Fig. 2), one at the Yucca Ridge Field Station (YRFS) near Fort Collins, CO and the second near Duke University (Durham, NC). With useful detection ranges of 1500-2000 km, the two sensors created a nominal network covering CONUS. Waveforms are locally processed at the two sites, compiled, and transmitted at 5-minute intervals to Duke where the larger iCMC values are retrieved. Geolocation is accomplished by time matching to CGs reported by the NLDN. Initial CMCN descriptions are found in Lyons et al. (2009). A GRL paper is now in preparation, with detailed results of the first three years of operation (with the greatly appreciated assistance of Vaisala, Inc.) During the CMCN’s first three years, approximately, 14 million discharges (out of 75+ million strokes detected by the NLDN) were energetic enough to retrieve iCMC values >100 C km. If one assumes an

Figure 3. Density of “sprite class” +CGs (iCMC >+300 C km) based upon 3 years of CMCN operation. Note: the axis of “sprite alley” is shifted south and east from the region of maximum +CG density, frequency and peak current. average CG channel length (Zq) of 7 km, 100 C km implies a charge lowered of ~ >14 C.
Though the CMCN cannot (as of now) provide the complete time history of the CMC for an SP+CG, which may take from 1 to 100+ ms to attain the sprite threshold value (depending on the return stroke and CC characteristics), the CMCN has still proven extremely helpful in detecting “sprite class” lightning. Operational experience suggests that when a +CG attains an iCMC value of ~ +100 C km, there is a 10% chance a sprite would be visible, with the probability rising to ~75% at ~+300 C km, and near unity for >+500 C km (Lyons et al., 2009). A map of the +CGs with iCMC >+300 C km for the first 3 years of operation is shown in Fig. 3. Some 56,500 +CGs were likely to have produced sprites. While SP+CGs can, and do, occur virtually anywhere, a marked concentration of such events, a “sprite alley” if you will, extends from northeastern Oklahoma into Iowa. We note that this region is located about 300 km south and east of the well documented region of the highest density and percentage of +CGs, and the largest +CG peak currents (Orville et al., 2011; Zajac and Rutledge, 2001; Lyons et al., 1998). This makes meteorological sense. Many central U.S. nocturnal MCSs begin as isolated afternoon storms (supercells or within squall lines) producing large peak current (but low iCMC) +CGs. As these systems move south and east, they evolve upscale into larger MCSs, they develop vast stratiform areas in which sprites typically occur.
Many thunderstorms produce no iCMCs >100 C km. Those storms which do often present distinct and repeatable patterns in the temporal and spatial distribution of iCMCs of both polarities. Some may be all positive, others all negative, and some show distinct patterns, such as bipolar (negative on the southern end where convection is initiating, positive in the northern
end where the mature convection is developing stratiform regions.) The real-time web display of the CMCN data shows a three-hour running display, updated every 5 minutes for events >75 C km. This allows the iCMC data to be used to orient ground based SpriteNet cameras installed to monitor above LMAs (Lyons et al., 2011). The display can help also position mobile camera teams, in capture either sprites or their parent lightning. This will prove invaluable in upcoming field campaigns such as PhOCAL (Physical Origins of Coupling to the Upper Atmosphere from Lightning).
The population of -CGs > -300 C km is <10% of their +CG counterparts. Yet the number of observed sprites (actually only one to date from YRFS) associated with -CGs is more than two orders less than from +CGs. This sprite polarity paradox has been discussed (Williams et al., 2007, 2012). The explanation for this lack of negative sprite observations resides in (1) many fewer large negative iCMC events (due mostly to a lack of sufficiently energetic -CCs), (2) the possibility that the CMC threshold for negative sprites is slightly higher, and (3) the fact that the observations may have been biased by the number cameras peering above the western High Plains, where SP-CGs are truly rare (more below). Sprites, both from positive and negative CGs, are just one of the several forms of TLEs. Two major types can be defined: (1) those induced in the middle and upper atmosphere by both electromagnetic pulses (EMP) and transient electrical field enhancements due to large CMC CGs (sprites, halos and elves), and (2) those emerging from the cloud tops of convective storms (blue starters and blue jets [Wescott et al, 1998], and gigantic jets [Pasko et al., 2002]). Halos and elves, which often precede sprites, are more likely triggered by CGs having both large peak currents and significant CMCs, and are more evenly distributed by CG polarity. A search for the “parent” of type 2 TLEs has proven more difficult. While a CG plays a role, it is often because a CG briefly unbalances the storm’s electrical charge centers which, in turn, leads to a intracloud (IC) event which then emerges from the storm top to altitudes of several kilometers (blue starter), or 10-25 km (blue jet) above the cloud, or reaches the ionosphere at 80-90 km (gigantic jet) (Krehbiel et al., 2008; Pasko, 2010). Recent related findings are discussed below
2.1 Warm Season Sprites from Positive CGs
Though sprite observations are heavily weighted
towards nocturnal MCSs on the U.S. High Plains, the frequency of observations (over 12,000 optical events from YRFS cameras alone since 1993), suggest that conditions in this mid-continental region are nearly optimal. MCSs in their mature to late stages having large stratiform regions can produce 50-150 events per hour in extreme cases (Lyons and Cummer, 2008).
SpriteNet cameras (Watec 902H Ultimate imagers, 0.0001 lux sensitivity, captured to PCs using scene changing software) have been situated to monitor TLEs above LMAs (Thomas et al., 2004), especially the system covering central Oklahoma. As discussed in detail by Lang et al. (2010, 2011), certain types of MCSs are especially favorable for production of +CGs yielding both high iCMC values and long CCs, which allow sufficient charge to be lowered to the ground to trigger
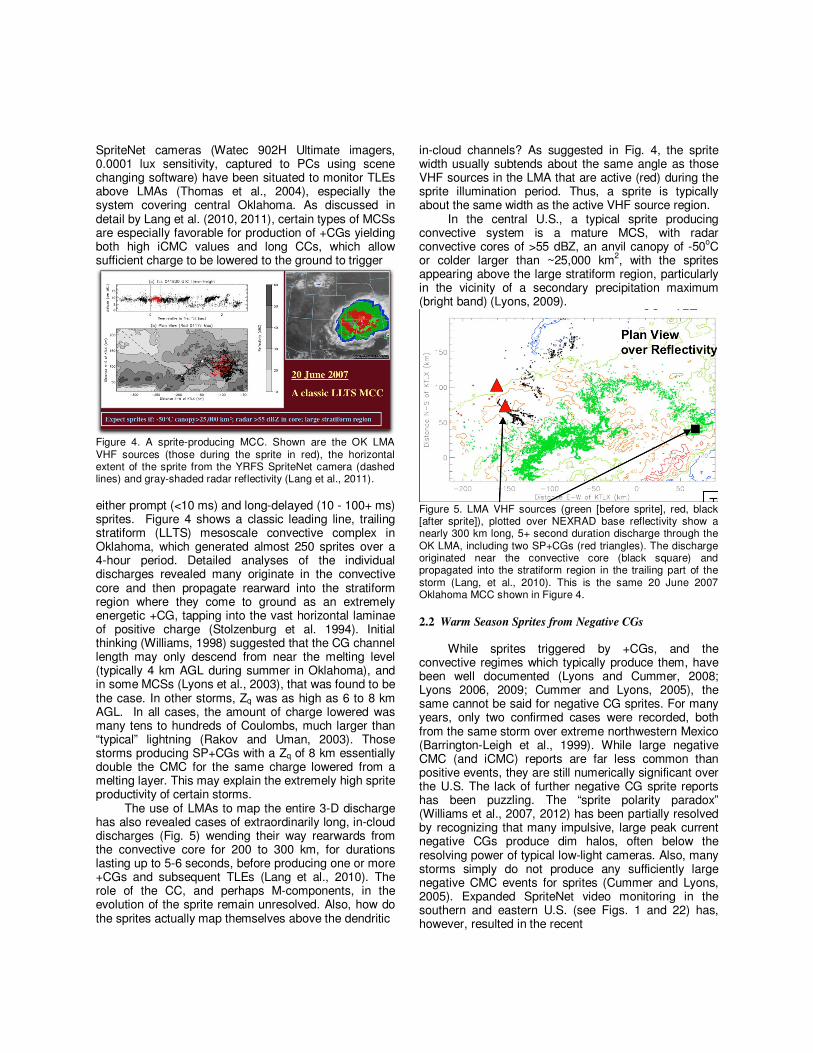
Figure 4. A sprite-producing MCC. Shown are the OK LMA VHF sources (those during the sprite in red), the horizontal extent of the sprite from the YRFS SpriteNet camera (dashed lines) and gray-shaded radar reflectivity (Lang et al., 2011).
either prompt (<10 ms) and long-delayed (10 - 100+ ms) sprites. Figure 4 shows a classic leading line, trailing stratiform (LLTS) mesoscale convective complex in Oklahoma, which generated almost 250 sprites over a 4-hour period. Detailed analyses of the individual discharges revealed many originate in the convective core and then propagate rearward into the stratiform region where they come to ground as an extremely energetic +CG, tapping into the vast horizontal laminae of positive charge (Stolzenburg et al. 1994). Initial thinking (Williams, 1998) suggested that the CG channel length may only descend from near the melting level (typically 4 km AGL during summer in Oklahoma), and in some MCSs (Lyons et al., 2003), that was found to be the case. In other storms, Zq was as high as 6 to 8 km AGL. In all cases, the amount of charge lowered was many tens to hundreds of Coulombs, much larger than “typical” lightning (Rakov and Uman, 2003). Those storms producing SP+CGs with a Zq of 8 km essentially double the CMC for the same charge lowered from a melting layer. This may explain the extremely high sprite productivity of certain storms.
The use of LMAs to map the entire 3-D discharge has also revealed cases of extraordinarily long, in-cloud discharges (Fig. 5) wending their way rearwards from the convective core for 200 to 300 km, for durations lasting up to 5-6 seconds, before producing one or more +CGs and subsequent TLEs (Lang et al., 2010). The role of the CC, and perhaps M-components, in the evolution of the sprite remain unresolved. Also, how do the sprites actually map themselves above the dendritic
in-cloud channels? As suggested in Fig. 4, the sprite width usually subtends about the same angle as those VHF sources in the LMA that are active (red) during the sprite illumination period. Thus, a sprite is typically about the same width as the active VHF source region.
In the central U.S., a typical sprite producing convective system is a mature MCS, with radar convective cores of >55 dBZ, an anvil canopy of -50
oC
or colder larger than ~25,000 km2, with the sprites
appearing above the large stratiform region, particularly in the vicinity of a secondary precipitation maximum (bright band) (Lyons, 2009).
Figure 5. LMA VHF sources (green [before sprite], red, black [after sprite]), plotted over NEXRAD base reflectivity show a nearly 300 km long, 5+ second duration discharge through the OK LMA, including two SP+CGs (red triangles). The discharge originated near the convective core (black square) and propagated into the stratiform region in the trailing part of the storm (Lang, et al., 2010). This is the same 20 June 2007 Oklahoma MCC shown in Figure 4.
2.2 Warm Season Sprites from Negative CGs
While sprites triggered by +CGs, and the convective regimes which typically produce them, have been well documented (Lyons and Cummer, 2008; Lyons 2006, 2009; Cummer and Lyons, 2005), the same cannot be said for negative CG sprites. For many years, only two confirmed cases were recorded, both from the same storm over extreme northwestern Mexico (Barrington-Leigh et al., 1999). While large negative CMC (and iCMC) reports are far less common than positive events, they are still numerically significant over the U.S. The lack of further negative CG sprite reports has been puzzling. The “sprite polarity paradox” (Williams et al., 2007, 2012) has been partially resolved by recognizing that many impulsive, large peak current negative CGs produce dim halos, often below the resolving power of typical low-light cameras. Also, many storms simply do not produce any sufficiently large negative CMC events for sprites (Cummer and Lyons, 2005). Expanded SpriteNet video monitoring in the southern and eastern U.S. (see Figs. 1 and 22) has, however, resulted in the recent

Figure 6. Three negative CG sprites (preceded by halos) obtained by the Duke SpriteNet camera. All three originated from smaller, intense cellular storms, not at all typical of those creating positive CG sprites. The NLDN peak current, and the impulse CMC derived from the CMCN sensors, is also shown.
Figure 7. The first (and so far, only) negative CG sprite detected by a SpriteNet camera in Colorado. It formed above a locally intense cell on the fringe of an asymmetric MCS. The large NLDN peak current (-102 kA) and huge –iCMC value (-703 C km) appear to be typical for negative CG sprites.
Table 1. Summary of the key parameters associated with negative CG sprites: intense cellular convection, large negative peak currents, and exceptionally large -iCMC values.
Figure 8. Over four years, less than two dozen negative CGs have been detected by the NLDN and CMCN, both possessing <-100 kA peak currents and <-1000 C km iCMCs.
detection of a few negative CG sprites, including three by the Duke SpriteNet camera (Fig. 6).
A dissipating tropical storm (Hermine) moving through the eastern portion of the Oklahoma LMA on 10 September 2010 produced two gigantic jets (GJs) - and a single negative sprite from an intense, embedded convective core with 15 km echo tops (Meyer et al. 2012). After 19 years, a Colorado SpriteNet camera finally captured a negative CG sprite on 29 July 2011 (Fig. 7). It was associated with a small convective core on the fringe of a larger asymmetric MCS. Table 1 summarizes the characteristics of the best-documented (to date) negative sprites (which are unusually preceded by a halo). It becomes clear that the SP-CGs are very impulsive, have very high peak currents (typically ~ -100 kA) plus extremely large iCMC values (~ -900-1000 C km). Most cases have originated in the convective core of isolated cells (or components of a multicellular cluster). These storms exhibit neither extensive stratiform precipitation nor (m)any high peak current +CGs and/or large +iCMCs. Figure 8 plots a data sort of the NLDN and iCMC databases from June 2007 through June 2011. Using fairly stringent criteria (-CG peak current < -100 kA and iCMC <-1000 C km), only 23 such negative CGs were detected. Moreover, they largely occurred in the Mississippi Valley, the southeastern U.S. and near the Gulf Stream, regions favorable to energetic negative strikes (Lyons et al. 1998; Orville et al., 2011). Thus, the dearth of “negative sprite class” CGs accounts in large part for their overall rarity in the U.S., as well as why observations from the base of the Rocky Mountains looking eastwards have failed (until recently) to detect even one such event. The bottom line: negative sprites are uncommon, but can and do occur, and the SpriteNet cameras in the eastern U.S. are better positioned to detect them.
2.3 Cold Season Sprites and Energetic CGs Climatologies of NLDN data (Orville et al., 2011)
and of the CMCN (Cummer et al., in preparation) show that while lightning (including large iCMC) strokes certainly peak during the U.S. warm season (July), electrically active storms continue throughout the year.
Winter cyclonic storms can often produce copious amounts of lightning, though activity is often concentrated in the warm sectors (Orville, 1993). Lightning, including large iCMCs, has been detected in snow-producing regions of cyclonic storms (Lyons and Cummer, 2008) and thundersnow events (Lyons, 1989; Market and Becker, 2009), though confirming a resultant sprite occurrence with optical sensors has yet to be accomplished. The same may be said for sprites associated with occasional Great Lakes’ snow events (Moore and Orville, 1990). The occurrence of large +iCMC flashes over the Gulf Stream has given rise to speculation of winter sprites in that environment (Price et al., 2002), and indeed, sprites and other TLEs, are now routinely detected in the well-documented energetic positive CGs of the Hokuriku winter snowstorms of Japan (Brook et al., 1982; Takahashi et al., 2003).
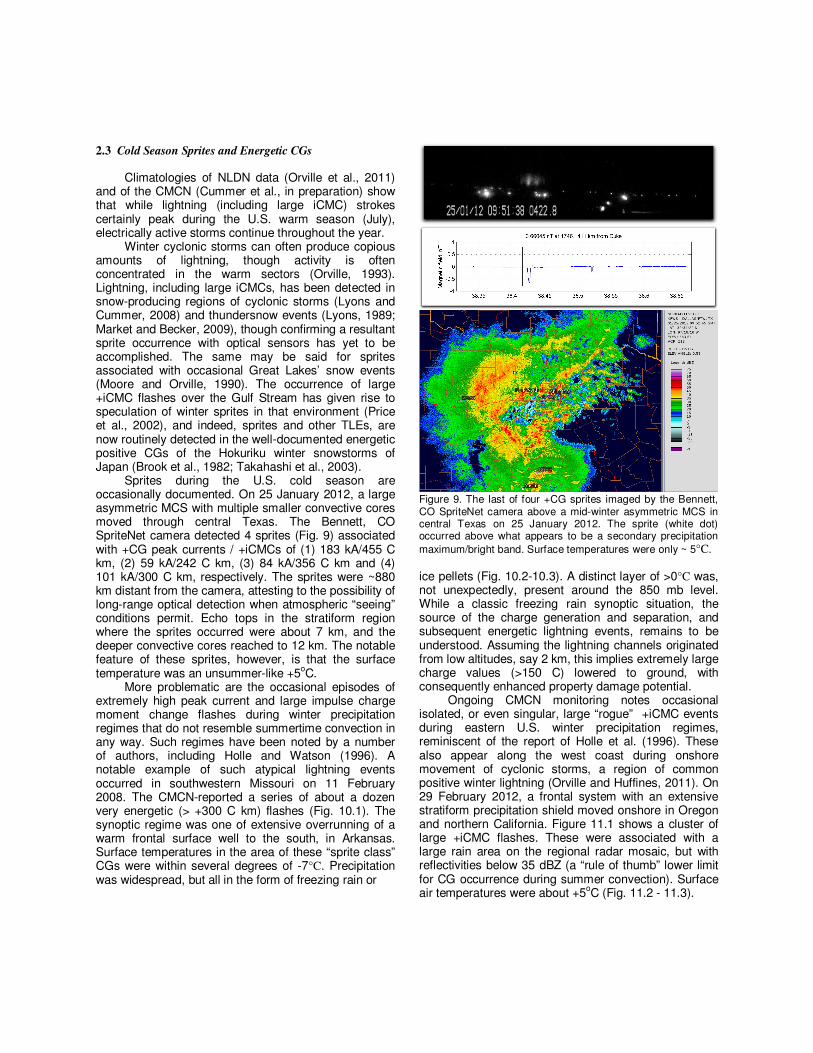
Sprites during the U.S. cold season are occasionally documented. On 25 January 2012, a large asymmetric MCS with multiple smaller convective cores moved through central Texas. The Bennett, CO SpriteNet camera detected 4 sprites (Fig. 9) associated with +CG peak currents / +iCMCs of (1) 183 kA/455 C km, (2) 59 kA/242 C km, (3) 84 kA/356 C km and (4) 101 kA/300 C km, respectively. The sprites were ~880 km distant from the camera, attesting to the possibility of long-range optical detection when atmospheric “seeing” conditions permit. Echo tops in the stratiform region where the sprites occurred were about 7 km, and the deeper convective cores reached to 12 km. The notable feature of these sprites, however, is that the surface temperature was an unsummer-like +5
oC.
More problematic are the occasional episodes of extremely high peak current and large impulse charge moment change flashes during winter precipitation regimes that do not resemble summertime convection in any way. Such regimes have been noted by a number of authors, including Holle and Watson (1996). A notable example of such atypical lightning events occurred in southwestern Missouri on 11 February 2008. The CMCN-reported a series of about a dozen very energetic (> +300 C km) flashes (Fig. 10.1). The synoptic regime was one of extensive overrunning of a warm frontal surface well to the south, in Arkansas. Surface temperatures in the area of these “sprite class” CGs were within several degrees of -7°C. Precipitation was widespread, but all in the form of freezing rain or
Figure 9. The last of four +CG sprites imaged by the Bennett, CO SpriteNet camera above a mid-winter asymmetric MCS in central Texas on 25 January 2012. The sprite (white dot) occurred above what appears to be a secondary precipitation
maximum/bright band. Surface temperatures were only ~ 5°C.
ice pellets (Fig. 10.2-10.3). A distinct layer of >0°C was, not unexpectedly, present around the 850 mb level. While a classic freezing rain synoptic situation, the source of the charge generation and separation, and subsequent energetic lightning events, remains to be understood. Assuming the lightning channels originated from low altitudes, say 2 km, this implies extremely large charge values (>150 C) lowered to ground, with consequently enhanced property damage potential. Ongoing CMCN monitoring notes occasional isolated, or even singular, large “rogue” +iCMC events during eastern U.S. winter precipitation regimes, reminiscent of the report of Holle et al. (1996). These also appear along the west coast during onshore movement of cyclonic storms, a region of common positive winter lightning (Orville and Huffines, 2011). On 29 February 2012, a frontal system with an extensive stratiform precipitation shield moved onshore in Oregon and northern California. Figure 11.1 shows a cluster of large +iCMC flashes. These were associated with a large rain area on the regional radar mosaic, but with reflectivities below 35 dBZ (a “rule of thumb” lower limit for CG occurrence during summer convection). Surface air temperatures were about +5
oC (Fig. 11.2 - 11.3).

Figure 10. (1) CMCN display of >300 C km iCMC +CGs for three hours prior to 1635 UTC 11 February 2008. (2) Surface data showing freezing rain and ice pellets in area of energetic lightning. (3) -50°C IR cloud top temperature and 0°C surface air temperature (green line).
Figure 11. (1) CMCN display of >300 C km iCMC +CGs for three hour period ending at 0240 UTC 29 February 2012. (2) Surface data showing cold, steady rain along the Oregon coast. (3) NEXRAD radar reflectivity mosaic with all echoes <35 dBZ.
3. BLUE JETS
Unlike sprites, halos and elves, which are induced in the middle atmosphere by energetic tropospheric CGs, blue jets originate from within a convective storm cloud and propagate upward in a conical spray to heights of 10 - 25 km above cloud tops (events extending only several kilometers above the top are called blue starters). Blue jets are the rarest and most problematic of the TLEs from a detection and forecasting vantage, in part because there are only on the order of 100 documented reports. Many of these reports were obtained during one aircraft mission near a severe thunderstorm by the University of Alaska -Fairbanks in 1994 (Westcott et al. 1998). Studies to date suggest a (possible) link to hail-producing storms and thus, to vigorous, deep convective clouds. However, there is no known direct CG (or iCMC) signature from the NLDN (or CMCN) to utilize. However, Krehbiel et al. (2008) postulate that blue jets result from electrical breakdown between the upper storm charge center and the cloud top screening charge layer. Evidence suggests the blue jets occur within 10 s or less after a CG or intracloud discharge produces a sudden charge imbalance in the storm. Leaders from the upper positive charge center move upward penetrating a weaker, but still significant, negative screening layer. Positive blue jets transport positive charge into the stratosphere.
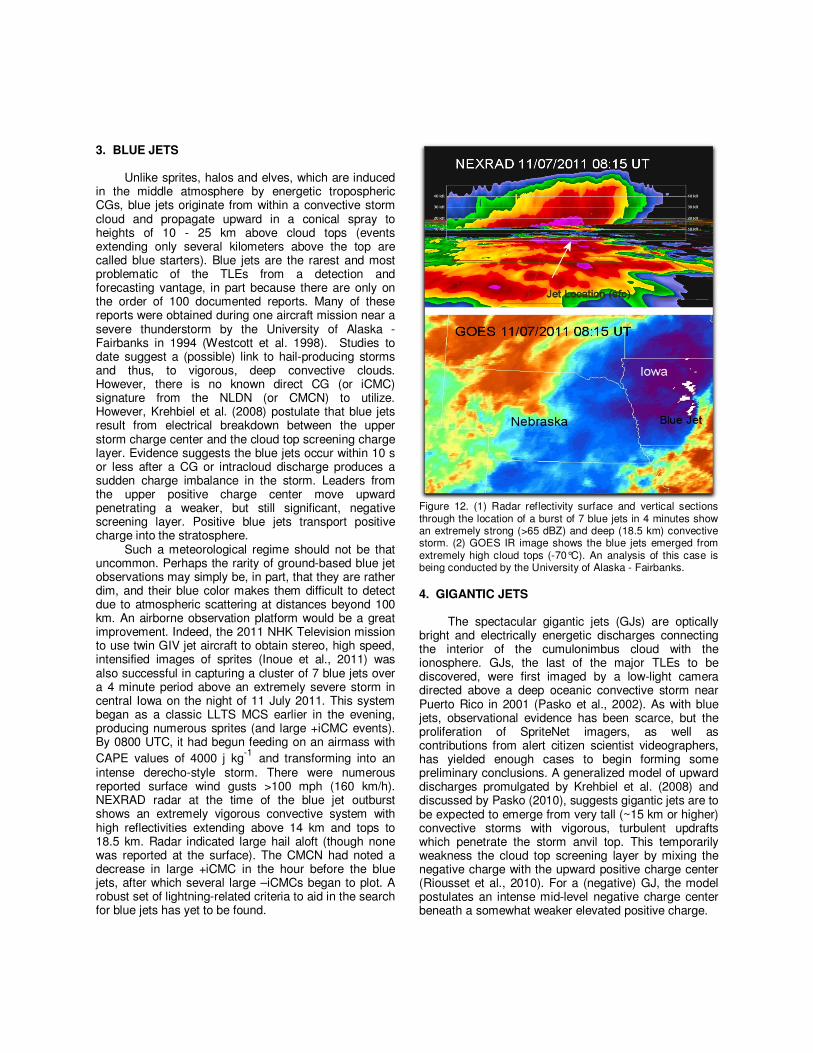
Such a meteorological regime should not be that uncommon. Perhaps the rarity of ground-based blue jet observations may simply be, in part, that they are rather dim, and their blue color makes them difficult to detect due to atmospheric scattering at distances beyond 100 km. An airborne observation platform would be a great improvement. Indeed, the 2011 NHK Television mission to use twin GIV jet aircraft to obtain stereo, high speed, intensified images of sprites (Inoue et al., 2011) was also successful in capturing a cluster of 7 blue jets over a 4 minute period above an extremely severe storm in central Iowa on the night of 11 July 2011. This system began as a classic LLTS MCS earlier in the evening, producing numerous sprites (and large +iCMC events). By 0800 UTC, it had begun feeding on an airmass with
CAPE values of 4000 j kg-1 and transforming into an
intense derecho-style storm. There were numerous reported surface wind gusts >100 mph (160 km/h). NEXRAD radar at the time of the blue jet outburst shows an extremely vigorous convective system with high reflectivities extending above 14 km and tops to 18.5 km. Radar indicated large hail aloft (though none was reported at the surface). The CMCN had noted a decrease in large +iCMC in the hour before the blue jets, after which several large –iCMCs began to plot. A robust set of lightning-related criteria to aid in the search for blue jets has yet to be found.
Figure 12. (1) Radar reflectivity surface and vertical sections through the location of a burst of 7 blue jets in 4 minutes show an extremely strong (>65 dBZ) and deep (18.5 km) convective storm. (2) GOES IR image shows the blue jets emerged from extremely high cloud tops (-70°C). An analysis of this case is being conducted by the University of Alaska - Fairbanks.
4. GIGANTIC JETS
The spectacular gigantic jets (GJs) are optically bright and electrically energetic discharges connecting the interior of the cumulonimbus cloud with the ionosphere. GJs, the last of the major TLEs to be discovered, were first imaged by a low-light camera directed above a deep oceanic convective storm near Puerto Rico in 2001 (Pasko et al., 2002). As with blue jets, observational evidence has been scarce, but the proliferation of SpriteNet imagers, as well as contributions from alert citizen scientist videographers, has yielded enough cases to begin forming some preliminary conclusions. A generalized model of upward discharges promulgated by Krehbiel et al. (2008) and discussed by Pasko (2010), suggests gigantic jets are to be expected to emerge from very tall (~15 km or higher) convective storms with vigorous, turbulent updrafts which penetrate the storm anvil top. This temporarily weakness the cloud top screening layer by mixing the negative charge with the upward positive charge center (Riousset et al., 2010). For a (negative) GJ, the model postulates an intense mid-level negative charge center beneath a somewhat weaker elevated positive charge.

Figure 13. (1) Radar reflectivity and VHF source density for the Florida and Oklahoma GJs. CAPPI displays show the GJ emerges from an overshooting top. (2) The VHF sources are most intense in the upper part of storms that are undergoing convective surges, perhaps after a partial rainout unburdened their updrafts (Meyer at al., 2012).
Figure 14. One of the first color images of a gigantic jet, captured by a consumer camera, shows the bright stem and a blue, transitioning to red, column reaching the ionosphere above an intense, 15 km tall convective system over Puerto Rico (0527 UTC 22 September 2011). Image: Frankie Lucena.
Table 2. A summary of characteristics of the well documented (negative) gigantic jets. They usually emerge from intense, deep convection, usually in a maritime tropical (mT) airmass (over either land and water). Clouds tops generally reach >15 km, though some exceptions have been noted. GJs and sprites generally do not occur at the same time and place in a storm system. GJ parent storms often have many large –iCMC CGs.
Krehbiel et al. (2008) suggest an upward leader
originates as a normal IC discharge in the strong mid-level negative charge center and passes through the weakened upper charge center. Unimpeded by a lack of a screening layer, it then continues upward to great heights until reaching the base of the ionosphere (Pasko, 2010). Thus, intense mid- and upper level IC activity, coupled with an upward convective surge at the storm top, would be in evidence. Sprites from supercells are extremely uncommon, even those producing high peak current (but low iCMCs) +CGs (Lyons et al., 2003, 2008). But such intense, deep convection may be the place to look for both blue jets and GJs, especially if there are numerous larger –iCMCs (indicative of intense normal polarity, rather than inverted polarity, convective storms.) The first GJ to be imaged from a continental U.S. ground-based camera (van der Velde et al., 2007) indeed was associated with an intense supercellular convective storm. Two GJ episodes have been analyzed in detail by Lu et al. (2011), which occurred within range of an LMA (Oklahoma) and the 4DLSS 3-D mapper serving the Kennedy Space Center. Like the blue jet, the GJ is not directly associated with a specific CG event. However, the GJ parent storms show a tendency to have many large negative iCMC strokes in their vicinity. One of the two GJs above the Oklahoma LMA did produce a VHF source at 35 km altitude, suggesting one possible RF-based signature of the phenomenon. The reader is referred to Lu et al. (2011) for details of the VHF source behavior associated with these GJs, which are consistent with the model of Krehbiel et al. (2008).

An ongoing investigation (Meyer et al., 2012) of the meteorological aspects of these GJ parent storms is summarized here. Both of the negative GJ producing storm cells formed in a maritime tropical (mT) airmass. The GJ parent portion was the strongest and tallest cell in the overall cluster. Maximum reflectivities were 53 to 55 dBZ and the 10 dBZ radar echo tops reached from 13.9 to 15.5 km AGL.
Figure 13.1 shows a combined radar reflectivity and VHF source density analysis of the cells at about the time of the GJs. In both the Florida and Oklahoma storms, the GJ emerged from the tallest part of the cloud, as seen by the 14 and 15 km CAPPI reflectivity displays. Vertical reflectivity slices show both storms had apparent updrafts penetrating the general anvil cloud layer. This convective surge was also the locus of intense VHF sources, indicating heightened IC electrical activity. Each storm was near its peak reflectivity and lightning flash rate with an overshooting echo top at the time of the GJs. The overshooting top and strong intensification indicate a convective surge that may have allowed the upper positive charge center to mix with a negatively charged screening layer and become briefly depleted. Intracloud lightning initiating in the mid-level negative region could have exited upward through the recently depleted positive region, producing a gigantic jet. Figure 13.2 presents the vertical profiles of VHF sources, which indicate maxima near the storm tops at the times of the GJs. The large low-level reflectivity also suggests the cell had been raining out, with the unloading of the precipitation possibly triggering a renewed upward surge in the upper part of the storm.
Figure 14 is one of the first color images of a gigantic jet, captured by a citizen scientist from the southwest corner of Puerto Rico, looking northeastward above an intense storm system over the center of the island. The GJ, imaged at 0527 UTC, 22 September 2011, was on the same azimuth as the highest echo tops (15 km.) The GJ was recorded with a consumer-grade Kodak Z749 digital camera, 8 second exposure on a tripod. Analysis of NEXRAD reflectivity and GLD360 lightning data suggested the lightning activity and reflectivity peaked around the time of the GJ, again indicative of a convective surge. The image also confirms that a GJ’s appearance often involves a bright lightning channel-like “stem” which emerges from the cloud top and then transitions to a flared blue column that becomes red near the top. It was visible to the naked eye.
Table 2 summarizes the key characteristics of the best-documented GJs to date. They may originate from storms over either land or water, but are usually within a maritime tropical (mT) airmass with deep moisture. The storms are cellular, with intense, high reflectivity cores, and evidence of strong updrafts, likely penetrating the anvil cloud layer at heights of ~15 km. Intense VHF
sources near the cloud top tend to confirm a convective surge through the anvil which depletes the screening layer charge by turbulent mixing may be a key to GJ triggering. The GJ data to date are supportive of the Krehbiel et al. (2008) conceptual model. 5. UPWARD LIGHTNING
5.1 Lightning Triggered Upward Lightning and TLEs
The investigation of lightning strikes to tall objects, situated both on flat ground and elevated terrain, has an extensive history (Rakov, 2003). The studies of McEachron (1939) on the Empire State Building and of Berger (1977) on Mount San Salvatore are examples of pioneering work in this area. Broadly speaking, as a grounded object increases in height, the probability of it being involved with a lightning discharge increases. In the simplest case, the enhanced electric field of a tall object allows an earlier start for upward leaders and preferentially increases their chance of connecting with a downward stepped leader, resulting in a return stroke (Rakov, 2003). This “normal” or “natural” lightning strike is distinct from additional mechanisms in which the initial upward leader originates from the object, either in response to nearby lightning discharges (leaders propagating through the cloud) or, in some cases, the charge within the cloud itself. For this discussion we will employ the terminology of (1) “lightning triggered upward lightning” (LTUL), and (2) “self initiated upward lightning” (SIUL) (Warner et al., 2012, these proceedings). As stated by Rakov (2003), “the latter, as opposed to ‘normal downward lightning,’ would not occur if the object were not there. Ground-based objects with heights ranging from about 100 to 500 m experience both downward and upward lightning flashes, the proportion being a function of object height.” Tall towers and buildings are more likely to experience LTUL or SIUL events as height increases. Warner et al. (2011, 2012) and Warner (2011) detail ongoing observations of lightning strikes to ten moderate height broadcast towers (91-191 m AGL) located on a ridge in Rapid City, SD. This region is frequented by summertime, nocturnal MCSs which often produce SP+CGs (refer to Fig. 3). Upward flashes have been imaged using (initially) standard and high definition video and, more recently, high-speed imagers. For 80+ LTUL cases, in all but one, optical observations confirm nearby flash activity prior to upward leader initiation, with approximately two thirds having confirmed NLDN +CGs within the prior ~400 ms. The +CGs, however, strike at ranges up to 50 km distant, and typically are at 15-20 km away. The upward leaders are typically positive polarity (“upward negative lightning”). The triggering component is proposed usually to be an area of horizontally propagating negative breakdown
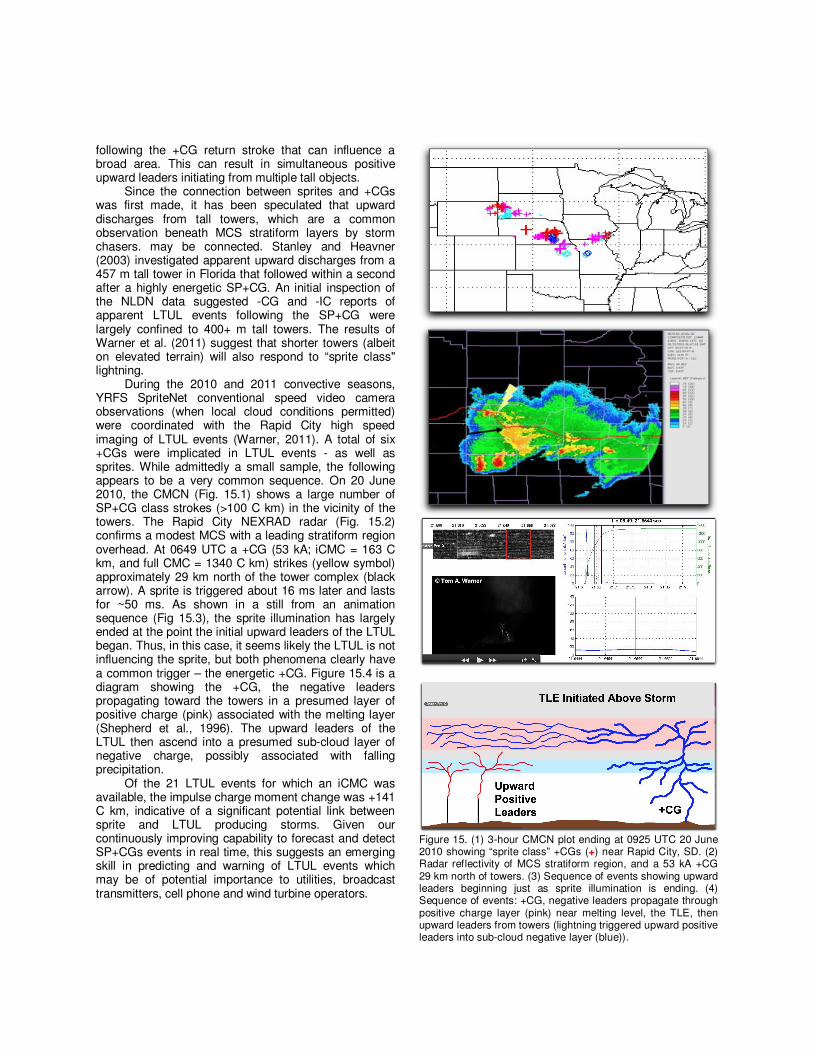
following the +CG return stroke that can influence a broad area. This can result in simultaneous positive upward leaders initiating from multiple tall objects. Since the connection between sprites and +CGs was first made, it has been speculated that upward discharges from tall towers, which are a common observation beneath MCS stratiform layers by storm chasers. may be connected. Stanley and Heavner (2003) investigated apparent upward discharges from a 457 m tall tower in Florida that followed within a second after a highly energetic SP+CG. An initial inspection of the NLDN data suggested -CG and -IC reports of apparent LTUL events following the SP+CG were largely confined to 400+ m tall towers. The results of Warner et al. (2011) suggest that shorter towers (albeit on elevated terrain) will also respond to “sprite class" lightning. During the 2010 and 2011 convective seasons, YRFS SpriteNet conventional speed video camera observations (when local cloud conditions permitted) were coordinated with the Rapid City high speed imaging of LTUL events (Warner, 2011). A total of six +CGs were implicated in LTUL events - as well as sprites. While admittedly a small sample, the following appears to be a very common sequence. On 20 June 2010, the CMCN (Fig. 15.1) shows a large number of SP+CG class strokes (>100 C km) in the vicinity of the towers. The Rapid City NEXRAD radar (Fig. 15.2) confirms a modest MCS with a leading stratiform region overhead. At 0649 UTC a +CG (53 kA; iCMC = 163 C km, and full CMC = 1340 C km) strikes (yellow symbol) approximately 29 km north of the tower complex (black arrow). A sprite is triggered about 16 ms later and lasts for ~50 ms. As shown in a still from an animation sequence (Fig 15.3), the sprite illumination has largely ended at the point the initial upward leaders of the LTUL began. Thus, in this case, it seems likely the LTUL is not influencing the sprite, but both phenomena clearly have a common trigger – the energetic +CG. Figure 15.4 is a diagram showing the +CG, the negative leaders propagating toward the towers in a presumed layer of positive charge (pink) associated with the melting layer (Shepherd et al., 1996). The upward leaders of the LTUL then ascend into a presumed sub-cloud layer of negative charge, possibly associated with falling precipitation. Of the 21 LTUL events for which an iCMC was available, the impulse charge moment change was +141 C km, indicative of a significant potential link between sprite and LTUL producing storms. Given our continuously improving capability to forecast and detect SP+CGs events in real time, this suggests an emerging skill in predicting and warning of LTUL events which may be of potential importance to utilities, broadcast transmitters, cell phone and wind turbine operators.
Figure 15. (1) 3-hour CMCN plot ending at 0925 UTC 20 June 2010 showing “sprite class” +CGs (+) near Rapid City, SD. (2) Radar reflectivity of MCS stratiform region, and a 53 kA +CG 29 km north of towers. (3) Sequence of events showing upward leaders beginning just as sprite illumination is ending. (4) Sequence of events: +CG, negative leaders propagate through positive charge layer (pink) near melting level, the TLE, then upward leaders from towers (lightning triggered upward positive leaders into sub-cloud negative layer (blue)).
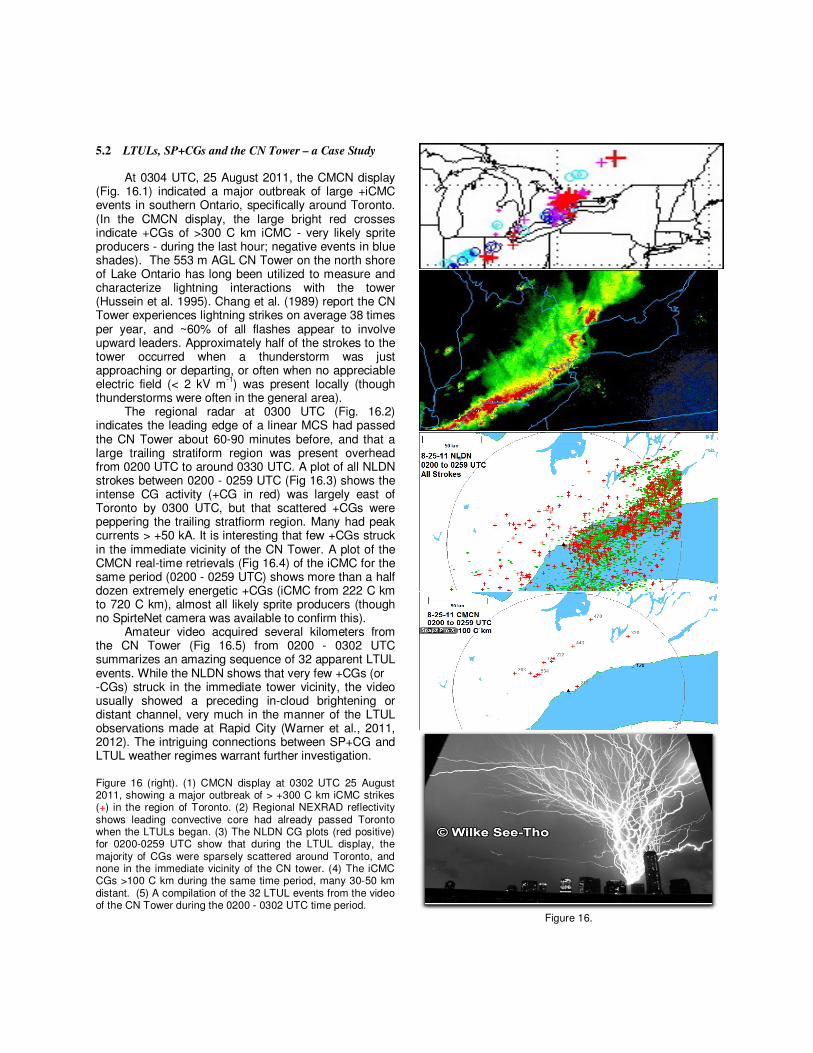
5.2 LTULs, SP+CGs and the CN Tower – a Case Study
At 0304 UTC, 25 August 2011, the CMCN display (Fig. 16.1) indicated a major outbreak of large +iCMC events in southern Ontario, specifically around Toronto. (In the CMCN display, the large bright red crosses indicate +CGs of >300 C km iCMC - very likely sprite producers - during the last hour; negative events in blue shades). The 553 m AGL CN Tower on the north shore of Lake Ontario has long been utilized to measure and characterize lightning interactions with the tower (Hussein et al. 1995). Chang et al. (1989) report the CN Tower experiences lightning strikes on average 38 times per year, and ~60% of all flashes appear to involve upward leaders. Approximately half of the strokes to the tower occurred when a thunderstorm was just approaching or departing, or often when no appreciable electric field (< 2 kV m
-1) was present locally (though
thunderstorms were often in the general area). The regional radar at 0300 UTC (Fig. 16.2) indicates the leading edge of a linear MCS had passed the CN Tower about 60-90 minutes before, and that a large trailing stratiform region was present overhead from 0200 UTC to around 0330 UTC. A plot of all NLDN strokes between 0200 - 0259 UTC (Fig 16.3) shows the intense CG activity (+CG in red) was largely east of Toronto by 0300 UTC, but that scattered +CGs were peppering the trailing stratfiorm region. Many had peak currents > +50 kA. It is interesting that few +CGs struck in the immediate vicinity of the CN Tower. A plot of the CMCN real-time retrievals (Fig 16.4) of the iCMC for the same period (0200 - 0259 UTC) shows more than a half dozen extremely energetic +CGs (iCMC from 222 C km to 720 C km), almost all likely sprite producers (though no SpirteNet camera was available to confirm this). Amateur video acquired several kilometers from the CN Tower (Fig 16.5) from 0200 - 0302 UTC summarizes an amazing sequence of 32 apparent LTUL events. While the NLDN shows that very few +CGs (or -CGs) struck in the immediate tower vicinity, the video usually showed a preceding in-cloud brightening or distant channel, very much in the manner of the LTUL observations made at Rapid City (Warner et al., 2011, 2012). The intriguing connections between SP+CG and LTUL weather regimes warrant further investigation. Figure 16 (right). (1) CMCN display at 0302 UTC 25 August 2011, showing a major outbreak of > +300 C km iCMC strikes (+) in the region of Toronto. (2) Regional NEXRAD reflectivity shows leading convective core had already passed Toronto when the LTULs began. (3) The NLDN CG plots (red positive) for 0200-0259 UTC show that during the LTUL display, the majority of CGs were sparsely scattered around Toronto, and none in the immediate vicinity of the CN tower. (4) The iCMC CGs >100 C km during the same time period, many 30-50 km distant. (5) A compilation of the 32 LTUL events from the video of the CN Tower during the 0200 - 0302 UTC time period.
Figure 16.
5.3 Self-Initiated Upward Lightning and a Winter Storm
Capturing sprites, or at least a major outbreak of “sprite class” +iCMCs, during a major blizzard over the U.S. has been a long-standing objective. Lightning associated with freezing precipitation and heavy snow rates (snow bursts) has been well documented (Lyons 1989; Holle and Watson, 1996; Brook et al., 1982, etc.) There is also a belief, based upon anecdotal evidence, that thundersnow lightning often involves high peak current +CGs. We note, however, a recent study by Market and Becker (2009) finds that fully 80% of the NLDN-detected lightning in central U.S. thundersnow events was negative, in contrast to winter thunderstorm events on the west coast of Japan (Brook et al., 1982).
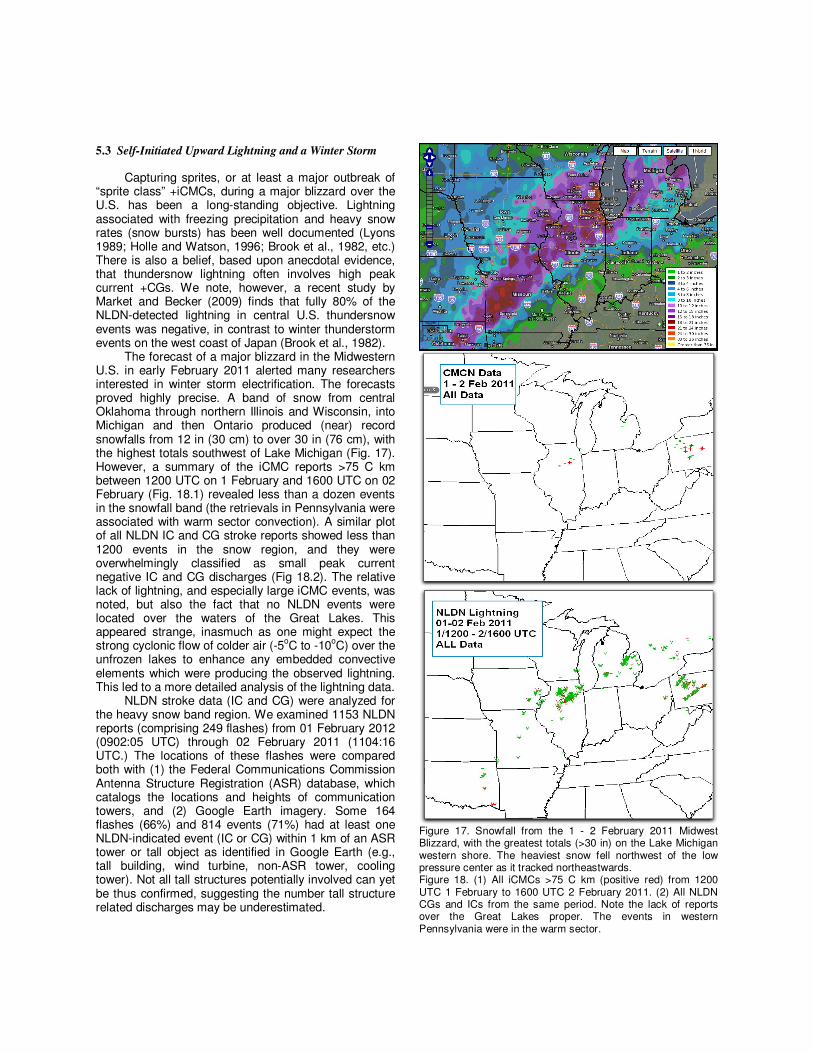
The forecast of a major blizzard in the Midwestern U.S. in early February 2011 alerted many researchers interested in winter storm electrification. The forecasts proved highly precise. A band of snow from central Oklahoma through northern Illinois and Wisconsin, into Michigan and then Ontario produced (near) record snowfalls from 12 in (30 cm) to over 30 in (76 cm), with the highest totals southwest of Lake Michigan (Fig. 17). However, a summary of the iCMC reports >75 C km between 1200 UTC on 1 February and 1600 UTC on 02 February (Fig. 18.1) revealed less than a dozen events in the snowfall band (the retrievals in Pennsylvania were associated with warm sector convection). A similar plot of all NLDN IC and CG stroke reports showed less than 1200 events in the snow region, and they were overwhelmingly classified as small peak current negative IC and CG discharges (Fig 18.2). The relative lack of lightning, and especially large iCMC events, was noted, but also the fact that no NLDN events were located over the waters of the Great Lakes. This appeared strange, inasmuch as one might expect the strong cyclonic flow of colder air (-5
oC to -10
oC) over the
unfrozen lakes to enhance any embedded convective elements which were producing the observed lightning. This led to a more detailed analysis of the lightning data.
NLDN stroke data (IC and CG) were analyzed for the heavy snow band region. We examined 1153 NLDN reports (comprising 249 flashes) from 01 February 2012 (0902:05 UTC) through 02 February 2011 (1104:16 UTC.) The locations of these flashes were compared both with (1) the Federal Communications Commission Antenna Structure Registration (ASR) database, which catalogs the locations and heights of communication towers, and (2) Google Earth imagery. Some 164 flashes (66%) and 814 events (71%) had at least one NLDN-indicated event (IC or CG) within 1 km of an ASR tower or tall object as identified in Google Earth (e.g., tall building, wind turbine, non-ASR tower, cooling tower). Not all tall structures potentially involved can yet be thus confirmed, suggesting the number tall structure related discharges may be underestimated.
Figure 17. Snowfall from the 1 - 2 February 2011 Midwest Blizzard, with the greatest totals (>30 in) on the Lake Michigan western shore. The heaviest snow fell northwest of the low pressure center as it tracked northeastwards. Figure 18. (1) All iCMCs >75 C km (positive red) from 1200 UTC 1 February to 1600 UTC 2 February 2011. (2) All NLDN CGs and ICs from the same period. Note the lack of reports over the Great Lakes proper. The events in western Pennsylvania were in the warm sector.
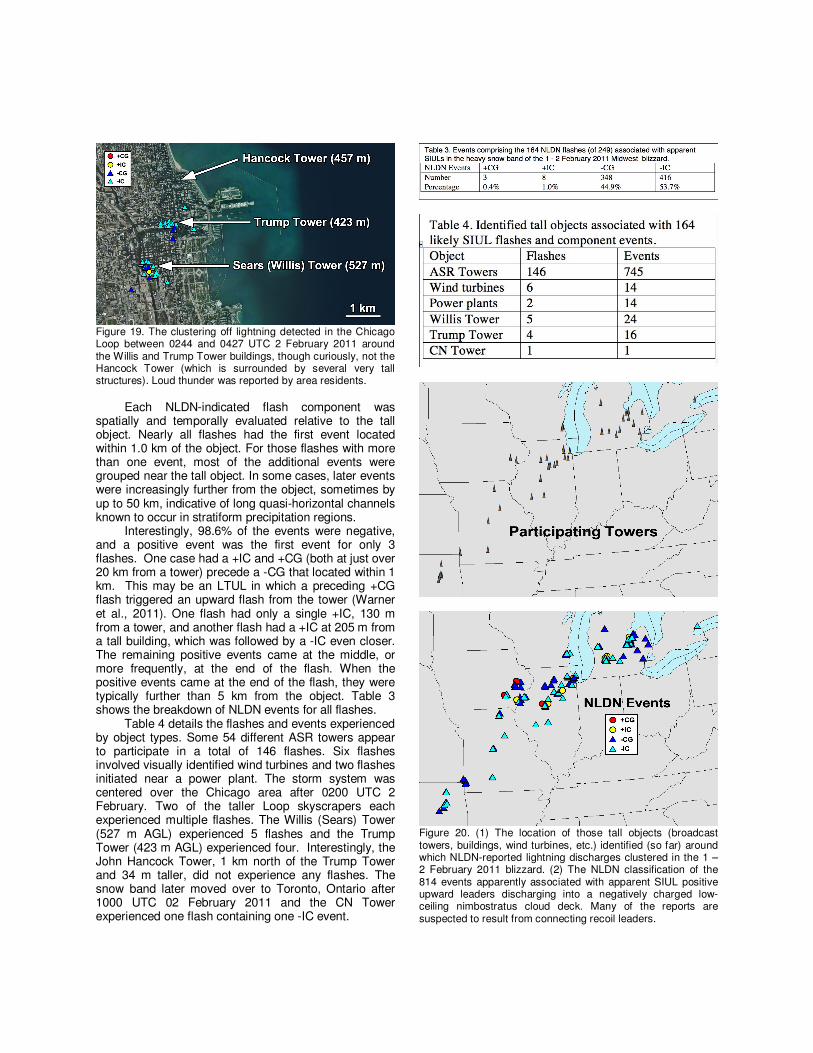
Figure 19. The clustering off lightning detected in the Chicago Loop between 0244 and 0427 UTC 2 February 2011 around the Willis and Trump Tower buildings, though curiously, not the Hancock Tower (which is surrounded by several very tall structures). Loud thunder was reported by area residents.
Each NLDN-indicated flash component was
spatially and temporally evaluated relative to the tall object. Nearly all flashes had the first event located within 1.0 km of the object. For those flashes with more than one event, most of the additional events were grouped near the tall object. In some cases, later events were increasingly further from the object, sometimes by up to 50 km, indicative of long quasi-horizontal channels known to occur in stratiform precipitation regions.
Interestingly, 98.6% of the events were negative, and a positive event was the first event for only 3 flashes. One case had a +IC and +CG (both at just over 20 km from a tower) precede a -CG that located within 1 km. This may be an LTUL in which a preceding +CG flash triggered an upward flash from the tower (Warner et al., 2011). One flash had only a single +IC, 130 m from a tower, and another flash had a +IC at 205 m from a tall building, which was followed by a -IC even closer. The remaining positive events came at the middle, or more frequently, at the end of the flash. When the positive events came at the end of the flash, they were typically further than 5 km from the object. Table 3 shows the breakdown of NLDN events for all flashes.
Table 4 details the flashes and events experienced by object types. Some 54 different ASR towers appear to participate in a total of 146 flashes. Six flashes involved visually identified wind turbines and two flashes initiated near a power plant. The storm system was centered over the Chicago area after 0200 UTC 2 February. Two of the taller Loop skyscrapers each experienced multiple flashes. The Willis (Sears) Tower (527 m AGL) experienced 5 flashes and the Trump Tower (423 m AGL) experienced four. Interestingly, the John Hancock Tower, 1 km north of the Trump Tower and 34 m taller, did not experience any flashes. The snow band later moved over to Toronto, Ontario after 1000 UTC 02 February 2011 and the CN Tower experienced one flash containing one -IC event.
Figure 20. (1) The location of those tall objects (broadcast towers, buildings, wind turbines, etc.) identified (so far) around which NLDN-reported lightning discharges clustered in the 1 – 2 February 2011 blizzard. (2) The NLDN classification of the 814 events apparently associated with apparent SIUL positive upward leaders discharging into a negatively charged low-ceiling nimbostratus cloud deck. Many of the reports are suspected to result from connecting recoil leaders.

Figure 21. National radar reflectivity mosaic at 0100 UTC 02 February 2011 showing reflectivities in the region of heaviest snow (and suspected SIUL discharges) were everywhere below 30-35 dBZ, as was the case through the entire storm.
We suspect that a majority of the flashes in the snow sector were self-initiated upward lightning (SIUL). Some 70.5% of the events were clearly associated with tall objects, and an additional 10% appeared potentially related to either transmission lines or tall objects not readily discernable in the databases. Except for the three flashes mentioned previously, these flashes were characterized by negative NLDN-indicated events close to the tower, and without preceding positive events nearby. The negative events recorded close to the tower locations were likely recoil leader connections (Mazur et al., 2011 a,b) with main luminous channels or dart leader/return stroke sequences following main channel current cutoff (Warner et al., 2011). A preliminary analysis of storm-scale NEXRAD radar reflectivity (see Fig. 21) shows that the heavy snow band was not associated with reflectivities greater than ~35 dBZ, a constant during the entire 30-hour period of heavy snow. The area of suspected SIULs, which at any one time covered an area approximately 200 km across, moved in parallel with, but northwest of, the surface low pressure center. In the snow area, surface air temperatures were substantially below freezing (-5°C to -10°C). During the entire period of apparent upward discharges from the Chicago skyscrapers, reflectivity remained less than 30-35 dBZ. These lightning events occurred totally within the “cold sector” of the storm, in a region with presumably significant synoptic-scale upward motion and low nimbostratus clouds. More detailed radar analyses are underway, but preliminary findings suggest embedded convective elements were not present.
What, then was the source of the charge generation and separation? There are few studies of charging within winter stratiform clouds. Rust and Trapp (2002) used balloon-born electric field measurements in six winter nimbostratus clouds to reveal layers of both positive and negative charge, with densities as high as 0.2 nC m
-3. Williams (1988) reports on electric field and
corona current measurements at the surface during the extreme New England blizzard of 1978, which indicated negative charge in the clouds overhead. Available soundings suggest there was no warm (>0
oC) layer aloft
in the SIUL zone, though mixed phase clouds would seem plausible. These apparent cases of SIULs launched upward positive leaders into a (presumably) negatively charged low-based (30-60 m) nimbostratus cloud deck over a large region for an extended period of time. This bears further investigation. With at least 70% (and possible 80+%) of the reported snow band lightning events apparently associated with upward lightning from elevated grounded objects, the question emerges: what lightning would have been reported had not these structures been built? Also, some of the events apparently involved wind turbines. There is evidence the probability of attachment of lightning to turbines may be enhanced if they are rotating (Wang et al., 2008). Does our increasing understanding of structure - lightning interactions suggests a possible mitigation opportunity to limit lightning damage to wind turbines?
7. CONCLUSIONS AND FUTURE RESEARCH
Just as lightning detection networks such as the NLDN inaugurated major advances in our understanding of the phenomenology of lightning and the storms which produce it, new tools such as 3-D LMAs and interferometers (mapping previously hidden in-cloud lightning channels), the CMCN (providing real-time estimates of charge lowered to ground, supplementing peak current), and high speed video (revealing such key features as recoil leaders) are accelerating our knowledge of the lightning discharge process.
A relatively simple, two-station system (the CMCN) can now operationally monitor impulse charge moment changes (iCMC). This has immediate applications to the detection of storms producing especially energetic lightning that trigger sprites (of both polarities). In addition, the availability of charge lowered to ground (which is only a weak function of peak current) could have numerous applications to utility protection, munitions storage, public safety, fire start detection and space weather. This capability will only be enhanced as the CMCN becomes more robust, deploys more sensors, and is upgraded to retrieve the full charge moment change of the CG (an area of active investigation).
By capturing high-speed lightning imagery of upward lightning from towers, the CMCN and SpriteNet cameras, the suspected common trigger (energetic +CGs) for both sprites and many LTUL events has been demonstrated. And the forecasting and monitoring techniques developed for sprite research now appear to have the ability to isolate regions likely to experience lightning triggered upward lightning (LTUL) discharges from tall towers and buildings.
The unanticipated finding that the overwhelming majority of NLDN-reported events in a major winter snow event appeared to be self-initiated upward lightning (SIUL) from tall structures raises a number of questions. Is there a significant charge generation mechanism within wintertime nimbostratus clouds in intense cyclonic storms that is not well understood? And how would these clouds have discharged, if at all, had not the numerous tall structures been placed in the storm’s path by humans?
Blue jets and gigantic jets, which can transport large amounts of charge upward from thunderstorm tops, remain enigmatic. Yet, by ongoing SpriteNet video monitoring which allows placing the jets in their electrical and meteorological context by using the NLDN, CMCN, LMAs, satellite and radar, we have begun to reveal the distinct meteorological regimes (very different from those producing sprites/halos/elves), which produce them.
Warner et al. (2011, 2012) note that each LTUL event, in addition to the +CG often serving as the initiator of the process, also appears to generate, on average, ~2 NLDN reports (typically small -CG or –IC events) that are likely the result of recoil leader reconnections. Along with an unknown number of SIULs in winter weather regimes, it is unclear how these processes affect the NLDN lightning climatology on the whole or for individual case studies. We note there are over 10,000 registered towers of >200 m AGL in the continental U.S.
Also, the ongoing reports of isolated, very high peak current and large iCMC CGs (often of positive polarity) appear in most cases to be real events, and not network artifacts. The meteorological circumstances surrounding these “rogue flashes” remain unclear.
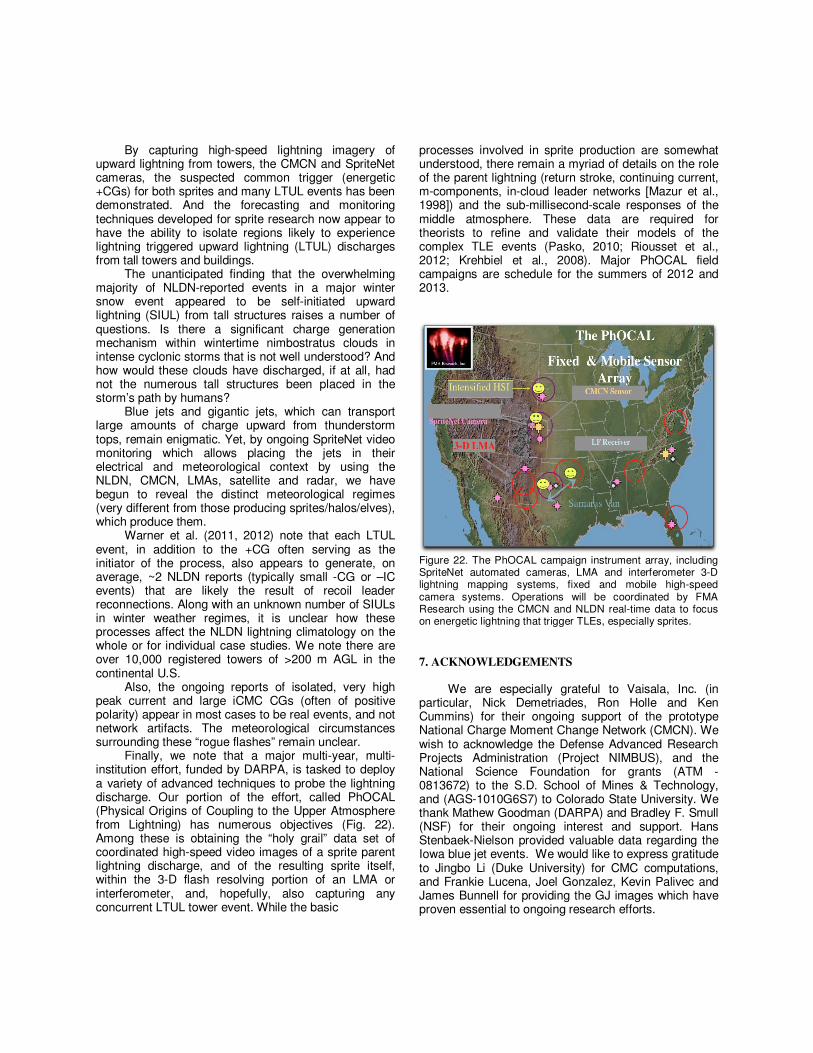
Finally, we note that a major multi-year, multi-institution effort, funded by DARPA, is tasked to deploy a variety of advanced techniques to probe the lightning discharge. Our portion of the effort, called PhOCAL (Physical Origins of Coupling to the Upper Atmosphere from Lightning) has numerous objectives (Fig. 22). Among these is obtaining the “holy grail” data set of coordinated high-speed video images of a sprite parent lightning discharge, and of the resulting sprite itself, within the 3-D flash resolving portion of an LMA or interferometer, and, hopefully, also capturing any concurrent LTUL tower event. While the basic
processes involved in sprite production are somewhat understood, there remain a myriad of details on the role of the parent lightning (return stroke, continuing current, m-components, in-cloud leader networks [Mazur et al., 1998]) and the sub-millisecond-scale responses of the middle atmosphere. These data are required for theorists to refine and validate their models of the complex TLE events (Pasko, 2010; Riousset et al., 2012; Krehbiel et al., 2008). Major PhOCAL field campaigns are schedule for the summers of 2012 and 2013.
Figure 22. The PhOCAL campaign instrument array, including SpriteNet automated cameras, LMA and interferometer 3-D lightning mapping systems, fixed and mobile high-speed camera systems. Operations will be coordinated by FMA Research using the CMCN and NLDN real-time data to focus on energetic lightning that trigger TLEs, especially sprites.
7. ACKNOWLEDGEMENTS
We are especially grateful to Vaisala, Inc. (in particular, Nick Demetriades, Ron Holle and Ken Cummins) for their ongoing support of the prototype National Charge Moment Change Network (CMCN). We wish to acknowledge the Defense Advanced Research Projects Administration (Project NIMBUS), and the National Science Foundation for grants (ATM - 0813672) to the S.D. School of Mines & Technology, and (AGS-1010G6S7) to Colorado State University. We thank Mathew Goodman (DARPA) and Bradley F. Smull (NSF) for their ongoing interest and support. Hans Stenbaek-Nielson provided valuable data regarding the Iowa blue jet events. We would like to express gratitude to Jingbo Li (Duke University) for CMC computations, and Frankie Lucena, Joel Gonzalez, Kevin Palivec and James Bunnell for providing the GJ images which have proven essential to ongoing research efforts.

8. REFERENCES
Berger, K., 1977: The Earth Flash In: Golde, R.H. (Ed.). Lightning, Physics of Lightning, vol 1. Academic Press, New York, pp. 119-190.
Barrington-Leigh, C.P., U.S. Inan, M. Stanley and S.A. Cummer, 1999: Sprites directly triggered by negative lightning discharges. Geophys. Res. Lett. 26, 3605-3608.
Boccippio, D.J., E.R. Williams, W.A. Lyons, I. Baker and R. Boldi, 1995: Sprites, ELF transients and positive ground strokes. Science, 269, 1088-1091.
Brook, M., M. Nakano, P. Krehbiel and T. Takeuti, 1982: The electrical structure of the Hokuriku winter thunderstorms. J. Geophys. Res., 87, 1207-1215.
Brook, M, P. Krehbiel, D. MacLaughlan, T. Takeuti and M. Nakano, 1980: Positive ground stroke observations in Japanese and Florida storms. Atmospheric Electrcity, 365-369.
Byers, H. and R.R. Braham Jr., 1949: The Thunderstorm. U.S. Weather Bureau, Washington, DC, 240.
Chang, J.-S., T.G. Beuthe, L. Seto, A. Duft, N. Hayashi, W. Chisholm and W. Janischewskyj, 1989: An investigation of the possible relationships between thundercloud electric fields and the lightning parameters for tall structures. J. Geophys. Res., 94, 13197-113205.
Cummer, S. A., and W. A. Lyons, 2005: Implications of lightning charge moment changes for sprite initiation.
J. Geophys. Res., 110, A04304, doi:10.1029/2004JA010812.
Cummer, S.A. and U.S. Inan, 1997: Measurement of charge transfer in sprite-producing lightning using ELF radio atmospherics. Geophys. Res. Lett., 24, 1731-1734.
Cummins, K. L., and M. J. Murphy, 2009: An overview of lightning locating systems: History, techniques, and data uses, with an in-depth look at the U.S. NLDN. IEEE Trans. Electromag. Compat., 51(3), 499-518.
Franz, R.C., R.J. Nemzek and J.R. Winckler, 1990: Television image of a large upward electrical discharge above a thunderstorm system. Science, 249, 48-51.
Holle, R.L. and A.I. Watson, 1996: Lightning during two central U.S. winter preciupitation events. Wea. Fcst., 11, 599-614.
Holle, R.L., R.E. Lopez, K.W. Howard, K.L. Cummins, M.D. Malone and E.P. Krider, 1996: An isolated winter cloud-to-ground lightning flash causing damage and injury in Connecticut. Bull. Amer. Meteor. Soc., 78, 437-441.
Hu, W., S. Cummer, W.A. Lyons and T. E. Nelson, 2002: Lightning charge moment changes for the initiation of sprites. Geophys. Res. Lett. , 29, doi: 10.1029/2001GL014593.
Huang, E., E. Williams, R. Boldi, S. Heckman, W. Lyons, M. Taylor, T. Nelson and C. Wong, 1999: Criteria for sprites and elves based on Schumann resonance observations. J. Geophys. Res. 104, 16943-16964.
Hussein, A.M., W. Janischewskyj, J.S. Chang, V. Shostak, W. Chisholm, P. Dzurevych and Z.E. Kawasaki, 1995: Simultaneous measurements of lightning paramters for strokes to the Toronto CN Tower. J. Geophys. Res. - Atmos., 100, 8853-8861.
Inoue, T., H.C. Stenbaek-Nielsen, et al., 2011: Stereo observations of sprites in support of NHK TV project: The Cosmic Shore. AGU Fall Meeting, Abstract
Krehbiel, P. R., J. A. Riousset, V. P. Pasko, R. J. Thomas, W. Rison, M. A. Stanley, and H. E. Edens, 2008: Upward electrical discharges from thunderstorms. Nat. Geosci., 1, 233-237, dio:10.1038/ngeo162.
Krider, E.P., R.C. Noggle, A.E. Pifer and D.L. Vance, 1980: Lightning direction-finding systems for forest fire detection. Bull. Amer. Meteor. Soc. 61, 980-986.
Lang, T. J., W. A. Lyons, S. A. Rutledge, J. D. Meyer, D. R. MacGorman, and S. A. Cummer, 2010: Transient luminous events above two mesoscale convective systems: Storm structure and evolution. J. Geophys. Res., 115, A00E22, doi:10.1029/2009JA014500.
Lang, T. J., J. Li, W. A. Lyons, S. A. Cummer, S. A. Rutledge, and D. R. MacGorman, 2011: Transient luminous events above two mesoscale convective systems: Charge moment change analysis. J. Geophys. Res., 116, A10306, doi:10.1029/2011JA016758.
Lu, G., et al., 2011: Lightning development associated with two negative gigantic jets. Geophys. Res. Lett., 38, L12801, doi:10.1029;2011GL047662.
Lyons, W.A., S.A. Cummer, S.A. Rutledge, T.J. Lang, T. Meyer, T.A. Warner,
T.M. Samaras, 2011: TLEs and
their parent lightning discharges. XIV International Conf. on Atmos. Electricity, Rio de Janiero, Brazil, 4 pp.
Lyons, W. A., M. Stanley, J. D. Meyer, T. E. Nelson, S. A. Rutledge, T. J. Lang, and S. A. Cummer, 2009: The meteorological and electrical structure of TLE-producing convective storms. In, Lightning: Principles, Instruments and Applications, edited by H. D. Betz et al., pp. 389–417, doi:10.1007/978-1-4020-9079-0-17, Springer, NY.
Lyons, W.A. and S.A. Cummer, 2008: Stratospheric Lightning: Forecasting and Nowcasting Tools. Final Report, SBIR Phase II, Missile Defense Agency, Contract HQ0006-06-C-7313, FMA Research, Inc., Fort Collins, CO, 298 pp.
Lyons, W.A., S.A. Cummer, M.A. Stanley, K. Wiens and T.E. Nelson, 2008: Supercells and sprites. Bull. Amer. Meteor. Soc. , 1165-1174, doi: 10.1175/BAMS2439.1

Lyons, W.A., 2006: The Meteorology of Transient Luminous Events – An Introduction and Overview, Chapter 1. NATO Advanced Study Institute, Sprites, Elves and Intense Lightning Discharges, NATO Science Series II (Mathematics, Physics and Chemistry), Vol. 225, Springer Publishing House. M. Fullekrug, Ed., Corte, Corsica, 19-56 pp.
Lyons, W.A., T.E. Nelson, R.A. Armstrong, V.P. Pasko, and M. A. Stanley, 2003: Upward electrical discharges from the tops of thunderstorms. Bull. Amer. Meteor. Soc., 84, 445-454.
Lyons, W. A., T. E. Nelson, E. R. Williams, S. A. Cummer, and M. A. Stanley, 2003: Characteristics of sprite-producing positive cloud-to-ground lightning during the 19 July 2000 STEPS mesoscale convective systems. Mon. Wea. Rev., 131, 2417–2427, doi:10.1175/1520-0493
Lyons, W. A., 1996: Sprite observations above the U.S. High Plains in relation to their parent thunderstorm systems. J. Geophys. Res., 101, 29,641–29,652, doi:10.1029/96JD01866.
Lyons, W.A., 1994: Characteristics of luminous structures in the stratosphere above thunderstorms as imaged by low-light video. Geophys. Res. Lett., 21, 875-878.
Lyons, W.A., 1989: Wintertime lightning. LDIS Technical News and Notes, No. 89-1, R*SCAN Corporation, Minneapolis, MN.
Market, P.S. and A. E. Becker, 2009: A study of lightning flashes attending periods of banded snowfall. Geophys. Res. Lett., 36, L01809, doi: 10.1029/2008GL036317.
Mazur, V., and L. H. Ruhnke, 2011a: Physical processes during development of upward leaders from tall structures. J. Electrostatics, 69, 97-110.
Mazur, V., L. H. Ruhnke, T. A. Warner, and R. E. Orville, 2011b: Discovering the Nature of Recoil Leaders. 14th International Conference on Atmospheric Electricity, August 07-12, 2011, Rio de Janeiro, Brazil.
Mazur, V., X.-M. Shao and P.R. Krehbiel, 1998: "Spider" lightning in intracloud and positive cloud-to-ground flashes. J. Geophys. Res., 103, 19811-19822.
McEachron, K.B., 1939: Lightning to the Empire State Building. J. Franklin Inst., 227, 149-217.
Meyer, T.C., T.J. Lang, S.A. Rutledge, W.A. Lyons S.A. Cummer and G. Lu, 2012: Radar and lightning analyses associated with negative gigantic jets. Geophys. Res. Lett. (submitted).
Moore, P.K. and R. E. Orville, 1990: Lightning characteristics in lake-effect thunderstorms. Mon. Wea. Rev., 118,1767-1782.
Orville, R.E., G.R. Huffines, W.R. Burrows and K.L. Cummins, 2011: The North American Lightning Detection Network (NALDN) – Analysis of flash data:
2001-2009. Mon. Wea. Rev., 139, 1305- 1322. Doi: 10:1175/2010MWR3452.1
Orville, R.E., 1993: Cloud-to-ground lightning in the blizzard of ’93. Geophys. Res. Lett., 20, 1367-1370.
Pasko, V.P, 2010: Recent advances in the theory of trasnient luminous events. J. Geophys. Res., 115, A00E35, doi: 10.1029/2009JA014860.
Pasko, V. P., M. A. Stanley, J. D. Mathews, U. S. Inan, and T. G. Wood, 2002: Electrical discharge from a thundercloud top to the lower ionosphere. Nature, 416, 152-154, doi:10.1038/416152a.
Price, C., W. Burrows, P. King, 2002: The likelihood of winter sprites over the Gulf Stream. Geophys. Res. Lett., 29, doi:10.1029/2002GL015571.
Proctor, D.E., 1971: A hyperbolic system for obtaining VHF radio pictures of lightning. J. Geophys. Res., 76, 1478-1489.
Rakov, V.A., 2003: A review of the interaction of lightning with tall objects. Recent Res. Devel. Geophys, 5, 57-71.
Rakov, V. A., and M. A. Uman, 2003: Lightning: Physics and Effects. Cambridge Univ. Press, New York.
Riousset, J. A., V. P. Pasko, P. R. Krehbiel, W. Rison, and M. A. Stanley, 2010: Modeling of thundercloud screening charges: Implications for blue and gigantic jets. J. Geophys. Res., 115, A00E10,doi:10.1029/2009JA014286.
Rust, W.D. and R.J. Trapp, 2002: Initial balloon soudnings of the electric field in winter nimbostratus clouds in the USA. Geophys. Res. Lett., 29, doi: 10.1029/2002GL015278.
Shepherd, Tommy R., W. David Rust, Thomas C. Marshall, 1996: Electric fields and charges near 0°C in stratiform clouds. Mon. Wea. Rev., 124, 919–938.
Stanley, M.A. and M.J. Heavner, 2003: Tall structure lightning induced by sprite-producing discharges. Proceedings, ICAE, 4 pp.
Stolzenburg, M., T. C. Marshall, W. D. Rust, and B. F. Smull, 1994: Horizontal distribution of electrical and meteorological conditions across the stratiform region of a mesoscale convective system. Mon. Weather Rev., 122, 1777–1797, doi:10.1175/1520-0493(1994)
Takahashi, Y., R. Miyasato, T. Adachi, K. Adachi, M. Sera, U. Uchida and H. Fukunishi, 2003: Activities of sprites and elves in the winter season. Japan. J. Atmos. Sol. Terr. Phys., 65, 551-560.
Thomas, R.J., P.R. Krehbiel, W. Rison, S.J. Hunyady, W.P. Winn, T. Hamlin and J. Harlin, 2004: Accuracy of the lightning mapping array. J. Geophys.Res.,109, D14207, doi: 10.1029/2004JD004549.
van der Velde, O.A., J. Bor, J. Lu, S.A.Cummer, E. Arnone, F. Zanotti, M. Fullekrug, C. Haldoupis, S. NaitAmor and T. Farges, 2010: Multi-instrumnetal observations of a positive gigantic jet produced by a
winter thunderstorm in Europe. J. Geophys. Res., 115, D24301, doi: 10.19029/2010JDD013332.
van der Velde, O. A., et al. , 2007: Analysis of the first gigantic jet recorded over continental North America, J. Geophys. Res., 112, D20104,doi:10.1029/2007JD008575.
Wang, D., N. Tagaki, T. Watanabe, H. Sakurano and M. Hashimoto, 2008: Obsevered characteristics of upward leaders from a windmill and its lightning protection tower. Geophys. Res. Lett., L02803, doi: 10.1029/2007GL032136.
Warner, T. A., 2011: Observations of simultaneous upward lightning leaders from multiple tall structures. J. Atmos. Res., doi:10.1016/j.atmosres.2011.07.004 (In press)
Warner, T.A., M.M.F. Saba, S. Ridge, M. Bunkers, W. Lyons and R.E. Orville, 2012: Lightning-triggered upward lightning from towers in Rapid City, South Dakota. Proceedings, ILDC, Boudler, CO, 9 pp.
Warner, T. A., K. L. Cummins, and R. E. Orville, 2011: Comparison of upward lightning observations from towers in Rapid City, South Dakota with National Lightning Detection Network data - preliminary findings. Proceedings of the 3rd International Symposium on Winter Lightning, Jun 13-15, Tokyo.
Wescott, E.M., D.D. Sentman, M.J. Heavner, D.L. Hampton and O.H. Vaughan, Jr., 1998: Blue jets: their relationship to lightning and very large hailfall, and their physical mechanisms for the production. J. Atmos. Sol. Terr. Phys. 60, 713-724.
Williams E.R., C.-L. Kuo, J. Bór, G. Sátori, R. Newsome, T. Adachi, R. Boldi, A. Chen, E. Downes, R.R. Hsu, W. Lyons, M. Saba, M. Taylor
and H.T. Su, 2012:
Resolution of the Sprite Polarity Paradox. Atmos Res. (in press)
Williams, E.R., E. Downes, R. Boldi, W. Lyons and S. Heckman, 2007: Polarity asymmetry of sprite-producing lightning: A paradox? Radio Science, 42, RS2S17, doi: 10.1029/2006RS003488.
Williams, E.R., 1998: The positive charge reservoir for sprite-producing lightning. J. Atmos. Solar-Terrest. Phys., 60, 689-692.
Williams, E.R., 1988: Anomalous electrification in winter storms. AMS, 15
th Conf. on Severe Local Storms,
Baltimore, 30-4-308. Zajac, B.A. and S.A. Rutledge, 2001: Cloud-to-ground
lightning activity in the contiguous United States from 1995 to 1999. Mon Wea. Rev., 129, 999-1019.