Embed Size (px)
Citation preview
THE UNITED REPUBLIC OF TANZANIA
PRIME MINISTER’S OFFICE
REGIONAL ADMINISTRATION AND LOCAL GOVERNMENT
ILALA MUNICIPAL COUNCIL
SOCIO-ECONOMIC PROFILE
Joint Publication by: ILALA MUNICIPAL COUNCIL
and INSTITUTE OF RURAL DEVELOPMENT PLANNING [IRDP]
DODOMA 2014
i
TABLE OF CONTENTS List of Tables ............................................................................................................................................... v List of Figures ............................................................................................................................................ ix LIST OF ABBREVIATIONS ...................................................................................................................... x FOREWORD .............................................................................................................................................. xi SECTION I................................................................................................................................................. 22 1.0 LAND, PEOPLE AND CLIMATE .............................................. Error! Bookmark not defined.
1.1 GEOGRAPHICAL LOCATION ................................................................................................... 22
1.2 LAND AREA AND ADMINISTRATIVE UNITS ...................................................................... 22
1.3 ETHNICITY..................................................................................................................................... 26
1.4 KEY POPULATION CHARACTERISTICS ................................................................................ 26
1.4.1 Introduction ................................................................................................................................. 26
1.4.2 Population Size, Growth and Density ...................................................................................... 26
1.4.3 Households and Households Size ............................................................................................ 28
1.4.4 Migration ...................................................................................................................................... 28
1.5 CLIMATE AND SOILS .................................................................................................................. 29
SECTION II ............................................................................................................................................... 30 2.0 MUNICIPAL ECONOMY ............................................................................................................. 30
2.1 INTRODUCTION.......................................................................................................................... 30
2.2 REGIONAL GDP ........................................................................................................................ 30
2.3 PER CAPITA GDP ........................................................................................................................ 31
2.4 PRODUCTIVE SECTORS .......................................................................................................... 31
2.4.1 AGRICULTURE ......................................................................................................................... 31
2.4.1.2 Food Crops .............................................................................................................. 32
2.4.1.3 Cash Crops .............................................................................................................. 32
2.4.1.4 Chemical Fertilizers ............................................................................................... 33
2.4.1.5 Utilization of Fungicides ....................................................................................... 34
2.4.1.6 Utilization of Insecticides ...................................................................................... 35
2.4.1.7 Improved Seeds ...................................................................................................... 35
2.4.1.8 Farm Implements ................................................................................................... 36
2.4.1.9 Irrigated Agriculture ............................................................................................. 37 2.4.2 LIVESTOCK ................................................................................................................................. 38
2.4.2.1 Livestock Population ............................................................................................. 38
2.4.2.2 Cattle Population ................................................................................................... 39
2.4.2.3 Livestock Keepers .................................................................................................. 39
2.4.2.4 Insemination of Cattle ........................................................................................... 40
2.4.2.5 Livestock Infrastructure ........................................................................................ 40
2.4.2.6 Major Cattle Diseases ............................................................................................ 41
2.4.2.7 Major Goat Diseases .............................................................................................. 41
2.4.2.8 Major Sheep Diseases ............................................................................................ 42
2.4.2.9 Major Poultry Diseases .......................................................................................... 42
2.4.2.10 Marketing of Major Livestock ............................................................................ 42
2.4.2.11 Marketing of Livestock Hides and Skins .......................................................... 43
ii
2.4.2.12 Milk Production ................................................................................................... 43
2.4.2.13 Livestock Personnel ............................................................................................. 44 2.4.3 Natural Resources ....................................................................................................................... 44
2.4.3.1 Forestry .................................................................................................................... 44
2.4.3.1.1 Forest Cover ......................................................................................................... 44
2.4.3.1.2 Status of Forest Reserve ..................................................................................... 45
2.4.3.1.3 New Tree Seedling Planted ............................................................................... 45
2.4.3.1.4 Revenue collected from Timber and Charcoal ............................................... 46
2.4.3.2 Fisheries ................................................................................................................... 46
2.4.3.2.1 Fisheries status in Ilala Municipal Council ..................................................... 46
2.4.3.2.2 Revenue Collection from fishermen ................................................................. 47
2.4.3.3 Beekeeping .............................................................................................................. 47
2.4.3.3.1 Beekeepers ............................................................................................................ 48
2.4.3.3.2 Beekeeping Products and Value Harvested .................................................... 48
2.4.3.4 Wildlife .................................................................................................................... 49 2.4.4 Trade and Industry .................................................................................................................... 49
2.4.4.1 Size and Type of Manufacturing Industry ......................................................... 49
2.4.4.2 Employment Status in Industries ........................................................................ 50
2.4.4.3 Type of Business undertaken ............................................................................... 51
2.4.4.4 Revenue collection by sources ............................................................................. 51
2.4.4.5 Trend of revenue collection .................................................................................. 52 SECTION III .............................................................................................................................................. 53 3.0 ECONOMIC INFRASTRUCTURE .................................................................................................. 53
3.1 ROAD TRANSPORT ..................................................................................................................... 53
3.1.1 Introduction ................................................................................................................................. 53
3.1.2 Road length and type ................................................................................................................. 53
3.1.3 Road Density ............................................................................................................. 54
3.1.4 Public Transport in Dar es Salaam ......................................................................... 55 3.2 RAILWAY TRANSPORT .............................................................................................................. 57
3.3 AIR TRANSPORT .......................................................................................................................... 58
3.4 MARINE TRANSPORT ................................................................................................................. 60
3.5 COMMUNICATIONS ................................................................................................................... 61
3.6 LAND DEVELOPMENT ............................................................................................................... 63
3.7 ENERGY .......................................................................................................................................... 64
3.7.1 Electricity ...................................................................................................................................... 64
3.7.2 Fossil Fuels ................................................................................................................................... 65
3.7.3 Fuel wood/Charcoal .................................................................................................................. 65
3.7.4 Solar Energy ................................................................................................................................. 65
SECTION IV .............................................................................................................................................. 65 4.0 SOCIO SERVICES .......................................................................................................................... 65
4.1 THE HEALTH SECTOR ................................................................................................................ 65
4.1.1 Introduction ................................................................................................................................. 65
iii
4.1.2 Morbidity and Mortality ............................................................................................................ 66
4.1.3 HIV/AIDS ................................................................................................................................... 69
4.1.4 Health Facilities .......................................................................................................................... 71
4.1.5 Key Health Personnel and Hospital/H.C beds ...................................................................... 75
4.1.6 Child Nutrition ............................................................................................................................ 77
4.1.7 The Immunisation of Children .................................................................................................. 78
4.1.8 Complementary Health Services .............................................................................................. 79
4.2 THE EDUCATION SECTOR ........................................................................................................ 82
4.2.1 Introduction ................................................................................................................................. 82
4.2.3 Primary School Enrolment ........................................................................................................ 85
4.2.3.1 Introduction ............................................................................................................ 85
4.2.3.2 Primary Schools ...................................................................................................... 85
4.2.3.3 Primary School Dropouts ..................................................................................... 90
4.2.3.4 Primary School Infrastructure .............................................................................. 91
4.2.3.5 Primary School Teachers ....................................................................................... 93
4.2.3.6 Primary Education Indicators .............................................................................. 95
4.2.3.6 Transition to Secondary Education ..................................................................... 97
4.2.3.7 Other School Infrastructures ................................................................................ 98 4.2.4 Secondary School Education ..................................................................................................... 99
4.2.4.1 Secondary School Enrollment and Performance ............................................... 99
4.2.2.4 Secondary School Teachers ................................................................................. 104
4.2.4.3 Secondary School Indicators .............................................................................. 106
4.2.5 Vocational Education and Training ..................................................................... 110 4.2.6 College Education ..................................................................................................................... 111
4.2.7 Adult education......................................................................................................................... 111
4.3 THE WATER SECTOR ................................................................................................................ 112
4.3.1 Introduction ............................................................................................................................... 112
4.4 SOLID WASTE MANAGEMENT .............................................................................................. 115
4.5.1 Solid waste composition ........................................................................................ 117
4.4.2 Solid waste collection and transportation ........................................................... 118 SECTION V ............................................................................................................................................. 120 5.0 OTHER DEVELOPMENT ISSUES ............................................................................................. 120
5.1 DAY CARE CENTRES ............................................................................................................ 120
5.2 Orphans and Most Vulnerable Children .................................................................................. 120
5.3 WOMEN PROTECTION AND DEVELOPMENT ................................................................... 121
5.4 YOUTH DEVELOPMENT GROUPS ......................................................................................... 122
5.5 COOPERATIVES .......................................................................................................................... 123
5.5.1 SACCOS and their membership ........................................................................... 123
5.5.2 Financial Institutions in Ilala Municipality ......................................................... 124 5.6 NON GOVERNMENTAL ORGANIZATIONS (NGO’S) ....................................................... 125
5.7 TOURISM ...................................................................................................................................... 126
5.8 ENVIRONMENTAL CONSERVATION .................................................................................. 126
iv
5.9 CIVIL SOCIETY ASSISTANCE ................................................................................................. 127
5.10 SAFETY AND SECURITY ....................................................................................................... 128
SECTION VI ............................................................................................................................................ 130 6.0 POTENTIAL AREAS FOR INVESTMENTS ................................................................................ 130
6.1 Education ...................................................................................................................................... 130
6.2 Health ............................................................................................................................................. 132
6.4 Fisheries Development ............................................................................................................... 134
6.5 Women Development ................................................................................................................. 135
6.6 Residential Houses at Ilala Municipality ................................................................................. 135
6.6.1 Build and Transfer .................................................................................................. 135
6.6.2 Build-Operate-Transfer .......................................................................................... 135
6.6.3 Mixed-Capital Partnership .................................................................................... 136
6.7 Water Supplies and Sanitation ................................................................................................... 136
6.8 Environmental Conservation.................................................................................................... 136
6. 9 Nurseries and Aquaria ............................................................................................................... 137
6.10 Municipal Parks ......................................................................................................................... 137
v
LIST OF TABLES
Table 1: Distribution of Land Area, Water Area and Total Area by Division ................................. 22 Table 2: Distribution of Administrative Units by Division, 2013 ...................................................... 23 Table 3: Distribution of the Population by Wards and Sex , Ilala Municipality, 2012 ................... 25 Table 4: Ilala Municipal Council Population Development 2002 to 2012 ........................................ 27 Table 5: Ilala Municipal Council Population by Division, 2002 and 2012 ........................................ 27 Table 6: Distribution of Population Density by Division, 2002 to 2012 ............................................ 28 Table 7: Estimated area (ha) under Crop production, Ilala Municipality, 2013 .............................. 31 Table 8: Estimated Production of both Food and Cash Crops (Tons) in Ilala Municipality….…32 Table 9: Availability of Chemical Fertilizers (Tons) in Ilala Municipality ....................................... 34 Table 10: Availability of Fungicides (Lts/Kgs/Tons) in Ilala Municipality ................................... 34 Table 11: Availability of Insecticides (Lts/Kgs/Tons) in Ilala Municipality … ........................... 35 Table 12: Availability of Improved Seeds (Tones) in Ilala Municipality .......................................... 36 Table 13: Availability of Agricultural Implements in Ilala Municipality, 2013 ............................... 36 Table 14: Potential Areas for Irrigation in Ilala Municipality, 2013 .................................................. 38 Table 15: Estimated Livestock Population by Division in Ilala Municipality, 2013 ....................... 38 Table 16: Distribution of cattle by type and division in Ilala Municipality, 2013 ........................... 39 Table 17: Distribution of Small holder Livestock Keepers in Ilala Municipality, 2013 .................. 39 Table 18: Number of Cattle Inseminated Artificially in Ilala Municipality .................................... 40 Table 19: Livestock Infrastructure in Ilala Municipality, 2013........................................................... 40 Table 20: Three Major Cattle Diseases Reported in Ilala Municipality, 2009-2013 ......................... 41 Table 21: Three Major Goat Diseases Reported in Ilala Municipality, 2009- 2013 .......................... 41 Table 22: Three Major Poultry Diseases Reported in Ilala Municipality 2009- 2013 ...................... 42 Table 23: Marketing of major livestock in Ilala Municipality, 2009 - 2013 ....................................... 42 Table 24: Marketing of Livestock Hides and Skins in Ilala Municipality, 2009-2013 ..................... 43 Table 25: Milk production in Ilala Municipality, 2009-2013 ............................................................... 43 Table 26: Availability of Livestock personnel in Ilala Municipality, 2013 ....................................... 44 Table 27: Forest Cover by Division, Ilala Municipality, 2013 ............................................................ 45 Table 28: Status of Forest Reserve in Ilala Municipality, 2013 ........................................................... 45 Table 29: Seedlings planting in Ilala Municipality, 2013 .................................................................... 45 Table 30: Revenue collected from Timber and Charcoal in Ilala Municipality, 2013 ..................... 46 Table 31: Status of fishing activities in Ilala Municipality, 2013 ........................................................ 46 Table 32: Government Revenue from fishermen in Ilala Municipality, 2009 to 2013 .................... 47 Table 33: Number of Beehives in Ilala Municipality, 2013 ................................................................. 47 Table 34: Beekeepers in Ilala Municipality , 2013 ................................................................................ 48 Table 35: Beekeeping products and Value harvested in Ilala Municipality .................................... 48 Table 36: Availability of Natural Resource Personnel in Ilala Municipality, 2013 ......................... 49 Table 37: Size and Type of Manufacturing Industry in Ilala Municipality ...................................... 50 Table 38: Distribution of number of workers in Industrial establishment in Ilala Municipality. . 50 Table 39: Income generated from different types of Business in Ilala Municipality, 2013 ............ 51 Table 40: Trend of Revenue Collection by Sources in Ilala Municipality, 2013 .............................. 52 Table 41: Trend of Revenue Collection in Ilala Municipality, 2009/2010 to 2012/2013 ................ 52 Table 42: Length of Road Network by Grade and by Division ......................................................... 53 Table 43: Length of Road Network (Kms) by Type of Surface by Division, 2013 ........................... 54 Table 44:Distribution of Road Density by Land Area and by Division, 2013 ................................. 54 Table 45:Railway Services in Ilala Municipality, 2013 ........................................................................ 57 Table 46: Air Services in Ilala Municipality .......................................................................................... 59
vi
Table 47: Telecommunication Services ................................................................................................. 62 Table 48: Accessibility of Mobile Phone Services ................................................................................ 62 Table 49: Urban Land Planning in Ilala Municipality ......................................................................... 63 Table 50: Land Use Planning in Ilala Municipality ............................................................................. 64 Table 51: List of Ten Most Commonly Reported Causes of Morbidity (Out patient Only) ......... 67 Table 52: List of Ten Most Commonly Reported Causes of Morbidity (In patient Only) ............ 68 Table 53: List of Ten Most Commonly Reported Causes of Mortality (In patient Only) ………69 Table 54: Distribution of HIV/AIDS cases in the population ............................................................ 70 Table 55: Number of Expectant Mothers Infected With HIV/AIDS with Respective HIV/AIDS status of Children Born, 2013 ................................................................................................................. 70 Table 56: Expectant Mothers Vaccinated TT2 from 2011 -2013 ......................................................... 71 Table 57: Number of TB Cases by Sex from 2009 to 2013 .................................................................. 71 Table 58: Distribution of dispensaries by ownership and by Division ............................................ 72 Table 59: Distribution of Health Centres and Hospitals by ownership and by Division .............. 72 Table 60: Distribution of Public Health Facilities ................................................................................ 73 Table 61: Distribution of Doctors among the population by Division ............................................. 76 Table 62: Type and Number of Medical personnel in Ilala Municipality ........................................ 76 Table 63: Distribution of hospital and health centres beds by Division, 2013……… ..................... 77 Table 64: Distribution of children under one year who were under weight by Division.. ........... 78 Table 65: Distribution of vaccinations with BCG of children under one year by Division ....... 79 Table 66: Distribution of vaccinations with DPT3 of children under one year by Division ...... 79 Table 67: Distribution of complementary Rural Health Care services by Division........................ 80 Table 68: Accessibility of Water in Public Health Facilities 2010 and 2013 ..................................... 80 Table 69: Number of Registered Pharmacy (Chemistry shops) 2013 ............................................... 81 Table 70: Number of Registered Accredited Drugs Dispensing Outlets (ADDO) ......................... 81 Table 71: Distribution of pre-primary school by ownership and by Division 2013 ....................... 83 Table 72: Number of Pre-Primary Schools by Ownership ................................................................. 83 Table 73: Distribution of total enrollment by ownership of pre-primary schools ,2013…… ........ 84 Table 74: Enrollment in Pre-Primary Schools by Ownership ............................................................ 84 Table 75: Distribution of number of primary schools by ownership and by Division 2013 ......... 85 Table 76: Distribution of the coverage of primary schools among population, 2013 ..................... 86 Table 77: Distribution of primary schools among Wards and Mitaa by Division 2013 ................. 86 Table 78: Distribution of total enrollment by sex and by Division, 2013 ......................................... 87 Table 79: Standard I Enrollment in Primary Schools by Ownership 2009 -2013 ............................. 87 Table 80: Total (Std I-VII) Enrollment by Sex in Public Primary Schools 2009 -2013 ..................... 88 Table 81: Distribution of primary school pupils in the population by Division, 2013 ................... 88 Table 82: Distribution of primary school dropouts by reason and by Division, 2013 .................... 90 Table 83: Distribution of dropouts by sex by Division, 2013 ............................................................. 90 Table 84: Distribution of primary school classrooms by Division, 2013 .......................................... 91 Table 85: Distribution of primary school toilet holes by Division, 2013 .......................................... 91 Table 86: Distribution of primary schools desks by Division, 2013 .................................................. 92 Table 87: Distribution of primary school Books by Division, 2013 ................................................... 92 Table 88: Distribution of primary school water tanks by Division, 2013 ......................................... 93 Table 89: Distribution of primary school teachers by Division ......................................................... 94 Table 90: Distribution of primary school teacher’s house by Division, 2013 ................................... 94 Table 91: Availability of Primary School's Teachers (Grade A, B, Diploma and Degree) ............. 94 Table 92: Number of Pupils enrolled with their Type of impairment, 2010 and 2013 ................... 95
vii
Table 93: Distribution of the pupils per teacher ratio by Division, 2013 .......................................... 96 Table 94: Distribution of primary school desks by Division, 2013 .................................................... 96 Table 95: Distribution of teacher’s houses among teachers by Division, 2013 ................................ 97 Table 96: Distribution of classrooms among pupils by Division, 2013 ............................................ 97 Table 97: Distribution of pupils examined and selected at the end of primary education by Division, 2013 ........................................................................................................................................... 98 Table 98: Accessibility of Water in Public Primary Schools, 2010 - 2013.......................................... 98 Table 99: Availability of Electric Power in Primary Schools 2013 ..................................................... 99 Table 100: Distribution of secondary school by ownership and by Division, 2013 ........................ 99 Table 101: Distribution of total enrollment in secondary schools by sex (O level) ....................... 100 Table 102: Total Form I Enrollment in Public Secondary Schools by Sex, 2009-2013 ................... 100 Table 103: Number of Students Completed Form IV in Public Secondary Schools by Sex, 2008, 2011 and 2012 .......................................................................................................................................... 101 Table 104: Students Performance in Form IV Examinations in Public Secondary Schools by Sex, 2009-2013 ................................................................................................................................................. 101 Table 105: Total Form V Enrollment by Sex in Public Secondary Schools, 2009 - 2013 ............... 102 Table 106: Number of Students Completed "A" Level Secondary School Education by Sex, 2009 to 2013 ...................................................................................................................................................... 102 Table 107: Students Performance in Form VI Examinations in Public Secondary Schools by Sex, 2009-2013 ................................................................................................................................................. 103 Table 108: Availability of Public Secondary School's Teachers by Division .................................. 104 Table 109: Availability of Public Secondary School's Teachers by Qualifications by Division, 2013 .......................................................................................................................................................... 105 Table 110: Number of Science and Arts Teachers in Public Secondary Schools by Division, 2013 .................................................................................................................................................................. 105 Table 111: Availability of Teachers Houses in Public Secondary Schools by Divisions, 2013 .... 106 Table 112: Availability of Classrooms in Public Secondary Schools by Division, 2013 ............... 106 Table 113: Availability of Pit Latrine in Public Secondary Schools by Division, 2013 ................. 107 Table 114:: Availability of Dormitories/Hostels in Public Secondary Schools by Division ........ 107 Table 115: Availability of Libraries in Public Secondary Schools by Divisions, 2013 .................. 108 Table 116: Availability of Desks in Public Secondary Schools by Division, 2013 ......................... 108 Table 117: Availability of Laboratories in Public Secondary Schools by Division, 2013 ............. 109 Table 118: Accessibility of Water in Public Secondary Schools by Division, 2010 and 2013 ....... 109 Table 119: Vocational Training Enrollment (2001-2006) ................................................................... 110 Table 120: Number of Adult Education Centers and Enrollments, 2010 and 2013 ...................... 112 Table 121: Major sources of Water Supply in Ilala Municipality, 2013 .......................................... 113 Table 122: Status of Water Sources ...................................................................................................... 113 Table 123: Type of Technology Used in Water Scheme .................................................................... 114 Table 124: Estimated amount of solid waste generated per ward, 2013 ........................................ 117 Table 125: Distributions of Day Care Centres by Division, 2010 and 2013 .................................... 120 Table 126: Distributions of Orphans by Division, 2013 .................................................................... 121 Table 127: Number of Women Economic Groups by Division, 2010-2013…….. .......................... 122 Table 128: Distribution of Cooperatives in Ilala Municipality, 2013 .............................................. 123 Table 129: Distribution of SACCOS and their membership by division……….. .......................... 124 Table 130: Financial Institutions in Ilala Municipality, 2013 ............................................................ 124 Table 131: List of NGOs Bilateral and Multilateral agencies and projects they have supported in Ilala Municipal Council for the last three years. ................................................................................ 125
viii
Table 132: NGOs/CBOs dealing with Environmental conservation in Ilala Municipality, 2013 127 Table 133: Total number of Crimes reported in Police Stations and Number of people Jailed from January to December 2013 ........................................................................................................... 129 Table 134: Total number of Accidents Reported in the Police Station and Number of People Injured/Died from January to December, 2013 ................................................................................. 129 Table 135: Total number of Theft Cases Reported in the Police Station and Number of People Jailed from January to December 2013 ................................................................................................ 129

ix
LIST OF FIGURES
Figure 1: Distribution of land area and water area by Division, Ilala Municipality, 2013 ............ 22
Figure 2: Distribution of Administrative Units by Division ............................................................... 24
x
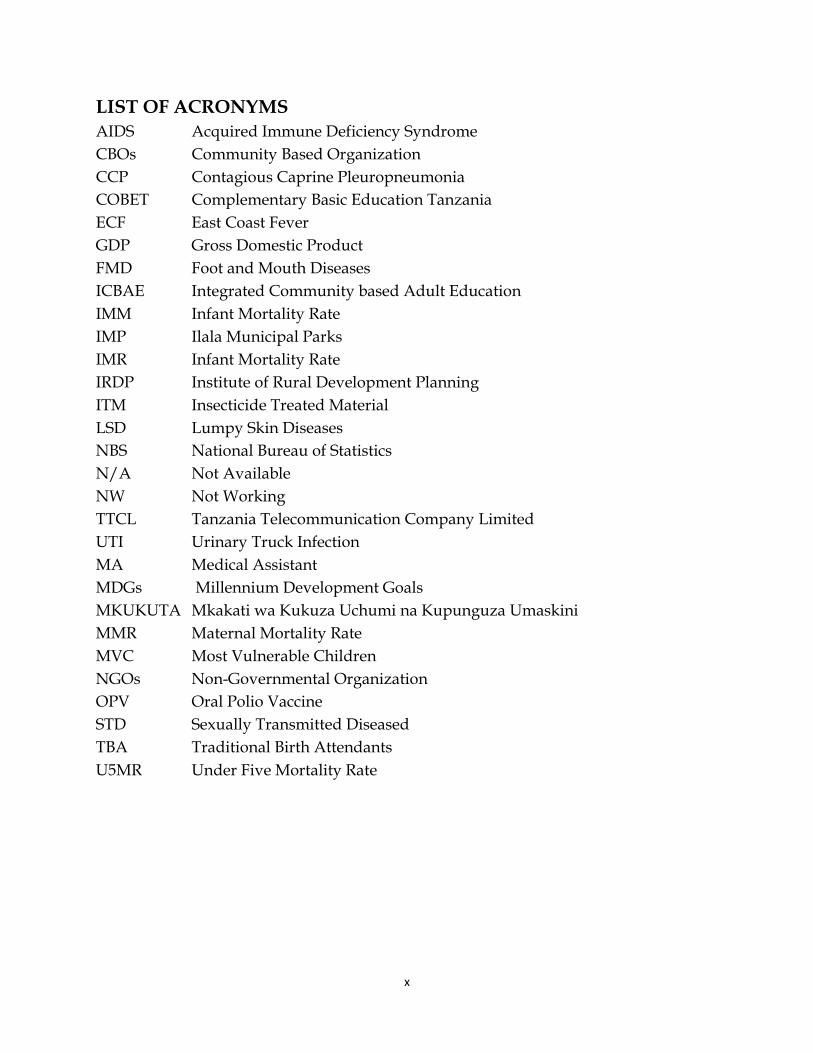
LIST OF ACRONYMS
AIDS Acquired Immune Deficiency Syndrome
CBOs Community Based Organization
CCP Contagious Caprine Pleuropneumonia
COBET Complementary Basic Education Tanzania
ECF East Coast Fever
GDP Gross Domestic Product
FMD Foot and Mouth Diseases
ICBAE Integrated Community based Adult Education
IMM Infant Mortality Rate
IMP Ilala Municipal Parks
IMR Infant Mortality Rate
IRDP Institute of Rural Development Planning
ITM Insecticide Treated Material
LSD Lumpy Skin Diseases
NBS National Bureau of Statistics
N/A Not Available
NW Not Working
TTCL Tanzania Telecommunication Company Limited
UTI Urinary Truck Infection
MA Medical Assistant
MDGs Millennium Development Goals
MKUKUTA Mkakati wa Kukuza Uchumi na Kupunguza Umaskini
MMR Maternal Mortality Rate
MVC Most Vulnerable Children
NGOs Non-Governmental Organization
OPV Oral Polio Vaccine
STD Sexually Transmitted Diseased
TBA Traditional Birth Attendants
U5MR Under Five Mortality Rate
xi
FOREWORD
Availability of accurate and adequate data is an essential aspect in the development
planning process. It is unquestionable that development plans that are based on
unreliable and inadequate data, are likely to be poorly implemented and unsustainable.
Therefore, efforts to gather accurate and reliable data is inevitable if development plans
aimed at improving the livelihoods of communities have to be attained. Reliable data is
also important when considering the implementation of the Tanzania’s Development
Vision 2025 with the NSGRPII (MKUKUTA II) and the Millennium Development Goals
(MDGs) as its implementation vehicles.
The increase in population for Dar es Salaam City and in particular Ilala Municipality
has increased pressure on provision of social and economic services to her people.
Social and economic services are still deteriorating and are becoming unsustainable.
Absence of accurate and reliable data has also hampered efforts of Ilala Municipal
Council to provide timely and quality services to all stakeholders.
After realizing the aforesaid problems, Ilala Municipal Council embarked on improving
its Socio-Economic Profile as an attempt to assess the situation and find a solution to
this data and information gap.
This document covers a wide range of data and information on the geography,
population, socio-economic parameters, social services, economic infrastructure and the
productive sectors. It also provides information on the potential investment areas in the
region. Such data and information will enable policy and decision makers to take
informed decisions. Furthermore, the information will be used by planners, researchers,
development partners and functional managers in planning, implementation,
monitoring and evaluation of development activities.
xii
Ilala Municipal Council Socio-Economic Profile contains detailed data and information
on the Municipal Council. It is expected that such data will prove to be valuable and
informative to our clients. However, constructive views and criticisms are still invited
from the readers to enable this profile to become a better tool in the planning and
implementation of development activities in the Municipality.
Lastly but not least, I wish to thank the staff of Ilala Municipal Council and the Institute
of Rural Development Planning Dodoma, for their devotion in ensuring the successful
compilation of this document.
Jerry Silaa
HON. MAYOR
ILALA MUNICIPAL COUNCIL
13
ILALA MUNICIPAL COUNCIL- UNIQUE FEATURES
There are many unique features in Ilala Municipality due to its history, coupled with Dar
es Salaam being the original capital city of the country and Ilala as the major commercial
centre in Tanzania. The Municipality has many features that may be of interest to
historians and tourists together with investors. They range from man-made features like
buildings and other infrastructures, to natural sites some of which have been cited
below;
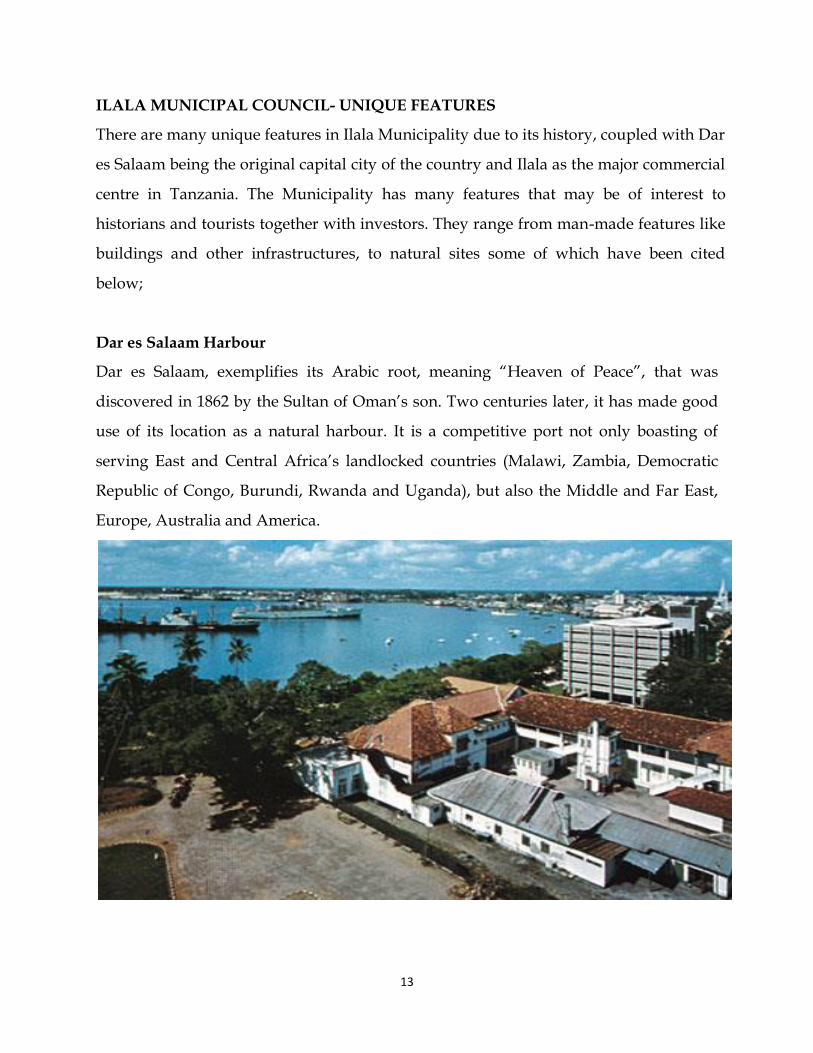
Dar es Salaam Harbour
Dar es Salaam, exemplifies its Arabic root, meaning “Heaven of Peace”, that was
discovered in 1862 by the Sultan of Oman’s son. Two centuries later, it has made good
use of its location as a natural harbour. It is a competitive port not only boasting of
serving East and Central Africa’s landlocked countries (Malawi, Zambia, Democratic
Republic of Congo, Burundi, Rwanda and Uganda), but also the Middle and Far East,
Europe, Australia and America.
14
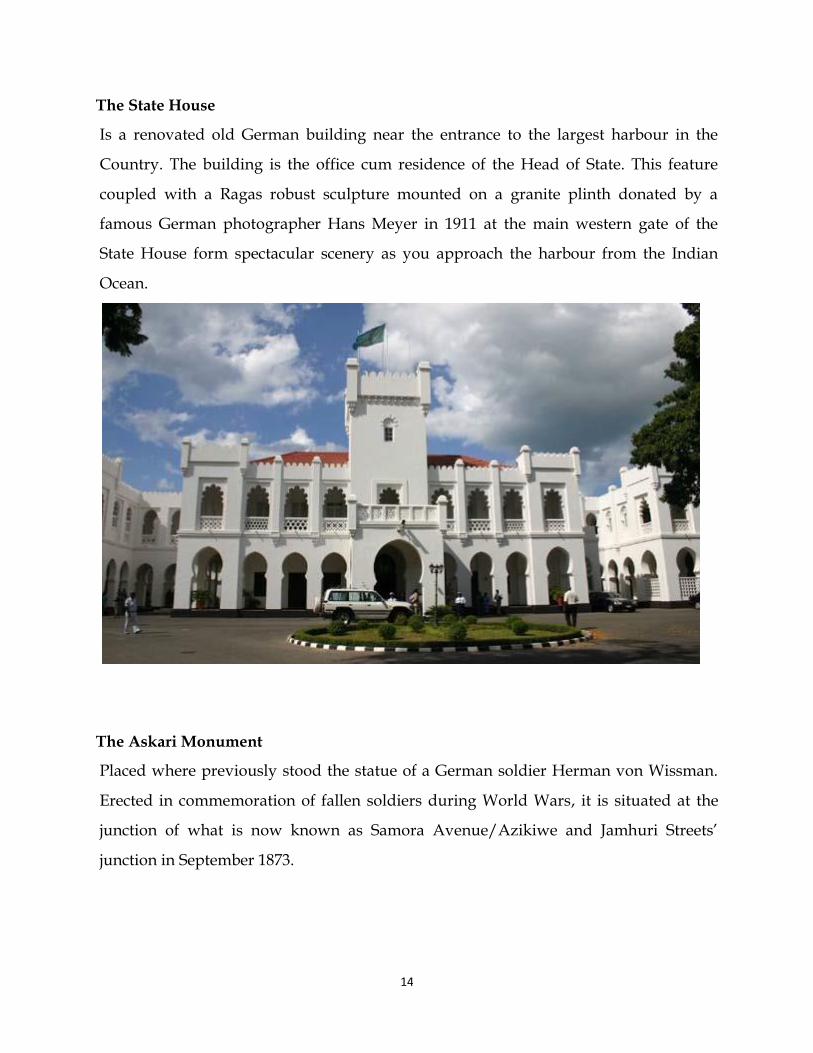
The State House
Is a renovated old German building near the entrance to the largest harbour in the
Country. The building is the office cum residence of the Head of State. This feature
coupled with a Ragas robust sculpture mounted on a granite plinth donated by a
famous German photographer Hans Meyer in 1911 at the main western gate of the
State House form spectacular scenery as you approach the harbour from the Indian
Ocean.
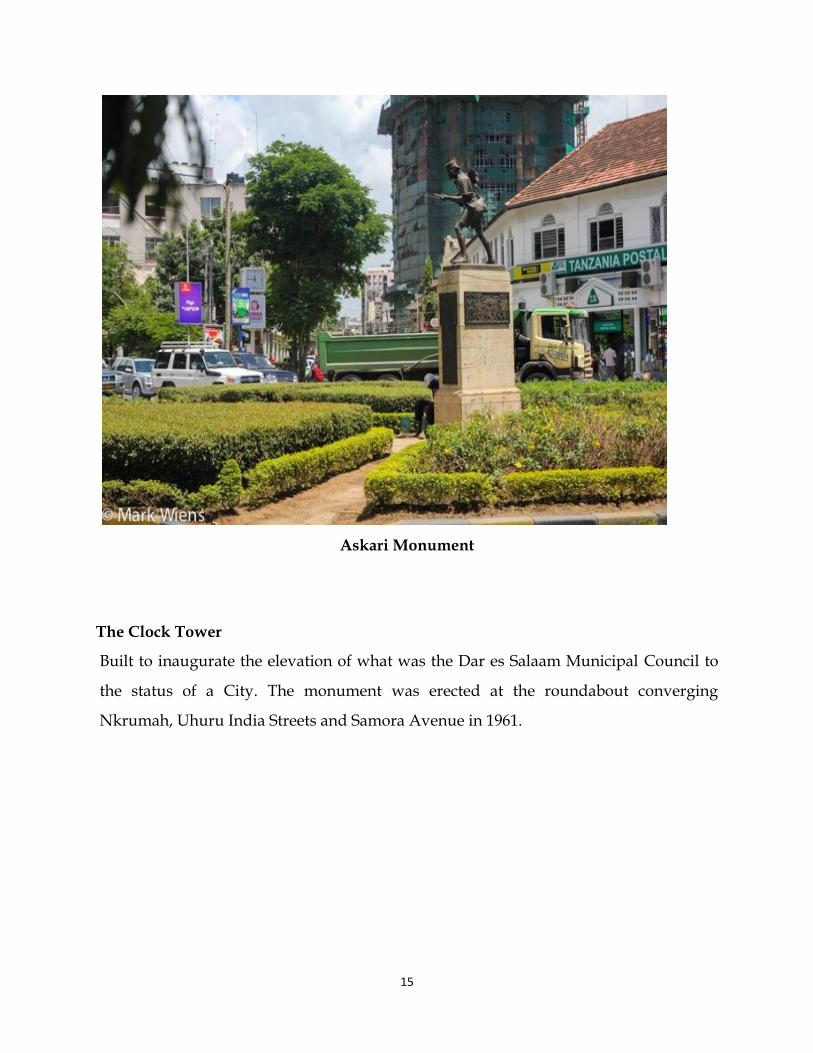
The Askari Monument
Placed where previously stood the statue of a German soldier Herman von Wissman.
Erected in commemoration of fallen soldiers during World Wars, it is situated at the
junction of what is now known as Samora Avenue/Azikiwe and Jamhuri Streets’
junction in September 1873.
15
Askari Monument
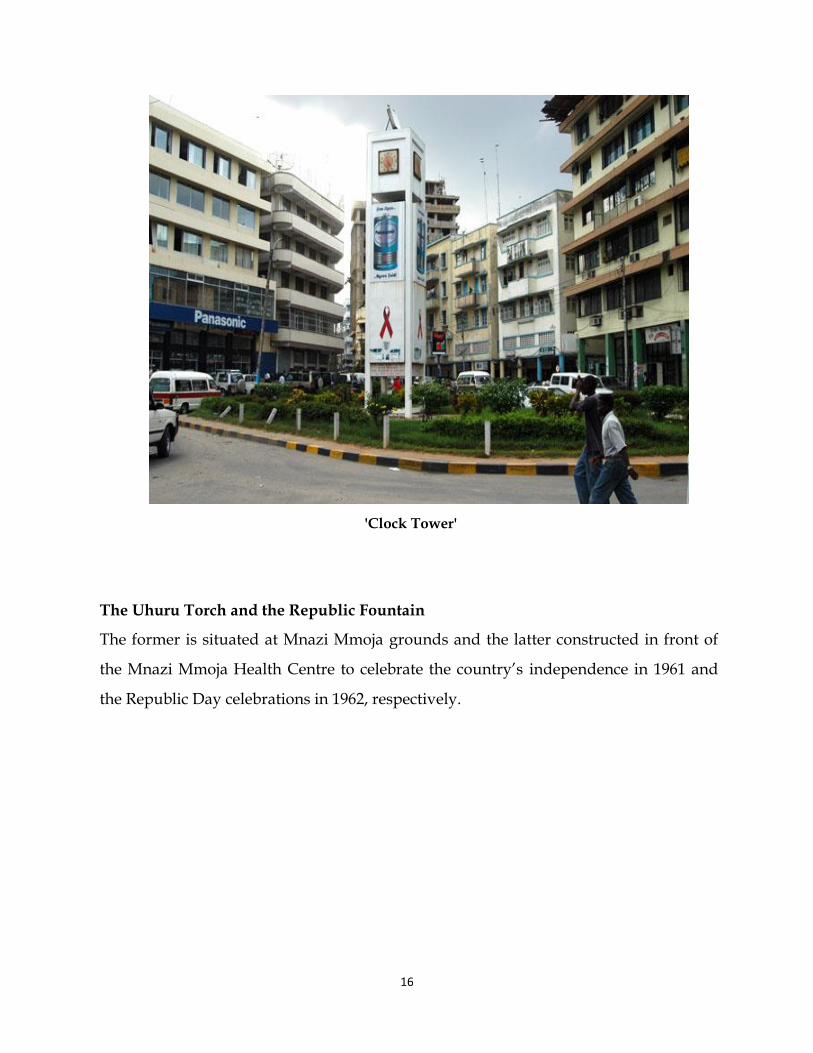
The Clock Tower
Built to inaugurate the elevation of what was the Dar es Salaam Municipal Council to
the status of a City. The monument was erected at the roundabout converging
Nkrumah, Uhuru India Streets and Samora Avenue in 1961.
16
'Clock Tower'
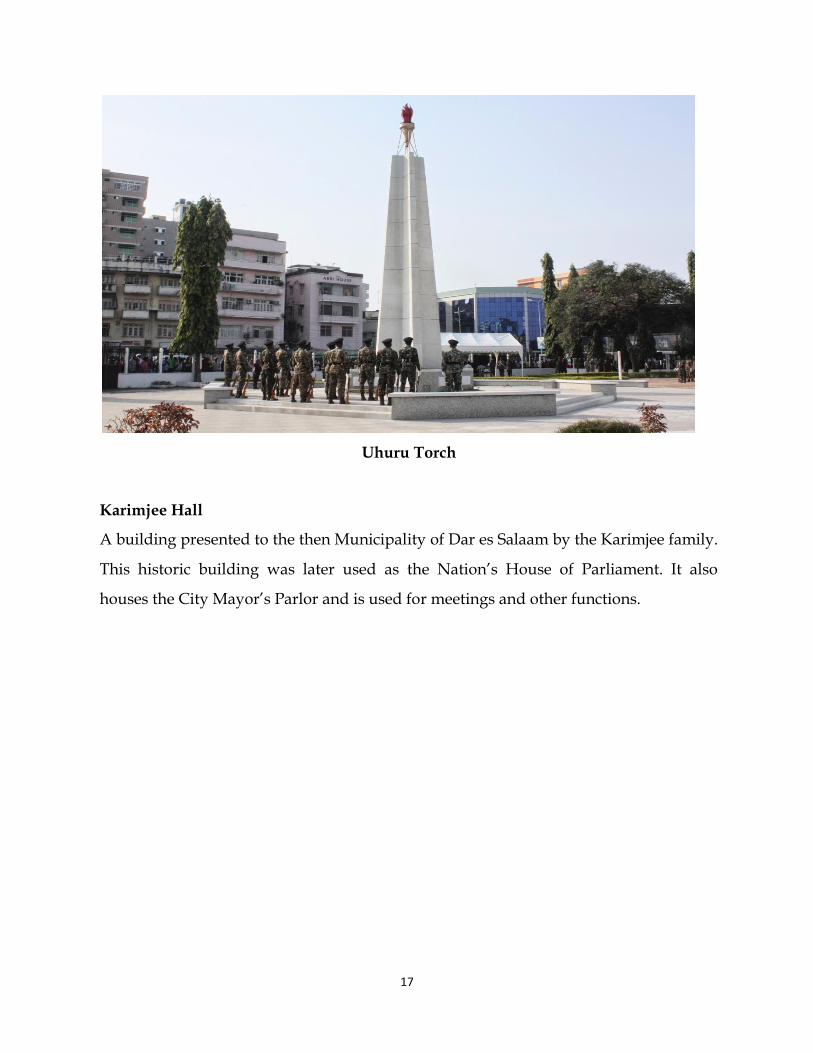
The Uhuru Torch and the Republic Fountain
The former is situated at Mnazi Mmoja grounds and the latter constructed in front of
the Mnazi Mmoja Health Centre to celebrate the country’s independence in 1961 and
the Republic Day celebrations in 1962, respectively.
17
Uhuru Torch
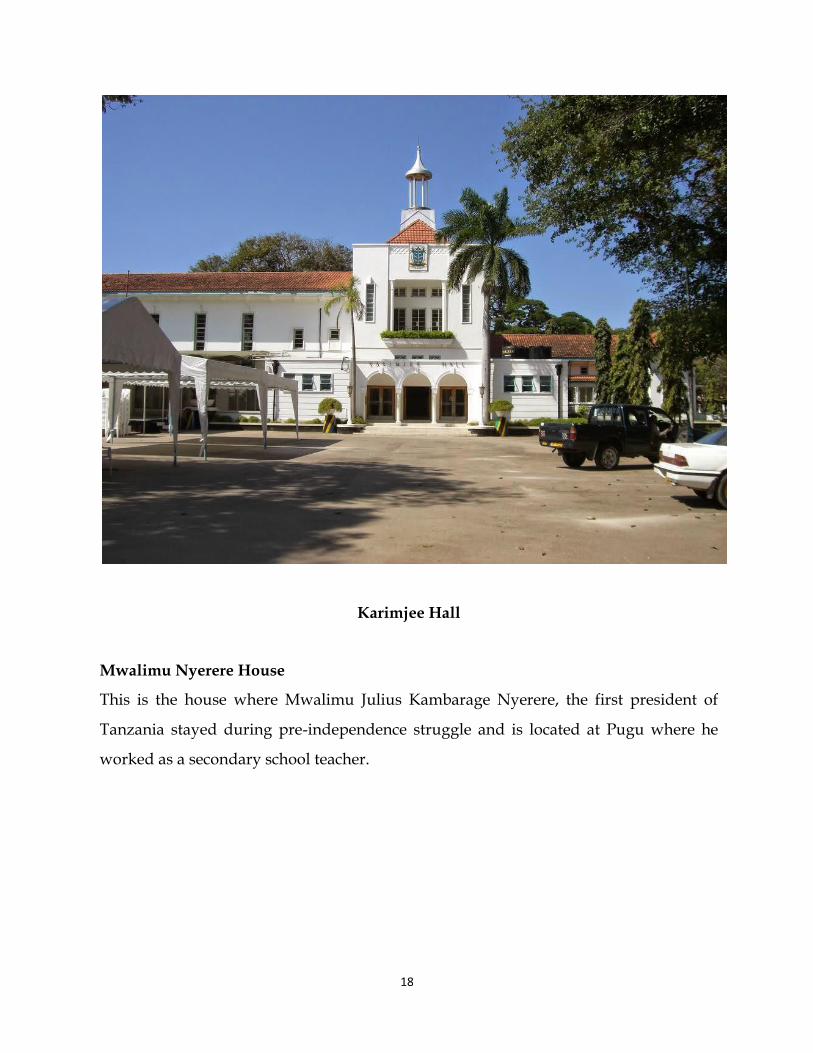
Karimjee Hall
A building presented to the then Municipality of Dar es Salaam by the Karimjee family.
This historic building was later used as the Nation’s House of Parliament. It also
houses the City Mayor’s Parlor and is used for meetings and other functions.
18
Karimjee Hall
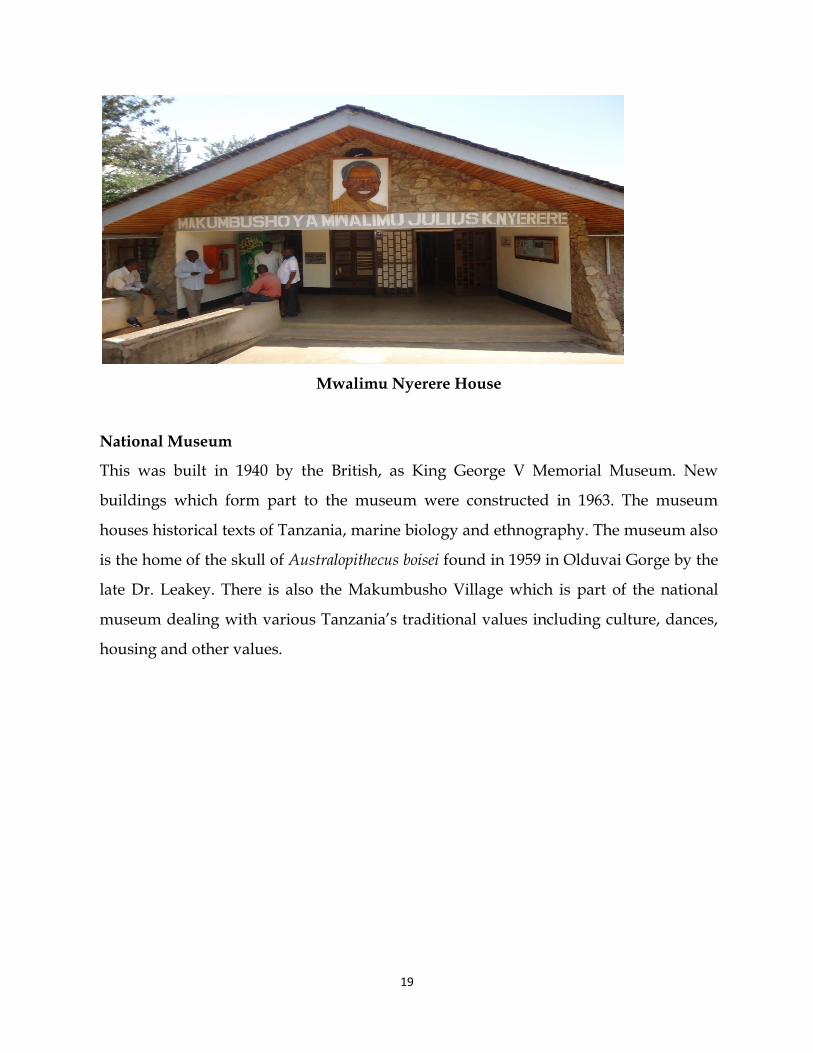
Mwalimu Nyerere House
This is the house where Mwalimu Julius Kambarage Nyerere, the first president of
Tanzania stayed during pre-independence struggle and is located at Pugu where he
worked as a secondary school teacher.
19
Mwalimu Nyerere House
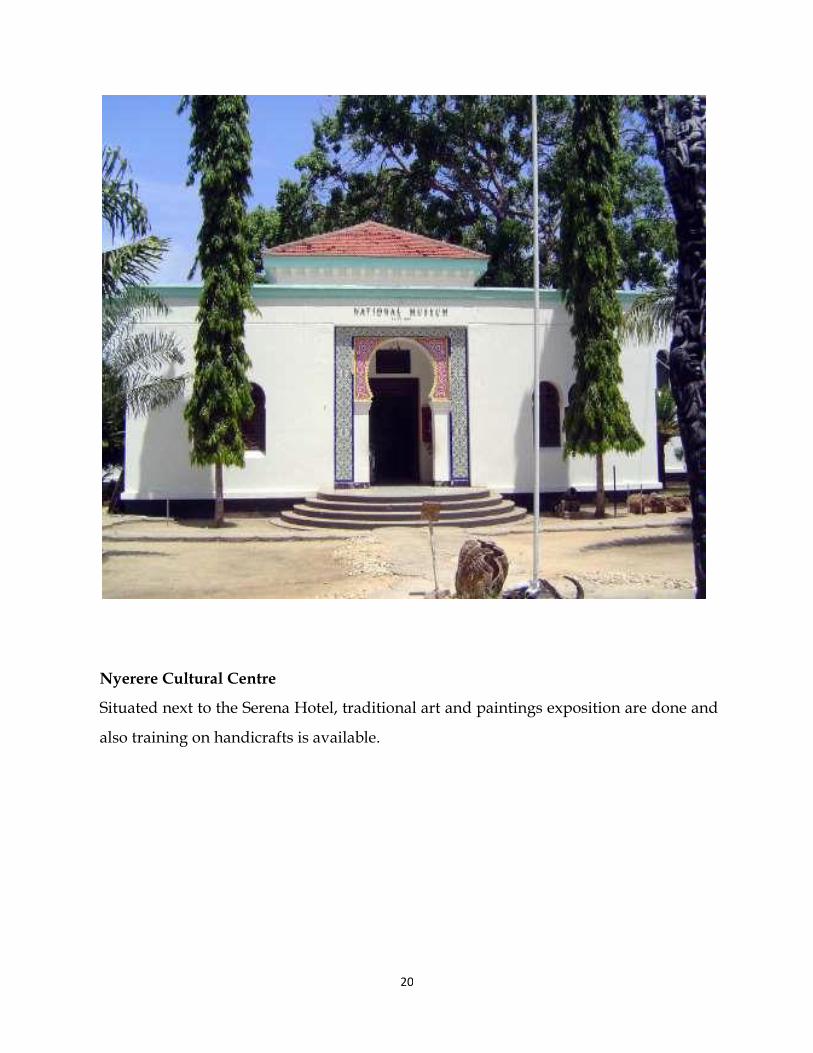
National Museum
This was built in 1940 by the British, as King George V Memorial Museum. New
buildings which form part to the museum were constructed in 1963. The museum
houses historical texts of Tanzania, marine biology and ethnography. The museum also
is the home of the skull of Australopithecus boisei found in 1959 in Olduvai Gorge by the
late Dr. Leakey. There is also the Makumbusho Village which is part of the national
museum dealing with various Tanzania’s traditional values including culture, dances,
housing and other values.
20
Nyerere Cultural Centre
Situated next to the Serena Hotel, traditional art and paintings exposition are done and
also training on handicrafts is available.
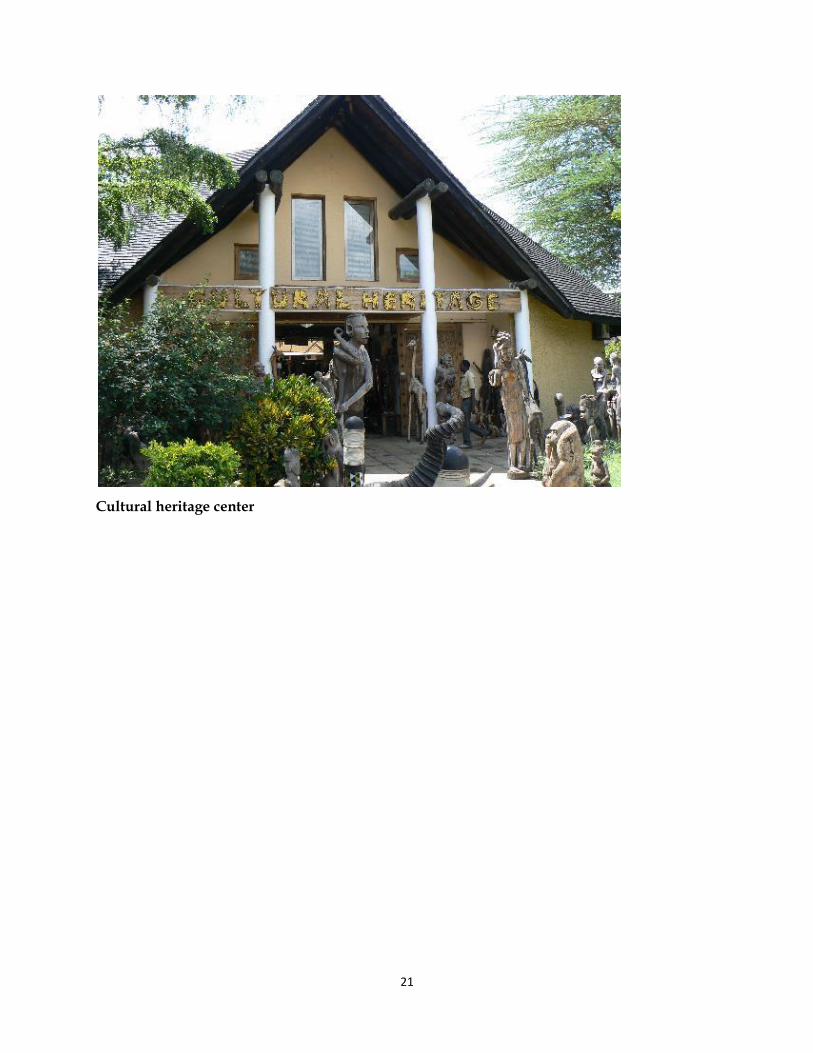
21
Cultural heritage center
22
SECTION I
LAND, PEOPLE AND CLIMATE
1.1 Geographical Location
Ilala Municipality bears the status of an Administrative district that lies between
longitude 39o and 40o east and between latitude 60 and 70 south of the Equator. As a
part of Dar es Salaam City, it is located in the extreme eastern corner of the Region,
bordering the Indian Ocean for a distance of about 10 kilometers to the east. On the
southern part it is bordered by Temeke Municipality, whereas on its western part it is
bordered by Kisarawe district and on its Northern part it is bordered by Kinondoni
Municipality.
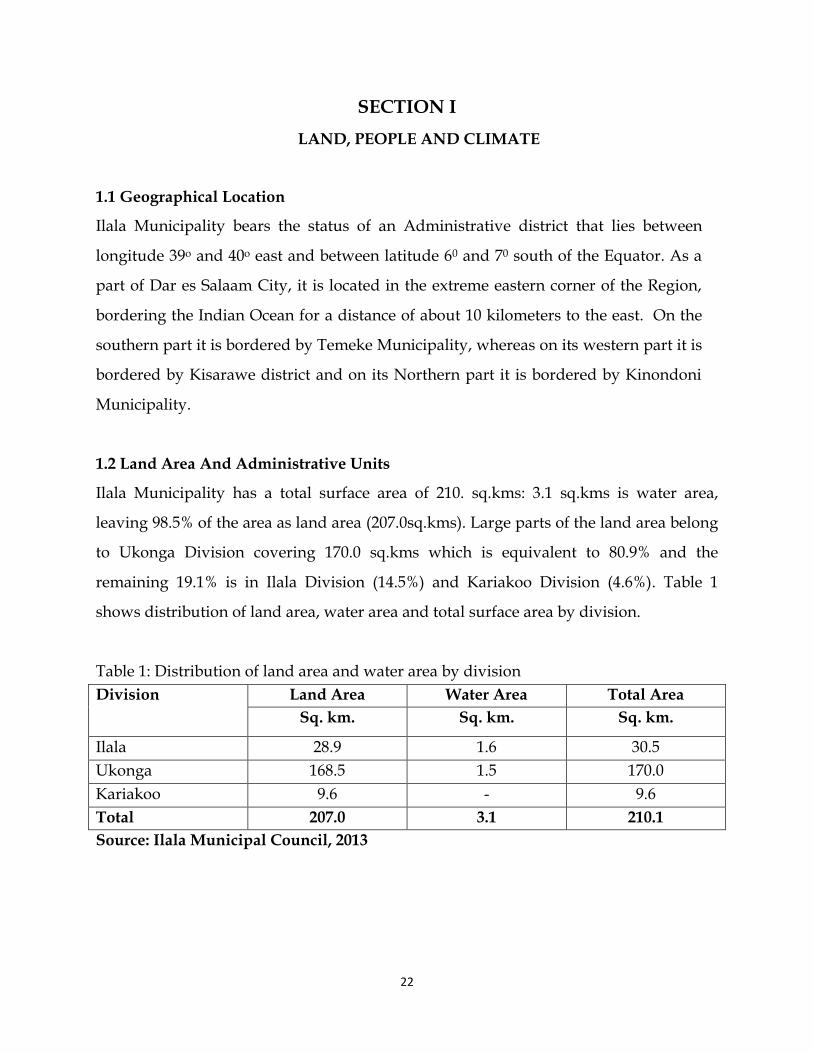
1.2 Land Area And Administrative Units
Ilala Municipality has a total surface area of 210. sq.kms: 3.1 sq.kms is water area,
leaving 98.5% of the area as land area (207.0sq.kms). Large parts of the land area belong
to Ukonga Division covering 170.0 sq.kms which is equivalent to 80.9% and the
remaining 19.1% is in Ilala Division (14.5%) and Kariakoo Division (4.6%). Table 1
shows distribution of land area, water area and total surface area by division.
Table 1: Distribution of land area and water area by division
Division Land Area Water Area Total Area
Sq. km. Sq. km. Sq. km.
Ilala 28.9 1.6 30.5
Ukonga 168.5 1.5 170.0
Kariakoo 9.6 - 9.6
Total 207.0 3.1 210.1
Source: Ilala Municipal Council, 2013
23
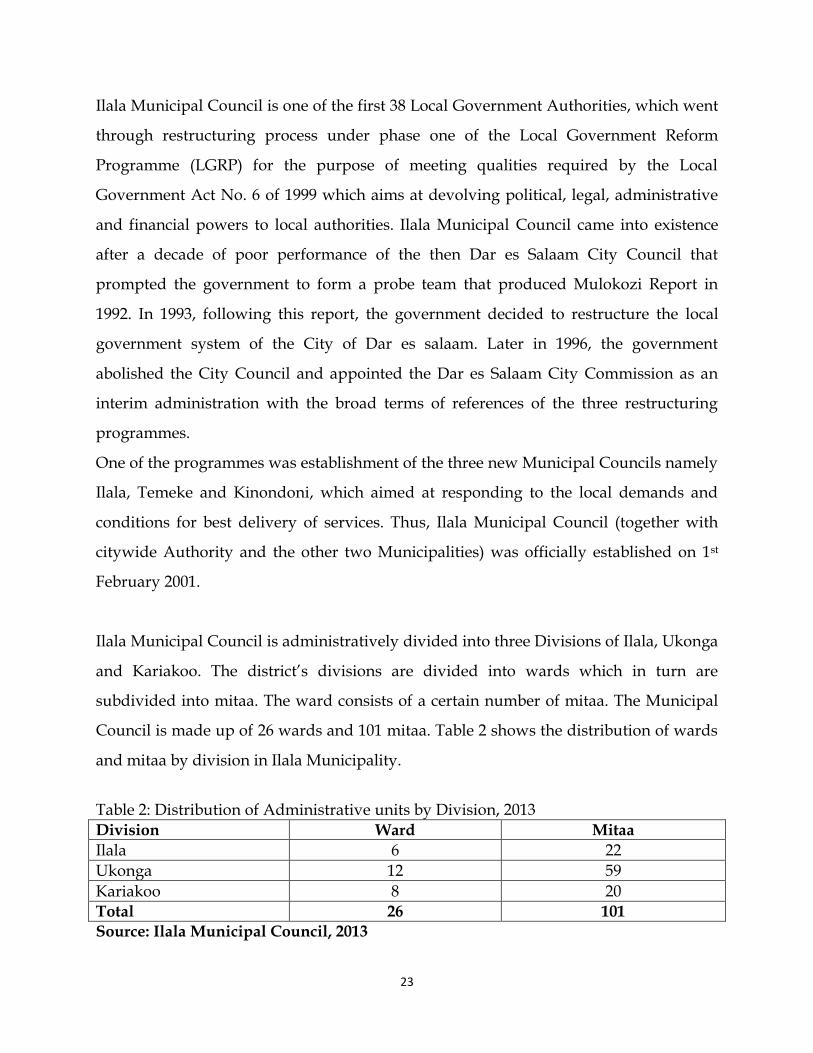
Ilala Municipal Council is one of the first 38 Local Government Authorities, which went
through restructuring process under phase one of the Local Government Reform
Programme (LGRP) for the purpose of meeting qualities required by the Local
Government Act No. 6 of 1999 which aims at devolving political, legal, administrative
and financial powers to local authorities. Ilala Municipal Council came into existence
after a decade of poor performance of the then Dar es Salaam City Council that
prompted the government to form a probe team that produced Mulokozi Report in
1992. In 1993, following this report, the government decided to restructure the local
government system of the City of Dar es salaam. Later in 1996, the government
abolished the City Council and appointed the Dar es Salaam City Commission as an
interim administration with the broad terms of references of the three restructuring
programmes.
One of the programmes was establishment of the three new Municipal Councils namely
Ilala, Temeke and Kinondoni, which aimed at responding to the local demands and
conditions for best delivery of services. Thus, Ilala Municipal Council (together with
citywide Authority and the other two Municipalities) was officially established on 1st
February 2001.
Ilala Municipal Council is administratively divided into three Divisions of Ilala, Ukonga
and Kariakoo. The district’s divisions are divided into wards which in turn are
subdivided into mitaa. The ward consists of a certain number of mitaa. The Municipal
Council is made up of 26 wards and 101 mitaa. Table 2 shows the distribution of wards
and mitaa by division in Ilala Municipality.
Table 2: Distribution of Administrative units by Division, 2013
Division Ward Mitaa
Ilala 6 22
Ukonga 12 59
Kariakoo 8 20 Total 26 101
Source: Ilala Municipal Council, 2013

24
Figure 2 below shows the percentage distribution of wards in Ilala Municipality for the
2013 with Ukonga division comprising of 46% of all wards in the Municipality.
Figure 1: Distribution of administrative units by division
Table 3 below shows the population distribution among the wards of Ilala Municipality
in 2012. The Municipality had a total population of 1,220,611 people of which 595,928
were males and 624,683 were females with sex ratio of 95. Ward wise, Vingunguti ward
had the highest population of 106,946 people and Kivukoni ward had the lowest
population of 6,742 people. The population of females relative to males continues to be
higher in almost all wards with exception of few wards like Mchikichini, Kariakoo,
Jangwani, Gerezani, Mchafukoge, Kivukoni and Upanga Magharibi (Table 3). The
number of households was 300,674 and the average household size in the Municipality
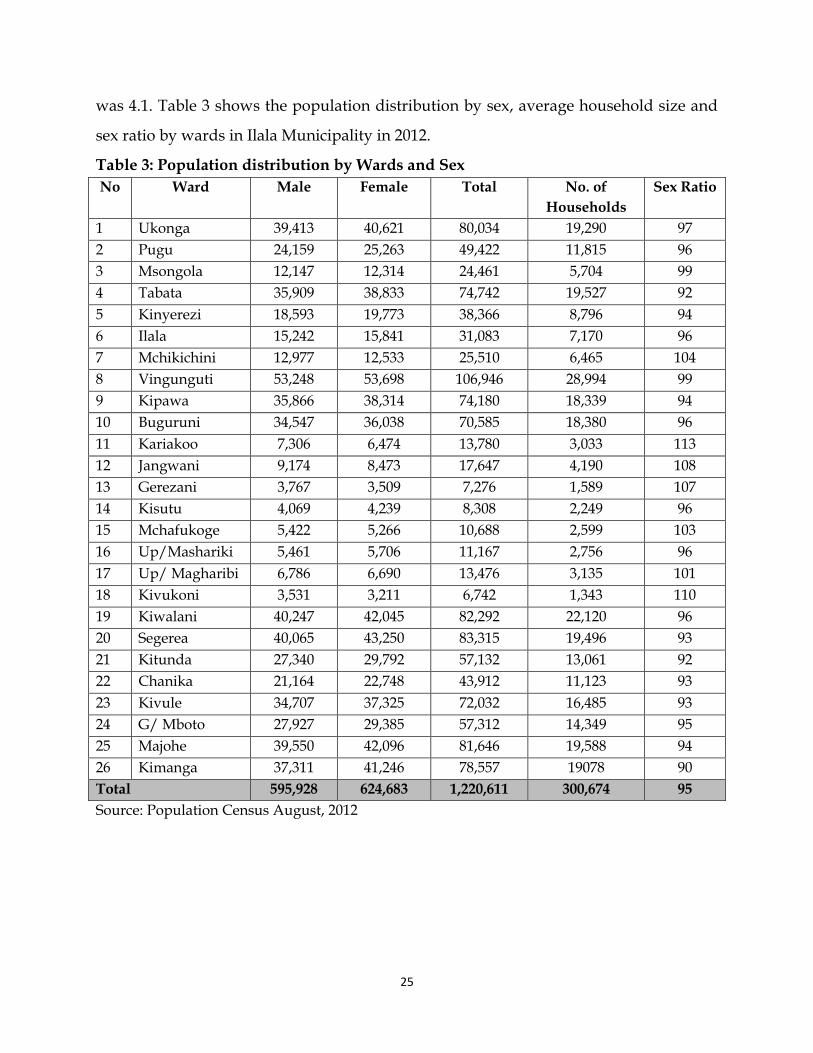
25
was 4.1. Table 3 shows the population distribution by sex, average household size and
sex ratio by wards in Ilala Municipality in 2012.
Table 3: Population distribution by Wards and Sex
No Ward Male Female Total No. of
Households
Sex Ratio
1 Ukonga 39,413 40,621 80,034 19,290 97
2 Pugu 24,159 25,263 49,422 11,815 96
3 Msongola 12,147 12,314 24,461 5,704 99
4 Tabata 35,909 38,833 74,742 19,527 92
5 Kinyerezi 18,593 19,773 38,366 8,796 94
6 Ilala 15,242 15,841 31,083 7,170 96
7 Mchikichini 12,977 12,533 25,510 6,465 104
8 Vingunguti 53,248 53,698 106,946 28,994 99
9 Kipawa 35,866 38,314 74,180 18,339 94
10 Buguruni 34,547 36,038 70,585 18,380 96
11 Kariakoo 7,306 6,474 13,780 3,033 113
12 Jangwani 9,174 8,473 17,647 4,190 108
13 Gerezani 3,767 3,509 7,276 1,589 107
14 Kisutu 4,069 4,239 8,308 2,249 96
15 Mchafukoge 5,422 5,266 10,688 2,599 103
16 Up/Mashariki 5,461 5,706 11,167 2,756 96
17 Up/ Magharibi 6,786 6,690 13,476 3,135 101
18 Kivukoni 3,531 3,211 6,742 1,343 110
19 Kiwalani 40,247 42,045 82,292 22,120 96
20 Segerea 40,065 43,250 83,315 19,496 93
21 Kitunda 27,340 29,792 57,132 13,061 92
22 Chanika 21,164 22,748 43,912 11,123 93
23 Kivule 34,707 37,325 72,032 16,485 93
24 G/ Mboto 27,927 29,385 57,312 14,349 95
25 Majohe 39,550 42,096 81,646 19,588 94
26 Kimanga 37,311 41,246 78,557 19078 90
Total 595,928 624,683 1,220,611 300,674 95
Source: Population Census August, 2012

26
1.3 Ethnicity
The main native ethnic groups in Ilala Municipality are the Zaramo and Ndengereko,
However, due to urbanization; many people of different ethnic backgrounds have
immigrated into the Municipality making it heterogonous in terms of tribal
composition. There is no single ethnic group that accounts for more than 25% of the
total population. Ilala is the most affected area in the City due to its strategic location as
the hub for social-economic activities and other interactions. The rapid economic
growth of the Dar es Salaam City also attracts the influx of people from different
corners of the country and outside the country.
1.4 Key Population Characteristics
1.4.1 Introduction
The first countrywide census was carried out in 1948, followed by those of 1957, 1967,
1978, 1988, 2002 and that of 2012. However, for Ilala Municipality the only available
data were for the censuses of 2002 and 2012. These censuses documented the age
groups, occupation, migration, education, water, health, sanitation and electricity. From
the two censuses the following general trends have been deduced. The population of
females continued to be larger than that of males while illiteracy continued to be higher
among females than males. Generally literacy is increasing among both sexes. Shop
salesmen, small-scale traders and Labourers continued to be the dominant economic
activities of the people. Infant mortality rate (IMR), under five mortality rate (U5MR)
and Maternal Mortality Rate (MMR) continued to decline.
1.4.2 Population size, growth and density
Ilala Municipal Council population growth rates increased from 4.6% in 2002 to 5.6% in
2012. This could be attributed to improved health services in the Municipality and
standard of living. Migration into the Municipality is an additional factor contributing
to the faster growth rate. Table 4 shows population growth from 2002 to 2012
27
Table 4: Ilala Municipal Council Population Development 2002 to 2012
Population
Census year
Total Municipal
Population
% Average annual
growth rate
% Population
increase over last
census
2002 634,924 4.6 -
2012 1,220,611 5.6 92.2
Source: Population and Housing Censuses, 2002 and 2012
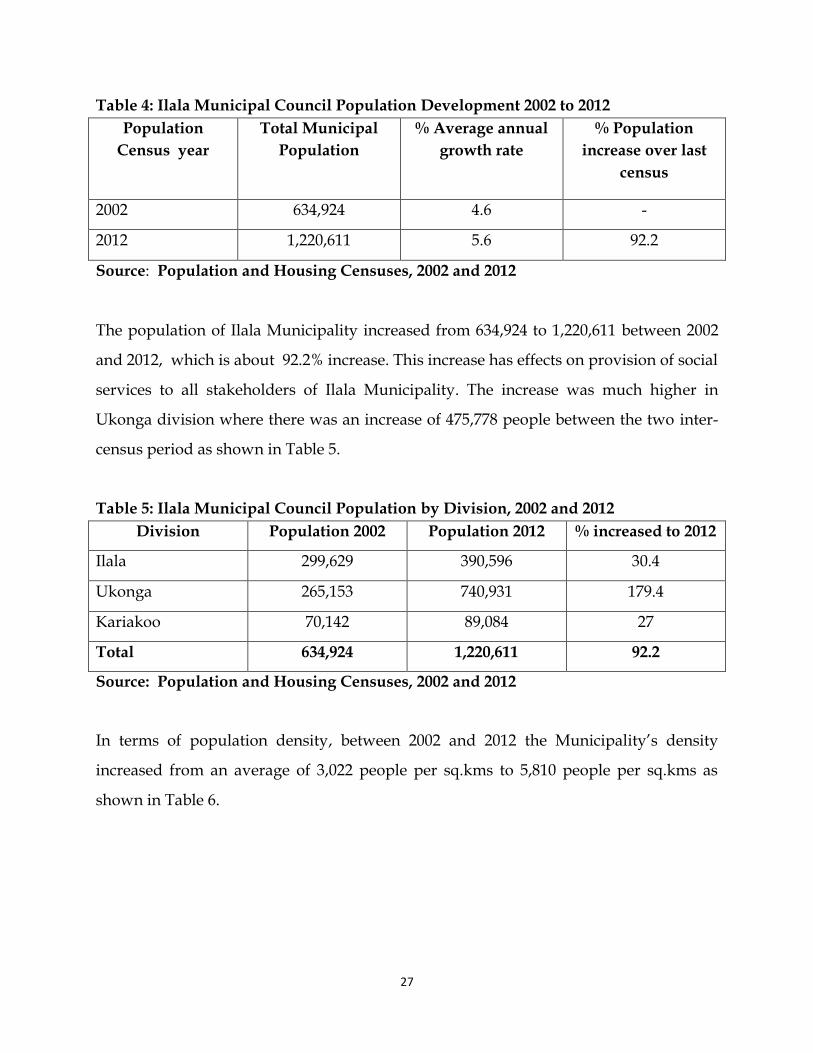
The population of Ilala Municipality increased from 634,924 to 1,220,611 between 2002
and 2012, which is about 92.2% increase. This increase has effects on provision of social
services to all stakeholders of Ilala Municipality. The increase was much higher in
Ukonga division where there was an increase of 475,778 people between the two inter-
census period as shown in Table 5.
Table 5: Ilala Municipal Council Population by Division, 2002 and 2012
Division Population 2002 Population 2012 % increased to 2012
Ilala 299,629 390,596 30.4
Ukonga 265,153 740,931 179.4
Kariakoo 70,142 89,084 27
Total 634,924 1,220,611 92.2
Source: Population and Housing Censuses, 2002 and 2012
In terms of population density, between 2002 and 2012 the Municipality’s density
increased from an average of 3,022 people per sq.kms to 5,810 people per sq.kms as
shown in Table 6.

28
Table 6: Distribution of Population Density by Division, 2002 to 2012
Division Land Area
sq.kms
Average Population per sq.km % increase in
density 2002 to
2012 2002 2012
Ilala 30.5 9,824 12,806 30.4
Ukonga 170.0 1,560 4,358 179.4
Kariakoo 9.6 7,306 9,280 27.0
Total 210.1 3,022 5,810 92.2
Source: Ilala Municipal Council, 2013
1.4.3 Households and households size
According to the 2012 Population and Housing Census, Ilala Municipality had a total of
300,674 households spread into 26 wards with Vingunguti ward recording the highest
number of households (28,994 households). Kivukoni ward had the lowest number of
households (1,343 households) as shown in Table 3. This is partly due to the fact that
most of the buildings in this area are Government Offices with very few buildings for
residential purposes.
Based on the 2012 Population and Housing Census, the sex ratio for Ilala Municipality
was at 95 indicating that there were more females than males in the Municipality.
Kariakoo ward had the highest sex ratio at 113 and Kimanga ward had the lowest sex
ratio of 90 (Table 3).
1.4.4 Migration
It is well known that natural increase in any locality is not the only factor which affects
population size and growth density. Deaths also affect population growth and density
negatively while migration can affect population positively or negatively. Ilala
Municipality is facing a problem of migration whereby the majority of Dar es Salaam
29
citizens spend their day time in Ilala Municipality, but are residents of other
Municipalities. Ilala Municipality seems to have small population compared to other
councils and this is due to the census approach used, which counts people based on
where they spent the night preceding census day. In part, this approach could be
underestimating the actual population of the Municipality.
It is estimated that the Dar es Salaam population is 5 million during the day. As a result,
Ilala always faces problems of inadequacy social services like water, health and
infrastructures. The Municipality also suffers from environmental pollution because the
increase in population is not accompanied by expansion of social services to meet the
increased demand for social services.
1.5 Climate And Soils
The municipality has humid temperatures that vary from 260C in August to 350C in
December and January. The long rains season (March – May) receives an average
monthly rainfall of 150mm – 300mm. The short rains season is between October and
December with monthly average rainfall ranging from 75mm – 100mm. Ilala
Municipality’s altitude that ranges between 0 and 900 meters above sea level influences
the ecological characteristics of the Municipality. Thus, the Municipality consists of a
large lowland area and a small part forming the upland zone. The lowland areas start
where the Municipality borders with the Indian Ocean (Kivukoni ward) and extends to
Segerea, Ukonga and Kitunda wards. Beyond these wards, the small upland areas
emerge as small hills or plateaus of Pugu, Kinyerezi, Chanika and Msongola wards.
Whereas most of the lowland areas constitute the urban part of the Municipality, the
upland areas are predominantly agricultural and peri-urban in character. The soil type
in these areas consists of sand, clay and loam properties.
30
SECTION II
MUNICIPAL ECONOMY
2.1 Introduction
The main economic activities taking place in Ilala Municipal Council are retailing
businesses including small and medium shops, hotels, bars and restaurants,
transportation services, clearing and forwarding, agro businesses, medical businesses,
handcraft businesses, banking businesses and construction business. These activities
employ about 45% of the total population of Ilala Municipality. They play a significant
role to the Municipal’s economy in terms of revenue and in provision of job
opportunities to the residents.
Agriculture and livestock sector is another important economic activity in Ilala
Municipality whereby 13% of the population is employed in the sector. The livestock
kept in the Municipality are cattle, goats, sheep, donkeys, pigs and chicken. Fishing in
Indian Ocean also provides employment to a sizeable proportion of the people in the
Municipality..
Ilala Municipal Council has a number of developed industries. The most significant
industries include medium industries which process food, beverage and textiles. Others
include small scale industries which dominates wide range of food and textiles. The
small scale industries comprises hulling and milling and fruit processing machines
which add value to agricultural primary products.
2.2 Regional GDP
Dar es Salaam Region has economic potentials in industrial production and business
transactions, which are mainly centred in Ilala Municipality. According to Dar Es
Salaam Regional Profile of 2007, the Region contributed about 17 percent of the country
31
Gross Domestic Product (GDP) annually. Furthermore, the Poverty and Human
Development Report (PHDR, 2005), indicated that about 20 percent of Dar es Salaam
residents were living below poverty line.
2.3 Per Capita GDP
The average per capita annual income in Dar es Salaam Region for 2002 was Tshs
708,047.00and increased to Tshs. 1,734,842.00 in 2012 ( NBS 2012)
2.4 Productive Sectors
2.4.1 Agriculture
2.4.1.1 Introduction
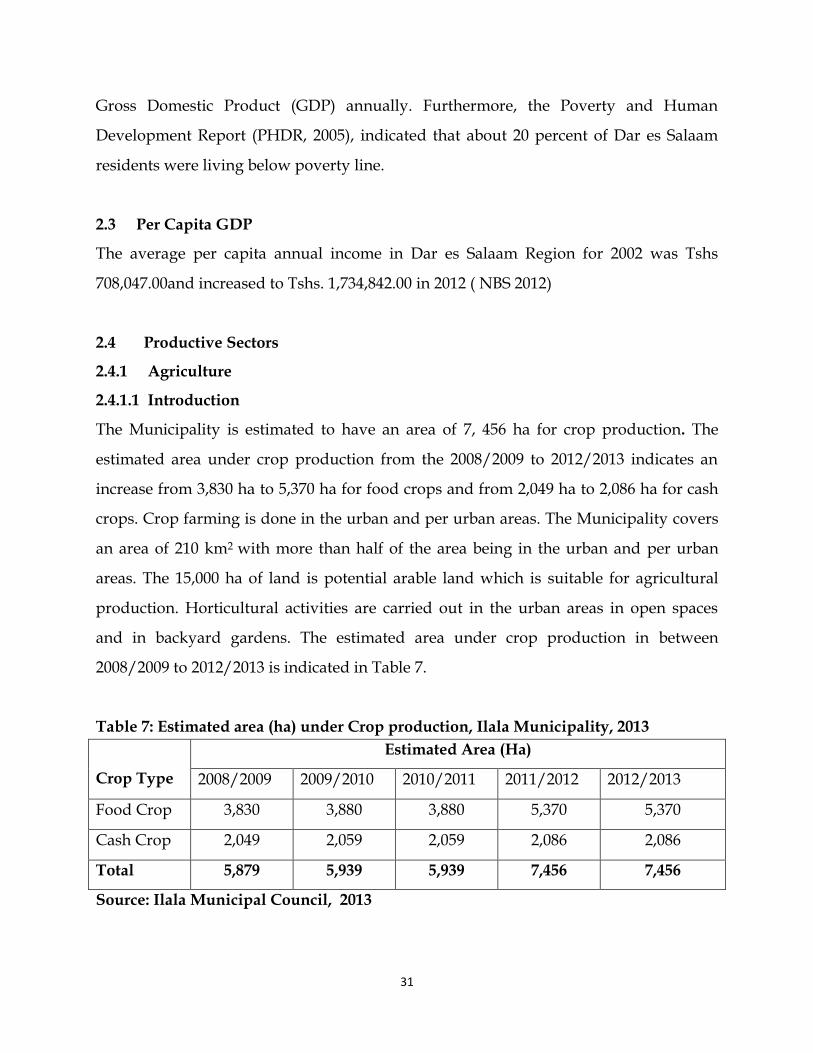
The Municipality is estimated to have an area of 7, 456 ha for crop production. The
estimated area under crop production from the 2008/2009 to 2012/2013 indicates an
increase from 3,830 ha to 5,370 ha for food crops and from 2,049 ha to 2,086 ha for cash
crops. Crop farming is done in the urban and per urban areas. The Municipality covers
an area of 210 km2 with more than half of the area being in the urban and per urban
areas. The 15,000 ha of land is potential arable land which is suitable for agricultural
production. Horticultural activities are carried out in the urban areas in open spaces
and in backyard gardens. The estimated area under crop production in between
2008/2009 to 2012/2013 is indicated in Table 7.
Table 7: Estimated area (ha) under Crop production, Ilala Municipality, 2013
Crop Type
Estimated Area (Ha)
2008/2009 2009/2010 2010/2011 2011/2012 2012/2013
Food Crop 3,830 3,880 3,880 5,370 5,370
Cash Crop 2,049 2,059 2,059 2,086 2,086
Total 5,879 5,939 5,939 7,456 7,456
Source: Ilala Municipal Council, 2013
32
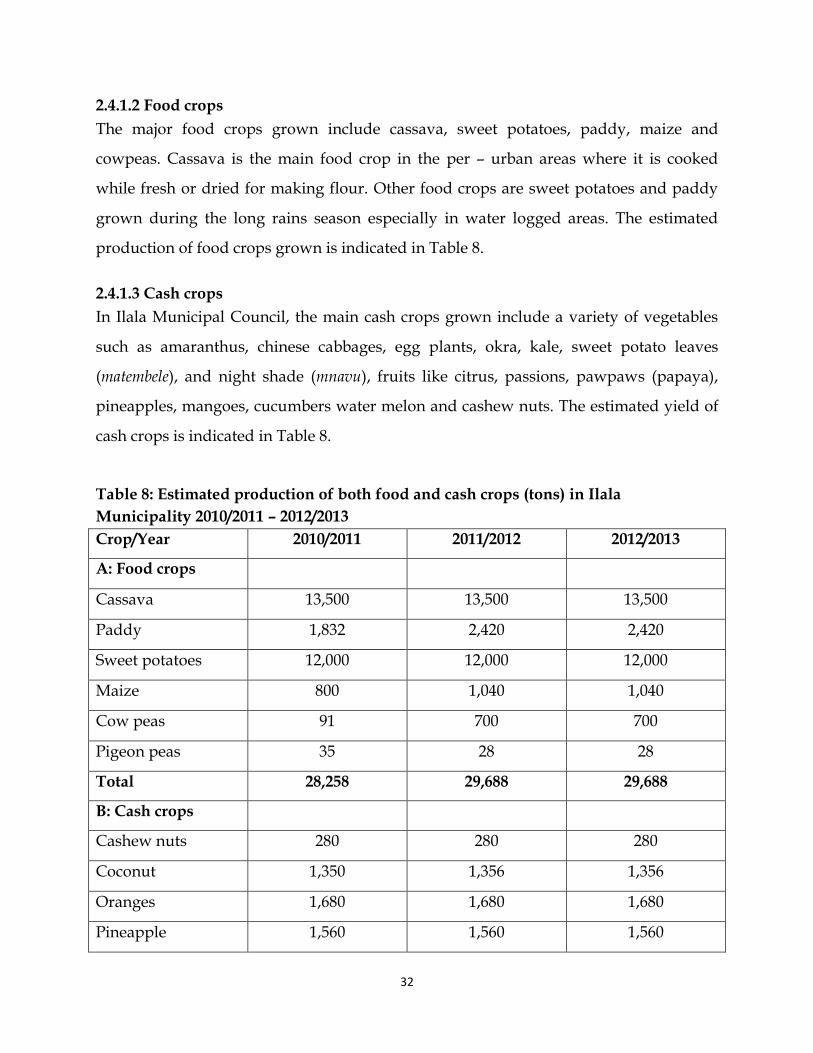
2.4.1.2 Food crops
The major food crops grown include cassava, sweet potatoes, paddy, maize and
cowpeas. Cassava is the main food crop in the per – urban areas where it is cooked
while fresh or dried for making flour. Other food crops are sweet potatoes and paddy
grown during the long rains season especially in water logged areas. The estimated
production of food crops grown is indicated in Table 8.
2.4.1.3 Cash crops
In Ilala Municipal Council, the main cash crops grown include a variety of vegetables
such as amaranthus, chinese cabbages, egg plants, okra, kale, sweet potato leaves
(matembele), and night shade (mnavu), fruits like citrus, passions, pawpaws (papaya),
pineapples, mangoes, cucumbers water melon and cashew nuts. The estimated yield of
cash crops is indicated in Table 8.
Table 8: Estimated production of both food and cash crops (tons) in Ilala
Municipality 2010/2011 – 2012/2013
Crop/Year 2010/2011 2011/2012 2012/2013
A: Food crops
Cassava 13,500 13,500 13,500
Paddy 1,832 2,420 2,420
Sweet potatoes 12,000 12,000 12,000
Maize 800 1,040 1,040
Cow peas 91 700 700
Pigeon peas 35 28 28
Total 28,258 29,688 29,688
B: Cash crops
Cashew nuts 280 280 280
Coconut 1,350 1,356 1,356
Oranges 1,680 1,680 1,680
Pineapple 1,560 1,560 1,560
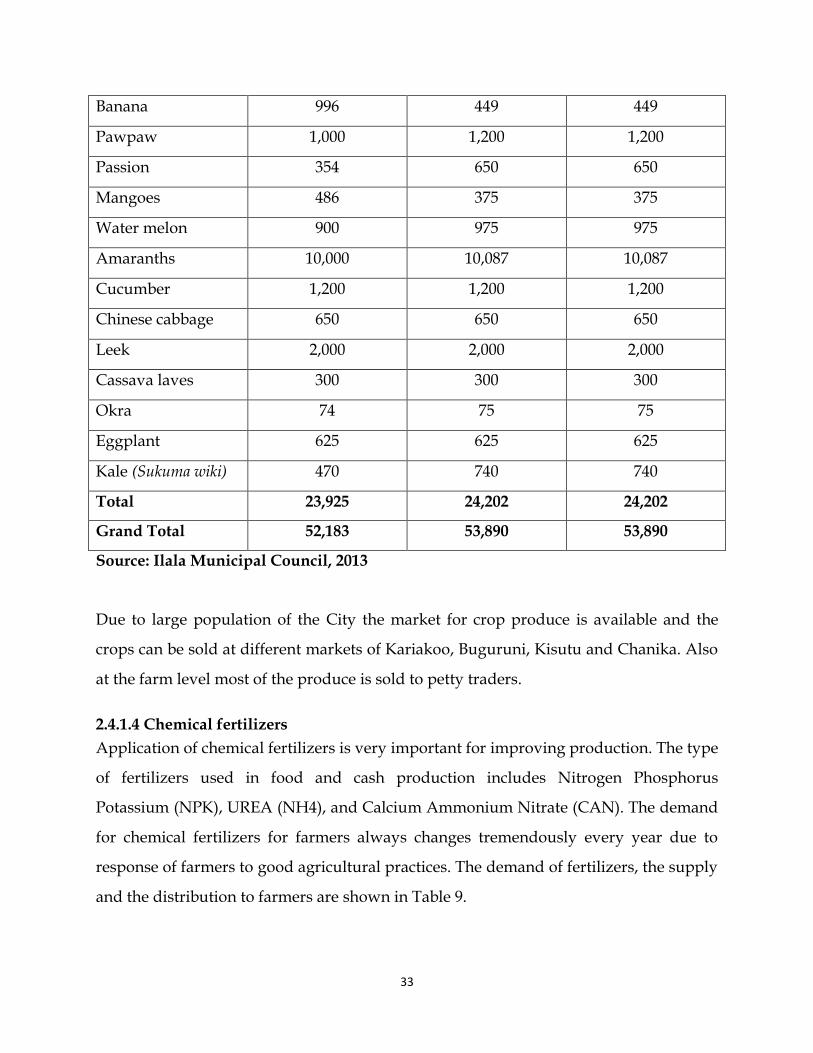
33
Banana 996 449 449
Pawpaw 1,000 1,200 1,200
Passion 354 650 650
Mangoes 486 375 375
Water melon 900 975 975
Amaranths 10,000 10,087 10,087
Cucumber 1,200 1,200 1,200
Chinese cabbage 650 650 650
Leek 2,000 2,000 2,000
Cassava laves 300 300 300
Okra 74 75 75
Eggplant 625 625 625
Kale (Sukuma wiki) 470 740 740
Total 23,925 24,202 24,202
Grand Total 52,183 53,890 53,890
Source: Ilala Municipal Council, 2013
Due to large population of the City the market for crop produce is available and the
crops can be sold at different markets of Kariakoo, Buguruni, Kisutu and Chanika. Also
at the farm level most of the produce is sold to petty traders.
2.4.1.4 Chemical fertilizers
Application of chemical fertilizers is very important for improving production. The type
of fertilizers used in food and cash production includes Nitrogen Phosphorus
Potassium (NPK), UREA (NH4), and Calcium Ammonium Nitrate (CAN). The demand
for chemical fertilizers for farmers always changes tremendously every year due to
response of farmers to good agricultural practices. The demand of fertilizers, the supply
and the distribution to farmers are shown in Table 9.
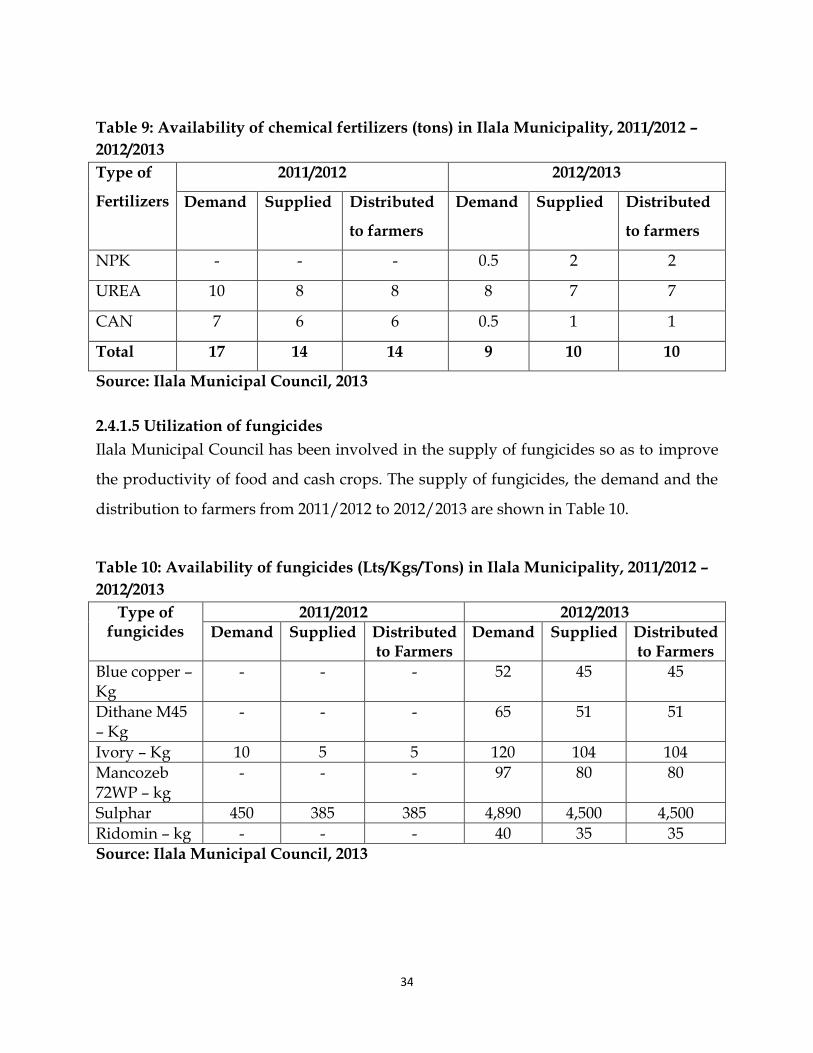
34
Table 9: Availability of chemical fertilizers (tons) in Ilala Municipality, 2011/2012 –
2012/2013
Type of
Fertilizers
2011/2012 2012/2013
Demand Supplied Distributed
to farmers
Demand Supplied Distributed
to farmers
NPK - - - 0.5 2 2
UREA 10 8 8 8 7 7
CAN 7 6 6 0.5 1 1
Total 17 14 14 9 10 10
Source: Ilala Municipal Council, 2013
2.4.1.5 Utilization of fungicides
Ilala Municipal Council has been involved in the supply of fungicides so as to improve
the productivity of food and cash crops. The supply of fungicides, the demand and the
distribution to farmers from 2011/2012 to 2012/2013 are shown in Table 10.
Table 10: Availability of fungicides (Lts/Kgs/Tons) in Ilala Municipality, 2011/2012 –
2012/2013
Type of fungicides
2011/2012 2012/2013
Demand Supplied Distributed to Farmers
Demand Supplied Distributed to Farmers
Blue copper – Kg
- - - 52 45 45
Dithane M45 – Kg
- - - 65 51 51
Ivory – Kg 10 5 5 120 104 104
Mancozeb 72WP – kg
- - - 97 80 80
Sulphar 450 385 385 4,890 4,500 4,500
Ridomin – kg - - - 40 35 35
Source: Ilala Municipal Council, 2013
35
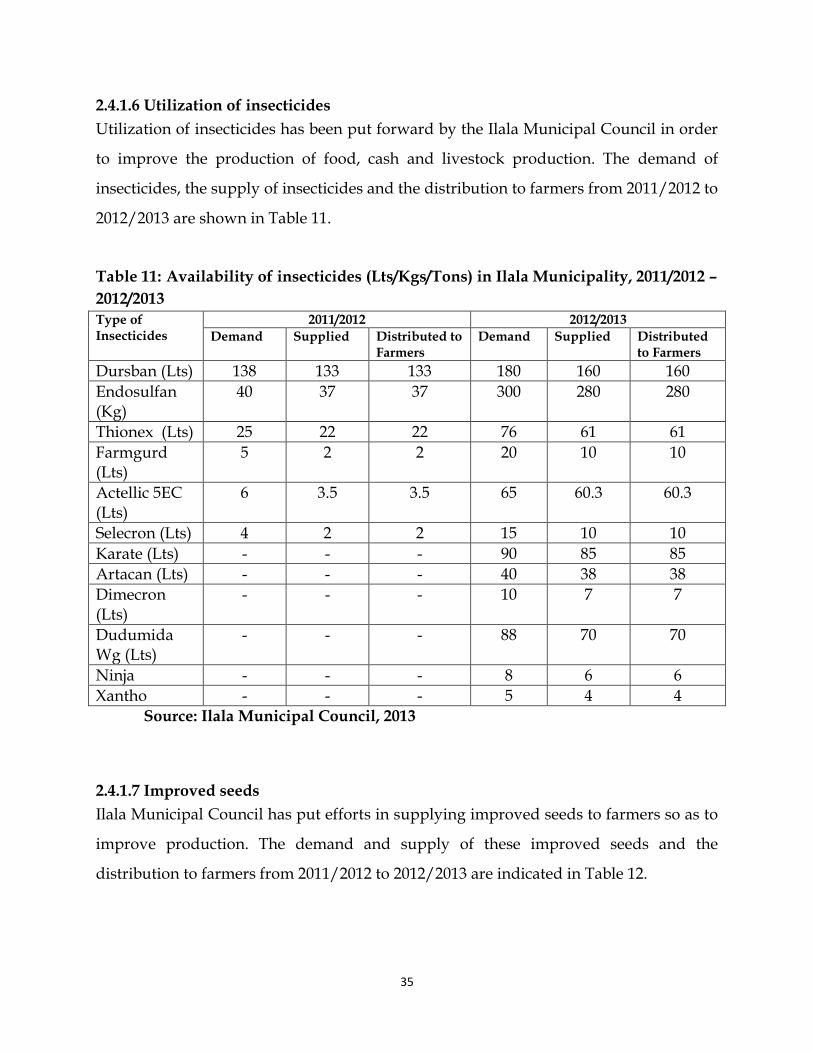
2.4.1.6 Utilization of insecticides
Utilization of insecticides has been put forward by the Ilala Municipal Council in order
to improve the production of food, cash and livestock production. The demand of
insecticides, the supply of insecticides and the distribution to farmers from 2011/2012 to
2012/2013 are shown in Table 11.
Table 11: Availability of insecticides (Lts/Kgs/Tons) in Ilala Municipality, 2011/2012 –
2012/2013
Type of Insecticides
2011/2012 2012/2013
Demand Supplied Distributed to Farmers
Demand Supplied Distributed to Farmers
Dursban (Lts) 138 133 133 180 160 160
Endosulfan (Kg)
40 37 37 300 280 280
Thionex (Lts) 25 22 22 76 61 61
Farmgurd (Lts)
5 2 2 20 10 10
Actellic 5EC (Lts)
6 3.5 3.5 65 60.3 60.3
Selecron (Lts) 4 2 2 15 10 10
Karate (Lts) - - - 90 85 85
Artacan (Lts) - - - 40 38 38
Dimecron (Lts)
- - - 10 7 7
Dudumida Wg (Lts)
- - - 88 70 70
Ninja - - - 8 6 6
Xantho - - - 5 4 4
Source: Ilala Municipal Council, 2013
2.4.1.7 Improved seeds
Ilala Municipal Council has put efforts in supplying improved seeds to farmers so as to
improve production. The demand and supply of these improved seeds and the
distribution to farmers from 2011/2012 to 2012/2013 are indicated in Table 12.
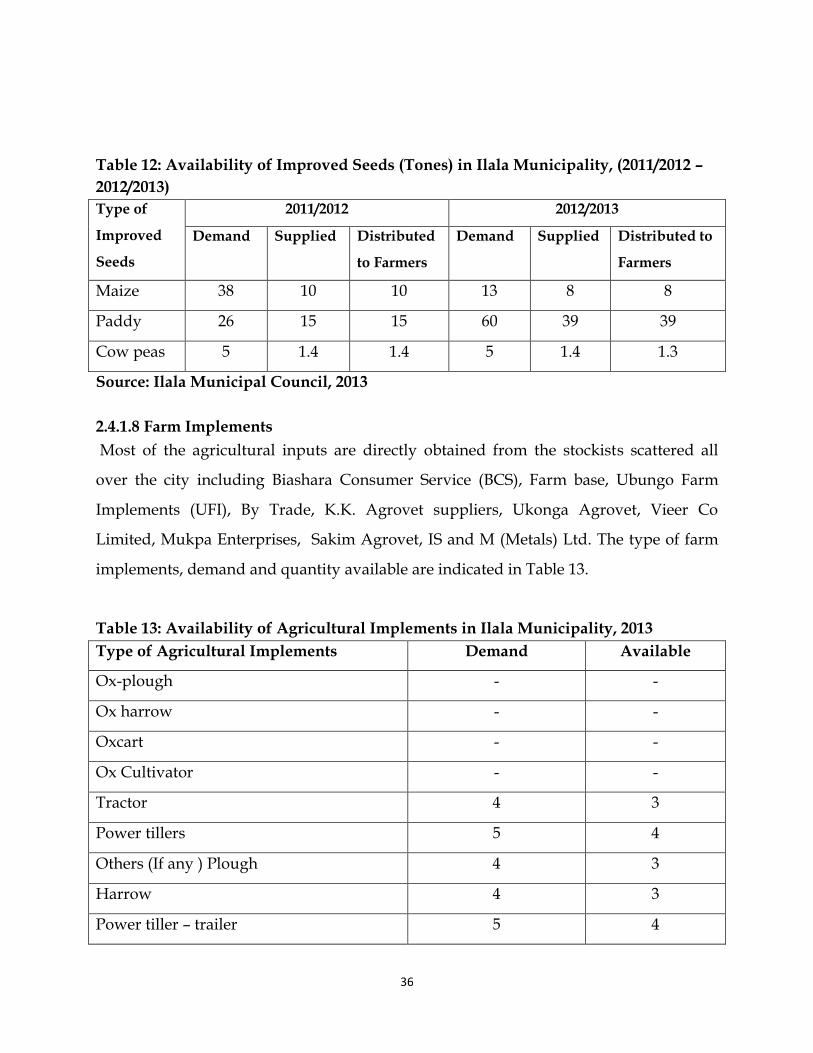
36
Table 12: Availability of Improved Seeds (Tones) in Ilala Municipality, (2011/2012 –
2012/2013)
Type of
Improved
Seeds
2011/2012 2012/2013
Demand Supplied Distributed
to Farmers
Demand Supplied Distributed to
Farmers
Maize 38 10 10 13 8 8
Paddy 26 15 15 60 39 39
Cow peas 5 1.4 1.4 5 1.4 1.3
Source: Ilala Municipal Council, 2013
2.4.1.8 Farm Implements
Most of the agricultural inputs are directly obtained from the stockists scattered all
over the city including Biashara Consumer Service (BCS), Farm base, Ubungo Farm
Implements (UFI), By Trade, K.K. Agrovet suppliers, Ukonga Agrovet, Vieer Co
Limited, Mukpa Enterprises, Sakim Agrovet, IS and M (Metals) Ltd. The type of farm
implements, demand and quantity available are indicated in Table 13.
Table 13: Availability of Agricultural Implements in Ilala Municipality, 2013
Type of Agricultural Implements Demand Available
Ox-plough - -
Ox harrow - -
Oxcart - -
Ox Cultivator - -
Tractor 4 3
Power tillers 5 4
Others (If any ) Plough 4 3
Harrow 4 3
Power tiller – trailer 5 4

37
Tractors - trailer 4 3
Planter 7 -
Ridger 7 -
Boom sprayer 70 50
Hoe 75,000 49,696
Motorize sprayer 5 3
Source: Ilala Municipal Council, 2013
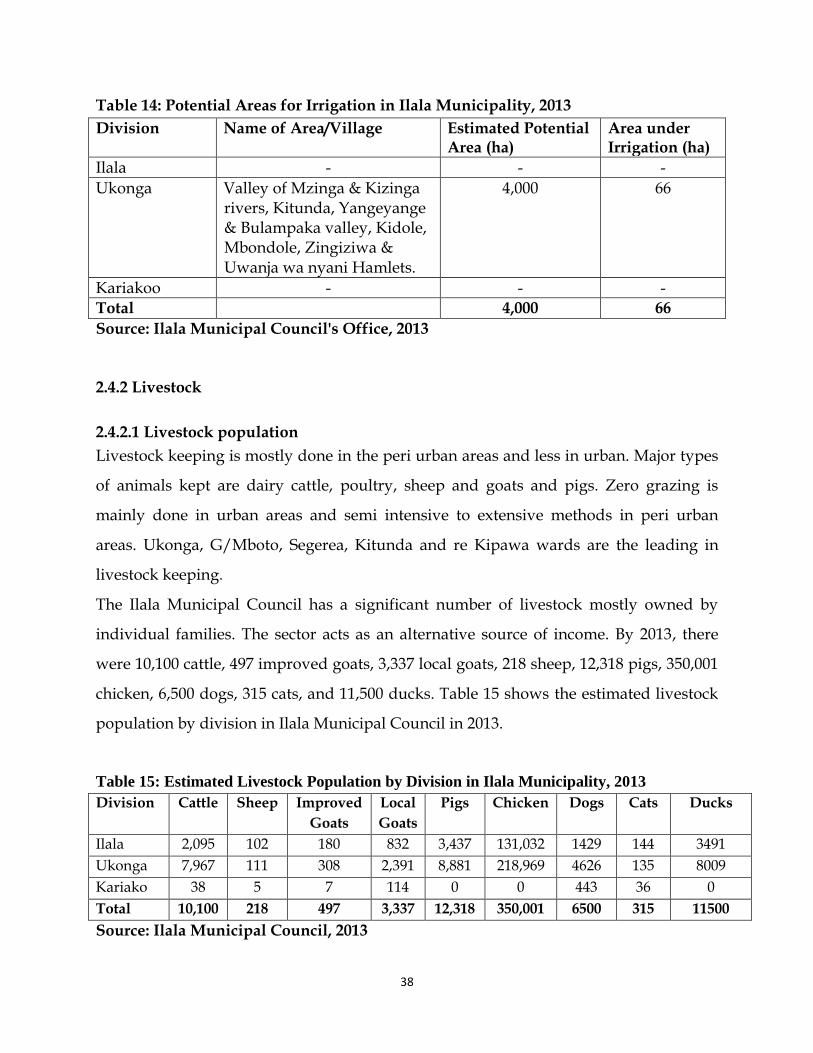
2.4.1.9 Irrigated agriculture
Ilala Municipal Council has a total of 4,000 hectors potential for irrigation farming.
However, only 66 hectors are currently irrigated using seasonal and permanent streams,
deep and shallow wells. Irrigation farming takes place mostly in Ukonga division. Most
of the farmers depend on rain fed agriculture and irrigation on small scale. Two small
irrigation schemes have been established at Kidole and Zingiziwa in Msongola and
Chanika wards, respectively. Presently, Ilala Municipal Council is conducting a
feasibility study for two irrigation schemes at Mzinga River and Zogoali valley in
Msongola and Chanika wards aiming to increase production throughout the year.
Generally, land which is suitable for traditional irrigation is found at Ukonga division
only. These areas include Valley of Mzinga, Kizinga rivers, Kitunda, Yangeyange and
Bulampaka valley, Kidole, Mbondole, Zingiziwa and Uwanja wa Nyani hamlets. Ilala
and Kariakoo divisions have no potentials area for irrigation.
The presence of ward Resource Centre at Kinyamwezi has enabled farmers to acquire
integrated farming skills offered by the centre. About 1,000 farmers are trained every
year. The centre also produces various seedlings and sells to farmers at affordable
prices. The potential areas for irrigation in Ilala Municipality are indicated in Table 14.
38
Table 14: Potential Areas for Irrigation in Ilala Municipality, 2013
Division Name of Area/Village Estimated Potential Area (ha)
Area under Irrigation (ha)
Ilala - - -
Ukonga Valley of Mzinga & Kizinga rivers, Kitunda, Yangeyange & Bulampaka valley, Kidole, Mbondole, Zingiziwa & Uwanja wa nyani Hamlets.
4,000 66
Kariakoo - - - Total 4,000 66
Source: Ilala Municipal Council's Office, 2013
2.4.2 Livestock
2.4.2.1 Livestock population
Livestock keeping is mostly done in the peri urban areas and less in urban. Major types
of animals kept are dairy cattle, poultry, sheep and goats and pigs. Zero grazing is
mainly done in urban areas and semi intensive to extensive methods in peri urban
areas. Ukonga, G/Mboto, Segerea, Kitunda and re Kipawa wards are the leading in
livestock keeping.
The Ilala Municipal Council has a significant number of livestock mostly owned by
individual families. The sector acts as an alternative source of income. By 2013, there
were 10,100 cattle, 497 improved goats, 3,337 local goats, 218 sheep, 12,318 pigs, 350,001
chicken, 6,500 dogs, 315 cats, and 11,500 ducks. Table 15 shows the estimated livestock
population by division in Ilala Municipal Council in 2013.
Table 15: Estimated Livestock Population by Division in Ilala Municipality, 2013
Division Cattle Sheep Improved
Goats
Local
Goats
Pigs Chicken Dogs Cats Ducks
Ilala 2,095 102 180 832 3,437 131,032 1429 144 3491
Ukonga 7,967 111 308 2,391 8,881 218,969 4626 135 8009
Kariako 38 5 7 114 0 0 443 36 0
Total 10,100 218 497 3,337 12,318 350,001 6500 315 11500
Source: Ilala Municipal Council, 2013
39
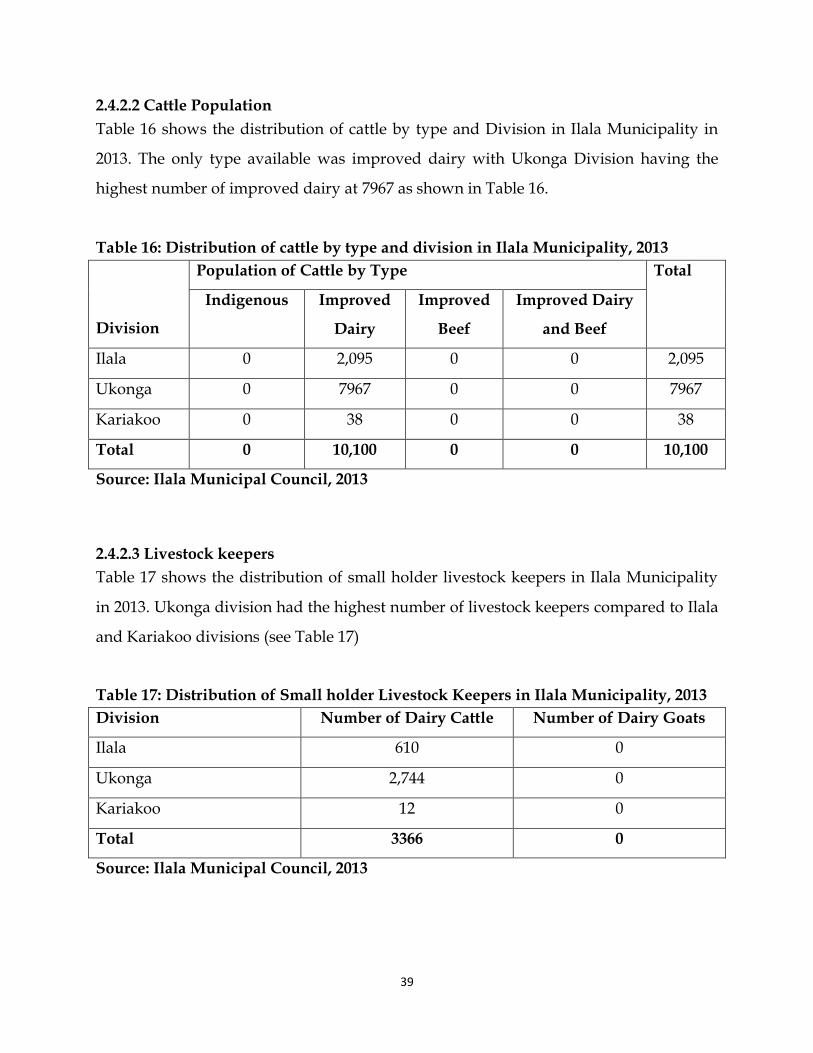
2.4.2.2 Cattle Population
Table 16 shows the distribution of cattle by type and Division in Ilala Municipality in
2013. The only type available was improved dairy with Ukonga Division having the
highest number of improved dairy at 7967 as shown in Table 16.
Table 16: Distribution of cattle by type and division in Ilala Municipality, 2013
Division
Population of Cattle by Type Total
Indigenous Improved
Dairy
Improved
Beef
Improved Dairy
and Beef
Ilala 0 2,095 0 0 2,095
Ukonga 0 7967 0 0 7967
Kariakoo 0 38 0 0 38
Total 0 10,100 0 0 10,100
Source: Ilala Municipal Council, 2013
2.4.2.3 Livestock keepers
Table 17 shows the distribution of small holder livestock keepers in Ilala Municipality
in 2013. Ukonga division had the highest number of livestock keepers compared to Ilala
and Kariakoo divisions (see Table 17)
Table 17: Distribution of Small holder Livestock Keepers in Ilala Municipality, 2013
Division Number of Dairy Cattle Number of Dairy Goats
Ilala 610 0
Ukonga 2,744 0
Kariakoo 12 0
Total 3366 0
Source: Ilala Municipal Council, 2013
40
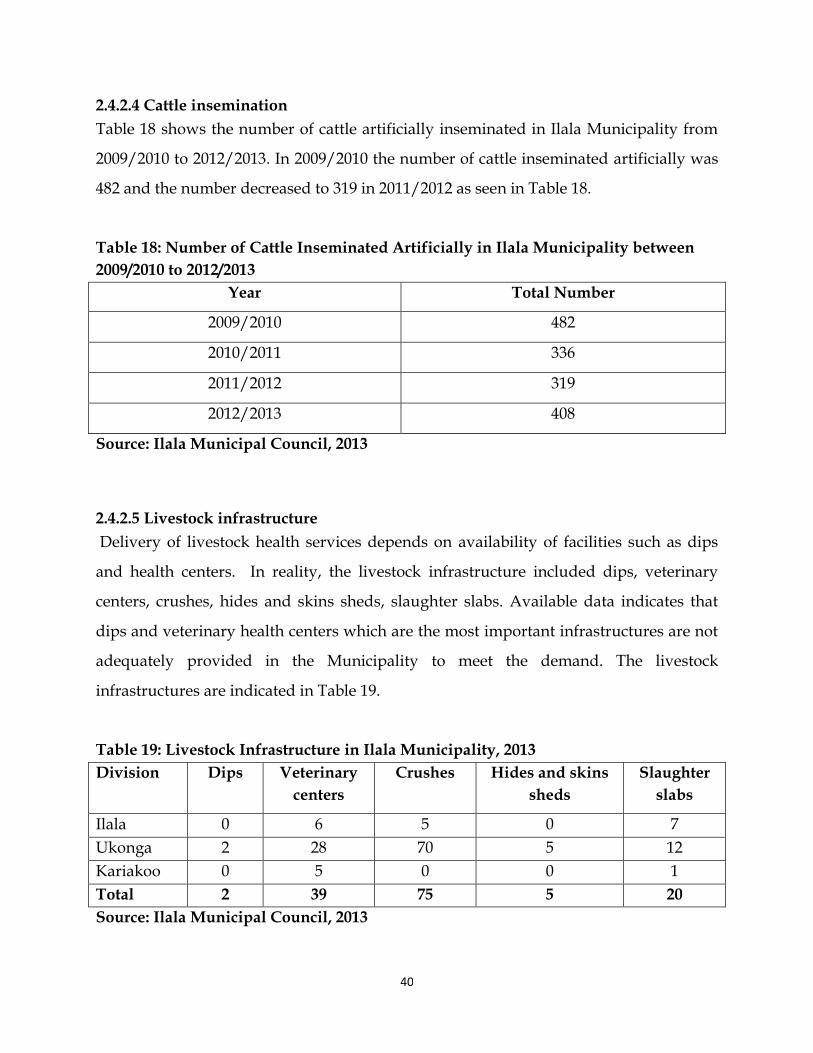
2.4.2.4 Cattle insemination
Table 18 shows the number of cattle artificially inseminated in Ilala Municipality from
2009/2010 to 2012/2013. In 2009/2010 the number of cattle inseminated artificially was
482 and the number decreased to 319 in 2011/2012 as seen in Table 18.
Table 18: Number of Cattle Inseminated Artificially in Ilala Municipality between
2009/2010 to 2012/2013
Year Total Number
2009/2010 482
2010/2011 336
2011/2012 319
2012/2013 408
Source: Ilala Municipal Council, 2013
2.4.2.5 Livestock infrastructure
Delivery of livestock health services depends on availability of facilities such as dips
and health centers. In reality, the livestock infrastructure included dips, veterinary
centers, crushes, hides and skins sheds, slaughter slabs. Available data indicates that
dips and veterinary health centers which are the most important infrastructures are not
adequately provided in the Municipality to meet the demand. The livestock
infrastructures are indicated in Table 19.
Table 19: Livestock Infrastructure in Ilala Municipality, 2013
Division Dips
Veterinary
centers
Crushes Hides and skins
sheds
Slaughter
slabs
Ilala 0 6 5 0 7
Ukonga 2 28 70 5 12
Kariakoo 0 5 0 0 1
Total 2 39 75 5 20
Source: Ilala Municipal Council, 2013

41
2.4.2.6 Major Cattle Diseases
Livestock diseases are quite a problem in Ilala Municipal Council, leading to poor
livestock health and even deaths. The major cattle diseases are Tryps, Foot and Mouth
Diseases (FMD) and East Coast Fever (ECF). The three major cattle diseases reported
between 2009 and 2013 by morbidity and mortality cases are shown in Table 20.
Table 20: Three Major Cattle Diseases Reported in Ilala Municipality, 2009-2013
Disease Number of Morbidity cases Number of Mortality cases
2009 2010 2011 2012 2013 2009 2010 2011 2012 2013
Trips 1,863 1,680 984 1,298 1,228 2 4 0 0 0
FMD 2855 2500 1,890 2,300 2,003 0 0 0 0 0
ECF 3200 3500 2,561 1,019 1,905 3 5 6 2 3
Total 7,918 7,680 5435 4,617 5,136 5 9 6 2 3
Source: Ilala Municipal Council, 2013
2.4.2.7 Major Goat Diseases
There are various diseases which affect goats but the major three diseases are
Contagious Caprine Pleuropneumonia (CCP), Helminthosis and Pneumonia. The
morbidity and mortality cases of goats reported between 2009 and 2013 are shown in
Table 21.
Table 21: Three Major Goat Diseases Reported in Ilala Municipality, 2009- 2013
Disease Number of Morbidity cases Number of Mortality cases
2009 2010 2011 2012 2013 2009 2010 2011 2012 2013
CCP 23 12 15 28 14 0 0 0 0 0
Helminthosis 312 253 405 334 497 0 0 0 0 0
Pneumonia 39 43 29 37 56 1 3 0 2 5
Total 374 308 449 399 567 1 3 0 2 5
Source: Ilala Municipal Council, 2013
42
2.4.2.8 Major Sheep Diseases
The Ilala Municipal Council has a significant number of sheep mostly owned by
individual families. However no diseases were reported in sheep for 2009 to 2013.
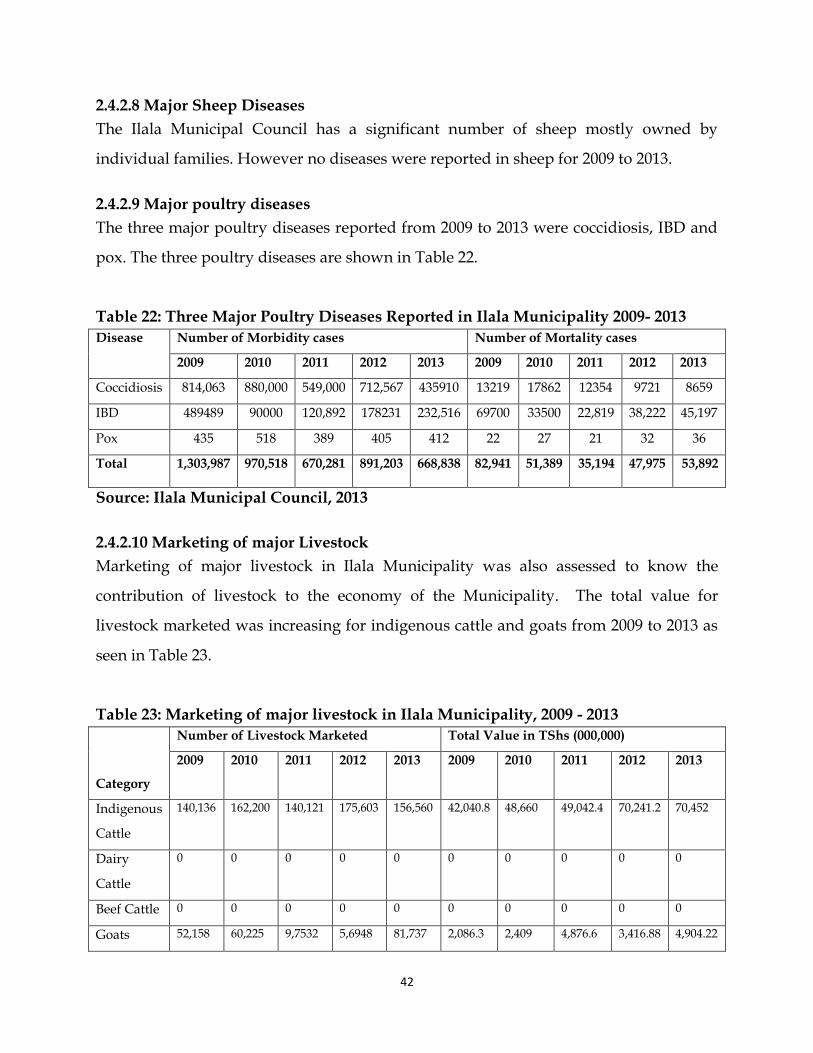
2.4.2.9 Major poultry diseases
The three major poultry diseases reported from 2009 to 2013 were coccidiosis, IBD and
pox. The three poultry diseases are shown in Table 22.
Table 22: Three Major Poultry Diseases Reported in Ilala Municipality 2009- 2013
Disease Number of Morbidity cases Number of Mortality cases
2009 2010 2011 2012 2013 2009 2010 2011 2012 2013
Coccidiosis 814,063 880,000 549,000 712,567 435910 13219 17862 12354 9721 8659
IBD 489489 90000 120,892 178231 232,516 69700 33500 22,819 38,222 45,197
Pox 435 518 389 405 412 22 27 21 32 36
Total 1,303,987 970,518 670,281 891,203 668,838 82,941 51,389 35,194 47,975 53,892
Source: Ilala Municipal Council, 2013
2.4.2.10 Marketing of major Livestock
Marketing of major livestock in Ilala Municipality was also assessed to know the
contribution of livestock to the economy of the Municipality. The total value for
livestock marketed was increasing for indigenous cattle and goats from 2009 to 2013 as
seen in Table 23.
Table 23: Marketing of major livestock in Ilala Municipality, 2009 - 2013
Category
Number of Livestock Marketed Total Value in TShs (000,000)
2009 2010 2011 2012 2013 2009 2010 2011 2012 2013
Indigenous
Cattle
140,136 162,200 140,121 175,603 156,560 42,040.8 48,660 49,042.4 70,241.2 70,452
Dairy
Cattle
0 0 0 0 0 0 0 0 0 0
Beef Cattle 0 0 0 0 0 0 0 0 0 0
Goats 52,158 60,225 9,7532 5,6948 81,737 2,086.3 2,409 4,876.6 3,416.88 4,904.22
43
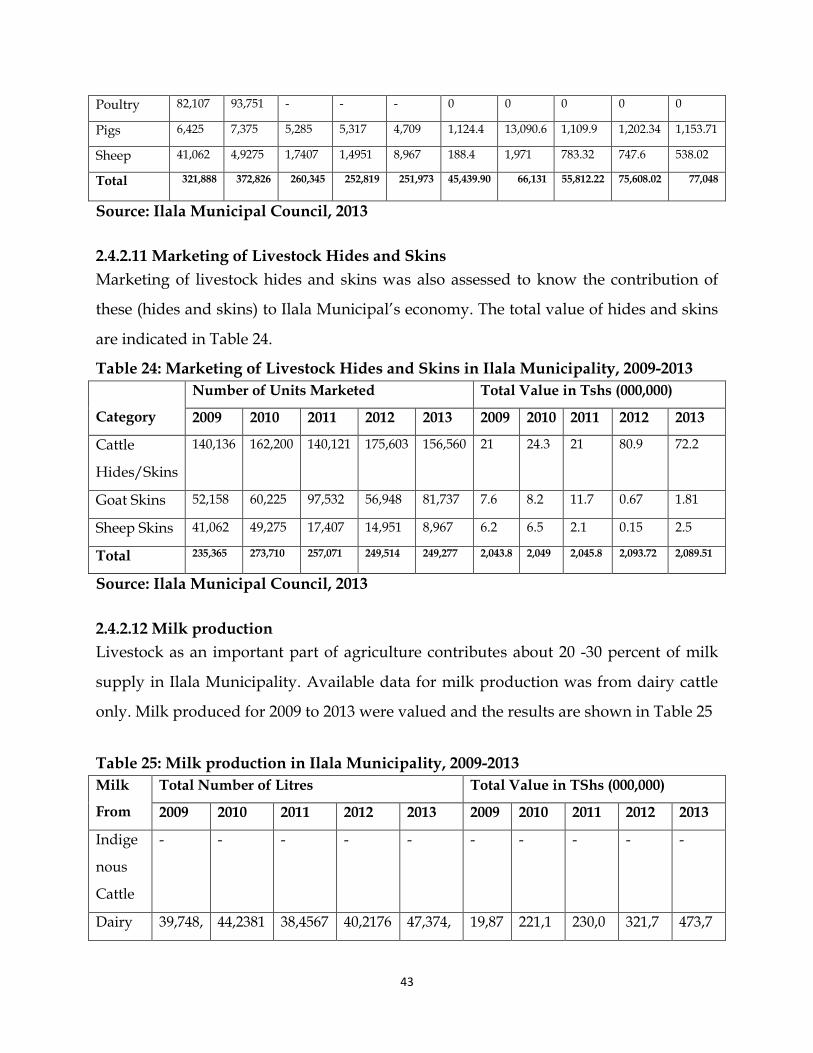
Poultry 82,107 93,751 - - - 0 0 0 0 0
Pigs 6,425 7,375 5,285 5,317 4,709 1,124.4 13,090.6 1,109.9 1,202.34 1,153.71
Sheep 41,062 4,9275 1,7407 1,4951 8,967 188.4 1,971 783.32 747.6 538.02
Total 321,888 372,826 260,345 252,819 251,973 45,439.90 66,131 55,812.22 75,608.02 77,048
Source: Ilala Municipal Council, 2013
2.4.2.11 Marketing of Livestock Hides and Skins
Marketing of livestock hides and skins was also assessed to know the contribution of
these (hides and skins) to Ilala Municipal’s economy. The total value of hides and skins
are indicated in Table 24.
Table 24: Marketing of Livestock Hides and Skins in Ilala Municipality, 2009-2013
Category
Number of Units Marketed Total Value in Tshs (000,000)
2009 2010 2011 2012 2013 2009 2010 2011 2012 2013
Cattle
Hides/Skins
140,136 162,200 140,121 175,603 156,560 21 24.3 21 80.9 72.2
Goat Skins 52,158 60,225 97,532 56,948 81,737 7.6 8.2 11.7 0.67 1.81
Sheep Skins 41,062 49,275 17,407 14,951 8,967 6.2 6.5 2.1 0.15 2.5
Total 235,365 273,710 257,071 249,514 249,277 2,043.8 2,049 2,045.8 2,093.72 2,089.51
Source: Ilala Municipal Council, 2013
2.4.2.12 Milk production
Livestock as an important part of agriculture contributes about 20 -30 percent of milk
supply in Ilala Municipality. Available data for milk production was from dairy cattle
only. Milk produced for 2009 to 2013 were valued and the results are shown in Table 25
Table 25: Milk production in Ilala Municipality, 2009-2013
Milk
From
Total Number of Litres Total Value in TShs (000,000)
2009 2010 2011 2012 2013 2009 2010 2011 2012 2013
Indige
nous
Cattle
- - - - - - - - - -
Dairy 39,748, 44,2381 38,4567 40,2176 47,374, 19,87 221,1 230,0 321,7 473,7
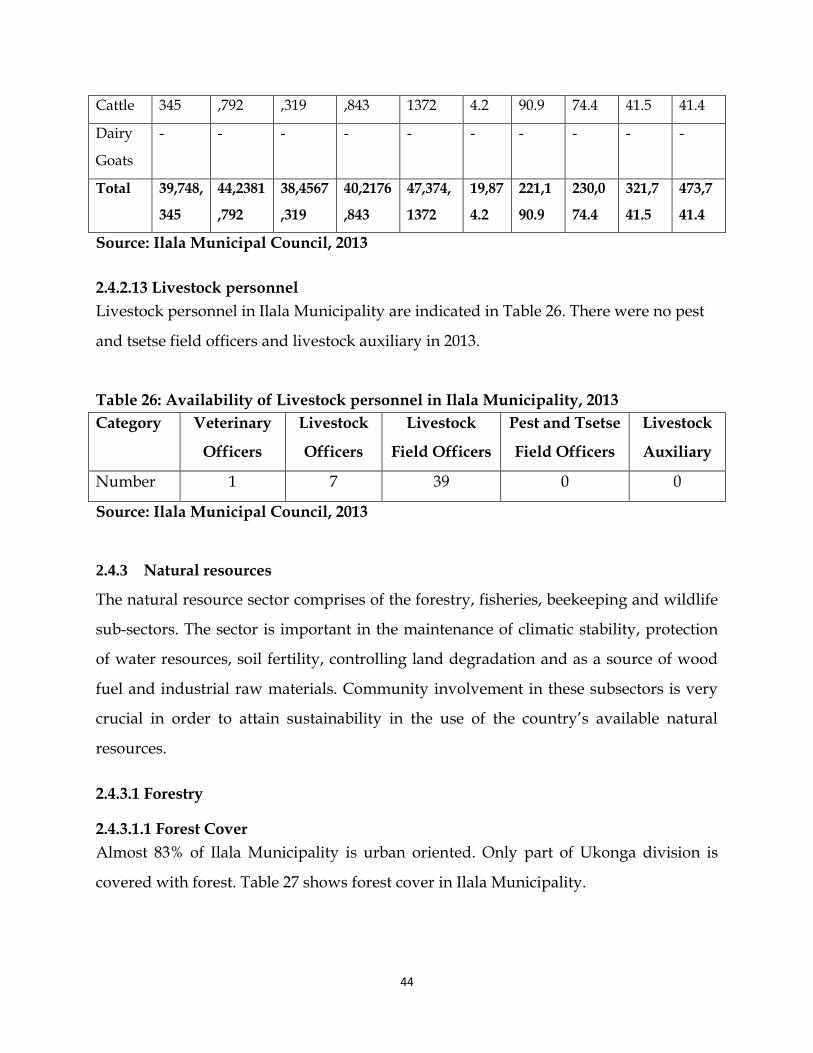
44
Cattle 345 ,792 ,319 ,843 1372 4.2 90.9 74.4 41.5 41.4
Dairy
Goats
- - - - - - - - - -
Total 39,748,
345
44,2381
,792
38,4567
,319
40,2176
,843
47,374,
1372
19,87
4.2
221,1
90.9
230,0
74.4
321,7
41.5
473,7
41.4
Source: Ilala Municipal Council, 2013
2.4.2.13 Livestock personnel
Livestock personnel in Ilala Municipality are indicated in Table 26. There were no pest
and tsetse field officers and livestock auxiliary in 2013.
Table 26: Availability of Livestock personnel in Ilala Municipality, 2013
Category Veterinary
Officers
Livestock
Officers
Livestock
Field Officers
Pest and Tsetse
Field Officers
Livestock
Auxiliary
Number 1 7 39 0 0
Source: Ilala Municipal Council, 2013
2.4.3 Natural resources
The natural resource sector comprises of the forestry, fisheries, beekeeping and wildlife
sub-sectors. The sector is important in the maintenance of climatic stability, protection
of water resources, soil fertility, controlling land degradation and as a source of wood
fuel and industrial raw materials. Community involvement in these subsectors is very
crucial in order to attain sustainability in the use of the country’s available natural
resources.
2.4.3.1 Forestry
2.4.3.1.1 Forest Cover
Almost 83% of Ilala Municipality is urban oriented. Only part of Ukonga division is
covered with forest. Table 27 shows forest cover in Ilala Municipality.
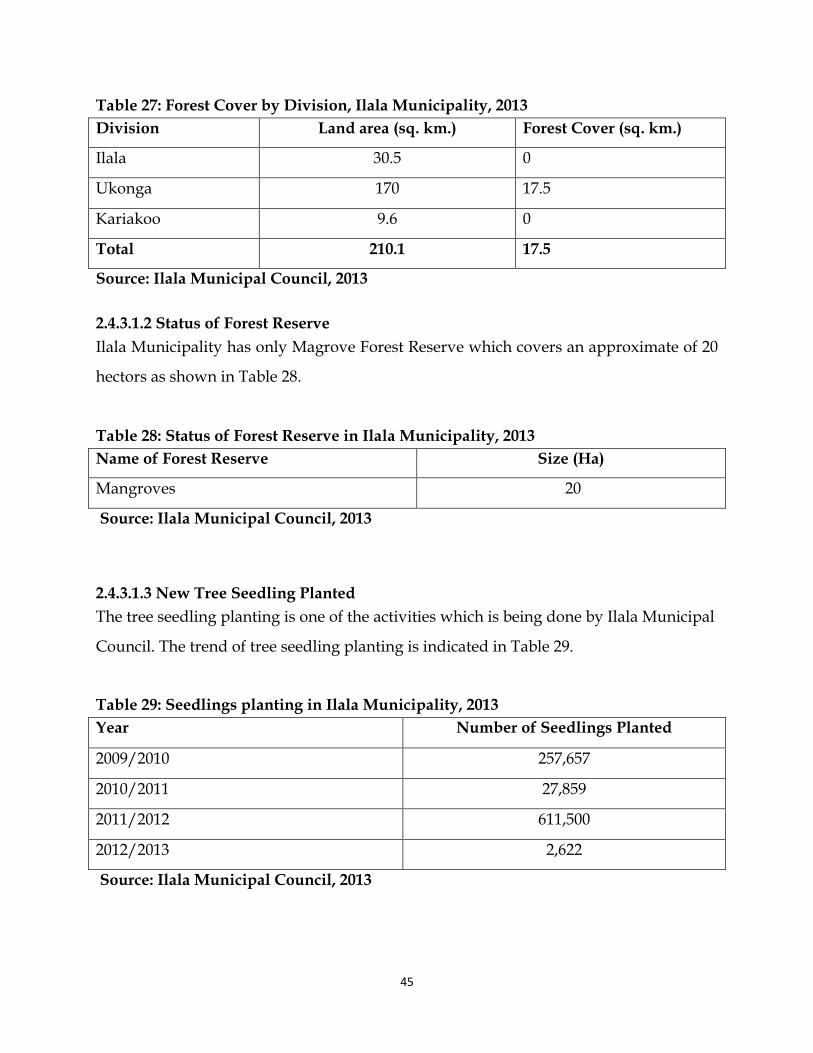
45
Table 27: Forest Cover by Division, Ilala Municipality, 2013
Division Land area (sq. km.) Forest Cover (sq. km.)
Ilala 30.5 0
Ukonga 170 17.5
Kariakoo 9.6 0
Total 210.1 17.5
Source: Ilala Municipal Council, 2013
2.4.3.1.2 Status of Forest Reserve
Ilala Municipality has only Magrove Forest Reserve which covers an approximate of 20
hectors as shown in Table 28.
Table 28: Status of Forest Reserve in Ilala Municipality, 2013
Name of Forest Reserve Size (Ha)
Mangroves 20
Source: Ilala Municipal Council, 2013
2.4.3.1.3 New Tree Seedling Planted
The tree seedling planting is one of the activities which is being done by Ilala Municipal
Council. The trend of tree seedling planting is indicated in Table 29.
Table 29: Seedlings planting in Ilala Municipality, 2013
Year Number of Seedlings Planted
2009/2010 257,657
2010/2011 27,859
2011/2012 611,500
2012/2013 2,622
Source: Ilala Municipal Council, 2013
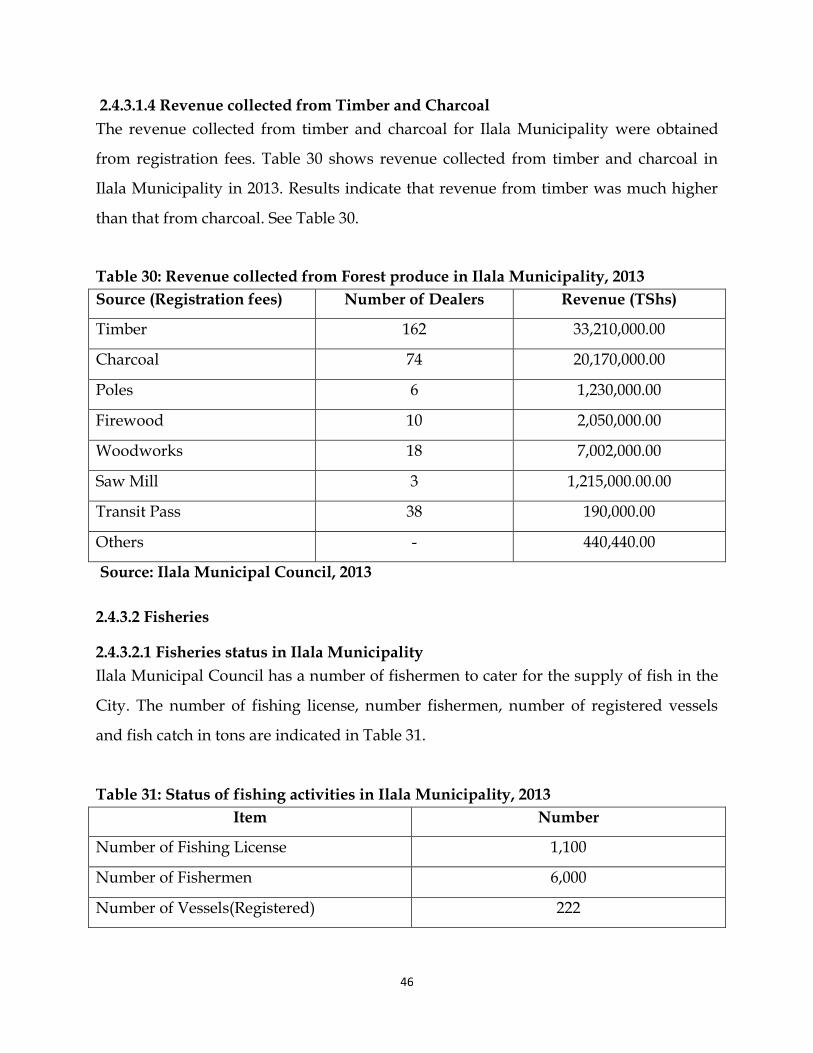
46
2.4.3.1.4 Revenue collected from Timber and Charcoal
The revenue collected from timber and charcoal for Ilala Municipality were obtained
from registration fees. Table 30 shows revenue collected from timber and charcoal in
Ilala Municipality in 2013. Results indicate that revenue from timber was much higher
than that from charcoal. See Table 30.
Table 30: Revenue collected from Forest produce in Ilala Municipality, 2013
Source (Registration fees) Number of Dealers Revenue (TShs)
Timber 162 33,210,000.00
Charcoal 74 20,170,000.00
Poles 6 1,230,000.00
Firewood 10 2,050,000.00
Woodworks 18 7,002,000.00
Saw Mill 3 1,215,000.00.00
Transit Pass 38 190,000.00
Others - 440,440.00
Source: Ilala Municipal Council, 2013
2.4.3.2 Fisheries
2.4.3.2.1 Fisheries status in Ilala Municipality
Ilala Municipal Council has a number of fishermen to cater for the supply of fish in the
City. The number of fishing license, number fishermen, number of registered vessels
and fish catch in tons are indicated in Table 31.
Table 31: Status of fishing activities in Ilala Municipality, 2013
Item Number
Number of Fishing License 1,100
Number of Fishermen 6,000
Number of Vessels(Registered) 222
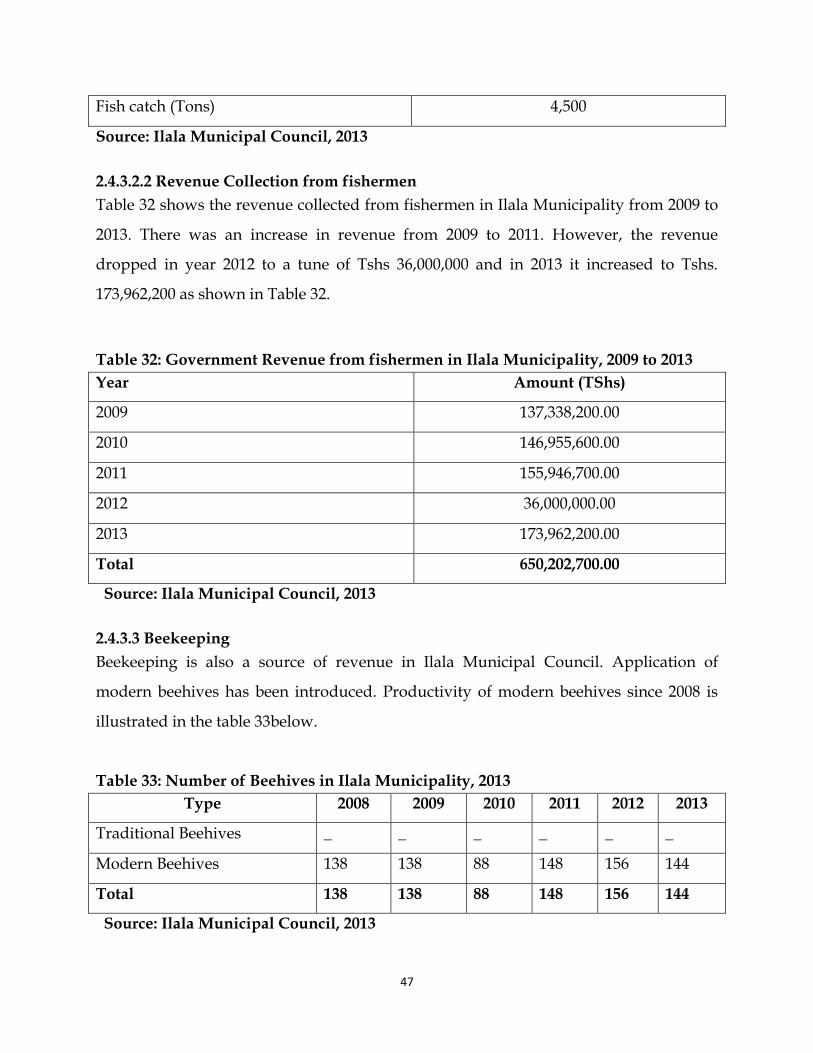
47
Fish catch (Tons) 4,500
Source: Ilala Municipal Council, 2013
2.4.3.2.2 Revenue Collection from fishermen
Table 32 shows the revenue collected from fishermen in Ilala Municipality from 2009 to
2013. There was an increase in revenue from 2009 to 2011. However, the revenue
dropped in year 2012 to a tune of Tshs 36,000,000 and in 2013 it increased to Tshs.
173,962,200 as shown in Table 32.
Table 32: Government Revenue from fishermen in Ilala Municipality, 2009 to 2013
Year Amount (TShs)
2009 137,338,200.00
2010 146,955,600.00
2011 155,946,700.00
2012 36,000,000.00
2013 173,962,200.00
Total 650,202,700.00
Source: Ilala Municipal Council, 2013
2.4.3.3 Beekeeping
Beekeeping is also a source of revenue in Ilala Municipal Council. Application of
modern beehives has been introduced. Productivity of modern beehives since 2008 is
illustrated in the table 33below.
Table 33: Number of Beehives in Ilala Municipality, 2013
Type 2008 2009 2010 2011 2012 2013
Traditional Beehives _ _ _ _ _ _
Modern Beehives 138 138 88 148 156 144
Total 138 138 88 148 156 144
Source: Ilala Municipal Council, 2013
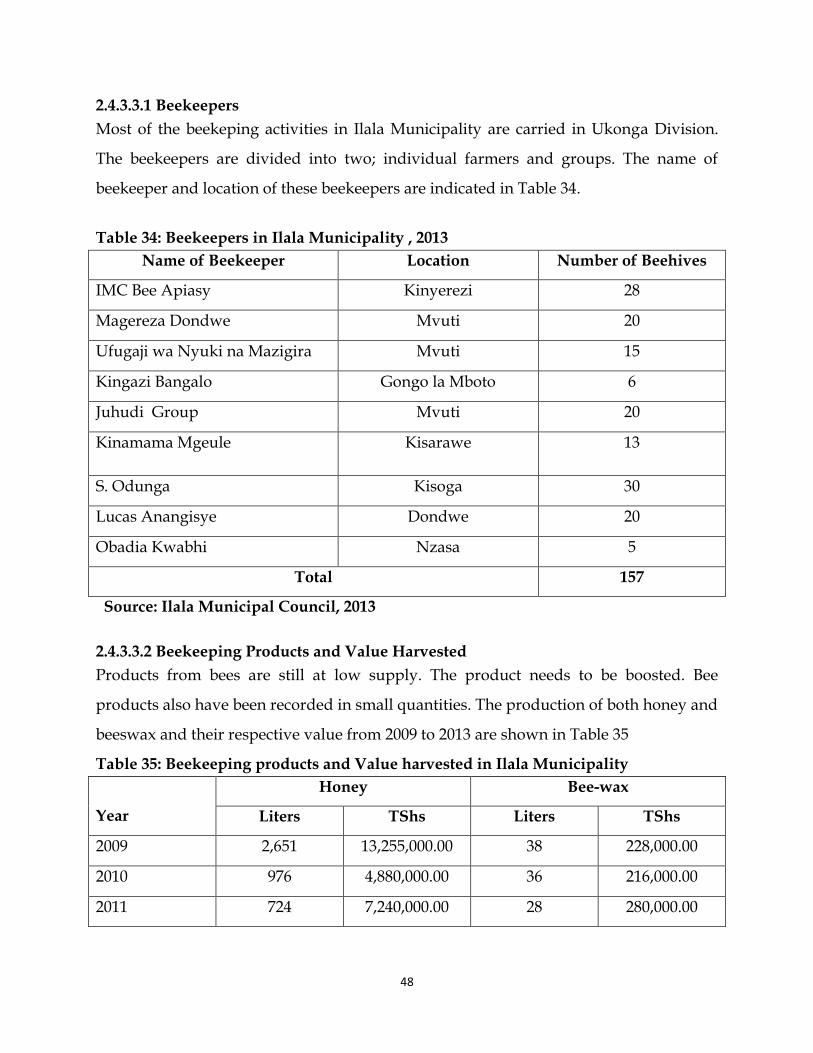
48
2.4.3.3.1 Beekeepers
Most of the beekeping activities in Ilala Municipality are carried in Ukonga Division.
The beekeepers are divided into two; individual farmers and groups. The name of
beekeeper and location of these beekeepers are indicated in Table 34.
Table 34: Beekeepers in Ilala Municipality , 2013
Name of Beekeeper Location Number of Beehives
IMC Bee Apiasy Kinyerezi 28
Magereza Dondwe Mvuti 20
Ufugaji wa Nyuki na Mazigira Mvuti 15
Kingazi Bangalo Gongo la Mboto 6
Juhudi Group Mvuti 20
Kinamama Mgeule Kisarawe 13
S. Odunga Kisoga 30
Lucas Anangisye Dondwe 20
Obadia Kwabhi Nzasa 5
Total 157
Source: Ilala Municipal Council, 2013
2.4.3.3.2 Beekeeping Products and Value Harvested
Products from bees are still at low supply. The product needs to be boosted. Bee
products also have been recorded in small quantities. The production of both honey and
beeswax and their respective value from 2009 to 2013 are shown in Table 35
Table 35: Beekeeping products and Value harvested in Ilala Municipality
Year
Honey Bee-wax
Liters TShs Liters TShs
2009 2,651 13,255,000.00 38 228,000.00
2010 976 4,880,000.00 36 216,000.00
2011 724 7,240,000.00 28 280,000.00
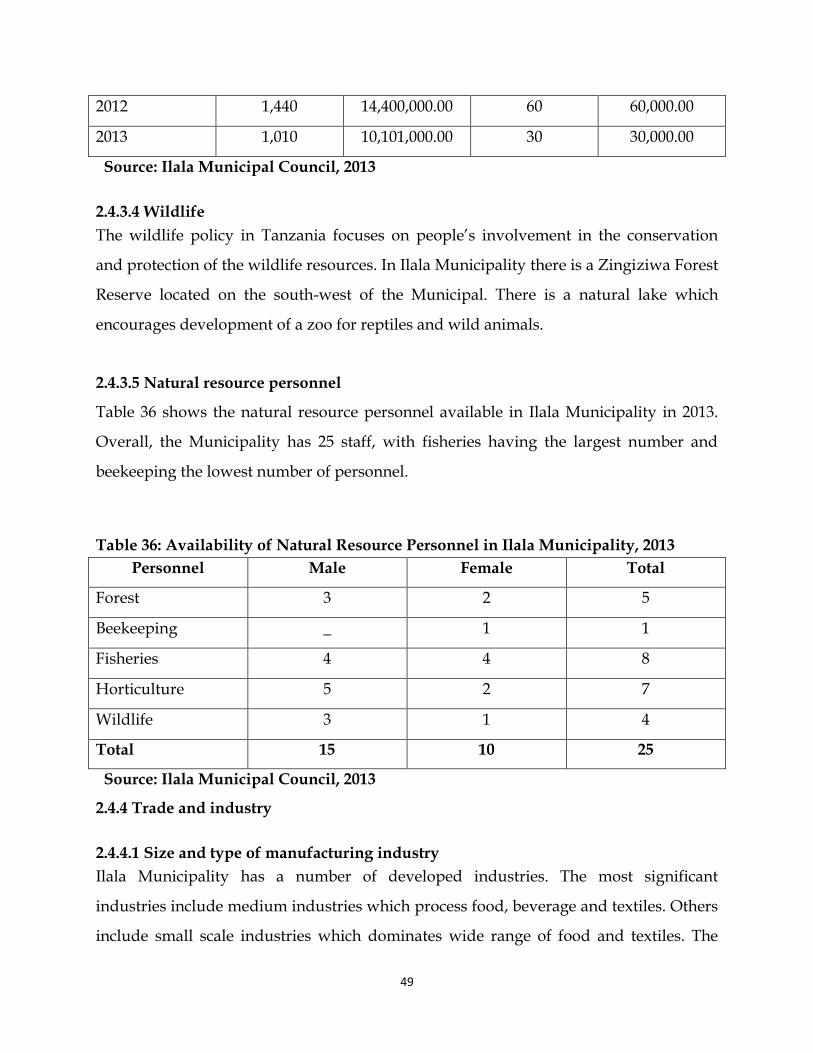
49
2012 1,440 14,400,000.00 60 60,000.00
2013 1,010 10,101,000.00 30 30,000.00
Source: Ilala Municipal Council, 2013
2.4.3.4 Wildlife
The wildlife policy in Tanzania focuses on people’s involvement in the conservation
and protection of the wildlife resources. In Ilala Municipality there is a Zingiziwa Forest
Reserve located on the south-west of the Municipal. There is a natural lake which
encourages development of a zoo for reptiles and wild animals.
2.4.3.5 Natural resource personnel
Table 36 shows the natural resource personnel available in Ilala Municipality in 2013.
Overall, the Municipality has 25 staff, with fisheries having the largest number and
beekeeping the lowest number of personnel.
Table 36: Availability of Natural Resource Personnel in Ilala Municipality, 2013
Personnel Male Female Total
Forest 3 2 5
Beekeeping _ 1 1
Fisheries 4 4 8
Horticulture 5 2 7
Wildlife 3 1 4
Total 15 10 25
Source: Ilala Municipal Council, 2013
2.4.4 Trade and industry
2.4.4.1 Size and type of manufacturing industry
Ilala Municipality has a number of developed industries. The most significant
industries include medium industries which process food, beverage and textiles. Others
include small scale industries which dominates wide range of food and textiles. The
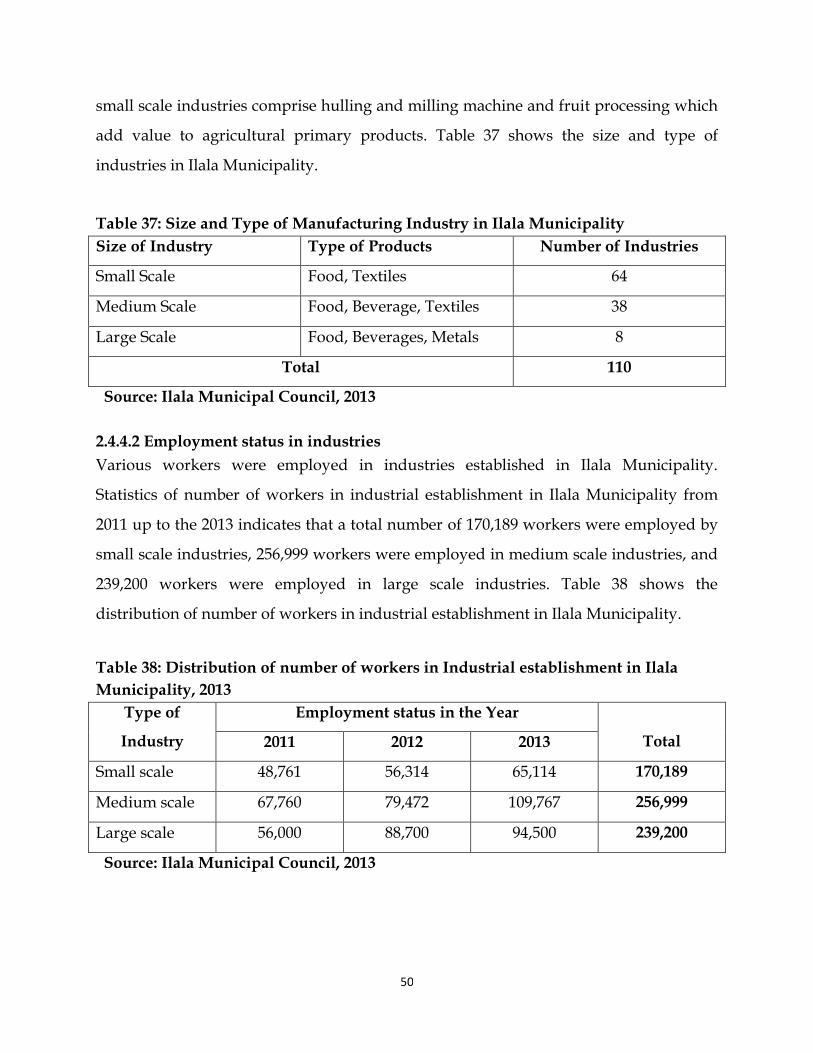
50
small scale industries comprise hulling and milling machine and fruit processing which
add value to agricultural primary products. Table 37 shows the size and type of
industries in Ilala Municipality.
Table 37: Size and Type of Manufacturing Industry in Ilala Municipality
Size of Industry Type of Products Number of Industries
Small Scale Food, Textiles 64
Medium Scale Food, Beverage, Textiles 38
Large Scale Food, Beverages, Metals 8
Total 110
Source: Ilala Municipal Council, 2013
2.4.4.2 Employment status in industries
Various workers were employed in industries established in Ilala Municipality.
Statistics of number of workers in industrial establishment in Ilala Municipality from
2011 up to the 2013 indicates that a total number of 170,189 workers were employed by
small scale industries, 256,999 workers were employed in medium scale industries, and
239,200 workers were employed in large scale industries. Table 38 shows the
distribution of number of workers in industrial establishment in Ilala Municipality.
Table 38: Distribution of number of workers in Industrial establishment in Ilala
Municipality, 2013
Type of
Industry
Employment status in the Year
Total 2011 2012 2013
Small scale 48,761 56,314 65,114 170,189
Medium scale 67,760 79,472 109,767 256,999
Large scale 56,000 88,700 94,500 239,200
Source: Ilala Municipal Council, 2013
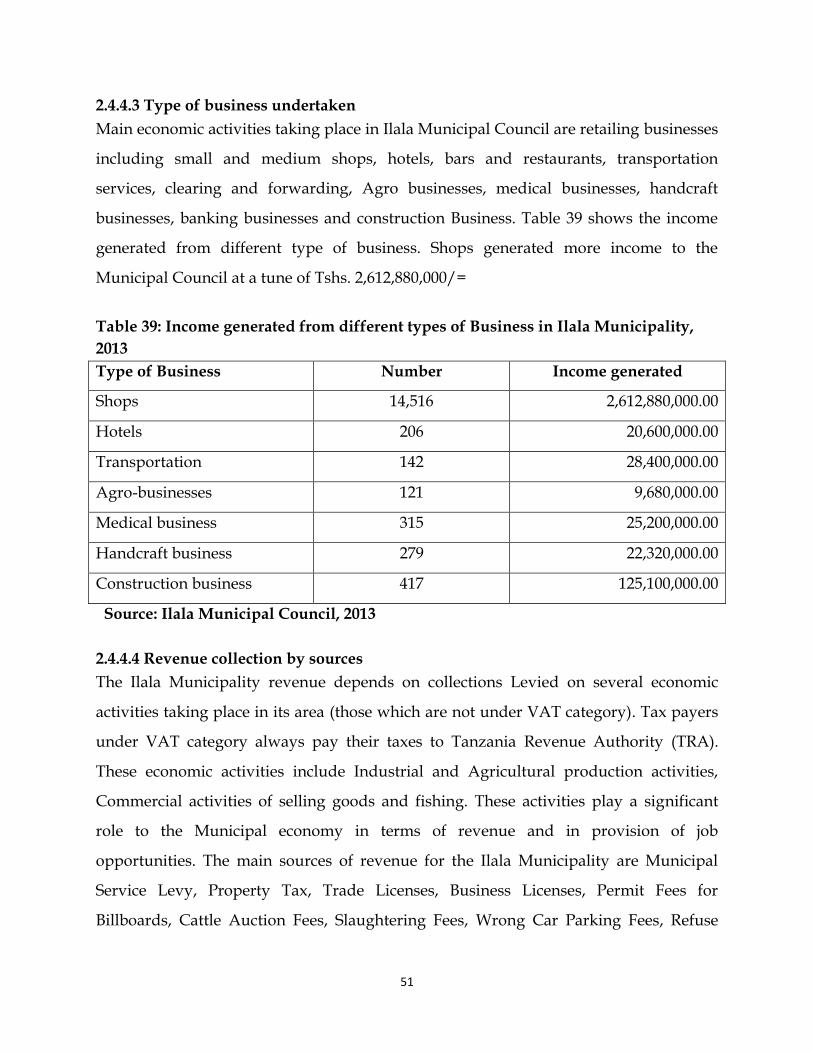
51
2.4.4.3 Type of business undertaken
Main economic activities taking place in Ilala Municipal Council are retailing businesses
including small and medium shops, hotels, bars and restaurants, transportation
services, clearing and forwarding, Agro businesses, medical businesses, handcraft
businesses, banking businesses and construction Business. Table 39 shows the income
generated from different type of business. Shops generated more income to the
Municipal Council at a tune of Tshs. 2,612,880,000/=
Table 39: Income generated from different types of Business in Ilala Municipality,
2013
Type of Business Number Income generated
Shops 14,516 2,612,880,000.00
Hotels 206 20,600,000.00
Transportation 142 28,400,000.00
Agro-businesses 121 9,680,000.00
Medical business 315 25,200,000.00
Handcraft business 279 22,320,000.00
Construction business 417 125,100,000.00
Source: Ilala Municipal Council, 2013
2.4.4.4 Revenue collection by sources
The Ilala Municipality revenue depends on collections Levied on several economic
activities taking place in its area (those which are not under VAT category). Tax payers
under VAT category always pay their taxes to Tanzania Revenue Authority (TRA).
These economic activities include Industrial and Agricultural production activities,
Commercial activities of selling goods and fishing. These activities play a significant
role to the Municipal economy in terms of revenue and in provision of job
opportunities. The main sources of revenue for the Ilala Municipality are Municipal
Service Levy, Property Tax, Trade Licenses, Business Licenses, Permit Fees for
Billboards, Cattle Auction Fees, Slaughtering Fees, Wrong Car Parking Fees, Refuse
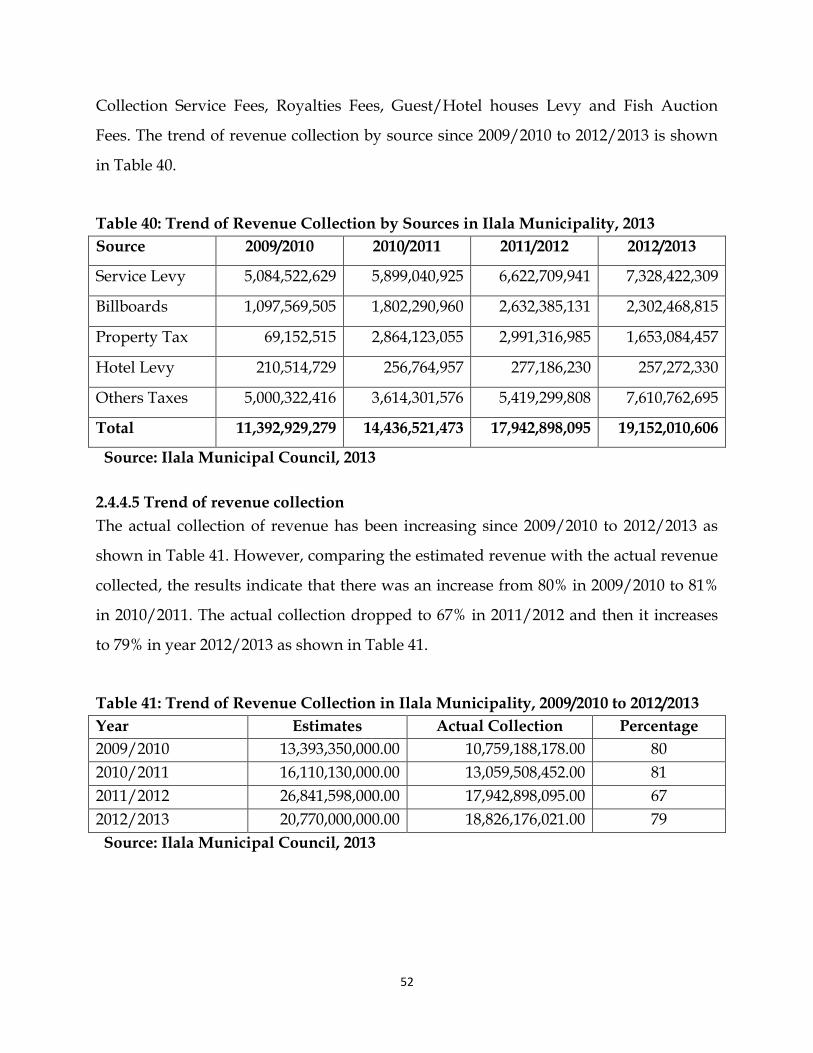
52
Collection Service Fees, Royalties Fees, Guest/Hotel houses Levy and Fish Auction
Fees. The trend of revenue collection by source since 2009/2010 to 2012/2013 is shown
in Table 40.
Table 40: Trend of Revenue Collection by Sources in Ilala Municipality, 2013
Source 2009/2010 2010/2011 2011/2012 2012/2013
Service Levy 5,084,522,629 5,899,040,925 6,622,709,941 7,328,422,309
Billboards 1,097,569,505 1,802,290,960 2,632,385,131 2,302,468,815
Property Tax 69,152,515 2,864,123,055 2,991,316,985 1,653,084,457
Hotel Levy 210,514,729 256,764,957 277,186,230 257,272,330
Others Taxes 5,000,322,416 3,614,301,576 5,419,299,808 7,610,762,695
Total 11,392,929,279 14,436,521,473 17,942,898,095 19,152,010,606
Source: Ilala Municipal Council, 2013
2.4.4.5 Trend of revenue collection
The actual collection of revenue has been increasing since 2009/2010 to 2012/2013 as
shown in Table 41. However, comparing the estimated revenue with the actual revenue
collected, the results indicate that there was an increase from 80% in 2009/2010 to 81%
in 2010/2011. The actual collection dropped to 67% in 2011/2012 and then it increases
to 79% in year 2012/2013 as shown in Table 41.
Table 41: Trend of Revenue Collection in Ilala Municipality, 2009/2010 to 2012/2013
Year Estimates Actual Collection Percentage
2009/2010 13,393,350,000.00 10,759,188,178.00 80
2010/2011 16,110,130,000.00 13,059,508,452.00 81
2011/2012 26,841,598,000.00 17,942,898,095.00 67
2012/2013 20,770,000,000.00 18,826,176,021.00 79
Source: Ilala Municipal Council, 2013
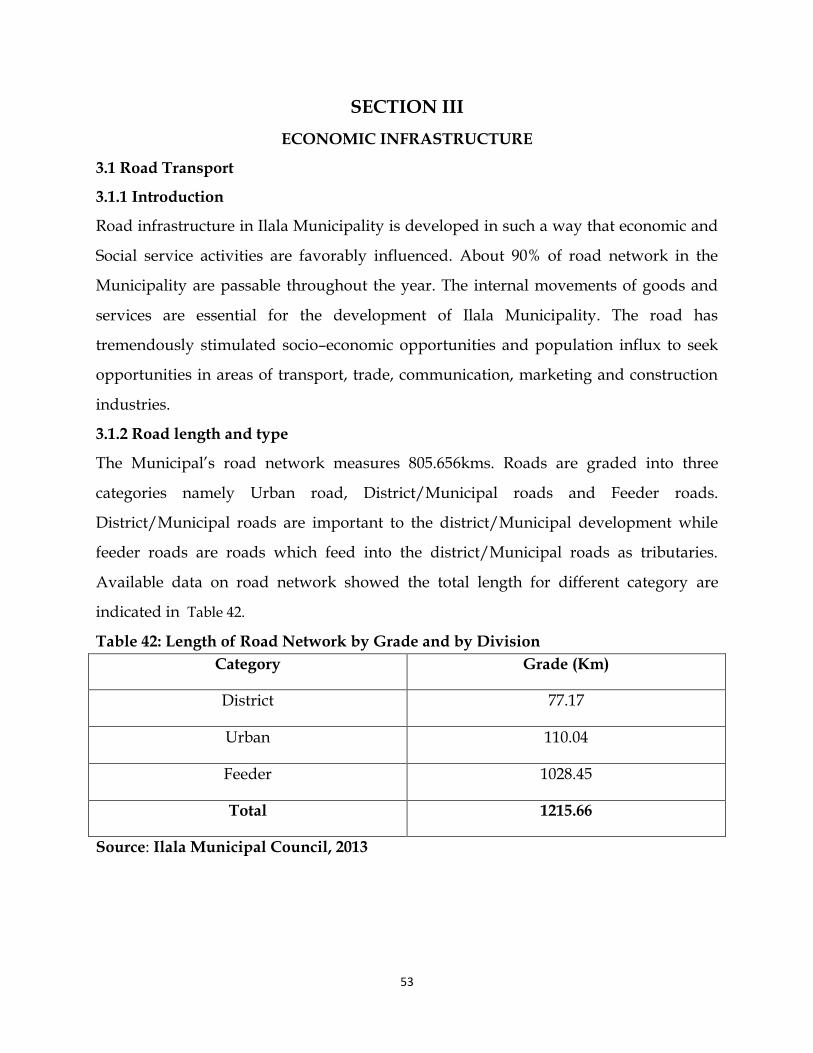
53
SECTION III
ECONOMIC INFRASTRUCTURE
3.1 Road Transport
3.1.1 Introduction
Road infrastructure in Ilala Municipality is developed in such a way that economic and
Social service activities are favorably influenced. About 90% of road network in the
Municipality are passable throughout the year. The internal movements of goods and
services are essential for the development of Ilala Municipality. The road has
tremendously stimulated socio–economic opportunities and population influx to seek
opportunities in areas of transport, trade, communication, marketing and construction
industries.
3.1.2 Road length and type
The Municipal’s road network measures 805.656kms. Roads are graded into three
categories namely Urban road, District/Municipal roads and Feeder roads.
District/Municipal roads are important to the district/Municipal development while
feeder roads are roads which feed into the district/Municipal roads as tributaries.
Available data on road network showed the total length for different category are
indicated in Table 42.
Table 42: Length of Road Network by Grade and by Division
Category Grade (Km)
District 77.17
Urban 110.04
Feeder 1028.45
Total 1215.66
Source: Ilala Municipal Council, 2013
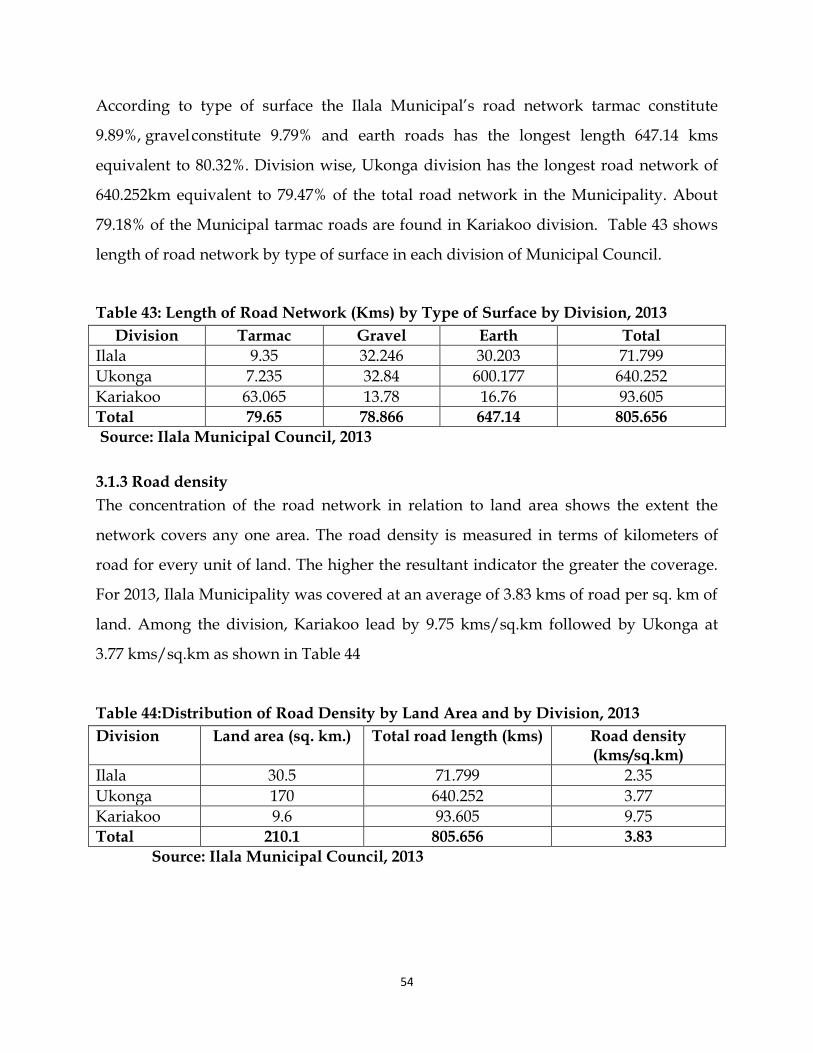
54
According to type of surface the Ilala Municipal’s road network tarmac constitute
9.89%, gravel constitute 9.79% and earth roads has the longest length 647.14 kms
equivalent to 80.32%. Division wise, Ukonga division has the longest road network of
640.252km equivalent to 79.47% of the total road network in the Municipality. About
79.18% of the Municipal tarmac roads are found in Kariakoo division. Table 43 shows
length of road network by type of surface in each division of Municipal Council.
Table 43: Length of Road Network (Kms) by Type of Surface by Division, 2013
Division Tarmac Gravel Earth Total
Ilala 9.35 32.246 30.203 71.799
Ukonga 7.235 32.84 600.177 640.252
Kariakoo 63.065 13.78 16.76 93.605 Total 79.65 78.866 647.14 805.656
Source: Ilala Municipal Council, 2013
3.1.3 Road density
The concentration of the road network in relation to land area shows the extent the
network covers any one area. The road density is measured in terms of kilometers of
road for every unit of land. The higher the resultant indicator the greater the coverage.
For 2013, Ilala Municipality was covered at an average of 3.83 kms of road per sq. km of
land. Among the division, Kariakoo lead by 9.75 kms/sq.km followed by Ukonga at
3.77 kms/sq.km as shown in Table 44
Table 44:Distribution of Road Density by Land Area and by Division, 2013
Division Land area (sq. km.) Total road length (kms) Road density (kms/sq.km)
Ilala 30.5 71.799 2.35
Ukonga 170 640.252 3.77
Kariakoo 9.6 93.605 9.75 Total 210.1 805.656 3.83
Source: Ilala Municipal Council, 2013
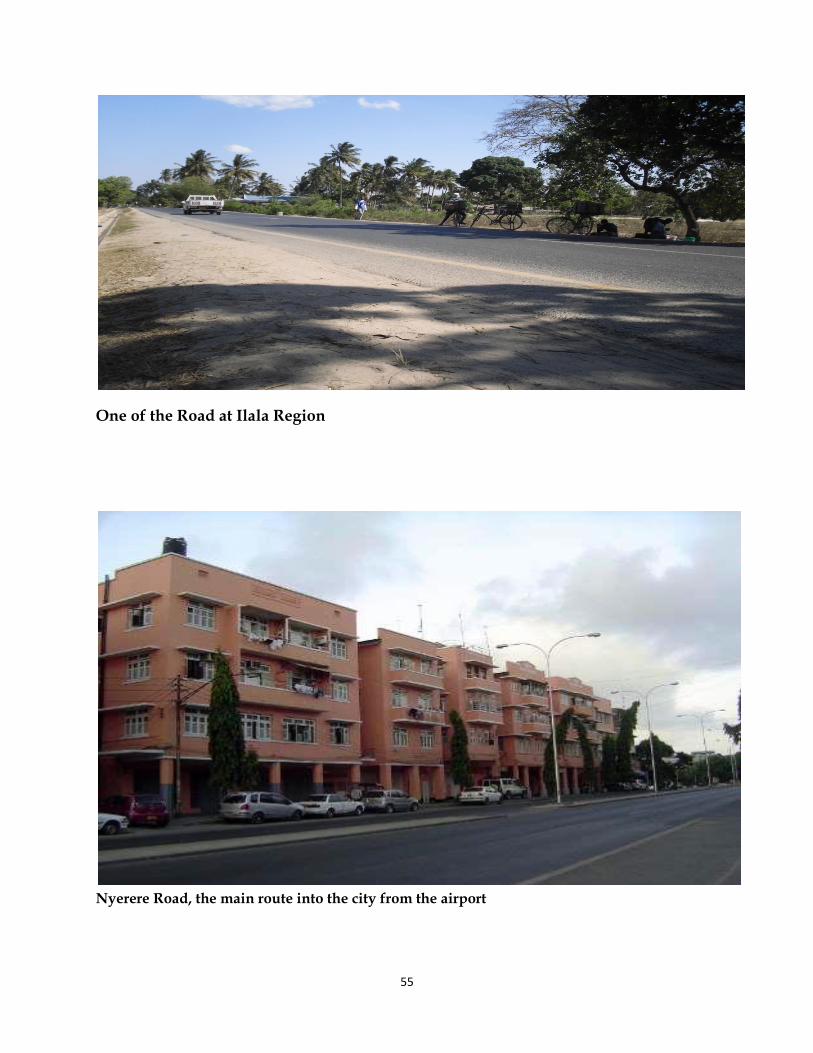
55
One of the Road at Ilala Region
Nyerere Road, the main route into the city from the airport

56
3.1.4 Public transport in Dar es Salaam
The public transport system mainly consists of buses called ‘daladala’. There are
approximately 7,000 registered and privately owned daladala in services with an
aggregate seating capacity of approximately 25-32 seats. The reliability, comfort and
safety of public transport services in Dar es Salaam are low. Considering the total urban
transport fleet size, the maximum daily passenger capacity is estimated to be 4.6 million
passenger trips per day. This is below the estimated demand of approximately 3.6
million passenger trips per day as it was in 2002.
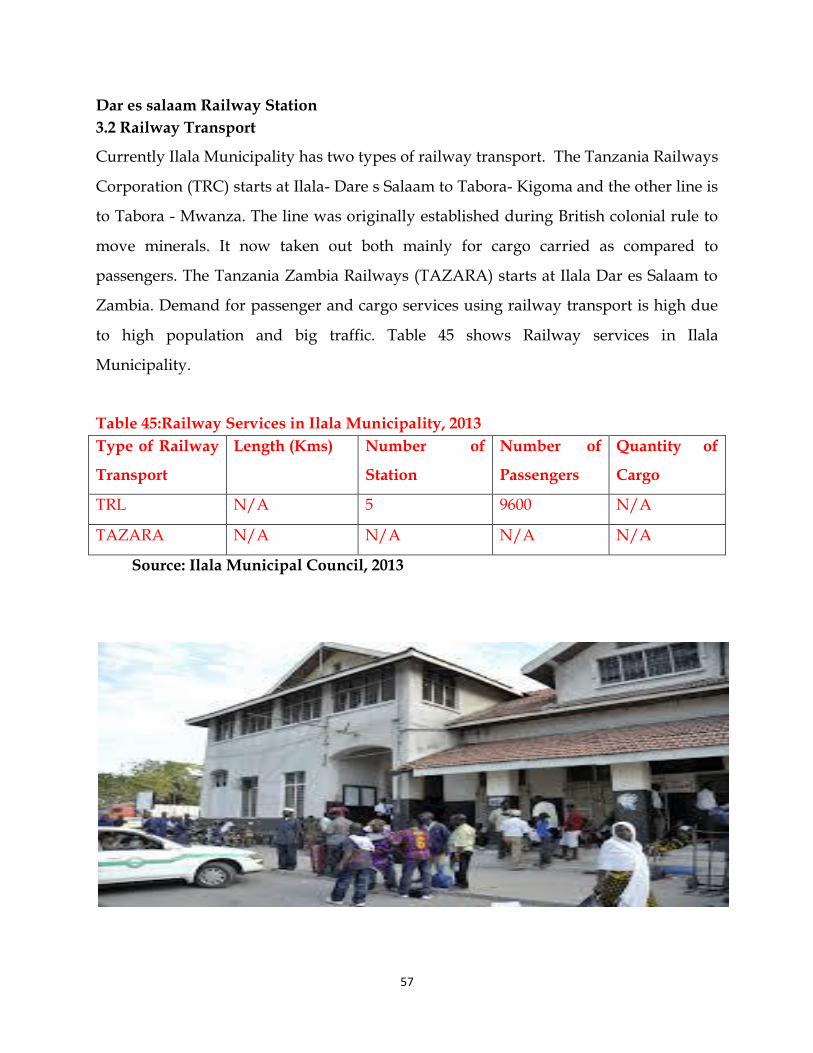
57
Dar es salaam Railway Station
3.2 Railway Transport
Currently Ilala Municipality has two types of railway transport. The Tanzania Railways
Corporation (TRC) starts at Ilala- Dare s Salaam to Tabora- Kigoma and the other line is
to Tabora - Mwanza. The line was originally established during British colonial rule to
move minerals. It now taken out both mainly for cargo carried as compared to
passengers. The Tanzania Zambia Railways (TAZARA) starts at Ilala Dar es Salaam to
Zambia. Demand for passenger and cargo services using railway transport is high due
to high population and big traffic. Table 45 shows Railway services in Ilala
Municipality.
Table 45:Railway Services in Ilala Municipality, 2013
Type of Railway
Transport
Length (Kms) Number of
Station
Number of
Passengers
Quantity of
Cargo
TRL N/A 5 9600 N/A
TAZARA N/A N/A N/A N/A
Source: Ilala Municipal Council, 2013
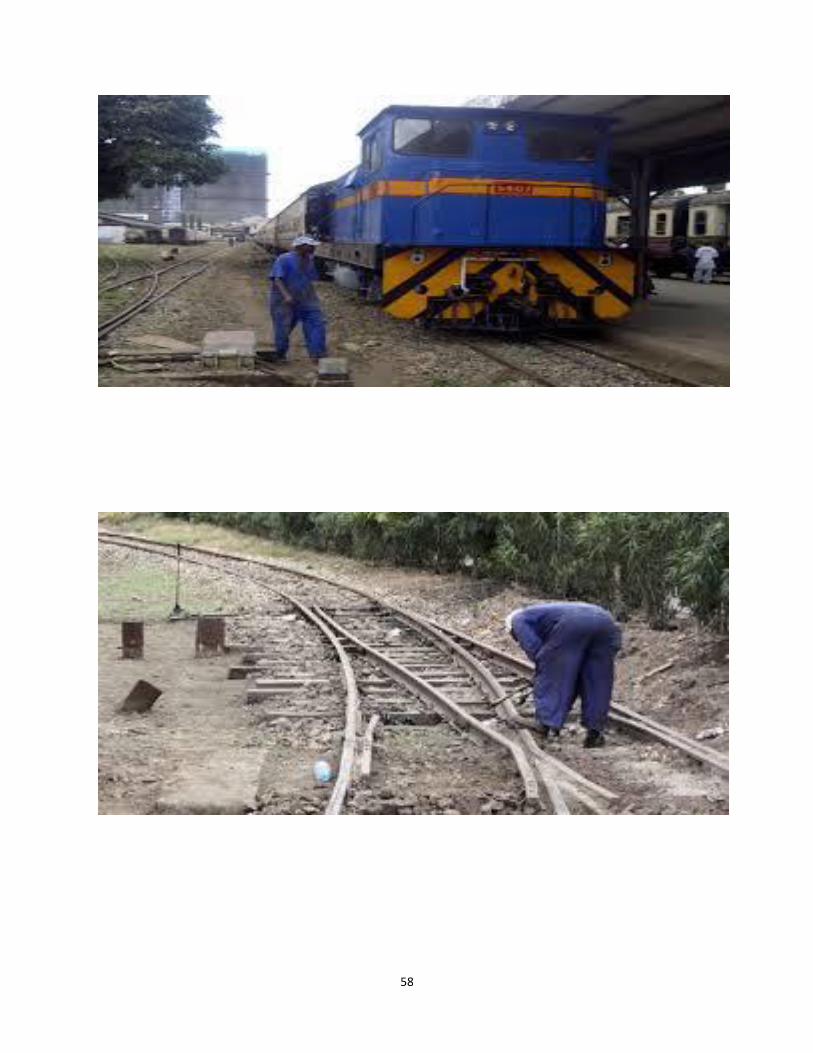
58
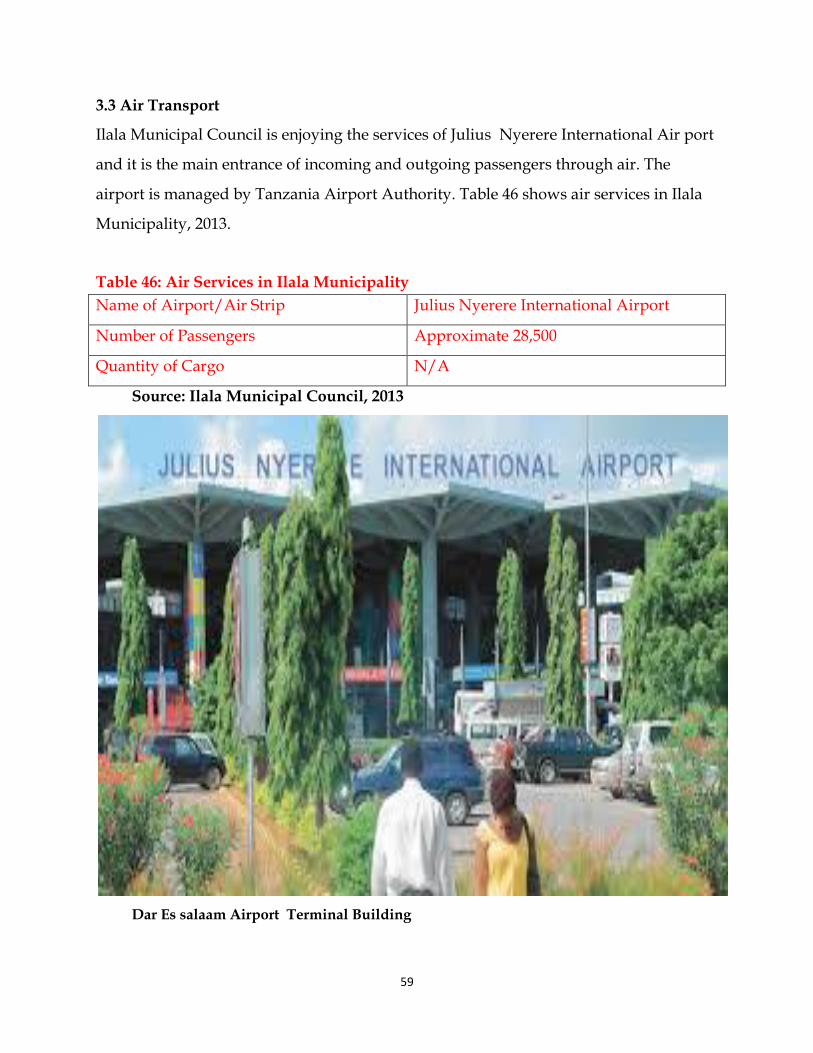
59
3.3 Air Transport
Ilala Municipal Council is enjoying the services of Julius Nyerere International Air port
and it is the main entrance of incoming and outgoing passengers through air. The
airport is managed by Tanzania Airport Authority. Table 46 shows air services in Ilala
Municipality, 2013.
Table 46: Air Services in Ilala Municipality
Name of Airport/Air Strip Julius Nyerere International Airport
Number of Passengers Approximate 28,500
Quantity of Cargo N/A
Source: Ilala Municipal Council, 2013
Dar Es salaam Airport Terminal Building
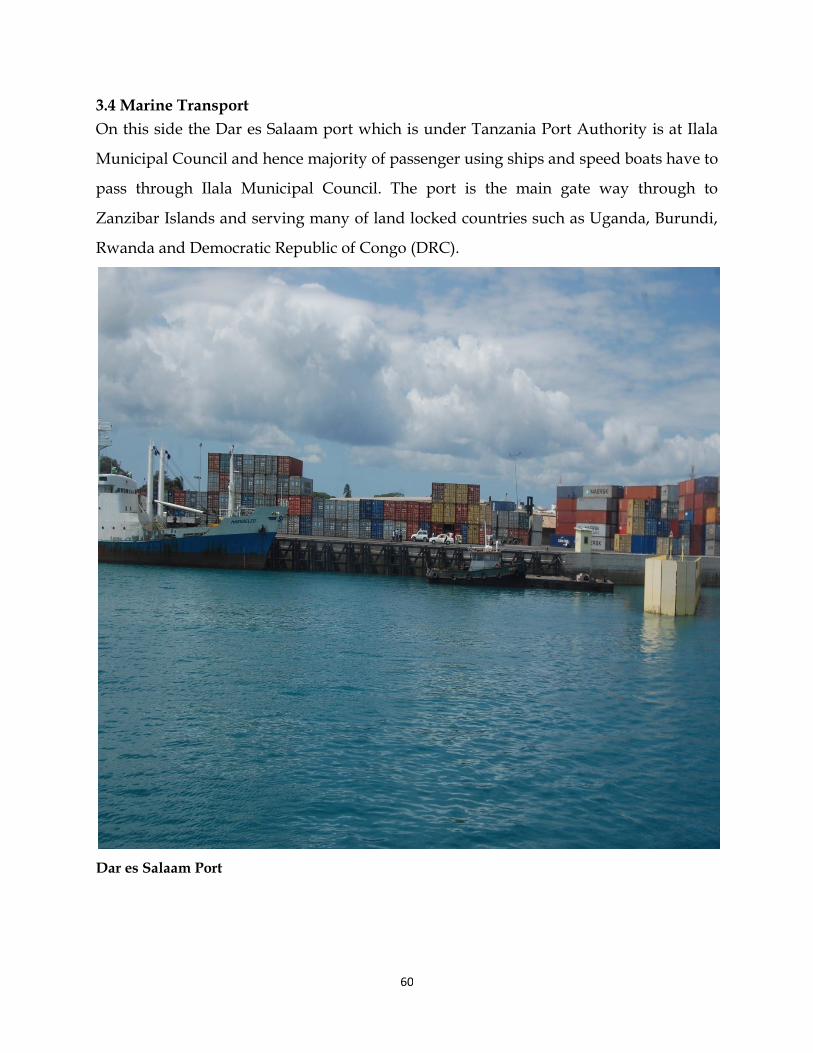
60
3.4 Marine Transport
On this side the Dar es Salaam port which is under Tanzania Port Authority is at Ilala
Municipal Council and hence majority of passenger using ships and speed boats have to
pass through Ilala Municipal Council. The port is the main gate way through to
Zanzibar Islands and serving many of land locked countries such as Uganda, Burundi,
Rwanda and Democratic Republic of Congo (DRC).
Dar es Salaam Port
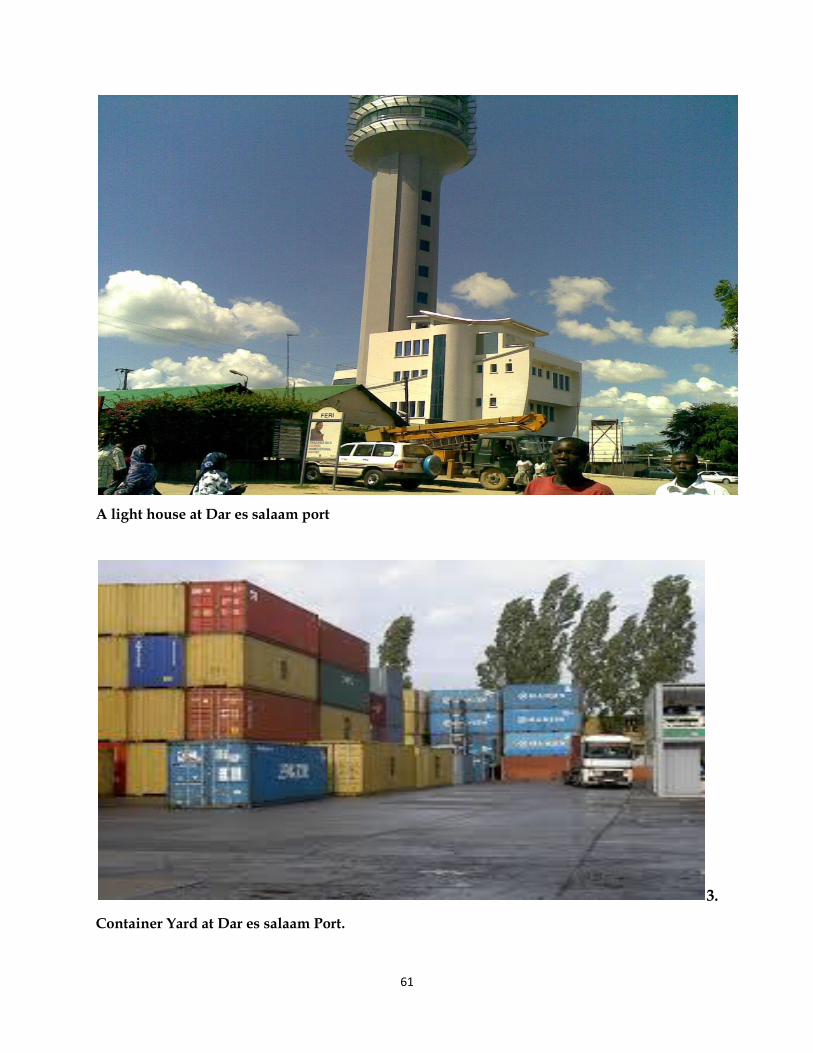
61
A light house at Dar es salaam port
3.
Container Yard at Dar es salaam Port.
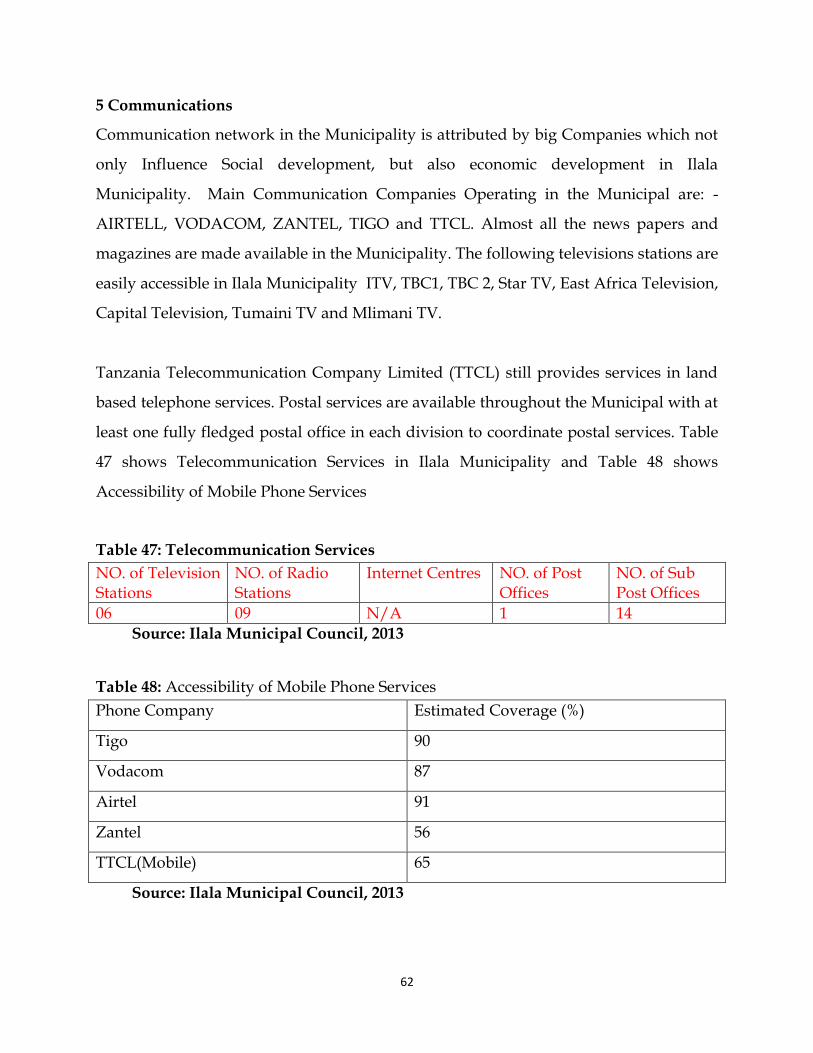
62
5 Communications
Communication network in the Municipality is attributed by big Companies which not
only Influence Social development, but also economic development in Ilala
Municipality. Main Communication Companies Operating in the Municipal are: -
AIRTELL, VODACOM, ZANTEL, TIGO and TTCL. Almost all the news papers and
magazines are made available in the Municipality. The following televisions stations are
easily accessible in Ilala Municipality ITV, TBC1, TBC 2, Star TV, East Africa Television,
Capital Television, Tumaini TV and Mlimani TV.
Tanzania Telecommunication Company Limited (TTCL) still provides services in land
based telephone services. Postal services are available throughout the Municipal with at
least one fully fledged postal office in each division to coordinate postal services. Table
47 shows Telecommunication Services in Ilala Municipality and Table 48 shows
Accessibility of Mobile Phone Services
Table 47: Telecommunication Services
NO. of Television Stations
NO. of Radio Stations
Internet Centres NO. of Post Offices
NO. of Sub Post Offices
06 09 N/A 1 14
Source: Ilala Municipal Council, 2013
Table 48: Accessibility of Mobile Phone Services
Phone Company Estimated Coverage (%)
Tigo 90
Vodacom 87
Airtel 91
Zantel 56
TTCL(Mobile) 65
Source: Ilala Municipal Council, 2013
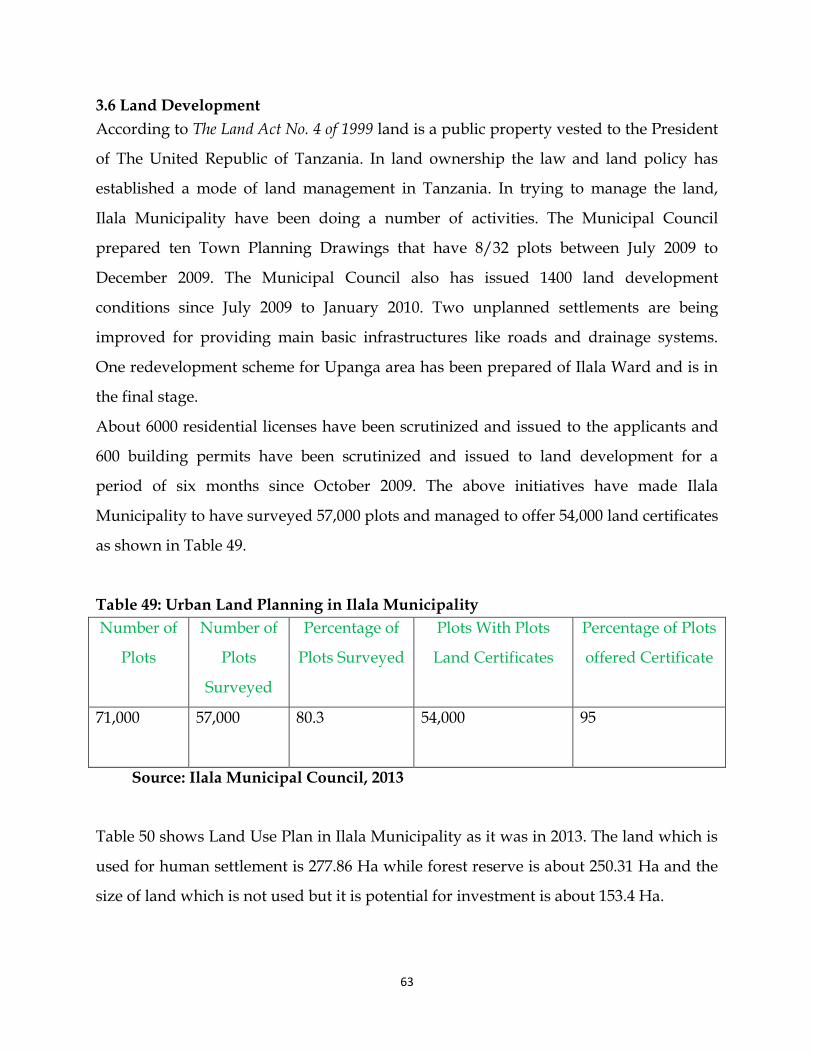
63
3.6 Land Development
According to The Land Act No. 4 of 1999 land is a public property vested to the President
of The United Republic of Tanzania. In land ownership the law and land policy has
established a mode of land management in Tanzania. In trying to manage the land,
Ilala Municipality have been doing a number of activities. The Municipal Council
prepared ten Town Planning Drawings that have 8/32 plots between July 2009 to
December 2009. The Municipal Council also has issued 1400 land development
conditions since July 2009 to January 2010. Two unplanned settlements are being
improved for providing main basic infrastructures like roads and drainage systems.
One redevelopment scheme for Upanga area has been prepared of Ilala Ward and is in
the final stage.
About 6000 residential licenses have been scrutinized and issued to the applicants and
600 building permits have been scrutinized and issued to land development for a
period of six months since October 2009. The above initiatives have made Ilala
Municipality to have surveyed 57,000 plots and managed to offer 54,000 land certificates
as shown in Table 49.
Table 49: Urban Land Planning in Ilala Municipality
Number of
Plots
Number of
Plots
Surveyed
Percentage of
Plots Surveyed
Plots With Plots
Land Certificates
Percentage of Plots
offered Certificate
71,000
57,000 80.3 54,000 95
Source: Ilala Municipal Council, 2013
Table 50 shows Land Use Plan in Ilala Municipality as it was in 2013. The land which is
used for human settlement is 277.86 Ha while forest reserve is about 250.31 Ha and the
size of land which is not used but it is potential for investment is about 153.4 Ha.
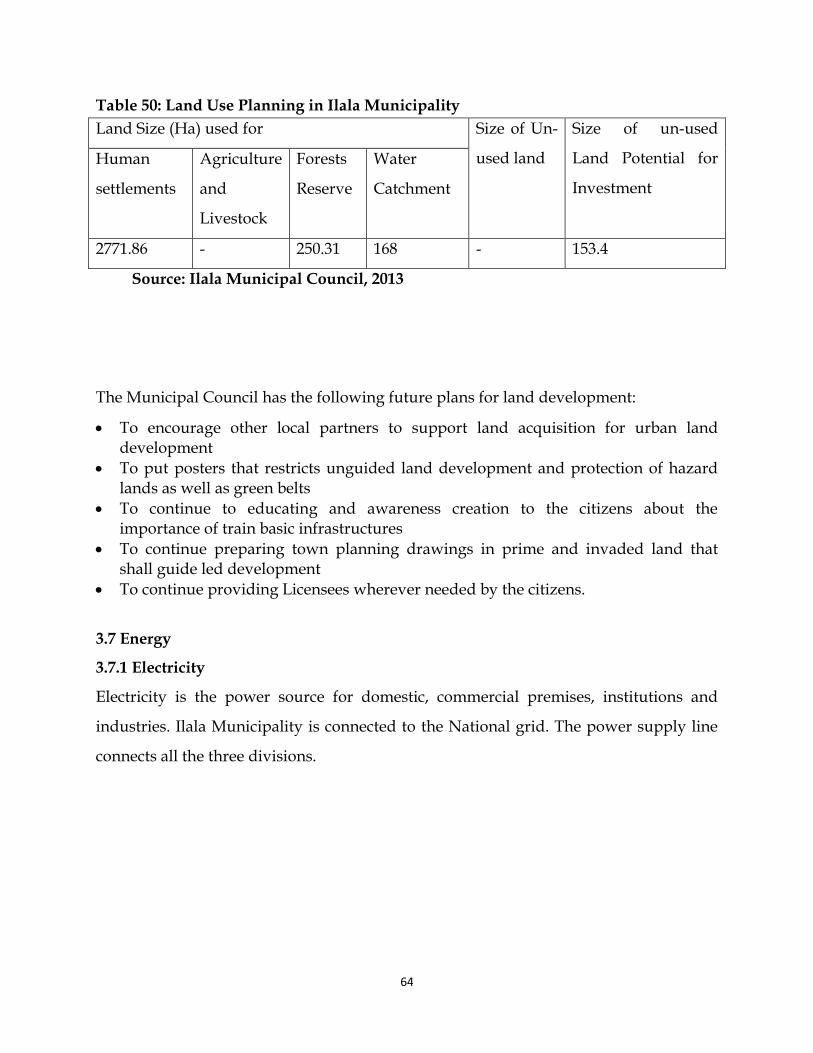
64
Table 50: Land Use Planning in Ilala Municipality
Land Size (Ha) used for Size of Un-
used land
Size of un-used
Land Potential for
Investment
Human
settlements
Agriculture
and
Livestock
Forests
Reserve
Water
Catchment
2771.86 - 250.31 168 - 153.4
Source: Ilala Municipal Council, 2013
The Municipal Council has the following future plans for land development:
To encourage other local partners to support land acquisition for urban land development
To put posters that restricts unguided land development and protection of hazard lands as well as green belts
To continue to educating and awareness creation to the citizens about the importance of train basic infrastructures
To continue preparing town planning drawings in prime and invaded land that shall guide led development
To continue providing Licensees wherever needed by the citizens.
3.7 Energy
3.7.1 Electricity
Electricity is the power source for domestic, commercial premises, institutions and
industries. Ilala Municipality is connected to the National grid. The power supply line
connects all the three divisions.
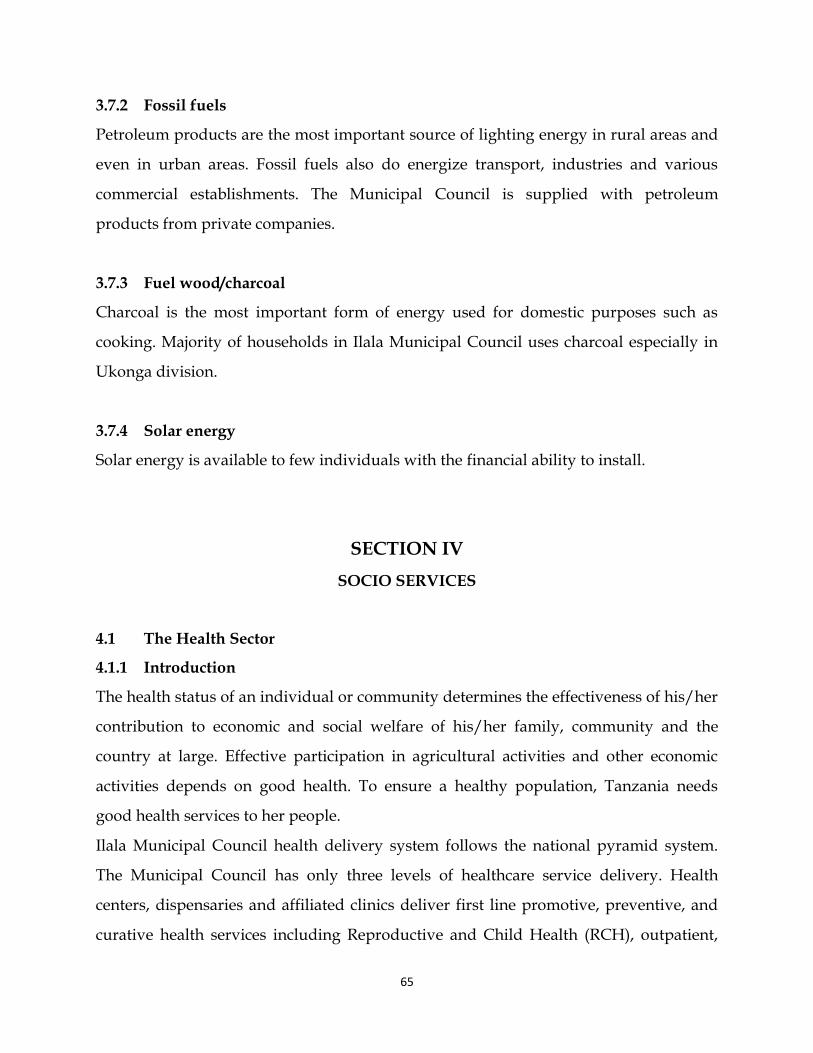
65
3.7.2 Fossil fuels
Petroleum products are the most important source of lighting energy in rural areas and
even in urban areas. Fossil fuels also do energize transport, industries and various
commercial establishments. The Municipal Council is supplied with petroleum
products from private companies.
3.7.3 Fuel wood/charcoal
Charcoal is the most important form of energy used for domestic purposes such as
cooking. Majority of households in Ilala Municipal Council uses charcoal especially in
Ukonga division.
3.7.4 Solar energy
Solar energy is available to few individuals with the financial ability to install.
SECTION IV
SOCIO SERVICES
4.1 The Health Sector
4.1.1 Introduction
The health status of an individual or community determines the effectiveness of his/her
contribution to economic and social welfare of his/her family, community and the
country at large. Effective participation in agricultural activities and other economic
activities depends on good health. To ensure a healthy population, Tanzania needs
good health services to her people.
Ilala Municipal Council health delivery system follows the national pyramid system.
The Municipal Council has only three levels of healthcare service delivery. Health
centers, dispensaries and affiliated clinics deliver first line promotive, preventive, and
curative health services including Reproductive and Child Health (RCH), outpatient,
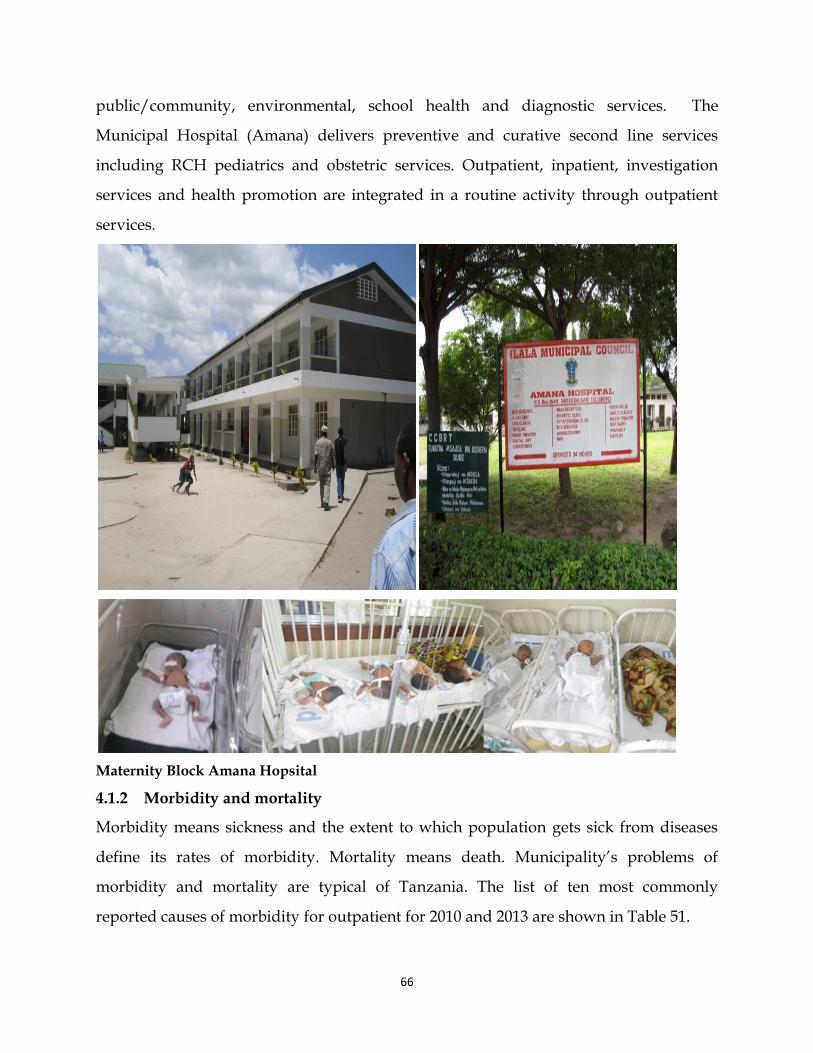
66
public/community, environmental, school health and diagnostic services. The
Municipal Hospital (Amana) delivers preventive and curative second line services
including RCH pediatrics and obstetric services. Outpatient, inpatient, investigation
services and health promotion are integrated in a routine activity through outpatient
services.
Maternity Block Amana Hopsital
4.1.2 Morbidity and mortality
Morbidity means sickness and the extent to which population gets sick from diseases
define its rates of morbidity. Mortality means death. Municipality’s problems of
morbidity and mortality are typical of Tanzania. The list of ten most commonly
reported causes of morbidity for outpatient for 2010 and 2013 are shown in Table 51.
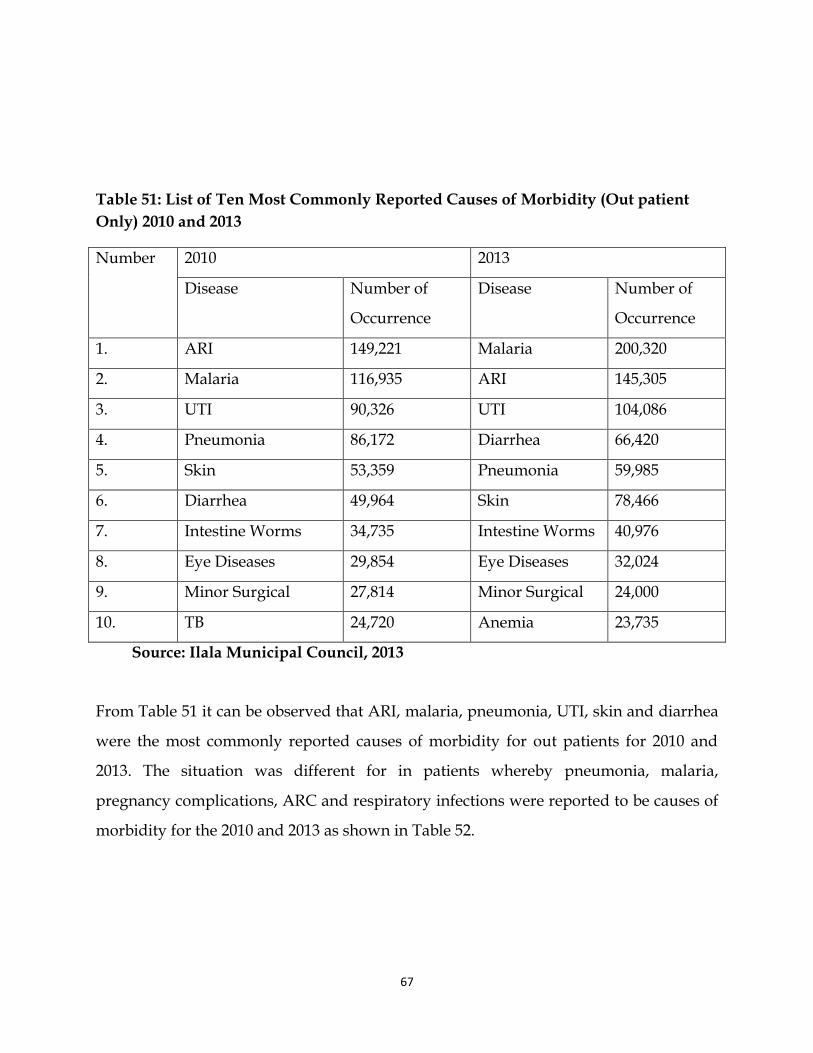
67
Table 51: List of Ten Most Commonly Reported Causes of Morbidity (Out patient
Only) 2010 and 2013
Number 2010 2013
Disease Number of
Occurrence
Disease Number of
Occurrence
1. ARI 149,221 Malaria 200,320
2. Malaria 116,935 ARI 145,305
3. UTI 90,326 UTI 104,086
4. Pneumonia 86,172 Diarrhea 66,420
5. Skin 53,359 Pneumonia 59,985
6. Diarrhea 49,964 Skin 78,466
7. Intestine Worms 34,735 Intestine Worms 40,976
8. Eye Diseases 29,854 Eye Diseases 32,024
9. Minor Surgical 27,814 Minor Surgical 24,000
10. TB 24,720 Anemia 23,735
Source: Ilala Municipal Council, 2013
From Table 51 it can be observed that ARI, malaria, pneumonia, UTI, skin and diarrhea
were the most commonly reported causes of morbidity for out patients for 2010 and
2013. The situation was different for in patients whereby pneumonia, malaria,
pregnancy complications, ARC and respiratory infections were reported to be causes of
morbidity for the 2010 and 2013 as shown in Table 52.
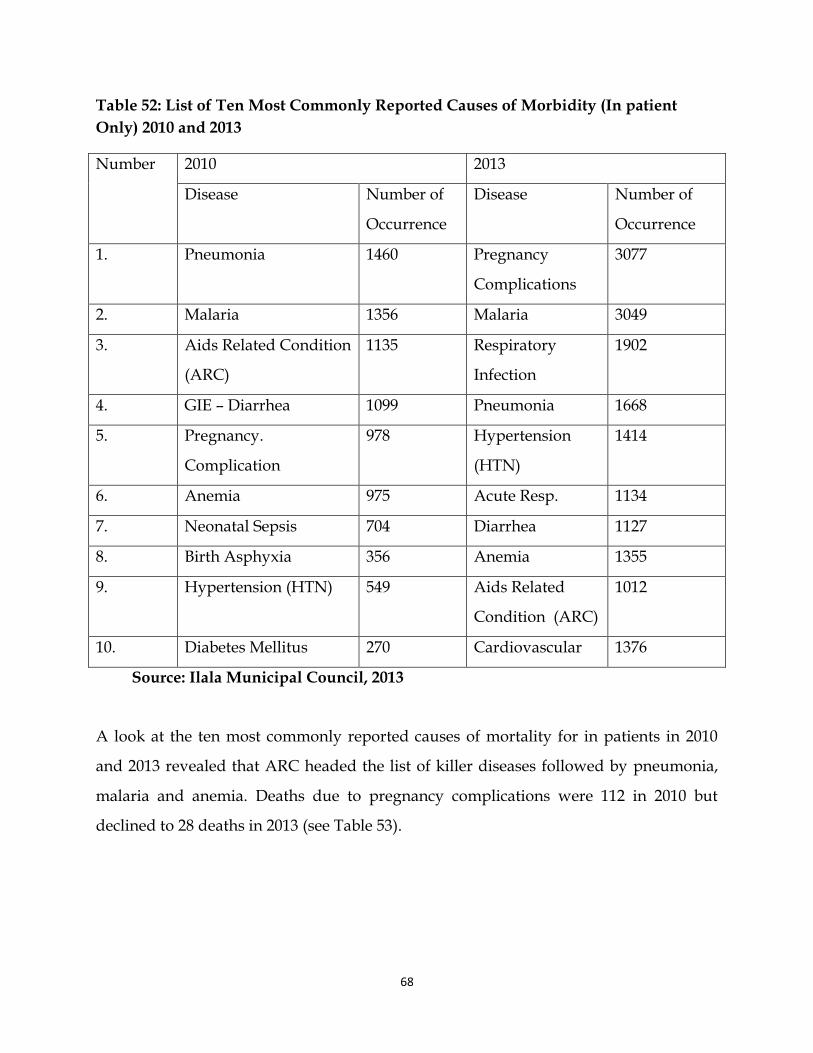
68
Table 52: List of Ten Most Commonly Reported Causes of Morbidity (In patient
Only) 2010 and 2013
Number 2010 2013
Disease Number of
Occurrence
Disease Number of
Occurrence
1. Pneumonia 1460 Pregnancy
Complications
3077
2. Malaria 1356 Malaria 3049
3. Aids Related Condition
(ARC)
1135 Respiratory
Infection
1902
4. GIE – Diarrhea 1099 Pneumonia 1668
5. Pregnancy.
Complication
978 Hypertension
(HTN)
1414
6. Anemia 975 Acute Resp. 1134
7. Neonatal Sepsis 704 Diarrhea 1127
8. Birth Asphyxia 356 Anemia 1355
9. Hypertension (HTN) 549 Aids Related
Condition (ARC)
1012
10. Diabetes Mellitus 270 Cardiovascular 1376
Source: Ilala Municipal Council, 2013
A look at the ten most commonly reported causes of mortality for in patients in 2010
and 2013 revealed that ARC headed the list of killer diseases followed by pneumonia,
malaria and anemia. Deaths due to pregnancy complications were 112 in 2010 but
declined to 28 deaths in 2013 (see Table 53).
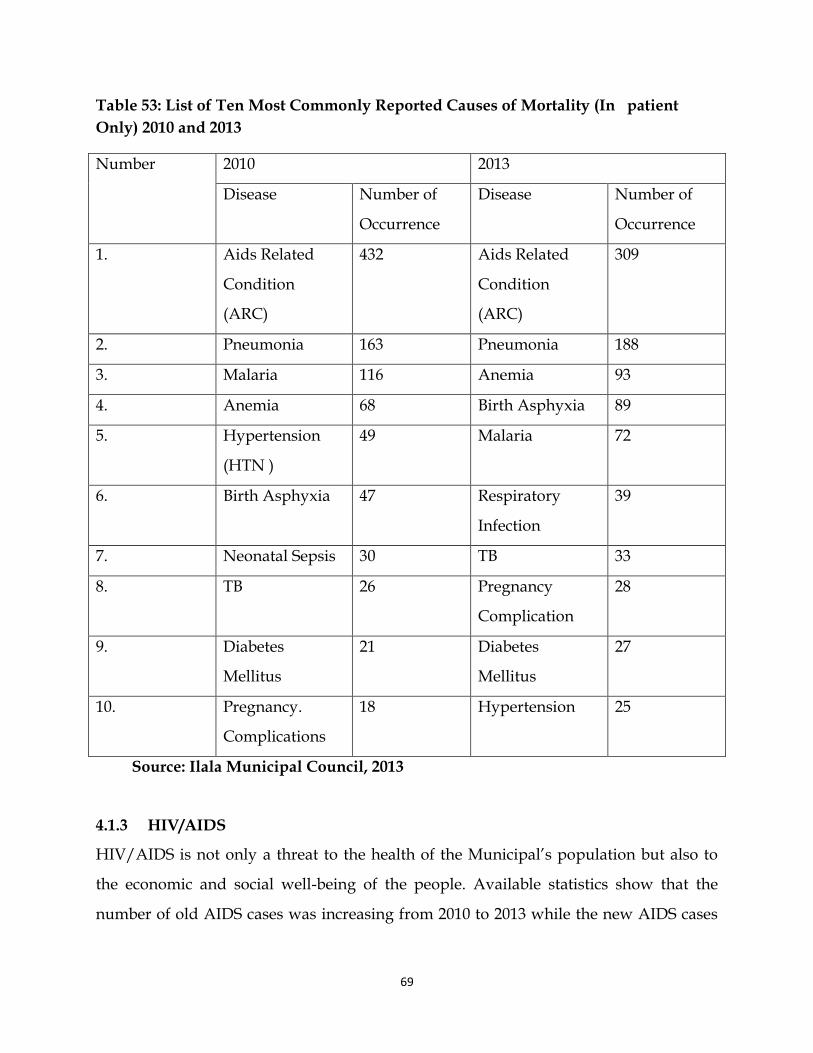
69
Table 53: List of Ten Most Commonly Reported Causes of Mortality (In patient
Only) 2010 and 2013
Number 2010 2013
Disease Number of
Occurrence
Disease Number of
Occurrence
1. Aids Related
Condition
(ARC)
432 Aids Related
Condition
(ARC)
309
2. Pneumonia 163 Pneumonia 188
3. Malaria 116 Anemia 93
4. Anemia 68 Birth Asphyxia 89
5. Hypertension
(HTN )
49 Malaria 72
6. Birth Asphyxia 47 Respiratory
Infection
39
7. Neonatal Sepsis 30 TB 33
8. TB 26 Pregnancy
Complication
28
9. Diabetes
Mellitus
21 Diabetes
Mellitus
27
10. Pregnancy.
Complications
18 Hypertension 25
Source: Ilala Municipal Council, 2013
4.1.3 HIV/AIDS
HIV/AIDS is not only a threat to the health of the Municipal’s population but also to
the economic and social well-being of the people. Available statistics show that the
number of old AIDS cases was increasing from 2010 to 2013 while the new AIDS cases
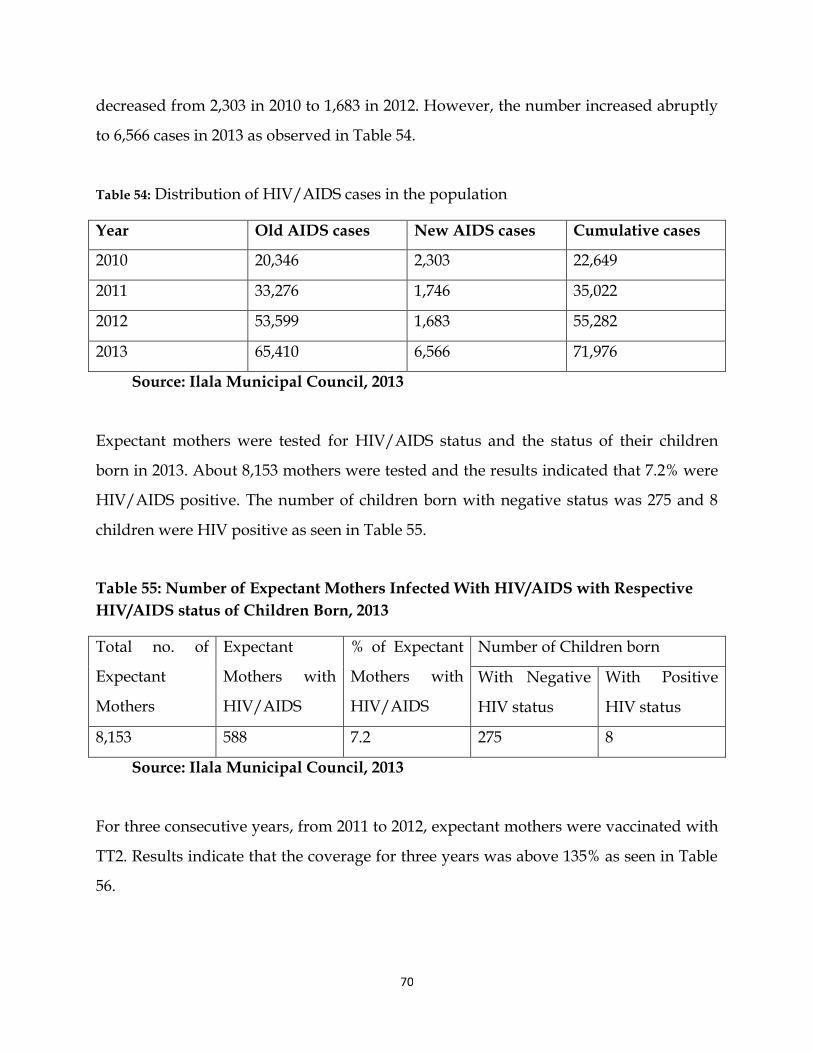
70
decreased from 2,303 in 2010 to 1,683 in 2012. However, the number increased abruptly
to 6,566 cases in 2013 as observed in Table 54.
Table 54: Distribution of HIV/AIDS cases in the population
Year Old AIDS cases New AIDS cases Cumulative cases
2010 20,346 2,303 22,649
2011 33,276 1,746 35,022
2012 53,599 1,683 55,282
2013 65,410 6,566 71,976
Source: Ilala Municipal Council, 2013
Expectant mothers were tested for HIV/AIDS status and the status of their children
born in 2013. About 8,153 mothers were tested and the results indicated that 7.2% were
HIV/AIDS positive. The number of children born with negative status was 275 and 8
children were HIV positive as seen in Table 55.
Table 55: Number of Expectant Mothers Infected With HIV/AIDS with Respective
HIV/AIDS status of Children Born, 2013
Total no. of
Expectant
Mothers
Expectant
Mothers with
HIV/AIDS
% of Expectant
Mothers with
HIV/AIDS
Number of Children born
With Negative
HIV status
With Positive
HIV status
8,153 588 7.2 275 8
Source: Ilala Municipal Council, 2013
For three consecutive years, from 2011 to 2012, expectant mothers were vaccinated with
TT2. Results indicate that the coverage for three years was above 135% as seen in Table
56.
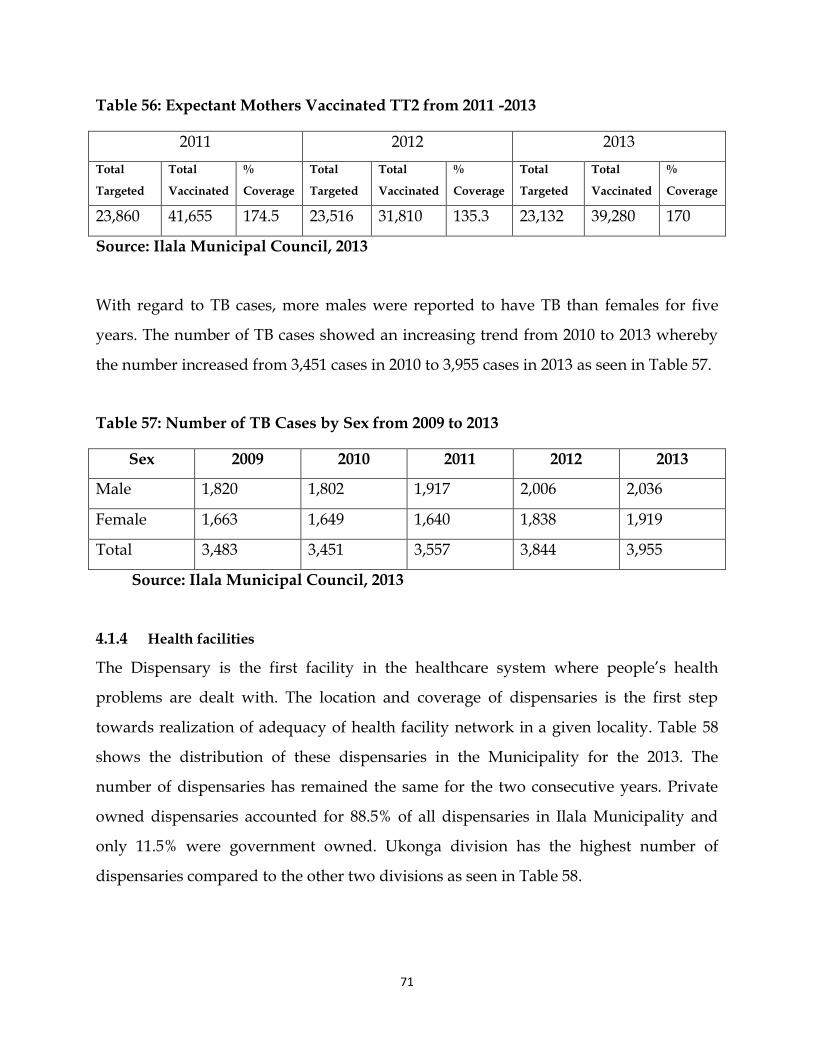
71
Table 56: Expectant Mothers Vaccinated TT2 from 2011 -2013
2011 2012 2013
Total
Targeted
Total
Vaccinated
%
Coverage
Total
Targeted
Total
Vaccinated
%
Coverage
Total
Targeted
Total
Vaccinated
%
Coverage
23,860 41,655 174.5 23,516 31,810 135.3 23,132 39,280 170
Source: Ilala Municipal Council, 2013
With regard to TB cases, more males were reported to have TB than females for five
years. The number of TB cases showed an increasing trend from 2010 to 2013 whereby
the number increased from 3,451 cases in 2010 to 3,955 cases in 2013 as seen in Table 57.
Table 57: Number of TB Cases by Sex from 2009 to 2013
Sex 2009 2010 2011 2012 2013
Male 1,820 1,802 1,917 2,006 2,036
Female 1,663 1,649 1,640 1,838 1,919
Total 3,483 3,451 3,557 3,844 3,955
Source: Ilala Municipal Council, 2013
4.1.4 Health facilities
The Dispensary is the first facility in the healthcare system where people’s health
problems are dealt with. The location and coverage of dispensaries is the first step
towards realization of adequacy of health facility network in a given locality. Table 58
shows the distribution of these dispensaries in the Municipality for the 2013. The
number of dispensaries has remained the same for the two consecutive years. Private
owned dispensaries accounted for 88.5% of all dispensaries in Ilala Municipality and
only 11.5% were government owned. Ukonga division has the highest number of
dispensaries compared to the other two divisions as seen in Table 58.
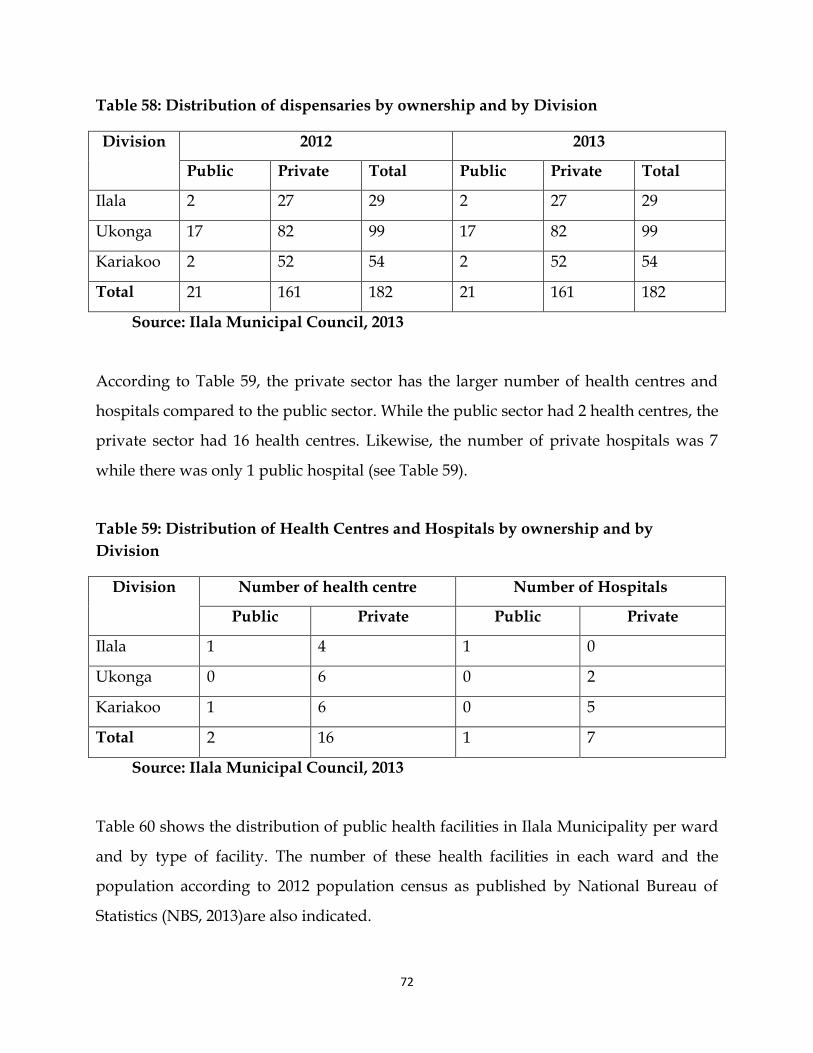
72
Table 58: Distribution of dispensaries by ownership and by Division
Division 2012 2013
Public Private Total Public Private Total
Ilala 2 27 29 2 27 29
Ukonga 17 82 99 17 82 99
Kariakoo 2 52 54 2 52 54
Total 21 161 182 21 161 182
Source: Ilala Municipal Council, 2013
According to Table 59, the private sector has the larger number of health centres and
hospitals compared to the public sector. While the public sector had 2 health centres, the
private sector had 16 health centres. Likewise, the number of private hospitals was 7
while there was only 1 public hospital (see Table 59).
Table 59: Distribution of Health Centres and Hospitals by ownership and by
Division
Division Number of health centre Number of Hospitals
Public Private Public Private
Ilala 1 4 1 0
Ukonga 0 6 0 2
Kariakoo 1 6 0 5
Total 2 16 1 7
Source: Ilala Municipal Council, 2013
Table 60 shows the distribution of public health facilities in Ilala Municipality per ward
and by type of facility. The number of these health facilities in each ward and the
population according to 2012 population census as published by National Bureau of
Statistics (NBS, 2013)are also indicated.
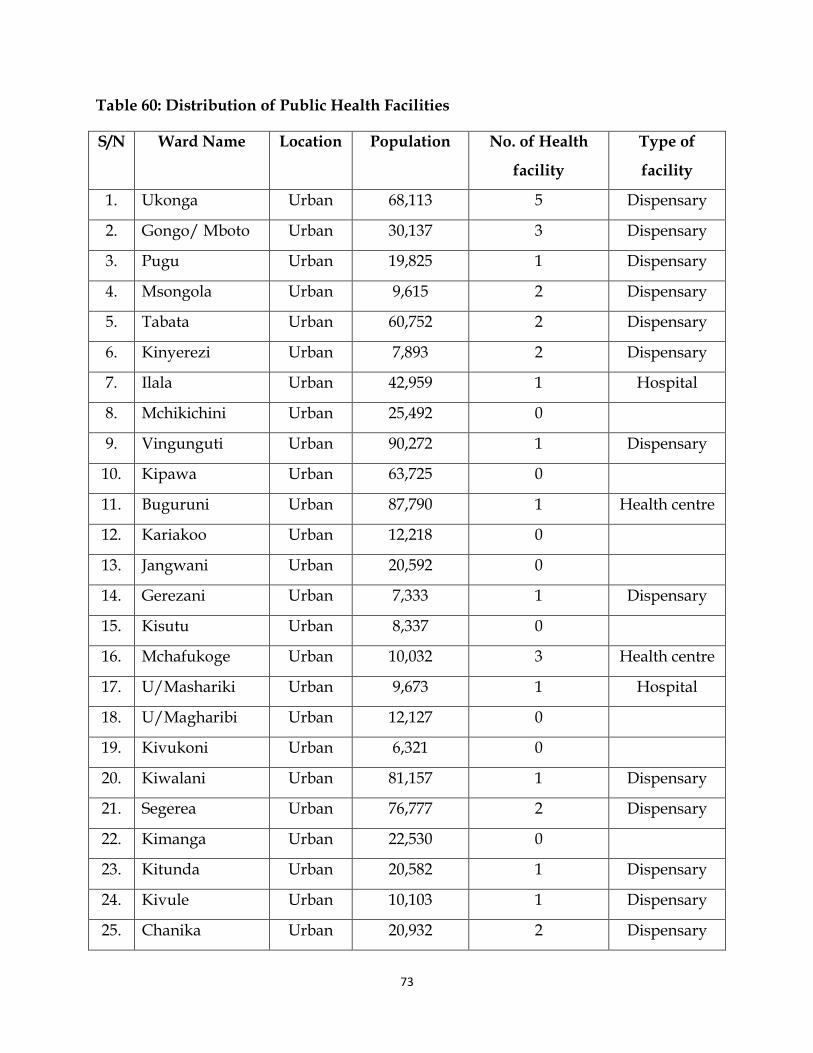
73
Table 60: Distribution of Public Health Facilities
S/N Ward Name Location Population No. of Health
facility
Type of
facility
1. Ukonga Urban 68,113 5 Dispensary
2. Gongo/ Mboto Urban 30,137 3 Dispensary
3. Pugu Urban 19,825 1 Dispensary
4. Msongola Urban 9,615 2 Dispensary
5. Tabata Urban 60,752 2 Dispensary
6. Kinyerezi Urban 7,893 2 Dispensary
7. Ilala Urban 42,959 1 Hospital
8. Mchikichini Urban 25,492 0
9. Vingunguti Urban 90,272 1 Dispensary
10. Kipawa Urban 63,725 0
11. Buguruni Urban 87,790 1 Health centre
12. Kariakoo Urban 12,218 0
13. Jangwani Urban 20,592 0
14. Gerezani Urban 7,333 1 Dispensary
15. Kisutu Urban 8,337 0
16. Mchafukoge Urban 10,032 3 Health centre
17. U/Mashariki Urban 9,673 1 Hospital
18. U/Magharibi Urban 12,127 0
19. Kivukoni Urban 6,321 0
20. Kiwalani Urban 81,157 1 Dispensary
21. Segerea Urban 76,777 2 Dispensary
22. Kimanga Urban 22,530 0
23. Kitunda Urban 20,582 1 Dispensary
24. Kivule Urban 10,103 1 Dispensary
25. Chanika Urban 20,932 2 Dispensary
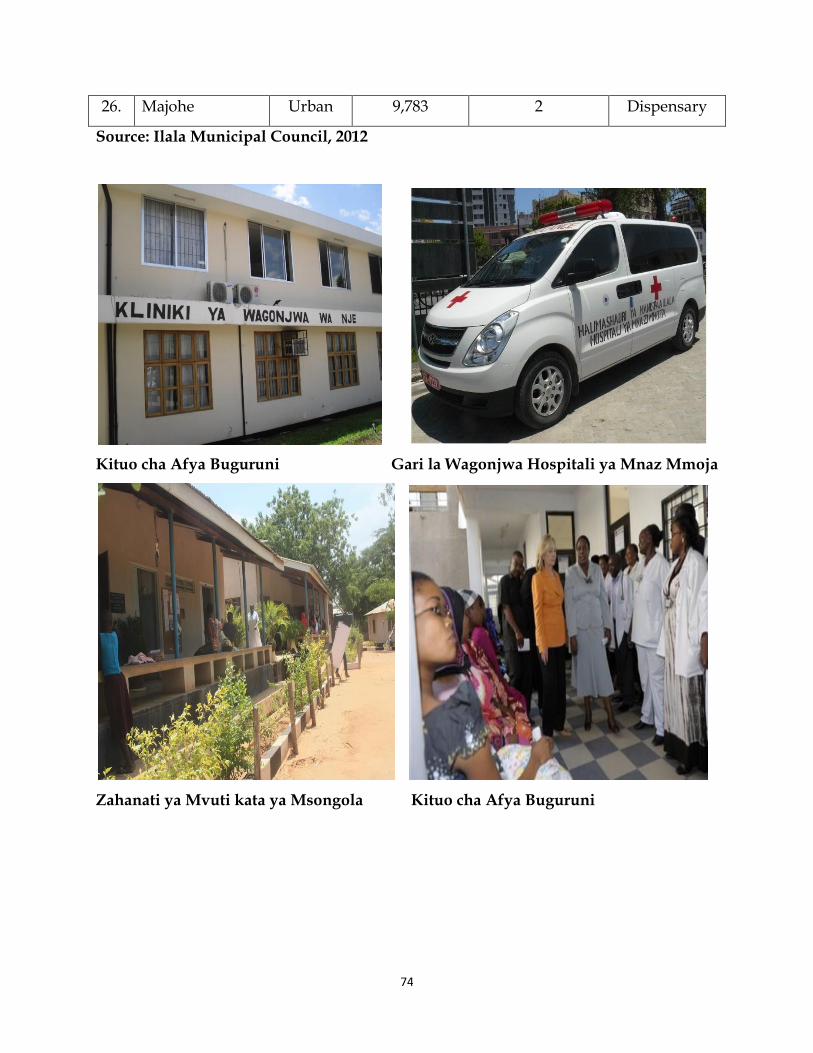
74
26. Majohe Urban 9,783 2 Dispensary
Source: Ilala Municipal Council, 2012
Kituo cha Afya Buguruni Gari la Wagonjwa Hospitali ya Mnaz Mmoja
Zahanati ya Mvuti kata ya Msongola Kituo cha Afya Buguruni
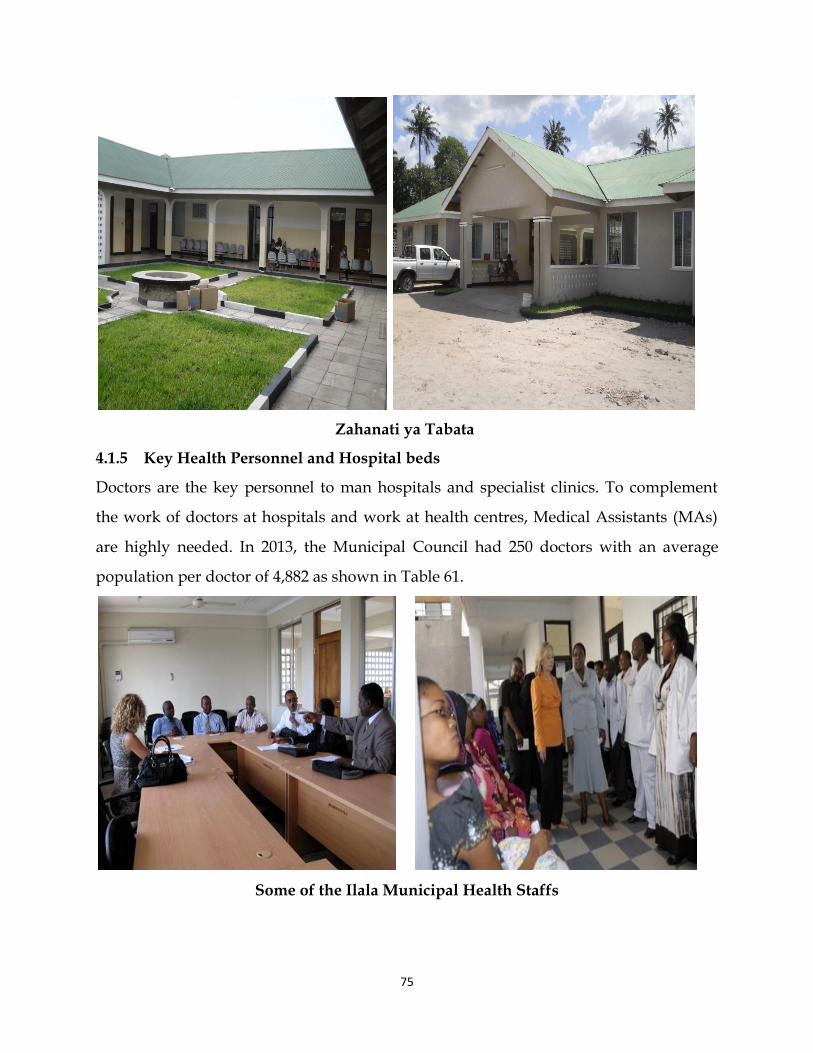
75
Zahanati ya Tabata
4.1.5 Key Health Personnel and Hospital beds
Doctors are the key personnel to man hospitals and specialist clinics. To complement
the work of doctors at hospitals and work at health centres, Medical Assistants (MAs)
are highly needed. In 2013, the Municipal Council had 250 doctors with an average
population per doctor of 4,882 as shown in Table 61.
Some of the Ilala Municipal Health Staffs
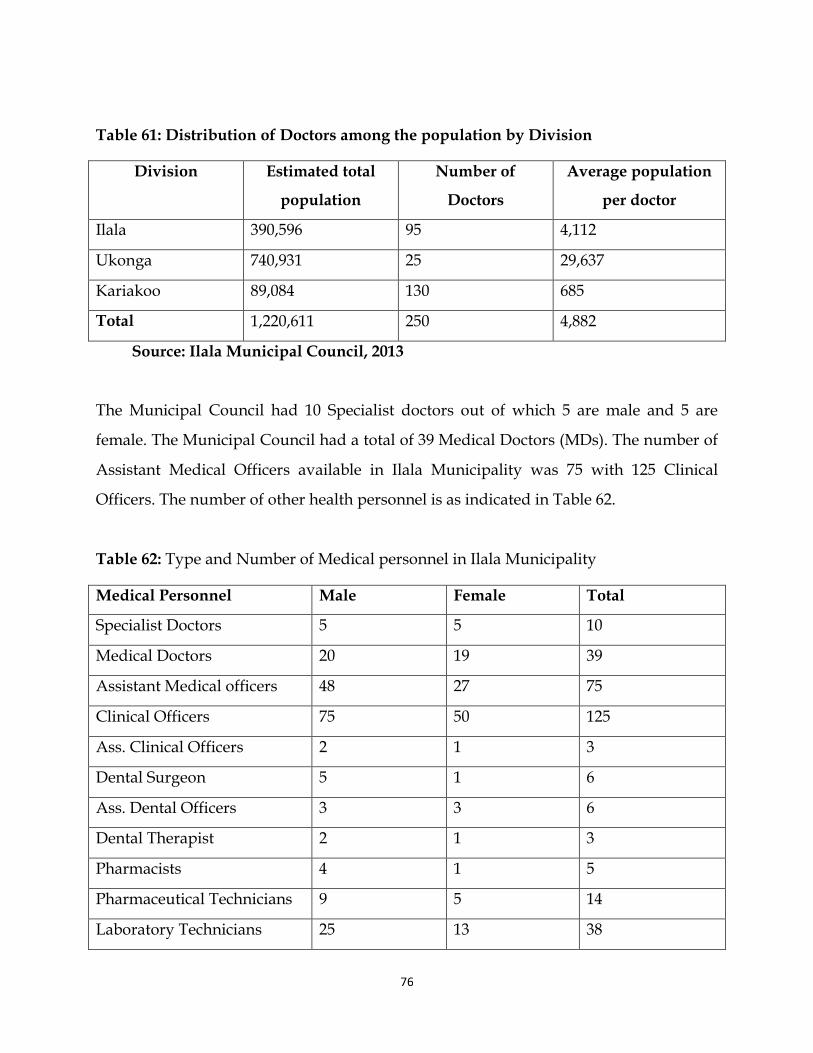
76
Table 61: Distribution of Doctors among the population by Division
Division Estimated total
population
Number of
Doctors
Average population
per doctor
Ilala 390,596 95 4,112
Ukonga 740,931 25 29,637
Kariakoo 89,084 130 685
Total 1,220,611 250 4,882
Source: Ilala Municipal Council, 2013
The Municipal Council had 10 Specialist doctors out of which 5 are male and 5 are
female. The Municipal Council had a total of 39 Medical Doctors (MDs). The number of
Assistant Medical Officers available in Ilala Municipality was 75 with 125 Clinical
Officers. The number of other health personnel is as indicated in Table 62.
Table 62: Type and Number of Medical personnel in Ilala Municipality
Medical Personnel Male Female Total
Specialist Doctors 5 5 10
Medical Doctors 20 19 39
Assistant Medical officers 48 27 75
Clinical Officers 75 50 125
Ass. Clinical Officers 2 1 3
Dental Surgeon 5 1 6
Ass. Dental Officers 3 3 6
Dental Therapist 2 1 3
Pharmacists 4 1 5
Pharmaceutical Technicians 9 5 14
Laboratory Technicians 25 13 38
77
Laboratory Ass. 3 9 12
Radiologist 1 0 1
Radiographer 3 4 7
Nursing Officers 3 24 27
Trained Nurse/NM/PHN 8 627 635
Medical Attendants 10 160 170
Health Officers 10 7 17
Health Ass. 42 21 63
Health Secretaries 1 5 6
Other Medical Carders 18 23 41
Source: Ilala Municipal Council, 2013
The coverage of hospital and health centre beds in Ilala Municipality was 2,034 people
per bed. Division wise, Ilala division had 350 beds with an average of 1,116 people per
bed. Ukonga division was disadvantaged reflecting the doctor coverage situation as
observed in Table 63.
Table 63: Distribution of hospital and health centres beds in the population by
Division, 2013
Division Estimated population
Number of beds Average population per bed
Ilala 390,596 350 1,116
Ukonga 740,931 100 7,409
Kariakoo 89,084 150 594
Total 1,220,611 600 2,034
Source: Ilala Municipal Council, 2013
4.1.6 Child nutrition
78
Nutrition-wise, children are at their most vulnerable stage at age of less than one year.
Malnutrition in young children is recognized as a symptom of imbalanced in children’s
food intake. The measles vaccination is earliest at 9 months. Hence, the weight of a child
at this time is a measure not only of the capacity of the family to feed the child correctly
but also of the effectiveness of the child health education given to mothers regarding
the development of their children. Table 64 shows the distribution of children under
one year who were under-weight at the time of their measles vaccination by division.
No child was found to be moderately underweight and severely underweight.
Table 64: Distribution of children under one year who were underweight at the time of
the measles vaccination by Division
Division Total number
weighed
Moderately
underweight
Severely
underweight
Ilala 9,210 0 0
Ukonga 9,740 0 0
Kariakoo 9,339 0 0
Total 28,289 0 0
Source: Ilala Municipal Council, 2013
4.1.7 Immunizations of children
Children are most at risk during the first month followed by first six months and then
during the first five years. The target group for vaccination against the six immunisable
childhood diseases is the under one year group. The most likely childhood diseases
which children may suffer are Tuberculosis, Diphtheria, Petusis, Tetanus, Polio and
Measles. These diseases are preventable by vaccination. Table 65 shows the distribution
of vaccinations with BCG of children under one year by Division.
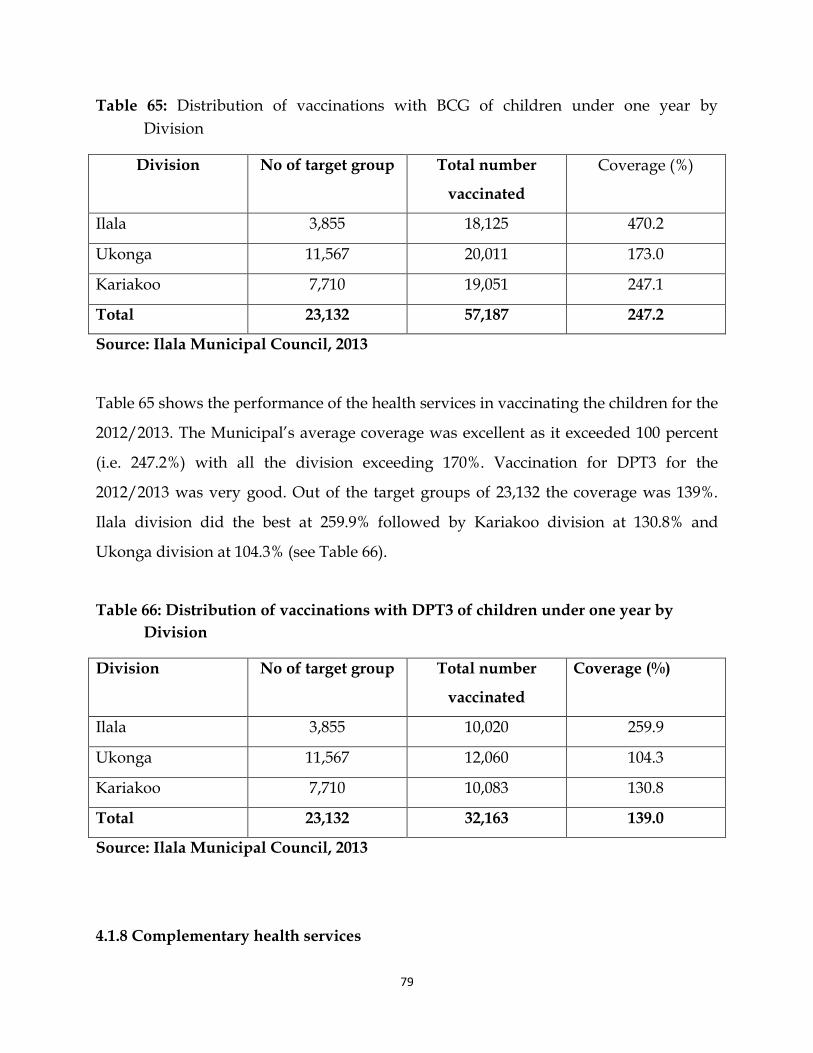
79
Table 65: Distribution of vaccinations with BCG of children under one year by
Division
Division No of target group Total number
vaccinated
Coverage (%)
Ilala 3,855 18,125 470.2
Ukonga 11,567 20,011 173.0
Kariakoo 7,710 19,051 247.1
Total 23,132 57,187 247.2
Source: Ilala Municipal Council, 2013
Table 65 shows the performance of the health services in vaccinating the children for the
2012/2013. The Municipal’s average coverage was excellent as it exceeded 100 percent
(i.e. 247.2%) with all the division exceeding 170%. Vaccination for DPT3 for the
2012/2013 was very good. Out of the target groups of 23,132 the coverage was 139%.
Ilala division did the best at 259.9% followed by Kariakoo division at 130.8% and
Ukonga division at 104.3% (see Table 66).
Table 66: Distribution of vaccinations with DPT3 of children under one year by
Division
Division No of target group Total number
vaccinated
Coverage (%)
Ilala 3,855 10,020 259.9
Ukonga 11,567 12,060 104.3
Kariakoo 7,710 10,083 130.8
Total 23,132 32,163 139.0
Source: Ilala Municipal Council, 2013
4.1.8 Complementary health services
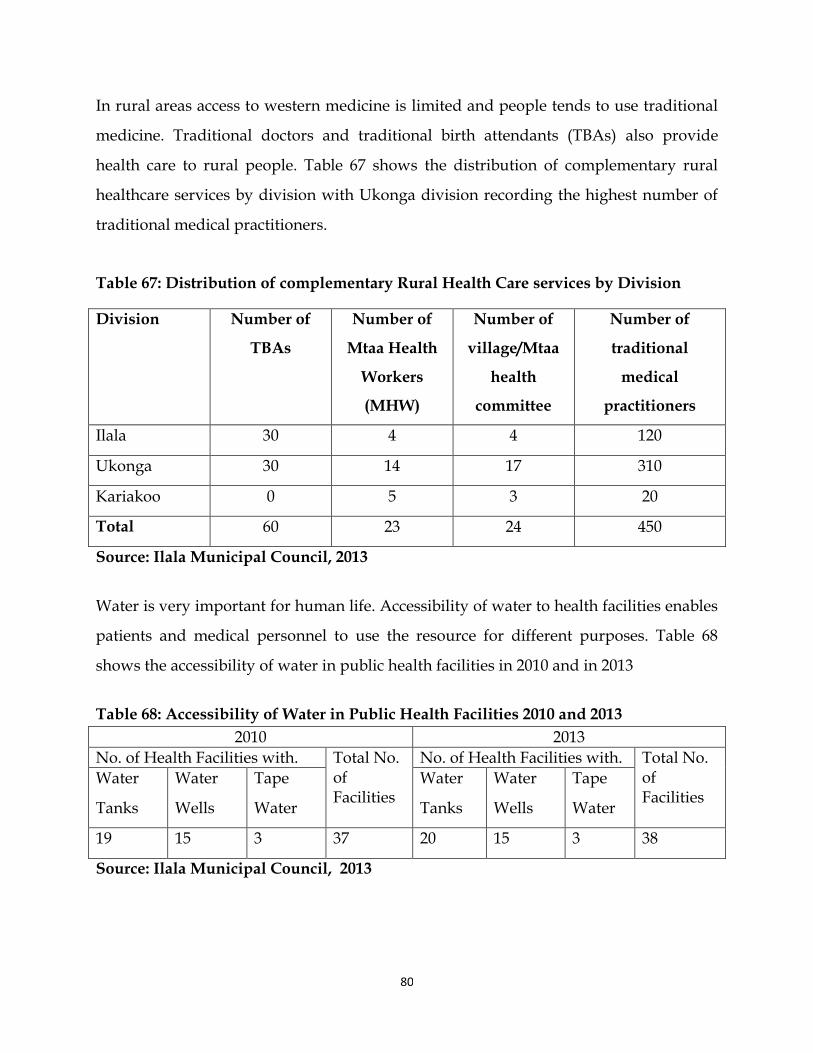
80
In rural areas access to western medicine is limited and people tends to use traditional
medicine. Traditional doctors and traditional birth attendants (TBAs) also provide
health care to rural people. Table 67 shows the distribution of complementary rural
healthcare services by division with Ukonga division recording the highest number of
traditional medical practitioners.
Table 67: Distribution of complementary Rural Health Care services by Division
Division Number of
TBAs
Number of
Mtaa Health
Workers
(MHW)
Number of
village/Mtaa
health
committee
Number of
traditional
medical
practitioners
Ilala 30 4 4 120
Ukonga 30 14 17 310
Kariakoo 0 5 3 20
Total 60 23 24 450
Source: Ilala Municipal Council, 2013
Water is very important for human life. Accessibility of water to health facilities enables
patients and medical personnel to use the resource for different purposes. Table 68
shows the accessibility of water in public health facilities in 2010 and in 2013
Table 68: Accessibility of Water in Public Health Facilities 2010 and 2013
2010 2013
No. of Health Facilities with. Total No. of Facilities
No. of Health Facilities with. Total No. of Facilities
Water
Tanks
Water
Wells
Tape
Water
Water
Tanks
Water
Wells
Tape
Water
19 15 3 37 20 15 3 38
Source: Ilala Municipal Council, 2013
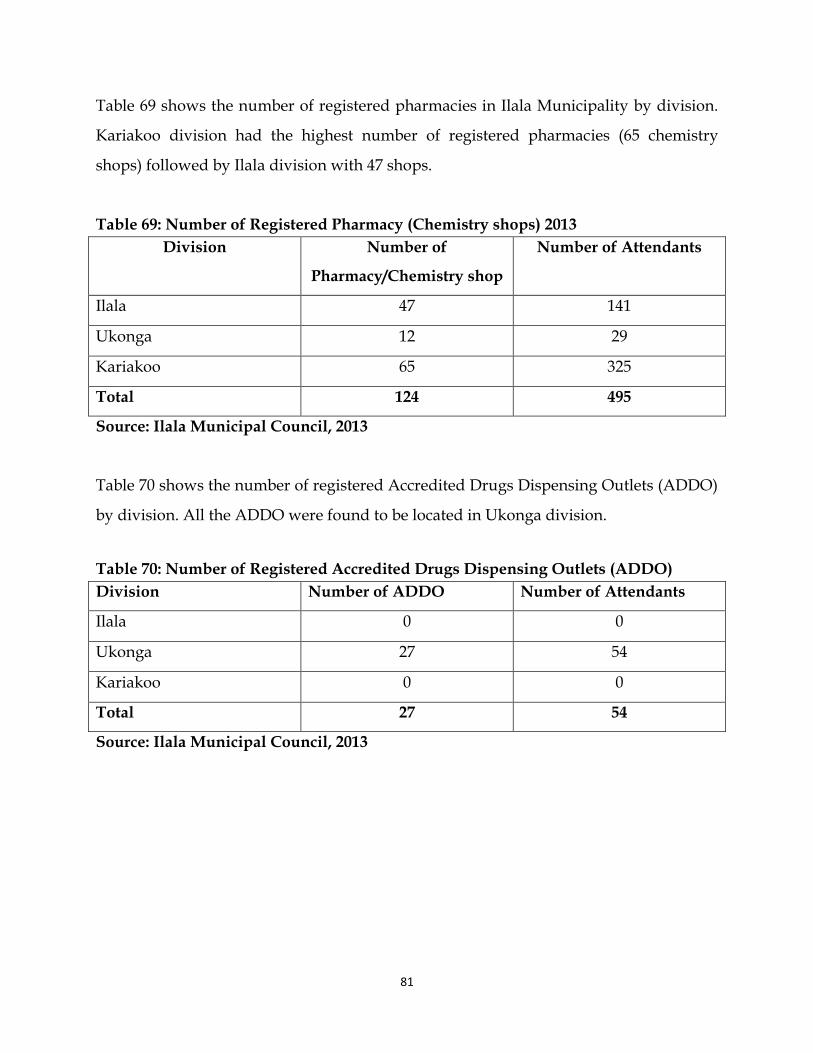
81
Table 69 shows the number of registered pharmacies in Ilala Municipality by division.
Kariakoo division had the highest number of registered pharmacies (65 chemistry
shops) followed by Ilala division with 47 shops.
Table 69: Number of Registered Pharmacy (Chemistry shops) 2013
Division Number of
Pharmacy/Chemistry shop
Number of Attendants
Ilala 47 141
Ukonga 12 29
Kariakoo 65 325
Total 124 495
Source: Ilala Municipal Council, 2013
Table 70 shows the number of registered Accredited Drugs Dispensing Outlets (ADDO)
by division. All the ADDO were found to be located in Ukonga division.
Table 70: Number of Registered Accredited Drugs Dispensing Outlets (ADDO)
Division Number of ADDO Number of Attendants
Ilala 0 0
Ukonga 27 54
Kariakoo 0 0
Total 27 54
Source: Ilala Municipal Council, 2013
82
4.2 The Education Sector
4.2.1 Introduction
Education is an important tool needed for clear understanding, judgment and decision
making in most issues ranging from economic, political and social. The Municipality
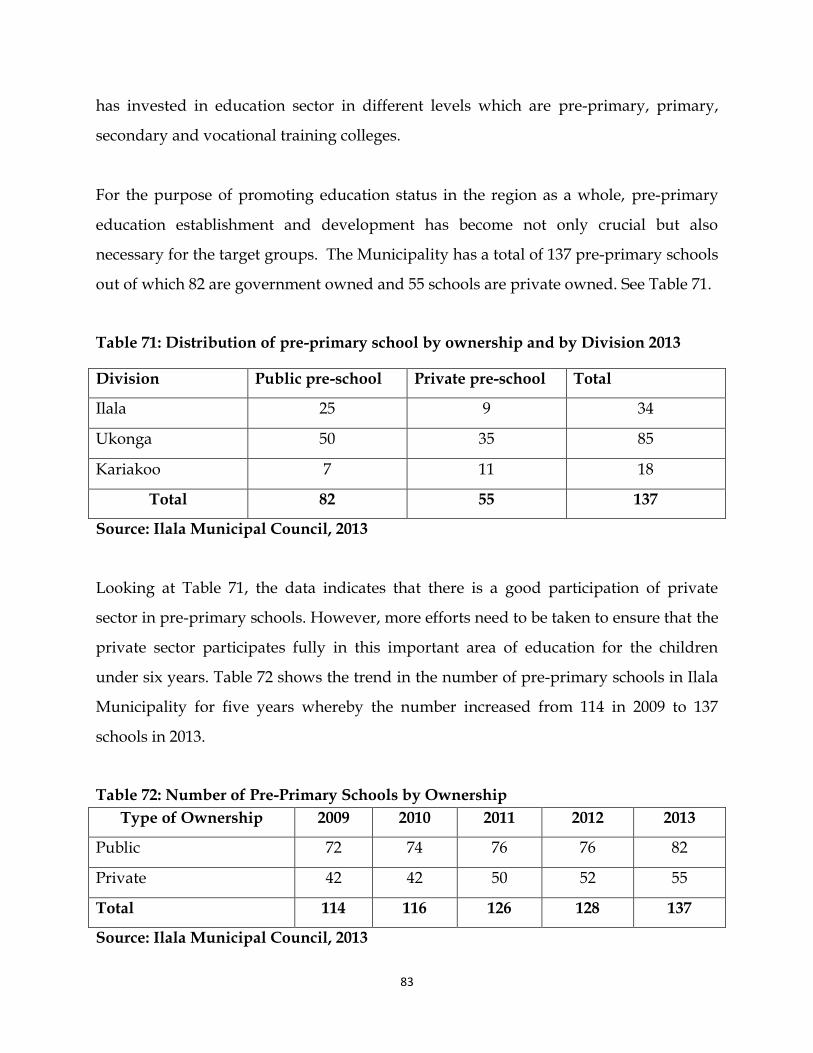
83
has invested in education sector in different levels which are pre-primary, primary,
secondary and vocational training colleges.
For the purpose of promoting education status in the region as a whole, pre-primary
education establishment and development has become not only crucial but also
necessary for the target groups. The Municipality has a total of 137 pre-primary schools
out of which 82 are government owned and 55 schools are private owned. See Table 71.
Table 71: Distribution of pre-primary school by ownership and by Division 2013
Division Public pre-school Private pre-school Total
Ilala 25 9 34
Ukonga 50 35 85
Kariakoo 7 11 18
Total 82 55 137
Source: Ilala Municipal Council, 2013
Looking at Table 71, the data indicates that there is a good participation of private
sector in pre-primary schools. However, more efforts need to be taken to ensure that the
private sector participates fully in this important area of education for the children
under six years. Table 72 shows the trend in the number of pre-primary schools in Ilala
Municipality for five years whereby the number increased from 114 in 2009 to 137
schools in 2013.
Table 72: Number of Pre-Primary Schools by Ownership
Type of Ownership 2009 2010 2011 2012 2013
Public 72 74 76 76 82
Private 42 42 50 52 55
Total 114 116 126 128 137
Source: Ilala Municipal Council, 2013
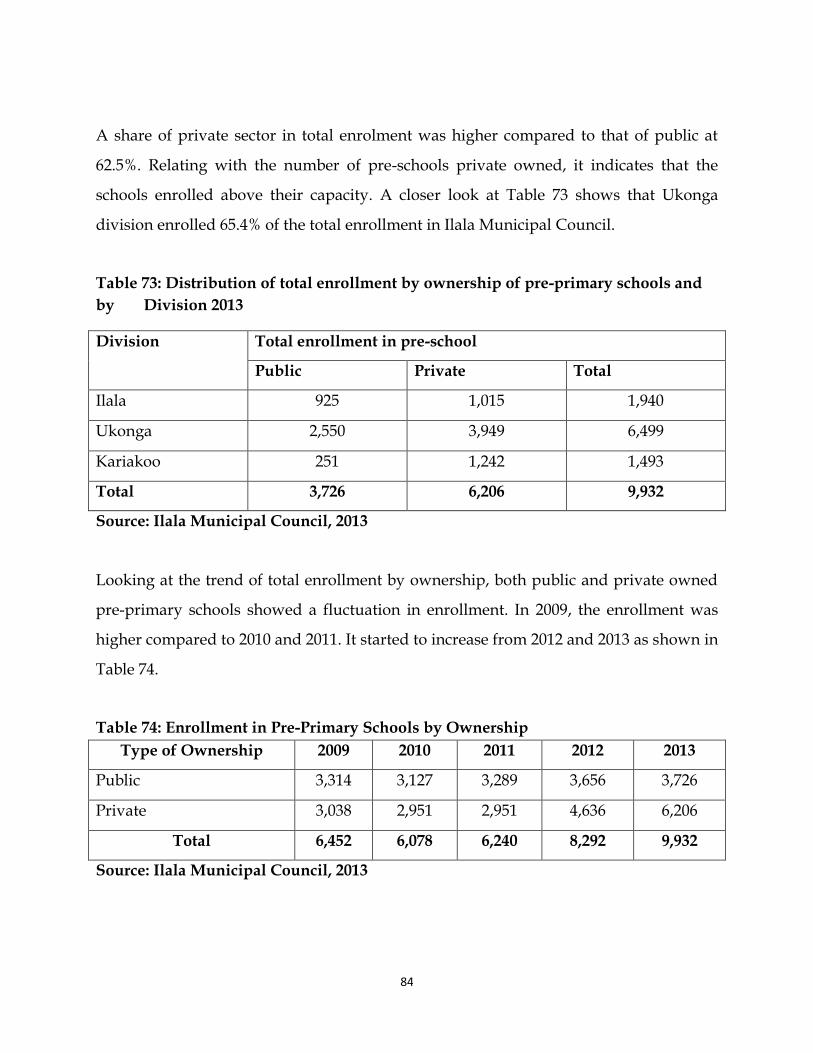
84
A share of private sector in total enrolment was higher compared to that of public at
62.5%. Relating with the number of pre-schools private owned, it indicates that the
schools enrolled above their capacity. A closer look at Table 73 shows that Ukonga
division enrolled 65.4% of the total enrollment in Ilala Municipal Council.
Table 73: Distribution of total enrollment by ownership of pre-primary schools and
by Division 2013
Division Total enrollment in pre-school
Public Private Total
Ilala 925 1,015 1,940
Ukonga 2,550 3,949 6,499
Kariakoo 251 1,242 1,493
Total 3,726 6,206 9,932
Source: Ilala Municipal Council, 2013
Looking at the trend of total enrollment by ownership, both public and private owned
pre-primary schools showed a fluctuation in enrollment. In 2009, the enrollment was
higher compared to 2010 and 2011. It started to increase from 2012 and 2013 as shown in
Table 74.
Table 74: Enrollment in Pre-Primary Schools by Ownership
Type of Ownership 2009 2010 2011 2012 2013
Public 3,314 3,127 3,289 3,656 3,726
Private 3,038 2,951 2,951 4,636 6,206
Total 6,452 6,078 6,240 8,292 9,932
Source: Ilala Municipal Council, 2013
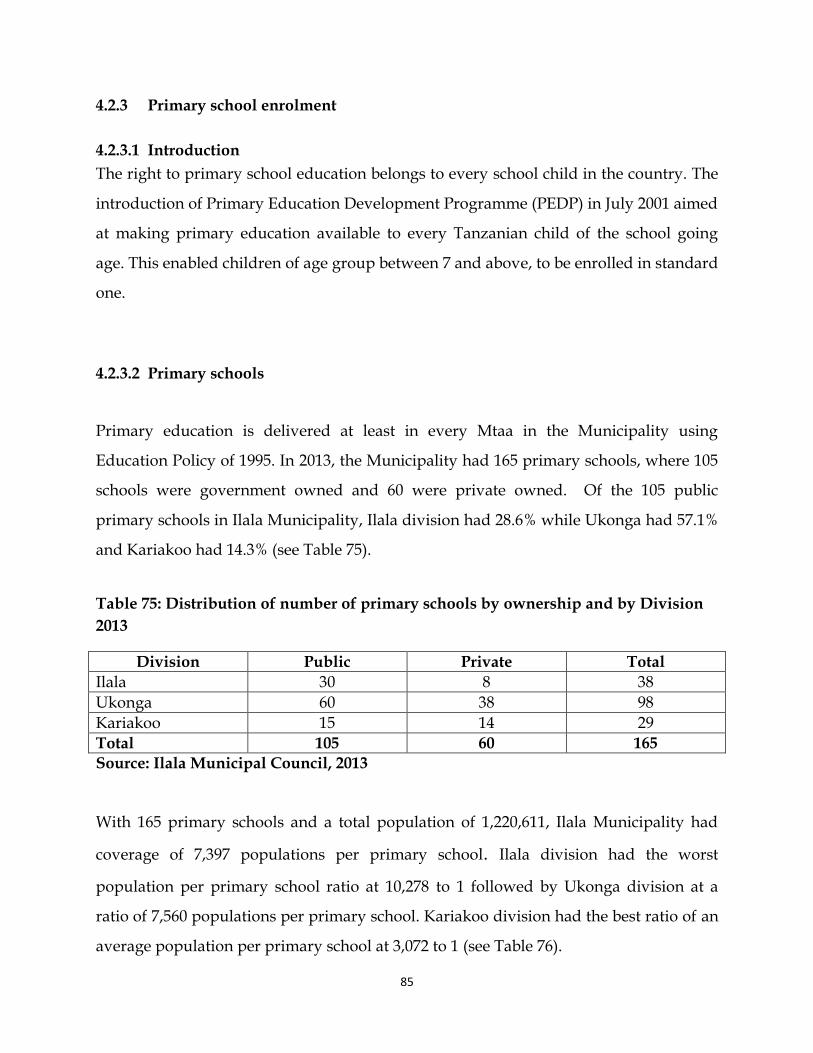
85
4.2.3 Primary school enrolment
4.2.3.1 Introduction
The right to primary school education belongs to every school child in the country. The
introduction of Primary Education Development Programme (PEDP) in July 2001 aimed
at making primary education available to every Tanzanian child of the school going
age. This enabled children of age group between 7 and above, to be enrolled in standard
one.
4.2.3.2 Primary schools
Primary education is delivered at least in every Mtaa in the Municipality using
Education Policy of 1995. In 2013, the Municipality had 165 primary schools, where 105
schools were government owned and 60 were private owned. Of the 105 public
primary schools in Ilala Municipality, Ilala division had 28.6% while Ukonga had 57.1%
and Kariakoo had 14.3% (see Table 75).
Table 75: Distribution of number of primary schools by ownership and by Division
2013
Division Public Private Total
Ilala 30 8 38
Ukonga 60 38 98
Kariakoo 15 14 29
Total 105 60 165
Source: Ilala Municipal Council, 2013
With 165 primary schools and a total population of 1,220,611, Ilala Municipality had
coverage of 7,397 populations per primary school. Ilala division had the worst
population per primary school ratio at 10,278 to 1 followed by Ukonga division at a
ratio of 7,560 populations per primary school. Kariakoo division had the best ratio of an
average population per primary school at 3,072 to 1 (see Table 76).
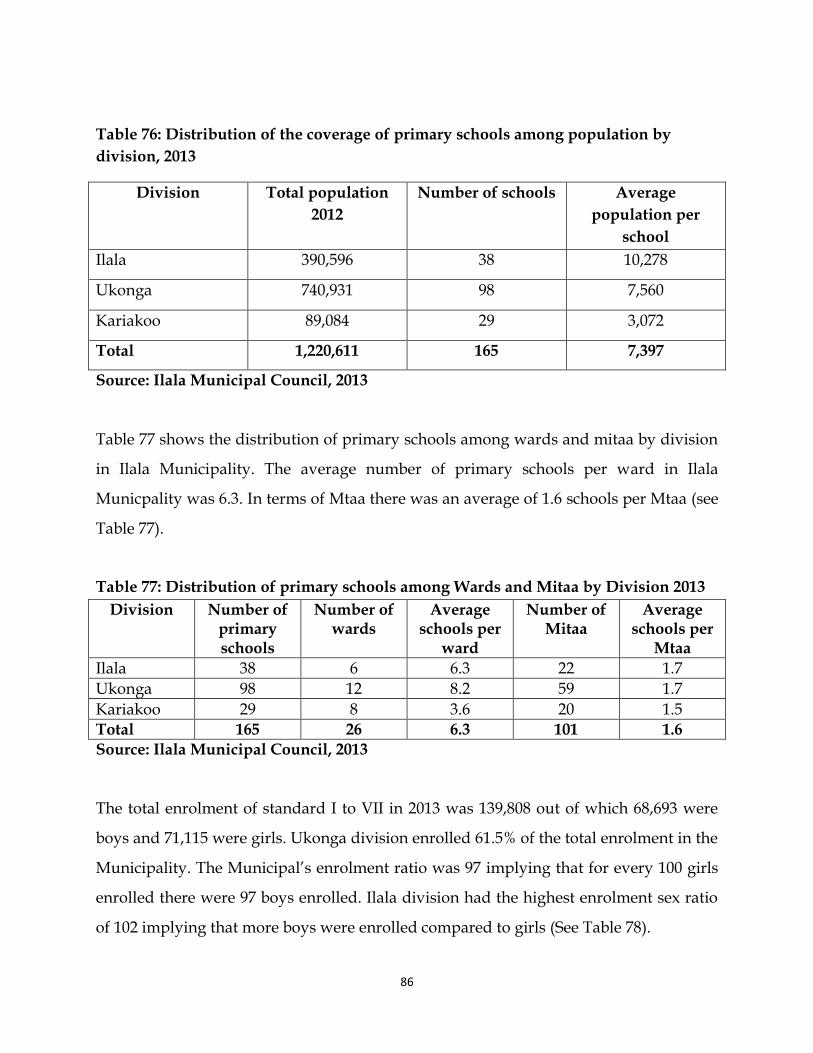
86
Table 76: Distribution of the coverage of primary schools among population by
division, 2013
Division Total population
2012
Number of schools Average
population per
school
Ilala 390,596 38 10,278
Ukonga 740,931 98 7,560
Kariakoo 89,084 29 3,072
Total 1,220,611 165 7,397
Source: Ilala Municipal Council, 2013
Table 77 shows the distribution of primary schools among wards and mitaa by division
in Ilala Municipality. The average number of primary schools per ward in Ilala
Municpality was 6.3. In terms of Mtaa there was an average of 1.6 schools per Mtaa (see
Table 77).
Table 77: Distribution of primary schools among Wards and Mitaa by Division 2013
Division Number of primary schools
Number of wards
Average schools per
ward
Number of Mitaa
Average schools per
Mtaa
Ilala 38 6 6.3 22 1.7
Ukonga 98 12 8.2 59 1.7
Kariakoo 29 8 3.6 20 1.5 Total 165 26 6.3 101 1.6
Source: Ilala Municipal Council, 2013
The total enrolment of standard I to VII in 2013 was 139,808 out of which 68,693 were
boys and 71,115 were girls. Ukonga division enrolled 61.5% of the total enrolment in the
Municipality. The Municipal’s enrolment ratio was 97 implying that for every 100 girls
enrolled there were 97 boys enrolled. Ilala division had the highest enrolment sex ratio
of 102 implying that more boys were enrolled compared to girls (See Table 78).
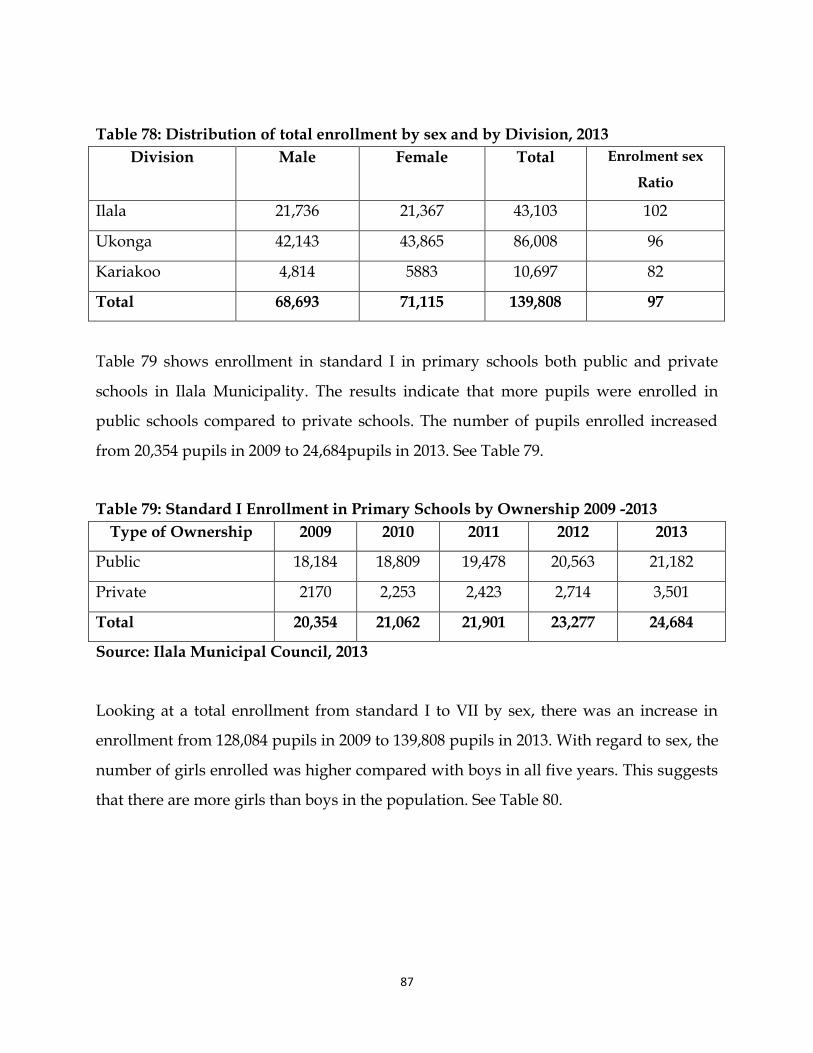
87
Table 78: Distribution of total enrollment by sex and by Division, 2013
Division Male Female Total Enrolment sex
Ratio
Ilala 21,736 21,367 43,103 102
Ukonga 42,143 43,865 86,008 96
Kariakoo 4,814 5883 10,697 82
Total 68,693 71,115 139,808 97
Table 79 shows enrollment in standard I in primary schools both public and private
schools in Ilala Municipality. The results indicate that more pupils were enrolled in
public schools compared to private schools. The number of pupils enrolled increased
from 20,354 pupils in 2009 to 24,684pupils in 2013. See Table 79.
Table 79: Standard I Enrollment in Primary Schools by Ownership 2009 -2013
Type of Ownership 2009 2010 2011 2012 2013
Public 18,184 18,809 19,478 20,563 21,182
Private 2170 2,253 2,423 2,714 3,501
Total 20,354 21,062 21,901 23,277 24,684
Source: Ilala Municipal Council, 2013
Looking at a total enrollment from standard I to VII by sex, there was an increase in
enrollment from 128,084 pupils in 2009 to 139,808 pupils in 2013. With regard to sex, the
number of girls enrolled was higher compared with boys in all five years. This suggests
that there are more girls than boys in the population. See Table 80.
88
Table 80: Total (Std I-VII) Enrollment by Sex in Public Primary Schools 2009 -2013
Sex 2009 2010 2011 2012 2013
Boys 63,299 64,492 66,595 65,650 68,693
Girls 64,744 66,739 68,799 69,839 71,115
Total 128,084 131,234 135,394 135,489 139,808
Source: Ilala Municipal Council, 2013
Table 81 shows that average number of pupils per 1000 population in Ilala Municipality
in 2013 was 115. Out of the three divisions, Kariakoo had highest average pupils per
1000 population at 120 while Ilala division recorded the lowest at 110 pupils per 1000
population.
Table 81: Distribution of primary school pupils in the population by Division, 2013
Division Estimated
population
Number of
enrollment
Average pupils per
1000 population
Ilala 390,596 43,103 110
Ukonga 740,931 86,008 116
Kariakoo 89,084 10,697 120
Total 1,220,611 139,808 115
Source: Ilala Municipal Council, 2013
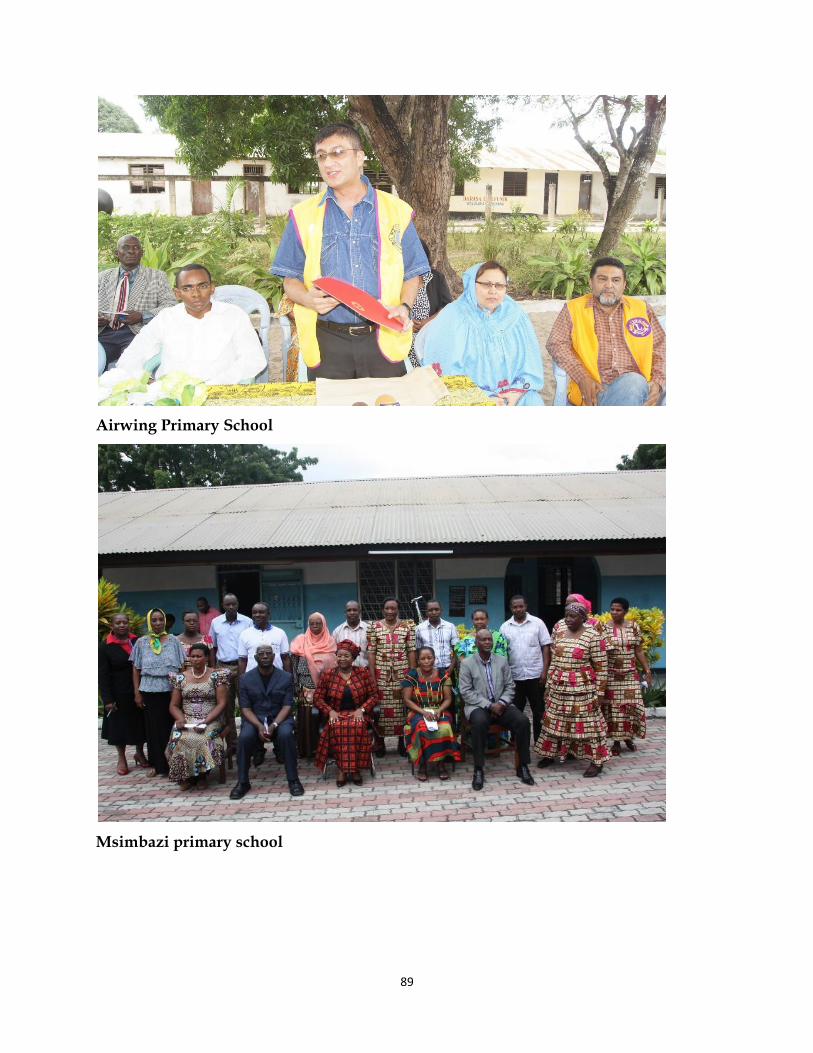
89
Airwing Primary School
Msimbazi primary school
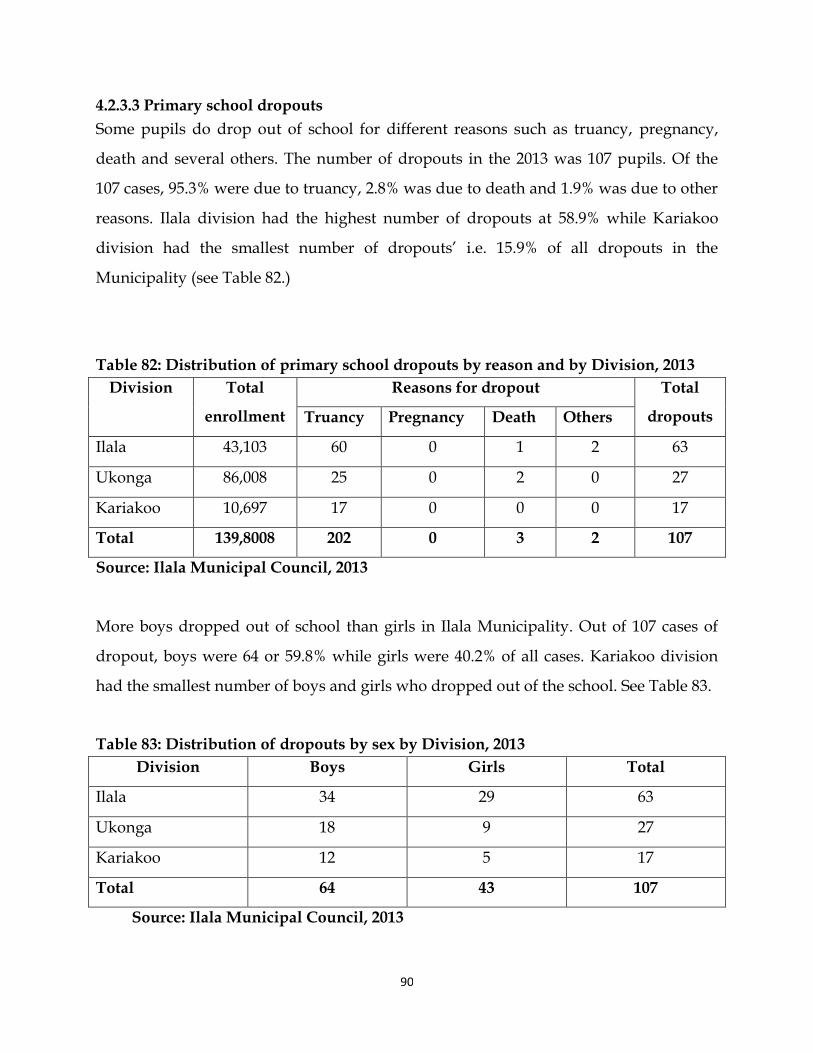
90
4.2.3.3 Primary school dropouts
Some pupils do drop out of school for different reasons such as truancy, pregnancy,
death and several others. The number of dropouts in the 2013 was 107 pupils. Of the
107 cases, 95.3% were due to truancy, 2.8% was due to death and 1.9% was due to other
reasons. Ilala division had the highest number of dropouts at 58.9% while Kariakoo
division had the smallest number of dropouts’ i.e. 15.9% of all dropouts in the
Municipality (see Table 82.)
Table 82: Distribution of primary school dropouts by reason and by Division, 2013
Division Total
enrollment
Reasons for dropout Total
dropouts Truancy Pregnancy Death Others
Ilala 43,103 60 0 1 2 63
Ukonga 86,008 25 0 2 0 27
Kariakoo 10,697 17 0 0 0 17
Total 139,8008 202 0 3 2 107
Source: Ilala Municipal Council, 2013
More boys dropped out of school than girls in Ilala Municipality. Out of 107 cases of
dropout, boys were 64 or 59.8% while girls were 40.2% of all cases. Kariakoo division
had the smallest number of boys and girls who dropped out of the school. See Table 83.
Table 83: Distribution of dropouts by sex by Division, 2013
Division Boys Girls Total
Ilala 34 29 63
Ukonga 18 9 27
Kariakoo 12 5 17
Total 64 43 107
Source: Ilala Municipal Council, 2013
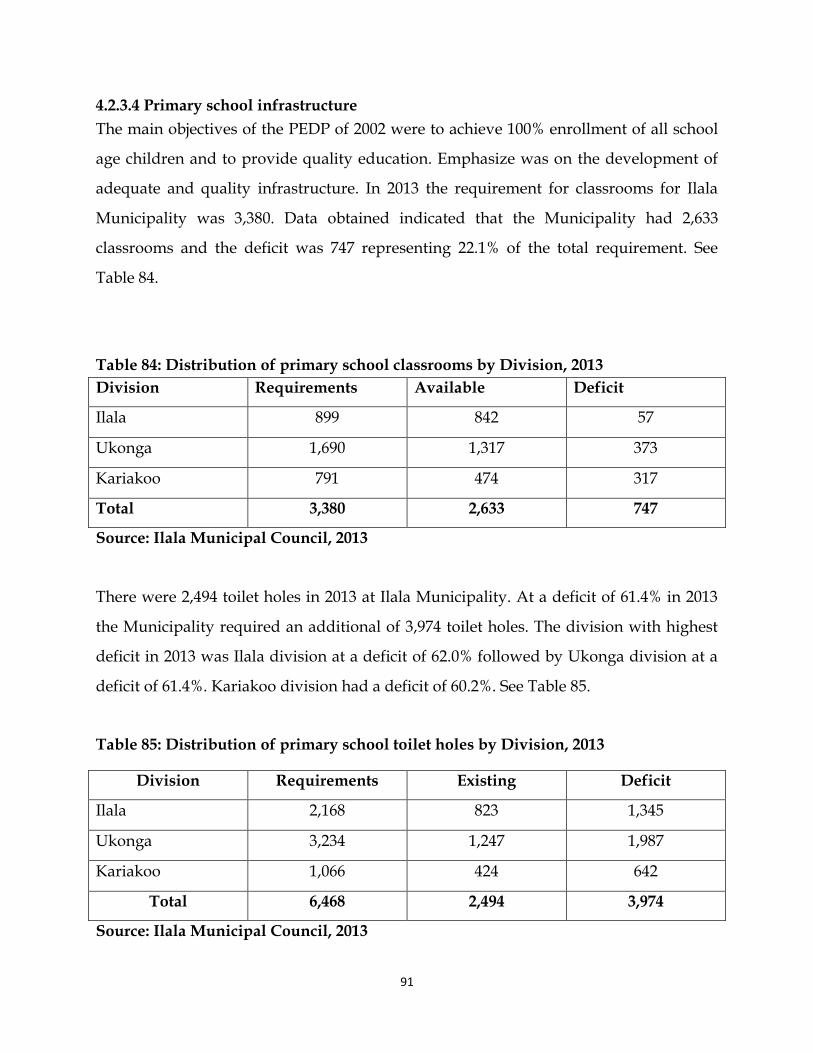
91
4.2.3.4 Primary school infrastructure
The main objectives of the PEDP of 2002 were to achieve 100% enrollment of all school
age children and to provide quality education. Emphasize was on the development of
adequate and quality infrastructure. In 2013 the requirement for classrooms for Ilala
Municipality was 3,380. Data obtained indicated that the Municipality had 2,633
classrooms and the deficit was 747 representing 22.1% of the total requirement. See
Table 84.
Table 84: Distribution of primary school classrooms by Division, 2013
Division Requirements Available Deficit
Ilala 899 842 57
Ukonga 1,690 1,317 373
Kariakoo 791 474 317
Total 3,380 2,633 747
Source: Ilala Municipal Council, 2013
There were 2,494 toilet holes in 2013 at Ilala Municipality. At a deficit of 61.4% in 2013
the Municipality required an additional of 3,974 toilet holes. The division with highest
deficit in 2013 was Ilala division at a deficit of 62.0% followed by Ukonga division at a
deficit of 61.4%. Kariakoo division had a deficit of 60.2%. See Table 85.
Table 85: Distribution of primary school toilet holes by Division, 2013
Division Requirements Existing Deficit
Ilala 2,168 823 1,345
Ukonga 3,234 1,247 1,987
Kariakoo 1,066 424 642
Total 6,468 2,494 3,974
Source: Ilala Municipal Council, 2013
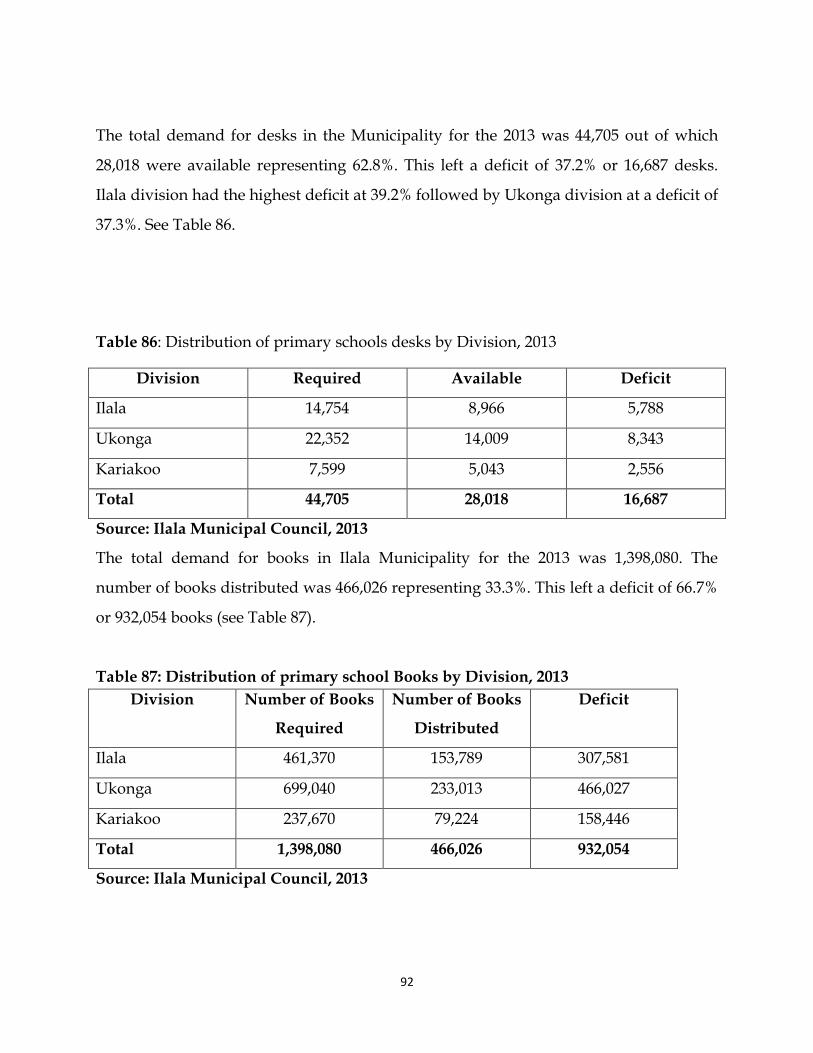
92
The total demand for desks in the Municipality for the 2013 was 44,705 out of which
28,018 were available representing 62.8%. This left a deficit of 37.2% or 16,687 desks.
Ilala division had the highest deficit at 39.2% followed by Ukonga division at a deficit of
37.3%. See Table 86.
Table 86: Distribution of primary schools desks by Division, 2013
Division Required Available Deficit
Ilala 14,754 8,966 5,788
Ukonga 22,352 14,009 8,343
Kariakoo 7,599 5,043 2,556
Total 44,705 28,018 16,687
Source: Ilala Municipal Council, 2013
The total demand for books in Ilala Municipality for the 2013 was 1,398,080. The
number of books distributed was 466,026 representing 33.3%. This left a deficit of 66.7%
or 932,054 books (see Table 87).
Table 87: Distribution of primary school Books by Division, 2013
Division Number of Books
Required
Number of Books
Distributed
Deficit
Ilala 461,370 153,789 307,581
Ukonga 699,040 233,013 466,027
Kariakoo 237,670 79,224 158,446
Total 1,398,080 466,026 932,054
Source: Ilala Municipal Council, 2013

93
In 2013, a total of 110 water tanks were required out of which 48 water tanks were
available. This left a deficit of 56.4% or 62 water tanks. Ukonga division had the highest
deficit of water tanks at 64% followed by Ilala division at 48.4% (see Table 88).
Table 88: Distribution of primary school water tanks by Division, 2013
Division Requirements Available Deficit
Ilala 31 16 15
Ukonga 64 23 41
Kariakoo 15 9 6
Total 110 48 62
Source: Ilala Municipal Council, 2013
Miundo mbinu
4.2.3.5 Primary school teachers
Teachers are the most important factors in primary education development. Teachers of
good quality and in the number required are needed to man the education system in the
Municipality and Region at large. In 2013, Ilala Municipal Council had 3,478 teachers
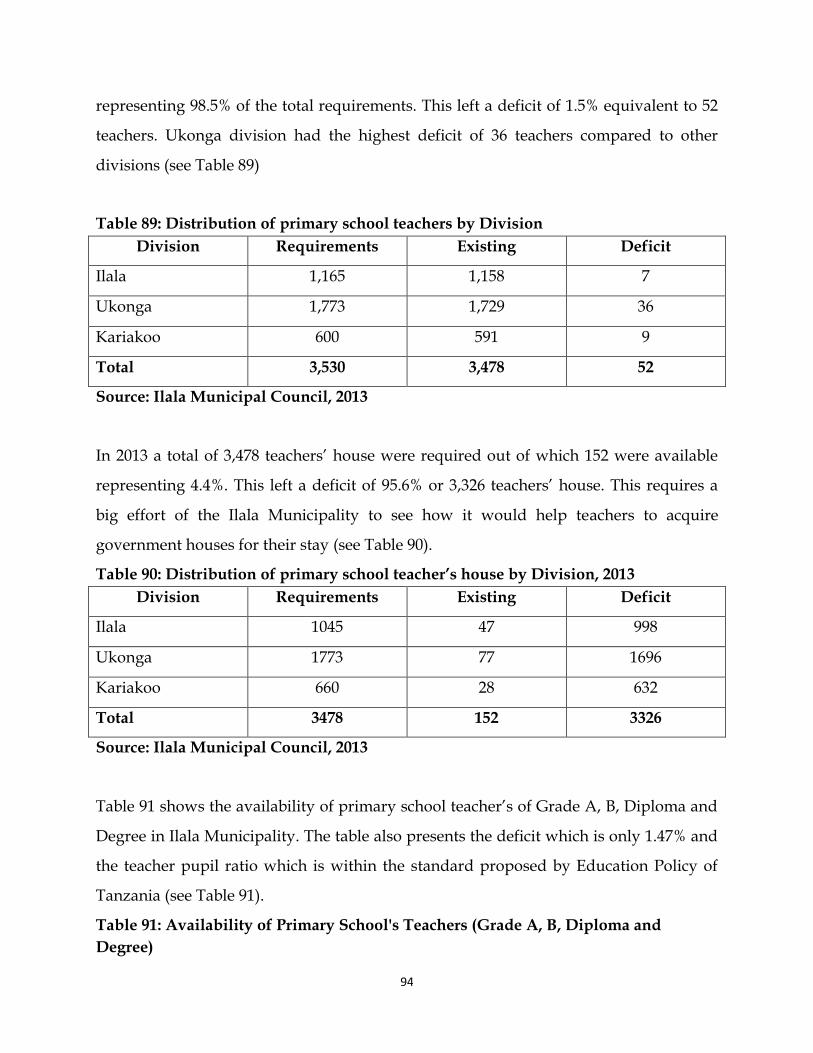
94
representing 98.5% of the total requirements. This left a deficit of 1.5% equivalent to 52
teachers. Ukonga division had the highest deficit of 36 teachers compared to other
divisions (see Table 89)
Table 89: Distribution of primary school teachers by Division
Division Requirements Existing Deficit
Ilala 1,165 1,158 7
Ukonga 1,773 1,729 36
Kariakoo 600 591 9
Total 3,530 3,478 52
Source: Ilala Municipal Council, 2013
In 2013 a total of 3,478 teachers’ house were required out of which 152 were available
representing 4.4%. This left a deficit of 95.6% or 3,326 teachers’ house. This requires a
big effort of the Ilala Municipality to see how it would help teachers to acquire
government houses for their stay (see Table 90).
Table 90: Distribution of primary school teacher’s house by Division, 2013
Division Requirements Existing Deficit
Ilala 1045 47 998
Ukonga 1773 77 1696
Kariakoo 660 28 632
Total 3478 152 3326
Source: Ilala Municipal Council, 2013
Table 91 shows the availability of primary school teacher’s of Grade A, B, Diploma and
Degree in Ilala Municipality. The table also presents the deficit which is only 1.47% and
the teacher pupil ratio which is within the standard proposed by Education Policy of
Tanzania (see Table 91).
Table 91: Availability of Primary School's Teachers (Grade A, B, Diploma and
Degree)
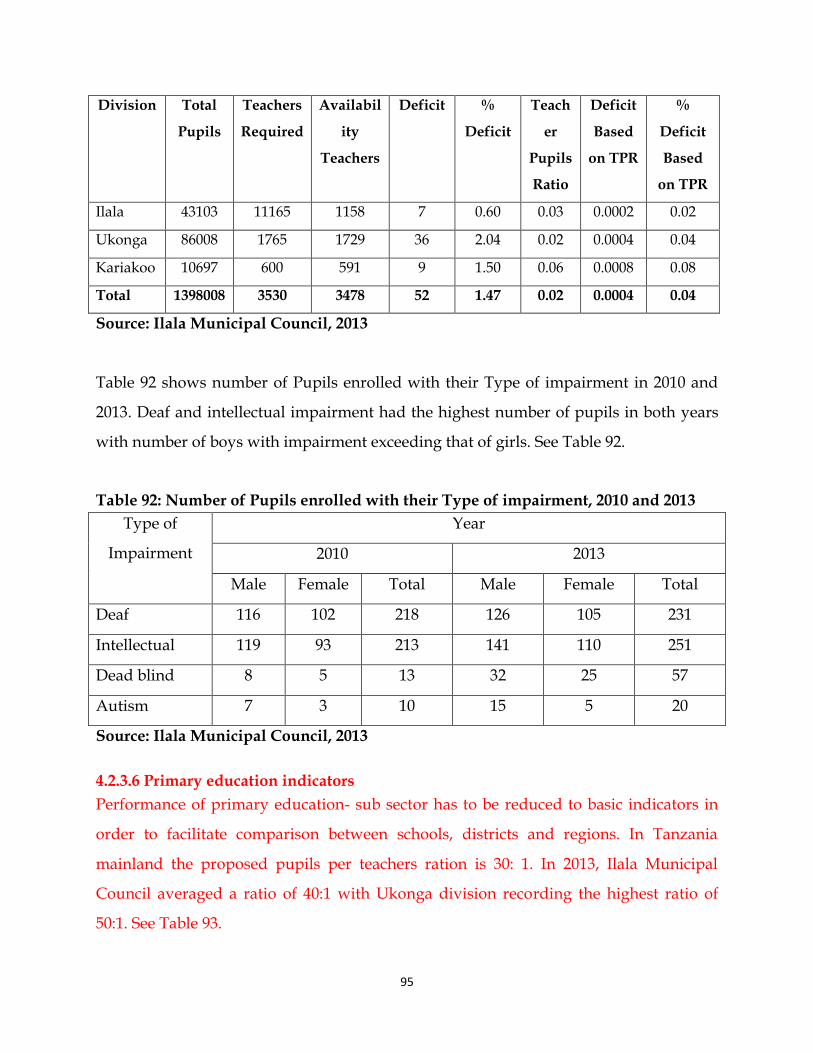
95
Division Total
Pupils
Teachers
Required
Availabil
ity
Teachers
Deficit %
Deficit
Teach
er
Pupils
Ratio
Deficit
Based
on TPR
%
Deficit
Based
on TPR
Ilala 43103 11165 1158 7 0.60 0.03 0.0002 0.02
Ukonga 86008 1765 1729 36 2.04 0.02 0.0004 0.04
Kariakoo 10697 600 591 9 1.50 0.06 0.0008 0.08
Total 1398008 3530 3478 52 1.47 0.02 0.0004 0.04
Source: Ilala Municipal Council, 2013
Table 92 shows number of Pupils enrolled with their Type of impairment in 2010 and
2013. Deaf and intellectual impairment had the highest number of pupils in both years
with number of boys with impairment exceeding that of girls. See Table 92.
Table 92: Number of Pupils enrolled with their Type of impairment, 2010 and 2013
Type of
Impairment
Year
2010 2013
Male Female Total Male Female Total
Deaf 116 102 218 126 105 231
Intellectual 119 93 213 141 110 251
Dead blind 8 5 13 32 25 57
Autism 7 3 10 15 5 20
Source: Ilala Municipal Council, 2013
4.2.3.6 Primary education indicators
Performance of primary education- sub sector has to be reduced to basic indicators in
order to facilitate comparison between schools, districts and regions. In Tanzania
mainland the proposed pupils per teachers ration is 30: 1. In 2013, Ilala Municipal
Council averaged a ratio of 40:1 with Ukonga division recording the highest ratio of
50:1. See Table 93.
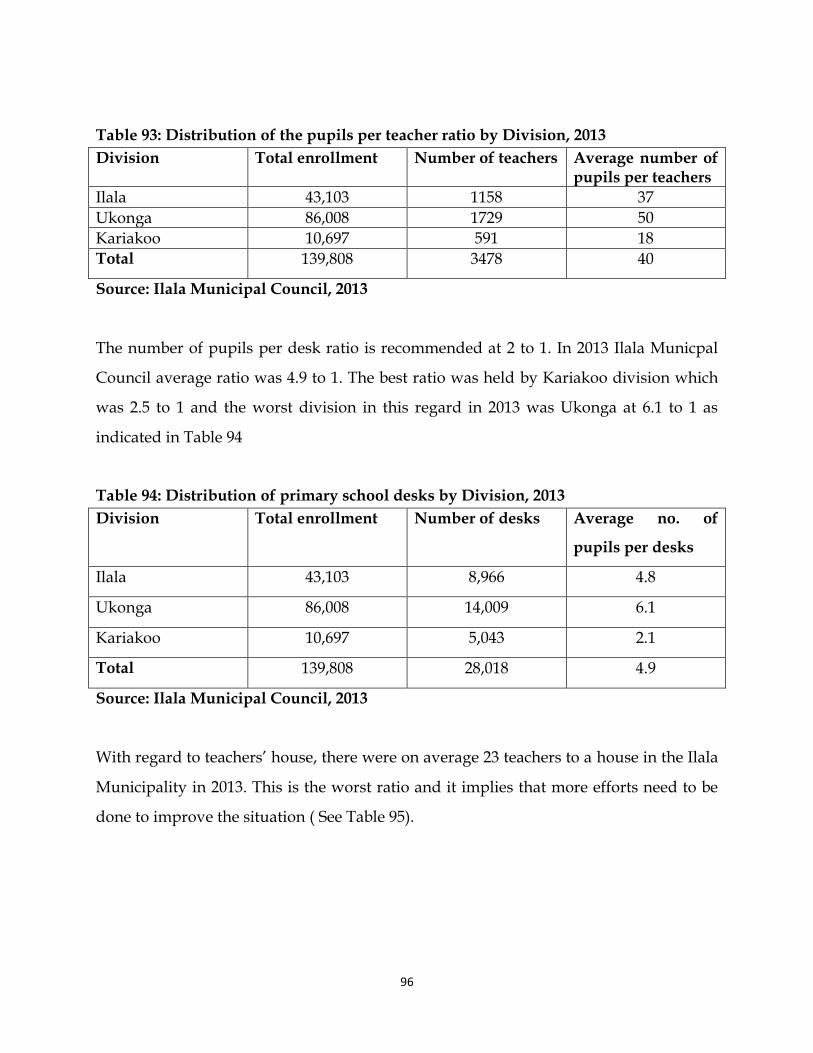
96
Table 93: Distribution of the pupils per teacher ratio by Division, 2013
Division Total enrollment Number of teachers Average number of pupils per teachers
Ilala 43,103 1158 37
Ukonga 86,008 1729 50
Kariakoo 10,697 591 18
Total 139,808 3478 40
Source: Ilala Municipal Council, 2013
The number of pupils per desk ratio is recommended at 2 to 1. In 2013 Ilala Municpal
Council average ratio was 4.9 to 1. The best ratio was held by Kariakoo division which
was 2.5 to 1 and the worst division in this regard in 2013 was Ukonga at 6.1 to 1 as
indicated in Table 94
Table 94: Distribution of primary school desks by Division, 2013
Division Total enrollment Number of desks Average no. of
pupils per desks
Ilala 43,103 8,966 4.8
Ukonga 86,008 14,009 6.1
Kariakoo 10,697 5,043 2.1
Total 139,808 28,018 4.9
Source: Ilala Municipal Council, 2013
With regard to teachers’ house, there were on average 23 teachers to a house in the Ilala
Municipality in 2013. This is the worst ratio and it implies that more efforts need to be
done to improve the situation ( See Table 95).
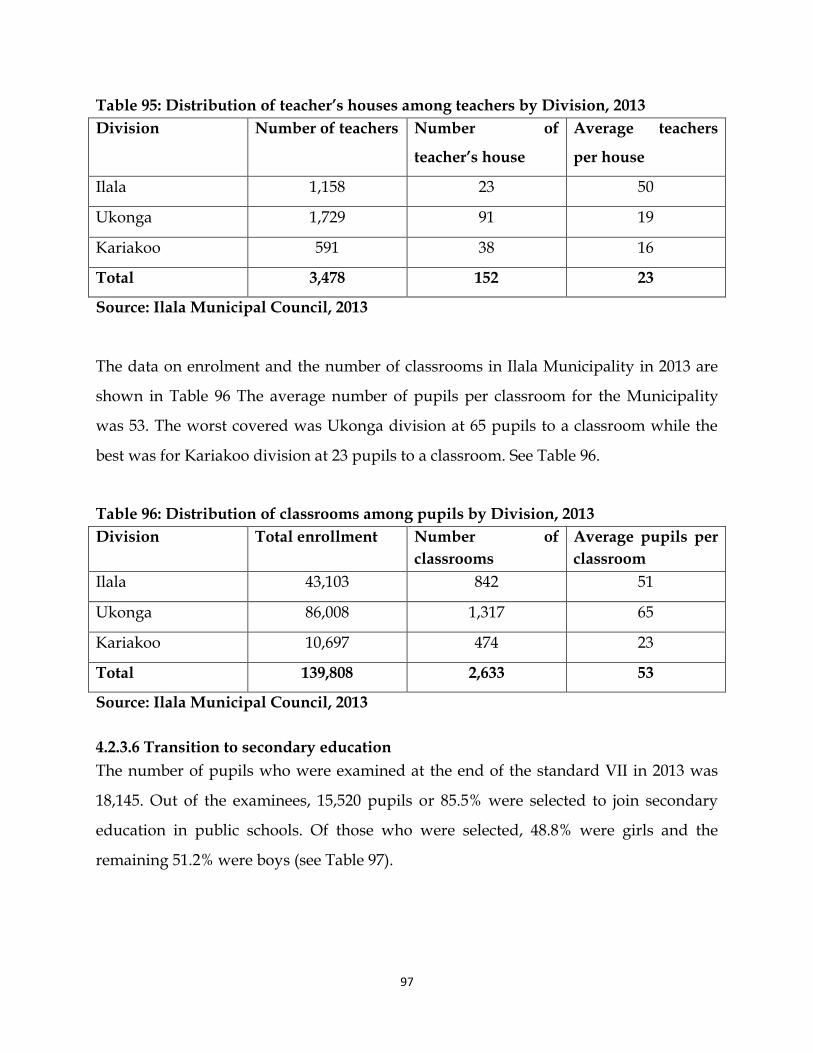
97
Table 95: Distribution of teacher’s houses among teachers by Division, 2013
Division Number of teachers Number of
teacher’s house
Average teachers
per house
Ilala 1,158 23 50
Ukonga 1,729 91 19
Kariakoo 591 38 16
Total 3,478 152 23
Source: Ilala Municipal Council, 2013
The data on enrolment and the number of classrooms in Ilala Municipality in 2013 are
shown in Table 96 The average number of pupils per classroom for the Municipality
was 53. The worst covered was Ukonga division at 65 pupils to a classroom while the
best was for Kariakoo division at 23 pupils to a classroom. See Table 96.
Table 96: Distribution of classrooms among pupils by Division, 2013
Division Total enrollment Number of
classrooms
Average pupils per
classroom
Ilala 43,103 842 51
Ukonga 86,008 1,317 65
Kariakoo 10,697 474 23
Total 139,808 2,633 53
Source: Ilala Municipal Council, 2013
4.2.3.6 Transition to secondary education
The number of pupils who were examined at the end of the standard VII in 2013 was
18,145. Out of the examinees, 15,520 pupils or 85.5% were selected to join secondary
education in public schools. Of those who were selected, 48.8% were girls and the
remaining 51.2% were boys (see Table 97).
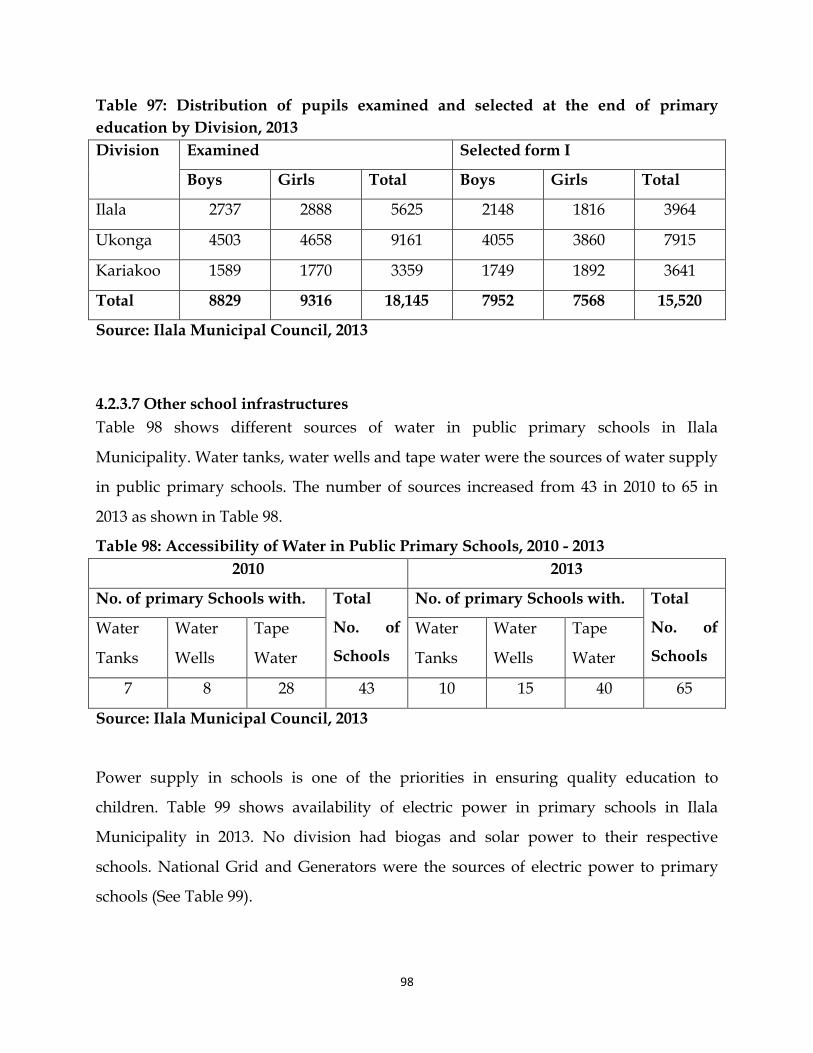
98
Table 97: Distribution of pupils examined and selected at the end of primary
education by Division, 2013
Division Examined Selected form I
Boys Girls Total Boys Girls Total
Ilala 2737 2888 5625 2148 1816 3964
Ukonga 4503 4658 9161 4055 3860 7915
Kariakoo 1589 1770 3359 1749 1892 3641
Total 8829 9316 18,145 7952 7568 15,520
Source: Ilala Municipal Council, 2013
4.2.3.7 Other school infrastructures
Table 98 shows different sources of water in public primary schools in Ilala
Municipality. Water tanks, water wells and tape water were the sources of water supply
in public primary schools. The number of sources increased from 43 in 2010 to 65 in
2013 as shown in Table 98.
Table 98: Accessibility of Water in Public Primary Schools, 2010 - 2013
2010 2013
No. of primary Schools with. Total
No. of
Schools
No. of primary Schools with. Total
No. of
Schools
Water
Tanks
Water
Wells
Tape
Water
Water
Tanks
Water
Wells
Tape
Water
7 8 28 43 10 15 40 65
Source: Ilala Municipal Council, 2013
Power supply in schools is one of the priorities in ensuring quality education to
children. Table 99 shows availability of electric power in primary schools in Ilala
Municipality in 2013. No division had biogas and solar power to their respective
schools. National Grid and Generators were the sources of electric power to primary
schools (See Table 99).
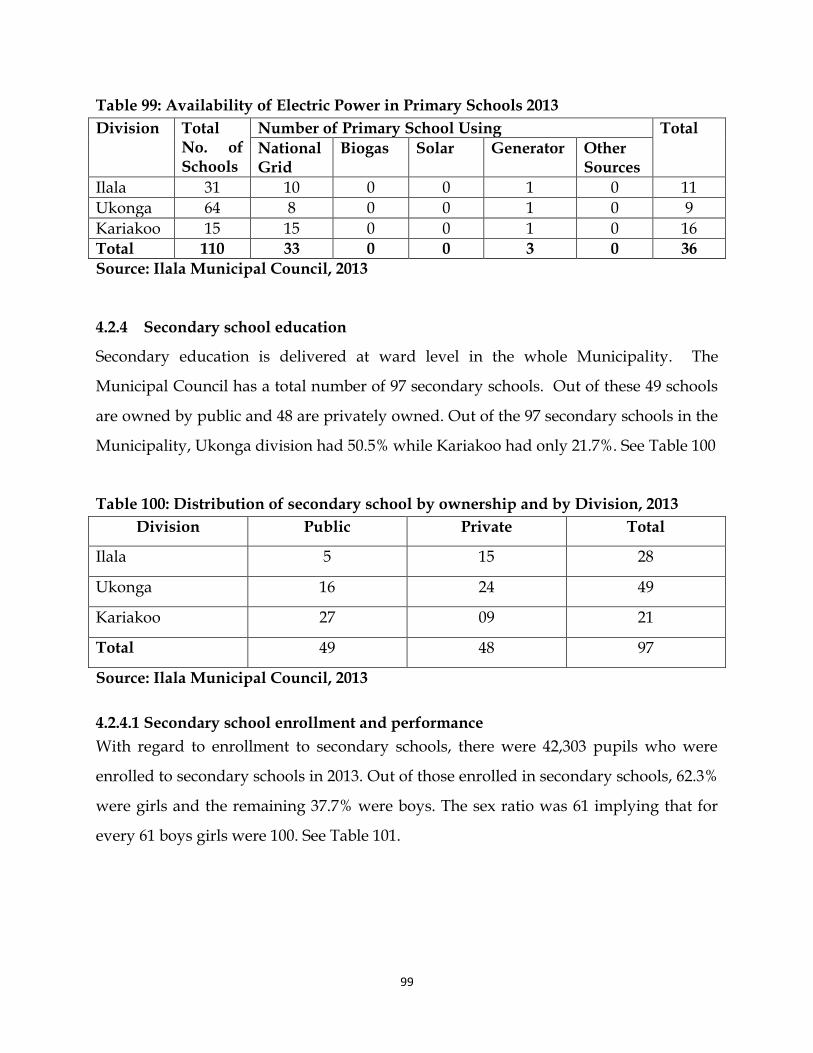
99
Table 99: Availability of Electric Power in Primary Schools 2013
Division Total No. of Schools
Number of Primary School Using Total
National Grid
Biogas Solar Generator Other Sources
Ilala 31 10 0 0 1 0 11
Ukonga 64 8 0 0 1 0 9
Kariakoo 15 15 0 0 1 0 16 Total 110 33 0 0 3 0 36
Source: Ilala Municipal Council, 2013
4.2.4 Secondary school education
Secondary education is delivered at ward level in the whole Municipality. The
Municipal Council has a total number of 97 secondary schools. Out of these 49 schools
are owned by public and 48 are privately owned. Out of the 97 secondary schools in the
Municipality, Ukonga division had 50.5% while Kariakoo had only 21.7%. See Table 100
Table 100: Distribution of secondary school by ownership and by Division, 2013
Division Public Private Total
Ilala 5 15 28
Ukonga 16 24 49
Kariakoo 27 09 21
Total 49 48 97
Source: Ilala Municipal Council, 2013
4.2.4.1 Secondary school enrollment and performance
With regard to enrollment to secondary schools, there were 42,303 pupils who were
enrolled to secondary schools in 2013. Out of those enrolled in secondary schools, 62.3%
were girls and the remaining 37.7% were boys. The sex ratio was 61 implying that for
every 61 boys girls were 100. See Table 101.

100
Table 101: Distribution of total enrollment in secondary schools by sex (O level)
Division Boys Girls Sex Ratio Total
Ilala 2080 2921 71 5001
Ukonga 5680 8479 67 13856
Kariakoo 8195 14948 55 22843
Total 15955 26348 61 42303
Source: Ilala Municipal Council, 2013
Table 102 shows total form I enrollment in public secondary schools by Sex from 2009 to
2013 in Ilala Municipality. The data indicates that the percentage of boys enrolled in
secondary schools was decreasing while it was increasing for girls. The total number of
pupils enrolled showed an increasing trend from 2010 to 2013 as in Table 102.
Table 102: Total Form I Enrollment in Public Secondary Schools by Sex, 2009-2013
Year
Boys Girls
Total Number % Number %
2009 5995 54.5 4995 45.5 10990
2010 5227 52.4 4744 47.6 9971
2011 6486 49.8 6548 50.2 13034
2012 7537 48.7 7946 51.3 15483
2013 7606 48.9 7947 51.1 15553
Table 103 shows the number of students who completed Form IV in public secondary
schools by Sex from 2009 to 2013. Results indicate that more boys completed form IV in
all four years than girls as seen in Table 103.
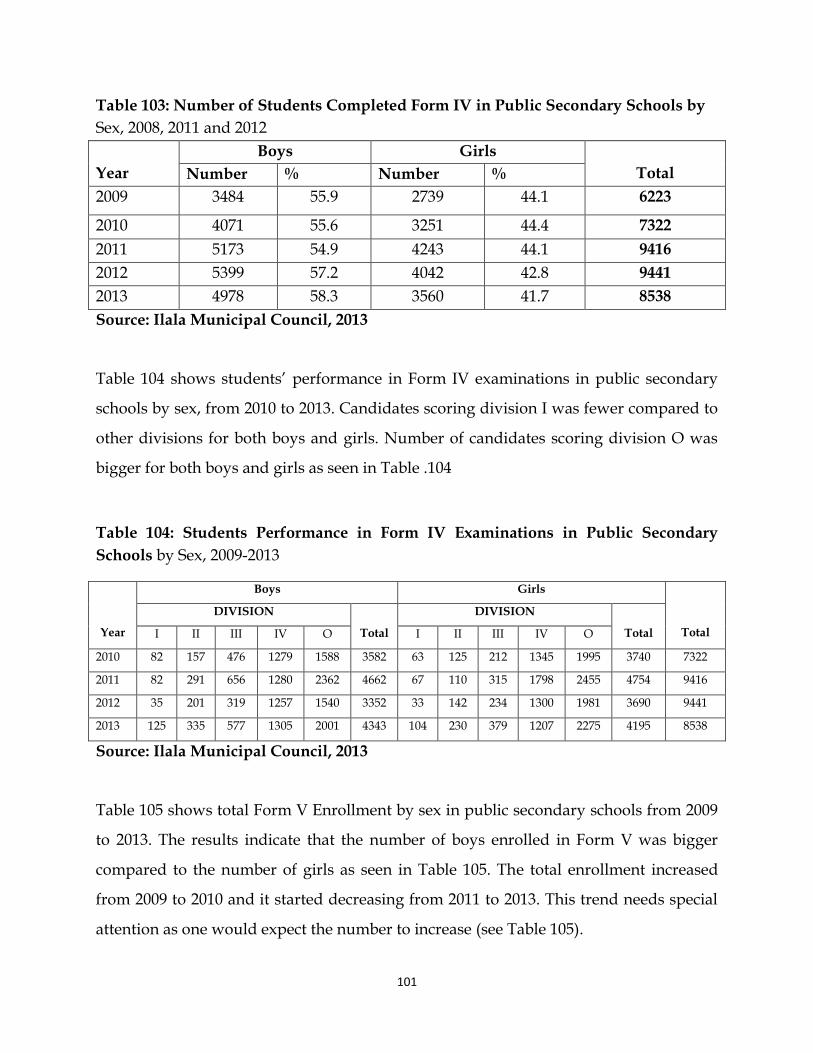
101
Table 103: Number of Students Completed Form IV in Public Secondary Schools by
Sex, 2008, 2011 and 2012
Year
Boys Girls
Total Number % Number %
2009 3484 55.9 2739 44.1 6223
2010 4071 55.6 3251 44.4 7322
2011 5173 54.9 4243 44.1 9416
2012 5399 57.2 4042 42.8 9441
2013 4978 58.3 3560 41.7 8538
Source: Ilala Municipal Council, 2013
Table 104 shows students’ performance in Form IV examinations in public secondary
schools by sex, from 2010 to 2013. Candidates scoring division I was fewer compared to
other divisions for both boys and girls. Number of candidates scoring division O was
bigger for both boys and girls as seen in Table .104
Table 104: Students Performance in Form IV Examinations in Public Secondary
Schools by Sex, 2009-2013
Year
Boys Girls
Total
DIVISION
Total
DIVISION
Total I II III IV O I II III IV O
2010 82 157 476 1279 1588 3582 63 125 212 1345 1995 3740 7322
2011 82 291 656 1280 2362 4662 67 110 315 1798 2455 4754 9416
2012 35 201 319 1257 1540 3352 33 142 234 1300 1981 3690 9441
2013 125 335 577 1305 2001 4343 104 230 379 1207 2275 4195 8538
Source: Ilala Municipal Council, 2013
Table 105 shows total Form V Enrollment by sex in public secondary schools from 2009
to 2013. The results indicate that the number of boys enrolled in Form V was bigger
compared to the number of girls as seen in Table 105. The total enrollment increased
from 2009 to 2010 and it started decreasing from 2011 to 2013. This trend needs special
attention as one would expect the number to increase (see Table 105).
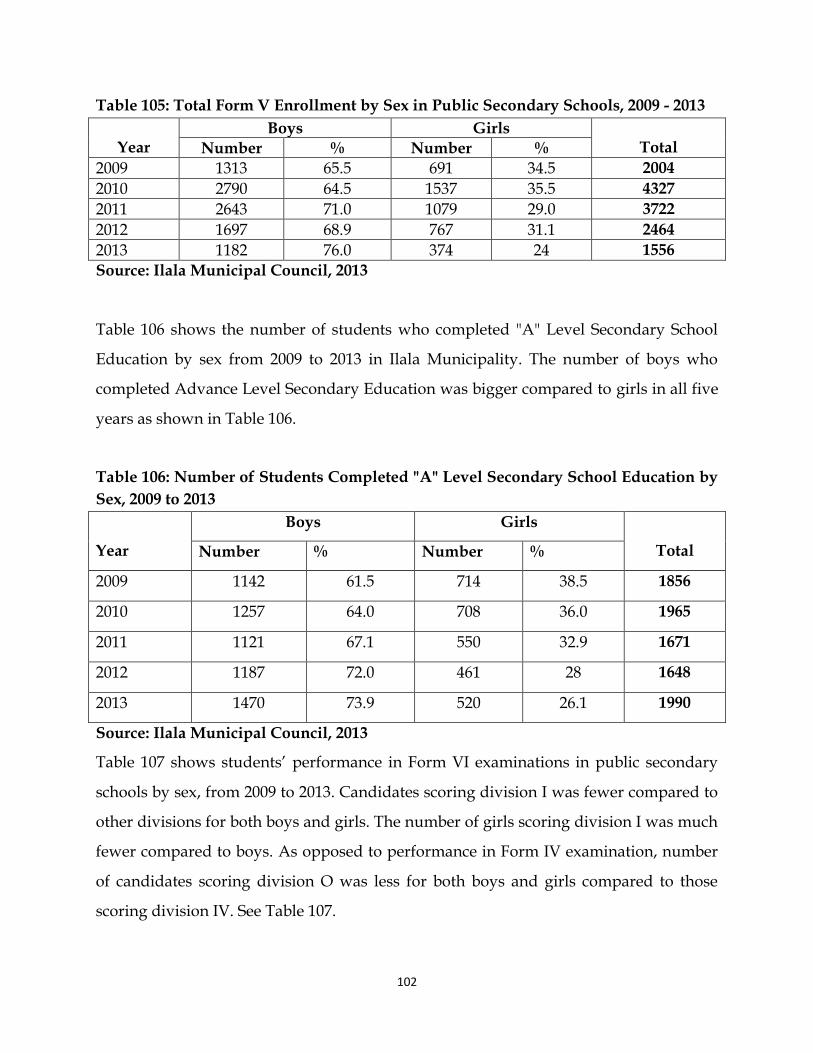
102
Table 105: Total Form V Enrollment by Sex in Public Secondary Schools, 2009 - 2013
Year
Boys Girls Total Number % Number %
2009 1313 65.5 691 34.5 2004
2010 2790 64.5 1537 35.5 4327
2011 2643 71.0 1079 29.0 3722
2012 1697 68.9 767 31.1 2464
2013 1182 76.0 374 24 1556
Source: Ilala Municipal Council, 2013
Table 106 shows the number of students who completed "A" Level Secondary School
Education by sex from 2009 to 2013 in Ilala Municipality. The number of boys who
completed Advance Level Secondary Education was bigger compared to girls in all five
years as shown in Table 106.
Table 106: Number of Students Completed "A" Level Secondary School Education by
Sex, 2009 to 2013
Year
Boys Girls
Total Number % Number %
2009 1142 61.5 714 38.5 1856
2010 1257 64.0 708 36.0 1965
2011 1121 67.1 550 32.9 1671
2012 1187 72.0 461 28 1648
2013 1470 73.9 520 26.1 1990
Source: Ilala Municipal Council, 2013
Table 107 shows students’ performance in Form VI examinations in public secondary
schools by sex, from 2009 to 2013. Candidates scoring division I was fewer compared to
other divisions for both boys and girls. The number of girls scoring division I was much
fewer compared to boys. As opposed to performance in Form IV examination, number
of candidates scoring division O was less for both boys and girls compared to those
scoring division IV. See Table 107.
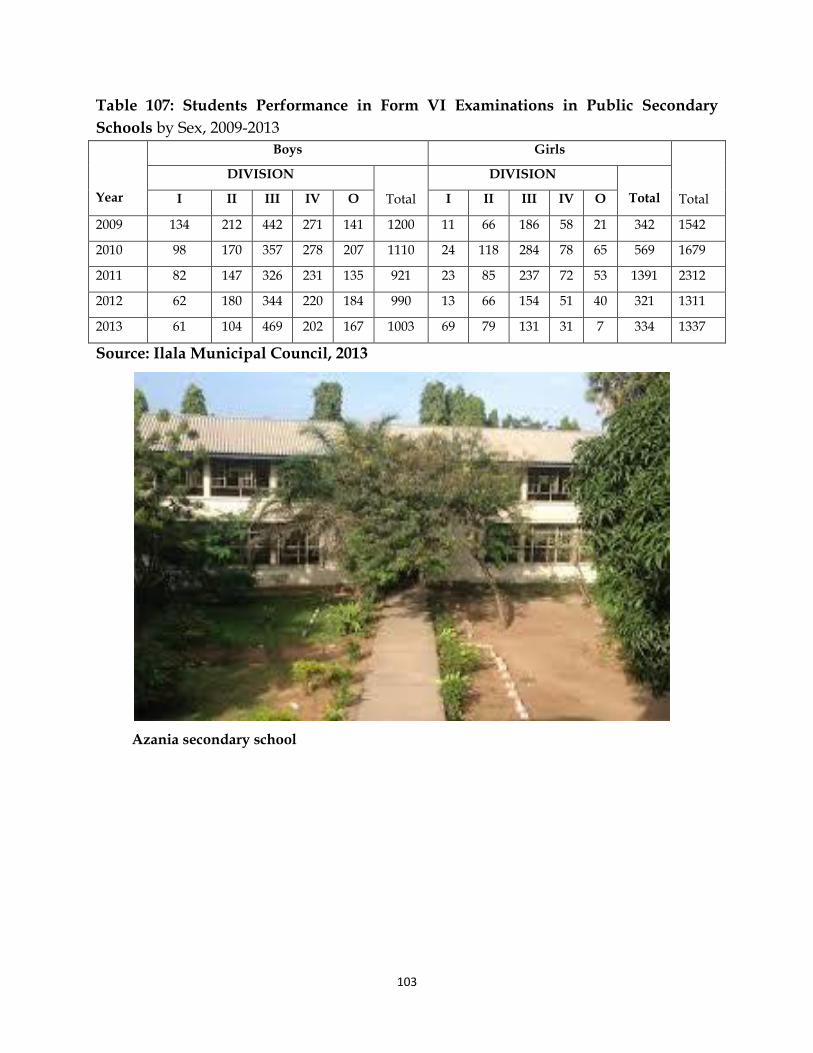
103
Table 107: Students Performance in Form VI Examinations in Public Secondary
Schools by Sex, 2009-2013
Year
Boys Girls
Total
DIVISION
Total
DIVISION
Total I II III IV O I II III IV O
2009 134 212 442 271 141 1200 11 66 186 58 21 342 1542
2010 98 170 357 278 207 1110 24 118 284 78 65 569 1679
2011 82 147 326 231 135 921 23 85 237 72 53 1391 2312
2012 62 180 344 220 184 990 13 66 154 51 40 321 1311
2013 61 104 469 202 167 1003 69 79 131 31 7 334 1337
Source: Ilala Municipal Council, 2013
Azania secondary school
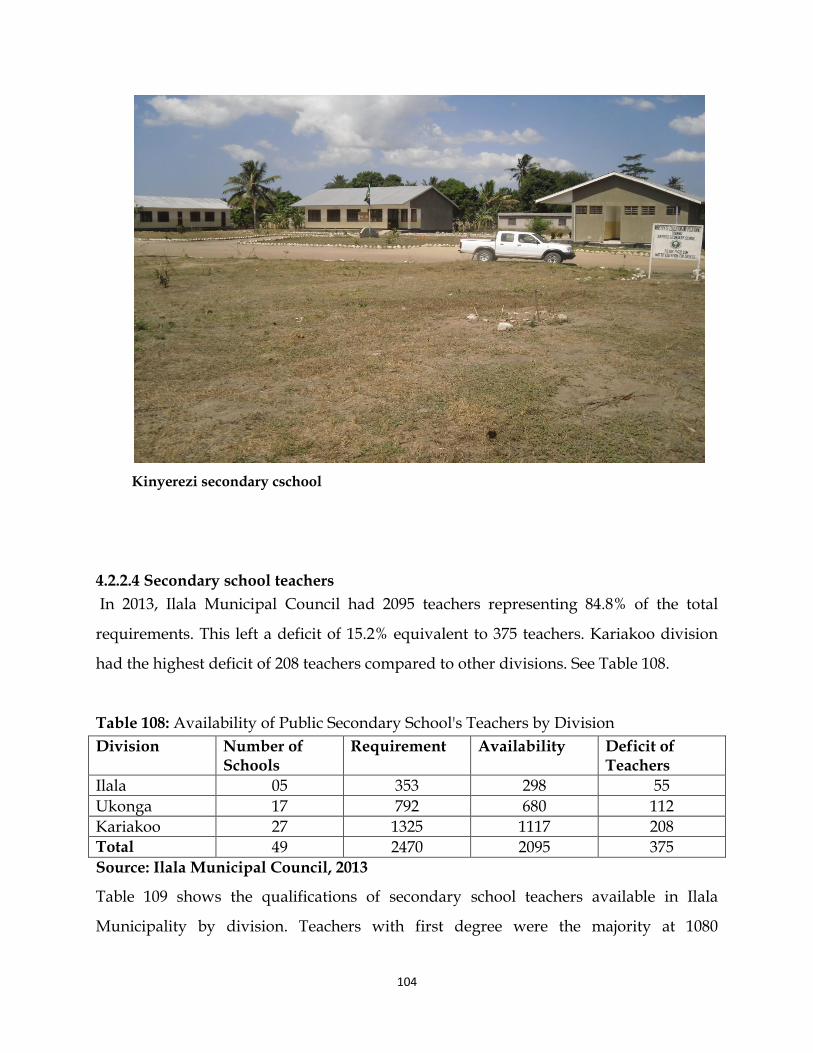
104
Kinyerezi secondary cschool
4.2.2.4 Secondary school teachers
In 2013, Ilala Municipal Council had 2095 teachers representing 84.8% of the total
requirements. This left a deficit of 15.2% equivalent to 375 teachers. Kariakoo division
had the highest deficit of 208 teachers compared to other divisions. See Table 108.
Table 108: Availability of Public Secondary School's Teachers by Division
Division Number of Schools
Requirement Availability Deficit of Teachers
Ilala 05 353 298 55
Ukonga 17 792 680 112
Kariakoo 27 1325 1117 208 Total 49 2470 2095 375
Source: Ilala Municipal Council, 2013
Table 109 shows the qualifications of secondary school teachers available in Ilala
Municipality by division. Teachers with first degree were the majority at 1080
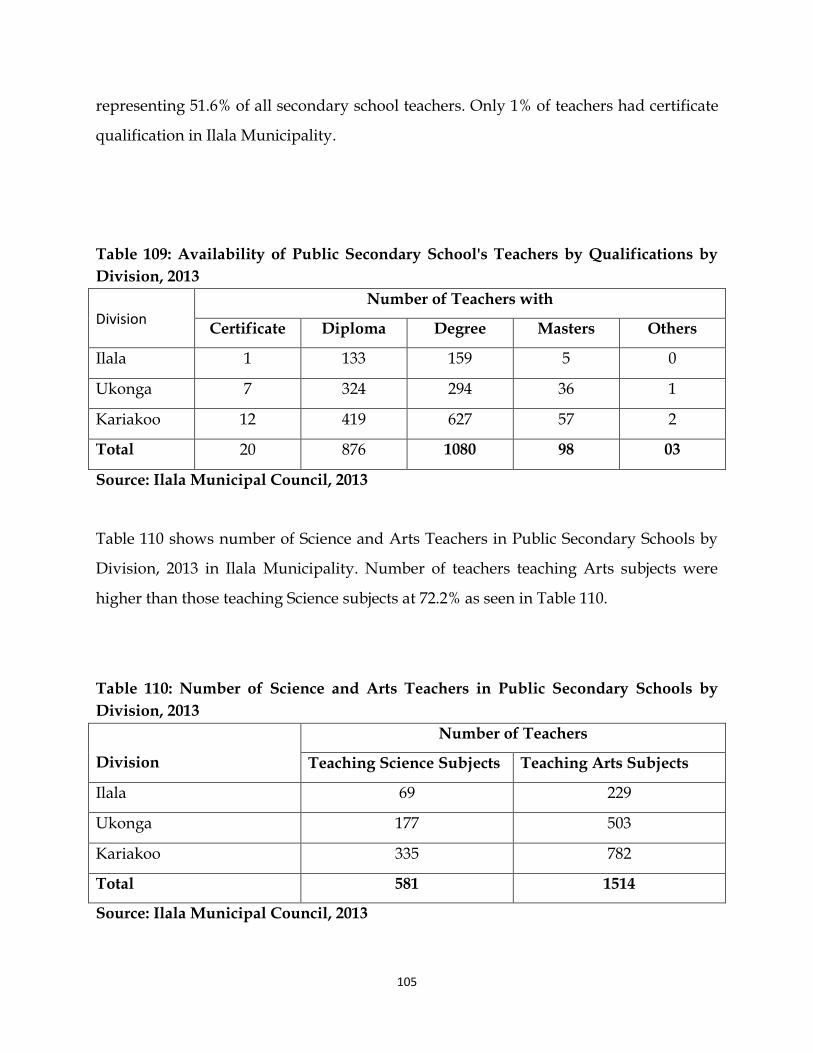
105
representing 51.6% of all secondary school teachers. Only 1% of teachers had certificate
qualification in Ilala Municipality.
Table 109: Availability of Public Secondary School's Teachers by Qualifications by
Division, 2013
Division
Number of Teachers with
Certificate Diploma Degree Masters Others
Ilala 1 133 159 5 0
Ukonga 7 324 294 36 1
Kariakoo 12 419 627 57 2
Total 20 876 1080 98 03
Source: Ilala Municipal Council, 2013
Table 110 shows number of Science and Arts Teachers in Public Secondary Schools by
Division, 2013 in Ilala Municipality. Number of teachers teaching Arts subjects were
higher than those teaching Science subjects at 72.2% as seen in Table 110.
Table 110: Number of Science and Arts Teachers in Public Secondary Schools by
Division, 2013
Division
Number of Teachers
Teaching Science Subjects Teaching Arts Subjects
Ilala 69 229
Ukonga 177 503
Kariakoo 335 782
Total 581 1514
Source: Ilala Municipal Council, 2013
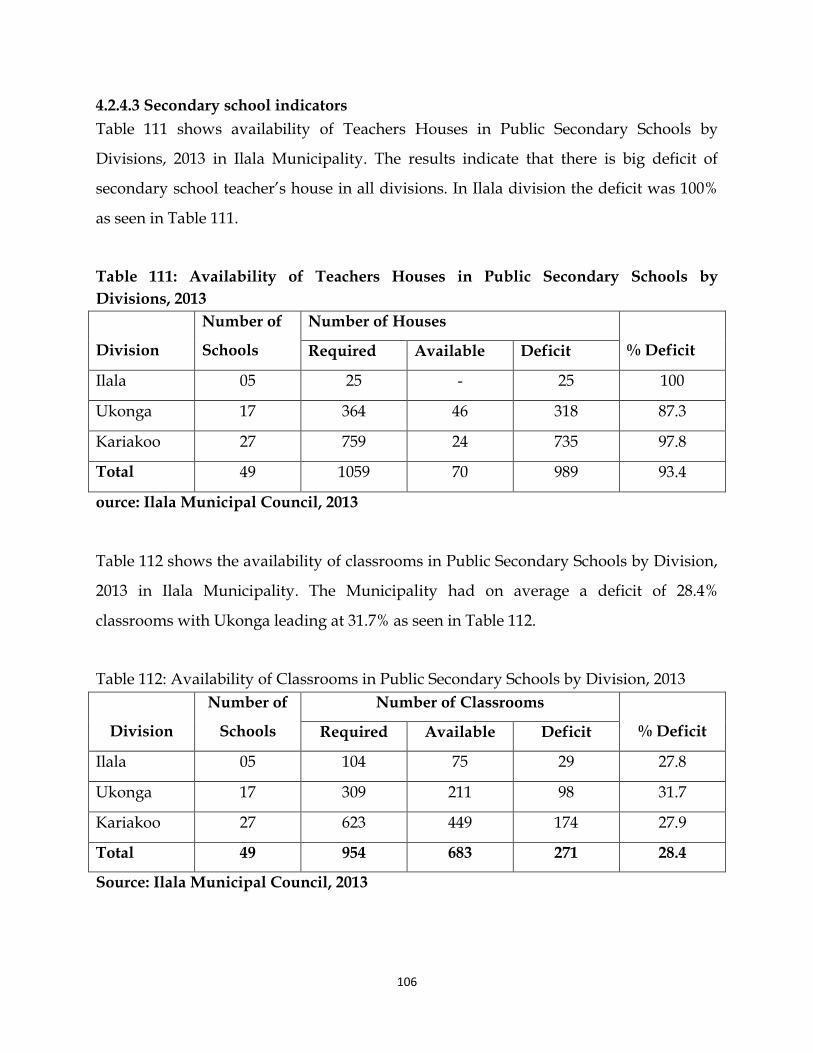
106
4.2.4.3 Secondary school indicators
Table 111 shows availability of Teachers Houses in Public Secondary Schools by
Divisions, 2013 in Ilala Municipality. The results indicate that there is big deficit of
secondary school teacher’s house in all divisions. In Ilala division the deficit was 100%
as seen in Table 111.
Table 111: Availability of Teachers Houses in Public Secondary Schools by
Divisions, 2013
Division
Number of
Schools
Number of Houses
% Deficit Required Available Deficit
Ilala 05 25 - 25 100
Ukonga 17 364 46 318 87.3
Kariakoo 27 759 24 735 97.8
Total 49 1059 70 989 93.4
ource: Ilala Municipal Council, 2013
Table 112 shows the availability of classrooms in Public Secondary Schools by Division,
2013 in Ilala Municipality. The Municipality had on average a deficit of 28.4%
classrooms with Ukonga leading at 31.7% as seen in Table 112.
Table 112: Availability of Classrooms in Public Secondary Schools by Division, 2013
Division
Number of
Schools
Number of Classrooms
% Deficit Required Available Deficit
Ilala 05 104 75 29 27.8
Ukonga 17 309 211 98 31.7
Kariakoo 27 623 449 174 27.9
Total 49 954 683 271 28.4
Source: Ilala Municipal Council, 2013
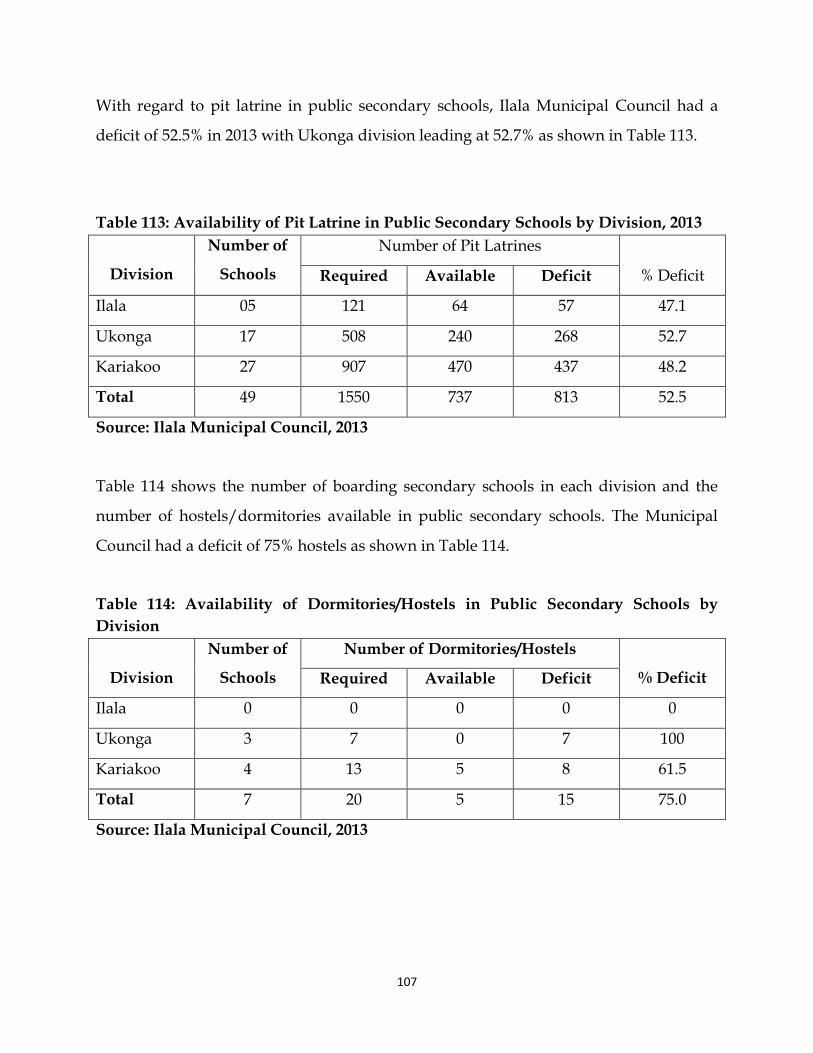
107
With regard to pit latrine in public secondary schools, Ilala Municipal Council had a
deficit of 52.5% in 2013 with Ukonga division leading at 52.7% as shown in Table 113.
Table 113: Availability of Pit Latrine in Public Secondary Schools by Division, 2013
Division
Number of
Schools
Number of Pit Latrines
% Deficit Required Available Deficit
Ilala 05 121 64 57 47.1
Ukonga 17 508 240 268 52.7
Kariakoo 27 907 470 437 48.2
Total 49 1550 737 813 52.5
Source: Ilala Municipal Council, 2013
Table 114 shows the number of boarding secondary schools in each division and the
number of hostels/dormitories available in public secondary schools. The Municipal
Council had a deficit of 75% hostels as shown in Table 114.
Table 114: Availability of Dormitories/Hostels in Public Secondary Schools by
Division
Division
Number of
Schools
Number of Dormitories/Hostels
% Deficit Required Available Deficit
Ilala 0 0 0 0 0
Ukonga 3 7 0 7 100
Kariakoo 4 13 5 8 61.5
Total 7 20 5 15 75.0
Source: Ilala Municipal Council, 2013
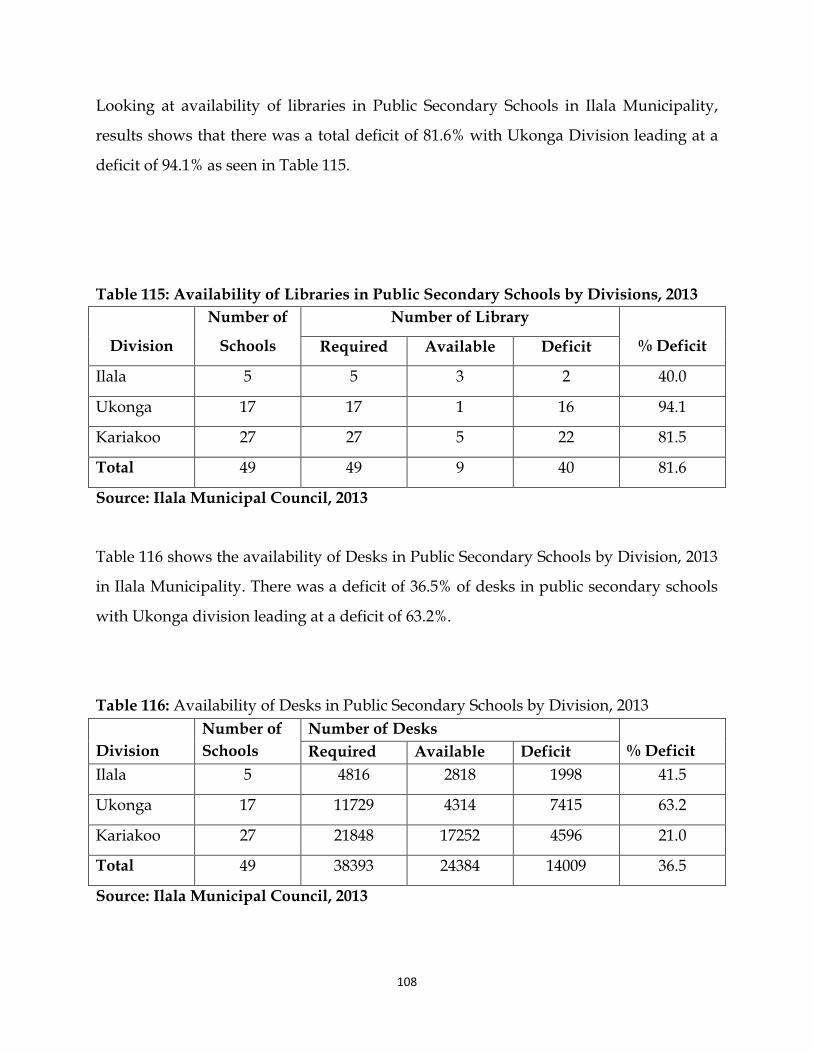
108
Looking at availability of libraries in Public Secondary Schools in Ilala Municipality,
results shows that there was a total deficit of 81.6% with Ukonga Division leading at a
deficit of 94.1% as seen in Table 115.
Table 115: Availability of Libraries in Public Secondary Schools by Divisions, 2013
Division
Number of
Schools
Number of Library
% Deficit Required Available Deficit
Ilala 5 5 3 2 40.0
Ukonga 17 17 1 16 94.1
Kariakoo 27 27 5 22 81.5
Total 49 49 9 40 81.6
Source: Ilala Municipal Council, 2013
Table 116 shows the availability of Desks in Public Secondary Schools by Division, 2013
in Ilala Municipality. There was a deficit of 36.5% of desks in public secondary schools
with Ukonga division leading at a deficit of 63.2%.
Table 116: Availability of Desks in Public Secondary Schools by Division, 2013
Division
Number of
Schools
Number of Desks
% Deficit Required Available Deficit
Ilala 5 4816 2818 1998 41.5
Ukonga 17 11729 4314 7415 63.2
Kariakoo 27 21848 17252 4596 21.0
Total 49 38393 24384 14009 36.5
Source: Ilala Municipal Council, 2013
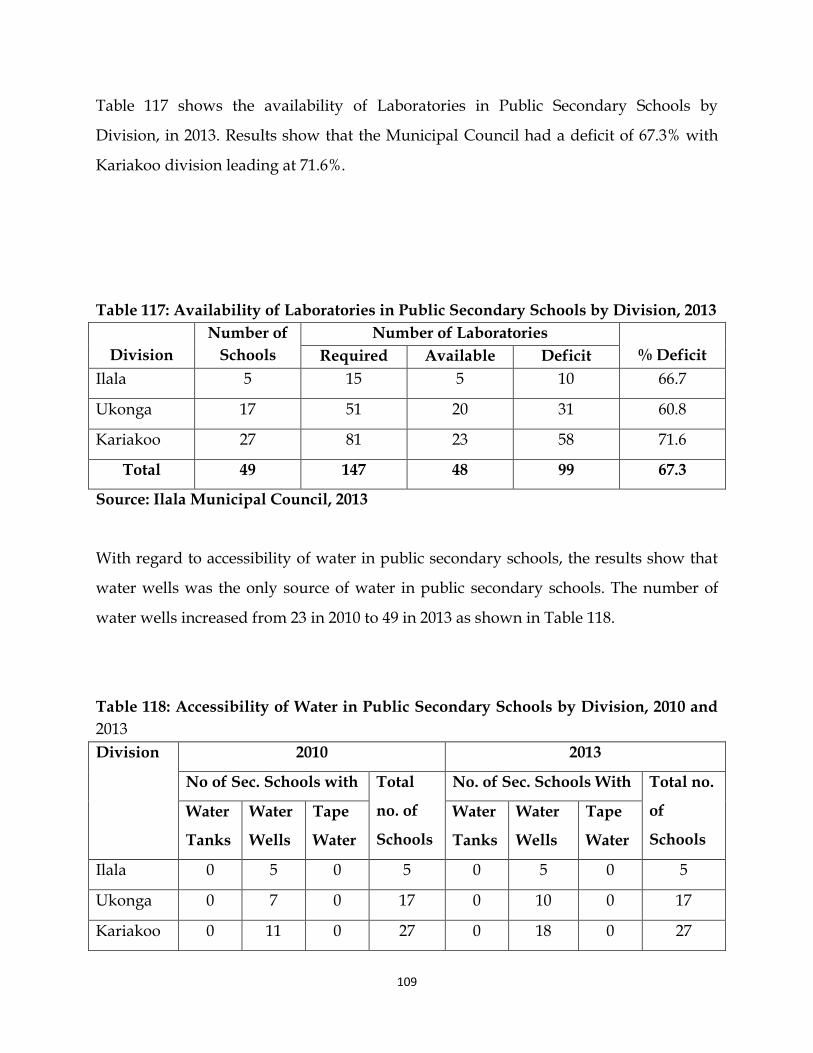
109
Table 117 shows the availability of Laboratories in Public Secondary Schools by
Division, in 2013. Results show that the Municipal Council had a deficit of 67.3% with
Kariakoo division leading at 71.6%.
Table 117: Availability of Laboratories in Public Secondary Schools by Division, 2013
Division
Number of
Schools
Number of Laboratories
% Deficit Required Available Deficit
Ilala 5 15 5 10 66.7
Ukonga 17 51 20 31 60.8
Kariakoo 27 81 23 58 71.6
Total 49 147 48 99 67.3
Source: Ilala Municipal Council, 2013
With regard to accessibility of water in public secondary schools, the results show that
water wells was the only source of water in public secondary schools. The number of
water wells increased from 23 in 2010 to 49 in 2013 as shown in Table 118.
Table 118: Accessibility of Water in Public Secondary Schools by Division, 2010 and
2013
Division 2010 2013
No of Sec. Schools with Total
no. of
Schools
No. of Sec. Schools With Total no.
of
Schools
Water
Tanks
Water
Wells
Tape
Water
Water
Tanks
Water
Wells
Tape
Water
Ilala 0 5 0 5 0 5 0 5
Ukonga 0 7 0 17 0 10 0 17
Kariakoo 0 11 0 27 0 18 0 27

110
Total 0 23 0 49 0 33 0 49
Source: Ilala Municipal Council, 2013
4.2.5 Vocational Education and Training
This kind of training is designed to upgrade or provide in-service training of artisans
for Self-employment at the semi-skilled or skilled levels in any branch of economic
activity. It can be provided as on the job training or combination of the two.
There has been new curriculum programmes introduced. The formation of this
programme is involved from the need to create a flexible vocational education and
training system to operate based on the Adult learners who are much interested to
increase their knowledge and skills in activities required in a particular occupation in
order to fight poverty. The major trainings offered are Home Economics, Agriculture
and livestock, carpentry, Home electricity installment, motor-electricity, masonry and
welding. Available data for Vocation Training Enrollment are shown in Table 119.
Table 119: Vocational Training Enrollment (2001-2006)
Year Type of Training
Carpentry Electricity Domestic
Science
Masonry Welding Total
2001 21 100 15 9 6 151
2002 16 91 18 25 8 158
2003 19 90 20 12 6 147
2004 18 86 10 7 5 126
2005 20 62 15 15 5 117
2006 16 60 43 13 21 153
Total 110 489 121 81 51 852
Source: Ilala Municipal Council, 2013
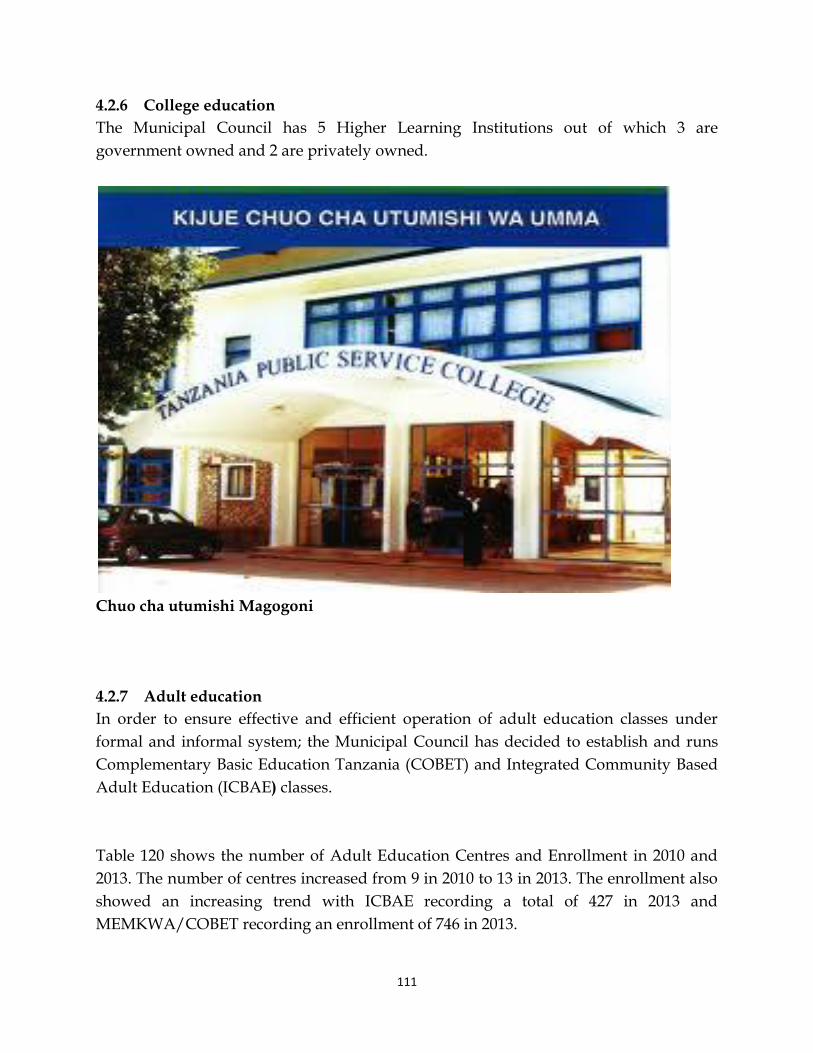
111
4.2.6 College education
The Municipal Council has 5 Higher Learning Institutions out of which 3 are
government owned and 2 are privately owned.
Chuo cha utumishi Magogoni
4.2.7 Adult education
In order to ensure effective and efficient operation of adult education classes under
formal and informal system; the Municipal Council has decided to establish and runs
Complementary Basic Education Tanzania (COBET) and Integrated Community Based
Adult Education (ICBAE) classes.
Table 120 shows the number of Adult Education Centres and Enrollment in 2010 and
2013. The number of centres increased from 9 in 2010 to 13 in 2013. The enrollment also
showed an increasing trend with ICBAE recording a total of 427 in 2013 and
MEMKWA/COBET recording an enrollment of 746 in 2013.
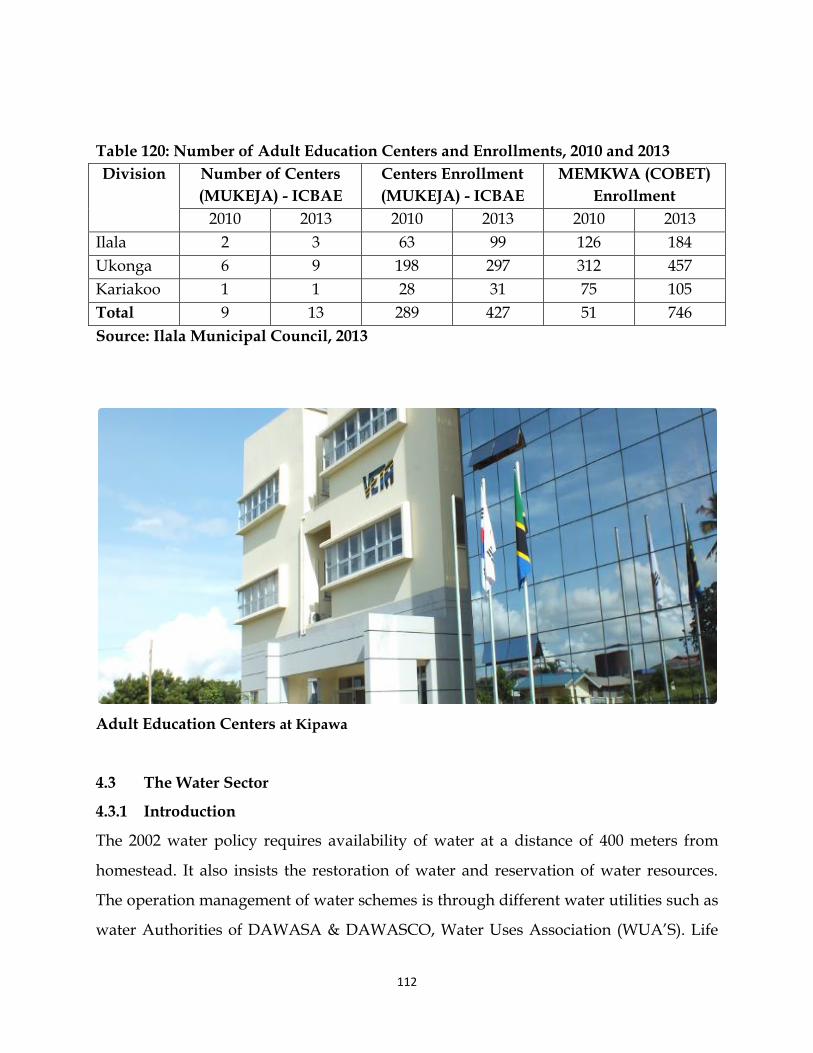
112
Table 120: Number of Adult Education Centers and Enrollments, 2010 and 2013
Division Number of Centers
(MUKEJA) - ICBAE
Centers Enrollment
(MUKEJA) - ICBAE
MEMKWA (COBET)
Enrollment
2010 2013 2010 2013 2010 2013
Ilala 2 3 63 99 126 184
Ukonga 6 9 198 297 312 457
Kariakoo 1 1 28 31 75 105
Total 9 13 289 427 51 746
Source: Ilala Municipal Council, 2013
Adult Education Centers at Kipawa
4.3 The Water Sector
4.3.1 Introduction
The 2002 water policy requires availability of water at a distance of 400 meters from
homestead. It also insists the restoration of water and reservation of water resources.
The operation management of water schemes is through different water utilities such as
water Authorities of DAWASA & DAWASCO, Water Uses Association (WUA’S). Life
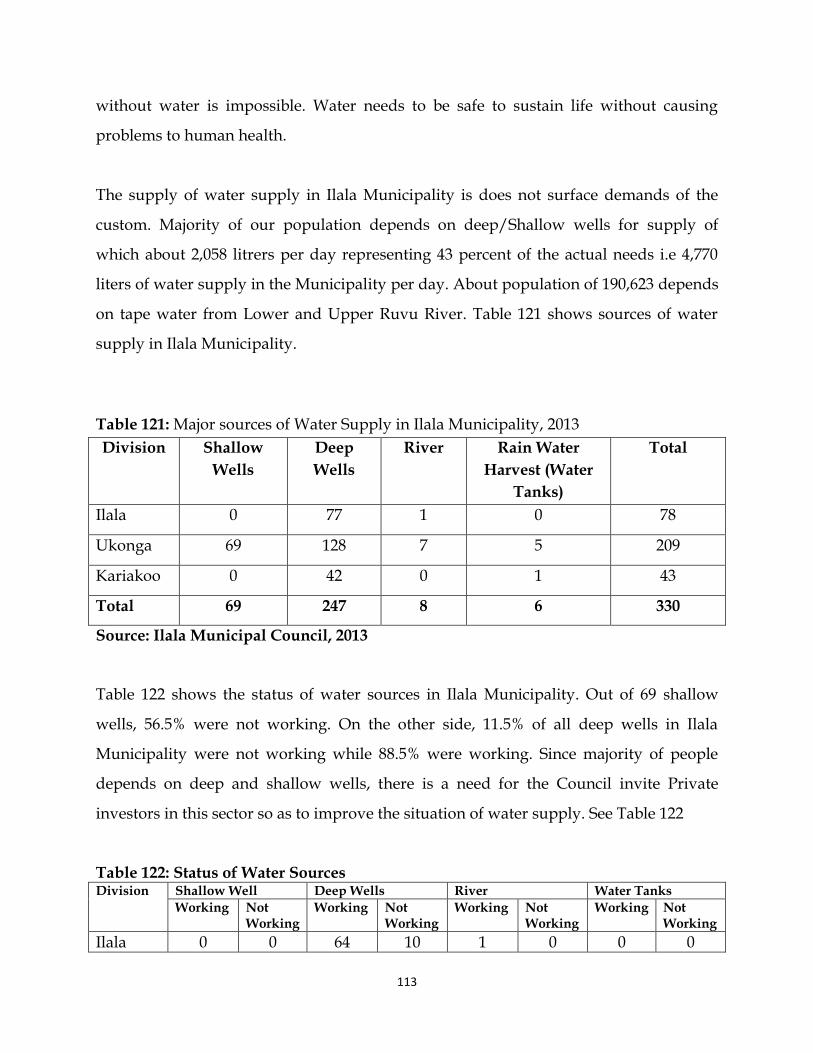
113
without water is impossible. Water needs to be safe to sustain life without causing
problems to human health.
The supply of water supply in Ilala Municipality is does not surface demands of the
custom. Majority of our population depends on deep/Shallow wells for supply of
which about 2,058 litrers per day representing 43 percent of the actual needs i.e 4,770
liters of water supply in the Municipality per day. About population of 190,623 depends
on tape water from Lower and Upper Ruvu River. Table 121 shows sources of water
supply in Ilala Municipality.
Table 121: Major sources of Water Supply in Ilala Municipality, 2013
Division Shallow
Wells
Deep
Wells
River Rain Water
Harvest (Water
Tanks)
Total
Ilala 0 77 1 0 78
Ukonga 69 128 7 5 209
Kariakoo 0 42 0 1 43
Total 69 247 8 6 330
Source: Ilala Municipal Council, 2013
Table 122 shows the status of water sources in Ilala Municipality. Out of 69 shallow
wells, 56.5% were not working. On the other side, 11.5% of all deep wells in Ilala
Municipality were not working while 88.5% were working. Since majority of people
depends on deep and shallow wells, there is a need for the Council invite Private
investors in this sector so as to improve the situation of water supply. See Table 122
Table 122: Status of Water Sources Division Shallow Well Deep Wells River Water Tanks
Working Not Working
Working Not Working
Working Not Working
Working Not Working
Ilala 0 0 64 10 1 0 0 0
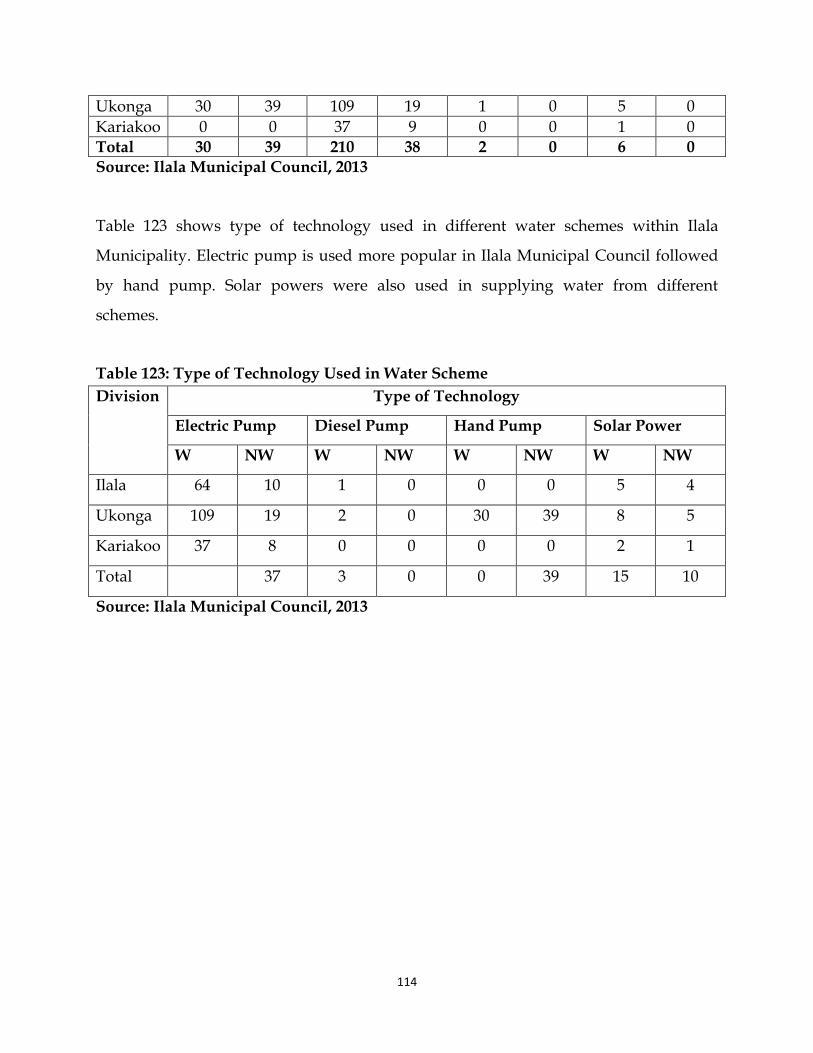
114
Ukonga 30 39 109 19 1 0 5 0
Kariakoo 0 0 37 9 0 0 1 0 Total 30 39 210 38 2 0 6 0
Source: Ilala Municipal Council, 2013
Table 123 shows type of technology used in different water schemes within Ilala
Municipality. Electric pump is used more popular in Ilala Municipal Council followed
by hand pump. Solar powers were also used in supplying water from different
schemes.
Table 123: Type of Technology Used in Water Scheme
Division Type of Technology
Electric Pump Diesel Pump Hand Pump Solar Power
W NW W NW W NW W NW
Ilala 64 10 1 0 0 0 5 4
Ukonga 109 19 2 0 30 39 8 5
Kariakoo 37 8 0 0 0 0 2 1
Total 37 3 0 0 39 15 10
Source: Ilala Municipal Council, 2013
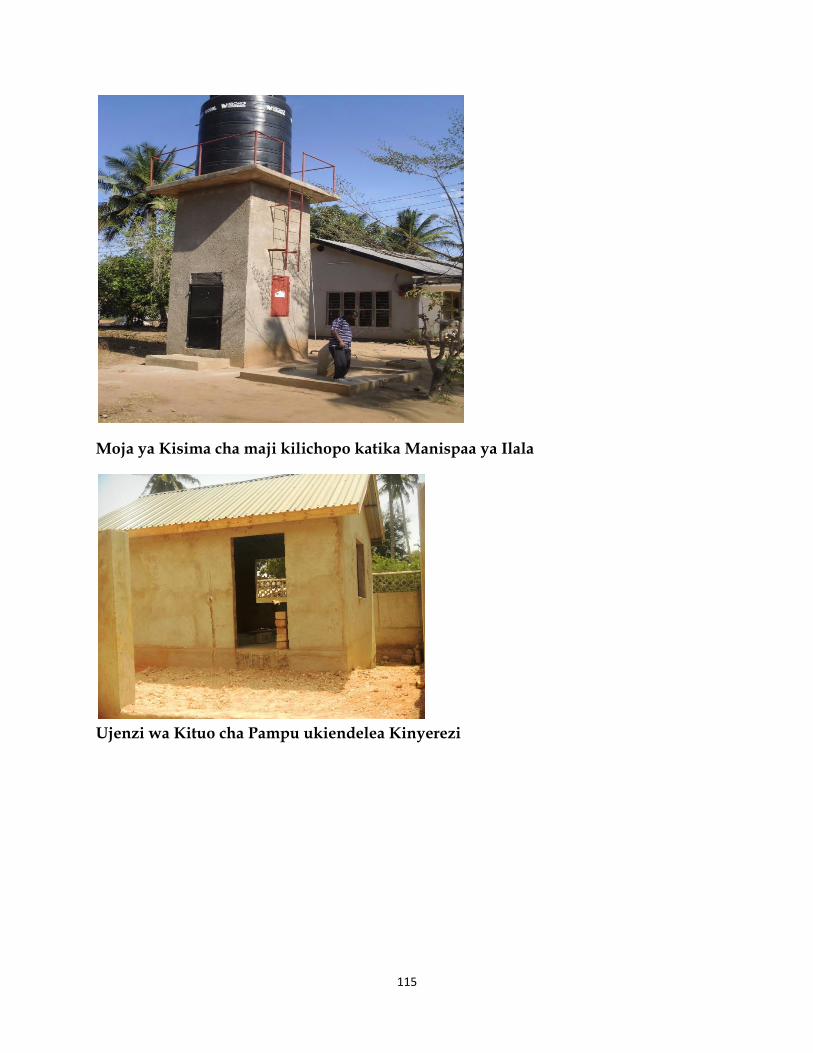
115
Moja ya Kisima cha maji kilichopo katika Manispaa ya Ilala
Ujenzi wa Kituo cha Pampu ukiendelea Kinyerezi
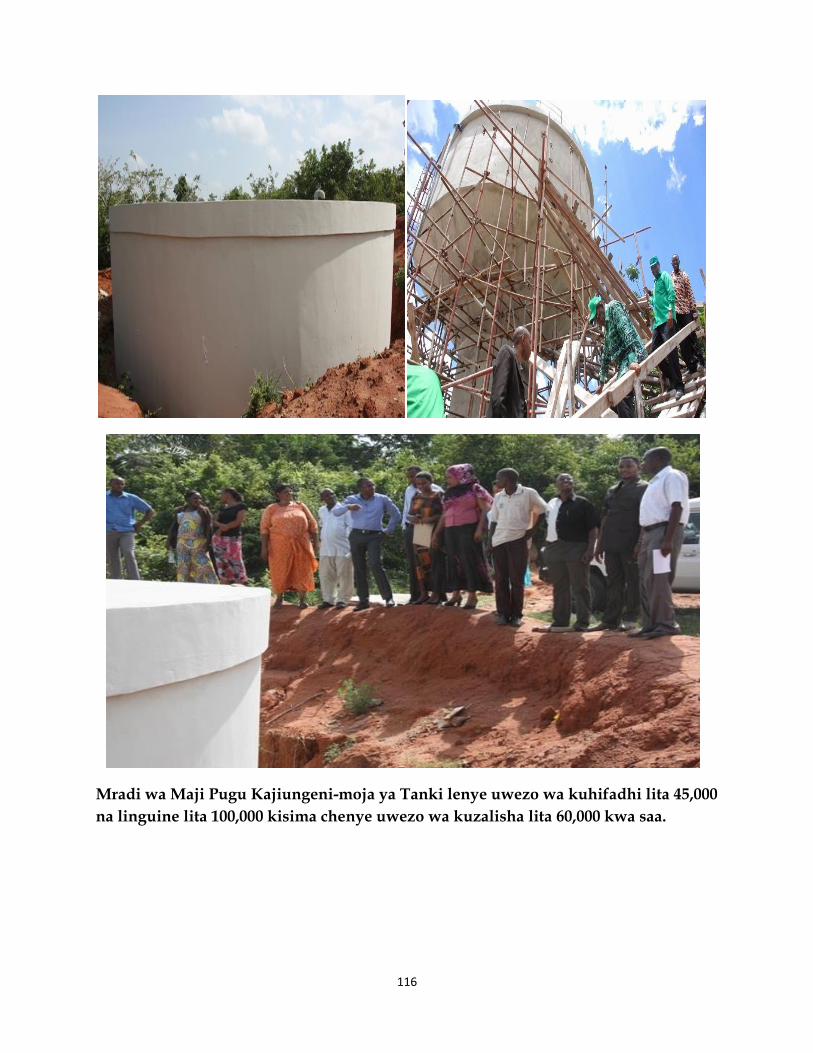
116
Mradi wa Maji Pugu Kajiungeni-moja ya Tanki lenye uwezo wa kuhifadhi lita 45,000
na linguine lita 100,000 kisima chenye uwezo wa kuzalisha lita 60,000 kwa saa.
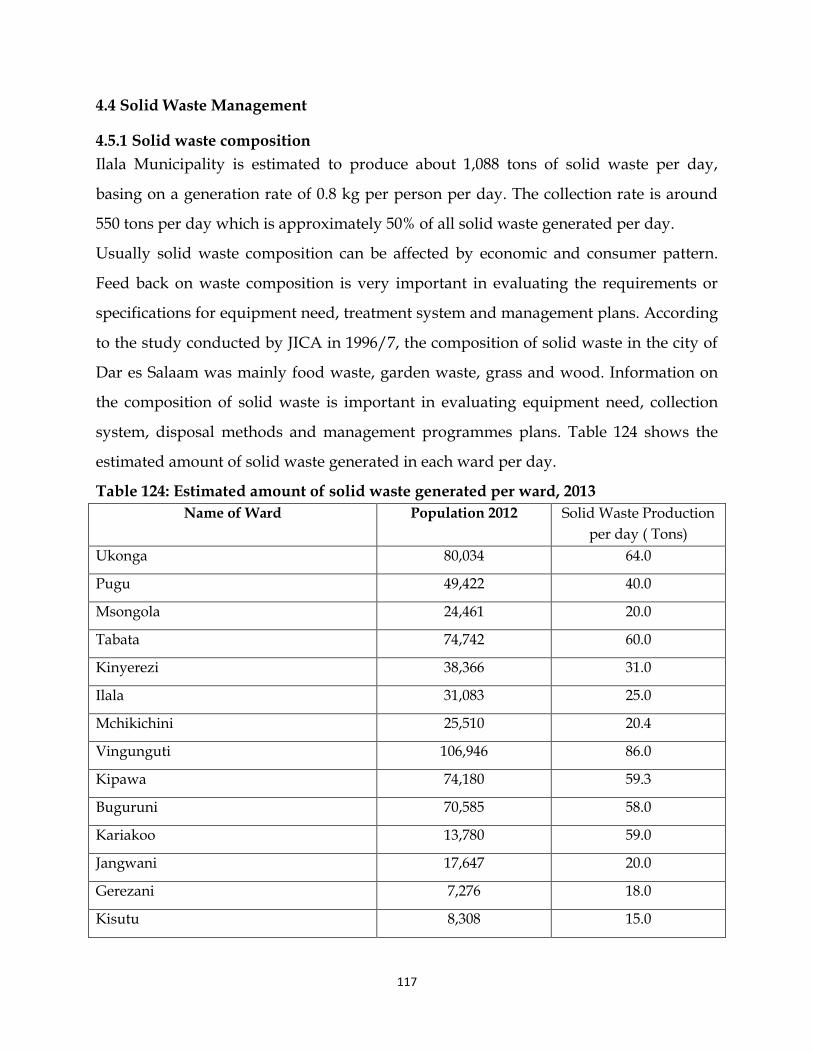
117
4.4 Solid Waste Management
4.5.1 Solid waste composition
Ilala Municipality is estimated to produce about 1,088 tons of solid waste per day,
basing on a generation rate of 0.8 kg per person per day. The collection rate is around
550 tons per day which is approximately 50% of all solid waste generated per day.
Usually solid waste composition can be affected by economic and consumer pattern.
Feed back on waste composition is very important in evaluating the requirements or
specifications for equipment need, treatment system and management plans. According
to the study conducted by JICA in 1996/7, the composition of solid waste in the city of
Dar es Salaam was mainly food waste, garden waste, grass and wood. Information on
the composition of solid waste is important in evaluating equipment need, collection
system, disposal methods and management programmes plans. Table 124 shows the
estimated amount of solid waste generated in each ward per day.
Table 124: Estimated amount of solid waste generated per ward, 2013
Name of Ward Population 2012 Solid Waste Production
per day ( Tons)
Ukonga 80,034 64.0
Pugu 49,422 40.0
Msongola 24,461 20.0
Tabata 74,742 60.0
Kinyerezi 38,366 31.0
Ilala 31,083 25.0
Mchikichini 25,510 20.4
Vingunguti 106,946 86.0
Kipawa 74,180 59.3
Buguruni 70,585 58.0
Kariakoo 13,780 59.0
Jangwani 17,647 20.0
Gerezani 7,276 18.0
Kisutu 8,308 15.0
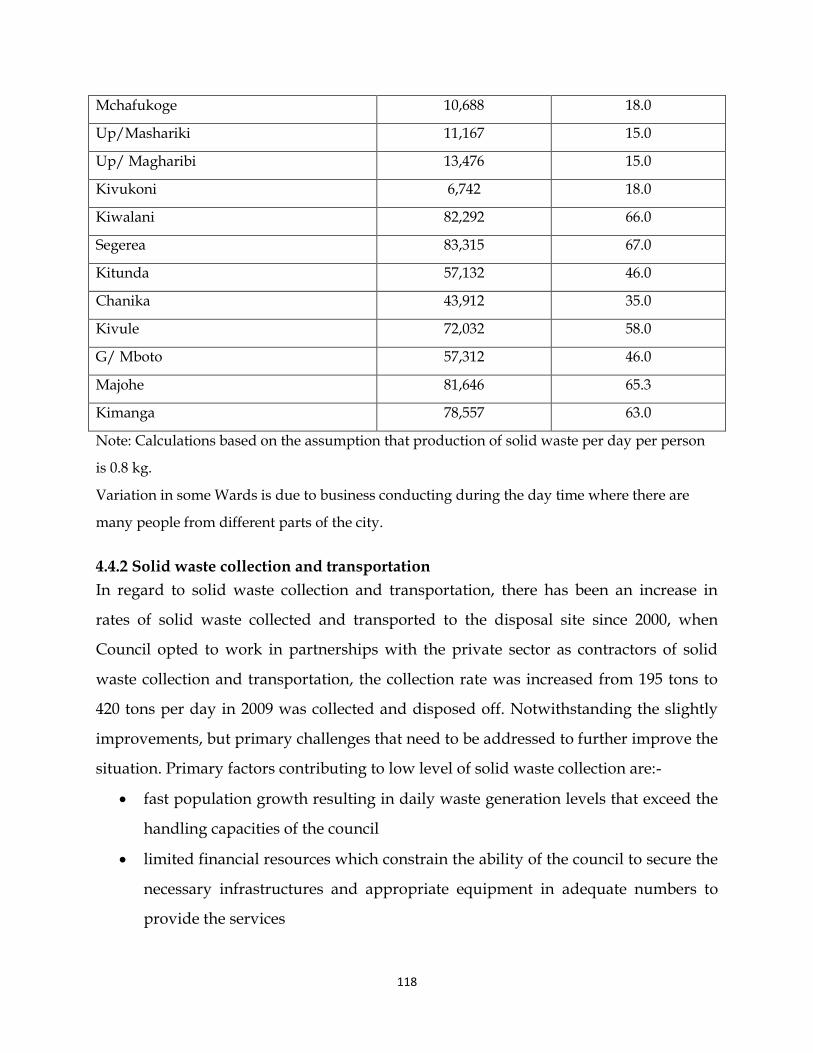
118
Mchafukoge 10,688 18.0
Up/Mashariki 11,167 15.0
Up/ Magharibi 13,476 15.0
Kivukoni 6,742 18.0
Kiwalani 82,292 66.0
Segerea 83,315 67.0
Kitunda 57,132 46.0
Chanika 43,912 35.0
Kivule 72,032 58.0
G/ Mboto 57,312 46.0
Majohe 81,646 65.3
Kimanga 78,557 63.0
Note: Calculations based on the assumption that production of solid waste per day per person
is 0.8 kg.
Variation in some Wards is due to business conducting during the day time where there are
many people from different parts of the city.
4.4.2 Solid waste collection and transportation
In regard to solid waste collection and transportation, there has been an increase in
rates of solid waste collected and transported to the disposal site since 2000, when
Council opted to work in partnerships with the private sector as contractors of solid
waste collection and transportation, the collection rate was increased from 195 tons to
420 tons per day in 2009 was collected and disposed off. Notwithstanding the slightly
improvements, but primary challenges that need to be addressed to further improve the
situation. Primary factors contributing to low level of solid waste collection are:-
fast population growth resulting in daily waste generation levels that exceed the
handling capacities of the council
limited financial resources which constrain the ability of the council to secure the
necessary infrastructures and appropriate equipment in adequate numbers to
provide the services
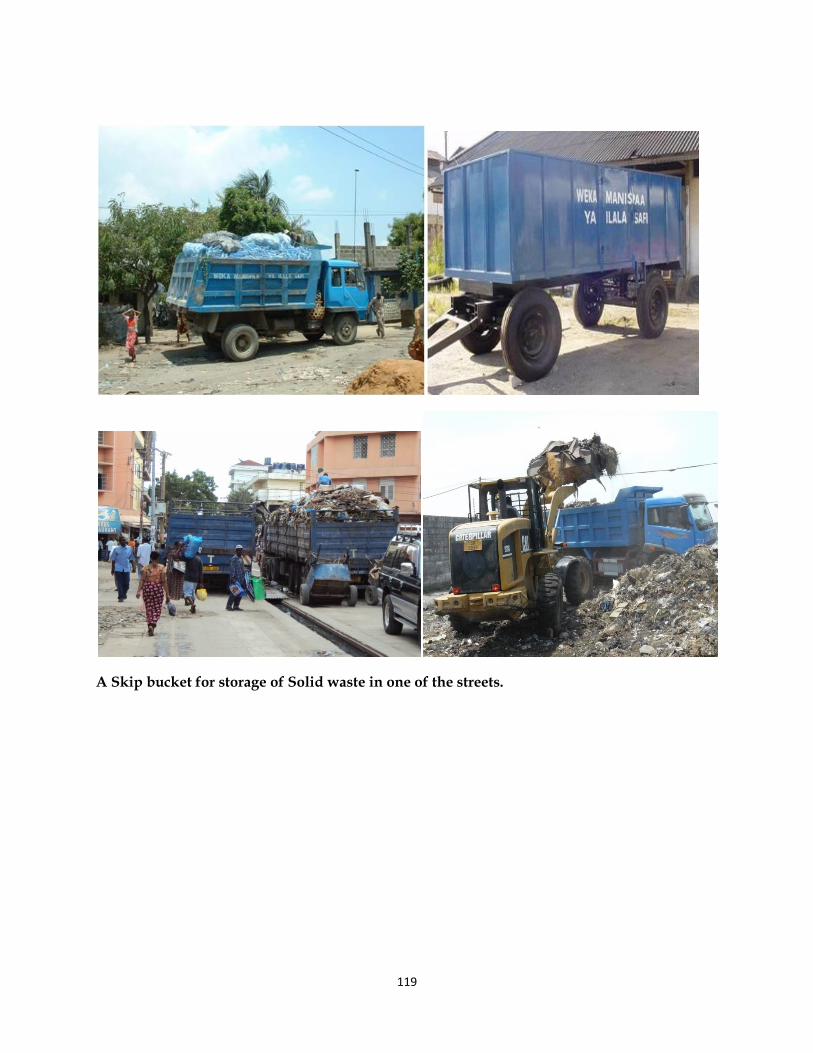
119
A Skip bucket for storage of Solid waste in one of the streets.

120
SECTION V OTHER DEVELOPMENT ISSUES
5.1 Day Care Centres
Nowadays parents tend to put children through day care centres and pre-schools prior
to join primary school education. In so doing children are prepared for the competition
in primary and secondary education. Children of age group of 3 to 4 are being sent to
day care centres while those in age group of 5 to 6 are found in pre-primary schools.
Table 125 shows the distribution of day care centres by division.
Table 125: Distributions of Day Care Centres by Division, 2010 and 2013
Division Number of Centres in 2013 Number of Centres in 2013
Ilala 12 18
Ukonga 8 14
Kariakoo 10 16
Total 30 58
Source: Ilala Municipal Council, 2013
In 2010, the Municipality had 30 day care centers, 40% of all centre were found in Ilala
division and 33.3% were from Kariakoo division. In 2013, the number of day care
centres increased to 58 equivalent to 93.3% increases compared to number of day care
centre in 2010. See Table 125.
5.2 Orphans and Most Vulnerable Children
Table 126 shows the number of orphans in Ilala Municipality by division. Results indicate that
The Municipal Council had a total number of 4,540 orphans out of which male were 2,243 and
female were 2,297. Ukonga division had the highest number of orphans at 56% followed by Ilala
division at 29.4%. See Table 126.
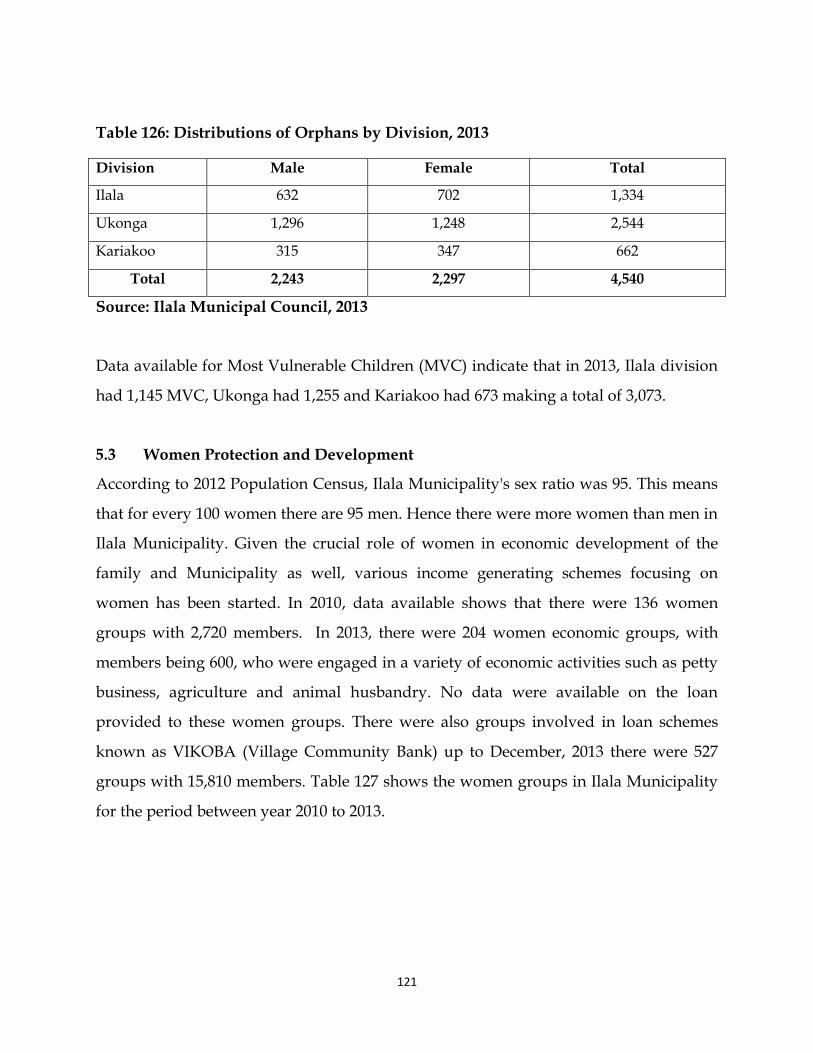
121
Table 126: Distributions of Orphans by Division, 2013
Division Male Female Total
Ilala 632 702 1,334
Ukonga 1,296 1,248 2,544
Kariakoo 315 347 662
Total 2,243 2,297 4,540
Source: Ilala Municipal Council, 2013
Data available for Most Vulnerable Children (MVC) indicate that in 2013, Ilala division
had 1,145 MVC, Ukonga had 1,255 and Kariakoo had 673 making a total of 3,073.
5.3 Women Protection and Development
According to 2012 Population Census, Ilala Municipality's sex ratio was 95. This means
that for every 100 women there are 95 men. Hence there were more women than men in
Ilala Municipality. Given the crucial role of women in economic development of the
family and Municipality as well, various income generating schemes focusing on
women has been started. In 2010, data available shows that there were 136 women
groups with 2,720 members. In 2013, there were 204 women economic groups, with
members being 600, who were engaged in a variety of economic activities such as petty
business, agriculture and animal husbandry. No data were available on the loan
provided to these women groups. There were also groups involved in loan schemes
known as VIKOBA (Village Community Bank) up to December, 2013 there were 527
groups with 15,810 members. Table 127 shows the women groups in Ilala Municipality
for the period between year 2010 to 2013.
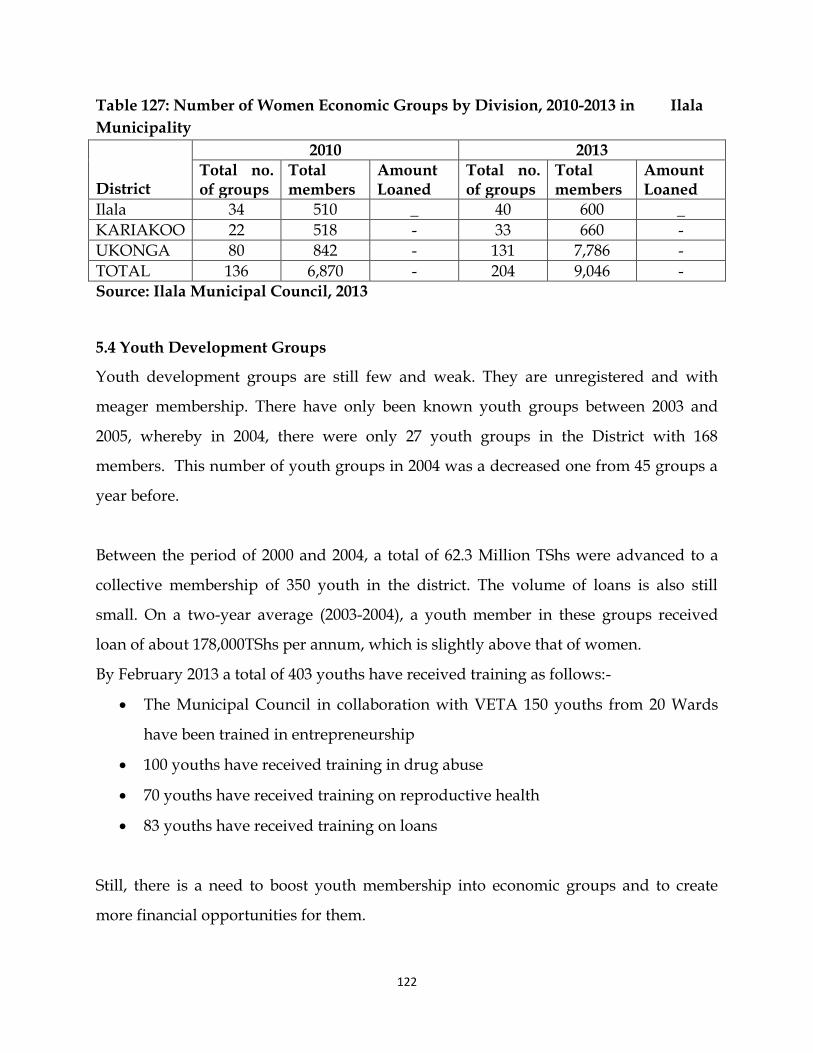
122
Table 127: Number of Women Economic Groups by Division, 2010-2013 in Ilala
Municipality
District
2010 2013
Total no. of groups
Total members
Amount Loaned
Total no. of groups
Total members
Amount Loaned
Ilala 34 510 _ 40 600 _
KARIAKOO 22 518 - 33 660 -
UKONGA 80 842 - 131 7,786 -
TOTAL 136 6,870 - 204 9,046 - Source: Ilala Municipal Council, 2013
5.4 Youth Development Groups
Youth development groups are still few and weak. They are unregistered and with
meager membership. There have only been known youth groups between 2003 and
2005, whereby in 2004, there were only 27 youth groups in the District with 168
members. This number of youth groups in 2004 was a decreased one from 45 groups a
year before.
Between the period of 2000 and 2004, a total of 62.3 Million TShs were advanced to a
collective membership of 350 youth in the district. The volume of loans is also still
small. On a two-year average (2003-2004), a youth member in these groups received
loan of about 178,000TShs per annum, which is slightly above that of women.
By February 2013 a total of 403 youths have received training as follows:-
The Municipal Council in collaboration with VETA 150 youths from 20 Wards
have been trained in entrepreneurship
100 youths have received training in drug abuse
70 youths have received training on reproductive health
83 youths have received training on loans
Still, there is a need to boost youth membership into economic groups and to create
more financial opportunities for them.
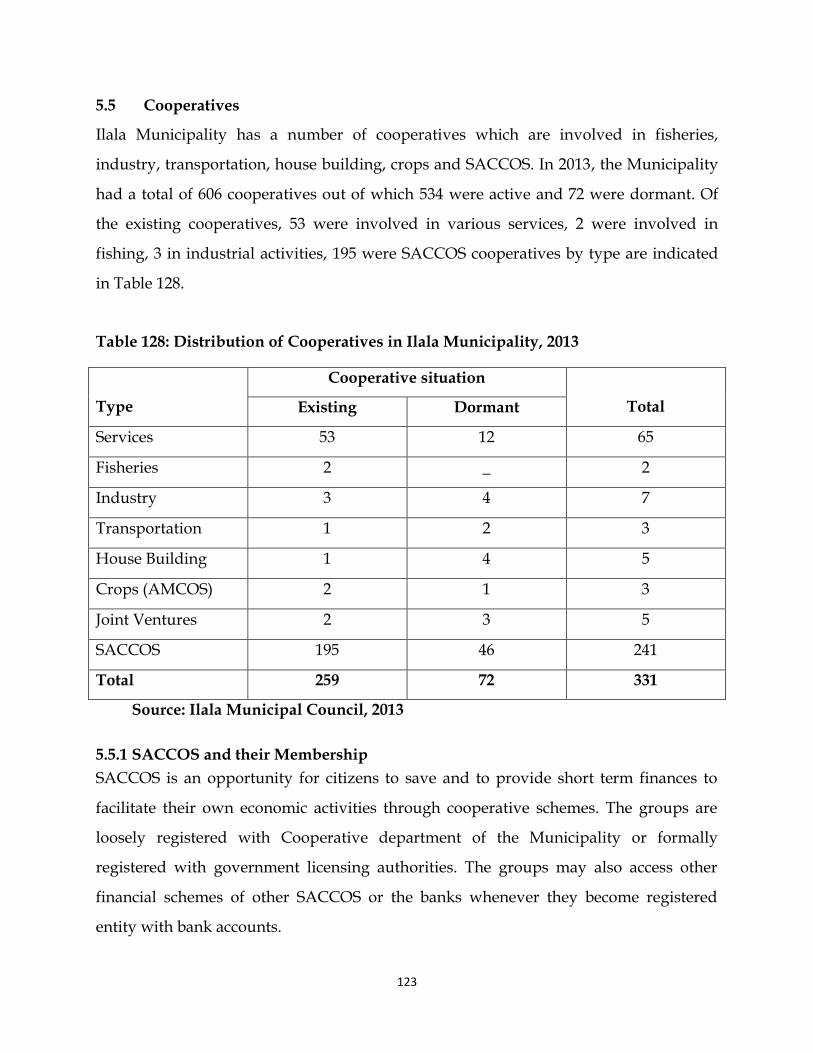
123
5.5 Cooperatives
Ilala Municipality has a number of cooperatives which are involved in fisheries,
industry, transportation, house building, crops and SACCOS. In 2013, the Municipality
had a total of 606 cooperatives out of which 534 were active and 72 were dormant. Of
the existing cooperatives, 53 were involved in various services, 2 were involved in
fishing, 3 in industrial activities, 195 were SACCOS cooperatives by type are indicated
in Table 128.
Table 128: Distribution of Cooperatives in Ilala Municipality, 2013
Type
Cooperative situation
Total Existing Dormant
Services 53 12 65
Fisheries 2 _ 2
Industry 3 4 7
Transportation 1 2 3
House Building 1 4 5
Crops (AMCOS) 2 1 3
Joint Ventures 2 3 5
SACCOS 195 46 241
Total 259 72 331
Source: Ilala Municipal Council, 2013
5.5.1 SACCOS and their Membership
SACCOS is an opportunity for citizens to save and to provide short term finances to
facilitate their own economic activities through cooperative schemes. The groups are
loosely registered with Cooperative department of the Municipality or formally
registered with government licensing authorities. The groups may also access other
financial schemes of other SACCOS or the banks whenever they become registered
entity with bank accounts.

124
The SACCOS are advanced economic groups than the women or youth groups. They
attract more members, substantial loan volumes and average distribution of loans per
member is also higher. Table 129 shows that in the 2013 the Ilala Municipality had 240
SACCOS with the Total Value of Shares amounting to TShs 4,406,720,800/= as per
31st/12/2013. Total Money Loaned to members was TShs 196,615,950,200/=. The distribution
of SACCOS by divisions and members is indicated in Table 129.
Table 129: Distribution of SACCOS and their membership by division, Ilala
Municipality, 2013
Division
Members Amount (Tshs)
SACCOS Members Total Value of Shares in
TShs as at 31/12/2013
Total Money Loaned
to Members (TShs).
Ilala 208 68,447 3,818,060,995.00 170,400,490,173.00
Ukonga 12 3,950 2,203,360.00 9,830,797,510.00
Kariakoo 20 6,603 586,456,445.00 16,384,662,517.00
Total 240 79,000 4,406,720,800.00 196,615,950,200.00
Source: Ilala Municipal Council, 2013
5.5.2 Financial Institutions in Ilala Municipality
There are a number of financial institutions in Ilala Municipality which offer a number
of services which include loans provision and savings to these clients. The distributions
of financial institutions available in Ilala Municipality are indicated in Table 130.
Table 130: Financial Institutions in Ilala Municipality, 2013
Type of Institutions Number of Institutions Area of Concentrations
CRDB 8 Loans, Savings
ACCESS BANK 4 Loans, Savings
BANK ABC 3 Loans, Savings
NBC 5 Loans, Savings
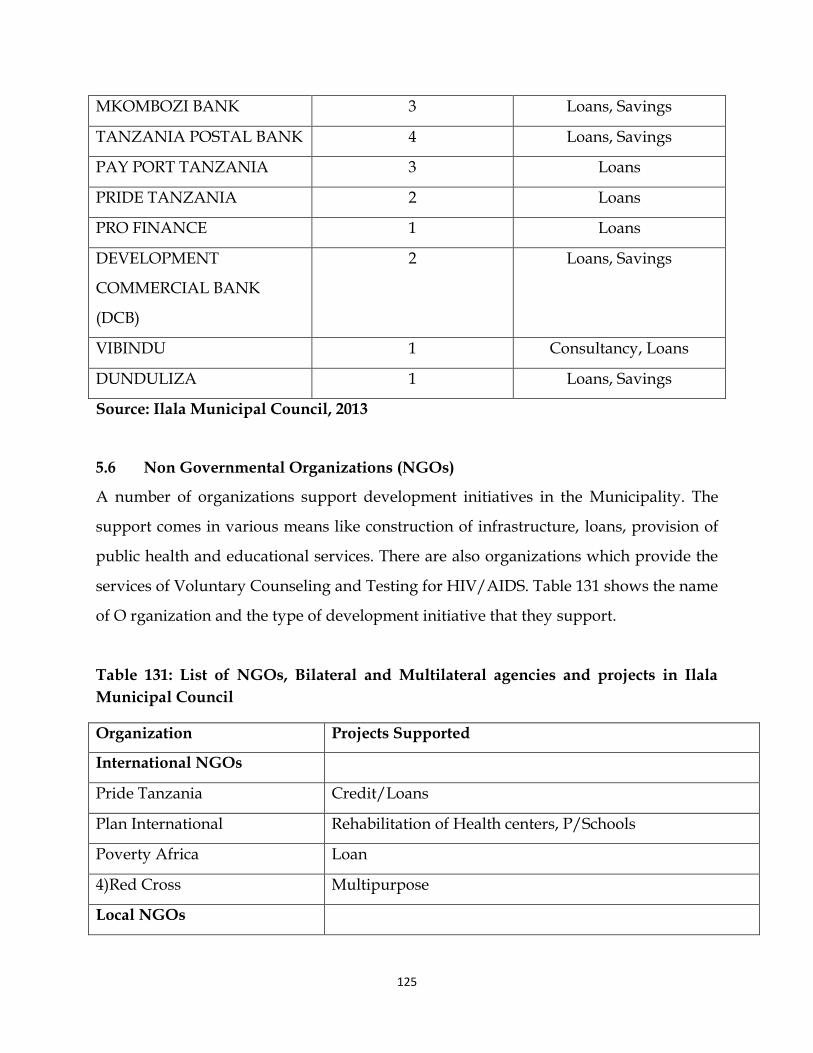
125
MKOMBOZI BANK 3 Loans, Savings
TANZANIA POSTAL BANK 4 Loans, Savings
PAY PORT TANZANIA 3 Loans
PRIDE TANZANIA 2 Loans
PRO FINANCE 1 Loans
DEVELOPMENT
COMMERCIAL BANK
(DCB)
2 Loans, Savings
VIBINDU 1 Consultancy, Loans
DUNDULIZA 1 Loans, Savings
Source: Ilala Municipal Council, 2013
5.6 Non Governmental Organizations (NGOs)
A number of organizations support development initiatives in the Municipality. The
support comes in various means like construction of infrastructure, loans, provision of
public health and educational services. There are also organizations which provide the
services of Voluntary Counseling and Testing for HIV/AIDS. Table 131 shows the name
of O rganization and the type of development initiative that they support.
Table 131: List of NGOs, Bilateral and Multilateral agencies and projects in Ilala
Municipal Council
Organization Projects Supported
International NGOs
Pride Tanzania Credit/Loans
Plan International Rehabilitation of Health centers, P/Schools
Poverty Africa Loan
4)Red Cross Multipurpose
Local NGOs
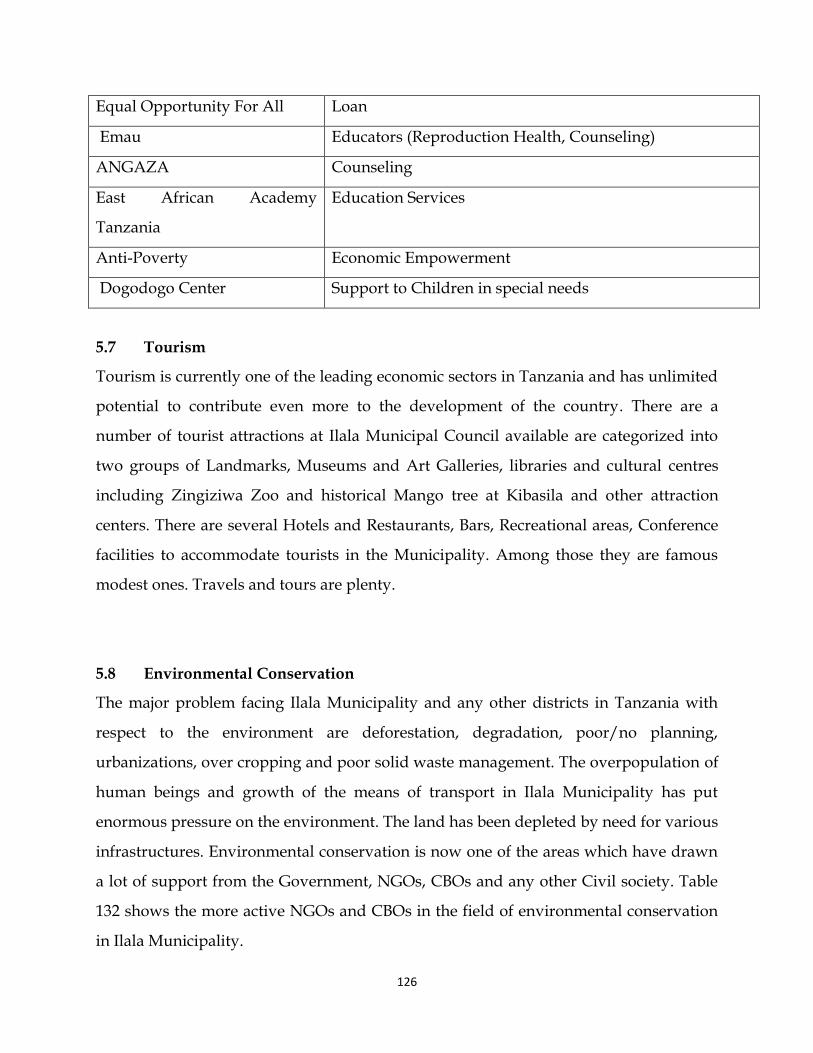
126
Equal Opportunity For All Loan
Emau Educators (Reproduction Health, Counseling)
ANGAZA Counseling
East African Academy
Tanzania
Education Services
Anti-Poverty Economic Empowerment
Dogodogo Center Support to Children in special needs
5.7 Tourism
Tourism is currently one of the leading economic sectors in Tanzania and has unlimited
potential to contribute even more to the development of the country. There are a
number of tourist attractions at Ilala Municipal Council available are categorized into
two groups of Landmarks, Museums and Art Galleries, libraries and cultural centres
including Zingiziwa Zoo and historical Mango tree at Kibasila and other attraction
centers. There are several Hotels and Restaurants, Bars, Recreational areas, Conference
facilities to accommodate tourists in the Municipality. Among those they are famous
modest ones. Travels and tours are plenty.
5.8 Environmental Conservation
The major problem facing Ilala Municipality and any other districts in Tanzania with
respect to the environment are deforestation, degradation, poor/no planning,
urbanizations, over cropping and poor solid waste management. The overpopulation of
human beings and growth of the means of transport in Ilala Municipality has put
enormous pressure on the environment. The land has been depleted by need for various
infrastructures. Environmental conservation is now one of the areas which have drawn
a lot of support from the Government, NGOs, CBOs and any other Civil society. Table
132 shows the more active NGOs and CBOs in the field of environmental conservation
in Ilala Municipality.
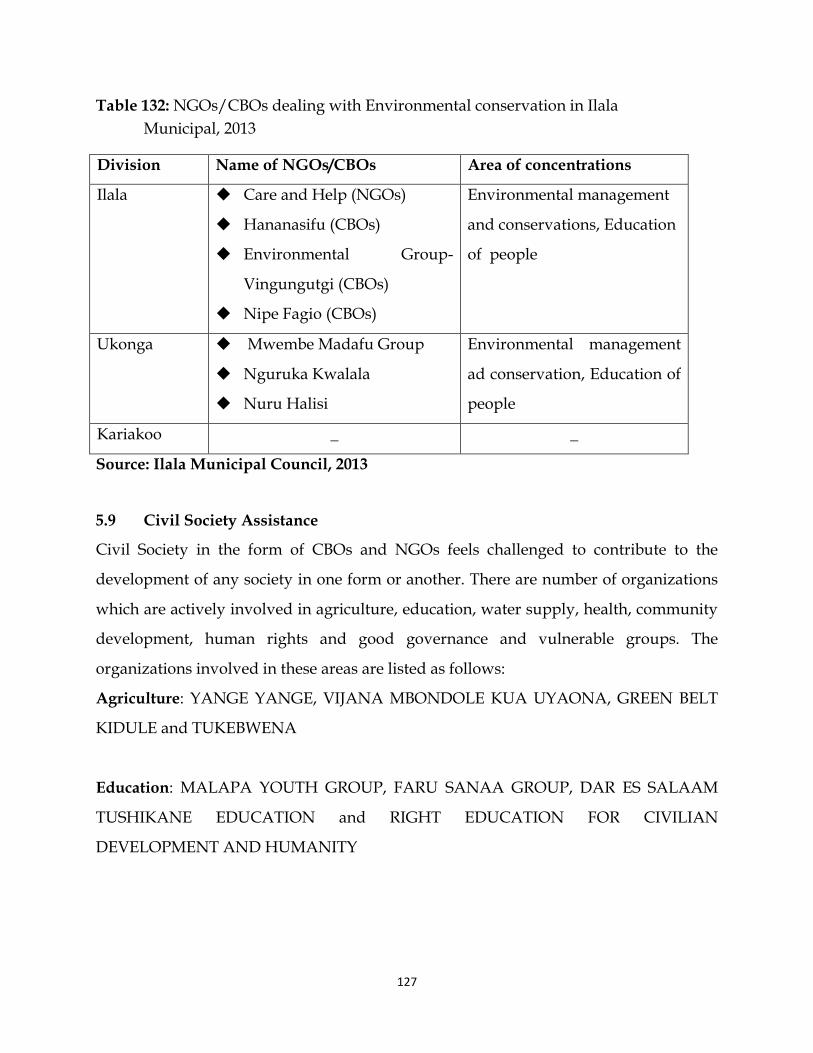
127
Table 132: NGOs/CBOs dealing with Environmental conservation in Ilala
Municipal, 2013
Division Name of NGOs/CBOs Area of concentrations
Ilala Care and Help (NGOs)
Hananasifu (CBOs)
Environmental Group-
Vingungutgi (CBOs)
Nipe Fagio (CBOs)
Environmental management
and conservations, Education
of people
Ukonga Mwembe Madafu Group
Nguruka Kwalala
Nuru Halisi
Environmental management
ad conservation, Education of
people
Kariakoo _ _
Source: Ilala Municipal Council, 2013
5.9 Civil Society Assistance
Civil Society in the form of CBOs and NGOs feels challenged to contribute to the
development of any society in one form or another. There are number of organizations
which are actively involved in agriculture, education, water supply, health, community
development, human rights and good governance and vulnerable groups. The
organizations involved in these areas are listed as follows:
Agriculture: YANGE YANGE, VIJANA MBONDOLE KUA UYAONA, GREEN BELT
KIDULE and TUKEBWENA
Education: MALAPA YOUTH GROUP, FARU SANAA GROUP, DAR ES SALAAM
TUSHIKANE EDUCATION and RIGHT EDUCATION FOR CIVILIAN
DEVELOPMENT AND HUMANITY
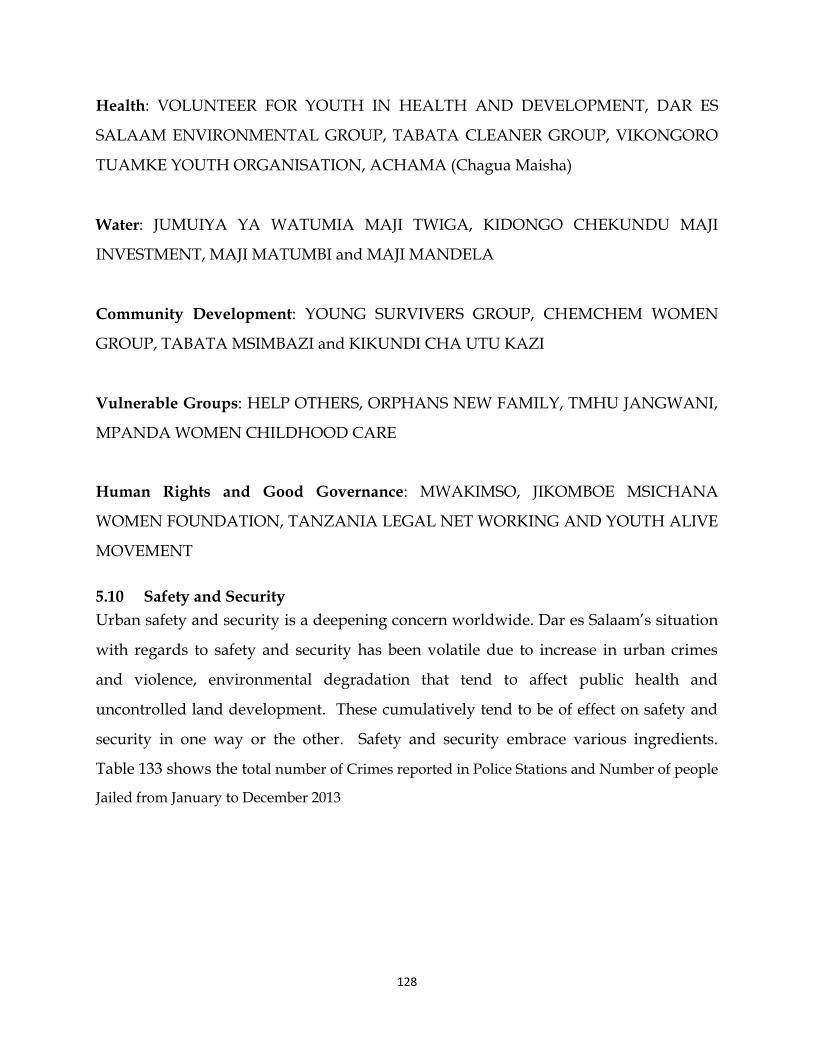
128
Health: VOLUNTEER FOR YOUTH IN HEALTH AND DEVELOPMENT, DAR ES
SALAAM ENVIRONMENTAL GROUP, TABATA CLEANER GROUP, VIKONGORO
TUAMKE YOUTH ORGANISATION, ACHAMA (Chagua Maisha)
Water: JUMUIYA YA WATUMIA MAJI TWIGA, KIDONGO CHEKUNDU MAJI
INVESTMENT, MAJI MATUMBI and MAJI MANDELA
Community Development: YOUNG SURVIVERS GROUP, CHEMCHEM WOMEN
GROUP, TABATA MSIMBAZI and KIKUNDI CHA UTU KAZI
Vulnerable Groups: HELP OTHERS, ORPHANS NEW FAMILY, TMHU JANGWANI,
MPANDA WOMEN CHILDHOOD CARE
Human Rights and Good Governance: MWAKIMSO, JIKOMBOE MSICHANA
WOMEN FOUNDATION, TANZANIA LEGAL NET WORKING AND YOUTH ALIVE
MOVEMENT
5.10 Safety and Security
Urban safety and security is a deepening concern worldwide. Dar es Salaam’s situation
with regards to safety and security has been volatile due to increase in urban crimes
and violence, environmental degradation that tend to affect public health and
uncontrolled land development. These cumulatively tend to be of effect on safety and
security in one way or the other. Safety and security embrace various ingredients.
Table 133 shows the total number of Crimes reported in Police Stations and Number of people
Jailed from January to December 2013
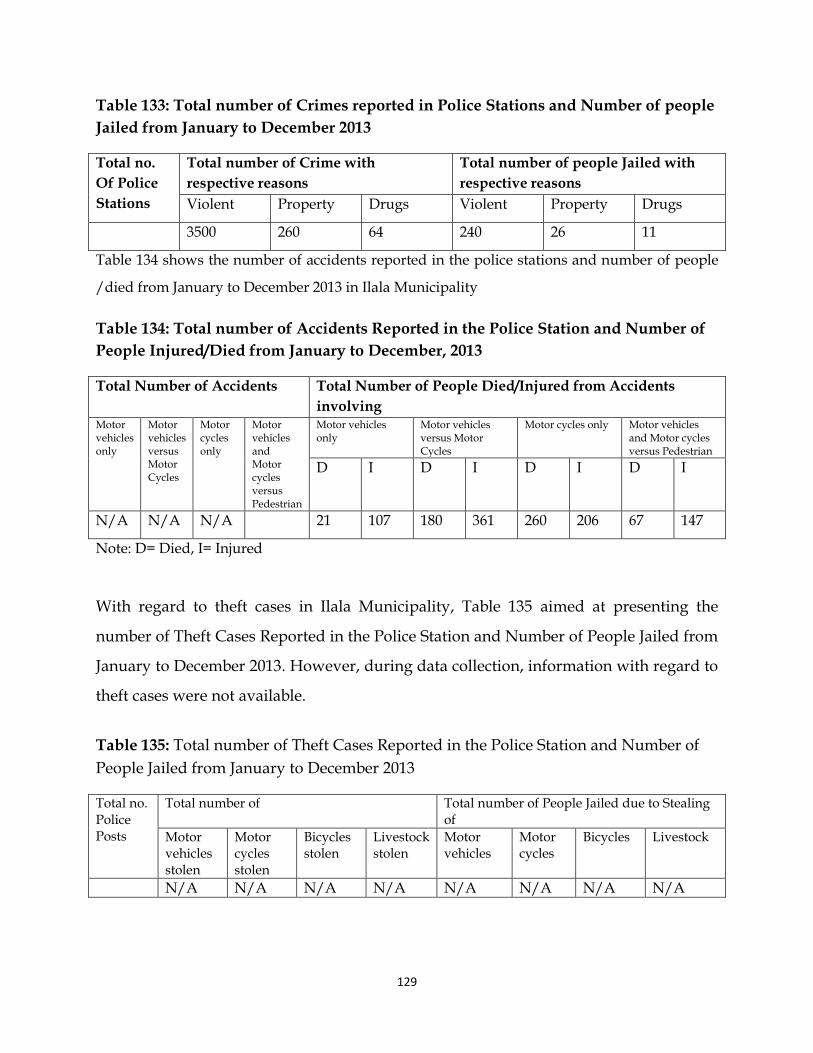
129
Table 133: Total number of Crimes reported in Police Stations and Number of people
Jailed from January to December 2013
Total no.
Of Police
Stations
Total number of Crime with
respective reasons
Total number of people Jailed with
respective reasons
Violent Property Drugs Violent Property Drugs
3500 260 64 240 26 11
Table 134 shows the number of accidents reported in the police stations and number of people
/died from January to December 2013 in Ilala Municipality
Table 134: Total number of Accidents Reported in the Police Station and Number of
People Injured/Died from January to December, 2013
Total Number of Accidents Total Number of People Died/Injured from Accidents
involving Motor vehicles only
Motor vehicles versus Motor Cycles
Motor cycles only
Motor vehicles and Motor cycles versus Pedestrian
Motor vehicles only
Motor vehicles versus Motor Cycles
Motor cycles only Motor vehicles and Motor cycles versus Pedestrian
D I D I D I D I
N/A N/A N/A 21 107 180 361 260 206 67 147
Note: D= Died, I= Injured
With regard to theft cases in Ilala Municipality, Table 135 aimed at presenting the
number of Theft Cases Reported in the Police Station and Number of People Jailed from
January to December 2013. However, during data collection, information with regard to
theft cases were not available.
Table 135: Total number of Theft Cases Reported in the Police Station and Number of
People Jailed from January to December 2013
Total no. Police Posts
Total number of Total number of People Jailed due to Stealing of
Motor vehicles stolen
Motor cycles stolen
Bicycles stolen
Livestock stolen
Motor vehicles
Motor cycles
Bicycles Livestock
N/A N/A N/A N/A N/A N/A N/A N/A
130
SECTION VI
POTENTIAL AREAS FOR INVESTMENTS
6.1 Education
Investment in the education sector at all levels from pre- primary school education to
University is now open to the private sector. Inadequate school infrastructures like
classrooms, desks, toilet, libraries and laboratories have been highlighted in section IV
of this document. Therefore, there is a very high potential in education for an investor
to make a choice. Assistance is needed to raise the standard of education. Moreover,
there is a need to invest in Teacher’s Training Colleges, University and Vocational
Training Centre.
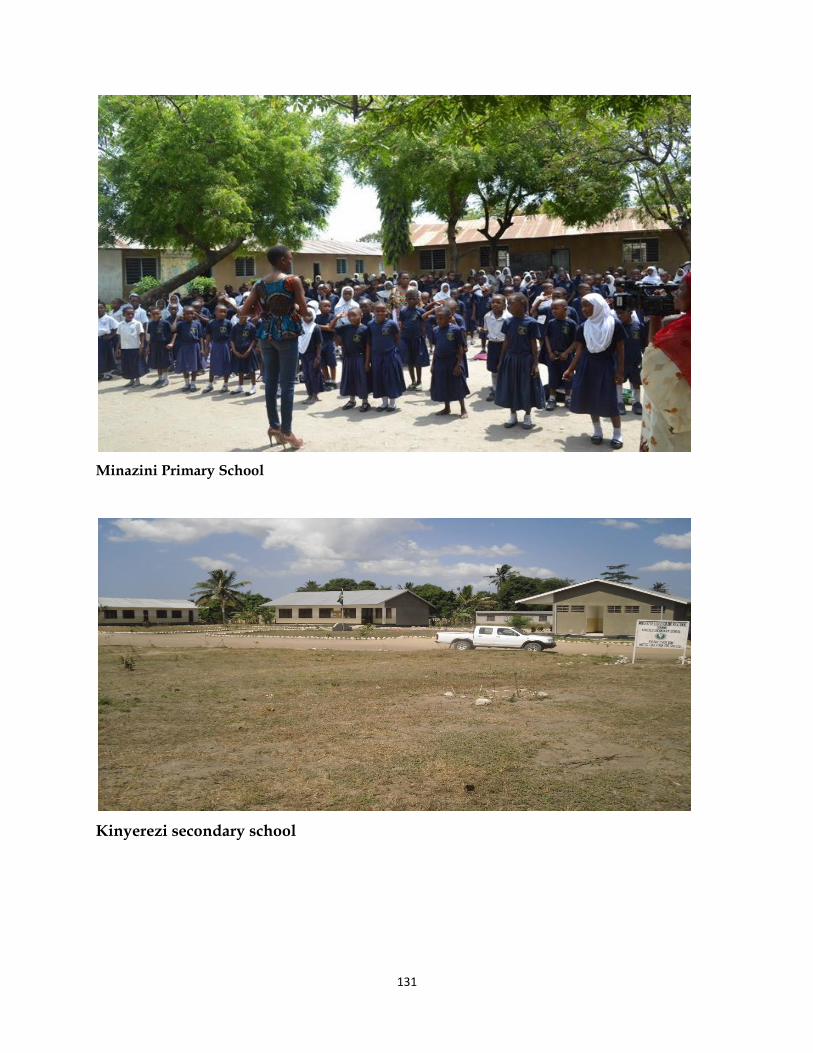
131
Minazini Primary School
Kinyerezi secondary school
132
6.2 Health
The government has opened the door for private sector investment in health services
delivery. The government has created suitable environment for privatization of the
health sector. Malaria is currently the number one cause of morbidity and deaths in
Ilala Municipality. The increased use of Insecticide Treated Materials (ITM) like
mosquito nets offers a relatively cheap method of controlling the spread of malaria.
Health education and other preventive measures are desperately required. The supply
of STD drugs at affordable prices or even the establishment of STD treatment centers in
each ward under the qualified personnel could also have positive impact on HIV
infection control. Generally, the overloaded healthcare facilities in Ilala Municipality
need support especially in the control of HIV/AIDS, Tuberculosis, Malaria, and
improvement of MCH services. The private sector can increase its stake in establishing
and running of hospitals, health centers and dispensaries, and provide the highly
needed drugs and medical equipment in affordable costs.
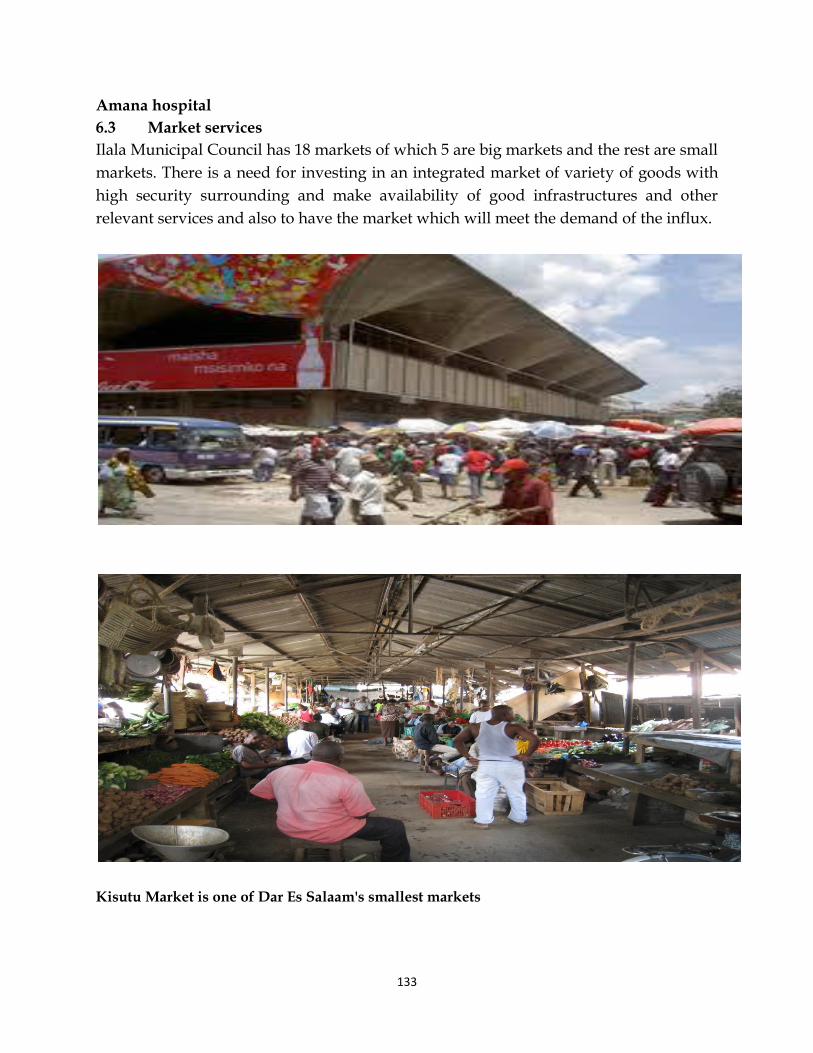
133
Amana hospital
6.3 Market services
Ilala Municipal Council has 18 markets of which 5 are big markets and the rest are small
markets. There is a need for investing in an integrated market of variety of goods with
high security surrounding and make availability of good infrastructures and other
relevant services and also to have the market which will meet the demand of the influx.
Kisutu Market is one of Dar Es Salaam's smallest markets
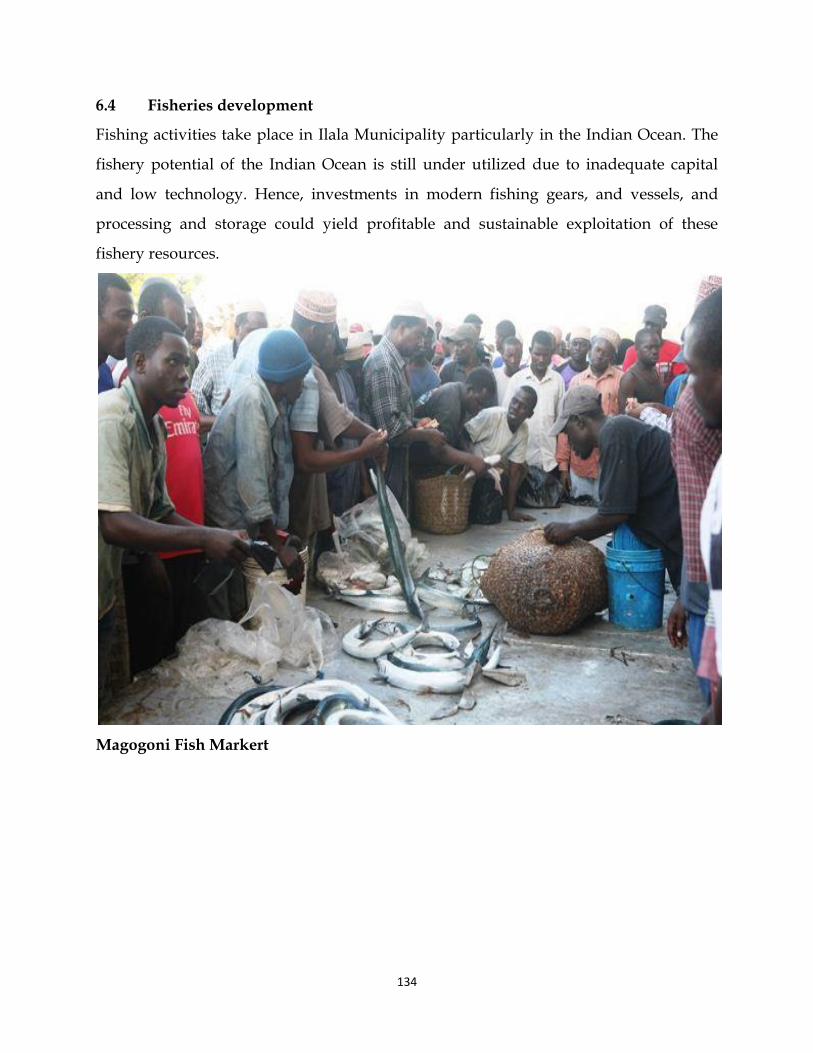
134
6.4 Fisheries development
Fishing activities take place in Ilala Municipality particularly in the Indian Ocean. The
fishery potential of the Indian Ocean is still under utilized due to inadequate capital
and low technology. Hence, investments in modern fishing gears, and vessels, and
processing and storage could yield profitable and sustainable exploitation of these
fishery resources.
Magogoni Fish Markert
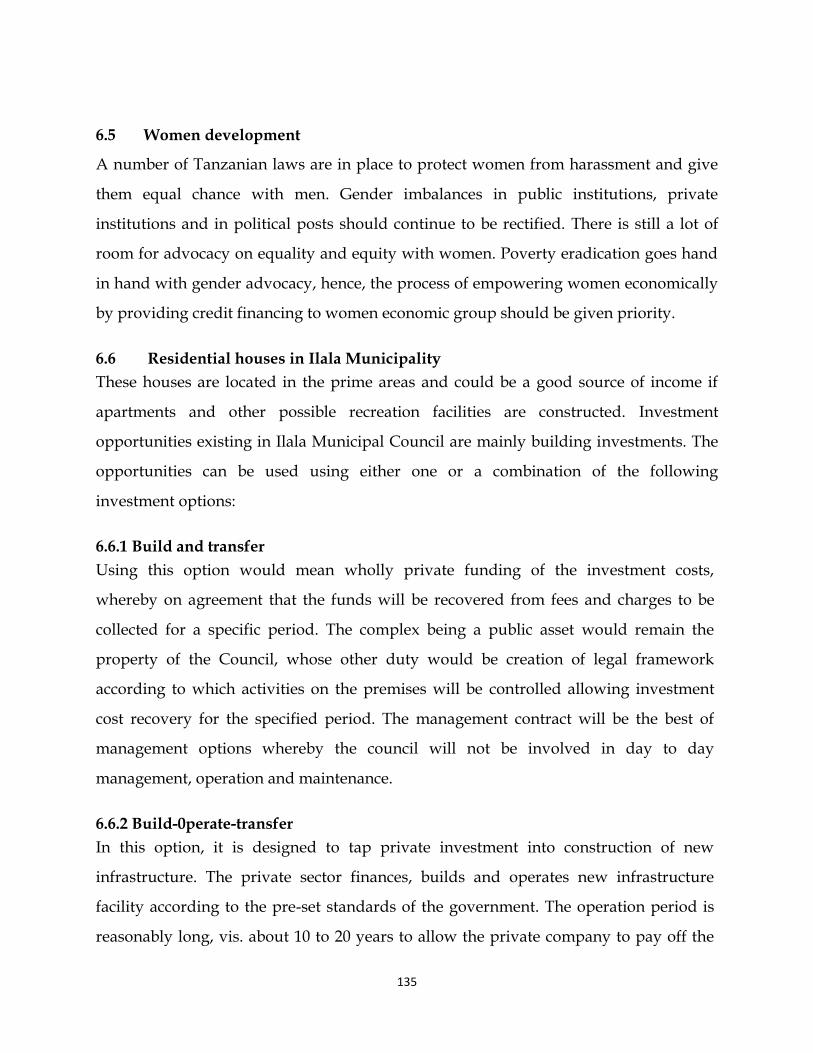
135
6.5 Women development
A number of Tanzanian laws are in place to protect women from harassment and give
them equal chance with men. Gender imbalances in public institutions, private
institutions and in political posts should continue to be rectified. There is still a lot of
room for advocacy on equality and equity with women. Poverty eradication goes hand
in hand with gender advocacy, hence, the process of empowering women economically
by providing credit financing to women economic group should be given priority.
6.6 Residential houses in Ilala Municipality
These houses are located in the prime areas and could be a good source of income if
apartments and other possible recreation facilities are constructed. Investment
opportunities existing in Ilala Municipal Council are mainly building investments. The
opportunities can be used using either one or a combination of the following
investment options:
6.6.1 Build and transfer
Using this option would mean wholly private funding of the investment costs,
whereby on agreement that the funds will be recovered from fees and charges to be
collected for a specific period. The complex being a public asset would remain the
property of the Council, whose other duty would be creation of legal framework
according to which activities on the premises will be controlled allowing investment
cost recovery for the specified period. The management contract will be the best of
management options whereby the council will not be involved in day to day
management, operation and maintenance.
6.6.2 Build-0perate-transfer
In this option, it is designed to tap private investment into construction of new
infrastructure. The private sector finances, builds and operates new infrastructure
facility according to the pre-set standards of the government. The operation period is
reasonably long, vis. about 10 to 20 years to allow the private company to pay off the
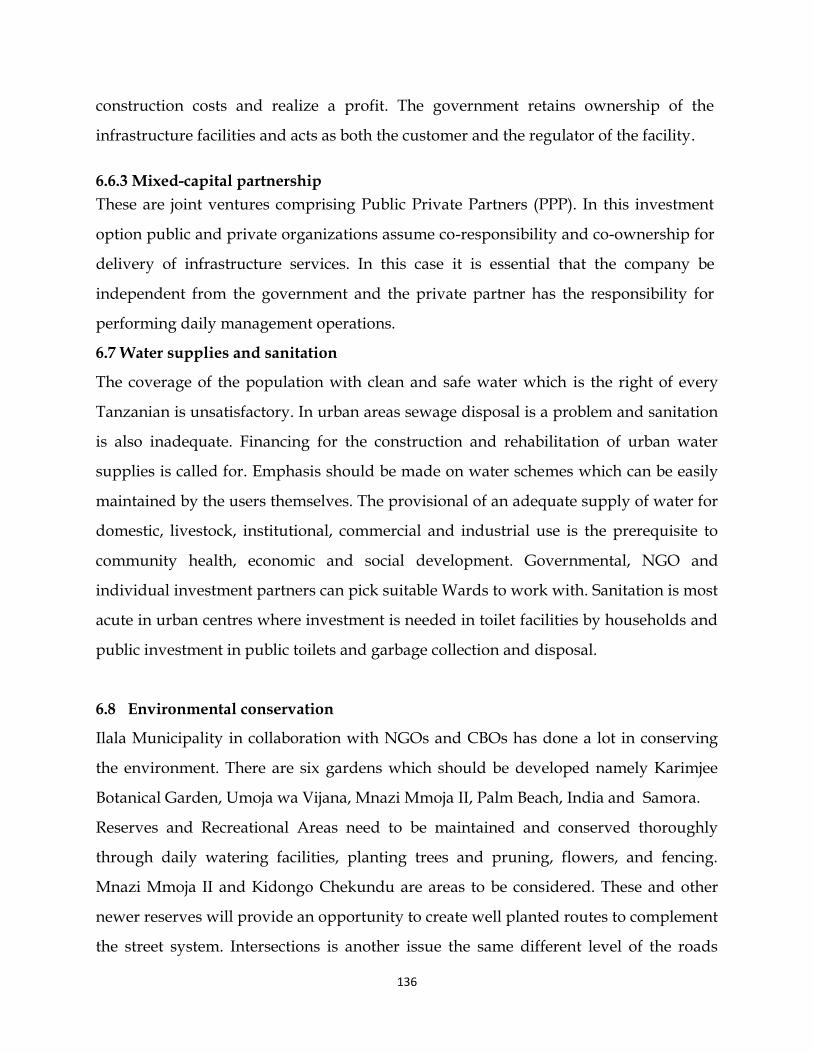
136
construction costs and realize a profit. The government retains ownership of the
infrastructure facilities and acts as both the customer and the regulator of the facility.
6.6.3 Mixed-capital partnership
These are joint ventures comprising Public Private Partners (PPP). In this investment
option public and private organizations assume co-responsibility and co-ownership for
delivery of infrastructure services. In this case it is essential that the company be
independent from the government and the private partner has the responsibility for
performing daily management operations.
6.7 Water supplies and sanitation
The coverage of the population with clean and safe water which is the right of every
Tanzanian is unsatisfactory. In urban areas sewage disposal is a problem and sanitation
is also inadequate. Financing for the construction and rehabilitation of urban water
supplies is called for. Emphasis should be made on water schemes which can be easily
maintained by the users themselves. The provisional of an adequate supply of water for
domestic, livestock, institutional, commercial and industrial use is the prerequisite to
community health, economic and social development. Governmental, NGO and
individual investment partners can pick suitable Wards to work with. Sanitation is most
acute in urban centres where investment is needed in toilet facilities by households and
public investment in public toilets and garbage collection and disposal.
6.8 Environmental conservation
Ilala Municipality in collaboration with NGOs and CBOs has done a lot in conserving
the environment. There are six gardens which should be developed namely Karimjee
Botanical Garden, Umoja wa Vijana, Mnazi Mmoja II, Palm Beach, India and Samora.
Reserves and Recreational Areas need to be maintained and conserved thoroughly
through daily watering facilities, planting trees and pruning, flowers, and fencing.
Mnazi Mmoja II and Kidongo Chekundu are areas to be considered. These and other
newer reserves will provide an opportunity to create well planted routes to complement
the street system. Intersections is another issue the same different level of the roads
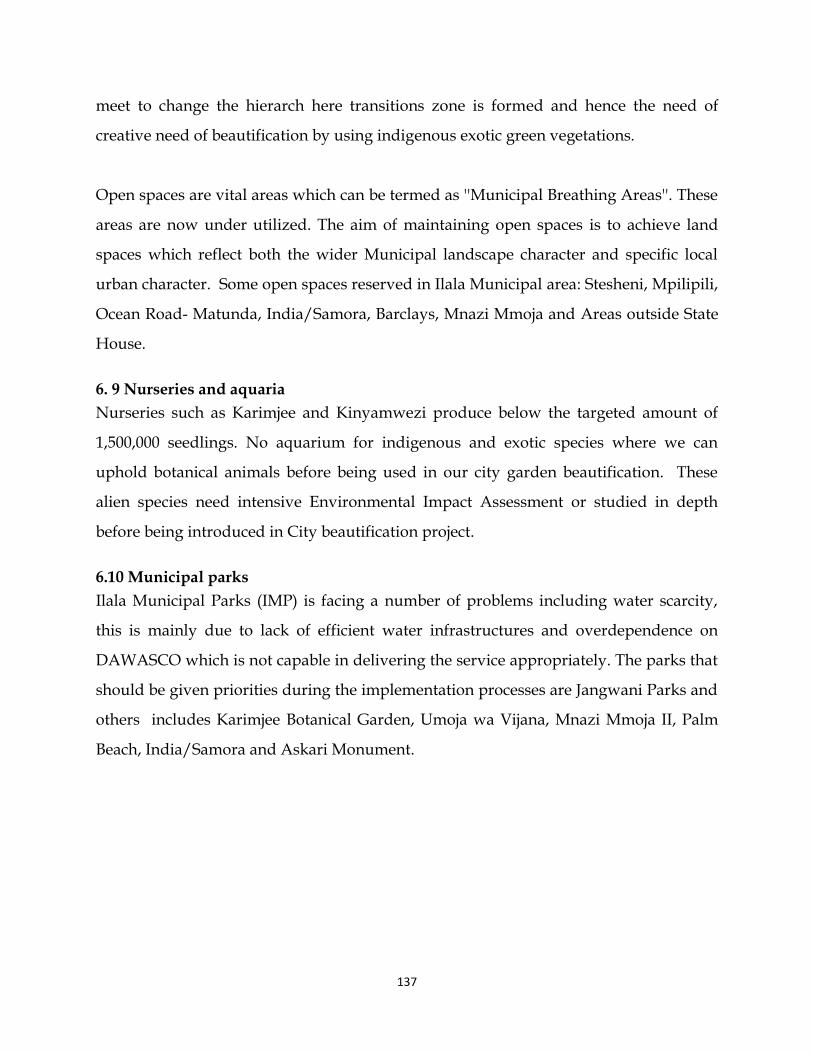
137
meet to change the hierarch here transitions zone is formed and hence the need of
creative need of beautification by using indigenous exotic green vegetations.
Open spaces are vital areas which can be termed as ''Municipal Breathing Areas''. These
areas are now under utilized. The aim of maintaining open spaces is to achieve land
spaces which reflect both the wider Municipal landscape character and specific local
urban character. Some open spaces reserved in Ilala Municipal area: Stesheni, Mpilipili,
Ocean Road- Matunda, India/Samora, Barclays, Mnazi Mmoja and Areas outside State
House.
6. 9 Nurseries and aquaria
Nurseries such as Karimjee and Kinyamwezi produce below the targeted amount of
1,500,000 seedlings. No aquarium for indigenous and exotic species where we can
uphold botanical animals before being used in our city garden beautification. These
alien species need intensive Environmental Impact Assessment or studied in depth
before being introduced in City beautification project.
6.10 Municipal parks
Ilala Municipal Parks (IMP) is facing a number of problems including water scarcity,
this is mainly due to lack of efficient water infrastructures and overdependence on
DAWASCO which is not capable in delivering the service appropriately. The parks that
should be given priorities during the implementation processes are Jangwani Parks and
others includes Karimjee Botanical Garden, Umoja wa Vijana, Mnazi Mmoja II, Palm
Beach, India/Samora and Askari Monument.
138
Seaside Palm Beach: parking
Karimjee parking