Embed Size (px)
Citation preview
IL-1 resets glucose homeostasis at central levelsAdriana del Rey*, Eduardo Roggero†, Anke Randolf*, Carolina Mahuad†, Samuel McCann‡§¶, Valeria Rettori§,and Hugo O. Besedovsky*¶
*Department of Immunophysiology, Institute of Physiology, Medical Faculty, Philipps University, 35037 Marburg, Germany; †Instituto deInmunologıa, Facultad de Ciencias Medicas, Universidad Nacional de Rosario, 2000 Rosario, Argentina; ‡Pennington Biomedical ResearchCenter, Baton Rouge, LA 70808-4124; and §Centro de Estudios Farmacologicos y Botanicos, Consejo Nacional de Investigaciones Cientıficasy Tecnicas, 1414 Buenos Aires, Argentina
Contributed by Samuel McCann, August 16, 2006
Administration of IL-1� results in a profound and long-lastinghypoglycemia. Here, we show that this effect can be elicited byendogenous IL-1 and is related to not only the capacity of thecytokine to increase glucose uptake in peripheral tissues but alsoto mechanisms integrated in the brain. We show that (i) blockadeof IL-1 receptors in the brain partially counteracted IL-1-inducedhypoglycemia; (ii) peripheral administration or induction of IL-1production resulted in IL-1� gene expression in the hypothalamusof normal and insulin-resistant, leptin receptor-deficient, diabeticdb�db mice; (iii) IL-1-treated normal and db�db mice challengedwith glucose did not return to their initial glucose levels butremained hypoglycemic for several hours. This effect was largelyantagonized by blockade of IL-1 receptors in the brain; and (iv)when animals with an advanced Type II diabetes were treated withIL-1 and challenged with glucose, they died in hypoglycemia.However, when IL-1 receptors in the brains of these diabetic micewere blocked, they survived, and glucose blood levels approachedthose that these mice had before IL-1 administration. The pro-longed hypoglycemic effect of IL-1 is insulin-independent anddevelops against increased levels of glucocorticoids, catechol-amines, and glucagon. These findings, together with the presentdemonstration that this effect is integrated in the brain and isparalleled by IL-1� expression in the hypothalamus, indicate thatthis cytokine can reset glucose homeostasis at central levels. Suchreset, along with the peripheral actions of the cytokine, wouldfavor glucose uptake by immune cells during inflammatory�immune processes.
CNS � IL-1 receptor antagonist � glucoregulation � type II diabetes �immune cell metabolism
There is evidence that immune-derived cytokines can mediatemetabolic alterations during the course of infective, inflam-
matory, autoimmune, and neoplastic processes (1–4), either byacting locally or by interacting with different endocrine mech-anisms (2, 3, 5). Under physiological conditions, glucose is theprincipal and most readily available source of energy. WhenIL-1, a prototypic proinflammatory cytokine, is administered tomice, a profound and long-lasting hypoglycemia is observed. Thehypoglycemic effect of IL-1 is not mediated by insulin, becauseit is clearly observed in insulin-resistant diabetic mice and rats;is not caused by glucose loss; and is independent from theanorexic effect of the cytokine (6–12). IL-1-induced hypoglyce-mia might be explained by the capacity of this cytokine tostimulate glucose uptake in vitro in a variety of tissues such asadipose cells (13), fibroblasts (14), articular chondrocytes (15),keratinocytes (16), intestinal macrophages (17), peritoneal me-sothelial cells (18), and glial cells (19). Studies in vivo also showthat overproduction of IL-1 results in increased 2-deoxyglucoseuptake in all tissues tested, including lymphoid organs and thebrain (20). Several of the mentioned in vitro studies on the effectof IL-1 on glucose transport have been performed by usinghuman cells, and injection of very low doses of recombinantIL-1� to patients with cancer induces a transient hypoglycemia(21). Administration of low doses of LPS to healthy volunteersincreases glucose utilization (22) and decreases glucose levels
(23). Because IL-1 is among the proinflammatory cytokineswhose production is induced by LPS, these results indicate thatIL-1 may also induce hypoglycemia in humans. IL-1�-stimulatedglucose transport is PKC- and p38 MAP-activation-dependentand is accompanied by increased expression and membraneincorporation of different glucose transporters (24). The type oftransporter affected depends on the tissue, for example, GLUT3in the liver and brain and GLUT1 in chondrocytes (24). Fur-thermore, IL-1 inhibits gluconeogenesis by inhibiting the activityof phosphoenolpyruvate carboxykinase and also mediates areduction in hepatic glycogen content (12, 20).
Besides these peripheral actions, there are indications thatIL-1 can affect glucose homeostasis by acting at brain levels.Indeed, IL-1-mediated hypoglycemia develops against the en-hanced output of counterregulatory hormones such as glucocor-ticoids, catecholamine, and glucagon (6, 9) and is very longlasting. Such a prolonged hypoglycemia is surprising, because theregulation of glucose levels in blood is one of the homeostaticmechanisms under the most tight feedback control at the levelof the CNS. Studies have shown that injection of picogramamounts of IL-1 into the lateral brain ventricle induces hypo-glycemia (10, 12). There is also evidence for brain IL-1 in theCNS, particularly in the hypothalamus, where it is present inneurons, and the quantity is increased by LPS administration (25,26). These facts, together with the complex pattern of endocrinealterations caused by the cytokine, led us to hypothesize thatIL-1, besides stimulating glucose transport and oxidation in theperiphery, can also change the set point of CNS-mediatedglucoregulation.
Here, we show that endogenous levels of IL-1 can inducehypoglycemia and trigger the expression of its own gene in thehypothalamus of normal and insulin-resistant mice. Further-more, we provide evidence that IL-1 affects the set point forglucose homeostasis by acting at central levels.
ResultsEndogenous IL-1 Mediates Hypoglycemia. We have administered alow dose (0.5 �g per mouse) of LPS together with the IL-1receptor antagonist (IL-1ra) to study whether endogenous IL-1contributes to LPS-induced hypoglycemia. Fig. 1A shows that i.p.administration of IL-1ra (300 �g) inhibits the hypoglycemiceffect of LPS.
Author contributions: A.d.R. and H.O.B. designed research; A.d.R., E.R., A.R., C.M., and V.R.performed research; A.d.R., A.R., S.M., V.R., and H.O.B. analyzed data; and A.d.R., S.M., andH.O.B. wrote the paper.
The authors declare no conflict of interest.
Abbreviations: g b.w., grams of body weight; IL-1ra, IL-1 receptor antagonist; i.c.v.,intracerebroventricular(ly).
Data deposition: The sequences reported in this paper have been deposited in the GenBankdatabase [accession nos. M15131 (IL-1�) and M32599 (glyceraldehyde-3-phosphate-dehy-drogenase)].
¶To whom correspondence may be addressed. E-mail: [email protected] [email protected].
© 2006 by The National Academy of Sciences of the USA
www.pnas.org�cgi�doi�10.1073�pnas.0607076103 PNAS � October 24, 2006 � vol. 103 � no. 43 � 16039–16044
PHYS
IOLO
GY
Dow
nloa
ded
by g
uest
on
May
22,
202
0
IL-1 Induces a More Prolonged Hypoglycemia Than Regular Insulin. Wehave compared the hypoglycemic effect of IL-1 with that of adose of regular insulin that decreases glucose levels in a com-parable magnitude. Fig. 1B shows the time kinetics of the effectof a single i.p. injection of 0.1 �g of IL-1 and 0.25 units (11.4 �g)of regular insulin on the glucose blood levels of normal mice. Itis clear that insulin-injected mice returned to euglycemic valueswithin 5 h, whereas the glucose levels of the mice that receivedIL-1 were still below the normal basal range 24 h later.
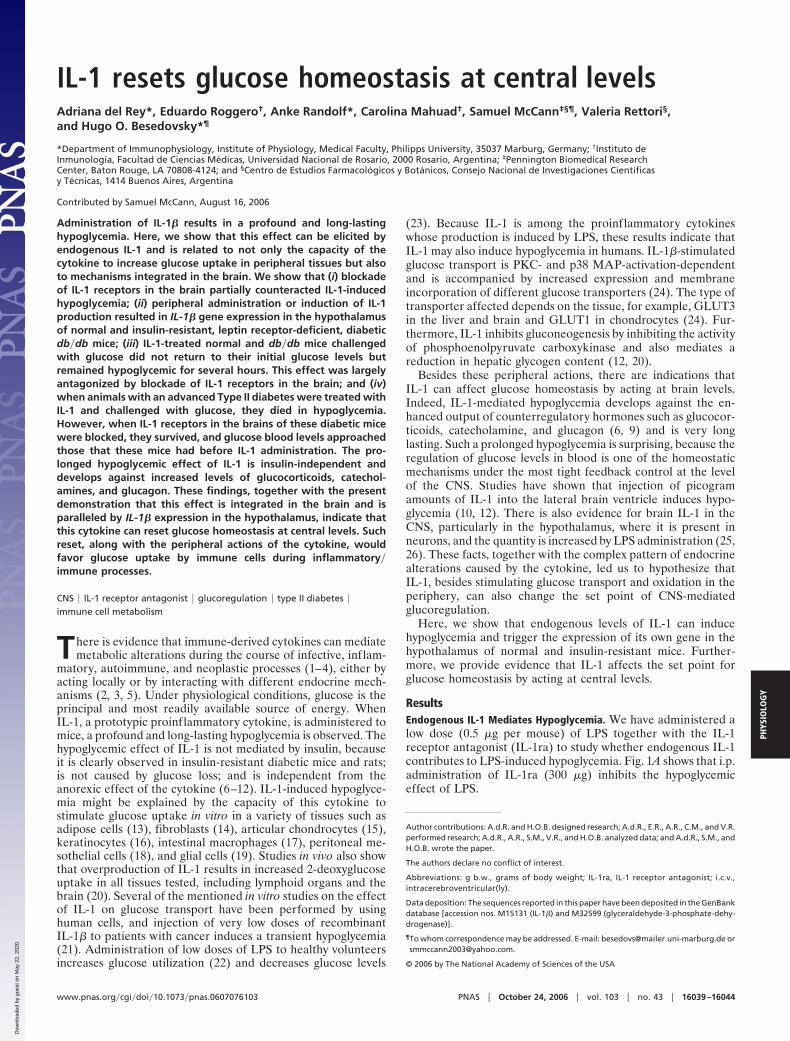
IL-1 in the Brain Contributes to Peripherally Induced IL-1 Hypoglyce-mia. To explore the possibility that IL-1 induces hypoglycemia byacting in the brain, IL-1 was injected i.p. and IL-1ra (50 �g)intracerebroventricularly (i.c.v.). When injected i.p., even 100 �gof IL-1ra are not enough to significantly affect IL-1-inducedhypoglycemia (see Fig. 1 A). As shown in Fig. 2, blockade of IL-1effects in the brain significantly attenuated the hypoglycemiainduced by peripheral administration of IL-1.
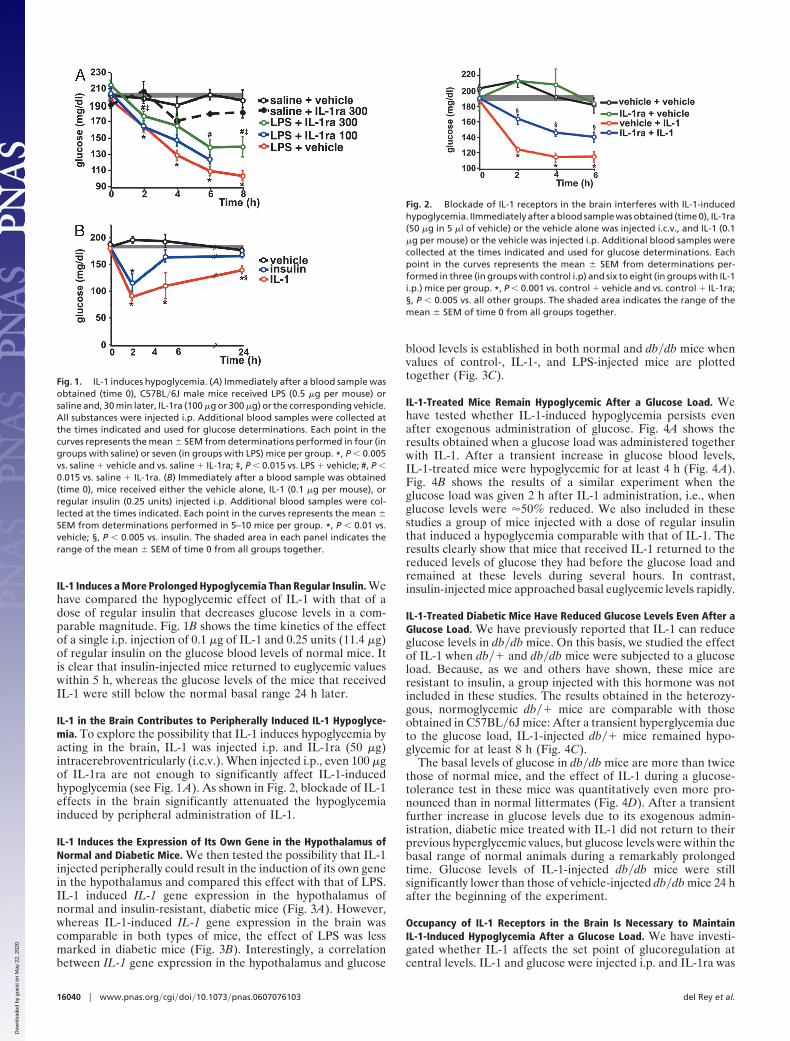
IL-1 Induces the Expression of Its Own Gene in the Hypothalamus ofNormal and Diabetic Mice. We then tested the possibility that IL-1injected peripherally could result in the induction of its own genein the hypothalamus and compared this effect with that of LPS.IL-1 induced IL-1 gene expression in the hypothalamus ofnormal and insulin-resistant, diabetic mice (Fig. 3A). However,whereas IL-1-induced IL-1 gene expression in the brain wascomparable in both types of mice, the effect of LPS was lessmarked in diabetic mice (Fig. 3B). Interestingly, a correlationbetween IL-1 gene expression in the hypothalamus and glucose
blood levels is established in both normal and db�db mice whenvalues of control-, IL-1-, and LPS-injected mice are plottedtogether (Fig. 3C).
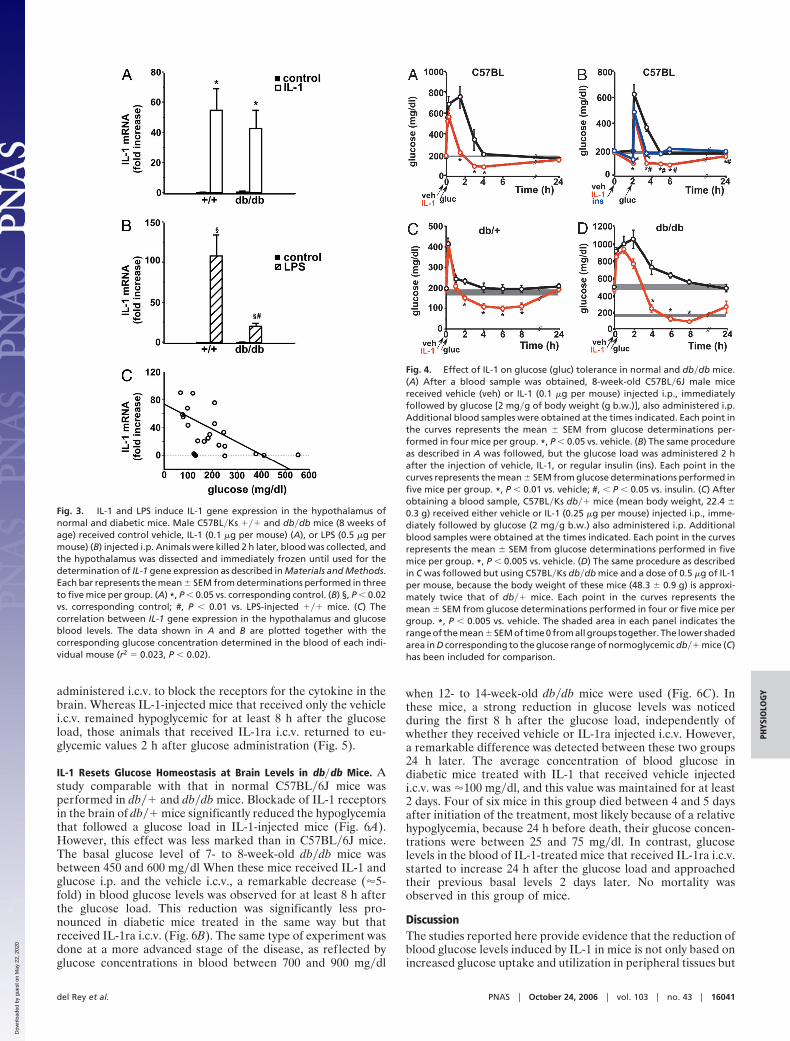
IL-1-Treated Mice Remain Hypoglycemic After a Glucose Load. Wehave tested whether IL-1-induced hypoglycemia persists evenafter exogenous administration of glucose. Fig. 4A shows theresults obtained when a glucose load was administered togetherwith IL-1. After a transient increase in glucose blood levels,IL-1-treated mice were hypoglycemic for at least 4 h (Fig. 4A).Fig. 4B shows the results of a similar experiment when theglucose load was given 2 h after IL-1 administration, i.e., whenglucose levels were �50% reduced. We also included in thesestudies a group of mice injected with a dose of regular insulinthat induced a hypoglycemia comparable with that of IL-1. Theresults clearly show that mice that received IL-1 returned to thereduced levels of glucose they had before the glucose load andremained at these levels during several hours. In contrast,insulin-injected mice approached basal euglycemic levels rapidly.
IL-1-Treated Diabetic Mice Have Reduced Glucose Levels Even After aGlucose Load. We have previously reported that IL-1 can reduceglucose levels in db�db mice. On this basis, we studied the effectof IL-1 when db�� and db�db mice were subjected to a glucoseload. Because, as we and others have shown, these mice areresistant to insulin, a group injected with this hormone was notincluded in these studies. The results obtained in the heterozy-gous, normoglycemic db�� mice are comparable with thoseobtained in C57BL�6J mice: After a transient hyperglycemia dueto the glucose load, IL-1-injected db�� mice remained hypo-glycemic for at least 8 h (Fig. 4C).
The basal levels of glucose in db�db mice are more than twicethose of normal mice, and the effect of IL-1 during a glucose-tolerance test in these mice was quantitatively even more pro-nounced than in normal littermates (Fig. 4D). After a transientfurther increase in glucose levels due to its exogenous admin-istration, diabetic mice treated with IL-1 did not return to theirprevious hyperglycemic values, but glucose levels were within thebasal range of normal animals during a remarkably prolongedtime. Glucose levels of IL-1-injected db�db mice were stillsignificantly lower than those of vehicle-injected db�db mice 24 hafter the beginning of the experiment.
Occupancy of IL-1 Receptors in the Brain Is Necessary to MaintainIL-1-Induced Hypoglycemia After a Glucose Load. We have investi-gated whether IL-1 affects the set point of glucoregulation atcentral levels. IL-1 and glucose were injected i.p. and IL-1ra was
Fig. 1. IL-1 induces hypoglycemia. (A) Immediately after a blood sample wasobtained (time 0), C57BL�6J male mice received LPS (0.5 �g per mouse) orsaline and, 30 min later, IL-1ra (100 �g or 300 �g) or the corresponding vehicle.All substances were injected i.p. Additional blood samples were collected atthe times indicated and used for glucose determinations. Each point in thecurves represents the mean � SEM from determinations performed in four (ingroups with saline) or seven (in groups with LPS) mice per group. *, P � 0.005vs. saline � vehicle and vs. saline � IL-1ra; ‡, P � 0.015 vs. LPS � vehicle; #, P �0.015 vs. saline � IL-1ra. (B) Immediately after a blood sample was obtained(time 0), mice received either the vehicle alone, IL-1 (0.1 �g per mouse), orregular insulin (0.25 units) injected i.p. Additional blood samples were col-lected at the times indicated. Each point in the curves represents the mean �SEM from determinations performed in 5–10 mice per group. *, P � 0.01 vs.vehicle; §, P � 0.005 vs. insulin. The shaded area in each panel indicates therange of the mean � SEM of time 0 from all groups together.
Fig. 2. Blockade of IL-1 receptors in the brain interferes with IL-1-inducedhypoglycemia. IImmediately after a blood sample was obtained (time 0), IL-1ra(50 �g in 5 �l of vehicle) or the vehicle alone was injected i.c.v., and IL-1 (0.1�g per mouse) or the vehicle was injected i.p. Additional blood samples werecollected at the times indicated and used for glucose determinations. Eachpoint in the curves represents the mean � SEM from determinations per-formed in three (in groups with control i.p) and six to eight (in groups with IL-1i.p.) mice per group. *, P � 0.001 vs. control � vehicle and vs. control � IL-1ra;§, P � 0.005 vs. all other groups. The shaded area indicates the range of themean � SEM of time 0 from all groups together.
16040 � www.pnas.org�cgi�doi�10.1073�pnas.0607076103 del Rey et al.
Dow
nloa
ded
by g
uest
on
May
22,
202
0
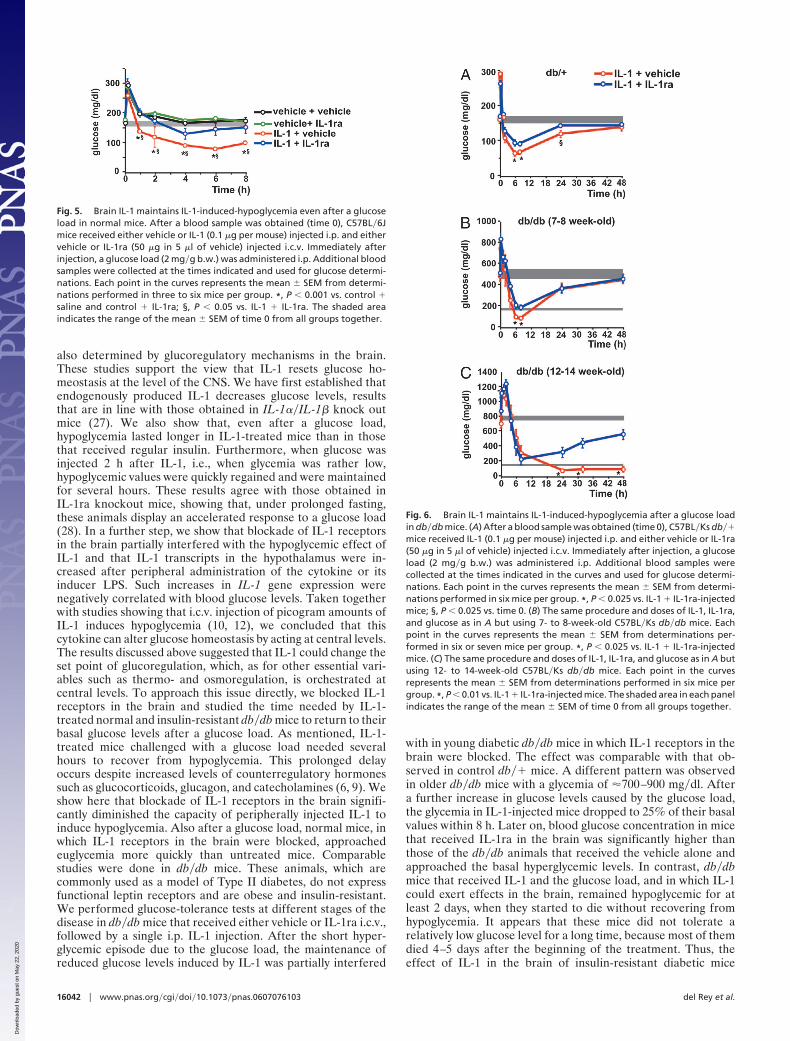
administered i.c.v. to block the receptors for the cytokine in thebrain. Whereas IL-1-injected mice that received only the vehiclei.c.v. remained hypoglycemic for at least 8 h after the glucoseload, those animals that received IL-1ra i.c.v. returned to eu-glycemic values 2 h after glucose administration (Fig. 5).
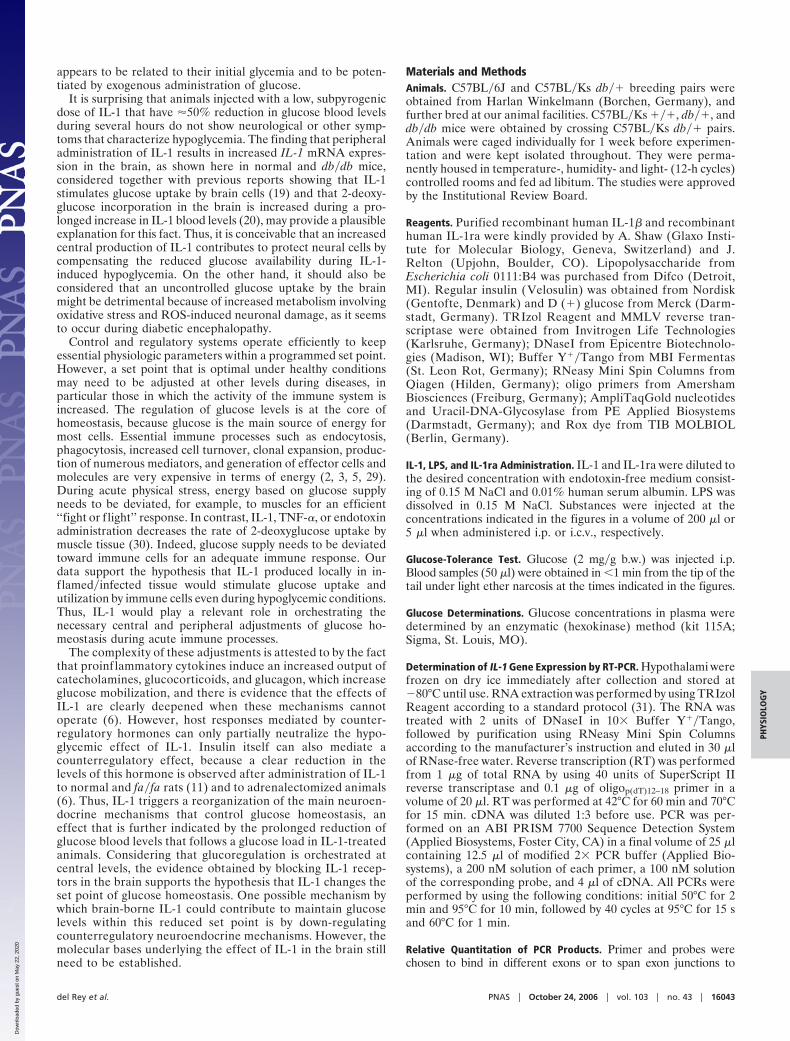
IL-1 Resets Glucose Homeostasis at Brain Levels in db�db Mice. Astudy comparable with that in normal C57BL�6J mice wasperformed in db�� and db�db mice. Blockade of IL-1 receptorsin the brain of db�� mice significantly reduced the hypoglycemiathat followed a glucose load in IL-1-injected mice (Fig. 6A).However, this effect was less marked than in C57BL�6J mice.The basal glucose level of 7- to 8-week-old db�db mice wasbetween 450 and 600 mg�dl When these mice received IL-1 andglucose i.p. and the vehicle i.c.v., a remarkable decrease (�5-fold) in blood glucose levels was observed for at least 8 h afterthe glucose load. This reduction was significantly less pro-nounced in diabetic mice treated in the same way but thatreceived IL-1ra i.c.v. (Fig. 6B). The same type of experiment wasdone at a more advanced stage of the disease, as reflected byglucose concentrations in blood between 700 and 900 mg�dl
when 12- to 14-week-old db�db mice were used (Fig. 6C). Inthese mice, a strong reduction in glucose levels was noticedduring the first 8 h after the glucose load, independently ofwhether they received vehicle or IL-1ra injected i.c.v. However,a remarkable difference was detected between these two groups24 h later. The average concentration of blood glucose indiabetic mice treated with IL-1 that received vehicle injectedi.c.v. was �100 mg�dl, and this value was maintained for at least2 days. Four of six mice in this group died between 4 and 5 daysafter initiation of the treatment, most likely because of a relativehypoglycemia, because 24 h before death, their glucose concen-trations were between 25 and 75 mg�dl. In contrast, glucoselevels in the blood of IL-1-treated mice that received IL-1ra i.c.v.started to increase 24 h after the glucose load and approachedtheir previous basal levels 2 days later. No mortality wasobserved in this group of mice.
DiscussionThe studies reported here provide evidence that the reduction ofblood glucose levels induced by IL-1 in mice is not only based onincreased glucose uptake and utilization in peripheral tissues but
Fig. 3. IL-1 and LPS induce IL-1 gene expression in the hypothalamus ofnormal and diabetic mice. Male C57BL�Ks ��� and db�db mice (8 weeks ofage) received control vehicle, IL-1 (0.1 �g per mouse) (A), or LPS (0.5 �g permouse) (B) injected i.p. Animals were killed 2 h later, blood was collected, andthe hypothalamus was dissected and immediately frozen until used for thedetermination of IL-1 gene expression as described in Materials and Methods.Each bar represents the mean � SEM from determinations performed in threeto five mice per group. (A) *, P � 0.05 vs. corresponding control. (B) §, P � 0.02vs. corresponding control; #, P � 0.01 vs. LPS-injected ��� mice. (C) Thecorrelation between IL-1 gene expression in the hypothalamus and glucoseblood levels. The data shown in A and B are plotted together with thecorresponding glucose concentration determined in the blood of each indi-vidual mouse (r2 � 0.023, P � 0.02).
Fig. 4. Effect of IL-1 on glucose (gluc) tolerance in normal and db�db mice.(A) After a blood sample was obtained, 8-week-old C57BL�6J male micereceived vehicle (veh) or IL-1 (0.1 �g per mouse) injected i.p., immediatelyfollowed by glucose [2 mg�g of body weight (g b.w.)], also administered i.p.Additional blood samples were obtained at the times indicated. Each point inthe curves represents the mean � SEM from glucose determinations per-formed in four mice per group. *, P � 0.05 vs. vehicle. (B) The same procedureas described in A was followed, but the glucose load was administered 2 hafter the injection of vehicle, IL-1, or regular insulin (ins). Each point in thecurves represents the mean � SEM from glucose determinations performed infive mice per group. *, P � 0.01 vs. vehicle; #, � P � 0.05 vs. insulin. (C) Afterobtaining a blood sample, C57BL�Ks db�� mice (mean body weight, 22.4 �0.3 g) received either vehicle or IL-1 (0.25 �g per mouse) injected i.p., imme-diately followed by glucose (2 mg�g b.w.) also administered i.p. Additionalblood samples were obtained at the times indicated. Each point in the curvesrepresents the mean � SEM from glucose determinations performed in fivemice per group. *, P � 0.005 vs. vehicle. (D) The same procedure as describedin C was followed but using C57BL�Ks db�db mice and a dose of 0.5 �g of IL-1per mouse, because the body weight of these mice (48.3 � 0.9 g) is approxi-mately twice that of db�� mice. Each point in the curves represents themean � SEM from glucose determinations performed in four or five mice pergroup. *, P � 0.005 vs. vehicle. The shaded area in each panel indicates therange of the mean � SEM of time 0 from all groups together. The lower shadedarea in D corresponding to the glucose range of normoglycemic db�� mice (C)has been included for comparison.
del Rey et al. PNAS � October 24, 2006 � vol. 103 � no. 43 � 16041
PHYS
IOLO
GY
Dow
nloa
ded
by g
uest
on
May
22,
202
0
also determined by glucoregulatory mechanisms in the brain.These studies support the view that IL-1 resets glucose ho-meostasis at the level of the CNS. We have first established thatendogenously produced IL-1 decreases glucose levels, resultsthat are in line with those obtained in IL-1��IL-1� knock outmice (27). We also show that, even after a glucose load,hypoglycemia lasted longer in IL-1-treated mice than in thosethat received regular insulin. Furthermore, when glucose wasinjected 2 h after IL-1, i.e., when glycemia was rather low,hypoglycemic values were quickly regained and were maintainedfor several hours. These results agree with those obtained inIL-1ra knockout mice, showing that, under prolonged fasting,these animals display an accelerated response to a glucose load(28). In a further step, we show that blockade of IL-1 receptorsin the brain partially interfered with the hypoglycemic effect ofIL-1 and that IL-1 transcripts in the hypothalamus were in-creased after peripheral administration of the cytokine or itsinducer LPS. Such increases in IL-1 gene expression werenegatively correlated with blood glucose levels. Taken togetherwith studies showing that i.c.v. injection of picogram amounts ofIL-1 induces hypoglycemia (10, 12), we concluded that thiscytokine can alter glucose homeostasis by acting at central levels.The results discussed above suggested that IL-1 could change theset point of glucoregulation, which, as for other essential vari-ables such as thermo- and osmoregulation, is orchestrated atcentral levels. To approach this issue directly, we blocked IL-1receptors in the brain and studied the time needed by IL-1-treated normal and insulin-resistant db�db mice to return to theirbasal glucose levels after a glucose load. As mentioned, IL-1-treated mice challenged with a glucose load needed severalhours to recover from hypoglycemia. This prolonged delayoccurs despite increased levels of counterregulatory hormonessuch as glucocorticoids, glucagon, and catecholamines (6, 9). Weshow here that blockade of IL-1 receptors in the brain signifi-cantly diminished the capacity of peripherally injected IL-1 toinduce hypoglycemia. Also after a glucose load, normal mice, inwhich IL-1 receptors in the brain were blocked, approachedeuglycemia more quickly than untreated mice. Comparablestudies were done in db�db mice. These animals, which arecommonly used as a model of Type II diabetes, do not expressfunctional leptin receptors and are obese and insulin-resistant.We performed glucose-tolerance tests at different stages of thedisease in db�db mice that received either vehicle or IL-1ra i.c.v.,followed by a single i.p. IL-1 injection. After the short hyper-glycemic episode due to the glucose load, the maintenance ofreduced glucose levels induced by IL-1 was partially interfered
with in young diabetic db�db mice in which IL-1 receptors in thebrain were blocked. The effect was comparable with that ob-served in control db�� mice. A different pattern was observedin older db�db mice with a glycemia of �700–900 mg�dl. Aftera further increase in glucose levels caused by the glucose load,the glycemia in IL-1-injected mice dropped to 25% of their basalvalues within 8 h. Later on, blood glucose concentration in micethat received IL-1ra in the brain was significantly higher thanthose of the db�db animals that received the vehicle alone andapproached the basal hyperglycemic levels. In contrast, db�dbmice that received IL-1 and the glucose load, and in which IL-1could exert effects in the brain, remained hypoglycemic for atleast 2 days, when they started to die without recovering fromhypoglycemia. It appears that these mice did not tolerate arelatively low glucose level for a long time, because most of themdied 4–5 days after the beginning of the treatment. Thus, theeffect of IL-1 in the brain of insulin-resistant diabetic mice
Fig. 5. Brain IL-1 maintains IL-1-induced-hypoglycemia even after a glucoseload in normal mice. After a blood sample was obtained (time 0), C57BL�6Jmice received either vehicle or IL-1 (0.1 �g per mouse) injected i.p. and eithervehicle or IL-1ra (50 �g in 5 �l of vehicle) injected i.c.v. Immediately afterinjection, a glucose load (2 mg�g b.w.) was administered i.p. Additional bloodsamples were collected at the times indicated and used for glucose determi-nations. Each point in the curves represents the mean � SEM from determi-nations performed in three to six mice per group. *, P � 0.001 vs. control �saline and control � IL-1ra; §, P � 0.05 vs. IL-1 � IL-1ra. The shaded areaindicates the range of the mean � SEM of time 0 from all groups together.
Fig. 6. Brain IL-1 maintains IL-1-induced-hypoglycemia after a glucose loadin db�db mice. (A) After a blood sample was obtained (time 0), C57BL�Ks db��mice received IL-1 (0.1 �g per mouse) injected i.p. and either vehicle or IL-1ra(50 �g in 5 �l of vehicle) injected i.c.v. Immediately after injection, a glucoseload (2 mg�g b.w.) was administered i.p. Additional blood samples werecollected at the times indicated in the curves and used for glucose determi-nations. Each point in the curves represents the mean � SEM from determi-nations performed in six mice per group. *, P � 0.025 vs. IL-1 � IL-1ra-injectedmice; §, P � 0.025 vs. time 0. (B) The same procedure and doses of IL-1, IL-1ra,and glucose as in A but using 7- to 8-week-old C57BL�Ks db�db mice. Eachpoint in the curves represents the mean � SEM from determinations per-formed in six or seven mice per group. *, P � 0.025 vs. IL-1 � IL-1ra-injectedmice. (C) The same procedure and doses of IL-1, IL-1ra, and glucose as in A butusing 12- to 14-week-old C57BL�Ks db�db mice. Each point in the curvesrepresents the mean � SEM from determinations performed in six mice pergroup. *, P � 0.01 vs. IL-1 � IL-1ra-injected mice. The shaded area in each panelindicates the range of the mean � SEM of time 0 from all groups together.
16042 � www.pnas.org�cgi�doi�10.1073�pnas.0607076103 del Rey et al.
Dow
nloa
ded
by g
uest
on
May
22,
202
0
appears to be related to their initial glycemia and to be poten-tiated by exogenous administration of glucose.
It is surprising that animals injected with a low, subpyrogenicdose of IL-1 that have �50% reduction in glucose blood levelsduring several hours do not show neurological or other symp-toms that characterize hypoglycemia. The finding that peripheraladministration of IL-1 results in increased IL-1 mRNA expres-sion in the brain, as shown here in normal and db�db mice,considered together with previous reports showing that IL-1stimulates glucose uptake by brain cells (19) and that 2-deoxy-glucose incorporation in the brain is increased during a pro-longed increase in IL-1 blood levels (20), may provide a plausibleexplanation for this fact. Thus, it is conceivable that an increasedcentral production of IL-1 contributes to protect neural cells bycompensating the reduced glucose availability during IL-1-induced hypoglycemia. On the other hand, it should also beconsidered that an uncontrolled glucose uptake by the brainmight be detrimental because of increased metabolism involvingoxidative stress and ROS-induced neuronal damage, as it seemsto occur during diabetic encephalopathy.
Control and regulatory systems operate efficiently to keepessential physiologic parameters within a programmed set point.However, a set point that is optimal under healthy conditionsmay need to be adjusted at other levels during diseases, inparticular those in which the activity of the immune system isincreased. The regulation of glucose levels is at the core ofhomeostasis, because glucose is the main source of energy formost cells. Essential immune processes such as endocytosis,phagocytosis, increased cell turnover, clonal expansion, produc-tion of numerous mediators, and generation of effector cells andmolecules are very expensive in terms of energy (2, 3, 5, 29).During acute physical stress, energy based on glucose supplyneeds to be deviated, for example, to muscles for an efficient‘‘fight or flight’’ response. In contrast, IL-1, TNF-�, or endotoxinadministration decreases the rate of 2-deoxyglucose uptake bymuscle tissue (30). Indeed, glucose supply needs to be deviatedtoward immune cells for an adequate immune response. Ourdata support the hypothesis that IL-1 produced locally in in-f lamed�infected tissue would stimulate glucose uptake andutilization by immune cells even during hypoglycemic conditions.Thus, IL-1 would play a relevant role in orchestrating thenecessary central and peripheral adjustments of glucose ho-meostasis during acute immune processes.
The complexity of these adjustments is attested to by the factthat proinf lammatory cytokines induce an increased output ofcatecholamines, glucocorticoids, and glucagon, which increaseglucose mobilization, and there is evidence that the effects ofIL-1 are clearly deepened when these mechanisms cannotoperate (6). However, host responses mediated by counter-regulatory hormones can only partially neutralize the hypo-glycemic effect of IL-1. Insulin itself can also mediate acounterregulatory effect, because a clear reduction in thelevels of this hormone is observed after administration of IL-1to normal and fa�fa rats (11) and to adrenalectomized animals(6). Thus, IL-1 triggers a reorganization of the main neuroen-docrine mechanisms that control glucose homeostasis, aneffect that is further indicated by the prolonged reduction ofglucose blood levels that follows a glucose load in IL-1-treatedanimals. Considering that glucoregulation is orchestrated atcentral levels, the evidence obtained by blocking IL-1 recep-tors in the brain supports the hypothesis that IL-1 changes theset point of glucose homeostasis. One possible mechanism bywhich brain-borne IL-1 could contribute to maintain glucoselevels within this reduced set point is by down-regulatingcounterregulatory neuroendocrine mechanisms. However, themolecular bases underlying the effect of IL-1 in the brain stillneed to be established.
Materials and MethodsAnimals. C57BL�6J and C57BL�Ks db�� breeding pairs wereobtained from Harlan Winkelmann (Borchen, Germany), andfurther bred at our animal facilities. C57BL�Ks ���, db��, anddb�db mice were obtained by crossing C57BL�Ks db�� pairs.Animals were caged individually for 1 week before experimen-tation and were kept isolated throughout. They were perma-nently housed in temperature-, humidity- and light- (12-h cycles)controlled rooms and fed ad libitum. The studies were approvedby the Institutional Review Board.
Reagents. Purified recombinant human IL-1� and recombinanthuman IL-1ra were kindly provided by A. Shaw (Glaxo Insti-tute for Molecular Biology, Geneva, Switzerland) and J.Relton (Upjohn, Boulder, CO). Lipopolysaccharide fromEscherichia coli 0111:B4 was purchased from Difco (Detroit,MI). Regular insulin (Velosulin) was obtained from Nordisk(Gentofte, Denmark) and D (�) glucose from Merck (Darm-stadt, Germany). TRIzol Reagent and MMLV reverse tran-scriptase were obtained from Invitrogen Life Technologies(Karlsruhe, Germany); DNaseI from Epicentre Biotechnolo-gies (Madison, WI); Buffer Y��Tango from MBI Fermentas(St. Leon Rot, Germany); RNeasy Mini Spin Columns fromQiagen (Hilden, Germany); oligo primers from AmershamBiosciences (Freiburg, Germany); AmpliTaqGold nucleotidesand Uracil-DNA-Glycosylase from PE Applied Biosystems(Darmstadt, Germany); and Rox dye from TIB MOLBIOL(Berlin, Germany).
IL-1, LPS, and IL-1ra Administration. IL-1 and IL-1ra were diluted tothe desired concentration with endotoxin-free medium consist-ing of 0.15 M NaCl and 0.01% human serum albumin. LPS wasdissolved in 0.15 M NaCl. Substances were injected at theconcentrations indicated in the figures in a volume of 200 �l or5 �l when administered i.p. or i.c.v., respectively.
Glucose-Tolerance Test. Glucose (2 mg�g b.w.) was injected i.p.Blood samples (50 �l) were obtained in �1 min from the tip of thetail under light ether narcosis at the times indicated in the figures.
Glucose Determinations. Glucose concentrations in plasma weredetermined by an enzymatic (hexokinase) method (kit 115A;Sigma, St. Louis, MO).
Determination of IL-1 Gene Expression by RT-PCR. Hypothalami werefrozen on dry ice immediately after collection and stored at�80°C until use. RNA extraction was performed by using TRIzolReagent according to a standard protocol (31). The RNA wastreated with 2 units of DNaseI in 10� Buffer Y��Tango,followed by purification using RNeasy Mini Spin Columnsaccording to the manufacturer’s instruction and eluted in 30 �lof RNase-free water. Reverse transcription (RT) was performedfrom 1 �g of total RNA by using 40 units of SuperScript IIreverse transcriptase and 0.1 �g of oligop(dT)12–18 primer in avolume of 20 �l. RT was performed at 42°C for 60 min and 70°Cfor 15 min. cDNA was diluted 1:3 before use. PCR was per-formed on an ABI PRISM 7700 Sequence Detection System(Applied Biosystems, Foster City, CA) in a final volume of 25 �lcontaining 12.5 �l of modified 2� PCR buffer (Applied Bio-systems), a 200 nM solution of each primer, a 100 nM solutionof the corresponding probe, and 4 �l of cDNA. All PCRs wereperformed by using the following conditions: initial 50°C for 2min and 95°C for 10 min, followed by 40 cycles at 95°C for 15 sand 60°C for 1 min.
Relative Quantitation of PCR Products. Primer and probes werechosen to bind in different exons or to span exon junctions to
del Rey et al. PNAS � October 24, 2006 � vol. 103 � no. 43 � 16043
PHYS
IOLO
GY
Dow
nloa
ded
by g
uest
on
May
22,
202
0
prevent amplification of genomic DNA. The forward primers(sequence 5�–3�) used were CAA CCA ACA AGT GAT ATT CTCCAT G (amplicon length 152 bp) for IL-1� (32) and CAA CGGGAA GCC CAT CAC CAT (amplicon length 66 bp) for glycer-aldehyde-3-phosphate-dehydrogenase (GAPDH). The fluorogenicinternal probes used were CTG TGT AAT GAA AGA CGG CACACC CAC C for IL-1� and TTC CAG GAG CGA GAC CCC ACTAAC for GAPDH. The reverse primer used were GAT CCA CACTCT CCA GCT GCA for IL-1� and CCG GCC TCA CCC CATTTG A for GAPDH. The comparative CT method was used tocalculate relative gene expression data, because we had determinedin preliminary experiments that the amplification efficiencies of thetarget gene (IL-1�) and the reference gene (GAPDH) are compa-
rable. Thus, the IL-1� mRNA level was normalized to the GAPDHmRNA level in each sample. The value of control animals wasarbitrarily set at 1.0.
Statistical Analysis. Results are expressed as mean � SEM. Datawere analyzed by using one-way ANOVA, followed by Fisher’stest for multiple comparisons. Correlations were analyzed byusing the StatView 5.1 program, version 2000. Differences wereconsidered significant when P values were �0.05.
This work was supported by German Research Council (DeutscheForschungsgemeinschaft) Grant RE 1451�2-2.
1. Riedemann NC, Guo RF, Ward PA (2003) J Clin Invest 112:460–467.2. Powanda MC, Beisel WR (2003) J Nutr 133:S322–S327.3. Bachmann MF, Kopf M (2002) Curr Opin Immunol 14:413–419.4. Straub RH, Besedovsky HO (2003) Faseb J 17:2176–2183.5. Calder PC (1995) Proc Nutr Soc 54:65–82.6. del Rey A, Besedovsky H (1987) Am J Physiol 253:R794–R798.7. Besedovsky H, del Rey A (1987) J Neurosci Res 18:172–178.8. del Rey A, Besedovsky H (1989) Proc Natl Acad Sci USA 86:5943–5947.9. Berkenbosch F, de Goeij DE, Rey AD, Besedovsky HO (1989) Neuroendocri-
nology 50:570–576.10. del Rey A, Besedovsky HO (1992) Eur J Clin Invest 22 Suppl 1:10–15.11. del Rey A, Monge-Arditi G, Klusman I, Besedovsky HO (1996) Exp Clin
Endocrinol Diabetes 104:317–326.12. del Rey A, Monge-Arditi G, Besedovsky HO (1998) Ann NY Acad Sci
840:153–161.13. Garcia-Welsh A, Schneiderman JS, Baly DL (1990) FEBS Lett 269:421–424.14. Bird TA, Davies A, Baldwin SA, Saklatvala J (1990) J Biol Chem 265:13578–
13583.15. Shikhman AR, Brinson DC, Valbracht J, Lotz MK (2001) J Immunol 167:7001–
7008.16. Gould GW, Cuenda A, Thomson FJ, Cohen P (1995) Biochem J 311 Pt
3:735–738.17. Fukuzumi M, Shinomiya H, Shimizu Y, Ohishi K, Utsumi S (1996) Infect
Immun 64:108–112.18. Fischereder M, Schroppel B, Wiese P, Fink M, Banas B, Schmidbauer S,
Schlondorff D (2003) J Nephrol 16:103–109.19. Vega C, Pellerin L, Dantzer R, Magistretti PJ (2002) Glia 39:10–18.20. Metzger S, Nusair S, Planer D, Barash V, Pappo O, Shilyansky J, Chajek-Shaul
T (2004) Endocrinology 145:5150–5156.21. Crown J, Jakubowski A, Kemeny N, Gordon M, Gasparetto C, Wong G,
Sheridan C, Toner G, Meisenberg B, Botet J, et al. (1991) Blood 78:1420–1427.
22. Agwunobi AO, Reid C, Maycock P, Little RA, Carlson GL (2000) J ClinEndocrinol Metab 85:3770–3778.
23. Bloesch D, Keller U, Spinas GA, Kury D, Girard J, Stauffacher W (1993) J ClinEndocrinol Metab 77:1156–1163.
24. Shikhman AR, Brinson DC, Lotz MK (2004) Am J Physiol Endocrinol Metab286:E980–E985.
25. Rettori V, Dees WL, Hiney JK, Lyson K, McCann SM (1994) Neuroimmuno-modulation 1:251–258.
26. Wong ML, Bongiorno PB, Rettori V, McCann SM, Licinio J (1997) Proc NatlAcad Sci USA 94:227–232.
27. Oguri S, Motegi K, Iwakura Y, Endo Y (2002) Clin Diagn Lab Immunol9:1307–1312.
28. Matsuki T, Horai R, Sudo K, Iwakura Y (2003) J Exp Med 198:877–888.29. Fox CJ, Hammerman PS, Thompson CB (2005) Nat Rev Immunol 5:
844–852.30. Ling PR, Bistrian BR, Mendez B, Istfan NW (1994) Metabolism 43:279–284.31. Chomczynski P, Sacchi N (1987) Anal Biochem 162:156–159.32. Overbergh L, Valckx D, Waer M, Mathieu C (1999) Cytokine 11:305–312.
16044 � www.pnas.org�cgi�doi�10.1073�pnas.0607076103 del Rey et al.
Dow
nloa
ded
by g
uest
on
May
22,
202
0