Embed Size (px)
Citation preview
International Journal for Sciences and Technology
Volume 8. No. 2/ June 2013 / ISSN: 2305-9346
A Refereed Scientific Journal Since 2006
��� ��� �� �� � � �2006
Issued By:
The International Centre for Advancement of Sciences and Technology
IJST contact Information:
P.O. Box 2793 Amman 11953 Jordan
Tel. +96265602285
E-mails: [email protected] / [email protected]
URL: www.ijst-jo.com
EDITORIAL BOARD - 2013 Al- Shammari , Abdul- Jabbar N. (Editor-in- Chief)
Professor of Microbiology / Faculty of Pharmacy / Royal University for Medical Sciences (RUMS) / P.O. Box 2793. Amman 11953 Jordan [email protected]
Abbas, Jamal A. Professor of Plant Ecophysiology / College of Agriculture / Kufa University / Iraq [email protected]
Abdul- Ghani, Zaki G. Professor of Microbiology / Faculty of Pharmaceutical Sciences / Amman Private University / Jordan [email protected]
Abdul- Hameed, Hayder M. PhD in Environmental Engineering / Environmental Engineering Dept./ Faculty of Engineering/ Baghdad University/ Iraq [email protected]
Abdullah, Ahmed R. PhD in Cancer Immunology and Genetics /Biotechnology Research Centre / Al- Nahrain University / Baghdad / Iraq [email protected] Al – Banna , Anton S. A Professor in Microbiology and Virology/ Faculty of Veterinary Medicine/ Baghdad University / Iraq [email protected]
Al- Dabbagh, Riadh H. Professor of Engineering Hydrology/ UAE [email protected]
Al- Daraji, Hazim J. Professor of Avian Reproduction and Physiology / Animal Resources Dept./ College of Agriculture / Baghdad University / Iraq [email protected]
Al- Douri, Atheer A. R PhD in Microbiology/Faculty of Veterinary Medicine/ Baghdad University/ Iraq [email protected]
Al- Jashami, Najim A. Professor of Nuclear Material Sciences / Dept. of Physics / College of Sciences / Kufa University / Iraq [email protected]
Al- Mashaykhi, Akram Othman PhD in IT / Amman Arab University for Graduate Studies / Jordan [email protected] Al- Murrani, Waleed K. Professor of Genetics and Biostatistics / University of Plymouth/ UK [email protected]
Al- Saqur, Ihsan M. Professor of Parasitology/ Faculty of Sciences / Baghdad University/ Iraq [email protected]
Al- Shamaony, Loai Professor of Biochemistry / Faculty of Pharmacy / Misr University for Sciences and Technology / Egypt [email protected] Al- Shebani, Abdullah S. PhD in Dairy Sciences and Technology / Food Sciences Dept./ College of Agriculture / Kufa University / Iraq [email protected]
Alwachi, Sabah N. Professor of Physiology / Biology Dept./ College of Sciences/ Baghdad University/ Iraq [email protected]
Daws, Kasim M. Professor of Mechanical Engineering / Faculty of Engineering / Baghdad University / Iraq [email protected]
Khamas, Wael Professor of Anatomy and Histology / College of Vaterinary Medicine / Western University of Health Sciences / Ponoma -California/ USA [email protected]
Mohammed, Ramadhan H. PhD in Geology / College of Sciences / Duhok University / Iraq [email protected]
Editorial Board Secretary Pharmacist. Nansi Elian Amman- Jordan [email protected]
International Journal for Sciences and Technology Vol. 8, No.2, June 2013 1
FORWARD
With well- established ambitious steps on continuing success way, IJST is coming for you all
today in its recent issue of volume eight for year 2013.
Year after year, IJST proves its strength and faithful belief in developing our scientific
communities among Arab World, especially in Iraq by giving an opportunity to all
researchers to present their fruitful achievements in main vital fields to let all world knows
that we are still the first leaders in civilized scientific life, despite all the unfortunate
situations or constraints.
It is my pleasure to welcome you and present you a new issue of our Journal, Volume 8, No. 2
(2013), the second issue of this year, with diversity of researches and elite experts of the
Editorial Board and Advisory Group. The members of Editorial Board, the ICAST and TSTC
teamwork and I hope you will find this collection of research articles useful and informative.
The journal is one of the scientific contributions offered by the International Centre for
Advancement of Sciences and Technology in cooperation with Treasure Est. for Scientific
Training and Consultations to the science and technology community (Arab region with
specific focus on Iraq and International).
Finally, on behalf of the International centre, I would like to express my gratitude and
appreciation to the efforts of the Editorial Board, Advisory group with their valuable efforts
in evaluating papers and the Editorial Board Secretary for managing the scientific, design,
technical and administrative aspects of the Journal and for preparing this issue for final
printing and publishing.
Editor-in-Chief
IJST
Abdul Jabbar Al- Shammari
International Journal for Sciences and Technology Vol. 8, No.2, June 2013 2
The Referees for this Issue * The referees and advisory group below are listed according to alphabetical order, with deep
appreciation for all. Prof. Abdul- Jabbar N. Al- Shammari Faculty of Pharmacy, Royal University for Medical Sciences (RUMS). Jordan Dr. Abdullah Sh. M. Al- Shebani Dept. of food sciences, Faculty of Agriculture, Al- Kufa University. Iraq
Prof. Ahmed M. Abdul-Lettif College of Sciences, University of Karbala. Iraq
Prof. Bashar Al- Shreidah National Centre for Agricultural Researches . Jordan
Dr. Dawood S. Al- Azzawi College of Pediatrics, Diyala University. Iraq
Dr. Harith F. Al- Mathkhouri College of Sciences, Baghdad University. Iraq
Dr. Hewa Y. Abdullah Head of physics department, college of Education, Salahaddidin-Hawler University, Erbil
Kurdistan region- Iraq
Prof. Jamal A. Abbas Faculty of Agriculture, Al- Kufa University. Iraq
Dr. Khalid Al- Azzawi Faculty of Pharmacy, Al- Isra University. Jordan
Prof. Mahmoud M. Othman Matar College of Medicine, Al- Najah National University. Palestine
Dr. Mohammed A.M. Al- Hajaj College of Sciences . Basra University. Iraq
Dr. Ramadhan H. Mohammed College of Sciences , Duhok University . Iraq
Dr. Taghreed H. Al- Noor College of Education for Pure Sciences, Ibn Al- Haitham , Baghdad University . Iraq
Prof. Taha Al- Samaraei Crown Research Institutes, Palmerston North. New Zealand
Prof. Zaki G. Abdul- Ghani Faculty of Pharmaceutical Sciences, Amman Private University. Jordan
International Journal for Sciences and Technology Vol. 8, No.2, June 2013 3
TABLE OF CONTENTS * Articles in this issue are listed below according to field specialties order, starting by English section and followed by
Arabic section.
(I) ENGLISH SECTION:
AGRICULTURAL SCIENCES
Adsorption of Malachite Green and Nile blue from Aqueous Solution onto Bentonite Clay Surface ………………………………………………………………………… 6-16 Bashaer J. Kadhim
Effect of lannate pesticide and its residues in bell green pepper on human lymphocytes……………………………………………………………………………………….. 17-22 Mohammed M. Mohammed, Sundus H. Ahmed, Mahdi Saleh, Ammar Mola,
Eman Mohammed & Falah Abdul- Hassan
BIOTECHNOLOGY
Extraction and Purification of Protease Inhibitor from Seeds of Some Plants and its Antimicrobial Activity ……………………………..……………………………........... 23-30. Sahar I.H. Al- Assadi
Inhibitory Effect of Camel Urine on Neoplastic and Transformed Cell Lines…………………31-35 Mohammed M. F. Al-Halbosiy, Rakad M. Kh. Al- Jumaily, Fadhel M. Lafta & Hussam M. Hassan
CHEMISTRY
Apolipoprotein B as a Biomarker in Patients with Stable and Unstable Angina Pectoris…...36-40. Hind Sh. Ahmed
Synthesis, Characterization and Inhibitory Effect on SALP of New Some Schiff Bases Derived From D-Erythroascorbic Acid…………………………………………41-47. Dhuha F. Hussein
Synthesis and anti-bacterial study of novel compounds with bis ( four-, five-, and seven-membered) heterocyclic rings…………………………………………………………………48-54. Muna S. AL-Rawi, Huda A. Hassan, Dheefaf F. Hassan & Rana M. Abdullah
Synthesis and characterization of some new thiazine-4-ones containing 1,3,4-thiadiazole moiety ………………………………………………………………………55-61 Ruwaidah S. Seed, Ali H. Samir, & Dr. Khalid. F. Ali
DENTISTRY
Comparative study of Fracture resistance of endodotically treated teeth restored with some types of cast posts ………………………………………………………………... 62-65 Haitham Dakhel
International Journal for Sciences and Technology Vol. 8, No.2, June 2013 4
ENGINEERING SCIENCES
Analysis Process the TFA of FH Based On Morlet CWT and SPWVD ……………….66-72 Jameela L. Abid Comparison Study between Adam-Bohart, Thomas and Yoon Nelson Models for Adsorption of Pb(II) from Simulated Wastewater by Activated Carbon…………73-79 Hayder M. Abdul- Hameed
MICROBIOLOGY Congenital cytomegalovirus infection in symptomatic infant in Baghdad and surrounding Area …………………………………………………………….. 80-85 Faiza L. Tuama, Atheer AR. Al- Douri, Faisal G. Nasser, Deena Moayad, Gasem Abas,
Mysoon Anwar & Saja Nehad Effect of Non-Thermal Plasma on Antibiotic Sensitivity and Biofilm Formation of Normal Flora Streptococcus spp. Isolated From Patients Exposed to X-Ray and From Healthy Persons …………………………………………………………………86-91
Ayad M.A. Fadhil, Reem N. Ibrahim, & Munira G. Ismail
Isolation of Staphylococcus aureus from Eczema patients ……….………………………92-96
Zainab K. Yousif
)II (قسم الدراسات والبحوث العربية – ARABIC SECTION
علــــوم األحياء الدقيقة
104-98............................................توصيف عاثي الرايزوبيوم المعزول من العقد الجذرية لنبات الباقالء
، أمير خضير عباس، علي هاشم الموسوي سندس علي جاسم
المحضرة محليا الميكروبية المعزولة من نوع من السلطاتحياءاألدراسة مسحية لبعض 115-105......................................................................................في بعض مطاعم بغداد
علياء سعد الحافظ
الغذاءعلـــــوم
124-116........................ الطمثانقطاع النساء في فترة دراسة تحليلية لبعض المتغيرات في أنماط التغذية لدى مريم مال اهللا غزال
International Journal for Sciences and Technology Vol. 8, No.2, June 2013 5
ENGLISH SECTION
International Journal for Sciences and Technology Vol. 8, No.2, June 2013 6
Adsorption of Malachite Green and Nile blue from Aqueous Solution onto
Bentonite Clay Surface
Bashaer J. Kadhim
Dept. of Food Science/ College of Agriculture/ Al- Kufa University / Republic of Iraq
ABSTRACT
The adsorption process of malachite Green and Nile blue from aqueous solution onto bentonite was studied. The results showed that the adsorption capacity of bentonite for the two dyes was 9.88 and 8.82 mg/g respectively. The figure of the adsorption isotherms indicated L4 type isotherms according to the Giles classification. The experimental adsorption results showed good correlation with the Langmuir and Ferundlich models. Experimental data indicated that the adsorption capacity of bentonite for the Malachite-Green dye was higher in basic rather than in acidic solution, whereas the Nile-blue was higher in neutral rather than in acidic solution, this was attributed to aggregation of two dyes in solution. Thermodynamic studies indicated that the adsorption of Malachite-Green onto bentonite was an exothermic process, while the adsorption of Nile-blue onto bentonite was an endothermic process. The adsorption enthalpy (∆H) for Malachite-Green and Nile-blue were calculated at -3.51 and +5.03 kJ/mole, respectively.
Keywords: Bentonite, Reactive dyes, Adsorption, isotherm
الملخص باللغة العربية
، حيـث تم دراسة عملية امتزاز صبغة الملكات الخضراء وصبغة النيل الزرقاء من المحلول المائي باستخدام سطح طين البنتونايـت .غم على التوالي/ ملغم 8.82 و 9.88نت النتائج أن سعة امتزاز البنتونايت للصبغتين كابينت
.(Giles) وفق تصنيف جيلزL4يزوثيرمات االمتزاز على سطح طين البنتونايت كانت من النوع إن أوضحت النتائج أون سـعة امتـزاز البنتونايـت أ واتضح ،Ferundlich و Langmuirبينت نتائج االمتزاز التجريبية وجود عالقة جيدة مع عالقات
بينما كانت لصبغة النيل الزرقاء أعلى فـي ،الملكات الخضراء كانت أعلى في المحلول القاعدي مما في المحلول الحامضي لصبغة . ويعزى ذلك الى تجمع الصبغتين في المحلول،المحلول المتعادل مما في المحلول الحامضي
كان ماصا للحـرارة في حين ، للحرارة ابنتونايت كان باعث تشير الدراسات الديناميكية الحرارية أن امتزاز الملكات الخضراء على ال لـصبغة الملكـات و kJ/mole 3.51- للـصبغتين فكانـت (H∆)تم حساب أنثالبي االمتزاز ، والزرقاء لى صبغة النيلإبالنسبة
+5.03kJ/moleلصبغة النيل.
International Journal for Sciences and Technology Vol. 8, No.2, June 2013 7
INTRODUCTION
Dyes and pigments have been used in many industries for coloration. Textile industry is one of the prominent pollutants, which release high concentrated effluent into the surrounding environments (1). Dyes contain carcinogenic materials, which can pose serious hazards to aquatic life as well as to the end users of water. Therefore, it is important to remove these pollutants before their final disposal. One of the conventional methods for removal of dyes from wastewater is adsorption (2,3). Natural clay, such as bentonite, may be an adsorbent because of their abundance in most continents of the world and its low cost (4,5). Bentonite is mainly composed of montmorillonite, consists of layers of two tetrahedral silica sheets sandwiching one octahedral alumina sheet. A number of adsorbents have been tried for treatment of wastewater such as activated carbon (6), orange peel (7), palmfruit bunch (8), rice husk (9), sugar cane dust (10), Chitin (11), fly ash (12) and wool fibers (13). The aim of the current study is to investigate the adsorption of reactive dyes by using bentonite clay, in addition to study the effect of initial dye concentration, contact time, pH and temperature.
MATERIALS AND METHODS
The absorbance measurements were carried out on an Apel-PD-303 UV-visible recording spectrophotometer whereas spectral of λmax of dyes was carried out on a Shimadzu UV-visible 1700 double beam spectrophotometer using (1 cm) glass cells. Shaking Incubator (precision scientific/GCA, Chicago, Illinois, USA), Megafuge 1.0 Hero centrifuge and a digital pH-meter Hanna were used. Preparation of bentonite clay (14) (adsorbent): Bentonite clay used in this study was obtained from the general company of geological survey and mining, Baghdad, Iraq. The results of chemical analysis of bentonite are listed in table (1).
Table (1): The chemical analysis of bentonite Bentonite was washed with distilled water several times to remove water-soluble impurities. Then it was dried at temperature 378k for 24 hours then placed in desiccators to be used in the adsorption experiments. Two reactive dyes were selected, namely Malachite-Green (Merck) and Nile-blue (Fluka).The chemical structures and molecular weight of the dyes are illustrated in table (2). Standard Malachite-Green solution 100 µg/ml) This solution was prepared by dissolving 0.01 g of Malachite-Green in 100 ml of distilled water, working standard of Malachite-Green solutions were prepared by simple dilution of the appropriate volume of the standard Malachite-Green solution (100 µg/ml) with distilled water. Standard Nile-blue solution (100 µg/ml) This solution was prepared by dissolving 0.01 g of Nile-blue in 100 ml of distilled water, working standard of Nile-blue solutions were prepared by simple dilution of appropriate volume of the standard Nile-blue solution (100 µg/ml) with distilled water. Calibration graphs of dyes In to a series of ten calibrated flask, transfer increasing volume of Malachite-Green and Nile-blue dyes working solution 100 µg.ml-1) to cover the range of the calibration curve. Linear calibration graphs of two dyes are obtained, that Beer's law is obeyed over the concentration range (2-20 ppm) with correlation coefficients (0.9951), (0.990) and intercept (0.1) and (0.04) for Malachite-Green and Nile-blue respectively.
constituent Wt%
Sio2 70.86
Al2O3 14.1
Fe2O3 0.90
CaO 2.33
MgO 1.63
SO3 0.31
K2O 6.95
Total 97.08
International Journal for Sciences and Technology Vol. 8, No.2, June 2013 8
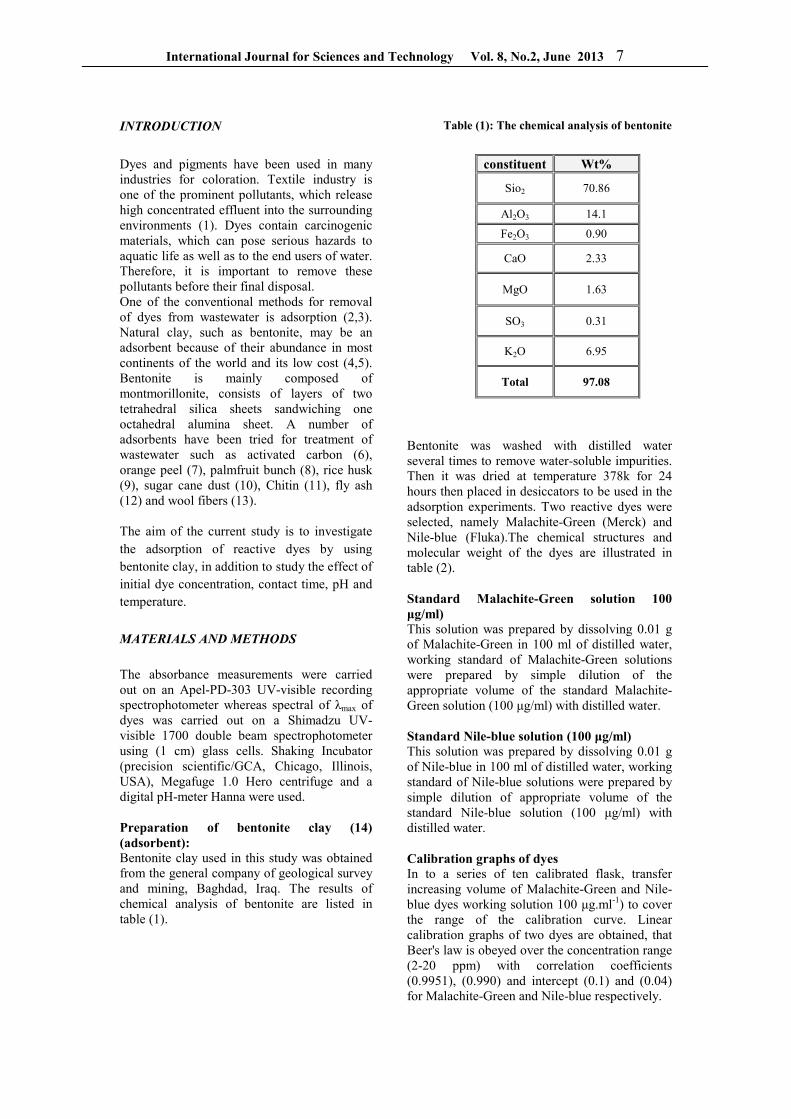
Table (2): Structures, molecular weights and wavelengths of dyes
Dyes Chemical Structure Molecular mass λmax (nm)
Malachite-Green C
(H3C)2NN(CH3)2
463
620
Nile-blue
415
631
Reactive dye adsorption isotherms procedure Equilibrium adsorption isotherms for reactive dyes were undertaken at 25±1 C. A mass of 0.04 g of bentonite clay was added to 250 cm3 conical flasks containing 20 cm3 of reactive dye of varying concentrations 2-20 ppm. The flasks were placed in a thermo stated shaker for 90 minutes until equilibrium was achieved. The adsorption behavior of the dyes on the bentonite clay was studied at four temperatures (298, 303, 308 and 313 K).
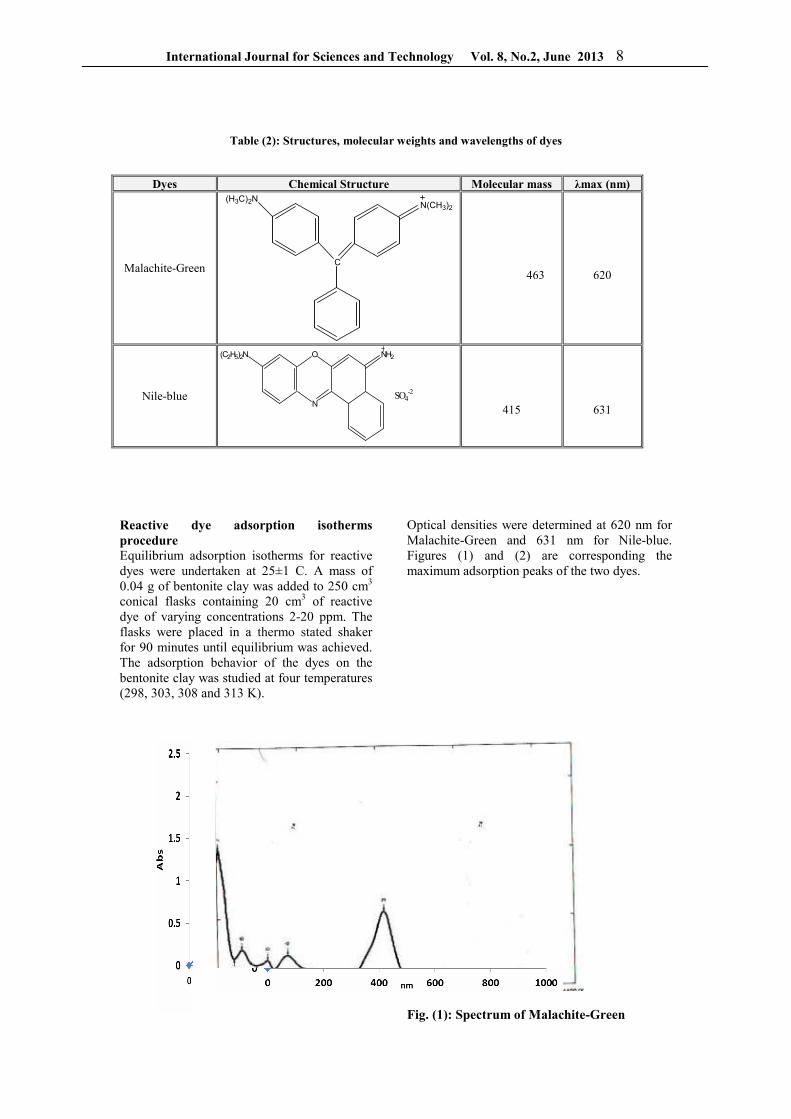
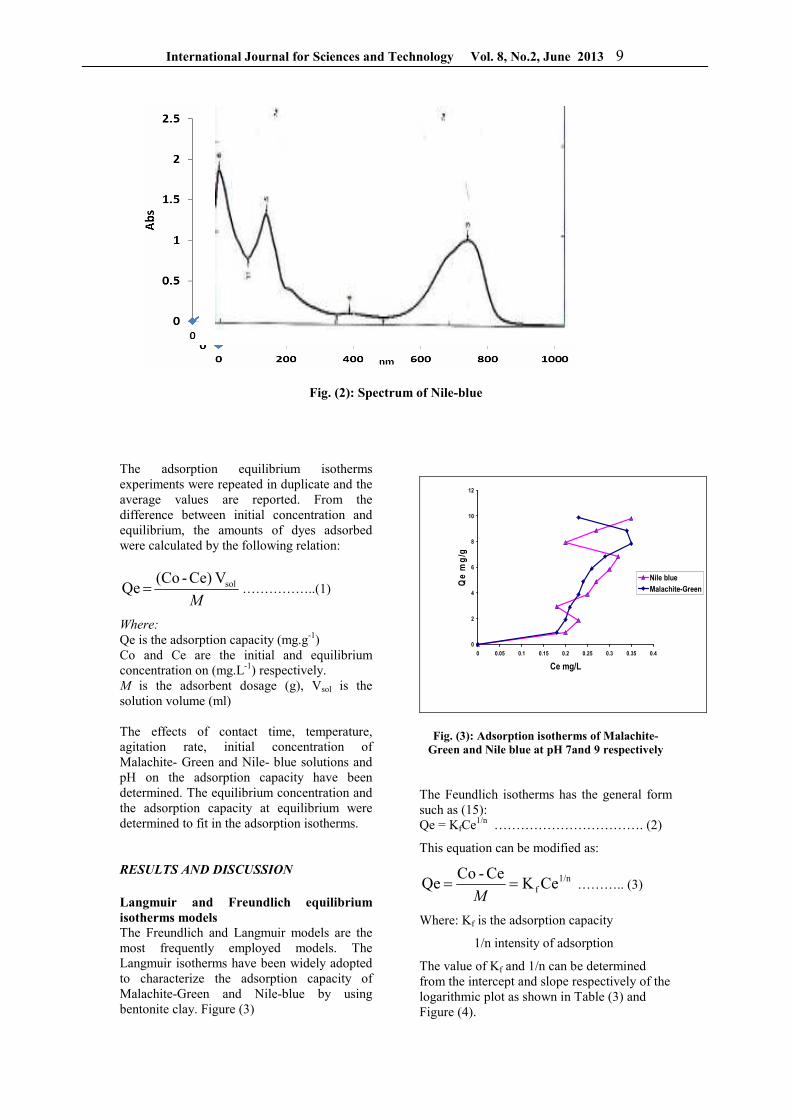
Optical densities were determined at 620 nm for Malachite-Green and 631 nm for Nile-blue. Figures (1) and (2) are corresponding the maximum adsorption peaks of the two dyes.
Fig. (1): Spectrum of Malachite-Green
N
O NH2(C2H5)2N
SO4-2
International Journal for Sciences and Technology Vol. 8, No.2, June 2013 9
Fig. (2): Spectrum of Nile-blue
The adsorption equilibrium isotherms experiments were repeated in duplicate and the average values are reported. From the difference between initial concentration and equilibrium, the amounts of dyes adsorbed were calculated by the following relation:
M
solV Ce)-(Co Qe = ……………..(1)
Where:
Qe is the adsorption capacity (mg.g-1) Co and Ce are the initial and equilibrium concentration on (mg.L-1) respectively. M is the adsorbent dosage (g), Vsol is the solution volume (ml) The effects of contact time, temperature, agitation rate, initial concentration of Malachite- Green and Nile- blue solutions and pH on the adsorption capacity have been determined. The equilibrium concentration and the adsorption capacity at equilibrium were determined to fit in the adsorption isotherms. RESULTS AND DISCUSSION
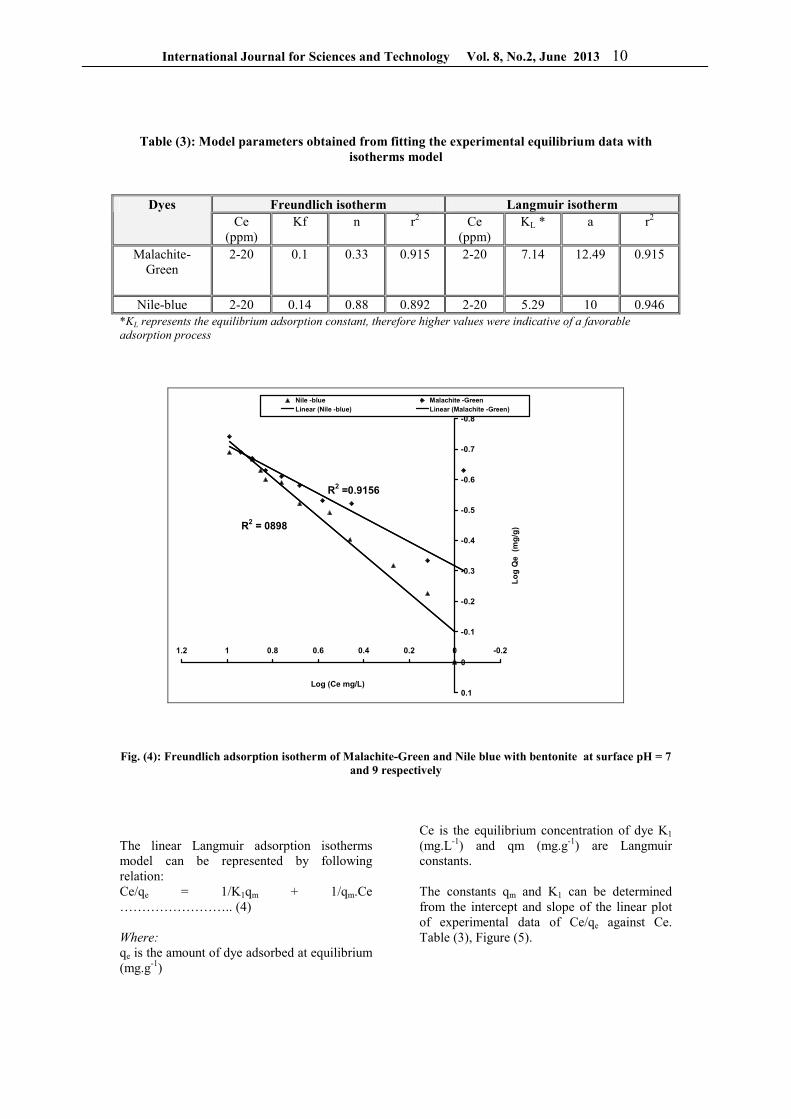
Langmuir and Freundlich equilibrium isotherms models The Freundlich and Langmuir models are the most frequently employed models. The Langmuir isotherms have been widely adopted to characterize the adsorption capacity of Malachite-Green and Nile-blue by using bentonite clay. Figure (3)
0
2
4
6
8
10
12
0 0.05 0.1 0.15 0.2 0.25 0.3 0.35 0.4
Ce mg/L
Qe
mg
/g
Nile blue
Malachite-Green
Fig. (3): Adsorption isotherms of Malachite-Green and Nile blue at pH 7and 9 respectively
The Feundlich isotherms has the general form such as (15): Qe = KfCe1/n ……………………………. (2)
This equation can be modified as:
1/nf CeK
Ce-Co Qe ==
M ……….. (3)
Where: Kf is the adsorption capacity
1/n intensity of adsorption
The value of Kf and 1/n can be determined from the intercept and slope respectively of the logarithmic plot as shown in Table (3) and Figure (4).
International Journal for Sciences and Technology Vol. 8, No.2, June 2013 10
Table (3): Model parameters obtained from fitting the experimental equilibrium data with
isotherms model
Freundlich isotherm Langmuir isotherm Dyes Ce
(ppm) Kf n r2 Ce
(ppm) KL * a r2
Malachite-Green
2-20 0.1 0.33 0.915 2-20 7.14 12.49 0.915
Nile-blue 2-20 0.14 0.88 0.892 2-20 5.29 10 0.946 *KL represents the equilibrium adsorption constant, therefore higher values were indicative of a favorable
adsorption process
R2 = 0898
R2 =0.9156
-0.8
-0.7
-0.6
-0.5
-0.4
-0.3
-0.2
-0.1
0
0.1
-0.200.20.40.60.811.2
Log (Ce mg/L)
Lo
g Q
e
(mg
/g)
Nile -blue Malachite -Green
Linear (Nile -blue) Linear (Malachite -Green)
Fig. (4): Freundlich adsorption isotherm of Malachite-Green and Nile blue with bentonite at surface pH = 7 and 9 respectively
The linear Langmuir adsorption isotherms model can be represented by following relation: Ce/qe = 1/K1qm + 1/qm.Ce …………………….. (4) Where:
qe is the amount of dye adsorbed at equilibrium (mg.g-1)
Ce is the equilibrium concentration of dye K1 (mg.L-1) and qm (mg.g-1) are Langmuir constants. The constants qm and K1 can be determined from the intercept and slope of the linear plot of experimental data of Ce/qe against Ce. Table (3), Figure (5).
International Journal for Sciences and Technology Vol. 8, No.2, June 2013 11
R2 = 0.916
R2 = 0.945
-0.05
0
0.05
0.1
0.15
0.2
0.25
0 0.05 0.1 0.15 0.2 0.25 0.3 0.35 0.4
Ce (mg/L)
Ce/Q
e (
mg
/g)
Malachite-Green Nile-blueLinear (Malachite-Green) Linear (Nile-blue)
Fig. (5): Langmuir adsorption isotherm of Malachite-Green and Nile blue with bentonite at surface pH = 7
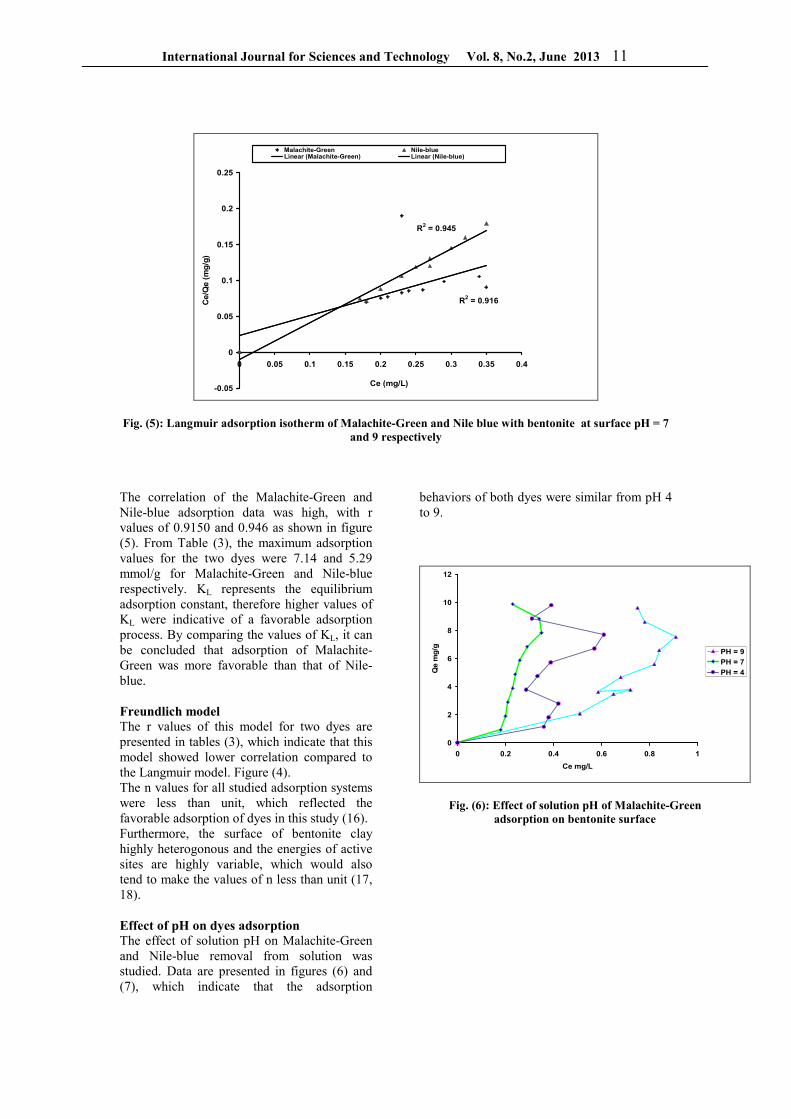
and 9 respectively The correlation of the Malachite-Green and Nile-blue adsorption data was high, with r values of 0.9150 and 0.946 as shown in figure (5). From Table (3), the maximum adsorption values for the two dyes were 7.14 and 5.29 mmol/g for Malachite-Green and Nile-blue respectively. KL represents the equilibrium adsorption constant, therefore higher values of KL were indicative of a favorable adsorption process. By comparing the values of KL, it can be concluded that adsorption of Malachite-Green was more favorable than that of Nile-blue. Freundlich model The r values of this model for two dyes are presented in tables (3), which indicate that this model showed lower correlation compared to the Langmuir model. Figure (4). The n values for all studied adsorption systems were less than unit, which reflected the favorable adsorption of dyes in this study (16). Furthermore, the surface of bentonite clay highly heterogonous and the energies of active sites are highly variable, which would also tend to make the values of n less than unit (17, 18). Effect of pH on dyes adsorption The effect of solution pH on Malachite-Green and Nile-blue removal from solution was studied. Data are presented in figures (6) and (7), which indicate that the adsorption
behaviors of both dyes were similar from pH 4 to 9.
0
2
4
6
8
10
12
0 0.2 0.4 0.6 0.8 1
Ce mg/L
Qe m
g/g
PH = 9
PH = 7
PH = 4
Fig. (6): Effect of solution pH of Malachite-Green adsorption on bentonite surface
International Journal for Sciences and Technology Vol. 8, No.2, June 2013 12
0
2
4
6
8
10
12
0 0.2 0.4 0.6 0.8 1
Ce mg/L
Qe
mg
/g
pH= 9"
pH = 7
PH=4
Fig. (7): Effect of solution pH of Nile blue adsorption on bentonite surface
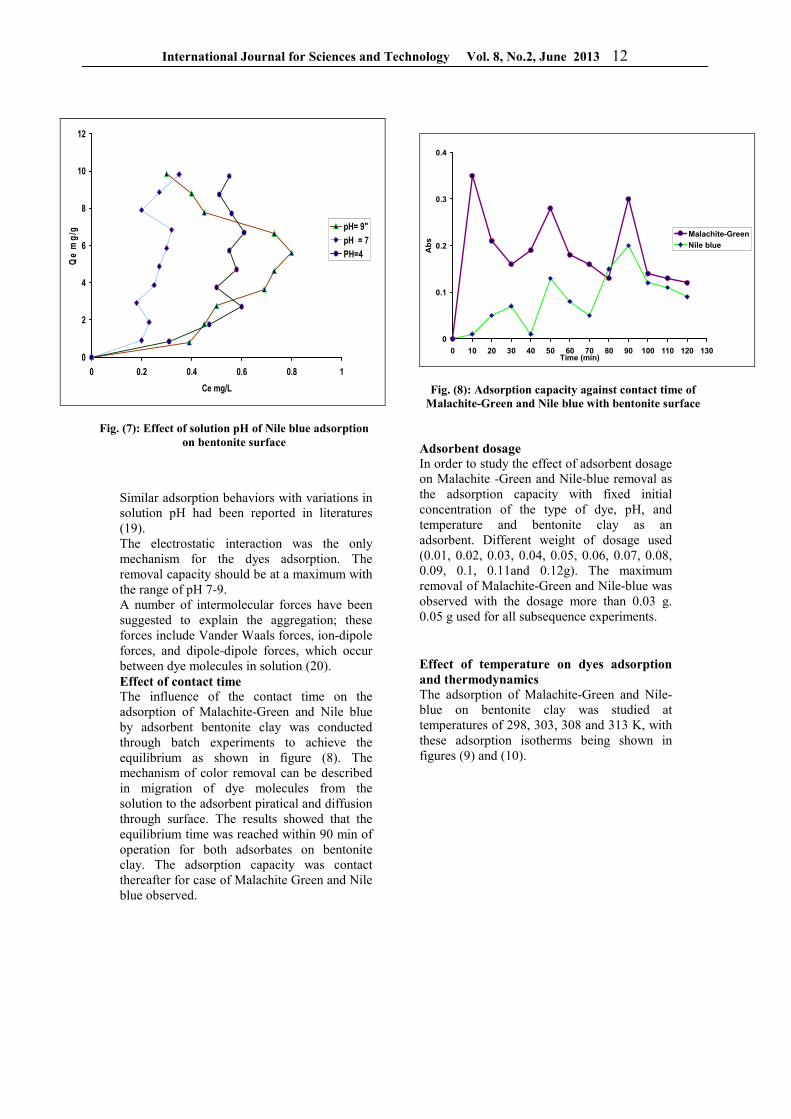
Similar adsorption behaviors with variations in solution pH had been reported in literatures (19). The electrostatic interaction was the only mechanism for the dyes adsorption. The removal capacity should be at a maximum with the range of pH 7-9. A number of intermolecular forces have been suggested to explain the aggregation; these forces include Vander Waals forces, ion-dipole forces, and dipole-dipole forces, which occur between dye molecules in solution (20). Effect of contact time The influence of the contact time on the adsorption of Malachite-Green and Nile blue by adsorbent bentonite clay was conducted through batch experiments to achieve the equilibrium as shown in figure (8). The mechanism of color removal can be described in migration of dye molecules from the solution to the adsorbent piratical and diffusion through surface. The results showed that the equilibrium time was reached within 90 min of operation for both adsorbates on bentonite clay. The adsorption capacity was contact thereafter for case of Malachite Green and Nile blue observed.
0
0.1
0.2
0.3
0.4
0 10 20 30 40 50 60 70 80 90 100 110 120 130Time (min)
Ab
s
Malachite-Green
Nile blue
Fig. (8): Adsorption capacity against contact time of Malachite-Green and Nile blue with bentonite surface
Adsorbent dosage In order to study the effect of adsorbent dosage on Malachite -Green and Nile-blue removal as the adsorption capacity with fixed initial concentration of the type of dye, pH, and temperature and bentonite clay as an adsorbent. Different weight of dosage used (0.01, 0.02, 0.03, 0.04, 0.05, 0.06, 0.07, 0.08, 0.09, 0.1, 0.11and 0.12g). The maximum removal of Malachite-Green and Nile-blue was observed with the dosage more than 0.03 g. 0.05 g used for all subsequence experiments.
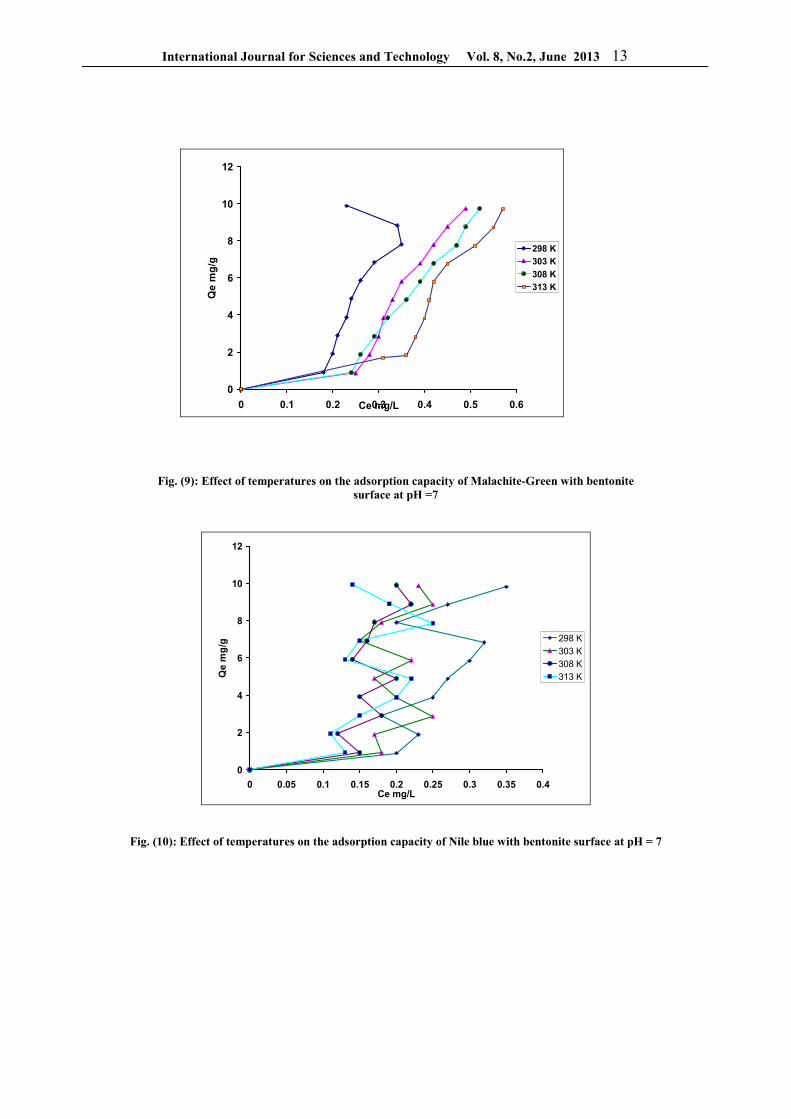
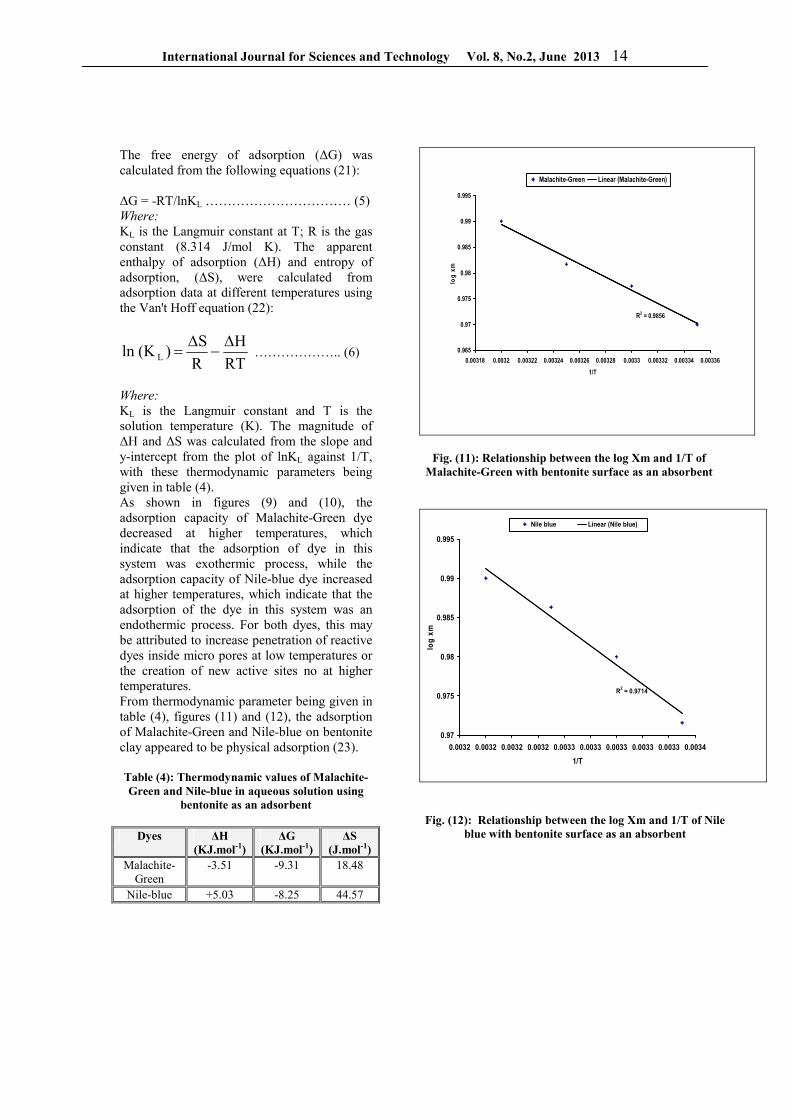
Effect of temperature on dyes adsorption and thermodynamics The adsorption of Malachite-Green and Nile-blue on bentonite clay was studied at temperatures of 298, 303, 308 and 313 K, with these adsorption isotherms being shown in figures (9) and (10).
International Journal for Sciences and Technology Vol. 8, No.2, June 2013 13
0
2
4
6
8
10
12
0 0.1 0.2 0.3 0.4 0.5 0.6Ce mg/L
Qe
mg
/g
298 K
303 K
308 K
313 K
Fig. (9): Effect of temperatures on the adsorption capacity of Malachite-Green with bentonite surface at pH =7
0
2
4
6
8
10
12
0 0.05 0.1 0.15 0.2 0.25 0.3 0.35 0.4Ce mg/L
Qe
mg
/g
298 K
303 K
308 K
313 K
Fig. (10): Effect of temperatures on the adsorption capacity of Nile blue with bentonite surface at pH = 7
International Journal for Sciences and Technology Vol. 8, No.2, June 2013 14
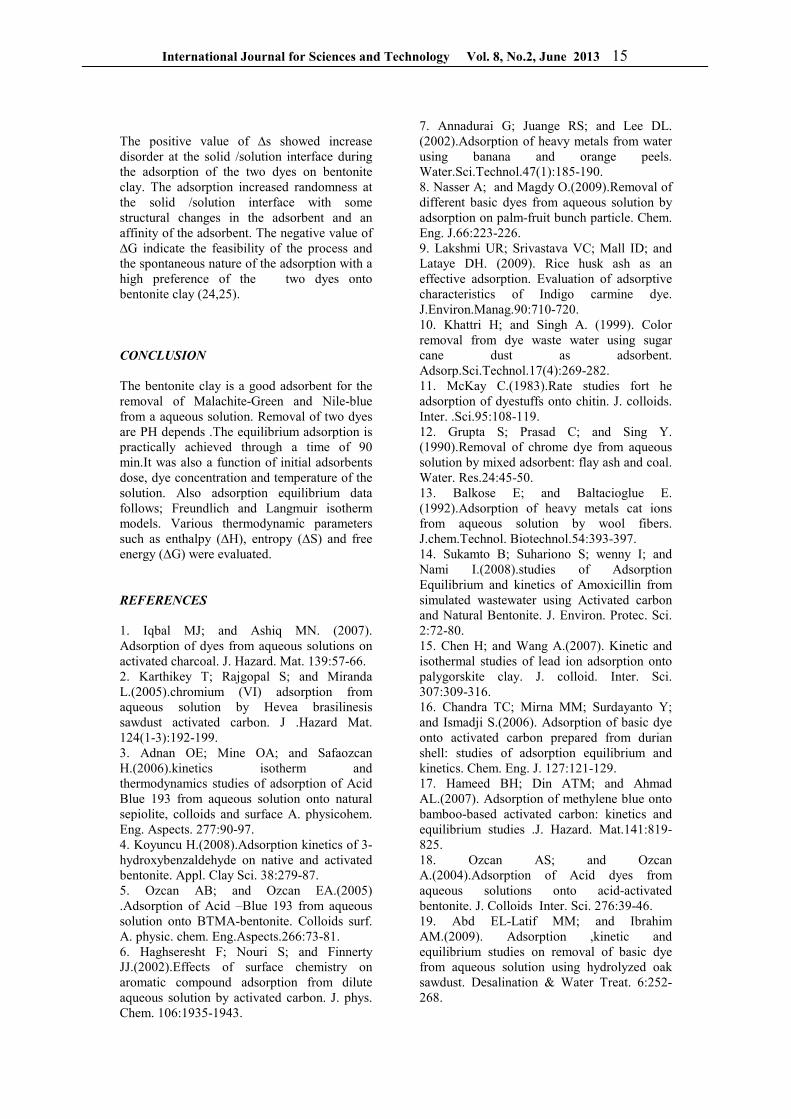
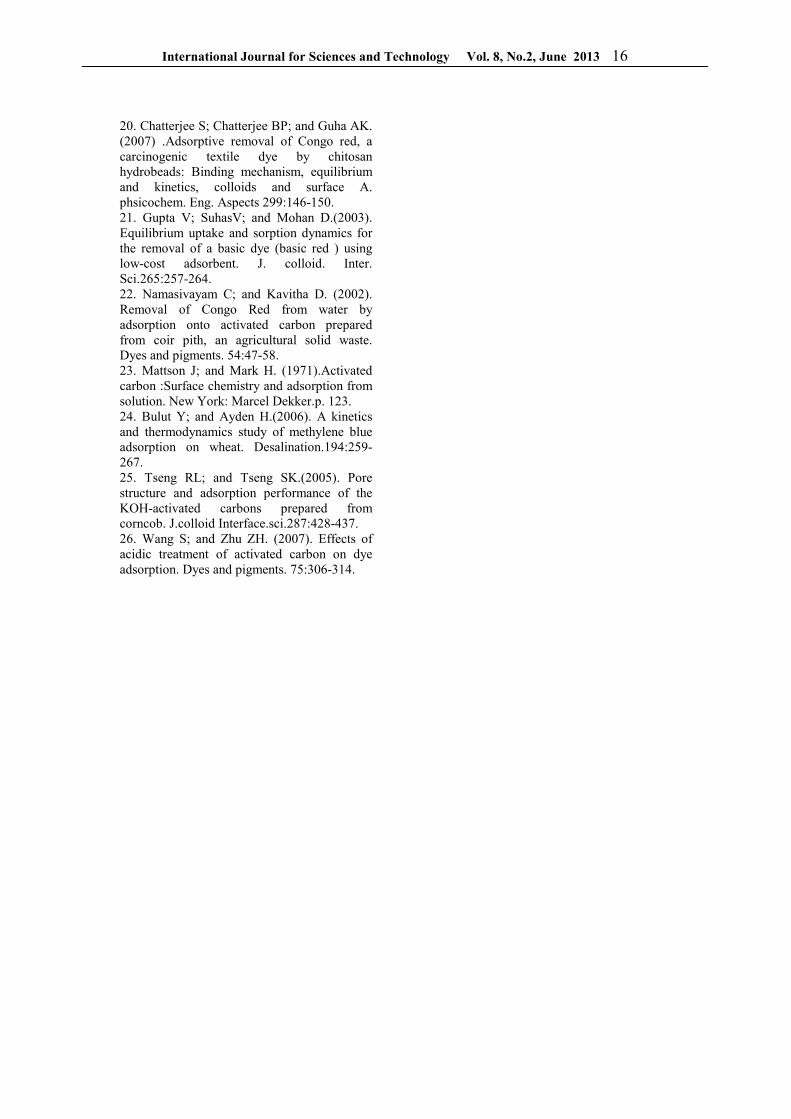
The free energy of adsorption (∆G) was calculated from the following equations (21): ∆G = -RT/lnKL …………………………… (5) Where:
KL is the Langmuir constant at T; R is the gas constant (8.314 J/mol K). The apparent enthalpy of adsorption (∆H) and entropy of adsorption, (∆S), were calculated from adsorption data at different temperatures using the Van't Hoff equation (22):
RT
H
R
S )(Kln L
∆−
∆= ……………….. (6)
Where:
KL is the Langmuir constant and T is the solution temperature (K). The magnitude of ∆H and ∆S was calculated from the slope and y-intercept from the plot of lnKL against 1/T, with these thermodynamic parameters being given in table (4). As shown in figures (9) and (10), the adsorption capacity of Malachite-Green dye decreased at higher temperatures, which indicate that the adsorption of dye in this system was exothermic process, while the adsorption capacity of Nile-blue dye increased at higher temperatures, which indicate that the adsorption of the dye in this system was an endothermic process. For both dyes, this may be attributed to increase penetration of reactive dyes inside micro pores at low temperatures or the creation of new active sites no at higher temperatures. From thermodynamic parameter being given in table (4), figures (11) and (12), the adsorption of Malachite-Green and Nile-blue on bentonite clay appeared to be physical adsorption (23). Table (4): Thermodynamic values of Malachite-Green and Nile-blue in aqueous solution using
bentonite as an adsorbent
Dyes ∆H (KJ.mol-1)
∆G (KJ.mol-1)
∆S (J.mol-1)
Malachite-Green
-3.51 -9.31 18.48
Nile-blue +5.03 -8.25 44.57
R2 = 0.9856
0.965
0.97
0.975
0.98
0.985
0.99
0.995
0.00318 0.0032 0.00322 0.00324 0.00326 0.00328 0.0033 0.00332 0.00334 0.00336
1/T
log
xm
Malachite-Green Linear (Malachite-Green)
Fig. (11): Relationship between the log Xm and 1/T of Malachite-Green with bentonite surface as an absorbent
R2 = 0.9714
0.97
0.975
0.98
0.985
0.99
0.995
0.0032 0.0032 0.0032 0.0032 0.0033 0.0033 0.0033 0.0033 0.0033 0.0034
1/T
log
xm
Nile blue Linear (Nile blue)
Fig. (12): Relationship between the log Xm and 1/T of Nile
blue with bentonite surface as an absorbent
International Journal for Sciences and Technology Vol. 8, No.2, June 2013 15
The positive value of ∆s showed increase disorder at the solid /solution interface during the adsorption of the two dyes on bentonite clay. The adsorption increased randomness at the solid /solution interface with some structural changes in the adsorbent and an affinity of the adsorbent. The negative value of ∆G indicate the feasibility of the process and the spontaneous nature of the adsorption with a high preference of the two dyes onto bentonite clay (24,25). CONCLUSION
The bentonite clay is a good adsorbent for the removal of Malachite-Green and Nile-blue from a aqueous solution. Removal of two dyes are PH depends .The equilibrium adsorption is practically achieved through a time of 90 min.It was also a function of initial adsorbents dose, dye concentration and temperature of the solution. Also adsorption equilibrium data follows; Freundlich and Langmuir isotherm models. Various thermodynamic parameters such as enthalpy (∆H), entropy (∆S) and free energy (∆G) were evaluated. REFERENCES
1. Iqbal MJ; and Ashiq MN. (2007). Adsorption of dyes from aqueous solutions on activated charcoal. J. Hazard. Mat. 139:57-66. 2. Karthikey T; Rajgopal S; and Miranda L.(2005).chromium (VI) adsorption from aqueous solution by Hevea brasilinesis sawdust activated carbon. J .Hazard Mat. 124(1-3):192-199. 3. Adnan OE; Mine OA; and Safaozcan H.(2006).kinetics isotherm and thermodynamics studies of adsorption of Acid Blue 193 from aqueous solution onto natural sepiolite, colloids and surface A. physicohem. Eng. Aspects. 277:90-97. 4. Koyuncu H.(2008).Adsorption kinetics of 3- hydroxybenzaldehyde on native and activated bentonite. Appl. Clay Sci. 38:279-87. 5. Ozcan AB; and Ozcan EA.(2005) .Adsorption of Acid –Blue 193 from aqueous solution onto BTMA-bentonite. Colloids surf. A. physic. chem. Eng.Aspects.266:73-81. 6. Haghseresht F; Nouri S; and Finnerty JJ.(2002).Effects of surface chemistry on aromatic compound adsorption from dilute aqueous solution by activated carbon. J. phys. Chem. 106:1935-1943.
7. Annadurai G; Juange RS; and Lee DL. (2002).Adsorption of heavy metals from water using banana and orange peels. Water.Sci.Technol.47(1):185-190. 8. Nasser A; and Magdy O.(2009).Removal of different basic dyes from aqueous solution by adsorption on palm-fruit bunch particle. Chem. Eng. J.66:223-226. 9. Lakshmi UR; Srivastava VC; Mall ID; and Lataye DH. (2009). Rice husk ash as an effective adsorption. Evaluation of adsorptive characteristics of Indigo carmine dye. J.Environ.Manag.90:710-720. 10. Khattri H; and Singh A. (1999). Color removal from dye waste water using sugar cane dust as adsorbent. Adsorp.Sci.Technol.17(4):269-282. 11. McKay C.(1983).Rate studies fort he adsorption of dyestuffs onto chitin. J. colloids. Inter. .Sci.95:108-119. 12. Grupta S; Prasad C; and Sing Y. (1990).Removal of chrome dye from aqueous solution by mixed adsorbent: flay ash and coal. Water. Res.24:45-50. 13. Balkose E; and Baltacioglue E. (1992).Adsorption of heavy metals cat ions from aqueous solution by wool fibers. J.chem.Technol. Biotechnol.54:393-397. 14. Sukamto B; Suhariono S; wenny I; and Nami I.(2008).studies of Adsorption Equilibrium and kinetics of Amoxicillin from simulated wastewater using Activated carbon and Natural Bentonite. J. Environ. Protec. Sci. 2:72-80. 15. Chen H; and Wang A.(2007). Kinetic and isothermal studies of lead ion adsorption onto palygorskite clay. J. colloid. Inter. Sci. 307:309-316. 16. Chandra TC; Mirna MM; Surdayanto Y; and Ismadji S.(2006). Adsorption of basic dye onto activated carbon prepared from durian shell: studies of adsorption equilibrium and kinetics. Chem. Eng. J. 127:121-129. 17. Hameed BH; Din ATM; and Ahmad AL.(2007). Adsorption of methylene blue onto bamboo-based activated carbon: kinetics and equilibrium studies .J. Hazard. Mat.141:819-825. 18. Ozcan AS; and Ozcan A.(2004).Adsorption of Acid dyes from aqueous solutions onto acid-activated bentonite. J. Colloids Inter. Sci. 276:39-46. 19. Abd EL-Latif MM; and Ibrahim AM.(2009). Adsorption ,kinetic and equilibrium studies on removal of basic dye from aqueous solution using hydrolyzed oak sawdust. Desalination & Water Treat. 6:252-268.
International Journal for Sciences and Technology Vol. 8, No.2, June 2013 16
20. Chatterjee S; Chatterjee BP; and Guha AK. (2007) .Adsorptive removal of Congo red, a carcinogenic textile dye by chitosan hydrobeads: Binding mechanism, equilibrium and kinetics, colloids and surface A. phsicochem. Eng. Aspects 299:146-150. 21. Gupta V; SuhasV; and Mohan D.(2003). Equilibrium uptake and sorption dynamics for the removal of a basic dye (basic red ) using low-cost adsorbent. J. colloid. Inter. Sci.265:257-264. 22. Namasivayam C; and Kavitha D. (2002). Removal of Congo Red from water by adsorption onto activated carbon prepared from coir pith, an agricultural solid waste. Dyes and pigments. 54:47-58. 23. Mattson J; and Mark H. (1971).Activated carbon :Surface chemistry and adsorption from solution. New York: Marcel Dekker.p. 123. 24. Bulut Y; and Ayden H.(2006). A kinetics and thermodynamics study of methylene blue adsorption on wheat. Desalination.194:259-267. 25. Tseng RL; and Tseng SK.(2005). Pore structure and adsorption performance of the KOH-activated carbons prepared from corncob. J.colloid Interface.sci.287:428-437. 26. Wang S; and Zhu ZH. (2007). Effects of acidic treatment of activated carbon on dye adsorption. Dyes and pigments. 75:306-314.
International Journal for Sciences and Technology Vol. 8, No.2, June 2013 17
Effect of lannate pesticide and its residues in bell green pepper on human
lymphocytes
Mohammed M. Mohammed (1), Sundus H. Ahmed (1), Mahdi Saleh(1), Ammar Mola (2), Eman Mohammed (2) & Falah Abdul- Hassan (2) (1) Agricultural Research Directorate/ Ministry of Sciences and Technology/ Baghdad (2) Material
Science Directorate / Ministry of Sciences and Technology/ Baghdad / Iraq
.
E –mail: [email protected]
ABSTRACT
This study was conducted to detect the residual concentration of lannate pesticide and its genotoxic activity ,The results showed that the concentration of lannate in twenty grams of pepper tissue were 9750, 9100, 7450, 6500 and 5700 ppm respectively after ( 5hr and 5, 10, 15, 20 days respectively) of collecting samples for analysis that were previously sprayed with the recommended dose of lannate 1.5ml/L. The ability of this pesticide was studied for its possible genotoxic effects eventually in vitro, micronucleus (MN) formation and sister-chromatid exchange (SCE) induction in human lymphocytes was tested. The results of the MN analysis indicated that MN frequencies after treatment with lannate pesticide in concentrations between (0-2000) µg/ml, significantly differ from the control and its increase was between (1.3- 77.1) , even mice were used in other experiments in order to determine the formation of free radicals.
Key words: Sister-chromatid exchange (SCE); Micronucleus.
الملخص باللغة العربية
شرين هدفت الدراسة الحالية إلى تحديد نسب متبقيات مبيد الالنيت وسميته الوراثية ، إذ أظهرت النتائج أن تركيز الالنيت في عبعد فترات قطف الثمار جزء بالمليون على التوالي5700، 6500، 7450، 9100، 9750غرام من نسيج الفلفل األخضر كانت
للفلفل األخضر بعد الرش بالجرعة المحددة لمبيد الالنيت وهي ) يوم على التوالي20 ,15، 10 ، 5 ساعات و 5( لغرض التحليل لمبيد في إحداث السمية الجينية في نهاية المطاف مخبريا، اجري فحص النويات الصغيرة ودرست إمكانية هذا ا.لتر/مل1.5
micronucleus (MN) وفحص تبادل الكروماتيدات الشقيقة(SCE) المستحثة في الخاليا اللمفاوية البشرية وأظهرت النتائج بأن نموذجمل اختلفت معنويا عن/ مايكروغرام ) 2 000 - 0( بعد المعاملة بالمبيد عند التراكيز)MN (تكرار النويات الصغيرة
الكشف عن تكون في تجارب أخرى لغرض كما استعملت فئران التجارب ،77.1 -1.3 ) (السيطرة ومعدل الزيادة كان بين .الجذور الحرة
International Journal for Sciences and Technology Vol. 8, No.2, June 2013 18
INTRODUCTION
In recent years, pesticide toxicity has been extensively investigated. The reason for this is not only their important role in agriculture but especially findings that certain pesticides showed carcinogenic and mutagenic properties in laboratory animals and exposed humans(1). Carbamate pesticides are widely used in agriculture and home gardening. They are derivatives of carbamic acid and like organophosphates, their mechanism of action is that of inhibiting the vital enzyme acetyl cholinesterase which is reversible as compared to organophosphates which is irreversible (2). Exposure to cholinesterase inhibiting agents is considered a major health problem for the farm workers throughout the world. lannate belongs to the carbamate family and its active ingredient is methomyl, lannate is widely used throughout the world since it is effective as “contact pesticide” as well as “systemic pesticide”(3). lannate has been classified as a pesticide of category-I toxicity The present work focuses on the in vitro and in vivo
analysis of genotoxic effects of Lannate using
cytogenetic tests such as micronucleus assay, sister-chromatid exchange analysis in human lymphocytes in vitro and lipid peroxidation test .
MATERIALS AND METHODS
Sprying lannate: Green peppers were cultured in green houses and sprayed with lannate (1.5 ml/L) when pests first appear, spraying was repeated as plants grew larger to ensure coverage and making sure that spraying should not exceed 7 days (4), samples were took for determination after 5hr, 5, 10, 15, 20 days and residues were measured by taking 20 grams from each sample of bell green peppers and gave concentrations( 9750 ،9100 ،7450 ،6500 and 5700ppm) respectively using HPLC technique (5). Blood Samples and Lannate: Blood samples were obtained from two healthy nonsmokers without previous known contact with pesticides. The donors were between 18- and 22-year-old. Lannate were dissolved in sterile distilled water at defined concentrations either as pure substances or in 1:1 mixtures.
The test concentrations are below the limits of solubility for lannate (6). Micronucleus (MN) Test in Human Lymphocytes in vitro: Whole blood (0.5 ml) was added to 6.5 ml Ham’s F-10 medium (Invitrogen), 1.5 ml foetal calf serum (Invitrogen) and 0.3 ml phytohaemagglutinin (Invitrogen) to stimulate cell division. Cultures were incubated at 37 ◦C for 72 h. The appropriate lannate were added 41 h after the start of the culture at final concentrations of 25-2000 µg/ml. Mitomycin-C (Sigma) at a final concentration of 0.5 µg/ml served as positive control. Three hours after the addition of the pesticide, i.e. at 44 h post-culture initiation, 6 µg /ml cytochalasin-B (Sigma) was added. Cells were collected by centrifugation at 72 h, fixed with freshly made methanol/acetic acid mixture (3:1 v/v) after mild hypotonic treatment, and stained with Giemsa (Fluka) (7). At least 1000 binucleate (BN) cells with preserved cytoplasm were scored, for each donor and for each case, in order to calculate the frequency of MN. Standard Criteria were used for scoring MN in at least at 2000 cells. Sister-Chromatid Exchange (SCE) assay in Human Lymphocytes in Vitro: Lymphocyte cultures from one healthy donor were set up as described for the MN assay. At the start of the culture, 5-bromodeoxyridine (5-BrdU) (Sigma) was added at a final concentration of 7.5 µg /ml. The appropriate chemicals were added 48 h after the initiation of the cultures at final concentrations of 25- 2000 µg/ml. Mitomycin-C (Sigma) at a final concentration of 0.1 µg /ml served as positive control. Cultures were incubated in the dark at 37 ◦C for 72 h and demecolcine (Gibco) at a final Concentration of 0.3 µg/ml was added 2 h before harvesting. Chromosome staining was performed according to the fluorescence-plus procedure, with minor modifications. Briefly, air-dried slides were immersed for 15 min in a solution of 0.5 µ g/ml (Sigma) in Sorensen’s buffer, exposed for 30 min to UV radiation, washed and finally stained with Giemsa (Fluka) solution in Sorensen’s buffer, pH 6.8, for 10 min. The frequency of SCE was evaluated in 50 second-division metaphases for each treatment. Calculating the replication index (RI) from 200 metaphases was the criterion for the determination of possible cytotoxic effects. The RI was given by equation: RI =M1 +2M2 +3M3/N, where M1, M2 and M3 denote those

International Journal for Sciences and Technology Vol. 8, No.2, June 2013 19
metaphases corresponding to first, second and third or subsequent divisions, and N is the total number of metaphases scored (8).
Determination Of Free Radicals Through a Lipid Peroxidation Assay: The mice were administered 4mg / kg body wt lannate for 30 days and effectived. Control mice were received distilled water. All the mice were autopsied by cervical dislocation on day 31, 24 hours after the last oral dose. The liver of all mice was dissected out and processed for biochemical. A bioassay is based on the principle of a chromogenic reaction of N-methyl-2-phenylindole (MPI) with malonedialdehyde (MDA) or 4-hydroxyalkenals at 45 °C, which forms a stable chromophore that can be detected by spectrophotometry at a 586 nm absorbance. Initially, blood was removed from the tissue by immersion in a cold isotonic saline solution; then the tissue was weighed and homogenized in 0.02 M phosphate buffer, pH 7.4 (20/30% w/v). To prevent sample oxidation, 10 µL of 0.5 M butylated hydroxytoluene were added per each mL of homogenized tissue. Coarse tissue particles were removed by centrifugation (3,000 g for 10 min at 4 °C). Total protein levels were measured in a sample aliquot by the Bradford method (9), and the samples were immediately frozen at−70 °C until the assay was carried out. A volume of 650 µL of 10.3 nM MPI in a 1:3 mix of acetonitrile and methanol were added to 200 µL of sample in a microcentrifuge tube. The sample was smoothly mixed in a vortex and 150 µL of methanesulfonic acid were added, the mix was incubated at 45 °C for 1 h. Those samples showing sediment were centrifuged (15,000 g for 10 min). The supernatant was obtained and analyzed in a spectrophotometer at 586 nm. Statistical Analysis: The one-way ANOVA test and the Student’s t-test of the Origin 7.0 software were applied to statistically analyze the results obtained with the different study groups. RESULTS
This study was conducted to detect the residual concentration of lannate pesticide in 20grams of bell green pepper by collecting samples after 5hr and 5, 10, 15, 20 days after spraying
bell green peppers with the recommended dose of lannate (1.5ml/L) and its genotoxic activity. Table (1) showed that the concentration of lannate residue in twenty grams of pepper tissue were 9750, 9100, 7450, 6500 and 5700 ppm respectively.
Table (1): lannate residue until 20 days
Days Pesticide residue (ppm)
5 hrs 9750
5 9100
10 7450
15 6500
20 5700
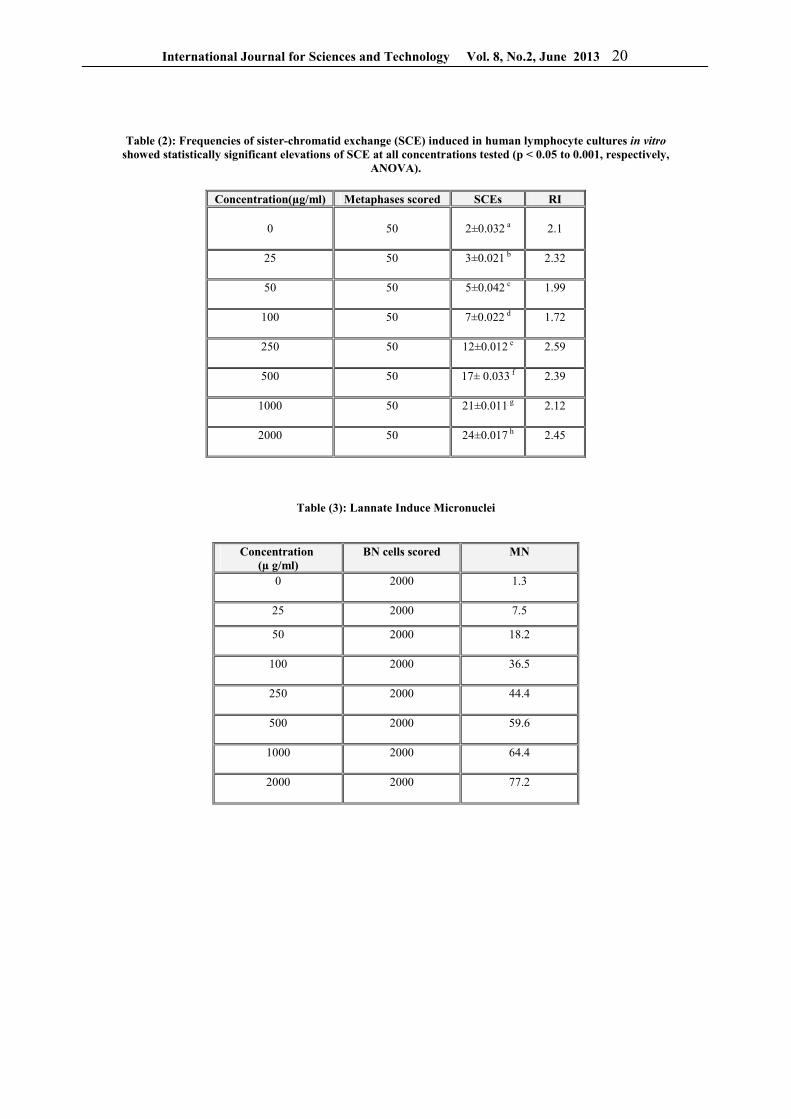
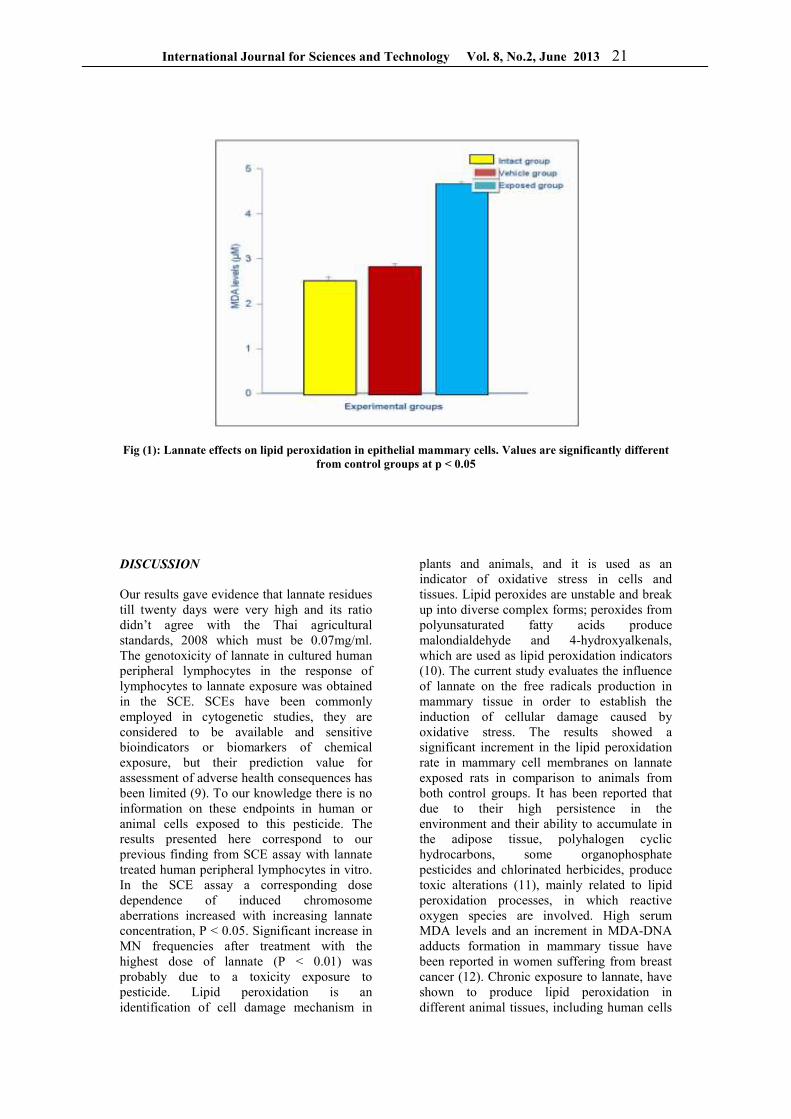
This pesticide was studied for its possible genotoxic effects with respect to the following cytogenetic end-points, in vitro micronucleus (MN) formation and sister-chromatid exchange (SCE). The ability of lannate to induce micronuclei in cytokinesis blocked cells is reflected in table (2). A positive influence in induced MN frequencies was attained at the highest concentration of lannate in compare with the controls. The results obtained from the SCE assays and the lymphocyte proliferation kinetics in table (3). The results of the MN analysis indicate that MN frequencies after treatment with lannate pesticide in concentration between (0-2000) µg/ml, significantly differ from the control and its increase between (1.3- 77.1) with the increasing of lannate concentration. Free radicals were measured by MDA synthesis in the tissue; a statistically significant difference was observed between the measurements of the exposed group and those of the vehicle control group, we found that the highest concentration of MDA was 4.78± 0.043 µm in exposed group in compare with the other groups vehicle and control group. Figure (1).
International Journal for Sciences and Technology Vol. 8, No.2, June 2013 20
Table (2): Frequencies of sister-chromatid exchange (SCE) induced in human lymphocyte cultures in vitro
showed statistically significant elevations of SCE at all concentrations tested (p < 0.05 to 0.001, respectively, ANOVA).
Table (3): Lannate Induce Micronuclei
Concentration(µg/ml) Metaphases scored SCEs RI 0
50
2±0.032 a
2.1
25
50 3±0.021 b 2.32
50
50 5±0.042 c 1.99
100
50 7±0.022 d 1.72
250
50 12±0.012 e 2.59
500
50 17± 0.033 f 2.39
1000
50 21±0.011 g 2.12
2000
50 24±0.017 h 2.45
Concentration (µ g/ml)
BN cells scored MN
0
2000 1.3
25 2000 7.5
50
2000 18.2
100
2000 36.5
250
2000 44.4
500
2000 59.6
1000
2000 64.4
2000
2000 77.2
International Journal for Sciences and Technology Vol. 8, No.2, June 2013 21
Fig (1): Lannate effects on lipid peroxidation in epithelial mammary cells. Values are significantly different
from control groups at p < 0.05
DISCUSSION
Our results gave evidence that lannate residues till twenty days were very high and its ratio didn’t agree with the Thai agricultural standards, 2008 which must be 0.07mg/ml. The genotoxicity of lannate in cultured human peripheral lymphocytes in the response of lymphocytes to lannate exposure was obtained in the SCE. SCEs have been commonly employed in cytogenetic studies, they are considered to be available and sensitive bioindicators or biomarkers of chemical exposure, but their prediction value for assessment of adverse health consequences has been limited (9). To our knowledge there is no information on these endpoints in human or animal cells exposed to this pesticide. The results presented here correspond to our previous finding from SCE assay with lannate treated human peripheral lymphocytes in vitro. In the SCE assay a corresponding dose dependence of induced chromosome aberrations increased with increasing lannate concentration, P < 0.05. Significant increase in MN frequencies after treatment with the highest dose of lannate (P < 0.01) was probably due to a toxicity exposure to pesticide. Lipid peroxidation is an identification of cell damage mechanism in
plants and animals, and it is used as an indicator of oxidative stress in cells and tissues. Lipid peroxides are unstable and break up into diverse complex forms; peroxides from polyunsaturated fatty acids produce malondialdehyde and 4-hydroxyalkenals, which are used as lipid peroxidation indicators (10). The current study evaluates the influence of lannate on the free radicals production in mammary tissue in order to establish the induction of cellular damage caused by oxidative stress. The results showed a significant increment in the lipid peroxidation rate in mammary cell membranes on lannate exposed rats in comparison to animals from both control groups. It has been reported that due to their high persistence in the environment and their ability to accumulate in the adipose tissue, polyhalogen cyclic hydrocarbons, some organophosphate pesticides and chlorinated herbicides, produce toxic alterations (11), mainly related to lipid peroxidation processes, in which reactive oxygen species are involved. High serum MDA levels and an increment in MDA-DNA adducts formation in mammary tissue have been reported in women suffering from breast cancer (12). Chronic exposure to lannate, have shown to produce lipid peroxidation in different animal tissues, including human cells
International Journal for Sciences and Technology Vol. 8, No.2, June 2013 22
(13). In the current work, adult rats chronically exposed to lannate showed a high lipid peroxidation rate in their mammary tissue, reflecting an oxidative stress condition. It is a well known fact that oxidative stress plays a very important role in the carcinogenesis process; also, some facts indicate that reactive oxygen species are involved in cancer early stages and in its progression (14).
REFERENCES
1. Dolara P; Salvadori M; Caboinco T; and Torrical F. (1992) Sister chromatid exchanges in human lymphocytes induced by dimethoate, omethoate, deltamethrin, benomyl and their mixture. Mutat. Res. 283: 113-118. 2. Meister RT. (1991). Farm Chemicals Handbook '91. Meister Publishing Company. Willoughby, Ohio. Pp. 96-98. 3. Baron RL. (1991). Carbamate pesticides, In Handbook of Pesticide Toxicology –Vol 3, Hayes WJ., Laws E.R. (Eds). SanDiego, Calif, Academic Press: New York. Pp. 1125-1190. 4. Crop care Australasia Pty Ltd. Unit 15/16 Metroplex Avenue. Murarrie Qld 4172. Approved: 20 December 2006. p. 6. 5. Kidd H; James DR. (Eds.) (1991). The Agrochemicals Handbook, 3rd ed. Royal Society of Chemistry Information Services. Cambridge: UK. P. 198. 6. Papapaulou D;. Vlastos G; and Stephanou NA. (2001). Linuron cytogenetic activity on human lymphocytes treated in vitro: Evaluation of clastogenic and aneugenic potential using cytokinesisblock micronucleus assay in combination with fluorescence in situ hybridization (FISH). Fresenius Environ. Bull. 10: 431–437. 7. Vlastos D; and Stephanou NA. (1998). Effects of cetirizine dihydrochloride on human lymphocytes in vitro: evaluation of chromosome aberrations and sister chromatid exchanges. Pharmacol. Appl. Skin Physiol. 11: 104– 110. 8. Schmid W. (1973). Chemical mutagen testing on in vivo some mammalian cells. Agents Act. 3:77–85. 9. De Ferrari M; Artuso M.; Bonassi S.; Bonatti S.; Cavalieri Z.; Pescatore D.; Marchini E.; Pisano V.; and Abbondandolo A. (1991). Cytogenetic
biomonitoring of an Italian population exposed to pesticides: Chromosome aberration and sister-chromatid exchange analysis in peripheral blood lymphocytes. Mutat. Res. 260:105-113. 10. Siems WG.; Pimenov AM.; Esterbauer H.; and Grune T. (1998). Metabolism of 4-hydroxynonenal, a cytotoxic lipid peroxidation product, in thymocytes as an effective secondary antioxidative defense mechanism. J. Biochem. 123: 534-539. 11. Esterbauer H; Schaur RJ; and Zollner H. (1991). Chemistry and biochemistry of 4-hydroxynonenal, malonaldehyde and related aldehydes. Free Radic. Biol. Med. 11:81-128. 12. Nath RG; Ocando JE; and Chung FL. (1996). Detection of 1, N2- propanodeoxyguanosine adducts as potential endogenous DNA lesions in rodent and human tissues. Cancer Res.56:452-456. 13. Perez-Maldonado IN; Herrera C; Batres LE; Gonzalez-Amaro R; Diaz-Barriga F; and Yanez L. (2005). DDT-induced oxidative damage in human blood mononuclear cells. Environ. Res. 98:177-184. 14. Olinski R; and Jurgowiak M. (1999). The role of reactive oxygen species in mutagenesis and carcinogenesis processes. Postepy. Biochem. 45:50-58.
International Journal for Sciences and Technology Vol. 8, No.2, June 2013 23
Extraction and purification of protease inhibitor from seeds of some plants and
its antimicrobial activity
Sahar I.H. Al- Assadi Dept. of Biotechnology / College of Sciences /Baghdad University / Iraq
E –mail: [email protected]
ABSTRACT
The current study aimed to extraction and purification of the protease inhibitor and its antimicrobial activity. The protease inhibitor was extracted from Lathyrus sativus and it's inhibited the trypsin enzyme with maximum percent of inhibition (89.6%), the crude extract prepared in 0.1M potassium phosphate buffer, pH 7 with showed maximum inhibitor activity (98%). The optimum extraction ratio efficiency was founded when the extraction ratio 1:7.5 (w:v) after 1h the maximum inhibitor activity obtained was (96%). The antimicrobial activity of protease inhibitor was estimated against seven bacterial & fungal strains, the maximum inhibition zone estimated 28 mm against Kluyveromyces
marixians. Protease inhibitor, isolated from Lathyrus sativus was purified by purification techniques, included ammonium sulphate percipitation 60%, followed by Ion exchange chromatography using DEAE–Cellulose column. The enzyme was purified to 2.5 times in the last step with an enzyme yield of 53.4%.
الملخص باللغة العربية
إنزيم ضد الميكروبي ، حيث استخلص مثبط تأثيرهتييز وتنقيته ودراسة و البرإنزيم استخالص مثبط إلى الحاليةهدفت الدراسة
لص المثبط باستخدام المحلول الدارئ ، استخ89.6% التربسين بفعالية تثبيطية تقدر إنزيم ثبط الذيالبروتييز من نبات الهرطمان ، قدرت نسبة المحلول %98 التربسين إلنزيم التثبيطية، حيث كانت الفعالية pH( 7( مولر و0.1لفوسفات البوتاسيوم بتركيز
بعد ساعة واحدة من االستخالص ، حيث بلغت قيمة الفعالية ) ح: و (7.5: 1الدارئ المثلى المستخدم الستخلص المثبط بـ لخميرة ملم28 طالتثبي بلغ قطر منطقة إذا، لمثبط البروتييزميكروبية ، كما قدرت الفعالية الضد %96 لإلنزيملتثبيطية ا
Kluyveromyces marixians. 60 إشباعمونيوم بنسبة األ التركيز بكبريتات باستخدام : المثبط البروتييزي بخطوتينتم تنقية % 2.5 األخيرة ، حيث بلغت عدد مرات التنقية للخطوة DEAE–Cellulose باستخدام عمود ياأليونرافيا التبادل غوكروماتو %.53.4 بلغت إنزيميةبحصيلة
International Journal for Sciences and Technology Vol. 8, No.2, June 2013 24
INTRODUCTION
Protease inhibitors are proteins or peptides capable of inhibiting catalytic activities of proteolytic enzymes and are widely distributed in many plant materials used as food, especially in legumes, potato, and cereals (1). The protease inhibitors have been thought to play a vital role in the arsenal of defense mechanisms that plants use to protect against environment hazards during germination and seed growth. Pest and pathogens are major constraints to plant growth and development, resulting in heavy losses in crop yield and quality (2). Plants are important sources of proteases and protease inhibitors. Possibly ten protease inhibitor families have been recognized in plants and mostly they are located in seeds and leaves (3). Plant protease inhibitors differ in specificities and in their ability to inhibit one or more proteases at the same time. Majority of them inhibit trypsin and many inhibit chymotrypsin. Inhibitors of elastase, kallikrein, plasmin, subtilisin and thrombin have also been found (4), legume seeds can be isolated as a source of protease inhibitor and are used in a variety of applications, such as medicine, agriculture and food technology (5). Plants produce compounds that act as natural defenses against pests and pathogens. Anti-microbial peptides provide the first line of defense against invading microbes in both plants and animals. Peptides ranging from 15 to 40 amino acids in length, most of which are hydrophobic and cationic, are generally involved in innate immunity. Such peptides provide protection against bacteria, fungi and viruses by acting on the cell membranes of the pathogens (6,7). Protease inhibitors have recently received improved interest because of their ability to potently inhibit carcinogenesis in a wide variety of in vivo and in vitro
systems (8). This phenomenon was first recorded in tomatoes infected with Phytophthora infestans, in which increased levels of trypsin and chymotrypsin inhibitors were found to be correlated with the plants resistance to the pathogen (9).The current study aimed to evaluate the protease inhibitor purification and application as antimicrobial activity against pathogenic microbes.
MATERIALS AND METHODS
Screening of plants for protease inhibitor 1. Plants seeds: Plant seeds, which are locally available in market, include Lathyrus sativus , and Vigna
radiate. Beans and Soybean were used as the source of material to screen for protease inhibitor activity. 2. Extraction and recovery of protease inhibitor: Plant seeds for the study were milled by mill electrical device, a seed extract was prepared by homogenizing 1 g of each plant seed in 7.5 ml of 0.1M phosphate buffer with pH 7.0 by the mortar. The mixing was done at room temperature for 30 minutes. The slurry was centrifuged at 10,000 rpm for 15 minutes at 4°C for removing any cell debris that remains in the preparation (10). The clear supernatant obtained represented the crude extract, and was assayed for protease inhibitor activity. 3. Protease assay & Protein concentration: The activities of the protease enzyme (Trypsin, Pepsin and Papain) were estimated according to the method described by (11) ,which depends on the decomposition soluble casein (1% of solution was prepared in 0.1 M sodium phosphate buffer, pH 7) to peptides and amino acids constituent by the enzyme. Enzymatic activity unit known as the amount of enzyme required to increase the absorbance by 0.01 per minute under standard conditions. The method of estimating protein was determined according to (12), depending on the standard curve of bovine serum albumin and using of coomassei blue G-250 at 595. 4. Remaining enzymes activity: A crude extract of each seed plant was incubated separately with a known volume of protease enzymes (trypsin, pepsin and papain) by 1:1 ratio for 30 mins, there after the protease activity of each enzyme was estimated. The remaining activity is the percent inhibitory activity of the enzyme with respect to the percent enzyme activity without inhibitor, as shown in the following equation:
International Journal for Sciences and Technology Vol. 8, No.2, June 2013 25
Determination of optimum condition for extraction the protease inhibitor 1. Buffer Extraction: Different types of buffers were selected for extraction of the protease inhibitors included, sodium acetate buffer pH (5,6) , potassium phosphate buffer pH (7,8) , tris base buffer pH ( 9) at concentration of 0.1 and 0.2 M separately. 2. Extraction ratio and optimum period for extraction: Different ratios of potassium phosphate buffer were selected to extract inhibitor included 1:5, 1:7.5, 1:10 and 1:12.5 (w:v) with a different period included a 30 min and 1hr separately. Determination the antimicrobial activity of the protease inhibitor against the local pathogenic isolate The antimicrobial activity of protease inhibitor against (E.coli, Staphyllocoocus aureus,
Pseudomonas aeroginosa, Candida albicans,
Candida tropicalis, Kluyveromyces marixians,
Aspergillus niger) isolates were determined according to the using agar diffusion method described by (13). Purification of Enzyme Inhibitor Protease inhibitor, isolated from Lathyrus
sativus was purified by protein purification technique, included ammonium sulphate precipitation, followed by Ion exchange chromatography. 1. Ammonium sulfate concentration: The concentration step of protease inhibitor was accomplished by addition of various concentrations ratios from ammonium sulfate to the crude extract included (30, 60 and 90) % separately, to getting better saturation ratio in precipetation and concentration of the enzyme inhibitor product from Lathyrus sativus.
2. Ion exchange chromatography: Ion exchanger diethyl amino ethyl cellulose (DEAD-Cellulose) was prepared according to Whitaker (14) by addition 8 ml of concentrated extract produced from ammonium sulfate precipitation step by saturation 60% to ion exchanger column with dimensions of 3.5 x18 cm. Then the column was washed by 0.02M phosphate buffer, pH 7.6 with flow rate (30 ml / h). The fractions from column were collected with 3 ml / fraction. The elution was done by using 0.02M phosphate buffer, pH 7.6 with a linear gradual of sodium chloride between 0.1-1 M with fast flow (30 ml / h). The product solution was collected with 3ml / fraction and the absorbance was measured at 280 nm. The active parts were collected, and the protease inhibitor activity estimated as well as protein concentration and size. RESULTS AND DISCUSSION
Screening of plants for protease inhibitor: Results presented in (Table 1) showed that the Lathyrus sativus have maximum percent of inhibition (89.8%) against trypsin, followed by Bean (89.2%), Soybean (87.6%) and Vigna
radiate (83.3%). The Lathyrus sativus seed had the large quantities of trypsin inhibitors. The most frequently occurring antinutritional substances in Lathyrus sativus are protease and amylase inhibitors, lectins, tannins, saponines (15).
Enzyme activity with protease inhibitor Remaining Enzymes Activity = X 100
Enzyme activity without protease inhibitor
International Journal for Sciences and Technology Vol. 8, No.2, June 2013 26
Table (1): Screening of plants for protease inhibitor
Inhibitor activity %
Enzyme Activity with Inhibitor
(U/ml)
Enzyme Activity without Inhibitor (U/ml)
Enzyme Plant Source
0 61
89.8
2.8 1.1 1.65
1.4 2.8 16.1
Papain Pepsin Trypsin
Lathyrus
sativus
0 36
89.2
4.35 1.8 1.75
1.4 2.8 16.1
Papain Pepsin Trypsin
Bean
0 54
87.6
2.25 1.3 2
1.4 2.8 16.1
Papain Pepsin Trypsin
Soybean
0 30.4 83.3
5.9 1.95 2.7
1.4 2.8 16.1
Papain Pepsin Trypsin
Vigna radiate
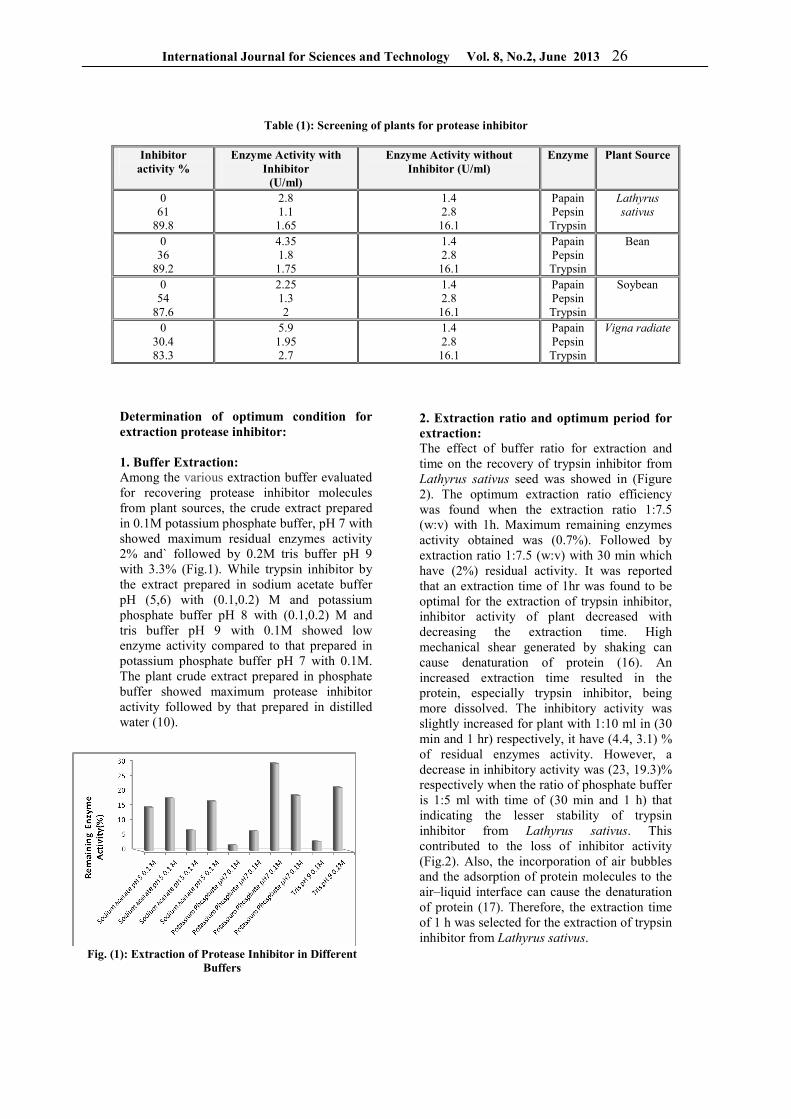
Determination of optimum condition for extraction protease inhibitor: 1. Buffer Extraction: Among the various extraction buffer evaluated for recovering protease inhibitor molecules from plant sources, the crude extract prepared in 0.1M potassium phosphate buffer, pH 7 with showed maximum residual enzymes activity 2% and` followed by 0.2M tris buffer pH 9 with 3.3% (Fig.1). While trypsin inhibitor by the extract prepared in sodium acetate buffer pH (5,6) with (0.1,0.2) M and potassium phosphate buffer pH 8 with (0.1,0.2) M and tris buffer pH 9 with 0.1M showed low enzyme activity compared to that prepared in potassium phosphate buffer pH 7 with 0.1M. The plant crude extract prepared in phosphate buffer showed maximum protease inhibitor activity followed by that prepared in distilled water (10).
Fig. (1): Extraction of Protease Inhibitor in Different Buffers
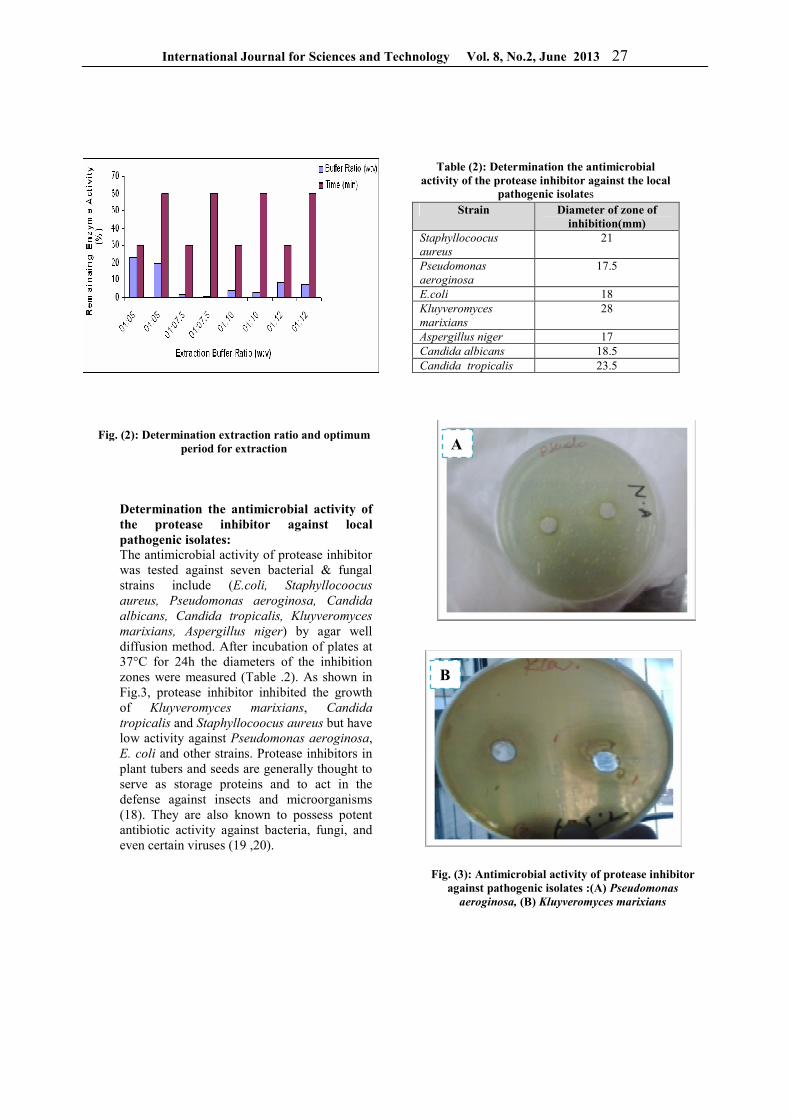
2. Extraction ratio and optimum period for extraction: The effect of buffer ratio for extraction and time on the recovery of trypsin inhibitor from Lathyrus sativus seed was showed in (Figure 2). The optimum extraction ratio efficiency was found when the extraction ratio 1:7.5 (w:v) with 1h. Maximum remaining enzymes activity obtained was (0.7%). Followed by extraction ratio 1:7.5 (w:v) with 30 min which have (2%) residual activity. It was reported that an extraction time of 1hr was found to be optimal for the extraction of trypsin inhibitor, inhibitor activity of plant decreased with decreasing the extraction time. High mechanical shear generated by shaking can cause denaturation of protein (16). An increased extraction time resulted in the protein, especially trypsin inhibitor, being more dissolved. The inhibitory activity was slightly increased for plant with 1:10 ml in (30 min and 1 hr) respectively, it have (4.4, 3.1) % of residual enzymes activity. However, a decrease in inhibitory activity was (23, 19.3)% respectively when the ratio of phosphate buffer is 1:5 ml with time of (30 min and 1 h) that indicating the lesser stability of trypsin inhibitor from Lathyrus sativus. This contributed to the loss of inhibitor activity (Fig.2). Also, the incorporation of air bubbles and the adsorption of protein molecules to the air–liquid interface can cause the denaturation of protein (17). Therefore, the extraction time of 1 h was selected for the extraction of trypsin inhibitor from Lathyrus sativus.
International Journal for Sciences and Technology Vol. 8, No.2, June 2013 27
Fig. (2): Determination extraction ratio and optimum period for extraction
Determination the antimicrobial activity of the protease inhibitor against local pathogenic isolates: The antimicrobial activity of protease inhibitor was tested against seven bacterial & fungal strains include (E.coli, Staphyllocoocus
aureus, Pseudomonas aeroginosa, Candida
albicans, Candida tropicalis, Kluyveromyces
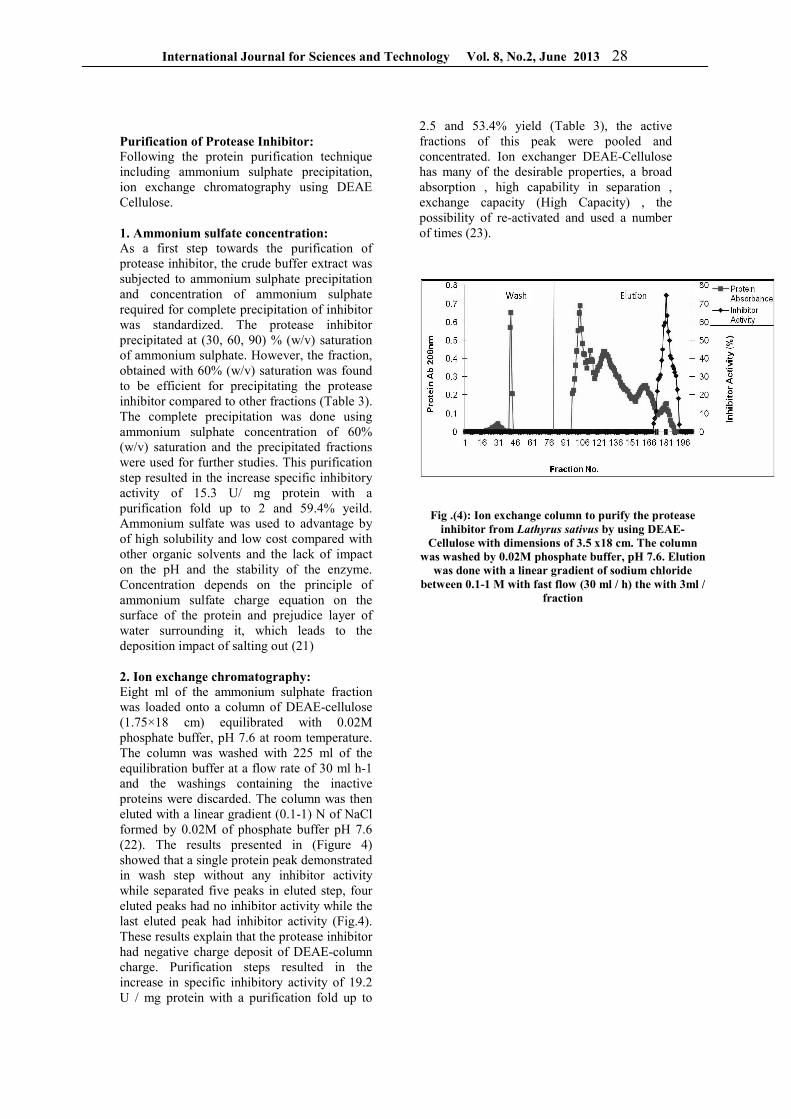
marixians, Aspergillus niger) by agar well diffusion method. After incubation of plates at 37°C for 24h the diameters of the inhibition zones were measured (Table .2). As shown in Fig.3, protease inhibitor inhibited the growth of Kluyveromyces marixians, Candida
tropicalis and Staphyllocoocus aureus but have low activity against Pseudomonas aeroginosa, E. coli and other strains. Protease inhibitors in plant tubers and seeds are generally thought to serve as storage proteins and to act in the defense against insects and microorganisms (18). They are also known to possess potent antibiotic activity against bacteria, fungi, and even certain viruses (19 ,20).
Table (2): Determination the antimicrobial activity of the protease inhibitor against the local
pathogenic isolates
Fig. (3): Antimicrobial activity of protease inhibitor
against pathogenic isolates :(A) Pseudomonas aeroginosa, (B) Kluyveromyces marixians
Strain Diameter of zone of inhibition(mm)
Staphyllocoocus
aureus 21
Pseudomonas
aeroginosa 17.5
E.coli 18 Kluyveromyces
marixians 28
Aspergillus niger 17 Candida albicans 18.5 Candida tropicalis 23.5
A
B
International Journal for Sciences and Technology Vol. 8, No.2, June 2013 28
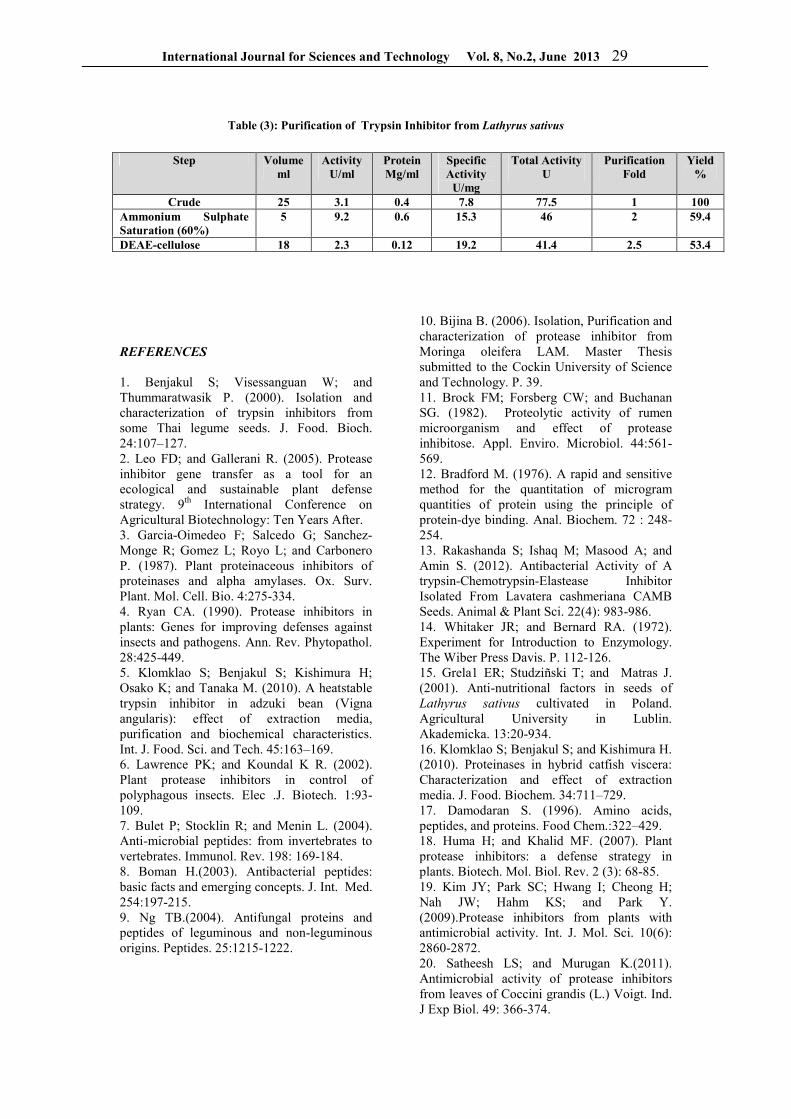
Purification of Protease Inhibitor: Following the protein purification technique including ammonium sulphate precipitation, ion exchange chromatography using DEAE Cellulose. 1. Ammonium sulfate concentration: As a first step towards the purification of protease inhibitor, the crude buffer extract was subjected to ammonium sulphate precipitation and concentration of ammonium sulphate required for complete precipitation of inhibitor was standardized. The protease inhibitor precipitated at (30, 60, 90) % (w/v) saturation of ammonium sulphate. However, the fraction, obtained with 60% (w/v) saturation was found to be efficient for precipitating the protease inhibitor compared to other fractions (Table 3). The complete precipitation was done using ammonium sulphate concentration of 60% (w/v) saturation and the precipitated fractions were used for further studies. This purification step resulted in the increase specific inhibitory activity of 15.3 U/ mg protein with a purification fold up to 2 and 59.4% yeild. Ammonium sulfate was used to advantage by of high solubility and low cost compared with other organic solvents and the lack of impact on the pH and the stability of the enzyme. Concentration depends on the principle of ammonium sulfate charge equation on the surface of the protein and prejudice layer of water surrounding it, which leads to the deposition impact of salting out (21) 2. Ion exchange chromatography: Eight ml of the ammonium sulphate fraction was loaded onto a column of DEAE-cellulose (1.75×18 cm) equilibrated with 0.02Μ phosphate buffer, pH 7.6 at room temperature. The column was washed with 225 ml of the equilibration buffer at a flow rate of 30 ml h-1 and the washings containing the inactive proteins were discarded. The column was then eluted with a linear gradient (0.1-1) N of NaCl formed by 0.02M of phosphate buffer pH 7.6 (22). The results presented in (Figure 4) showed that a single protein peak demonstrated in wash step without any inhibitor activity while separated five peaks in eluted step, four eluted peaks had no inhibitor activity while the last eluted peak had inhibitor activity (Fig.4). These results explain that the protease inhibitor had negative charge deposit of DEAE-column charge. Purification steps resulted in the increase in specific inhibitory activity of 19.2 U / mg protein with a purification fold up to
2.5 and 53.4% yield (Table 3), the active fractions of this peak were pooled and concentrated. Ion exchanger DEAE-Cellulose has many of the desirable properties, a broad absorption , high capability in separation , exchange capacity (High Capacity) , the possibility of re-activated and used a number of times (23).
Fig .(4): Ion exchange column to purify the protease inhibitor from Lathyrus sativus by using DEAE-
Cellulose with dimensions of 3.5 x18 cm. The column was washed by 0.02M phosphate buffer, pH 7.6. Elution
was done with a linear gradient of sodium chloride between 0.1-1 M with fast flow (30 ml / h) the with 3ml /
fraction
International Journal for Sciences and Technology Vol. 8, No.2, June 2013 29
Table (3): Purification of Trypsin Inhibitor from Lathyrus sativus
REFERENCES
1. Benjakul S; Visessanguan W; and Thummaratwasik P. (2000). Isolation and characterization of trypsin inhibitors from some Thai legume seeds. J. Food. Bioch. 24:107–127. 2. Leo FD; and Gallerani R. (2005). Protease inhibitor gene transfer as a tool for an ecological and sustainable plant defense strategy. 9th International Conference on Agricultural Biotechnology: Ten Years After. 3. Garcia-Oimedeo F; Salcedo G; Sanchez-Monge R; Gomez L; Royo L; and Carbonero P. (1987). Plant proteinaceous inhibitors of proteinases and alpha amylases. Ox. Surv. Plant. Mol. Cell. Bio. 4:275-334. 4. Ryan CA. (1990). Protease inhibitors in plants: Genes for improving defenses against insects and pathogens. Ann. Rev. Phytopathol. 28:425-449. 5. Klomklao S; Benjakul S; Kishimura H; Osako K; and Tanaka M. (2010). A heatstable trypsin inhibitor in adzuki bean (Vigna angularis): effect of extraction media, purification and biochemical characteristics. Int. J. Food. Sci. and Tech. 45:163–169. 6. Lawrence PK; and Koundal K R. (2002). Plant protease inhibitors in control of polyphagous insects. Elec .J. Biotech. 1:93-109. 7. Bulet P; Stocklin R; and Menin L. (2004). Anti-microbial peptides: from invertebrates to vertebrates. Immunol. Rev. 198: 169-184. 8. Boman H.(2003). Antibacterial peptides: basic facts and emerging concepts. J. Int. Med. 254:197-215. 9. Ng TB.(2004). Antifungal proteins and peptides of leguminous and non-leguminous origins. Peptides. 25:1215-1222.
10. Bijina B. (2006). Isolation, Purification and characterization of protease inhibitor from Moringa oleifera LAM. Master Thesis submitted to the Cockin University of Science and Technology. P. 39. 11. Brock FM; Forsberg CW; and Buchanan SG. (1982). Proteolytic activity of rumen microorganism and effect of protease inhibitose. Appl. Enviro. Microbiol. 44:561-569. 12. Bradford M. (1976). A rapid and sensitive method for the quantitation of microgram quantities of protein using the principle of protein-dye binding. Anal. Biochem. 72 : 248-254. 13. Rakashanda S; Ishaq M; Masood A; and Amin S. (2012). Antibacterial Activity of A trypsin-Chemotrypsin-Elastease Inhibitor Isolated From Lavatera cashmeriana CAMB Seeds. Animal & Plant Sci. 22(4): 983-986. 14. Whitaker JR; and Bernard RA. (1972). Experiment for Introduction to Enzymology. The Wiber Press Davis. P. 112-126. 15. Grela1 ER; Studziñski T; and Matras J. (2001). Anti-nutritional factors in seeds of Lathyrus sativus cultivated in Poland. Agricultural University in Lublin. Akademicka. 13:20-934. 16. Klomklao S; Benjakul S; and Kishimura H. (2010). Proteinases in hybrid catfish viscera: Characterization and effect of extraction media. J. Food. Biochem. 34:711–729. 17. Damodaran S. (1996). Amino acids, peptides, and proteins. Food Chem.:322–429. 18. Huma H; and Khalid MF. (2007). Plant protease inhibitors: a defense strategy in plants. Biotech. Mol. Biol. Rev. 2 (3): 68-85. 19. Kim JY; Park SC; Hwang I; Cheong H; Nah JW; Hahm KS; and Park Y. (2009).Protease inhibitors from plants with antimicrobial activity. Int. J. Mol. Sci. 10(6): 2860-2872. 20. Satheesh LS; and Murugan K.(2011). Antimicrobial activity of protease inhibitors from leaves of Coccini grandis (L.) Voigt. Ind. J Exp Biol. 49: 366-374.
Step Volume ml
Activity U/ml
Protein Mg/ml
Specific Activity
U/mg
Total Activity U
Purification Fold
Yield %
Crude 25 3.1 0.4 7.8 77.5 1 100 Ammonium Sulphate Saturation (60%)
5 9.2 0.6 15.3 46 2 59.4
DEAE-cellulose 18 2.3 0.12 19.2 41.4 2.5 53.4

International Journal for Sciences and Technology Vol. 8, No.2, June 2013 30
21. White A; Handler P; and Smith; E. (1973). Principle of Biochemestry. McGrow- Hill book Company. Ablakiston publication. New York: P. 33. 22. Kansal R; Kumar M; Kuhar K; Gupta RN; Subrahmanyam B; Koundal KR; and Gupta VK. (2008). Purification and characterization of trypsin inhibitor from Cicer arietnum L. and its efficacy against Helecovera armigera. Braz. J. Plan. Phys. 6(2): 88-92. 23. Karlsson E; Ryden L; and Brewer; J. (1998). Ion exchange chromatography. John Wiley and Sons, Inc. Pub. P. 201-210.
International Journal for Sciences and Technology Vol. 8, No.2, June 2013 31
Inhibitory Effect of Camel Urine on Neoplastic and Transformed Cell Lines
Mohammed M. F. Al-Halbosiy (1), Rakad M. Kh. Al- Jumaily (2), Fadhel M. Lafta (2) and Hussam M. Hassan (2).
(1)Biotechnology Research Centre / Al- Nahrain University- Baghdad (2) Dept. of Biology/ College of
Sciences / Baghdad University/ Iraq
ABSTRACT
The cytotoxic effect of different concentrations of camel urine on two types of cell lines (RD, L20B) for different exposure time (24 , 48 and 72 hrs) was examined. Cytotoxicity assay of this study demonstrated that camel urine caused inhibitory effect on the growth of RD cell lines at high concentration (250, 500 µg/ml) for all exposure time. While the inhibitory activity was gradually reduced with decreasing of concentration. Moreover, Camel urine showed less inhibitory effect on transformed cell (L20B), compared with their effect on cancer cell line, indicating of the safety camel urine toward non malignant cells.
الملخص باللغة العربية
ضـمن )L20B , RD( تم اختبار التأثير السمي لتراكيز مختلفة من بول االبل في نوعين من الخطوط الخلوية اظهرت النتائج االحصائية التي تم الحصول عليها التأثير السمي لبول االبل علـى . ساعة) 72 ، 48 ، 24(اوقات تعريضية مختلفة
والوقات التعريض جميعها ، في حين قل التـاثير ) مل/ مايكروغرام 500 ، 250( النامية عند التراكيز العالية RDط خاليا خطو ، ممـا (L20B)التثبيطي تدريجيا مع انخفاض التركيز المستعمل ، بينما سجل اثر تثبيطي اقل لبول االبل على الخاليـا المتحولـة
.االبل على الخاليا غير الخبيثةيؤشر التأثير غير الضار لبول
International Journal for Sciences and Technology Vol. 8, No.2, June 2013 32
INTRODUCTION
Cancer is a disease where damaged cells of the patient's body do not undergo programmed cell death, but their growth is no longer controlled and their metabolism is altered (1). Next to ischemic heart disease cancer is a major cause of death in most developed countries (1, 2). Management of cancer is one of the challenging problems in medical practice as there are no available medical modalities that can selectively kill cancer cell without adverse effect on normal living cell or the functions of vital organs (3). Conventional therapies had limited benefits as treatment of cancer due to the resistance, toxicities relapse problems, therefore researches are necessary to find alternative effective, safe and in expressive therapies (4). Natural products play an important role in our healthcare system (5). They offer a valuable source of potent compounds with wide variety of biological activities and novel structures and provide important leads for the development of novel drugs (6 , 7). Camel urine is used in folklore medicine to treat cancer. The Bedouin in the Arab desert give camel urine to patients who where suffering from cancer (8). Camel urine can be classified as environmentally friendly inhibitor, because drinking of camel urine for the therapeutic purpose was indicated since 14 century (9). It has been shown throughout the history of medical science till today that urine has a profound medical uses (10), such as effectiveness against all ergies, psoriasis and all skin problems. Also (11) reported the effect of urine on fertility, fever, burns and tuberculosis. Microbiological studies (12, 13) on camel urine proved its high efficiency against a number of pathogenic microbes when compared with some antibiotics. The camel urine has also been qualified as anti-inflammatory antioxidant and anti-tumor (14, 15). The best approach to evaluate the effect of a new material is in vitro by utilizing the growing mammalian cells at tissue culture level and not on the living organism (16 , 17). For this purpose, this study was designed to evaluate the anticancer effects of the camel urine on cancer cell lines in vitro, through different exposure time and different concentration of camel urine.
MATERIALS AND METHODS
Urine samples: Urine of camel samples was collected from young male camels (one humped) in the morning before provender breakfast (foodstuff and desert plants). The samples were collected in sterile screw bottles kept in cool boxes until transported to the laboratory. Physically, the fresh extracted urine appears clear amber yellow and watery. The different concentrations of camel urine were prepared and kept at (4 ˚C) until being used.
Cell line preparation for cytotoxicity study: The cell lines, rhabdomysarcom (RD) and murine L cells (fibroblast) expressing (L20B), that used in this study were supplied by tissue culture unit biotechnology research center / Al-Nahrin University, and maintained in RPMI-1640. when the cells in flask form a confluent monolayer, the following protocols were performed (18). The growth medium was decanted off and the cell sheet washed twice with PBS. Two to three ml of sterile trypsin-versene were added to the cells sheet and the flask rocked gently. After approximately 30 seconds most of the trypsin was poured off and the cells incubated at 37˚C until they had detached from the flask. Cells were further dispensed by pipetting in growth medium. Afterwards, 200 µl of cells in growth medium were added to each well of a sterile 96-well micro titration plate. The plates were sealed with a self – adhensive film, lid placed on and incubated at 37˚C. When the cells are in exponential growth at near confluence mostly after 24hrs, the medium was removed and serial dilutions of camel urine (7.81 , 15.62 , 31.25 , 62.5 , 125 , 250 and 500 µg/ml) were added to the wells. Three replicates were used for each concentration, then, the plates were re-incubated at 37˚Cfor the selected exposure times (24 , 48 and 72 hrs). Cytotoxicity assay:
After the end of the exposure period, the medium decanted off and cells in the wells gently washed by adding and removing 0.1 ml sterile PBS two times. Finally 0.1 ml of maintenance medium added in each well and incubated for further 24 hrs. At the end of recovery time, the maintenance medium, threw away, and replaced by 50 µl of 0.01 % crystal violet dye.
International Journal for Sciences and Technology Vol. 8, No.2, June 2013 33
After 20 mins., the stain was washed gently with tap water for three times. The plate was left until become dry.
The optical density of each well was read by using a micro-ELISA reader at 492 nm transmitting wave length (18). The percentage of inhibition was calculated according to the following equation (19). Inhibition % =[(optical density of control wells – optical density of test wells) / optical density of control wells] x 100.
Statistical analysis: Experimental data for cytotoxicity assays were analyzed using statistical software SPSS 10.0 for windows. Significance between control and samples was determined using student's t-test. P value ≤ 0.05 was considered statistically significant. RESULTS
Cytotoxic effect of different concentrations of camel urine on two types of cell lines (RD and L20B) for different exposure time (24 , 48 and 72 hrs.) was examined. The results in figure (1) showed significant effect (P<0.05) at the concentration, (250 and 500 µg/ml) during 24 , 48 and 72 hours of exposures.
0
0.05
0.1
0.15
0.2
0.25
Mean
of
cell
lin
e d
en
sit
y
7.81 15.6 31.3 62.5 125 250 500
concentration in µg / ml
24
48
72
Fig.(1): Effect of different concentration of camel
urine on RD cell line during different exposure period (P<0.05).
Also there is significant effect (P<0.05) for the concentration (125 µg / ml), at 24 and 48 hrs), and 62.5 µg / ml at 72 hrs., where the other concentrations showed non-significant effect during all the periods of exposures.
The effect of camel urine on L20B cell line was demonstrated in figure (2), most concentrations of camel urine had no significant effects on the growth of L20B cell line (P<0.05). Only the treatment with concentration (250 µg / ml at 72 hrs) caused significant effect (P<0.05) in cell growth.
0
0.05
0.1
0.15
0.2
0.25
Mean
of
cell lin
e
den
sit
y
7.81 15.6 31.3 62.5 125 250 500
concentration in µg / ml
24
48
72
Fig.(2): Effect of different concentration of camel urine on L20B cell line during different exposure periods (P<0.05). The results in table (1) showed that the best exposure period was 72 hrs. than the other periods (24 and 48 hrs.). The growth inhibition percentage for camel urine on RD cell line at 500 µg / ml concentrations was 67.36% , 73% and 78.02 % after 24, 48 and 72 hours respectively. The results also showed the growth inhibition percentage for camel urine on L20B cell line, by the same concentration was 14.28% , 28.48% and 25.32% after 24, 48 and 72 hours respectively. In the other hand, the growth inhibition percentages for the camel urine on RD cell line at 250 µg / ml concentration was 61.98%, 67.62% and 74.81% after 24,48 and 72 hours respectively, while the growth inhibition percentage for camel urine on L20B cell line at the same concentration was 15.58% , 28.24% and 24.68% after 24 , 48 and 72 hours respectively. The results in table (1) revealed that RD cell line was more sensitive to the camel urine after period of exposure.
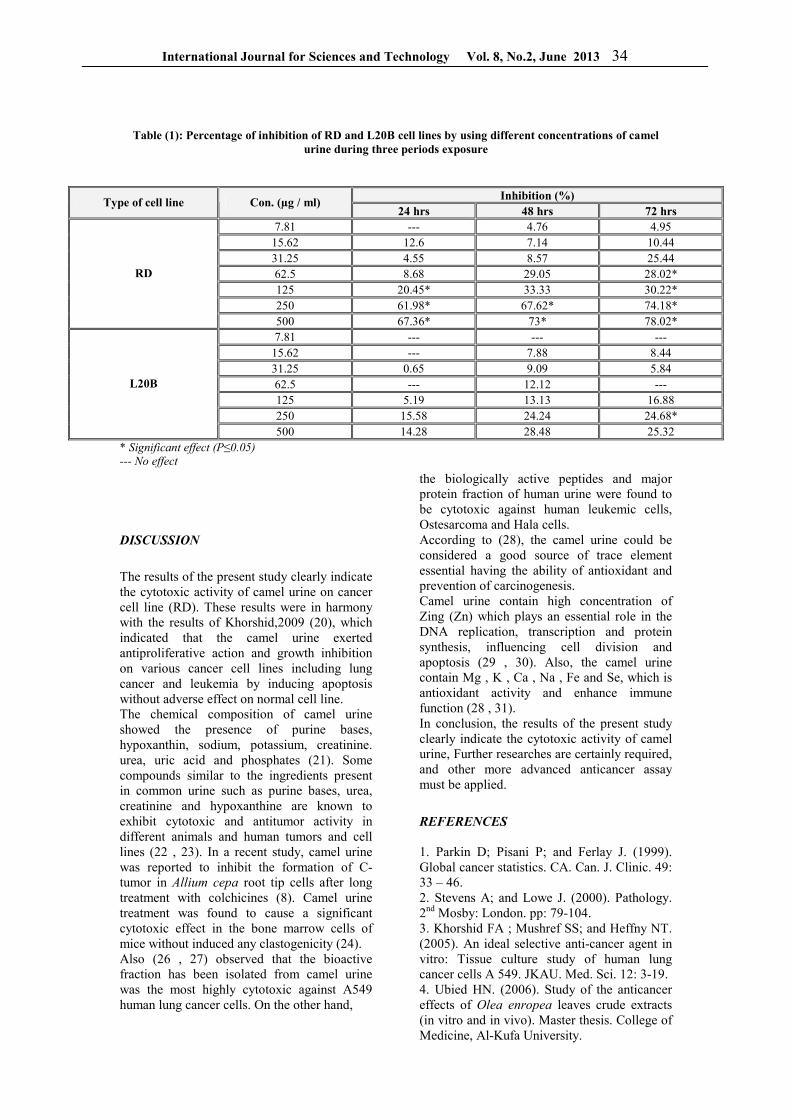
International Journal for Sciences and Technology Vol. 8, No.2, June 2013 34
Table (1): Percentage of inhibition of RD and L20B cell lines by using different concentrations of camel urine during three periods exposure
Inhibition (%) Type of cell line Con. (µg / ml)
24 hrs 48 hrs 72 hrs 7.81 --- 4.76 4.95
15.62 12.6 7.14 10.44 31.25 4.55 8.57 25.44 62.5 8.68 29.05 28.02* 125 20.45* 33.33 30.22* 250 61.98* 67.62* 74.18*
RD
500 67.36* 73* 78.02* 7.81 --- --- ---
15.62 --- 7.88 8.44 31.25 0.65 9.09 5.84 62.5 --- 12.12 --- 125 5.19 13.13 16.88 250 15.58 24.24 24.68*
L20B
500 14.28 28.48 25.32 * Significant effect (P≤0.05)
--- No effect DISCUSSION
The results of the present study clearly indicate the cytotoxic activity of camel urine on cancer cell line (RD). These results were in harmony with the results of Khorshid,2009 (20), which indicated that the camel urine exerted antiproliferative action and growth inhibition on various cancer cell lines including lung cancer and leukemia by inducing apoptosis without adverse effect on normal cell line. The chemical composition of camel urine showed the presence of purine bases, hypoxanthin, sodium, potassium, creatinine. urea, uric acid and phosphates (21). Some compounds similar to the ingredients present in common urine such as purine bases, urea, creatinine and hypoxanthine are known to exhibit cytotoxic and antitumor activity in different animals and human tumors and cell lines (22 , 23). In a recent study, camel urine was reported to inhibit the formation of C-tumor in Allium cepa root tip cells after long treatment with colchicines (8). Camel urine treatment was found to cause a significant cytotoxic effect in the bone marrow cells of mice without induced any clastogenicity (24). Also (26 , 27) observed that the bioactive fraction has been isolated from camel urine was the most highly cytotoxic against A549 human lung cancer cells. On the other hand,
the biologically active peptides and major protein fraction of human urine were found to be cytotoxic against human leukemic cells, Ostesarcoma and Hala cells. According to (28), the camel urine could be considered a good source of trace element essential having the ability of antioxidant and prevention of carcinogenesis. Camel urine contain high concentration of Zing (Zn) which plays an essential role in the DNA replication, transcription and protein synthesis, influencing cell division and apoptosis (29 , 30). Also, the camel urine contain Mg , K , Ca , Na , Fe and Se, which is antioxidant activity and enhance immune function (28 , 31). In conclusion, the results of the present study clearly indicate the cytotoxic activity of camel urine, Further researches are certainly required, and other more advanced anticancer assay must be applied.
REFERENCES
1. Parkin D; Pisani P; and Ferlay J. (1999). Global cancer statistics. CA. Can. J. Clinic. 49: 33 – 46. 2. Stevens A; and Lowe J. (2000). Pathology. 2nd Mosby: London. pp: 79-104. 3. Khorshid FA ; Mushref SS; and Heffny NT. (2005). An ideal selective anti-cancer agent in vitro: Tissue culture study of human lung cancer cells A 549. JKAU. Med. Sci. 12: 3-19. 4. Ubied HN. (2006). Study of the anticancer effects of Olea enropea leaves crude extracts (in vitro and in vivo). Master thesis. College of Medicine, Al-Kufa University.
International Journal for Sciences and Technology Vol. 8, No.2, June 2013 35
5. Schwartsmann G. (2000). Marine organisms and other novel natural sources of new drugs. Annal. Oncol. 11:235-243. 6. Lee KH. (1999). Novel antitumor agents from higher plants. Med. Res. Rev. 19:569 – 596. 7. Vourela P; Leinonen M; Saikku P ; Tammela P; Rauha JP; Wennberg T; and Vourela H. (2004). Natural products in the process of finding new drug condidates. Curr. Med. Chem. 11 : 1375 – 1389. 8. Kabarity A; Mazrooci S; and Elgindi A. (1988). Camel urine as a possible anticarcinogenic agent. Arab Gulf J. Sci. Agric. Res. Biol. Sci.1: 55 – 63. 9. Noor EA. (2008). Electrochemical study for the corrosion inhibition of mild steel in hydrochloric acid by untreated and treated camel's urine. Euro. J. Scien. Res. 120 (3): 496-507. 10. Martha MC. (2000). Clinically tested medicinal proved book, your on perfect medicine. Mesa Arizona. Wishland publishing. USA. P. 89. 11. Natalie B. (2002). Drinking urine. J. Barkeley med. 18: 22-29. 12. Al-Abdallah AHA. (2010). The inhibitory effect of camel's urine on mycotoxins and fungal growth. Afr. J. Agri. Res. 5 (11): 1331 – 1337. 13. Shoeib AA; and Bahatheg A M. (2008). Electromicroscopic study of Camel urine effect on the Morphology of some human pathogenic bacteria, in comparison with antibiotic cefuroxime. Saudi. J. Biolog. Sci. 15 (3): 119 – 125. 14. Alghamdi Z; and Khorshid F.(2012). Cytotoxicity of the urine of different camel breeds on the proliferation of lung cancer cells. A549. 2:5. 15. Abdel-Raouf GA; Khorshid F A; and Kumosani TA. (2009). FI-IR spectroscopy as a tool for identification of apoptosis – induced structural charges in A549 cells treated with PM 701. Int. J. Nano Biomat. 2(1-2): 396 – 408. 16. Cooper GM. (1997). The cell molecular approach. Distributed exclusively outside north America by Oxford UP. Washington DC. ASMP. P.63. 17. Khorshid FA. (2005). The effect of the viscosity of the medium in the reaction of cells to topograph-1. Pore Saudi. Sci. Fac. 1:67-98. 18. Freshney RI. (2000). Culture of animal cells: A manual for basic technique (4thed.) Wiley-Liss Inc. Canada. P. 330. 19. Gao S ; Yu B; Li Y; Dong W; and Luo H. (2003). Antiproliferative effect of Octreotide on gastric cells mediated of inhibition of Akt / PkB and telomerase. World J. Gastroentrol. 9 : 2362 – 2365. 20. Khorshid FA. (2009). Potential anticancer natural product against human lung cancer cells. Trends Med. Res. 4 (1) : 8-15.
21. Murs U; Osman AM; Mohamed AS; Di-Martino D; and Ipata PL. (1987). Purine Salvage as metabolite and energy saving mechanism in Camelus dromedarius: the recovery of guanine. Comparative Biochem. Physiol. B87:157 – 160. 22. Kudriashov BA; Kolomina S M; Kalishevskaia TM; Pododina LS; and Chentsov IUS. (1979). Effect of haparin complexed with urea on tumor growth and the ultra structure of malignant cells. Farmakologie and Toksikologie. 42:147 – 155. 23. Miller EE; Evans AE; and Cohn M. (1993). Inhibition rate of tumor growth by creatine and cyclocreatine. Proceedings of the National Academy of Science. USA. 90:3304 – 3308. 24. Al-Harbi MM; Qureshi S; Ahmed MM; Raza M; Baig MZ; and Shah AH. (1996). Effect of camel urine on the cytological and biochemical changes induced by cyclophophamide in mice. J. Ethnopharmacol. 52(3):129 – 139. 25. Khorshid FA; and Moshref S S.(2006). In vitro anticancer agent, I-tissue culture study of human lung cancer cells A549 II-tissue culture study of mice Leukemia cells L12b. Int. J. Cancer Res.2:330 – 344. 26. Burzynaski SR; Loo TL ; Ho DH; Rao PN ; Geogiades G; and Kratzenstein H. (1976). Biologically active peptides in human urine III. Inhibitors of the growth of human leukemia, Osteosarcoma and Hela cells. Physiol. Chem. Phys. 8:13 – 22. 27. Malareille C; Hautefenille A; Brun G; Vineis P; and Bartsch H. (1992). Substances in human urine that strongly inhibit bacterial mutagenicity of 2-amino-1-methyl-6-phenylimidazo (4,5-b) pyridine (PhIP) and related heterocyclic amines. Carcinogen. 13:2317 – 2320. 28. Al-Attas AS. (2008). Determination of essential elements in milk and urine of camel and in Nigella sativa seeds. Arabian J. Chem. 1(2): 123 – 129. 29. Goering PL; and Klassen CD. (1984). Zinc Induced tolerance to Cadmium hepatotoxicity. Toxicol. Apllied Pharmacol. 74: 299 – 307. 30. Powell SR. (2000). Antioxidant properties of zinc. J. Nutr. 130:1447 – 1454. 31. El-Shahawy A; El-Sawi NM; Baker WS; Khorshid F; and Geweely N. (2010). Spectral analysis, molecular orbital calculations and antimicrobial activity of PMF-G Fraction extracted from PM-701. Int. J. Pharma. Biosci. 1(2): 1331 – 1337. 32. Al-Haider AA; El-Gendy MAM; Korashy HM; and El-Kadi AOS. (2011). Camel urine inhibits the cytochrome P450 1a1 gene expression through an AhR- dependent mechanism in Hepatol. Cell Line. 133:184-190.
International Journal for Sciences and Technology Vol. 8, No.2, June 2013 36
Apolipoprotein B as a biomarker in patients with stable and unstable angina
pectoris
Hind Sh. Ahmed
Dept. of Chemistry/ College of Education for Pure Science (Ibn Al-Haitham)/ Baghdad University /
Iraq
ABSTRACT
Apolipoprotein B (Apo B) is the primary apolipoproteins of chylomicrons and low-density lipoproteins (LDL). High levels of apo B can lead to plaques that cause vascular disease (atherosclerosis), leading to heart diseases. There is considerable evidence that levels of apo B are a better indicator of heart disease risk than total cholesterol or LDL. The aim of the present study was to evaluate serum apo B and serum lipid profile in patients with stable angina pectoris (SAP) and unstable angina pectoris (USAP) and compared with their controls. This study was conducted during the period from January 2013 until the end of April 2013. The patients were admitted to Medical City Hospital and all the measurements were performed in the Medical Teaching Laboratories in Baghdad. A total of 30 patients with SAP and USAP; their age range was (40-57) years and compared with 15 healthy controls. They were studied for their body mass index (BMI), serum lipid profile including serum total cholesterol (TC), triacylglycerol (TAG), high density lipoprotein cholesterol (HDL-C), low density lipoprotein cholesterol (LDL-C), very low density lipoprotein cholesterol (VLDL-C), and non. HDL-C in fasting state, along with apo B levels. As a result, BMI and serum lipid profile level except HDL-C were significantly increased in patients with SAP and USAP as compared with their controls. A significant decreased was found in serum HDL-C for those patients as compared with their controls, (P=0.0001). Serum apo B and LDL associated apo B (LDL-apo B) were significantly increased in patients with SAP and USAP as compared with their controls and there was a significant difference between SAP and USAP, (P= 0.0001). It was concluded that apo B is the most frequently occurring dyslipidemia in SAP and USAP. It identifies individuals with high risk of acute coronary disease not otherwise detected on routine lipid profile
Key words: Apolipoprotein B, angina pectoris, dyslipidemia
الملخص باللغة العربية
المستويات العالية من . من األبوليبوبروتينات األساسية للدقائق الكيلوسية المايكروية والبروتينات الدهنية قليلة الكثافة B يعد األبوليبوبروتين
. المؤدية ألمراض القلب) الشرايينتصلب(و التي تسبب أمراض األوعية الدموية ) الصفيحة(ممكن أن تؤدي لتكوين اللويحة B األبوليبوبروتين تعتبر مؤشر أفضل من الدهون الكلية أو البروتين الدهني B هنالك العديد من األدلة التي تؤخذ بنظر األعتبار على ان مستويات األبوليبوبروتين
.قليل الكثافة على خطر أمراض القلبون في مصل الدم لدى مرضى الذبحة الصدرية المستقرة وغير المستقرة ومقارنتها والدهBالهدف من الدراسة الحالية هو تقدير األبوليبوبروتين
على المرضى الراقدين في مستشفى مدينة 2013 الى نهاية نيسان 2013تمت هذه الدراسة خالل الفترة من كانون الثاني . مع مجموعة السيطرة مريضا مصابين بالذبحة الصدرية 30يبلغ عدد المرضى الكلي . ة في بغدادالطب وجميع القياسات تم اجراؤها في المختبرات التعليمية الطبي
تم دراسة معدل كتلة الجسم والدهون في . شخصا سليما15سنة ومقارنتها مع ) 57- 40(المستقرة وغير المستقرة والذين تتراوح أعماره ما بين , البروتين الدهني قليل الكثافة, كليسيرايد، البروتين الدهني عالي الكثافةالدهون ثالثية ال, مصل هؤالء المرضى والتي تتضمن الدهون الكلية
أظهرت . Bوالبروتين الدهني غير عالي الكثافة في حالة الصيام وعالقتها مع مستويات األبوليبوبروتين , البروتين الدهني شديد انخفاض الكثافةلدهون في المصل باستثناء البروتين الدهني عالي الكثافة لدى المرضى المصابين النتائج وجود ارتفاع معنوي في معدل كتلة الجسم و مستوى ا
حيث يوجد انخفاض في مستوى البروتين الدهني عالي الكثافة لهؤالء المرضى عند مقارنتها مع , بالذبحة الصدرية المستقرة وغير المستقرةالمرتبط بالبروتين الدهني قليل الكثافة B في المصل واألبوليبوبروتينB تين يوجد ارتفاع معنوي لألبوليبوبرو). P= 0.0001(, مجموعة السيطرة
و يوجد اختالف معنوي بين المرضى , لدى المرضى المصابين بالذبحة الصدرية المستقرة و غير المستقرة عند مقارنتها مع مجموعة السيطرة غالبا ما يظهر في Bيمكن األستنتاج بأن األبوليبوبروتين ). P= 0.0001(لة عند مستوى دال, المصابين بالذبحة الصدرية المستقرة وغير المستقرة
فهو يميز المرضى المعرضين ألمراض القلب التاجية , حالة اضطراب الدهون في الدم لدى مرضى الذبحة الصدرية المستقرة وغير المستقرة .الحادة والتي اليمكن الكشف عنها عن طريق فحص الدهون الروتيني
International Journal for Sciences and Technology Vol. 8, No.2, June 2013 37
INTRODUCTION
Cardiovascular disease (CVD) is the leading cause of death in industrialized countries. Coronary artery disease (CAD) is the most common form of CVD. In CAD, atherosclerosis damages the coronary artery wall predisposing to thrombus formation. The symptoms and severity of acute coronary syndromes (unstable angina pectoris -USAP- and myocardial infarction) vary depending on the degree to which thrombi occlude the coronary arteries (1). Stable angina pectoris (SAP) is a common and sometimes disabling disorder (2). Many individual lipid and inflammatory markers have been considered as the factors playing an important role in atherogenesis and prognosis of related diseases. The atherogenic dyslipidemic profile, especially mild to marked elevation of apo-B containing lipoproteins, such as VLDL, VLDL-remnants, intermediate-density lipoproteins (IDL), and LDL (specifically small, dense LDL), and low levels of high density lipoprotein cholesterol (HDL-C) (3). Apo B, a large amphipathic glycoprotein, plays a central role in human lipoprotein metabolism. Two forms of apo B in circulating lipoproteins: apo B48 and apo B100 (4). Apo B48 is synthesized by enterocytes and secreted in chylomicrons, and is retained in chylomicron remnants (5). Apo B100 is synthesized in the hepatocytes and its excess is degraded within cells. It resides in the VLDL, LDL and LDL particles at a ratio of one molecule per lipoprotein particle (6). VLDL, IDL, LDL, and lipoprotein each contain one molecule of apo B100. Similarly, chylomicrons and their remnants contain a single molecule of apo B48. Hence, plasma apo B concentrations reflect the total number of atherogenic particles present in the circulation (7). Apo B can be used as an effective marker for elevations in these atherogenic triacylglycerol-rich lipoproteins and a more accurate predictor of cardiovascular risk (CV) (8). However, in individuals whose LDL particles, on average, contain less cholesterol than normal, the LDL-C concentration will underestimate the number of LDL particles. In these individuals, the apo B concentration will more accurately reflect the number of LDL particles and LDL-related CVD risk (9). Also, there now appears to be less laboratory error in the determination of apo B than of LDL-C, particularly in patients with hypertriglyceridemia (10).
MATERIALS AND METHODS
This study was conducted during the period from January 2013 until the end of April 2013. The patients in this study were admitted to Medical City Hospital. All the tests were performed in the Medical Teaching Laboratories in Baghdad. About 5 milliliters of venous blood was obtained from 30 patients and 15 healthy individuals as control group after 12 hours fast. Their age range was (40-57) years. Blood samples were transferred into plain tube, allowed to stand for 15 minutes at room temperature, centrifuged at 3500 rpm for 10 minutes. Patients were categorized into two groups based on the degree of ischemic heart disease (IHD): stable angina pectoris (SAP group) and unstable angina pectoris (USAP group). The SAP group consisted of 8 male and 7 female (total 15, mean age 51.3±6.7 years); the USAP group had 8 male and 7 female (total 15, mean age 53.8±9.8 years). The patients in the SAP group are demonstrated objective evidence of ischemia on electrocardiogram (ECG). USAP was defined according to Hamm and Braunwald (11). All patients in the USAP group had chest pain of increasing frequency and severity or at rest during the last 48 hours before hospitalization associated with ST segment changes, T wave changes, or both. Measurements: 1-Determination of Serum Total Cholesterol (TC): Serum TC is measured by cholesterol kit, using an enzymatic method (12). 2-Determination of Serum Triacylglycerol (TAG): Serum TAG is measured by TAG kit, using an enzymatic method (13). 3-Determination of Serum High Density Lipoprotein-Cholesterol (HDL-C): Serum HDL-C is measured by HDL-C kit, using an enzymatic method (14). 4-Determination of Serum Low Density Lipoprotein- Cholesterol (LDL-C): Serum LDL-C is calculated indirectly by using the Friedewald s equation (15). LDL-C = TC − [TAG/5 + HDL-C]. This equation is only accurate when TAG levels are below 400 mg/dl. 5-Determination of Serum Non-High Density Lipoprotein Cholesterol (Non.HDL-C): Serum non HDL-C is calculated directly from the difference between serum total and high-density lipoprotein cholesterol (16). Serum non.HDL-C= [S.TC – S.HDL-C].
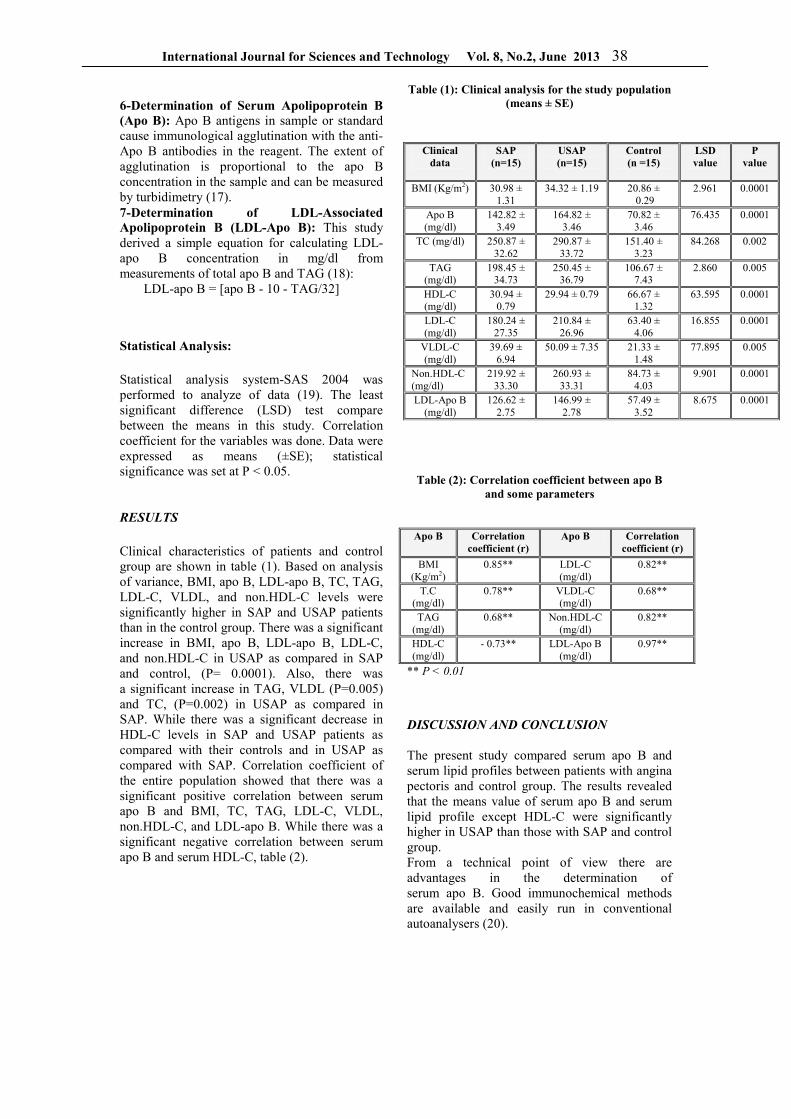
International Journal for Sciences and Technology Vol. 8, No.2, June 2013 38
6-Determination of Serum Apolipoprotein B (Apo B): Apo B antigens in sample or standard cause immunological agglutination with the anti- Apo B antibodies in the reagent. The extent of agglutination is proportional to the apo B concentration in the sample and can be measured by turbidimetry (17). 7-Determination of LDL-Associated Apolipoprotein B (LDL-Apo B): This study derived a simple equation for calculating LDL-apo B concentration in mg/dl from measurements of total apo B and TAG (18): LDL-apo B = [apo B - 10 - TAG/32]
Statistical Analysis:
Statistical analysis system-SAS 2004 was performed to analyze of data (19). The least significant difference (LSD) test compare between the means in this study. Correlation coefficient for the variables was done. Data were expressed as means (±SE); statistical significance was set at P < 0.05. RESULTS
Clinical characteristics of patients and control group are shown in table (1). Based on analysis of variance, BMI, apo B, LDL-apo B, TC, TAG, LDL-C, VLDL, and non.HDL-C levels were significantly higher in SAP and USAP patients than in the control group. There was a significant increase in BMI, apo B, LDL-apo B, LDL-C, and non.HDL-C in USAP as compared in SAP and control, (P= 0.0001). Also, there was a significant increase in TAG, VLDL (P=0.005) and TC, (P=0.002) in USAP as compared in SAP. While there was a significant decrease in HDL-C levels in SAP and USAP patients as compared with their controls and in USAP as compared with SAP. Correlation coefficient of the entire population showed that there was a significant positive correlation between serum apo B and BMI, TC, TAG, LDL-C, VLDL, non.HDL-C, and LDL-apo B. While there was a significant negative correlation between serum apo B and serum HDL-C, table (2).
Table (1): Clinical analysis for the study population (means ± SE)
Table (2): Correlation coefficient between apo B and some parameters
Correlation coefficient (r)
Apo B Correlation coefficient (r)
Apo B
0.82** LDL-C (mg/dl)
0.85** BMI (Kg/m2)
0.68** VLDL-C (mg/dl)
0.78** T.C (mg/dl)
0.82** Non.HDL-C (mg/dl)
0.68** TAG (mg/dl)
0.97** LDL-Apo B (mg/dl)
- 0.73** HDL-C (mg/dl)
** P < 0.01
DISCUSSION AND CONCLUSION
The present study compared serum apo B and serum lipid profiles between patients with angina pectoris and control group. The results revealed that the means value of serum apo B and serum lipid profile except HDL-C were significantly higher in USAP than those with SAP and control group. From a technical point of view there are advantages in the determination of serum apo B. Good immunochemical methods are available and easily run in conventional autoanalysers (20).
P value
LSD value
Control (n =15)
USAP (n=15)
SAP (n=15)
Clinical data
0.0001 2.961 20.86 ± 0.29
34.32 ± 1.19 30.98 ± 1.31
BMI (Kg/m2)
0.0001 76.435 70.82 ± 3.46
164.82 ± 3.46
142.82 ± 3.49
Apo B (mg/dl)
0.002 84.268 151.40 ± 3.23
290.87 ± 33.72
250.87 ± 32.62
TC (mg/dl)
0.005 2.860 106.67 ± 7.43
250.45 ± 36.79
198.45 ± 34.73
TAG (mg/dl)
0.0001 63.595 66.67 ± 1.32
29.94 ± 0.79 30.94 ± 0.79
HDL-C (mg/dl)
0.0001 16.855 63.40 ± 4.06
210.84 ± 26.96
180.24 ± 27.35
LDL-C (mg/dl)
0.005 77.895 21.33 ± 1.48
50.09 ± 7.35 39.69 ± 6.94
VLDL-C (mg/dl)
0.0001 9.901 84.73 ± 4.03
260.93 ± 33.31
219.92 ± 33.30
Non.HDL-C (mg/dl)
0.0001 8.675 57.49 ± 3.52
146.99 ± 2.78
126.62 ± 2.75
LDL-Apo B (mg/dl)
International Journal for Sciences and Technology Vol. 8, No.2, June 2013 39
This study used apolipoprotein measurements, which present some methodological advantages when compared with LDL-C quantification. In many labs LDL-C is still calculated by the Friedewalds equation which only provides an estimate of the LDL-C values, and depends on TC, TAG and HDL-C levels. In this manner, the estimate may include the possible analytical errors of these three parameters. This equation also presents several has several limitations and the LDL-C estimate cannot be extended to samples presenting TAG levels higher than 400 mg/dl, samples containing chylomicrons and to patients with dysbetalipoproteinemia. In addition, the homogeneous method for measuring LDL-C and the estimate of these values by the Friedewalds equation do not show similar results. On the other hand, apolipoproteins may be measured directly in plasma through accurate and precise internationally standardized methods, by using a common reference material for apo B, which is not routinely available for measurements of LDL-C (21). The prospective value of apo B as the strongest single lipids associated risk factor has been shown in large observational studies (22,23,24). Non.HDL-C, which is calculated in the present study, provides a measure of all apo B-containing lipoproteins, all of which have the potential to deliver cholesterol into the arterial wall and contribute to atherosclerotic lesions. This measure reflects atherogenic risk not captured by LDL-C measurement alone, particularly in the context of elevated TAG (25). Because ultracentrifugation is not readily available in most clinical laboratories, the equation which is used in the present study conveniently estimates LDL-apo B from commonly available measurements for total apo B and TAG. According to the equation of Baca and Warnick, 2008, the TAG/32 term takes into consideration the VLDL contribution to apo B and is reminiscent of the TAG/5 term in the Friedewalds equation. Clinically; this equation can be used to estimate atherogenic apo B particle number without requiring specialized laboratory measurements. It is therefore concluded that there was a significant difference between serum apo B, LDL-apo B, BMI, and serum lipid profiles in patients with angina pectoris as compared with their controls; therefore methodological and clinical benefits of apo B should be included in the dyslipidemic work up of angina patients to correctly assess the potential atherogenic risk.
REFERENCES
1. Bassand JP; Hamm CW; and Ardissino D. (2007). Task force for diagnosis and treatment of non-ST-segment elevation acute coronary syndromes of European society of cardiology. Guidelines for the diagnosis and treatment of non-ST-segment elevation acute coronary syndromes. Eur. Heart J. 28(13):1598-1660. 2. Tobin K J. (2010). Stable Angina Pectoris: What does the current clinical evidence tell us? J. Amer. Osteopath. Assoc. 110(7):364-370. 3. Djordjevic VB; Osic VC; Stojanovic I; Kundalic S; Zvezdanovic L; Deljanin-Ilic M; Vlahovic P; and Popovic L. (2011). Lipoprotein (a) is the best single marker in assessing unstable angina pectoris. Cardiol. Res. Prac. (175363):1-13. 4. Burnett JR; and Watts GF. (2008). Estimating LDL apo B: infomania or clinical advance? Clin. Chem. 54(5):782-784. 5. Su JW; Nzekwu MM; Cabezas MC; Redgrave T; and Proctor SD. (2009). Methods to assess impaired post-prandial metabolism and the impact for early detection of cardiovascular disease risk. Eur. J. Clin. Invest. 39(9):741-754. 6. Dominiczak MH; and Caslake MJ. (2011). Apolipoproteins: metabolic role and clinical biochemistry applications. Ann. Clin. Biochem. 48(6):498-515. 7. Sniderman AD. (2008). Differential response of cholesterol and particle measures of atherogenic lipoproteins to LDL-lowering therapy: implications for clinical practice. J. Clin. Lipidol. 2(1):36-42. 8. Harper CR; and Jacobson TA. (2010). Using apolipoprotein B to manage dyslipidemic patients: time for a change? Commentary. Mayo. Clin Proc. 85(5):440-445. 9. Davidson MH; Ballantyne CM; Jacobson TA; Bittner VA; Braun LT; Brown AS; Brown WV; Cromwell WC; Goldberg RB; McKenney JM; Remaley AT; Sniderman AD; Toth PP; Tsimikas S; and Ziajka PE. (2011). Clinical utility of inflammatory markers and advanced lipoprotein testing: advice from an expert panel of lipid specialists. J. Clin. Lipidol. 5(5):338-367. 10.Reiner Z; Catapano AL; Backer GD; Graham I; Taskinen M; Wiklund O; Agewall S; and Alegria E. (2011). ESC/EAS guidelines for the management of dyslipidemias: The Task Force for the management of dyslipidemias of the European society of cardiology (ESC) and the European atherosclerosis society (EAS). Euro. Heart J. 32(14):1769-1818. 11. Hamm CW; and Braunwald E. (2000). A classification of unstable angina revisited. Circul. 102(1):118-122.
International Journal for Sciences and Technology Vol. 8, No.2, June 2013 40
12. Richmond W. (1992). Analytical reviews in clinical biochemistry: the quantitative analysis of cholesterol. Ann. Clin. Biochem.29(26):577-597. 13. Fossati P; and Prencipe L. (1982). Serum triglycerides determined colorimetrically with an enzyme that produces hydrogen peroxide. Clin.Chem. 28(10):2077-2080. 14. Burstein M; Scholnick HR; and Scand MR. (1980). Rapid method for the isolation of lipoproteins from human serum by precipitation with polyanions. J. Clin. Lab. Invest. 11(6):583-595. 15. Friedewald W T; Robert I L; and Donald SF. (1972). Estimation of the concentration of low-density lipoprotein cholesterol in plasma, without use of the preparative ultracentrifuge. Clin. Chemi. 18(6):499-502. 16. Hermans MP; Sacks FM; Ahn SA; and Rousseau MF. (2011). Non-HDL-cholesterol as valid surrogate to apolipoprotein B100 measurement in diabetes: Discriminant ratio and unbiased equivalence. Cardiovas. Diabetol. 10(20):1-7. 17. Dati F. (1989). Estimation of apolipoproteins by immunoturbidimetric method. Lab.Med. 13:87. 18. Baca AM; and Warnick GR. (2008). Estimation of LDL-associated apolipoprotein B from measurements of triglycerides and total apolipoprotein B. Clin. Chem. 54(5):907-910. 19. SAS. (2004). Statistical Analysis System, User's Guide. Statistical. Version 7th ed. SAS. Inst. Inc. Cary. N.C. USA. 20. Charlton-Menys V; Betteridge DJ; Colhoun H; Fuller J; France M; Hitman GA; Livingstone SJ; Neil HA; Newman CB; Szarek M; DeMicco DA; and Durrington PN. (2009). Targets of statin therapy: LDL cholesterol, non-HDL cholesterol, and apolipoprotein B in type 2 diabetes in the collaborative atorvastatin diabetes study (CARDS). Clin. Chem. 55(3):473-480. 21. Kanani FH; and Alam JM. (2010). Apolipoprotein B in type 2 diabetics-a cross sectional study in a tertiary care set-up. J. Pak. Med. Assoc. 60(8): 653-656. 22. Boekholdt SM; Arsenault BJ; Mora S; Pedersen TR; LaRosa JC; Nestel PJ; Simes RJ; Durrington P; Hitman GA; Welch KM; DeMicco DA; Zwinderman AH; Clearfield MB; Downs JR; Tonkin AM; Colhoun HM; Gotto AM; Ridker PM; and Kastelein JJ. (2012). Association of LDL cholesterol, non–HDL cholesterol, and apolipoprotein B levels with risk of cardiovascular events among patients treated with statins. A meta-analysis. JAMA. 307(12):1302-1309. 23. Duewell P; Kono H; and Rayner KJ. (2010). NLRP3 inflammasomes are required for
atherogenesis and activated by cholesterol crystals. Nat. 464(7293):1357-1361 24. Contois JH; McConnell JP; Sethi AA; Csako G; Devaraj S; Hoefner DM; and Warnick GR.. (2009). Apolipoprotein B and cardiovascular disease risk position statement from the AACC lipoproteins and vascular diseases division working group on best practices. Clin. Chem.55(3):407-419. 25. Ahmed K; Jeong MH; Chakraborty R; Hong YJ; Oh MS; Cho KH; Kim MC; Hachinohe D; Hwang SH; Lee MG; Sim DS; Park KH; Kim JH; Ahn Y; and Kang JC. (2012). Clinical impact of non-high density lipoprotein-cholesterol and apolipoprotein B on clinical outcomes in metabolic syndrome patients with acute myocardial infarction undergoing percutaneous coronary intervention. Korean Circul. J. 42(5):319-328.
International Journal for Sciences and Technology Vol. 8, No.2, June 2013 41
Synthesis, characterization and inhibitory effect on SALP of new some Schiff
Bases derived from D-Erythroascorbic acid
Dhuha F. Hussein
Dept. of Chemistry/ College of Education for Pure Science (Ibn Al-Haitham)/ Baghdad University /
Iraq
ABSTRACT
New five Schiff bases derived from D-erythroascorbic acid were prepared by condensing pentulosono-γ-lactone-2,3-enedianisoate (5) with 3-amino phenol, (4-iodo, 4-methoxy, 4-methyl, 4-nitro) aniline in the presence of glacial acetic acid and dry benzene. The products were characterized by spectral methods FTIR, and some by (UV-Vis), 1H and 13CNMR, mass spectra and measurement of its physical properties. The derivatives showed inhibitory effect on serum alkaline phosphatase (SALP) activity of healthy, hypo and hyperthyroidisum patients.
Key words: Schiff bases, imine, serum alkaline phosphatase (SALP), erythroascorbic acid
الملخص باللغة العربية
كامـا -بنتيولوسونو) ( ٥(تم تحضير خمسة من قواعد شف الجديدة المشتقة من حامض االرثرواسكوربيك وذلك من تكاثف مركب نيلين بوجود حامض ا) نايترو -٤, مثيل -٤ , ميثوكسي -٤, ايودو -٤( , امينو فينول -٣مع ) ين ثنائي انيسويت -٢,٣-الكتون–
وبعضها بواسطة طيـف , شخصت المركبات المحضرة بالطرق الطيفية طيف االشعة تحت الحمراء . الخليك الثلجي والبنزين الجاف أظهـرت . قياس بعـض خصائـصها الفيزيائيـة ,طيف الكتلة , طيف الرنين النووي المغناطيسي , االشعة فوق البنفسجية والمرئية
على فعالية أنزيم الفوسفاتيز القاعدي في أمصال األصحاء والمرضى بالخلـل الـوظيفي للغـدة " تثبيطيا" راالمشتقات المحضرة تأثي .الدرقية
International Journal for Sciences and Technology Vol. 8, No.2, June 2013 42
INTRODUCTION
The formation of carbon–nitrogen double bond plays important role in organic synthesis. This can be achieved by the reaction of aldehydes and amines in acidic medium, which leads to synthesis of Schiff bases (imines). Nowadays, the research field dealing with Schiff base coordination chemistry has expanded enormously. The importance of Schiff base complexes for bioinorganic chemistry, biomedical application like anticancer (1), antitumor(2), anti-inflammatory agents (3). Insecticidal (4), antibacterial (5), antituberculosis (6), antimicrobial (7), anticonvulsant activity(8), supramolecular chemistry, catalysis and material science, separation and encapsulation processes, and formation of compounds with unusual properties and structures has been well recognized (9). The Schiff bases are also used as versatile components in nucleophilic addition with organometallic reagents (10) and in cycloaddition reactions (11,12). The reaction of primary aromatic amines with aryl aldehydes is found to be catalyzed by lemon juice as natural acid under solvent-free conditions to give the corresponding Schiff bases in good yields. This eco-friendly reaction has many advantages like economical, environmental, mild reaction conditions and simple work-up with high product yield (13). The introduction of enzyme inhibitors in particular has drastically decreased the mortality and morbidity associated with many diseases (14). The current paper deals with the synthesis, spectral and inhibitory effect on serum alkaline phosphatase (SALP) of new five schiff bases derived from D-erythroascorbic acid.
MATERIALS AND METHODS
Melting points were determined by electrothermal Stuart melting point apparatus and are uncorrected. IR spectra (in KBr) were recorded on 8400s Shimadzu FT infrared spectrophotometer. 1HNMR spectra were recorded on Ultra Shield (300 MHz) spectrometer with tetramethyl silane as internal standard. 13CNMR spectrum was recoded on a Varian Mercury plus 100 MHz spectrometer. Electronic spectrum was obtained using a (U.V-Vis) spectrophotometer type CECl 7200 England. Mass spectrum for the compound (5) was recorded on IEOLJMS-7high resolution
instrument. Thin layer chromatography (TLC) was performed on aluminum plates coated with layer of silica gel, supplied by Merck. The spots were detected by iodine vapor. All chemical were obtained from Fluka or BDH. Synthesis of 5,6-O-isopropylidene-L-ascorbic acid (2) Dry hydrogen chloride was rapidly bubbled with stirring for 20 minutes into a (250ml) flask containing (10g, 57mmol) of powdered L-ascorbic acid (1) and (100ml) of dry acetone. After addition of (80ml) n-hexane, stirring and cooling in an ice-water, the supernatant was decanted. The precipitate was washed four times with (154ml) of acetone-hexane mixture (4:7) (v/v), cooling in an ice-water and removal of supernatant after each addition. The last precipitate was dried under reduced pressure to give (2) (95%) as a white crystalline residue (15), m.p (206-208˚C). Rf (0.68) (benzene: methanol, 5:5) (v/v). FTIR (KBr, cm-1): 3240 (O-H), 2993 (C-Hali.), 2908 (C-Hace.), 1751 (C=Olac.), 1662 (C=C), 1431 (-CH-asym), 1388 (-CH-sym), 1141-900 (C-O), 767 δ(O-H) (O.O.P.) (16). Synthesis of 2,3-O-dianisoyl-5,6-O-isopropylidene-L-ascorbic acid (3): To a cold solution of (2) (10g, 46mmol) in pyridine (50ml), anisoyl chloride was added as dropwise (17.5ml , 129mmol) with stirring .The resulting mixture was stirred for 2 hours , then kept in dark place at room temperature for 22 hours. The mixture was poured into ice-water and stirred for 20 minutes, the supernatant was decanted. The oil layer was extracted with chloroform (150 ml), washed with water, dilute hydrochloric acid (5%) (2 × 100ml.), saturated aqueous sodium hydrogen carbonate (100ml) and water. Dried over anhydrous magnesium sulfate. Chloroform was evaporated to produce a brown syrup and purified from chloroform: petroleum ether (60-80˚C) (1:5) (v/v) to give (3) (76.5%) as a pale yellow solid (17), m.p (102-104˚C). Rf (0.80) (benzene: methanol, 5:5) (v/v). FTIR (KBr, cm-1): 3028 (C-Har.), 2983 (C-Hali.), 2939 (C-Hace.), 2843 (OC-Hali.), 1749 (C=Olac.), 1683 (C=Oest.), 1647 (C=Cali.), 1604 (C=Car.), 1300-1107 (C-Oest.), 900-600 δ(C-H) (O.O.P.) (17).
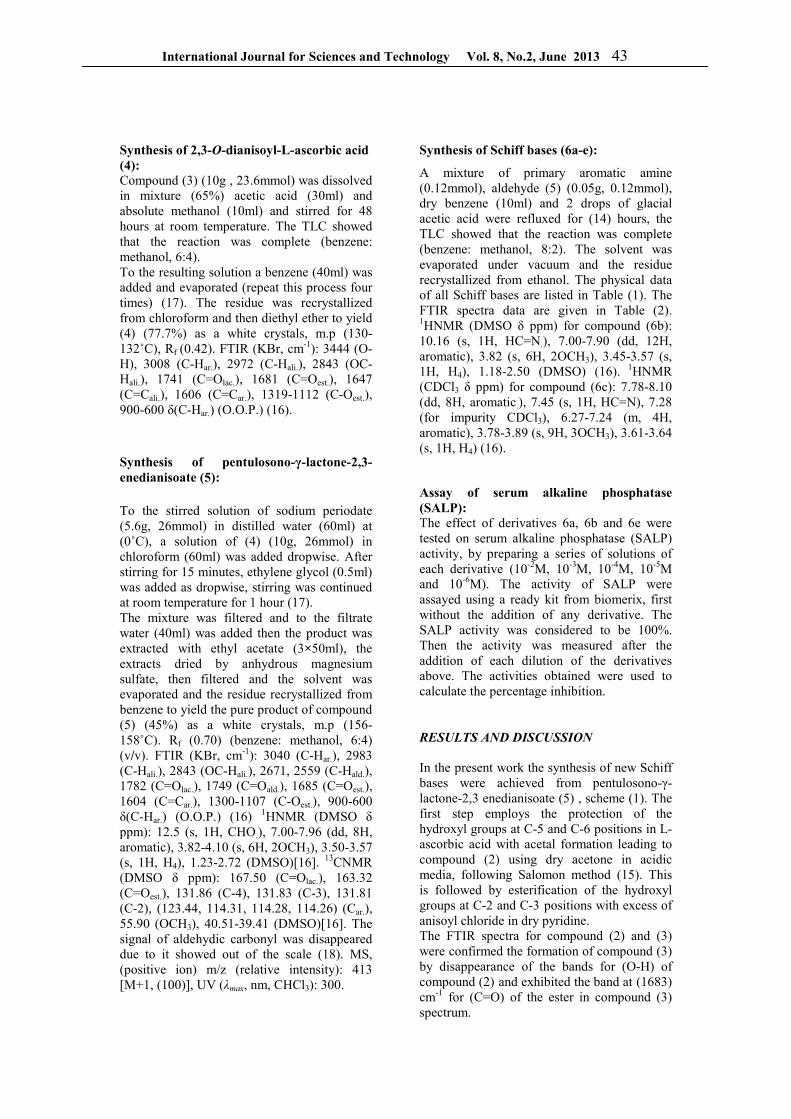
International Journal for Sciences and Technology Vol. 8, No.2, June 2013 43
Synthesis of 2,3-O-dianisoyl-L-ascorbic acid (4): Compound (3) (10g , 23.6mmol) was dissolved in mixture (65%) acetic acid (30ml) and absolute methanol (10ml) and stirred for 48 hours at room temperature. The TLC showed that the reaction was complete (benzene: methanol, 6:4). To the resulting solution a benzene (40ml) was added and evaporated (repeat this process four times) (17). The residue was recrystallized from chloroform and then diethyl ether to yield (4) (77.7%) as a white crystals, m.p (130-132˚C), Rf (0.42). FTIR (KBr, cm-1): 3444 (O-H), 3008 (C-Har.), 2972 (C-Hali.), 2843 (OC-Hali.), 1741 (C=Olac.), 1681 (C=Oest.), 1647 (C=Cali.), 1606 (C=Car.), 1319-1112 (C-Oest.), 900-600 δ(C-Har.) (O.O.P.) (16). Synthesis of pentulosono-γ-lactone-2,3-enedianisoate (5): To the stirred solution of sodium periodate (5.6g, 26mmol) in distilled water (60ml) at (0˚C), a solution of (4) (10g, 26mmol) in chloroform (60ml) was added dropwise. After stirring for 15 minutes, ethylene glycol (0.5ml) was added as dropwise, stirring was continued at room temperature for 1 hour (17). The mixture was filtered and to the filtrate water (40ml) was added then the product was extracted with ethyl acetate (3×50ml), the extracts dried by anhydrous magnesium sulfate, then filtered and the solvent was evaporated and the residue recrystallized from benzene to yield the pure product of compound (5) (45%) as a white crystals, m.p (156-158˚C). Rf (0.70) (benzene: methanol, 6:4) (v/v). FTIR (KBr, cm-1): 3040 (C-Har.), 2983 (C-Hali.), 2843 (OC-Hali.), 2671, 2559 (C-Hald.), 1782 (C=Olac.), 1749 (C=Oald.), 1685 (C=Oest.), 1604 (C=Car.), 1300-1107 (C-Oest.), 900-600 δ(C-Har.) (O.O.P.) (16) 1HNMR (DMSO δ ppm): 12.5 (s, 1H, CHO.), 7.00-7.96 (dd, 8H, aromatic), 3.82-4.10 (s, 6H, 2OCH3), 3.50-3.57 (s, 1H, H4), 1.23-2.72 (DMSO)[16]. 13CNMR (DMSO δ ppm): 167.50 (C=Olac.), 163.32 (C=Oest.), 131.86 (C-4), 131.83 (C-3), 131.81 (C-2), (123.44, 114.31, 114.28, 114.26) (Car.), 55.90 (OCH3), 40.51-39.41 (DMSO)[16]. The signal of aldehydic carbonyl was disappeared due to it showed out of the scale (18). MS, (positive ion) m/z (relative intensity): 413 [M+1, (100)], UV (λmax, nm, CHCl3): 300.
Synthesis of Schiff bases (6a-e):
A mixture of primary aromatic amine (0.12mmol), aldehyde (5) (0.05g, 0.12mmol), dry benzene (10ml) and 2 drops of glacial acetic acid were refluxed for (14) hours, the TLC showed that the reaction was complete (benzene: methanol, 8:2). The solvent was evaporated under vacuum and the residue recrystallized from ethanol. The physical data of all Schiff bases are listed in Table (1). The FTIR spectra data are given in Table (2). 1HNMR (DMSO δ ppm) for compound (6b): 10.16 (s, 1H, HC=N.), 7.00-7.90 (dd, 12H, aromatic), 3.82 (s, 6H, 2OCH3), 3.45-3.57 (s, 1H, H4), 1.18-2.50 (DMSO) (16). 1HNMR (CDCl3 δ ppm) for compound (6c): 7.78-8.10 (dd, 8H, aromatic.), 7.45 (s, 1H, HC=N), 7.28 (for impurity CDCl3), 6.27-7.24 (m, 4H, aromatic), 3.78-3.89 (s, 9H, 3OCH3), 3.61-3.64 (s, 1H, H4) (16).
Assay of serum alkaline phosphatase (SALP): The effect of derivatives 6a, 6b and 6e were tested on serum alkaline phosphatase (SALP) activity, by preparing a series of solutions of each derivative (10-2M, 10-3M, 10-4M, 10-5M and 10-6M). The activity of SALP were assayed using a ready kit from biomerix, first without the addition of any derivative. The SALP activity was considered to be 100%. Then the activity was measured after the addition of each dilution of the derivatives above. The activities obtained were used to calculate the percentage inhibition.
RESULTS AND DISCUSSION
In the present work the synthesis of new Schiff bases were achieved from pentulosono-γ-lactone-2,3 enedianisoate (5) , scheme (1). The first step employs the protection of the hydroxyl groups at C-5 and C-6 positions in L- ascorbic acid with acetal formation leading to compound (2) using dry acetone in acidic media, following Salomon method (15). This is followed by esterification of the hydroxyl groups at C-2 and C-3 positions with excess of anisoyl chloride in dry pyridine. The FTIR spectra for compound (2) and (3) were confirmed the formation of compound (3) by disappearance of the bands for (O-H) of compound (2) and exhibited the band at (1683) cm-1 for (C=O) of the ester in compound (3) spectrum.
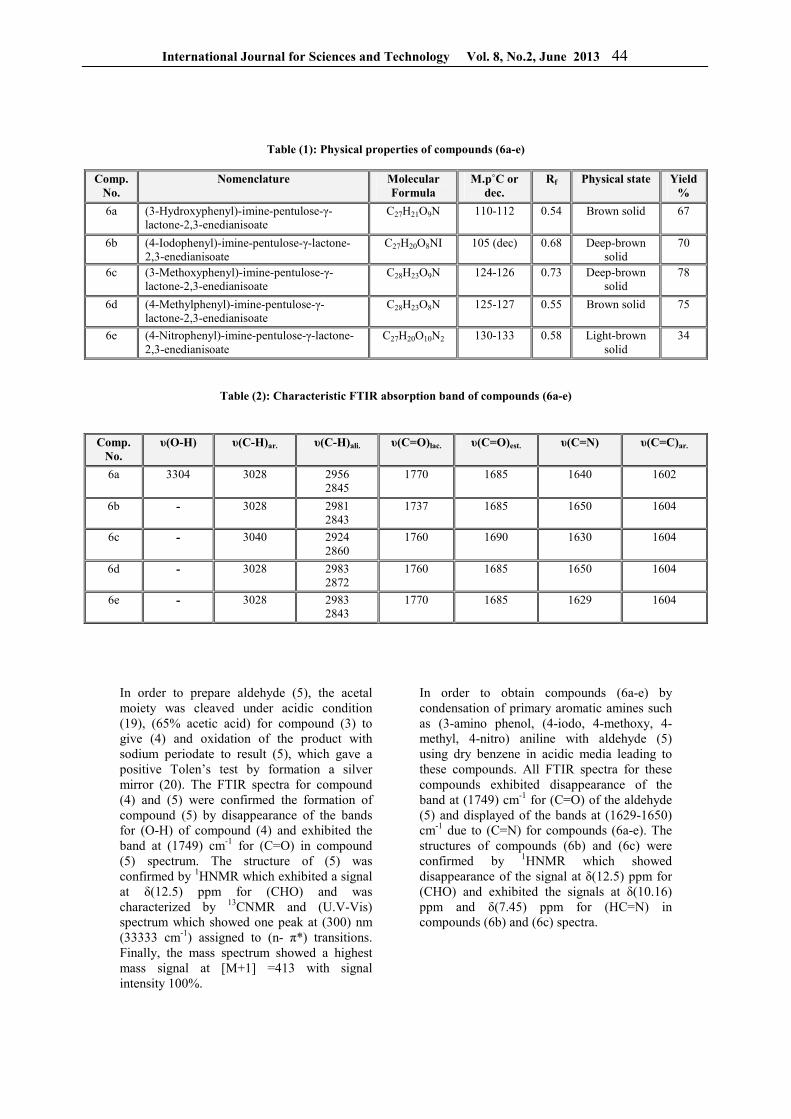
International Journal for Sciences and Technology Vol. 8, No.2, June 2013 44
Table (1): Physical properties of compounds (6a-e)
Comp. No.
Nomenclature Molecular Formula
M.p˚C or dec.
Rf Physical state Yield %
6a (3-Hydroxyphenyl)-imine-pentulose-γ-lactone-2,3-enedianisoate
C27H21O9N 110-112 0.54 Brown solid 67
6b (4-Iodophenyl)-imine-pentulose-γ-lactone-2,3-enedianisoate
C27H20O8NI 105 (dec) 0.68 Deep-brown solid
70
6c (3-Methoxyphenyl)-imine-pentulose-γ-lactone-2,3-enedianisoate
C28H23O9N 124-126 0.73 Deep-brown solid
78
6d (4-Methylphenyl)-imine-pentulose-γ-lactone-2,3-enedianisoate
C28H23O8N 125-127 0.55 Brown solid 75
6e (4-Nitrophenyl)-imine-pentulose-γ-lactone-2,3-enedianisoate
C27H20O10N2 130-133 0.58 Light-brown solid
34
Table (2): Characteristic FTIR absorption band of compounds (6a-e)
Comp. No.
υ(O-H) υ(C-H)ar. υ(C-H)ali. υ(C=O)lac. υ(C=O)est. υ(C=N) υ(C=C)ar.
6a 3304 3028 2956 2845
1770 1685 1640 1602
6b - 3028 2981 2843
1737 1685 1650 1604
6c - 3040 2924 2860
1760 1690 1630 1604
6d - 3028 2983 2872
1760 1685 1650 1604
6e - 3028 2983 2843
1770 1685 1629 1604
In order to prepare aldehyde (5), the acetal moiety was cleaved under acidic condition (19), (65% acetic acid) for compound (3) to give (4) and oxidation of the product with sodium periodate to result (5), which gave a positive Tolen’s test by formation a silver mirror (20). The FTIR spectra for compound (4) and (5) were confirmed the formation of compound (5) by disappearance of the bands for (O-H) of compound (4) and exhibited the band at (1749) cm-1 for (C=O) in compound (5) spectrum. The structure of (5) was confirmed by 1HNMR which exhibited a signal at δ(12.5) ppm for (CHO) and was characterized by 13CNMR and (U.V-Vis) spectrum which showed one peak at (300) nm (33333 cm-1) assigned to (n- π*) transitions. Finally, the mass spectrum showed a highest mass signal at [M+1] =413 with signal intensity 100%.
In order to obtain compounds (6a-e) by condensation of primary aromatic amines such as (3-amino phenol, (4-iodo, 4-methoxy, 4-methyl, 4-nitro) aniline with aldehyde (5) using dry benzene in acidic media leading to these compounds. All FTIR spectra for these compounds exhibited disappearance of the band at (1749) cm-1 for (C=O) of the aldehyde (5) and displayed of the bands at (1629-1650) cm-1 due to (C=N) for compounds (6a-e). The structures of compounds (6b) and (6c) were confirmed by 1HNMR which showed disappearance of the signal at δ(12.5) ppm for (CHO) and exhibited the signals at δ(10.16) ppm and δ(7.45) ppm for (HC=N) in compounds (6b) and (6c) spectra.
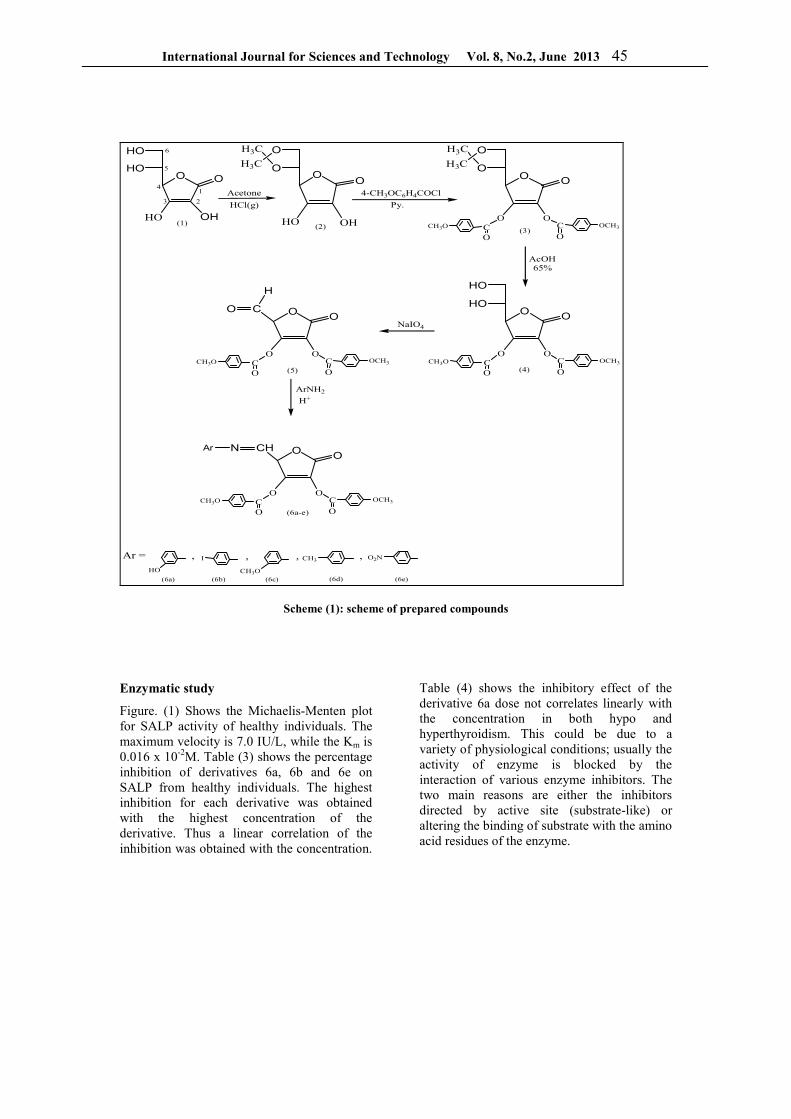
International Journal for Sciences and Technology Vol. 8, No.2, June 2013 45
O O
OH
HO
HO
(1)
OO
O
OH3C
H3C
HO OH(2)
Acetone
HCl(g)
1
23
4
5
6
HO
OO
O
OH3C
H3C
(3)
4-CH3OC6H4COCl
Py.
CO
O
OCH3
OC
OCH3O
AcOH65%
OO
HO
HO
(4)C
O
O
OCH3
OC
OCH3O
NaIO4
OO
(5)C
O
O
OCH3
OC
OCH3O
C
H
O
Ar =
H+
ArNH2
I O2N
OO
(6a-e)
CO
O
OCH3
OC
OCH3O
CHNAr
CH3
CH3OHO
, ,,,
(6a) (6b) (6e)(6c) (6d)
Scheme (1): scheme of prepared compounds
Enzymatic study
Figure. (1) Shows the Michaelis-Menten plot for SALP activity of healthy individuals. The maximum velocity is 7.0 IU/L, while the Km is 0.016 x 10⁻²M. Table (3) shows the percentage inhibition of derivatives 6a, 6b and 6e on SALP from healthy individuals. The highest inhibition for each derivative was obtained with the highest concentration of the derivative. Thus a linear correlation of the inhibition was obtained with the concentration.
Table (4) shows the inhibitory effect of the derivative 6a dose not correlates linearly with the concentration in both hypo and hyperthyroidism. This could be due to a variety of physiological conditions; usually the activity of enzyme is blocked by the interaction of various enzyme inhibitors. The two main reasons are either the inhibitors directed by active site (substrate-like) or altering the binding of substrate with the amino acid residues of the enzyme.
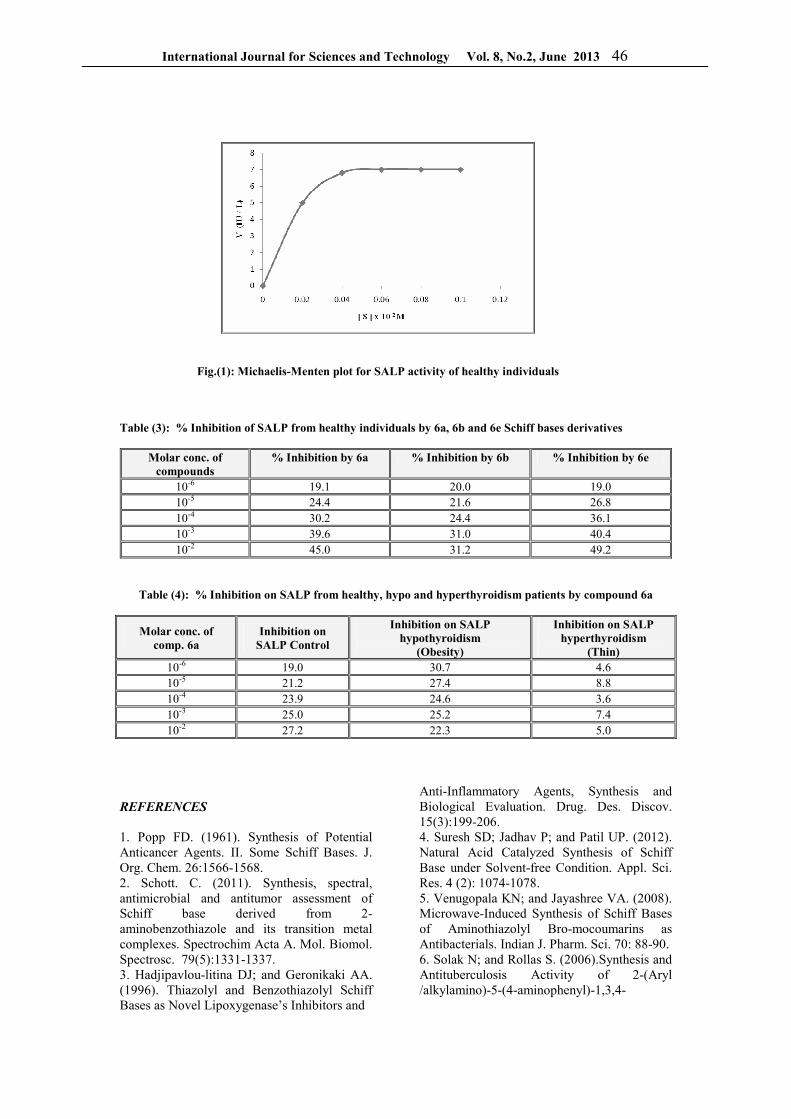
International Journal for Sciences and Technology Vol. 8, No.2, June 2013 46
Fig.(1): Michaelis-Menten plot for SALP activity of healthy individuals Table (3): % Inhibition of SALP from healthy individuals by 6a, 6b and 6e Schiff bases derivatives
Molar conc. of compounds
% Inhibition by 6a % Inhibition by 6b % Inhibition by 6e
10-6 19.1 20.0 19.0 10-5 24.4 21.6 26.8 10-4 30.2 24.4 36.1 10-3 39.6 31.0 40.4 10-2 45.0 31.2 49.2
Table (4): % Inhibition on SALP from healthy, hypo and hyperthyroidism patients by compound 6a
Molar conc. of comp. 6a
Inhibition on SALP Control
Inhibition on SALP hypothyroidism
(Obesity)
Inhibition on SALP hyperthyroidism
(Thin) 10-6 19.0 30.7 4.6 10-5 21.2 27.4 8.8 10-4 23.9 24.6 3.6 10-3 25.0 25.2 7.4 10-2 27.2 22.3 5.0
REFERENCES
1. Popp FD. (1961). Synthesis of Potential Anticancer Agents. II. Some Schiff Bases. J. Org. Chem. 26:1566-1568. 2. Schott. C. (2011). Synthesis, spectral, antimicrobial and antitumor assessment of Schiff base derived from 2-aminobenzothiazole and its transition metal complexes. Spectrochim Acta A. Mol. Biomol. Spectrosc. 79(5):1331-1337. 3. Hadjipavlou-litina DJ; and Geronikaki AA. (1996). Thiazolyl and Benzothiazolyl Schiff Bases as Novel Lipoxygenase’s Inhibitors and
Anti-Inflammatory Agents, Synthesis and Biological Evaluation. Drug. Des. Discov. 15(3):199-206. 4. Suresh SD; Jadhav P; and Patil UP. (2012). Natural Acid Catalyzed Synthesis of Schiff Base under Solvent-free Condition. Appl. Sci. Res. 4 (2): 1074-1078. 5. Venugopala KN; and Jayashree VA. (2008). Microwave-Induced Synthesis of Schiff Bases of Aminothiazolyl Bro-mocoumarins as Antibacterials. Indian J. Pharm. Sci. 70: 88-90. 6. Solak N; and Rollas S. (2006).Synthesis and Antituberculosis Activity of 2-(Aryl /alkylamino)-5-(4-aminophenyl)-1,3,4-
International Journal for Sciences and Technology Vol. 8, No.2, June 2013 47
thiadiazoles and Their Schiff Bases. Arkivoc. 12: 173-181. 7. Wadher S.; Puranik MP; Karande N A; and Yeole PG. (2009). Synthesis and Biological Evaluation of Schiff Base of Dapsone and Their derivative as Antimicrobial Agents. Int. J. Pharm. Tech. Res. 1(1): 22-33. 8. Cates AL; and Rasheed SM.(1984). Phosphorus GABA Analogues as Potential Prodrugs. Pharm. Res. 1(6): 271-273. 9. Ashraf MA; Abdul Wajid KM; Maah MJ; and Yusoff I. (2011). Synthesis, Characterization and Biological Activity of Schiff bases. Int. Con. on Chem. and Chem. Proc. 10:1-7. 10. Kuznetsov VV; Palma AR; Aliev AE; Varlamov AV; and Prostakov NS.(1991). Regioselective Cyclization of 1-Allyl-1-α(β)-naphthylaminocyclohexanes to 4-Methyl-1,2,3,4 tetrahydrospiro(cyclohexane-1,2-benzo(h)(f) (quinolin-es). Zh. Org. Khim.
l27:1579-1581. 11. Taggi AE; Hafez AM; Wack H; Young B; Ferraris D; and Lectka T. (2002). The Development of the First Catalyzed Reaction of Ketenes and Imines: Catalytic, Asymmetric Synthesis of b-Lactams. J. Am. Chem. Soc. 124: 6626-6635. 12. Tsuge O; and Kanemasa R.(1989). Recent Advances in Azo-methine Ylide Chemistry. Adv. Heterocycl. Chem. 45:231-349. 13. Patil S; Jadhav SD; and Patil UP.(2012). Natural Acid Catalyzed Synthesis of Schiff Base under Solvent-free Condition: As a Green Approach. Appl. Sci. Res. 4 (2): 1074-1078. 14. Mohammed HK. (2011). Synthesis and Anti-HIV Activity of New Schiff Bases Derived from the Antihypertensive Drug “Lisinopril”. J. Basrah. Res. Sci. 37(4): 105-110. 15. Salomon LL. (1963). Preparation of 5,6-O-Isopropylidene-L-Ascorbic Acid. Experientia 19(12): 619-620. 16. Dudley H; and Fleming I. (1995). Spectroscopic Methods in Organic Chemistry. 5th ed. McGraw-Hill companies, London. P. 24. 17. Al-Rawi MS.(2011). Synthesis of New Heterocyclic Derivatives of D-Erythroascorbic acid. PhD Thesis. Baghdad University. 18. Carey FA. (2006).Organic Chemistry”; 6th Ed., the McGraw-Hill Companies. Inc., New York; 767.
19. Gazivoda T; Wittine K; Lovric I; Makuc D; Plavec J; Cetina M; Mrvos-Sermek D; Suman L; Kralj M; Pavelic K; Mintas M; and Raic-Malic S. (2006). Synthesis, Structural Studies, and Cytostatic Evaluation of 5,6-Di-O-modified L-Ascorbic Acid Derivatives. Carbohydr. Res. 341 (4):433-442. 20. Vogel AI. (1989).Vogel's Textbook of Practical Organic Chemistry. 5th Ed. John Wiley and Sons, Inc., New York: 1219.
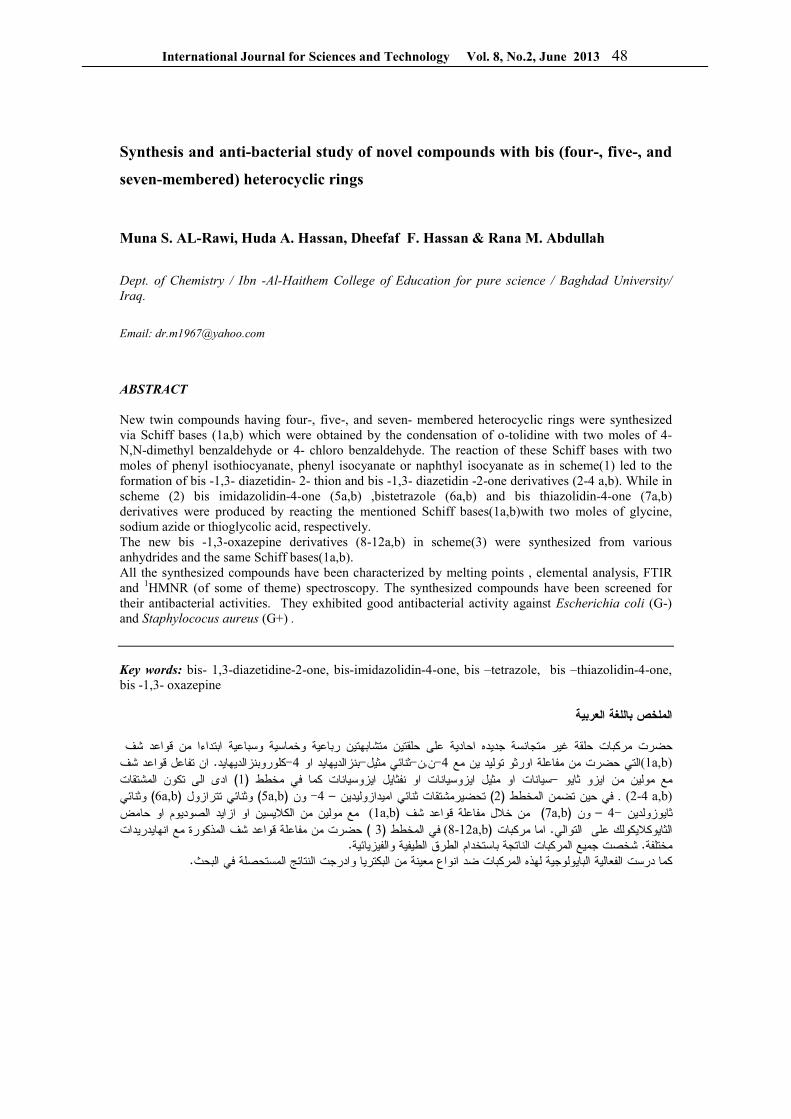
International Journal for Sciences and Technology Vol. 8, No.2, June 2013 48
Synthesis and anti-bacterial study of novel compounds with bis (four-, five-, and
seven-membered) heterocyclic rings
Muna S. AL-Rawi, Huda A. Hassan, Dheefaf F. Hassan & Rana M. Abdullah
Dept. of Chemistry / Ibn -Al-Haithem College of Education for pure science / Baghdad University/
Iraq.
Email: [email protected]
ABSTRACT
New twin compounds having four-, five-, and seven- membered heterocyclic rings were synthesized via Schiff bases (1a,b) which were obtained by the condensation of o-tolidine with two moles of 4-N,N-dimethyl benzaldehyde or 4- chloro benzaldehyde. The reaction of these Schiff bases with two moles of phenyl isothiocyanate, phenyl isocyanate or naphthyl isocyanate as in scheme(1) led to the formation of bis -1,3- diazetidin- 2- thion and bis -1,3- diazetidin -2-one derivatives (2-4 a,b). While in scheme (2) bis imidazolidin-4-one (5a,b) ,bistetrazole (6a,b) and bis thiazolidin-4-one (7a,b) derivatives were produced by reacting the mentioned Schiff bases(1a,b)with two moles of glycine, sodium azide or thioglycolic acid, respectively. The new bis -1,3-oxazepine derivatives (8-12a,b) in scheme(3) were synthesized from various anhydrides and the same Schiff bases(1a,b). All the synthesized compounds have been characterized by melting points , elemental analysis, FTIR and 1HMNR (of some of theme) spectroscopy. The synthesized compounds have been screened for their antibacterial activities. They exhibited good antibacterial activity against Escherichia coli (G-) and Staphylococus aureus (G+) . Key words: bis- 1,3-diazetidine-2-one, bis-imidazolidin-4-one, bis –tetrazole, bis –thiazolidin-4-one, bis -1,3- oxazepine
الملخص باللغة العربية
حضرت مركبات حلقة غير متجانسة جديده احادية على حلقتين متشابهتين رباعية وخماسية وسباعية ابتداءا من قواعد شف(1a,b) ان تفاعل قواعد شف . كلوروبنزالديهايد-4بنزالديهايد او -ثنائي مثيل-ن,ن-4التي حضرت من مفاعلة اورثو توليد ين مع
ادى الى تكون المشتقات ) 1(سيانات او مثيل ايزوسيانات او نفثايل ايزوسيانات كما في مخطط –مع مولين من ايزو ثايو (2-4 a,b) .5( ون -4 –تحضيرمشتقات ثنائي اميدازوليدين ) 2(ي حين تضمن المخطط فa,b ( وثنائي تترازول)6a,b ( وثنائي
مع مولين من الكاليسين او ازايد الصوديوم او حامض 1a,b) (من خالل مفاعلة قواعد شف ) 7a,b( ون – 4-ثايوزولدين حضرت من مفاعلة قواعد شف المذكورة مع انهايدريدات ) 3( المخطط في12a,b-8) (اما مركبات . الثايوكاليكولك على التوالي
. شخصت جميع المركبات الناتجة باستخدام الطرق الطيفية والفيزيائية. مختلفة .كما درست الفعالية البايولوجية لهذه المركبات ضد انواع معينة من البكتريا وادرجت النتائج المستحصلة في البحث
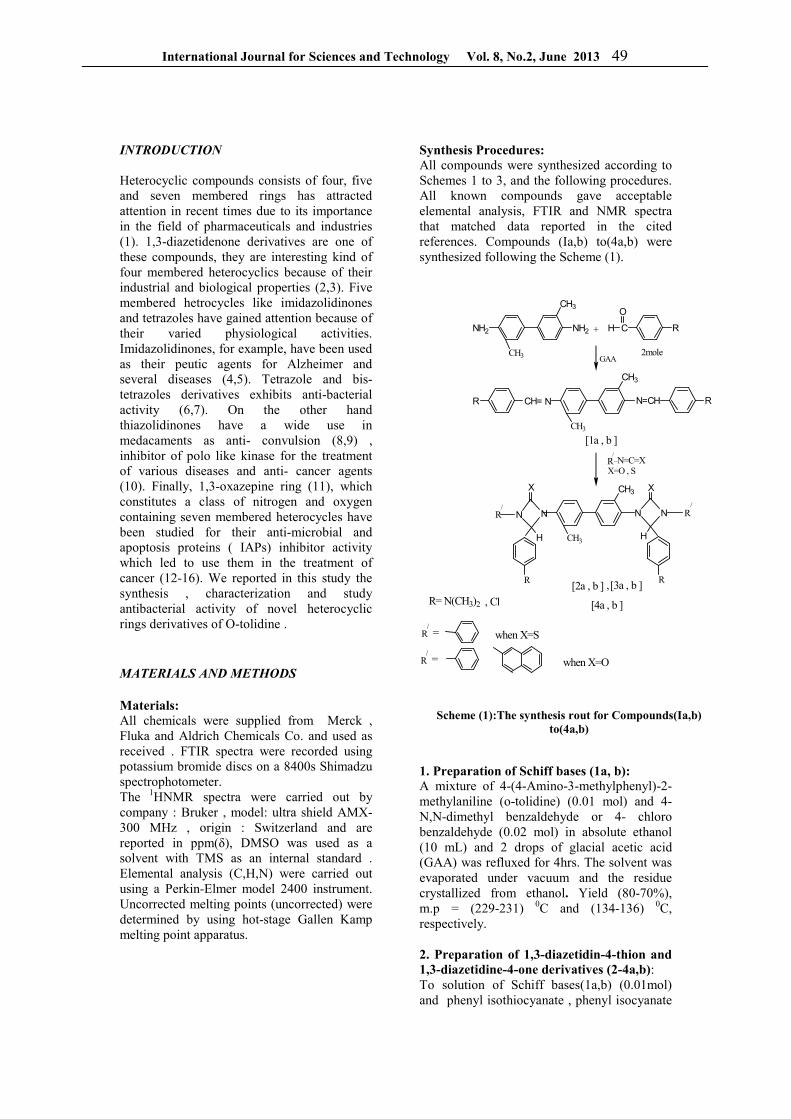
International Journal for Sciences and Technology Vol. 8, No.2, June 2013 49
+
CH3
CH3
NH2NH2 RC
2mole
CH3
CH3
N=N RCHCH=R
CH3
CH3
GAA
R= N(CH3)2
R/_N=C=X
X=O , S
R
R
/
/
=
R
R/
N N
X
H
N N
X
H
R
[1a , b ]
[2a , b ] [3a , b ]
[4a , b ]
,
O
H
, Cl
R/
=
when X=S
when X=O
INTRODUCTION
Heterocyclic compounds consists of four, five and seven membered rings has attracted attention in recent times due to its importance in the field of pharmaceuticals and industries (1). 1,3-diazetidenone derivatives are one of these compounds, they are interesting kind of four membered heterocyclics because of their industrial and biological properties (2,3). Five membered hetrocycles like imidazolidinones and tetrazoles have gained attention because of their varied physiological activities. Imidazolidinones, for example, have been used as their peutic agents for Alzheimer and several diseases (4,5). Tetrazole and bis-tetrazoles derivatives exhibits anti-bacterial activity (6,7). On the other hand thiazolidinones have a wide use in medacaments as anti- convulsion (8,9) , inhibitor of polo like kinase for the treatment of various diseases and anti- cancer agents (10). Finally, 1,3-oxazepine ring (11), which constitutes a class of nitrogen and oxygen containing seven membered heterocycles have been studied for their anti-microbial and apoptosis proteins ( IAPs) inhibitor activity which led to use them in the treatment of cancer (12-16). We reported in this study the synthesis , characterization and study antibacterial activity of novel heterocyclic rings derivatives of O-tolidine .
MATERIALS AND METHODS
Materials: All chemicals were supplied from Merck , Fluka and Aldrich Chemicals Co. and used as received . FTIR spectra were recorded using potassium bromide discs on a 8400s Shimadzu spectrophotometer. The 1HNMR spectra were carried out by company : Bruker , model: ultra shield AMX-300 MHz , origin : Switzerland and are reported in ppm(δ), DMSO was used as a solvent with TMS as an internal standard . Elemental analysis (C,H,N) were carried out using a Perkin-Elmer model 2400 instrument. Uncorrected melting points (uncorrected) were determined by using hot-stage Gallen Kamp melting point apparatus.
Synthesis Procedures: All compounds were synthesized according to Schemes 1 to 3, and the following procedures. All known compounds gave acceptable elemental analysis, FTIR and NMR spectra that matched data reported in the cited references. Compounds (Ia,b) to(4a,b) were synthesized following the Scheme (1).
Scheme (1):The synthesis rout for Compounds(Ia,b) to(4a,b)
1. Preparation of Schiff bases (1a, b): A mixture of 4-(4-Amino-3-methylphenyl)-2-methylaniline (o-tolidine) (0.01 mol) and 4-N,N-dimethyl benzaldehyde or 4- chloro benzaldehyde (0.02 mol) in absolute ethanol (10 mL) and 2 drops of glacial acetic acid (GAA) was refluxed for 4hrs. The solvent was evaporated under vacuum and the residue crystallized from ethanol. Yield (80-70%), m.p = (229-231) 0C and (134-136) 0C, respectively. 2. Preparation of 1,3-diazetidin-4-thion and 1,3-diazetidine-4-one derivatives (2-4a,b): To solution of Schiff bases(1a,b) (0.01mol) and phenyl isothiocyanate , phenyl isocyanate
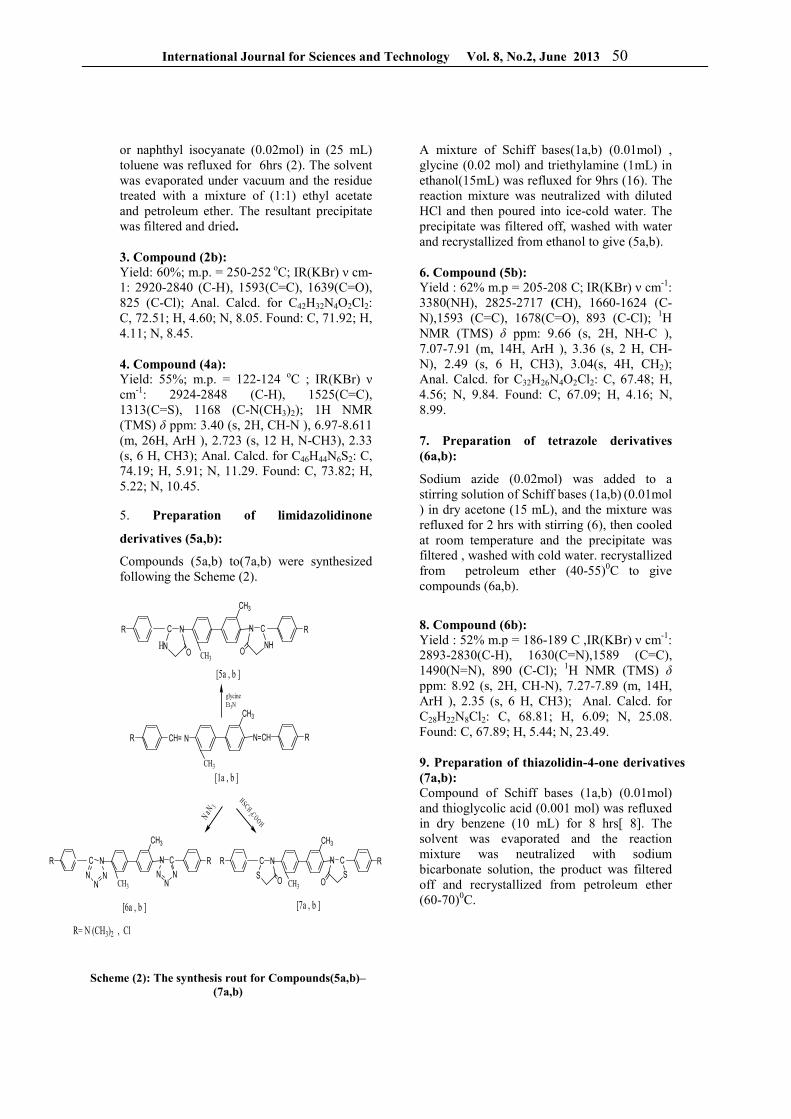
International Journal for Sciences and Technology Vol. 8, No.2, June 2013 50
or naphthyl isocyanate (0.02mol) in (25 mL) toluene was refluxed for 6hrs (2). The solvent was evaporated under vacuum and the residue treated with a mixture of (1:1) ethyl acetate and petroleum ether. The resultant precipitate was filtered and dried. 3. Compound (2b): Yield: 60%; m.p. = 250-252 oC; IR(KBr) ν cm-1: 2920-2840 (C-H), 1593(C=C), 1639(C=O), 825 (C-Cl); Anal. Calcd. for C42H32N4O2Cl2: C, 72.51; H, 4.60; N, 8.05. Found: C, 71.92; H, 4.11; N, 8.45. 4. Compound (4a): Yield: 55%; m.p. = 122-124 oC ; IR(KBr) ν cm-1: 2924-2848 (C-H), 1525(C=C), 1313(C=S), 1168 (C-N(CH3)2); 1H NMR (TMS) δ ppm: 3.40 (s, 2H, CH-N ), 6.97-8.611 (m, 26H, ArH ), 2.723 (s, 12 H, N-CH3), 2.33 (s, 6 H, CH3); Anal. Calcd. for C46H44N6S2: C, 74.19; H, 5.91; N, 11.29. Found: C, 73.82; H, 5.22; N, 10.45. 5. Preparation of limidazolidinone
derivatives (5a,b):
Compounds (5a,b) to(7a,b) were synthesized following the Scheme (2).
CH3
CH3
N=N RCHCH=R
[1a , b ]
[6a , b ] [7a , b ]
CH3
CH3
RR
NH
CN
O
C
N
N
OH
[5a , b ]
glycineEt3N
CH3
CH3
RR
S
CN
O
C
S
N
O
CH3
CH3
RR
NN
CN
N
C
NNN
N
HSCH2 COOH
NaN
3
R= N (CH3)2 , Cl
Scheme (2): The synthesis rout for Compounds(5a,b)– (7a,b)
A mixture of Schiff bases(1a,b) (0.01mol) , glycine (0.02 mol) and triethylamine (1mL) in ethanol(15mL) was refluxed for 9hrs (16). The reaction mixture was neutralized with diluted HCl and then poured into ice-cold water. The precipitate was filtered off, washed with water and recrystallized from ethanol to give (5a,b). 6. Compound (5b): Yield : 62% m.p = 205-208 C; IR(KBr) ν cm-1: 3380(NH), 2825-2717 (CH), 1660-1624 (C-N),1593 (C=C), 1678(C=O), 893 (C-Cl); 1H NMR (TMS) δ ppm: 9.66 (s, 2H, NH-C ), 7.07-7.91 (m, 14H, ArH ), 3.36 (s, 2 H, CH-N), 2.49 (s, 6 H, CH3), 3.04(s, 4H, CH2); Anal. Calcd. for C32H26N4O2Cl2: C, 67.48; H, 4.56; N, 9.84. Found: C, 67.09; H, 4.16; N, 8.99. 7. Preparation of tetrazole derivatives (6a,b):
Sodium azide (0.02mol) was added to a stirring solution of Schiff bases (1a,b) (0.01mol
) in dry acetone (15 mL), and the mixture was refluxed for 2 hrs with stirring (6), then cooled at room temperature and the precipitate was filtered , washed with cold water. recrystallized from petroleum ether (40-55)0C to give compounds (6a,b).
8. Compound (6b): Yield : 52% m.p = 186-189 C ,IR(KBr) ν cm-1: 2893-2830(C-H), 1630(C=N),1589 (C=C), 1490(N=N), 890 (C-Cl); 1H NMR (TMS) δ
ppm: 8.92 (s, 2H, CH-N), 7.27-7.89 (m, 14H, ArH ), 2.35 (s, 6 H, CH3); Anal. Calcd. for C28H22N8Cl2: C, 68.81; H, 6.09; N, 25.08. Found: C, 67.89; H, 5.44; N, 23.49. 9. Preparation of thiazolidin-4-one derivatives (7a,b): Compound of Schiff bases (1a,b) (0.01mol) and thioglycolic acid (0.001 mol) was refluxed in dry benzene (10 mL) for 8 hrs[ 8]. The solvent was evaporated and the reaction mixture was neutralized with sodium bicarbonate solution, the product was filtered off and recrystallized from petroleum ether (60-70)0C.
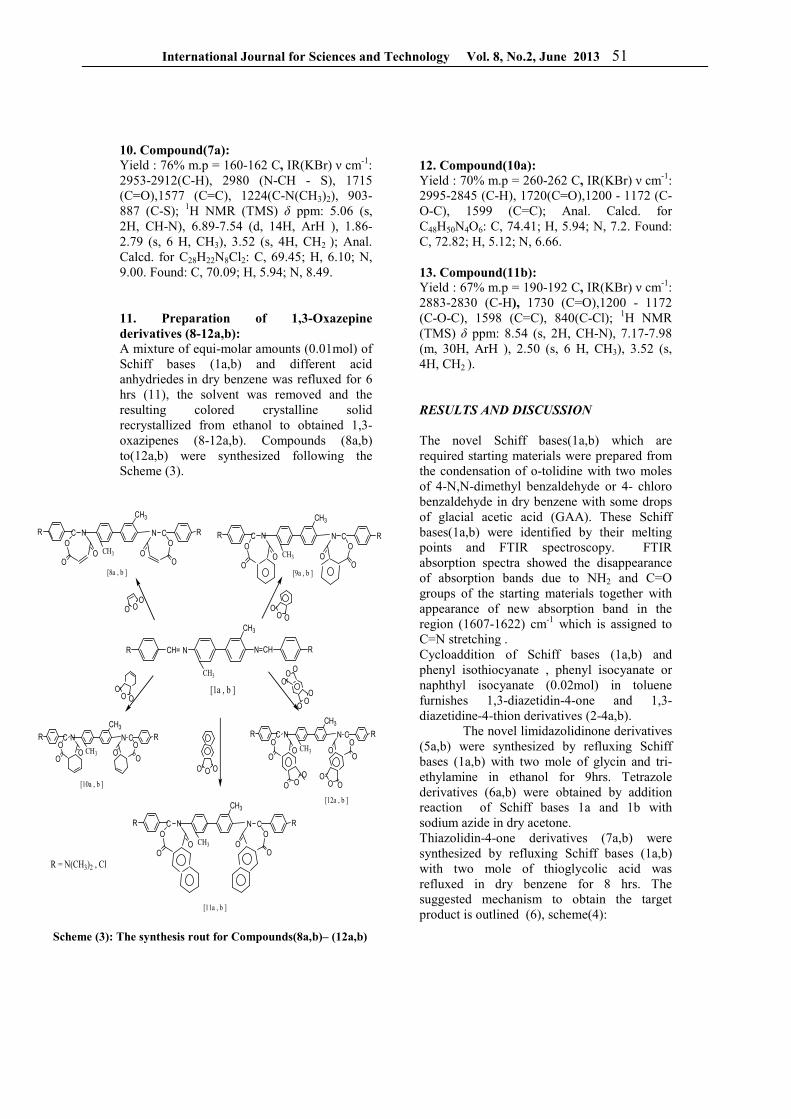
International Journal for Sciences and Technology Vol. 8, No.2, June 2013 51
10. Compound(7a): Yield : 76% m.p = 160-162 C, IR(KBr) ν cm-1: 2953-2912(C-H), 2980 (N-CH - S), 1715 (C=O),1577 (C=C), 1224(C-N(CH3)2), 903-887 (C-S); 1H NMR (TMS) δ ppm: 5.06 (s, 2H, CH-N), 6.89-7.54 (d, 14H, ArH ), 1.86-2.79 (s, 6 H, CH3), 3.52 (s, 4H, CH2 ); Anal. Calcd. for C28H22N8Cl2: C, 69.45; H, 6.10; N, 9.00. Found: C, 70.09; H, 5.94; N, 8.49. 11. Preparation of 1,3-Oxazepine derivatives (8-12a,b): A mixture of equi-molar amounts (0.01mol) of Schiff bases (1a,b) and different acid anhydriedes in dry benzene was refluxed for 6 hrs (11), the solvent was removed and the resulting colored crystalline solid recrystallized from ethanol to obtained 1,3-oxazipenes (8-12a,b). Compounds (8a,b) to(12a,b) were synthesized following the Scheme (3).
CH3
CH3
N=N RCHCH=R
[1a , b ]
CH3
CH3
RR
[9a , b ]
O
NC
OO
O
N C
OO
CH3
CH3
RR
[8a , b ]
O
NC
OO
O
N C
OO
CH3
CH3
RR
[10a , b ]
ONC
OO
ON C
OO
CH3
CH3
RR
O
NC
OO
O
N C
OO
CH3
CH3
RRO
NC
OO
ON C
OO
OO
O O OO
[11a , b ]
[12a , b ]
OO
OO O
O
O OO
O OO
OO
O
OO
O
R = N(CH3)2 , Cl
Scheme (3): The synthesis rout for Compounds(8a,b)– (12a,b)
12. Compound(10a): Yield : 70% m.p = 260-262 C, IR(KBr) ν cm-1: 2995-2845 (C-H), 1720(C=O),1200 - 1172 (C-O-C), 1599 (C=C); Anal. Calcd. for C48H50N4O6: C, 74.41; H, 5.94; N, 7.2. Found: C, 72.82; H, 5.12; N, 6.66. 13. Compound(11b): Yield : 67% m.p = 190-192 C, IR(KBr) ν cm-1: 2883-2830 (C-H), 1730 (C=O),1200 - 1172 (C-O-C), 1598 (C=C), 840(C-Cl); 1H NMR (TMS) δ ppm: 8.54 (s, 2H, CH-N), 7.17-7.98 (m, 30H, ArH ), 2.50 (s, 6 H, CH3), 3.52 (s, 4H, CH2 ). RESULTS AND DISCUSSION
The novel Schiff bases(1a,b) which are required starting materials were prepared from the condensation of o-tolidine with two moles of 4-N,N-dimethyl benzaldehyde or 4- chloro benzaldehyde in dry benzene with some drops of glacial acetic acid (GAA). These Schiff bases(1a,b) were identified by their melting points and FTIR spectroscopy. FTIR absorption spectra showed the disappearance of absorption bands due to NH2 and C=O groups of the starting materials together with appearance of new absorption band in the region (1607-1622) cm-1 which is assigned to C=N stretching . Cycloaddition of Schiff bases (1a,b) and phenyl isothiocyanate , phenyl isocyanate or naphthyl isocyanate (0.02mol) in toluene furnishes 1,3-diazetidin-4-one and 1,3-diazetidine-4-thion derivatives (2-4a,b). The novel limidazolidinone derivatives (5a,b) were synthesized by refluxing Schiff bases (1a,b) with two mole of glycin and tri-ethylamine in ethanol for 9hrs. Tetrazole derivatives (6a,b) were obtained by addition reaction of Schiff bases 1a and 1b with sodium azide in dry acetone. Thiazolidin-4-one derivatives (7a,b) were synthesized by refluxing Schiff bases (1a,b) with two mole of thioglycolic acid was refluxed in dry benzene for 8 hrs. The suggested mechanism to obtain the target product is outlined (6), scheme(4):
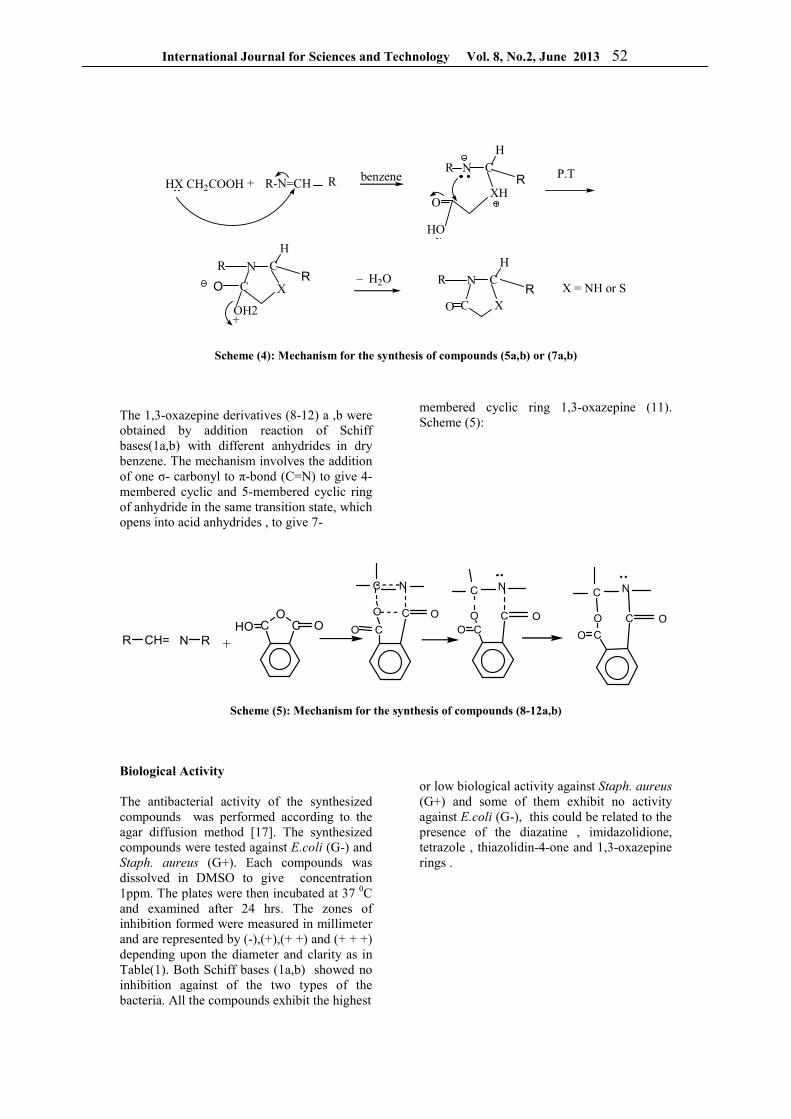
International Journal for Sciences and Technology Vol. 8, No.2, June 2013 52
R-N=CH
H
CN
XCO
R
HX CH2COOH
H
CNR
XH
R
HO
O
_ H2O
+P.Tbenzene
R
H
CN
X
R
C
+OH2
RO
R
X = NH or S
Scheme (4): Mechanism for the synthesis of compounds (5a,b) or (7a,b)
The 1,3-oxazepine derivatives (8-12) a ,b were obtained by addition reaction of Schiff bases(1a,b) with different anhydrides in dry benzene. The mechanism involves the addition of one σ- carbonyl to π-bond (C=N) to give 4-membered cyclic and 5-membered cyclic ring of anhydride in the same transition state, which opens into acid anhydrides , to give 7-
membered cyclic ring 1,3-oxazepine (11). Scheme (5):
Scheme (5): Mechanism for the synthesis of compounds (8-12a,b)
Biological Activity The antibacterial activity of the synthesized compounds was performed according to the agar diffusion method [17]. The synthesized compounds were tested against E.coli (G-) and Staph. aureus (G+). Each compounds was dissolved in DMSO to give concentration 1ppm. The plates were then incubated at 37 0C and examined after 24 hrs. The zones of inhibition formed were measured in millimeter and are represented by (-),(+),(+ +) and (+ + +) depending upon the diameter and clarity as in Table(1). Both Schiff bases (1a,b) showed no inhibition against of the two types of the bacteria. All the compounds exhibit the highest
or low biological activity against Staph. aureus (G+) and some of them exhibit no activity against E.coli (G-), this could be related to the presence of the diazatine , imidazolidione, tetrazole , thiazolidin-4-one and 1,3-oxazepine rings .
RNR CH=
COCHO O
O C
C N C
O C
N
CO
OO
CO
C
O C
N
CO
O
+
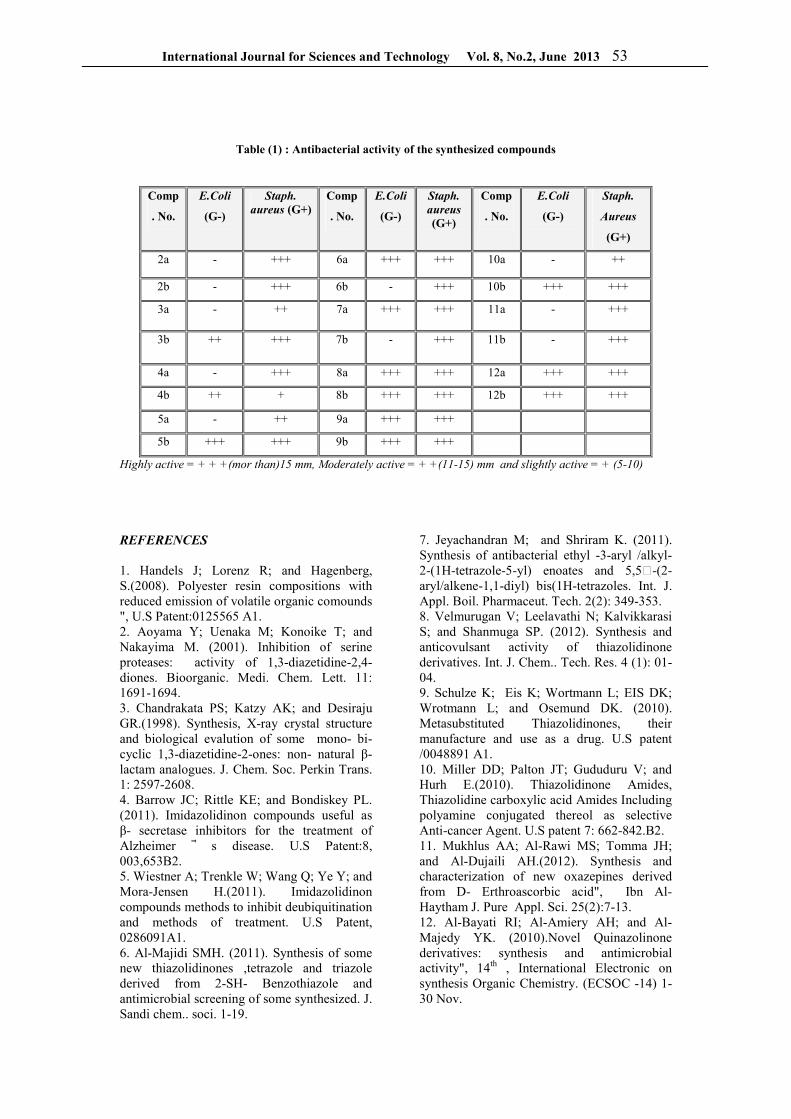
International Journal for Sciences and Technology Vol. 8, No.2, June 2013 53
Table (1) : Antibacterial activity of the synthesized compounds
Comp
. No.
E.Coli
(G-)
Staph.
aureus (G+) Comp
. No.
E.Coli
(G-)
Staph.
aureus (G+)
Comp
. No.
E.Coli
(G-)
Staph.
Aureus
(G+)
2a - +++ 6a +++ +++ 10a - ++
2b - +++ 6b - +++ 10b +++ +++
3a - ++ 7a +++ +++ 11a - +++
3b ++ +++ 7b - +++ 11b - +++
4a - +++ 8a +++ +++ 12a +++ +++
4b ++ + 8b +++ +++ 12b +++ +++
5a - ++ 9a +++ +++
5b +++ +++ 9b +++ +++
Highly active = + + +(mor than)15 mm, Moderately active = + +(11-15) mm and slightly active = + (5-10)
REFERENCES
1. Handels J; Lorenz R; and Hagenberg, S.(2008). Polyester resin compositions with reduced emission of volatile organic comounds ", U.S Patent:0125565 A1. 2. Aoyama Y; Uenaka M; Konoike T; and Nakayima M. (2001). Inhibition of serine proteases: activity of 1,3-diazetidine-2,4-diones. Bioorganic. Medi. Chem. Lett. 11: 1691-1694. 3. Chandrakata PS; Katzy AK; and Desiraju GR.(1998). Synthesis, X-ray crystal structure and biological evalution of some mono- bi- cyclic 1,3-diazetidine-2-ones: non- natural β-lactam analogues. J. Chem. Soc. Perkin Trans. 1: 2597-2608. 4. Barrow JC; Rittle KE; and Bondiskey PL. (2011). Imidazolidinon compounds useful as β- secretase inhibitors for the treatment of Alzheimer s disease. U.S Patent:8, 003,653B2. 5. Wiestner A; Trenkle W; Wang Q; Ye Y; and Mora-Jensen H.(2011). Imidazolidinon compounds methods to inhibit deubiquitination and methods of treatment. U.S Patent, 0286091A1. 6. Al-Majidi SMH. (2011). Synthesis of some new thiazolidinones ,tetrazole and triazole derived from 2-SH- Benzothiazole and antimicrobial screening of some synthesized. J. Sandi chem.. soci. 1-19.
7. Jeyachandran M; and Shriram K. (2011). Synthesis of antibacterial ethyl -3-aryl /alkyl-2-(1H-tetrazole-5-yl) enoates and 5,5ʹ-(2-aryl/alkene-1,1-diyl) bis(1H-tetrazoles. Int. J. Appl. Boil. Pharmaceut. Tech. 2(2): 349-353. 8. Velmurugan V; Leelavathi N; Kalvikkarasi S; and Shanmuga SP. (2012). Synthesis and anticovulsant activity of thiazolidinone derivatives. Int. J. Chem.. Tech. Res. 4 (1): 01-04. 9. Schulze K; Eis K; Wortmann L; EIS DK; Wrotmann L; and Osemund DK. (2010). Metasubstituted Thiazolidinones, their manufacture and use as a drug. U.S patent /0048891 A1. 10. Miller DD; Palton JT; Gududuru V; and Hurh E.(2010). Thiazolidinone Amides, Thiazolidine carboxylic acid Amides Including polyamine conjugated thereol as selective Anti-cancer Agent. U.S patent 7: 662-842.B2. 11. Mukhlus AA; Al-Rawi MS; Tomma JH; and Al-Dujaili AH.(2012). Synthesis and characterization of new oxazepines derived from D- Erthroascorbic acid", Ibn Al- Haytham J. Pure Appl. Sci. 25(2):7-13. 12. Al-Bayati RI; Al-Amiery AH; and Al-Majedy YK. (2010).Novel Quinazolinone derivatives: synthesis and antimicrobial activity", 14th , International Electronic on synthesis Organic Chemistry. (ECSOC -14) 1-30 Nov.
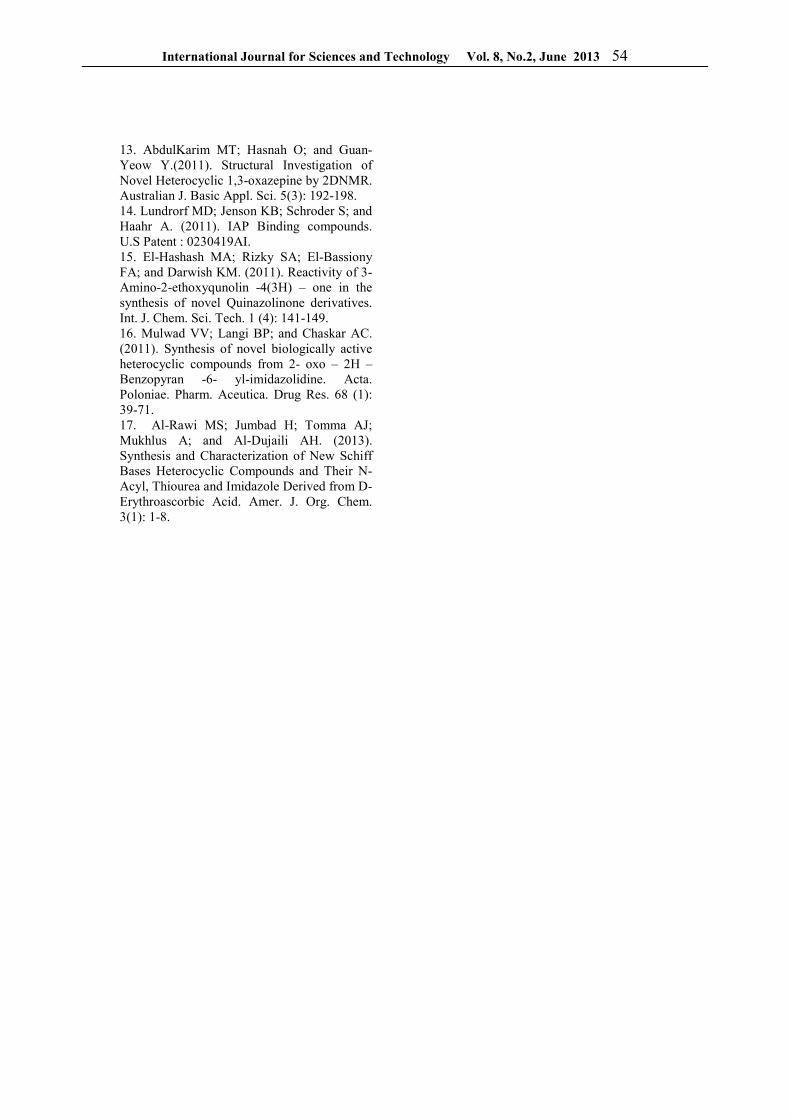
International Journal for Sciences and Technology Vol. 8, No.2, June 2013 54
13. AbdulKarim MT; Hasnah O; and Guan-Yeow Y.(2011). Structural Investigation of Novel Heterocyclic 1,3-oxazepine by 2DNMR. Australian J. Basic Appl. Sci. 5(3): 192-198. 14. Lundrorf MD; Jenson KB; Schroder S; and Haahr A. (2011). IAP Binding compounds. U.S Patent : 0230419AI. 15. El-Hashash MA; Rizky SA; El-Bassiony FA; and Darwish KM. (2011). Reactivity of 3-Amino-2-ethoxyqunolin -4(3H) – one in the synthesis of novel Quinazolinone derivatives. Int. J. Chem. Sci. Tech. 1 (4): 141-149. 16. Mulwad VV; Langi BP; and Chaskar AC. (2011). Synthesis of novel biologically active heterocyclic compounds from 2- oxo – 2H – Benzopyran -6- yl-imidazolidine. Acta. Poloniae. Pharm. Aceutica. Drug Res. 68 (1): 39-71. 17. Al-Rawi MS; Jumbad H; Tomma AJ; Mukhlus A; and Al-Dujaili AH. (2013). Synthesis and Characterization of New Schiff Bases Heterocyclic Compounds and Their N-Acyl, Thiourea and Imidazole Derived from D-Erythroascorbic Acid. Amer. J. Org. Chem. 3(1): 1-8.
International Journal for Sciences and Technology Vol. 8, No.2, June 2013 55
Synthesis and characterization of some new thiazine-4-ones containing 1,3,4-
thiadiazole moiety
Ruwaidah S. Seed *, Ali H. Samir, and Khalid F. Ali Dept. of Chemistry / Ibn -Al-Haithem College of Education for pure science / Baghdad University/
Iraq.
ABSTRACT
2-amino-5-mercapto-1,3,4-thiadiazole [I] were prepared by the cyclization of thiosemecarbazide with carbon disulphide and anhydrous sodium carbonate in ethanol as a solvent. The reaction of compound [I] with ethyl iodide yielded 2- amino-5-thioethyl- 1,3,4- thiadiazole [II]. Compound [II] was reacted with different aromatic aldehydes to yieled 2-[(substituted benzyliden ) amino] -5- thioethyl- 1,3,4- thiadiazole [III]a-c. The Schiff ,s bases (III) were found to react with 2-mercapto benzoic acid in the triethyl amine to give 3-[ 5-( ethylthio) -1,3,4- thiadiazol-2-yl] -2,3- dihydro- 2- (aryl) benzo [e] [1,3] thiazine -4-one [IV]a-c . The structures of the newly synthesized compounds were confirmed by physical properties and spectral (FT-IR, 1H-NMR) analysis. * This paper is extracted from master thesis of the first author.
الملخص باللغة العربية
بتحولق الثايوسميكاربازايد مع ثنائي كبريتيد الكاربون بوجود [I] ثياديازول -4و3و1 - مركبتو-5 - امينو-2المركب تم تحضير - ثايوايثايل-5- امينو -2 مع يوديد االثيل يعطي المركب [I]تفاعل المركب . كاربونات الصوديوم الالمائية وفي مذيب كحولي
امينو ) بنزلدين معوض ( [-2 مع الديهايدات اروماتية مختلفة اعطى المركب [II] تفاعل المركب . [II] ثياديازول -4و3و1مركبتو حامض البنزويك بوجود ثالثي -2وجد ان قواعد شف تتفاعل مع . ] a-c[III ثياديازول -4و3و1-ثايو ايثايل -5-]
[e] [بنزو) اريل (-2- داي هايدرو-3و2- ] يل-2-ثياديازول – 4و3و1 –) ثايوايثايل ( – 5 [ -3اثيل امين لتعطي المركب تراكيب المركبات الجديدة المحضرة من خالل القياسات الفيزياوية واطياف ، تم تشخيص a- c[IV] ون-4- ثيازين ]3و 1]
.االشعة تحت الحمراء وطيف الرنين النووي المغناطيسي
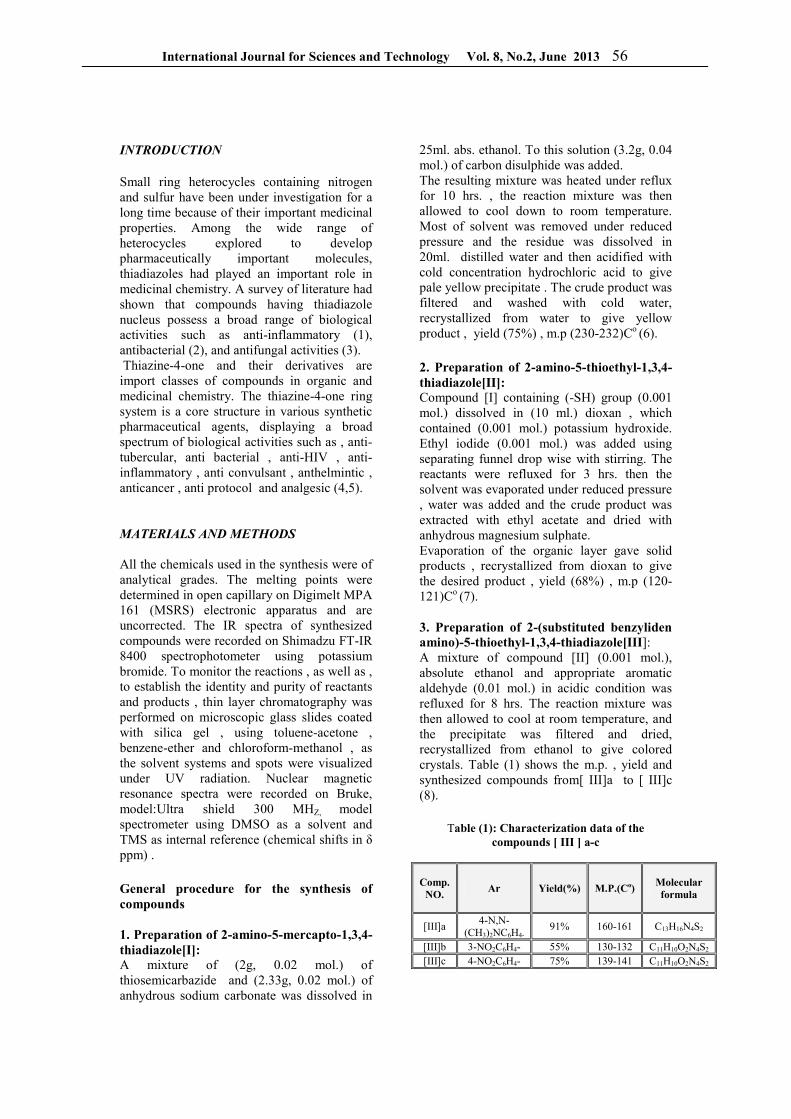
International Journal for Sciences and Technology Vol. 8, No.2, June 2013 56
INTRODUCTION
Small ring heterocycles containing nitrogen and sulfur have been under investigation for a long time because of their important medicinal properties. Among the wide range of heterocycles explored to develop pharmaceutically important molecules, thiadiazoles had played an important role in medicinal chemistry. A survey of literature had shown that compounds having thiadiazole nucleus possess a broad range of biological activities such as anti-inflammatory (1), antibacterial (2), and antifungal activities (3). Thiazine-4-one and their derivatives are import classes of compounds in organic and medicinal chemistry. The thiazine-4-one ring system is a core structure in various synthetic pharmaceutical agents, displaying a broad spectrum of biological activities such as , anti-tubercular, anti bacterial , anti-HIV , anti-inflammatory , anti convulsant , anthelmintic , anticancer , anti protocol and analgesic (4,5). MATERIALS AND METHODS
All the chemicals used in the synthesis were of analytical grades. The melting points were determined in open capillary on Digimelt MPA 161 (MSRS) electronic apparatus and are uncorrected. The IR spectra of synthesized compounds were recorded on Shimadzu FT-IR 8400 spectrophotometer using potassium bromide. To monitor the reactions , as well as , to establish the identity and purity of reactants and products , thin layer chromatography was performed on microscopic glass slides coated with silica gel , using toluene-acetone , benzene-ether and chloroform-methanol , as the solvent systems and spots were visualized under UV radiation. Nuclear magnetic resonance spectra were recorded on Bruke, model:Ultra shield 300 MHZ, model spectrometer using DMSO as a solvent and TMS as internal reference (chemical shifts in δ ppm) . General procedure for the synthesis of compounds 1. Preparation of 2-amino-5-mercapto-1,3,4-thiadiazole[I]: A mixture of (2g, 0.02 mol.) of thiosemicarbazide and (2.33g, 0.02 mol.) of anhydrous sodium carbonate was dissolved in
25ml. abs. ethanol. To this solution (3.2g, 0.04 mol.) of carbon disulphide was added. The resulting mixture was heated under reflux for 10 hrs. , the reaction mixture was then allowed to cool down to room temperature. Most of solvent was removed under reduced pressure and the residue was dissolved in 20ml. distilled water and then acidified with cold concentration hydrochloric acid to give pale yellow precipitate . The crude product was filtered and washed with cold water, recrystallized from water to give yellow product , yield (75%) , m.p (230-232)Co (6). 2. Preparation of 2-amino-5-thioethyl-1,3,4-thiadiazole[II]: Compound [I] containing (-SH) group (0.001 mol.) dissolved in (10 ml.) dioxan , which contained (0.001 mol.) potassium hydroxide. Ethyl iodide (0.001 mol.) was added using separating funnel drop wise with stirring. The reactants were refluxed for 3 hrs. then the solvent was evaporated under reduced pressure , water was added and the crude product was extracted with ethyl acetate and dried with anhydrous magnesium sulphate. Evaporation of the organic layer gave solid products , recrystallized from dioxan to give the desired product , yield (68%) , m.p (120-121)Co (7). 3. Preparation of 2-(substituted benzyliden amino)-5-thioethyl-1,3,4-thiadiazole[III]: A mixture of compound [II] (0.001 mol.), absolute ethanol and appropriate aromatic aldehyde (0.01 mol.) in acidic condition was refluxed for 8 hrs. The reaction mixture was then allowed to cool at room temperature, and the precipitate was filtered and dried, recrystallized from ethanol to give colored crystals. Table (1) shows the m.p. , yield and synthesized compounds from[ III]a to [ III]c (8).
Table (1): Characterization data of the compounds [ III ] a-c
Comp. NO.
Ar Yield(%) M.P.(Co) Molecular formula
[III]a 4-N,N-
(CH3)2NC6H4- 91% 160-161 C13H16N4S2
[III]b 3-NO2C6H4- 55% 130-132 C11H10O2N4S2
[III]c 4-NO2C6H4- 75% 139-141 C11H10O2N4S2
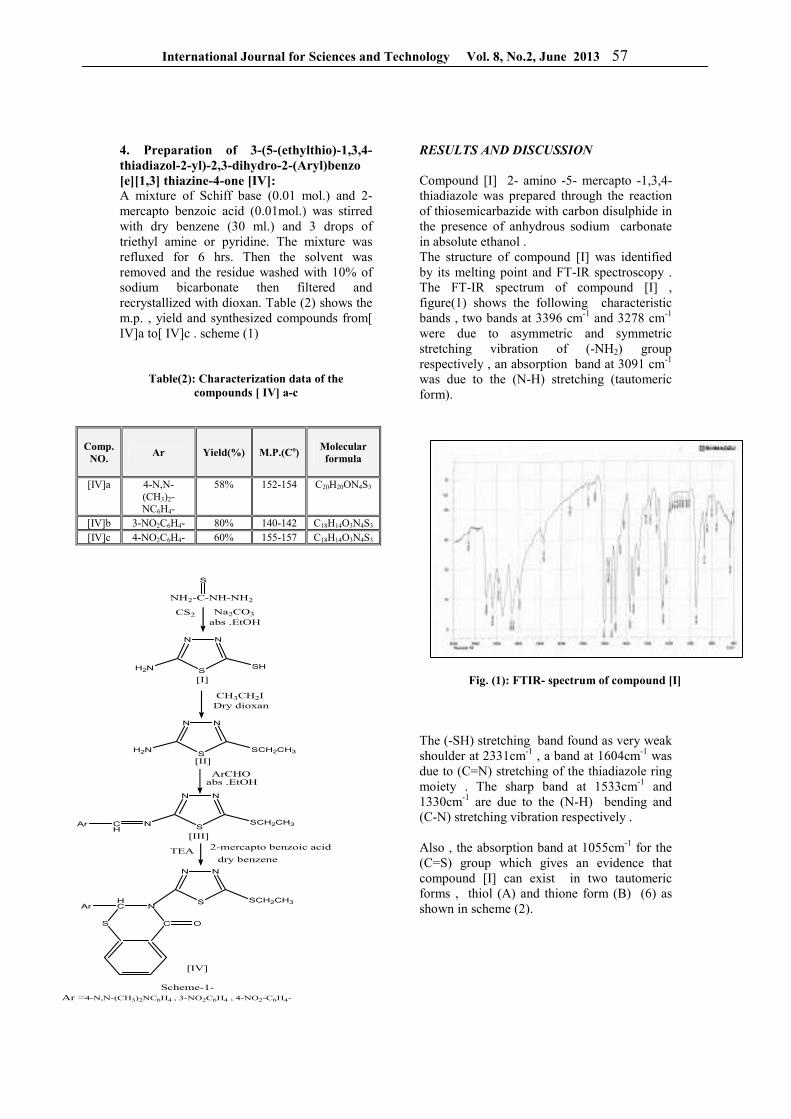
International Journal for Sciences and Technology Vol. 8, No.2, June 2013 57
4. Preparation of 3-(5-(ethylthio)-1,3,4-thiadiazol-2-yl)-2,3-dihydro-2-(Aryl)benzo [e][1,3] thiazine-4-one [IV]: A mixture of Schiff base (0.01 mol.) and 2-mercapto benzoic acid (0.01mol.) was stirred with dry benzene (30 ml.) and 3 drops of triethyl amine or pyridine. The mixture was refluxed for 6 hrs. Then the solvent was removed and the residue washed with 10% of sodium bicarbonate then filtered and recrystallized with dioxan. Table (2) shows the m.p. , yield and synthesized compounds from[ IV]a to[ IV]c . scheme (1)
Table(2): Characterization data of the compounds [ IV] a-c
Comp. NO.
Ar Yield(%) M.P.(Co) Molecular formula
[IV]a 4-N,N-(CH3)2-NC6H4-
58% 152-154 C20H20ON4S3
[IV]b 3-NO2C6H4- 80% 140-142 C18H14O3N4S3
[IV]c 4-NO2C6H4- 60% 155-157 C18H14O3N4S3
S
Na2CO3
abs .EtOHCS2
NN
SH2N SH
[I]
CH3CH2IDry dioxan
NN
SH2N SCH2CH3
[II]
ArCHOabs .EtOH
NN
SN SCH2CH3C
HAr
[III]
TEA 2-mercapto benzoic acid
dry benzene
NN
S SCH2CH3
Scheme-1-Ar =4-N,N-(CH3)2NC6H4 , 3-NO2C6H4 , 4-NO2-C6H4-
C
NHC
S
Ar
O
NH2-C-NH-NH2
[IV]
RESULTS AND DISCUSSION
Compound [I] 2- amino -5- mercapto -1,3,4-thiadiazole was prepared through the reaction of thiosemicarbazide with carbon disulphide in the presence of anhydrous sodium carbonate in absolute ethanol . The structure of compound [I] was identified by its melting point and FT-IR spectroscopy . The FT-IR spectrum of compound [I] , figure(1) shows the following characteristic bands , two bands at 3396 cm-1 and 3278 cm-1 were due to asymmetric and symmetric stretching vibration of (-NH2) group respectively , an absorption band at 3091 cm-1 was due to the (N-H) stretching (tautomeric form).
Fig. (1): FTIR- spectrum of compound [I]
The (-SH) stretching band found as very weak shoulder at 2331cm-1 , a band at 1604cm-1 was due to (C=N) stretching of the thiadiazole ring moiety . The sharp band at 1533cm-1 and 1330cm-1 are due to the (N-H) bending and (C-N) stretching vibration respectively . Also , the absorption band at 1055cm-1 for the (C=S) group which gives an evidence that compound [I] can exist in two tautomeric forms , thiol (A) and thione form (B) (6) as shown in scheme (2).
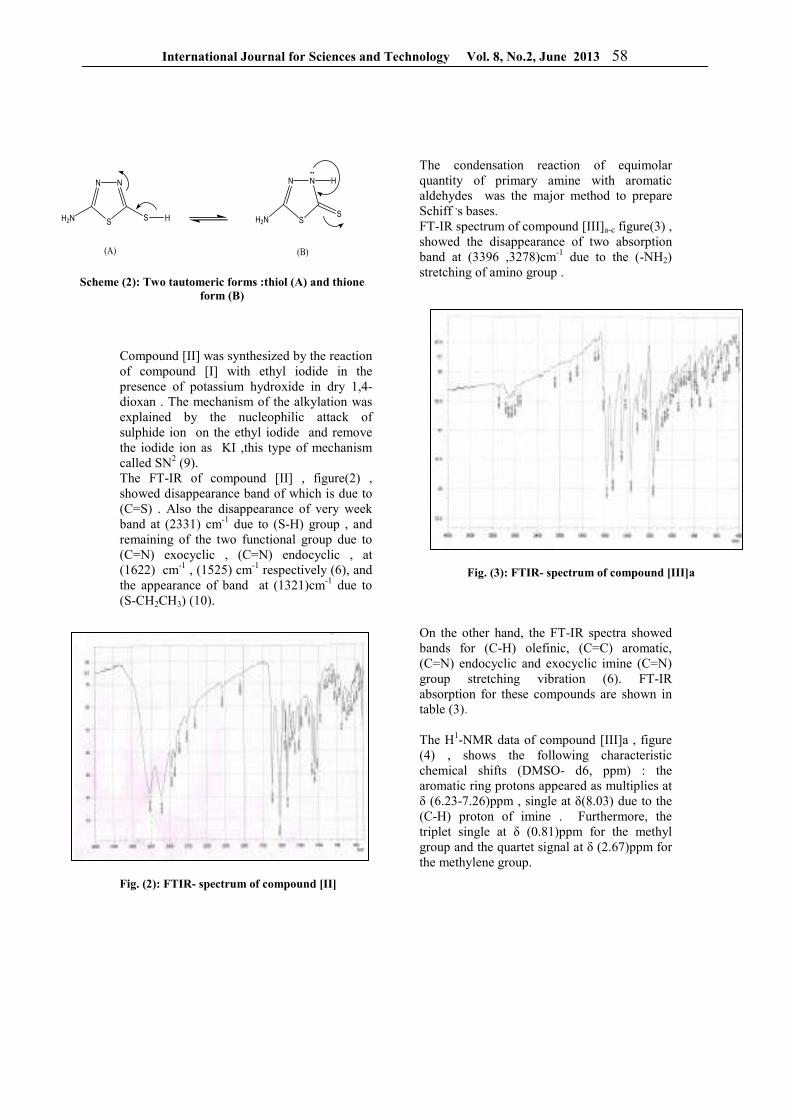
International Journal for Sciences and Technology Vol. 8, No.2, June 2013 58
NN
SSH2N H
(A)
NN
SH2NS
H
..
(B)
Scheme (2): Two tautomeric forms :thiol (A) and thione form (B)
Compound [II] was synthesized by the reaction of compound [I] with ethyl iodide in the presence of potassium hydroxide in dry 1,4- dioxan . The mechanism of the alkylation was explained by the nucleophilic attack of sulphide ion on the ethyl iodide and remove the iodide ion as KI ,this type of mechanism called SN2 (9). The FT-IR of compound [II] , figure(2) , showed disappearance band of which is due to (C=S) . Also the disappearance of very week band at (2331) cm-1 due to (S-H) group , and remaining of the two functional group due to (C=N) exocyclic , (C=N) endocyclic , at (1622) cm-1 , (1525) cm-1 respectively (6), and the appearance of band at (1321)cm-1 due to (S-CH2CH3) (10).
Fig. (2): FTIR- spectrum of compound [II]
The condensation reaction of equimolar quantity of primary amine with aromatic aldehydes was the major method to prepare Schiff ,s bases. FT-IR spectrum of compound [III]a-c figure(3) , showed the disappearance of two absorption band at (3396 ,3278)cm-1 due to the (-NH2) stretching of amino group .
Fig. (3): FTIR- spectrum of compound [III]a
On the other hand, the FT-IR spectra showed bands for (C-H) olefinic, (C=C) aromatic, (C=N) endocyclic and exocyclic imine (C=N) group stretching vibration (6). FT-IR absorption for these compounds are shown in table (3). The H1-NMR data of compound [III]a , figure (4) , shows the following characteristic chemical shifts (DMSO- d6, ppm) : the aromatic ring protons appeared as multiplies at δ (6.23-7.26)ppm , single at δ(8.03) due to the (C-H) proton of imine . Furthermore, the triplet single at δ (0.81)ppm for the methyl group and the quartet signal at δ (2.67)ppm for the methylene group.
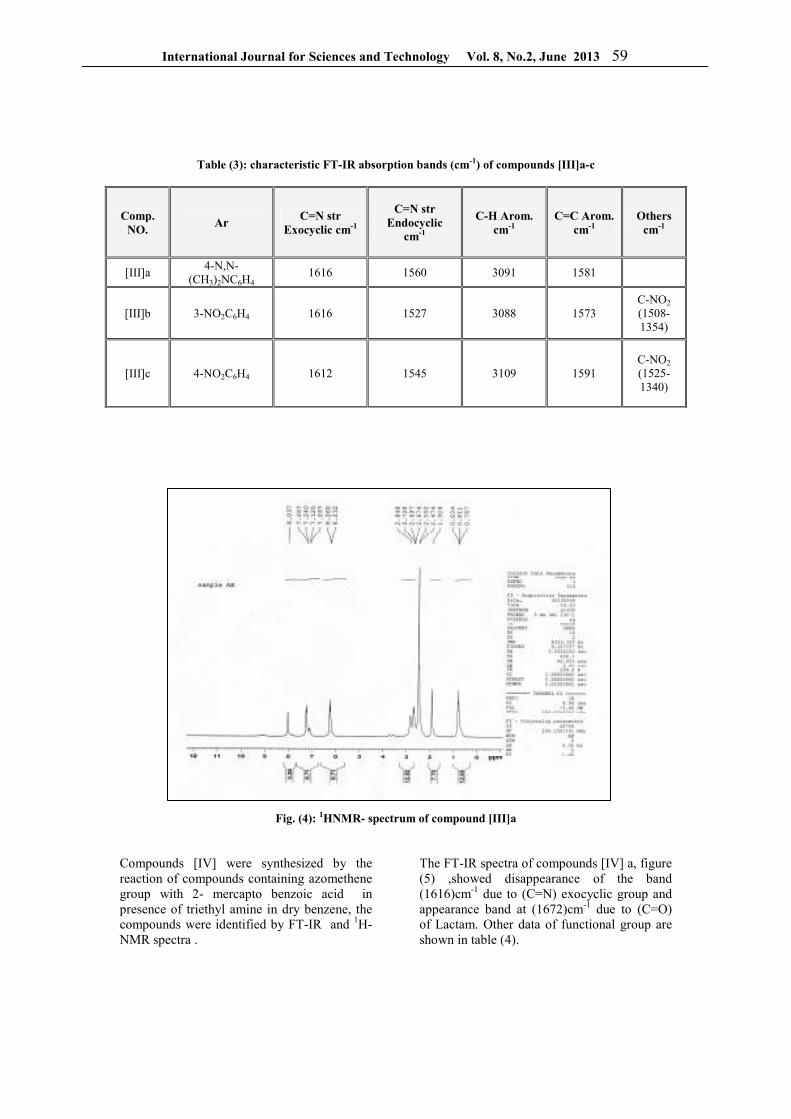
International Journal for Sciences and Technology Vol. 8, No.2, June 2013 59
Table (3): characteristic FT-IR absorption bands (cm-1) of compounds [III]a-c
Fig. (4): 1HNMR- spectrum of compound [III]a Compounds [IV] were synthesized by the reaction of compounds containing azomethene group with 2- mercapto benzoic acid in presence of triethyl amine in dry benzene, the compounds were identified by FT-IR and 1H-NMR spectra .
The FT-IR spectra of compounds [IV] a, figure (5) ,showed disappearance of the band (1616)cm-1 due to (C=N) exocyclic group and appearance band at (1672)cm-1 due to (C=O) of Lactam. Other data of functional group are shown in table (4).
Comp. NO.
Ar C=N str
Exocyclic cm-1
C=N str Endocyclic
cm-1
C-H Arom. cm-1
C=C Arom. cm-1
Others cm-1
[III]a 4-N,N-
(CH3)2NC6H4 1616 1560 3091 1581
[III]b 3-NO2C6H4 1616 1527 3088 1573 C-NO2 (1508-1354)
[III]c 4-NO2C6H4 1612 1545 3109 1591 C-NO2
(1525-1340)
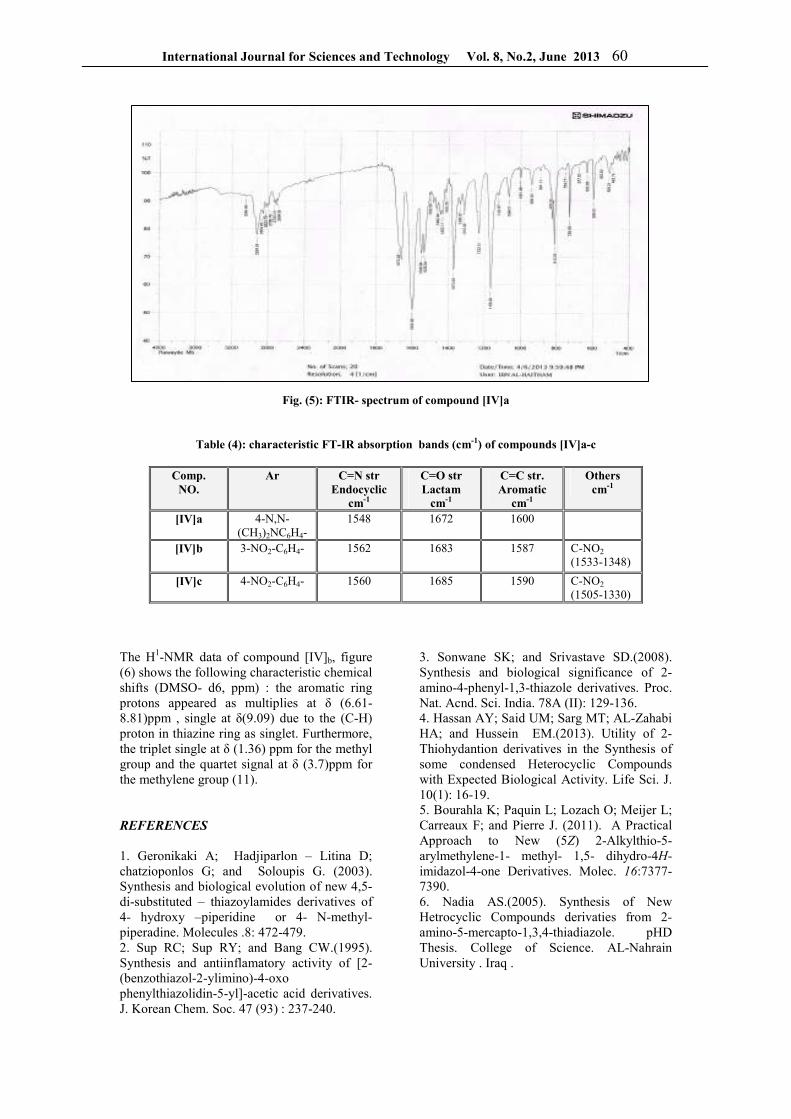
International Journal for Sciences and Technology Vol. 8, No.2, June 2013 60
Fig. (5): FTIR- spectrum of compound [IV]a
Table (4): characteristic FT-IR absorption bands (cm-1) of compounds [IV]a-c
Comp. NO.
Ar C=N str Endocyclic
cm-1
C=O str Lactam
cm-1
C=C str. Aromatic
cm-1
Others cm-1
[IV]a 4-N,N-(CH3)2NC6H4-
1548 1672 1600
[IV]b 3-NO2-C6H4- 1562 1683 1587 C-NO2 (1533-1348)
[IV]c 4-NO2-C6H4- 1560 1685 1590 C-NO2
(1505-1330)
The H1-NMR data of compound [IV]b, figure (6) shows the following characteristic chemical shifts (DMSO- d6, ppm) : the aromatic ring protons appeared as multiplies at δ (6.61-8.81)ppm , single at δ(9.09) due to the (C-H) proton in thiazine ring as singlet. Furthermore, the triplet single at δ (1.36) ppm for the methyl group and the quartet signal at δ (3.7)ppm for the methylene group (11). REFERENCES
1. Geronikaki A; Hadjiparlon – Litina D; chatzioponlos G; and Soloupis G. (2003). Synthesis and biological evolution of new 4,5- di-substituted – thiazoylamides derivatives of 4- hydroxy –piperidine or 4- N-methyl-piperadine. Molecules .8: 472-479. 2. Sup RC; Sup RY; and Bang CW.(1995). Synthesis and antiinflamatory activity of [2-(benzothiazol-2-ylimino)-4-oxo phenylthiazolidin-5-yl]-acetic acid derivatives. J. Korean Chem. Soc. 47 (93) : 237-240.
3. Sonwane SK; and Srivastave SD.(2008). Synthesis and biological significance of 2-amino-4-phenyl-1,3-thiazole derivatives. Proc. Nat. Acnd. Sci. India. 78A (II): 129-136. 4. Hassan AY; Said UM; Sarg MT; AL-Zahabi HA; and Hussein EM.(2013). Utility of 2-Thiohydantion derivatives in the Synthesis of some condensed Heterocyclic Compounds with Expected Biological Activity. Life Sci. J. 10(1): 16-19. 5. Bourahla K; Paquin L; Lozach O; Meijer L; Carreaux F; and Pierre J. (2011). A Practical Approach to New (5Z) 2-Alkylthio-5-arylmethylene-1- methyl- 1,5- dihydro-4H-imidazol-4-one Derivatives. Molec. 16:7377-7390. 6. Nadia AS.(2005). Synthesis of New Hetrocyclic Compounds derivaties from 2-amino-5-mercapto-1,3,4-thiadiazole. pHD Thesis. College of Science. AL-Nahrain University . Iraq .
International Journal for Sciences and Technology Vol. 8, No.2, June 2013 61
7. Mahmoud MJ; and Mustafa IF.(1996). Synthesis and characterization of some dioxadiazole and their methyl and ethyl thioether. Mu,tah J. Res. Stud. 11(5)1022. 8. Mahmoud MJ; AL-Rubaiy ZM; AL-Kubaisy RK; Najafi MM; and AL-Jumaily HM. (2004). Synthesis and antimicrobial evaluation of 2-amino-5-thiol-1,3,4-thiadiazole derivatives. Ibn AL-Haitham J. pure Appl . Sci.17(1) :103-110. 9. AL-Rubaiy ZM. (1998). Synthesis and characterization of some triazole derivatives and their methyl, ethyl and propyl thioethers. Master thesis. College of Education, Baghdad University, Iraq. 10. Mustafa IF. (1997). Synthesis and characterization of some oxadiazole and triazole derivatives. Mu,tah J. Res. Stud. 12(3):144 . 11. Majeed IY. (2011). Synthesis of new Heterocyclic Compounds includings four to seven membered rings with evaluating of antibacterial activity for some of theme. PhD. thesis. College of Education. Baghdad University.
International Journal for Sciences and Technology Vol. 8, No.2, June 2013 62
Comparative study of Fracture resistance of endodotically treated teeth restored
with some types of cast posts
Haitham Dakhel Dept. of Conservative Dentistry/ College of Dentistry/ Al-Anbar University/ Iraq
ABSTRACT
The current in-vitro study aimed to evaluate and compare the fracture resistance of teeth treated endodontically restored using cast posts cemented with different types of cement. Thirty intact human maxillary central incisors were selected for this study. The crowns were removed and endodontic therapy was done on the roots, which were then prepared to receive cast posts. The cast posts were cemented with zinc phosphate cement (group I), glass ionomer cement (group II),and resin cement (group III). The samples were subjected to compressive fracturing loads by a Zwick testing machine at a cross head speed of 5mm/min., with an angle of 45º to the long axis of each tooth. Results showed that the posts cemented with resin cement exhibited the highest mean value of failure load followed by those cemented with glass ionomer cement, while posts cemented with zinc phosphate cement exhibited the lowest mean value of failure load.
Key Words: Casts post, Resin cement, Glass ionomer cement
الملخص باللغة العربية
تهدف هذه الدراسة المختبرية على تقييم ومقارنة مقاومة االنكسار لالسنان المعالجة بحشوات الجذور واالوتاد المـصبوبة والمثبتـة ثم تم ازالـة التيجـان لجميـع االسـنان . سن بشري سليم في هذه الدراسة 30تم اختيار . بأستخدام انواع مختلفة من مادة االسمنت
بالنسبة للمجموعة االولى تم تثبيت االوتـاد المـصبوبة بأسـتخدام سـمنت . المختارة وعالجها بحشوات الجذور واالوتاد المصبوبة أما اوتاد المجموعة الثالثـة فثبتـت بأسـتخدام , اوتاد المجموعة الثانية تم تثبيتها بأستخدام السمنت الزجاجي االيوني , فوسفات الزنك
ملمتـر فـي 5ميع النماذج عرضت الى احمال ضاغطة كاسرة بأستعمال الة اختبارية تدعى زفك وبـسرعة ج. السمنت الراتنجي اظهرت النتائج ان االوتاد المصبوبة مع السمنت الراتنجي لها اعلى معـدل . درجة من الطول الشاقولي لكل سن45وبزاوية , الدقيقة
بينما االوتاد المصبوبة مع سمنت فوسفات الزنك اظهرت اقـل , جاجي االيوني تحمل للكسر ثم تليها االوتاد المصبوبة مع السمنت الز . معدل تحمل للكسر
International Journal for Sciences and Technology Vol. 8, No.2, June 2013 63
INTRODUCTION
Contemporary endodontic therapy helps patients to retain their teeth even if severely damaged. The restoration of most endodontically treated teeth involves complex and controversial procedures. These teeth have lost significant coronal dentin because of endodontic access or previous dental caries and restoration. Several researches had been described the need for coronoradicular stabilization and numerous post systems and techniques (1). Custom cast posts and cores have been considered the most accepted treatment mode for many years. Later on, the commercial prefabricated posts with plastic core materials have become a common and a popular method for post and core build up (2). Several parameters such as cementing medium, length, diameter, configuration, surface roughness and matrial used in the dowel can affect teeth retention and strength (3). The bond strength of the cementing agents plays an important role in the success of the cast restoration. Zinc phosphate cement despite its lack of adhesion property to tooth structure it is the most selected preferable for cementation of posts for many years (3). However, more new materials such as adhesive resin cements have been advocated for cementation of posts because they bond dentin to metal post and thereby achieve a stronger and more retentive restoration (4). Nowadays, glass ionomer cement with improved mechanical properties and chemical adhesion to tooth structure are used as a cementing medium (5). MATERIALS AND METHODS Thirty intact human maxillary central incisors recently extracted due to periodontal reasons collected form different dental clinic, of comparable root length and width were selected, cleaned and stored in normal saline solution at room temperature through all the time of experimentation. The anatomic crowns of the teeth were removed at the level of cementoenamel junction perpendicular to the long axis of the tooth using diamond bur rotating at a high speed under constant water spray coolant. Endodontic therapy has been done for all teeth, and then post spaces preparation were done using pessoreamers from No.1 to No.6 successively in an increasing order of width
and for a length of 8 mm measured from the coronal end of the root with the aid of a rubber stopper. After that, 1mm gingival chamfer finishing line was done with a diamond chamfer bur on a sound tooth structure. The external surfaces of the roots were carefully notched using diamond fissure bur approximately 3mm from the apex and at 0.5mm depth to provide adequate retention for the teeth in acrylic resin blocks. After that, teeth were embedded in individual blocks of self-curing resin to about 2mm below their coronal ends. Wax pattern of posts (post crowns) were made directly on the prepared teeth using type II blue inlay wax and plastic posts, and then invested with a phosphate bonded investment material and the casting procedure was performed using nickel-chromium casting alloy. After casting, the obtained cast posts were cleaned and smoothed and were carefully fitted into their canal spaces to assure proper seating and fitness, then for each post a groove was made along the side of the post with No.1/4 round bur rotating at a high speed to provide an escape vent for cement during cementation. For all teeth in all groups, post spaces were cleaned with 1ml of 95% ethyl alcohol to remove any residual eugenol contaminantes from the sealer (6), then rinsed with normal saline solution and dried with paper points. 37% phosphoric acid was applied to post spaces for 15 seconds then rinsed thoroughly with water for 30 seconds, dried with paper points and air blower (7). The cast posts and their respective prepared roots were randomly divided into three groups of ten each: Group I: teeth with cast posts cemented using zinc phosphate cement. Group II: teeth with cast posts cemented using glass ionomer cement. Group III: teeth with cast posts cemented using resin cement. The cementation procedure was performed by the same investigator and at a room temperature around 25ºC, and a static load of 5 Kg was used to hold each post in their canals according to the setting time of each cement. The samples were placed in a special mounting fixture, attached to a universal testing machine (Zwick testing machine) (8). A continuously increasing compressive force was applied to the facial cusp in the axio-occlusal line angle, 45 degrees to the long axis of the tooth at a crosshead speed of 5mm/min. until failure (9,10). The data obtained were then statistically evaluated using one way analysis
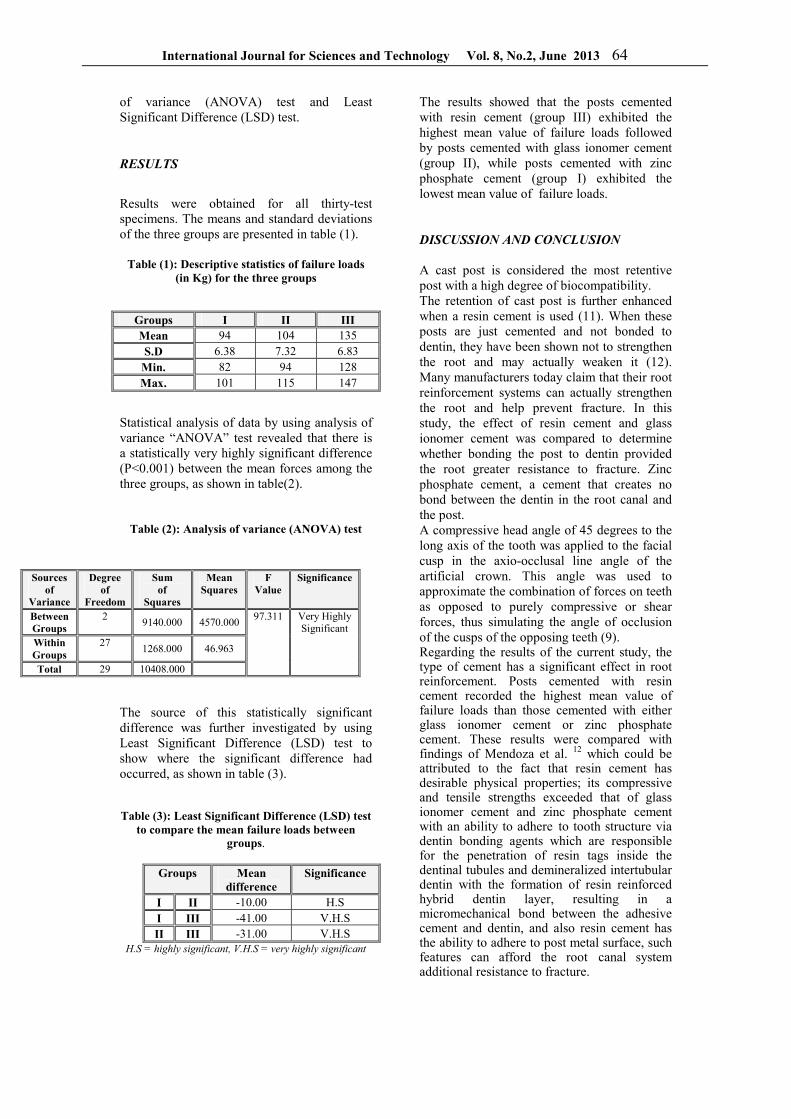
International Journal for Sciences and Technology Vol. 8, No.2, June 2013 64
of variance (ANOVA) test and Least Significant Difference (LSD) test.
RESULTS
Results were obtained for all thirty-test specimens. The means and standard deviations of the three groups are presented in table (1).
Table (1): Descriptive statistics of failure loads (in Kg) for the three groups
Statistical analysis of data by using analysis of variance “ANOVA” test revealed that there is a statistically very highly significant difference (P<0.001) between the mean forces among the three groups, as shown in table(2).
Table (2): Analysis of variance (ANOVA) test
The source of this statistically significant difference was further investigated by using Least Significant Difference (LSD) test to show where the significant difference had occurred, as shown in table (3).
Table (3): Least Significant Difference (LSD) test
to compare the mean failure loads between groups.
Groups Mean
difference Significance
I II -10.00 H.S I III -41.00 V.H.S II III -31.00 V.H.S
H.S = highly significant, V.H.S = very highly significant
The results showed that the posts cemented with resin cement (group III) exhibited the highest mean value of failure loads followed by posts cemented with glass ionomer cement (group II), while posts cemented with zinc phosphate cement (group I) exhibited the lowest mean value of failure loads. DISCUSSION AND CONCLUSION
A cast post is considered the most retentive post with a high degree of biocompatibility. The retention of cast post is further enhanced when a resin cement is used (11). When these posts are just cemented and not bonded to dentin, they have been shown not to strengthen the root and may actually weaken it (12). Many manufacturers today claim that their root reinforcement systems can actually strengthen the root and help prevent fracture. In this study, the effect of resin cement and glass ionomer cement was compared to determine whether bonding the post to dentin provided the root greater resistance to fracture. Zinc phosphate cement, a cement that creates no bond between the dentin in the root canal and the post. A compressive head angle of 45 degrees to the long axis of the tooth was applied to the facial cusp in the axio-occlusal line angle of the artificial crown. This angle was used to approximate the combination of forces on teeth as opposed to purely compressive or shear forces, thus simulating the angle of occlusion of the cusps of the opposing teeth (9). Regarding the results of the current study, the type of cement has a significant effect in root reinforcement. Posts cemented with resin cement recorded the highest mean value of failure loads than those cemented with either glass ionomer cement or zinc phosphate cement. These results were compared with findings of Mendoza et al. 12 which could be attributed to the fact that resin cement has desirable physical properties; its compressive and tensile strengths exceeded that of glass ionomer cement and zinc phosphate cement with an ability to adhere to tooth structure via dentin bonding agents which are responsible for the penetration of resin tags inside the dentinal tubules and demineralized intertubular dentin with the formation of resin reinforced hybrid dentin layer, resulting in a micromechanical bond between the adhesive cement and dentin, and also resin cement has the ability to adhere to post metal surface, such features can afford the root canal system additional resistance to fracture.
Groups I II III Mean 94 104 135 S.D 6.38 7.32 6.83
Min. 82 94 128 Max. 101 115 147
Sources of
Variance
Degree of
Freedom
Sum of
Squares
Mean Squares
F Value
Significance
Between Groups
2 9140.000 4570.000
Within Groups
27 1268.000 46.963
Total 29 10408.000
97.311 Very Highly Significant
International Journal for Sciences and Technology Vol. 8, No.2, June 2013 65
In addition, the results of this study showed that posts cemented with glass ionomer cement recorded higher mean failure loads than posts cemented with zinc phosphate cement. A possible explanation is that the values of tensile strength of glass ionomer cement exceed that of zinc phosphate cement (13) and also the adhesive nature of glass ionomer cement (chemical chelating) can afford root canal system significant additional resistance to fracture.
REFERENCES
1. Morgano SM; Hashem AF; Fotoohi K; and Rose L. (1994). A Nationwide survey of contemporary philosophies and techniques of restoring endodontically treated teeth. J Prosthet Dent 72(3): 259-267. 2. Christensen GJ. (1993). Posts, Cores and Patient Care. J Am Dent Assoc 124(6):86-89. 3. Johnson JK; and Sakamura JS.(1978). Dowel and tensile force. J Prosthet Dent 40(6): 645-649. 4. Liberman R; Ben-Amer A; Ursein M; and Fitzig S. (1989). Conditioning of root canals prior to dowel cementation with composite luting cement and two-dentin adhesive systems. J. Oral. Rehabil. 16: 597-602. 5. Mclean JW; Nicholson JW; and Wilson AD. (1994). Proposed nomenclature for glass ionomer dental cements and related materials. Quintessence Int. 25: 587-589. 6. Tjan AH; and Nemetz H.(1992). Effect of eugenol-containing endodontic sealer on retention of prefabricated posts luted with adhesive composite resin cement. Quintessence Int. 23: 839-844. 7. Utter JD; Wong BH; and Miller BH.(1997). The effect of cementing procedures on retention of prefabricated metal posts. J. Am. Dent. Assoc. 128: 1123-1127. 8. Kahn FH; Rosenberg PA; Schulman A; and Pines M. (1996). Comparison of fatigue for three prefabricated threaded post systems. J. Prosthet. Dent. 75: 148-153. 9. Dean JP; Jeansonne BG; and Sarker NK. (1998). In-vitro evaluation of a carbon fiber post. J. Endod. 24:807-809. 10. Hamdi MJ. (1999). Evaluation the effect of metal etching and type of cement on the retention of cast posts. Master thesis, Department of Conservative Dentistry, College of dentistry, University of Baghdad . 11. Al-Saffar DS.(1996). A comparative study of fracture resistance of freshly endodontically treated teeth restored with cast post or prefabricated post. Master thesis. Department
of conservative dentistry, College of Dentistry, University of Baghdad. 12. Mendoza DB; Eakle WS; Kahl EA; and Ho R.(1997). Root reinforcement with a resin-bonded preformed post. J. Prosthet. Dent.78: 10-15. 13. Craig RG. (1997). Restorative dental materials. 10th ed. St Louis. CV Mosby Ch 8:173-198.
International Journal for Sciences and Technology Vol. 8, No.2, June 2013 66
Analysis Process the TFA of FH Based On Morlet CWT and SPWVD
Jameela L. Abid
AL-Mansor Medical Technical Institute /Iraq
ABSTRACT
Analysis process of the TFA (Time-Frequency Analysis) of frequency hopping signal is presented in this paper. The algorithm that used Morlet Wavelet and SPWVD can detect the frequency hopping signal which effectively by selecting the range of the period and resolution properly, the parameters of frequency hopping signal such as hop duration, time offset and hop frequency can be estimated
Key Words: Wavelet, Frequency hopping signal, SPWVD, TFA
الملخص باللغة العربية
Frequency)لترددات القفز (time-frequency analysis) ) لزمنيتحليل التردد ا(يقدم هذا البحث عملية تحليل لـ Hoppingمويجات المستمرة الموريلت ال الخوارزمية المستخدمة هي حيث كانت(morlet CWT wavelet) وكذلك توزيع
والدقة بشكل وذلك لكشف اشارة ترددات القفز بشكل فعال من خالل تحديد مجال فترة معينة (SPWVD)فايل المصقول -وينكر . صحيح او بشكل مالئم، وكذلك يمكن تخمين المؤشرات الشارة ترددات القفز مثل فترة القفز، فترة التعديل وتردد القفز
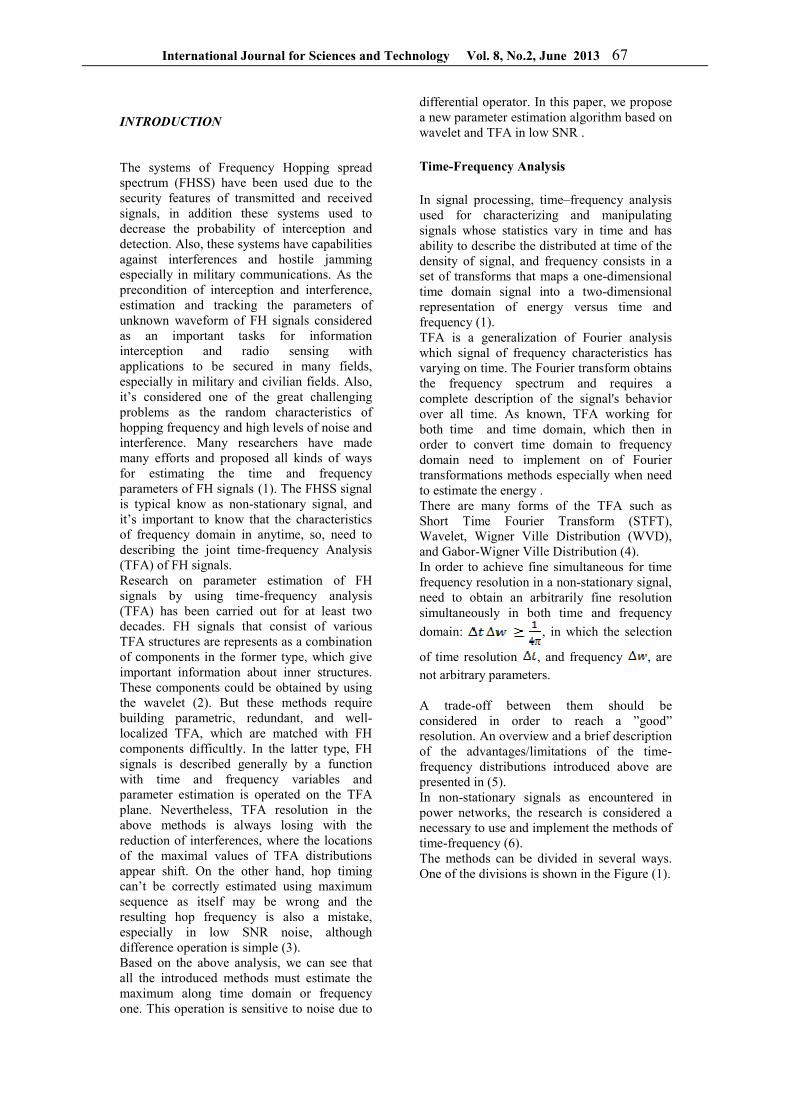
International Journal for Sciences and Technology Vol. 8, No.2, June 2013 67
INTRODUCTION
The systems of Frequency Hopping spread spectrum (FHSS) have been used due to the security features of transmitted and received signals, in addition these systems used to decrease the probability of interception and detection. Also, these systems have capabilities against interferences and hostile jamming especially in military communications. As the precondition of interception and interference, estimation and tracking the parameters of unknown waveform of FH signals considered as an important tasks for information interception and radio sensing with applications to be secured in many fields, especially in military and civilian fields. Also, it’s considered one of the great challenging problems as the random characteristics of hopping frequency and high levels of noise and interference. Many researchers have made many efforts and proposed all kinds of ways for estimating the time and frequency parameters of FH signals (1). The FHSS signal is typical know as non-stationary signal, and it’s important to know that the characteristics of frequency domain in anytime, so, need to describing the joint time-frequency Analysis (TFA) of FH signals. Research on parameter estimation of FH signals by using time-frequency analysis (TFA) has been carried out for at least two decades. FH signals that consist of various TFA structures are represents as a combination of components in the former type, which give important information about inner structures. These components could be obtained by using the wavelet (2). But these methods require building parametric, redundant, and well-localized TFA, which are matched with FH components difficultly. In the latter type, FH signals is described generally by a function with time and frequency variables and parameter estimation is operated on the TFA plane. Nevertheless, TFA resolution in the above methods is always losing with the reduction of interferences, where the locations of the maximal values of TFA distributions appear shift. On the other hand, hop timing can’t be correctly estimated using maximum sequence as itself may be wrong and the resulting hop frequency is also a mistake, especially in low SNR noise, although difference operation is simple (3). Based on the above analysis, we can see that all the introduced methods must estimate the maximum along time domain or frequency one. This operation is sensitive to noise due to
differential operator. In this paper, we propose a new parameter estimation algorithm based on wavelet and TFA in low SNR . Time-Frequency Analysis In signal processing, time–frequency analysis used for characterizing and manipulating signals whose statistics vary in time and has ability to describe the distributed at time of the density of signal, and frequency consists in a set of transforms that maps a one-dimensional time domain signal into a two-dimensional representation of energy versus time and frequency (1). TFA is a generalization of Fourier analysis which signal of frequency characteristics has varying on time. The Fourier transform obtains the frequency spectrum and requires a complete description of the signal's behavior over all time. As known, TFA working for both time and time domain, which then in order to convert time domain to frequency domain need to implement on of Fourier transformations methods especially when need to estimate the energy . There are many forms of the TFA such as Short Time Fourier Transform (STFT), Wavelet, Wigner Ville Distribution (WVD), and Gabor-Wigner Ville Distribution (4). In order to achieve fine simultaneous for time frequency resolution in a non-stationary signal, need to obtain an arbitrarily fine resolution simultaneously in both time and frequency
domain: , in which the selection
of time resolution , and frequency , are not arbitrary parameters. A trade-off between them should be considered in order to reach a ”good” resolution. An overview and a brief description of the advantages/limitations of the time-frequency distributions introduced above are presented in (5). In non-stationary signals as encountered in power networks, the research is considered a necessary to use and implement the methods of time-frequency (6). The methods can be divided in several ways. One of the divisions is shown in the Figure (1).
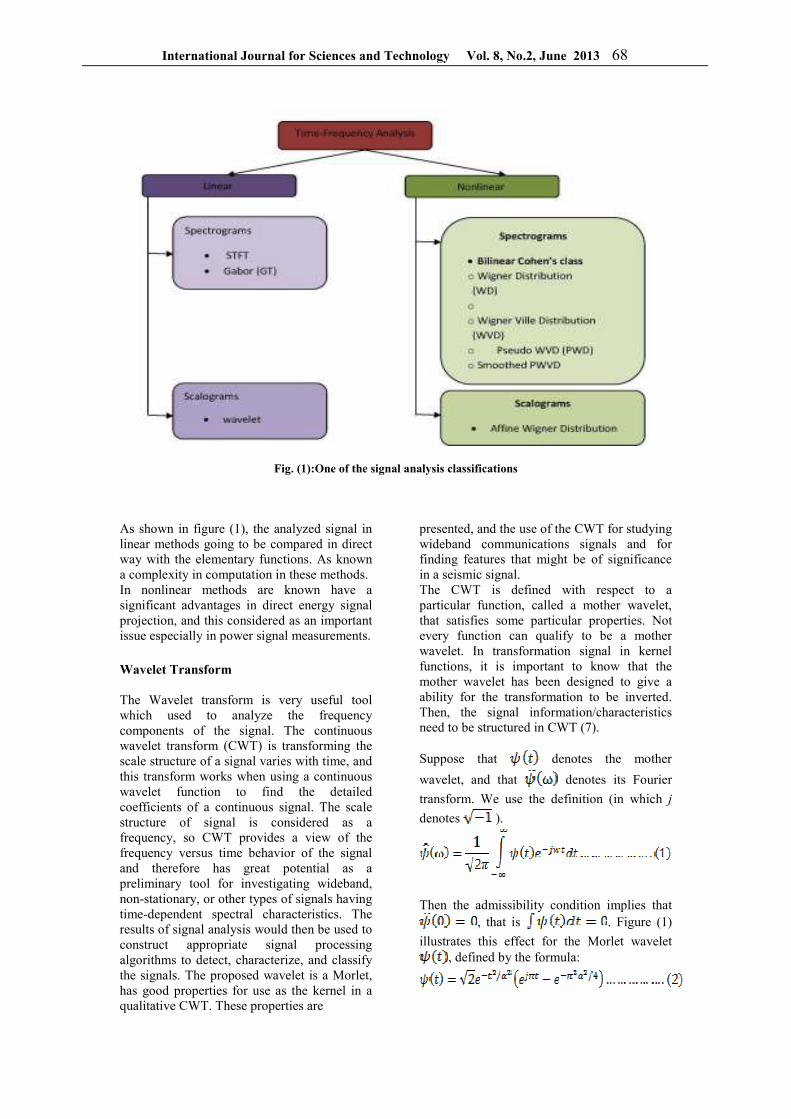
International Journal for Sciences and Technology Vol. 8, No.2, June 2013 68
Fig. (1):One of the signal analysis classifications
As shown in figure (1), the analyzed signal in linear methods going to be compared in direct way with the elementary functions. As known a complexity in computation in these methods. In nonlinear methods are known have a significant advantages in direct energy signal projection, and this considered as an important issue especially in power signal measurements. Wavelet Transform The Wavelet transform is very useful tool which used to analyze the frequency components of the signal. The continuous wavelet transform (CWT) is transforming the scale structure of a signal varies with time, and this transform works when using a continuous wavelet function to find the detailed coefficients of a continuous signal. The scale structure of signal is considered as a frequency, so CWT provides a view of the frequency versus time behavior of the signal and therefore has great potential as a preliminary tool for investigating wideband, non-stationary, or other types of signals having time-dependent spectral characteristics. The results of signal analysis would then be used to construct appropriate signal processing algorithms to detect, characterize, and classify the signals. The proposed wavelet is a Morlet, has good properties for use as the kernel in a qualitative CWT. These properties are
presented, and the use of the CWT for studying wideband communications signals and for finding features that might be of significance in a seismic signal. The CWT is defined with respect to a particular function, called a mother wavelet, that satisfies some particular properties. Not every function can qualify to be a mother wavelet. In transformation signal in kernel functions, it is important to know that the mother wavelet has been designed to give a ability for the transformation to be inverted. Then, the signal information/characteristics need to be structured in CWT (7). Suppose that denotes the mother
wavelet, and that denotes its Fourier
transform. We use the definition (in which j
denotes ).
Then the admissibility condition implies that
, that is . Figure (1)
illustrates this effect for the Morlet wavelet , defined by the formula:
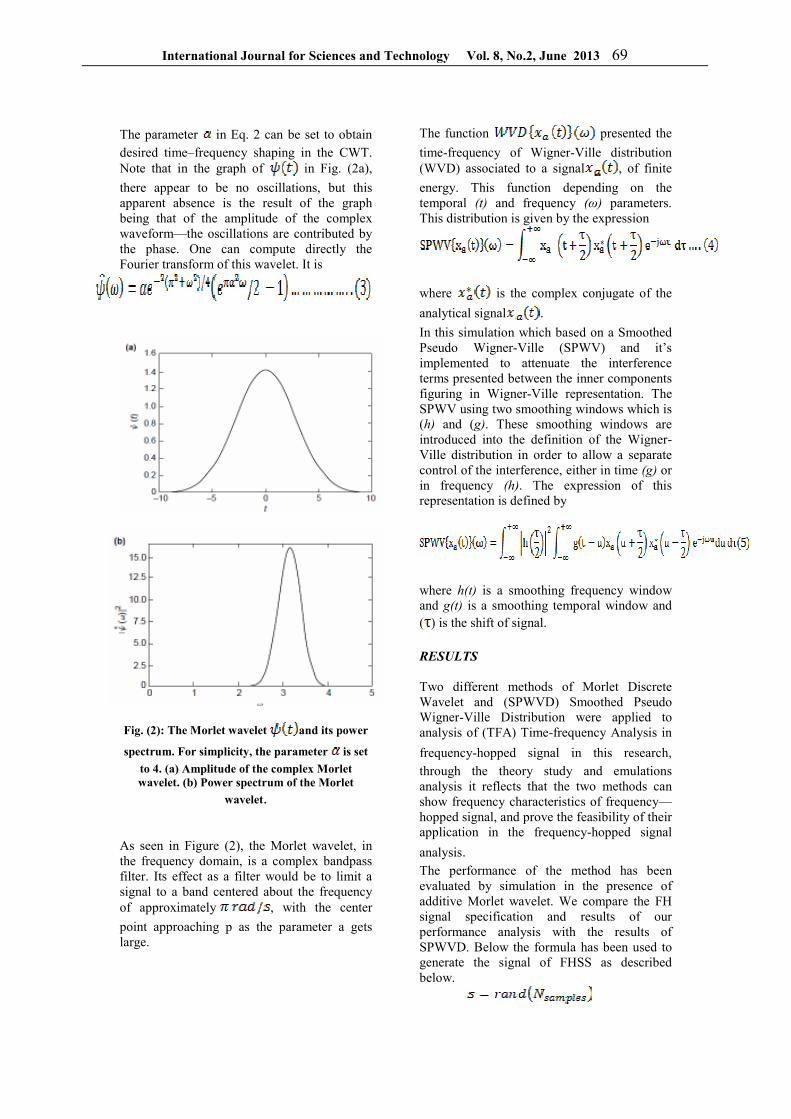
International Journal for Sciences and Technology Vol. 8, No.2, June 2013 69
The parameter in Eq. 2 can be set to obtain desired time–frequency shaping in the CWT. Note that in the graph of in Fig. (2a),
there appear to be no oscillations, but this apparent absence is the result of the graph being that of the amplitude of the complex waveform—the oscillations are contributed by the phase. One can compute directly the Fourier transform of this wavelet. It is
Fig. (2): The Morlet wavelet and its power
spectrum. For simplicity, the parameter is set
to 4. (a) Amplitude of the complex Morlet wavelet. (b) Power spectrum of the Morlet
wavelet. As seen in Figure (2), the Morlet wavelet, in the frequency domain, is a complex bandpass filter. Its effect as a filter would be to limit a signal to a band centered about the frequency of approximately , with the center
point approaching p as the parameter a gets large.
The function presented the
time-frequency of Wigner-Ville distribution (WVD) associated to a signal , of finite
energy. This function depending on the temporal (t) and frequency (ω) parameters. This distribution is given by the expression
where is the complex conjugate of the
analytical signal .
In this simulation which based on a Smoothed Pseudo Wigner-Ville (SPWV) and it’s implemented to attenuate the interference terms presented between the inner components figuring in Wigner-Ville representation. The SPWV using two smoothing windows which is (h) and (g). These smoothing windows are introduced into the definition of the Wigner-Ville distribution in order to allow a separate control of the interference, either in time (g) or in frequency (h). The expression of this representation is defined by
where h(t) is a smoothing frequency window and g(t) is a smoothing temporal window and ( ) is the shift of signal. RESULTS
Two different methods of Morlet Discrete Wavelet and (SPWVD) Smoothed Pseudo Wigner-Ville Distribution were applied to analysis of (TFA) Time-frequency Analysis in
frequency-hopped signal in this research, through the theory study and emulations analysis it reflects that the two methods can show frequency characteristics of frequency—hopped signal, and prove the feasibility of their application in the frequency-hopped signal
analysis. The performance of the method has been evaluated by simulation in the presence of additive Morlet wavelet. We compare the FH signal specification and results of our performance analysis with the results of SPWVD. Below the formula has been used to generate the signal of FHSS as described below.
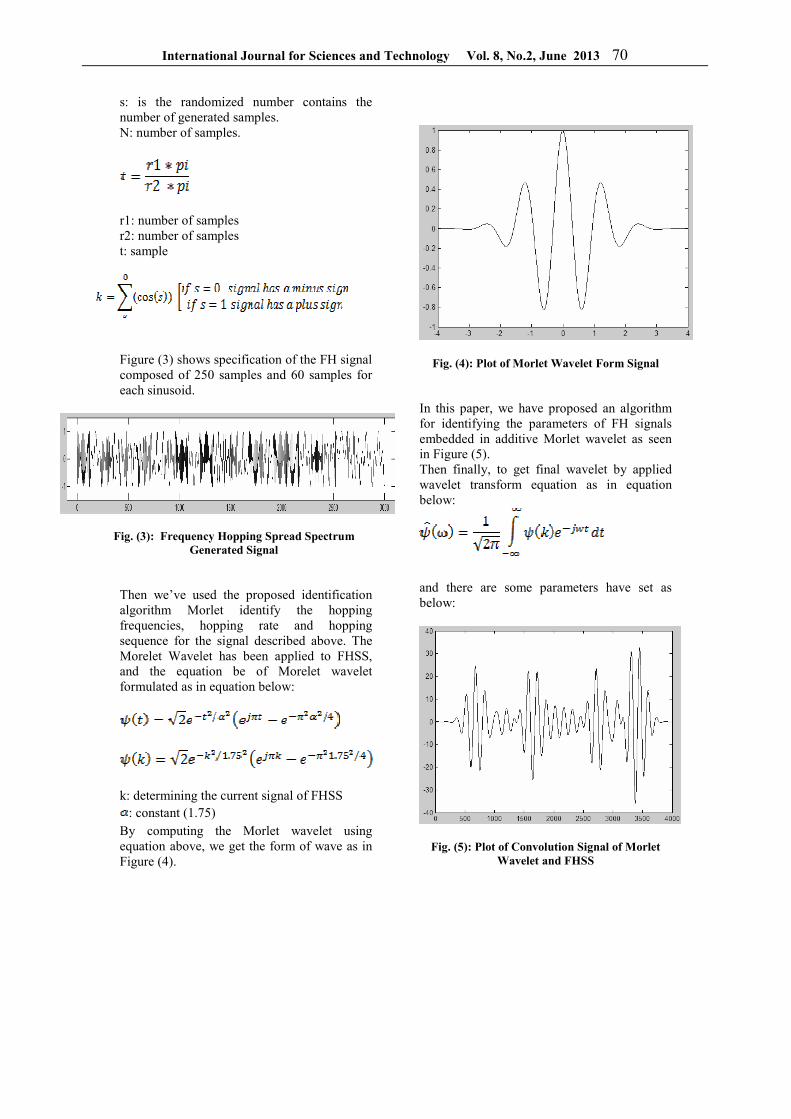
International Journal for Sciences and Technology Vol. 8, No.2, June 2013 70
s: is the randomized number contains the number of generated samples. N: number of samples.
r1: number of samples r2: number of samples t: sample
Figure (3) shows specification of the FH signal composed of 250 samples and 60 samples for each sinusoid.
Fig. (3): Frequency Hopping Spread Spectrum Generated Signal
Then we’ve used the proposed identification algorithm Morlet identify the hopping frequencies, hopping rate and hopping sequence for the signal described above. The Morelet Wavelet has been applied to FHSS, and the equation be of Morelet wavelet formulated as in equation below:
k: determining the current signal of FHSS
: constant (1.75) By computing the Morlet wavelet using equation above, we get the form of wave as in Figure (4).
Fig. (4): Plot of Morlet Wavelet Form Signal In this paper, we have proposed an algorithm for identifying the parameters of FH signals embedded in additive Morlet wavelet as seen in Figure (5). Then finally, to get final wavelet by applied wavelet transform equation as in equation below:
and there are some parameters have set as below:
Fig. (5): Plot of Convolution Signal of Morlet Wavelet and FHSS
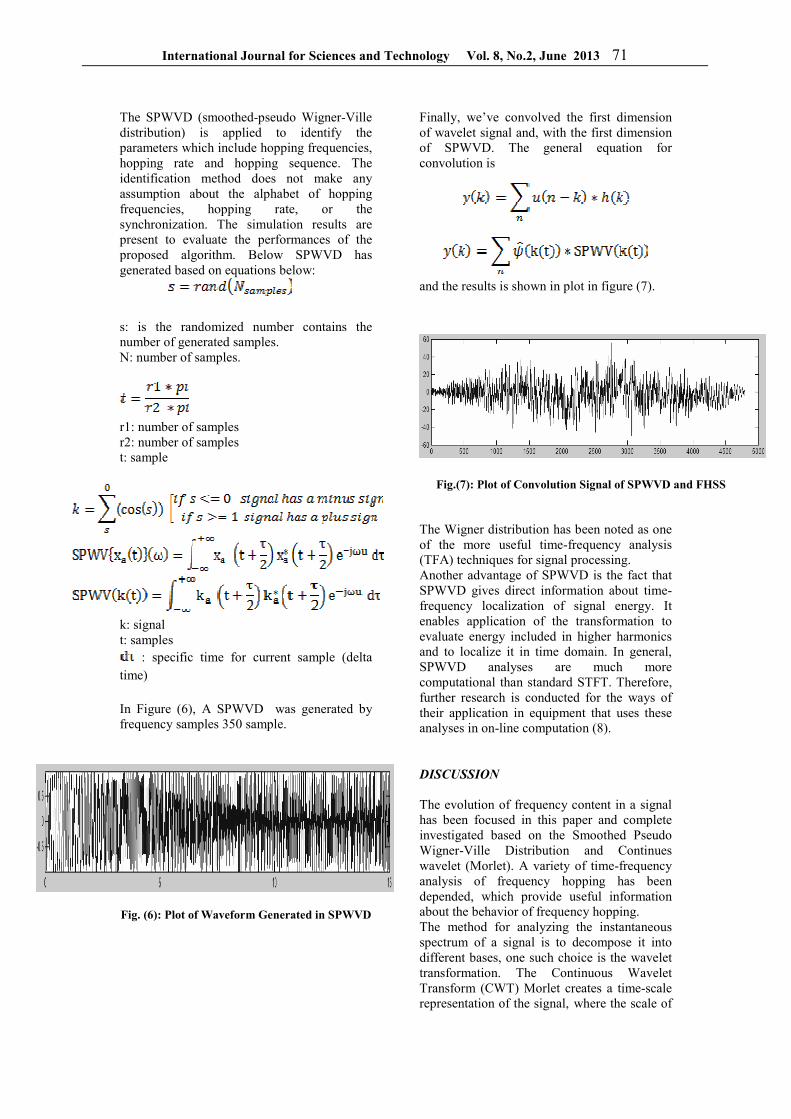
International Journal for Sciences and Technology Vol. 8, No.2, June 2013 71
The SPWVD (smoothed-pseudo Wigner-Ville distribution) is applied to identify the parameters which include hopping frequencies, hopping rate and hopping sequence. The identification method does not make any assumption about the alphabet of hopping frequencies, hopping rate, or the synchronization. The simulation results are present to evaluate the performances of the proposed algorithm. Below SPWVD has generated based on equations below:
s: is the randomized number contains the number of generated samples. N: number of samples.
r1: number of samples r2: number of samples t: sample
k: signal t: samples
: specific time for current sample (delta time) In Figure (6), A SPWVD was generated by frequency samples 350 sample.
Fig. (6): Plot of Waveform Generated in SPWVD
Finally, we’ve convolved the first dimension of wavelet signal and, with the first dimension of SPWVD. The general equation for convolution is
and the results is shown in plot in figure (7).
Fig.(7): Plot of Convolution Signal of SPWVD and FHSS
The Wigner distribution has been noted as one of the more useful time-frequency analysis (TFA) techniques for signal processing. Another advantage of SPWVD is the fact that SPWVD gives direct information about time-frequency localization of signal energy. It enables application of the transformation to evaluate energy included in higher harmonics and to localize it in time domain. In general, SPWVD analyses are much more computational than standard STFT. Therefore, further research is conducted for the ways of their application in equipment that uses these analyses in on-line computation (8). DISCUSSION
The evolution of frequency content in a signal has been focused in this paper and complete investigated based on the Smoothed Pseudo Wigner-Ville Distribution and Continues wavelet (Morlet). A variety of time-frequency analysis of frequency hopping has been depended, which provide useful information about the behavior of frequency hopping. The method for analyzing the instantaneous spectrum of a signal is to decompose it into different bases, one such choice is the wavelet transformation. The Continuous Wavelet Transform (CWT) Morlet creates a time-scale representation of the signal, where the scale of
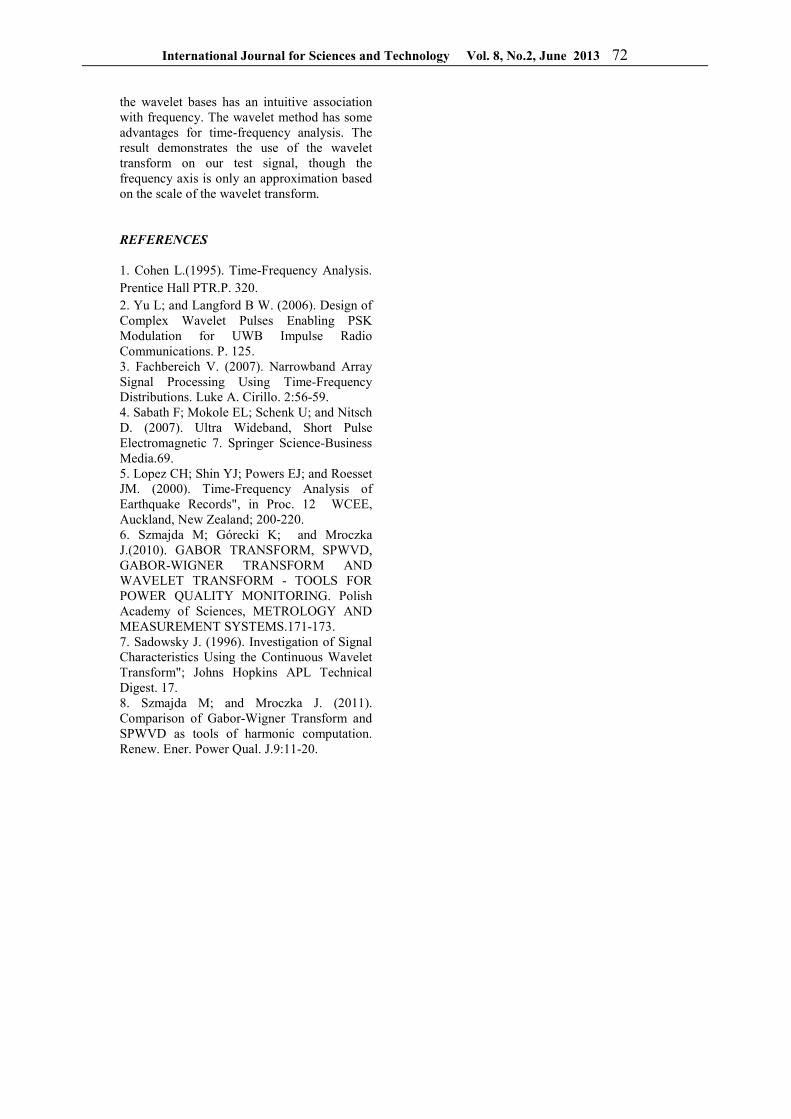
International Journal for Sciences and Technology Vol. 8, No.2, June 2013 72
the wavelet bases has an intuitive association with frequency. The wavelet method has some advantages for time-frequency analysis. The result demonstrates the use of the wavelet transform on our test signal, though the frequency axis is only an approximation based on the scale of the wavelet transform. REFERENCES
1. Cohen L.(1995). Time-Frequency Analysis. Prentice Hall PTR.P. 320. 2. Yu L; and Langford B W. (2006). Design of Complex Wavelet Pulses Enabling PSK Modulation for UWB Impulse Radio Communications. P. 125. 3. Fachbereich V. (2007). Narrowband Array Signal Processing Using Time-Frequency Distributions. Luke A. Cirillo. 2:56-59. 4. Sabath F; Mokole EL; Schenk U; and Nitsch D. (2007). Ultra Wideband, Short Pulse Electromagnetic 7. Springer Science-Business Media.69. 5. Lopez CH; Shin YJ; Powers EJ; and Roesset JM. (2000). Time-Frequency Analysis of Earthquake Records", in Proc. 12 WCEE, Auckland, New Zealand; 200-220. 6. Szmajda M; Górecki K; and Mroczka J.(2010). GABOR TRANSFORM, SPWVD, GABOR-WIGNER TRANSFORM AND WAVELET TRANSFORM - TOOLS FOR POWER QUALITY MONITORING. Polish Academy of Sciences, METROLOGY AND MEASUREMENT SYSTEMS.171-173. 7. Sadowsky J. (1996). Investigation of Signal Characteristics Using the Continuous Wavelet Transform"; Johns Hopkins APL Technical Digest. 17. 8. Szmajda M; and Mroczka J. (2011). Comparison of Gabor-Wigner Transform and SPWVD as tools of harmonic computation. Renew. Ener. Power Qual. J.9:11-20.
International Journal for Sciences and Technology Vol. 8, No.2, June 2013 73
Comparison Study between Adam-Bohart, Thomas and Yoon Nelson Models for
Adsorption of Pb(II) from Simulated Wastewater by Activated Carbon
Hayder M. Abdul- Hameed Dept. of environmental engineering / College of engineering / Baghdad University/ Iraq
E-mail: [email protected]
ABSTRACT
In this research a comparison study was made between Adam-Bohart, Thomas and Yoon-Nelson model to determine which model gives the best representation for the adsorption of Pb (II) from simulated wastewater by activated carbon. Depending on the values of (R2) and the HYBRID error function (HEF). It is found that Adam-Bohart model describe the equilibrium isotherm data better than Thomas and Yoon-Nelson model with (R2) value of 0.962, 0.937and 0.924 for Adam-Bohart, Thomas and Yoon-Nelson model respectively, and (HEF) of 0.281, 0.335 and 0.484 for Adam-Bohart Thomas and Yoon-Nelson model respectively. Also it found the adsorption of Pb(II) from aqueous solution by activated carbon was of favorable type.
Key Words: adsorption, activated carbon, Adam-Bohart model, Yoon-Nelson model, HYBRID error function
الملخص باللغة العربية
لمعرفـة أي Yoon-Nelson ونمـوذج Thomas ونموذج Adam-Bohartيهدف البحث إلى إجراء دراسة مقارنة بين نموذج . الرصاص الثنائي من المياه باستخدام الكاربون المنشط منها األفضل في وصف عملية امتزاز أيون
عملية االمتـزاز أليـون يصف Adam-Bohart وجد أن نموذج HYBRID الهجينة وكذلك قيم دالة الخطأ R2اعتمادا على قيم كانـت Adam-Bohart لنمـوذج R2 حيث إن قيمـة ,Yoon-Nelson و نموذج Thomasالرصاص الثنائي أفضل من نموذج
.9240. كانت Yoon-Nelson ولنموذج 0.937 كانت Thomas بينما لنموذج 0.962 .Yoon-Nelson.لنموذج 4840.وThomasلنموذج Adam-Bohart 0.335 لنموذج 0.281نة كانت إن قيمة دالة الخطأ الهجي
.از أليون الرصاص الثنائي بواسطة الكاربون المنشط كانت من النوع المفضل وان عملية االمتز
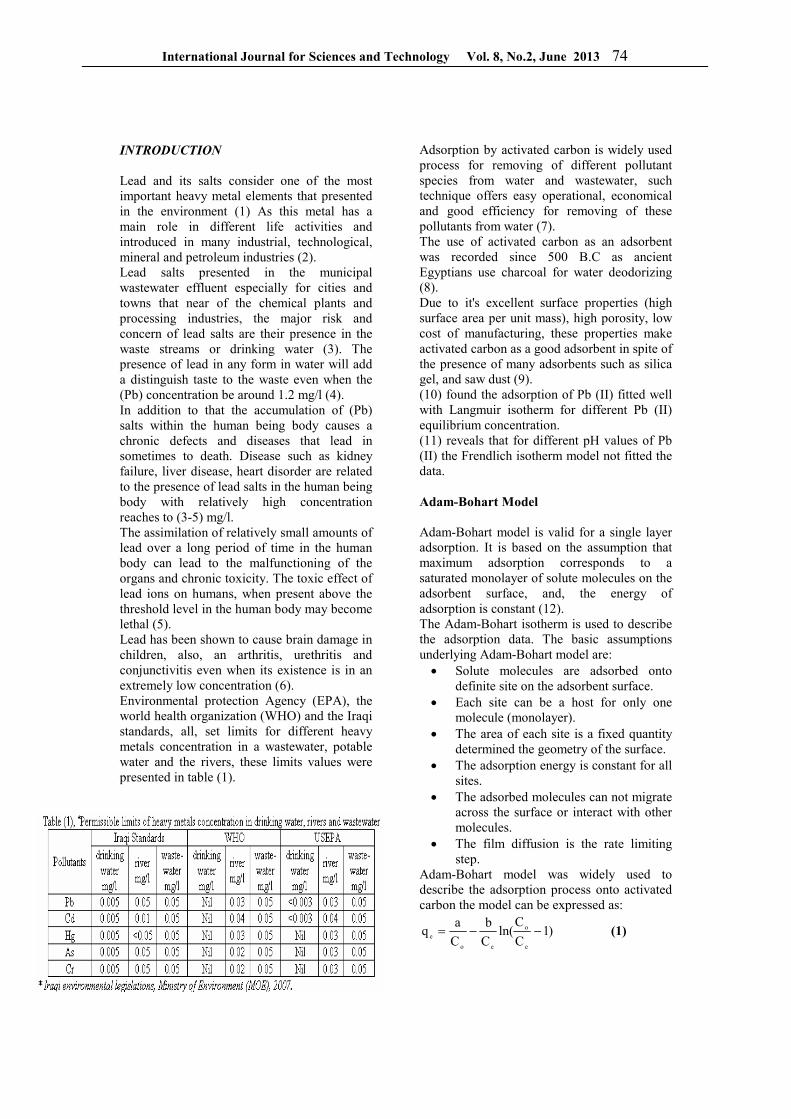
International Journal for Sciences and Technology Vol. 8, No.2, June 2013 74
INTRODUCTION
Lead and its salts consider one of the most important heavy metal elements that presented in the environment (1) As this metal has a main role in different life activities and introduced in many industrial, technological, mineral and petroleum industries (2). Lead salts presented in the municipal wastewater effluent especially for cities and towns that near of the chemical plants and processing industries, the major risk and concern of lead salts are their presence in the waste streams or drinking water (3). The presence of lead in any form in water will add a distinguish taste to the waste even when the (Pb) concentration be around 1.2 mg/l (4). In addition to that the accumulation of (Pb) salts within the human being body causes a chronic defects and diseases that lead in sometimes to death. Disease such as kidney failure, liver disease, heart disorder are related to the presence of lead salts in the human being body with relatively high concentration reaches to (3-5) mg/l. The assimilation of relatively small amounts of lead over a long period of time in the human body can lead to the malfunctioning of the organs and chronic toxicity. The toxic effect of lead ions on humans, when present above the threshold level in the human body may become lethal (5). Lead has been shown to cause brain damage in children, also, an arthritis, urethritis and conjunctivitis even when its existence is in an extremely low concentration (6). Environmental protection Agency (EPA), the world health organization (WHO) and the Iraqi standards, all, set limits for different heavy metals concentration in a wastewater, potable water and the rivers, these limits values were presented in table (1).
Adsorption by activated carbon is widely used process for removing of different pollutant species from water and wastewater, such technique offers easy operational, economical and good efficiency for removing of these pollutants from water (7). The use of activated carbon as an adsorbent was recorded since 500 B.C as ancient Egyptians use charcoal for water deodorizing (8). Due to it's excellent surface properties (high surface area per unit mass), high porosity, low cost of manufacturing, these properties make activated carbon as a good adsorbent in spite of the presence of many adsorbents such as silica gel, and saw dust (9). (10) found the adsorption of Pb (II) fitted well with Langmuir isotherm for different Pb (II) equilibrium concentration. (11) reveals that for different pH values of Pb (II) the Frendlich isotherm model not fitted the data. Adam-Bohart Model Adam-Bohart model is valid for a single layer adsorption. It is based on the assumption that maximum adsorption corresponds to a saturated monolayer of solute molecules on the adsorbent surface, and, the energy of adsorption is constant (12). The Adam-Bohart isotherm is used to describe the adsorption data. The basic assumptions underlying Adam-Bohart model are: • Solute molecules are adsorbed onto
definite site on the adsorbent surface. • Each site can be a host for only one
molecule (monolayer). • The area of each site is a fixed quantity
determined the geometry of the surface. • The adsorption energy is constant for all
sites. • The adsorbed molecules can not migrate
across the surface or interact with other molecules.
• The film diffusion is the rate limiting step.
Adam-Bohart model was widely used to describe the adsorption process onto activated carbon the model can be expressed as:
)1C
Cln(
C
b
C
aq
e
o
eo
e −−= (1)
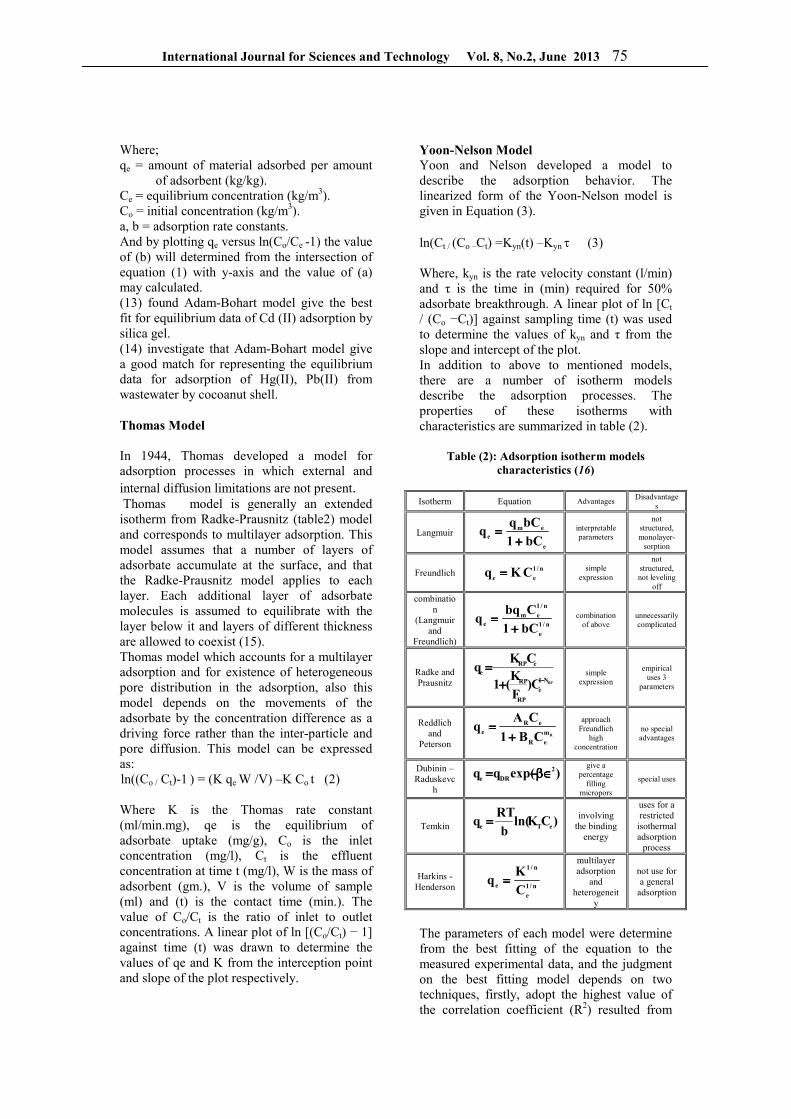
International Journal for Sciences and Technology Vol. 8, No.2, June 2013 75
Where; qe = amount of material adsorbed per amount
of adsorbent (kg/kg). Ce = equilibrium concentration (kg/m3). Co = initial concentration (kg/m3). a, b = adsorption rate constants. And by plotting qe versus ln(Co/Ce -1) the value of (b) will determined from the intersection of equation (1) with y-axis and the value of (a) may calculated. (13) found Adam-Bohart model give the best fit for equilibrium data of Cd (II) adsorption by silica gel. (14) investigate that Adam-Bohart model give a good match for representing the equilibrium data for adsorption of Hg(II), Pb(II) from wastewater by cocoanut shell. Thomas Model In 1944, Thomas developed a model for adsorption processes in which external and internal diffusion limitations are not present. Thomas model is generally an extended isotherm from Radke-Prausnitz (table2) model and corresponds to multilayer adsorption. This model assumes that a number of layers of adsorbate accumulate at the surface, and that the Radke-Prausnitz model applies to each layer. Each additional layer of adsorbate molecules is assumed to equilibrate with the layer below it and layers of different thickness are allowed to coexist (15). Thomas model which accounts for a multilayer adsorption and for existence of heterogeneous pore distribution in the adsorption, also this model depends on the movements of the adsorbate by the concentration difference as a driving force rather than the inter-particle and pore diffusion. This model can be expressed as:
ln((Co / Ct)-1 ) = (K qe W /V) –K Co t (2) Where K is the Thomas rate constant (ml/min.mg), qe is the equilibrium of adsorbate uptake (mg/g), Co is the inlet concentration (mg/l), Ct is the effluent concentration at time t (mg/l), W is the mass of adsorbent (gm.), V is the volume of sample (ml) and (t) is the contact time (min.). The value of Co/Ct is the ratio of inlet to outlet concentrations. A linear plot of ln [(Co/Ct) − 1] against time (t) was drawn to determine the values of qe and K from the interception point and slope of the plot respectively.
Yoon-Nelson Model Yoon and Nelson developed a model to describe the adsorption behavior. The linearized form of the Yoon-Nelson model is given in Equation (3). ln(Ct / (Co –Ct) =Kyn(t) –Kyn τ (3) Where, kyn is the rate velocity constant (l/min) and τ is the time in (min) required for 50% adsorbate breakthrough. A linear plot of ln [Ct / (Co −Ct)] against sampling time (t) was used to determine the values of kyn and τ from the slope and intercept of the plot. In addition to above to mentioned models, there are a number of isotherm models describe the adsorption processes. The properties of these isotherms with characteristics are summarized in table (2).
Table (2): Adsorption isotherm models
characteristics (16)
Isotherm Equation Advantages Disadvantage
s
Langmuir
e
eme bC1
bCqq
++++==== interpretable
parameters
not structured, monolayer-
sorption
Freundlich n/1
ee CKq ==== simple
expression
not structured, not leveling
off
combination
(Langmuir and
Freundlich)
n/1
e
n/1
eme bC1
Cbqq
++++==== combination
of above unnecessarily complicated
Radke and Prausnitz RPN1
e
RP
RP
eRPe
C)F
K(1
CKq
−−−−++++==== simple
expression
empirical uses 3
parameters
Reddlich and
Peterson Rm
eR
eRe CB1
CAq
++++====
approach Freundlich
high concentration
no special advantages
Dubinin – Raduskevc
h
)exp(qq 2
DRe ∈∈∈∈ββββ−−−−====
give a percentage
filling micropors
special uses
Temkin )CKln(b
RTq eTe ====
involving the binding
energy
uses for a restricted
isothermal adsorption
process
Harkins - Henderson n/1
e
n/1
e C
Kq ====
multilayer adsorption
and heterogeneit
y
not use for a general
adsorption
The parameters of each model were determine from the best fitting of the equation to the measured experimental data, and the judgment on the best fitting model depends on two techniques, firstly, adopt the highest value of the correlation coefficient (R2) resulted from
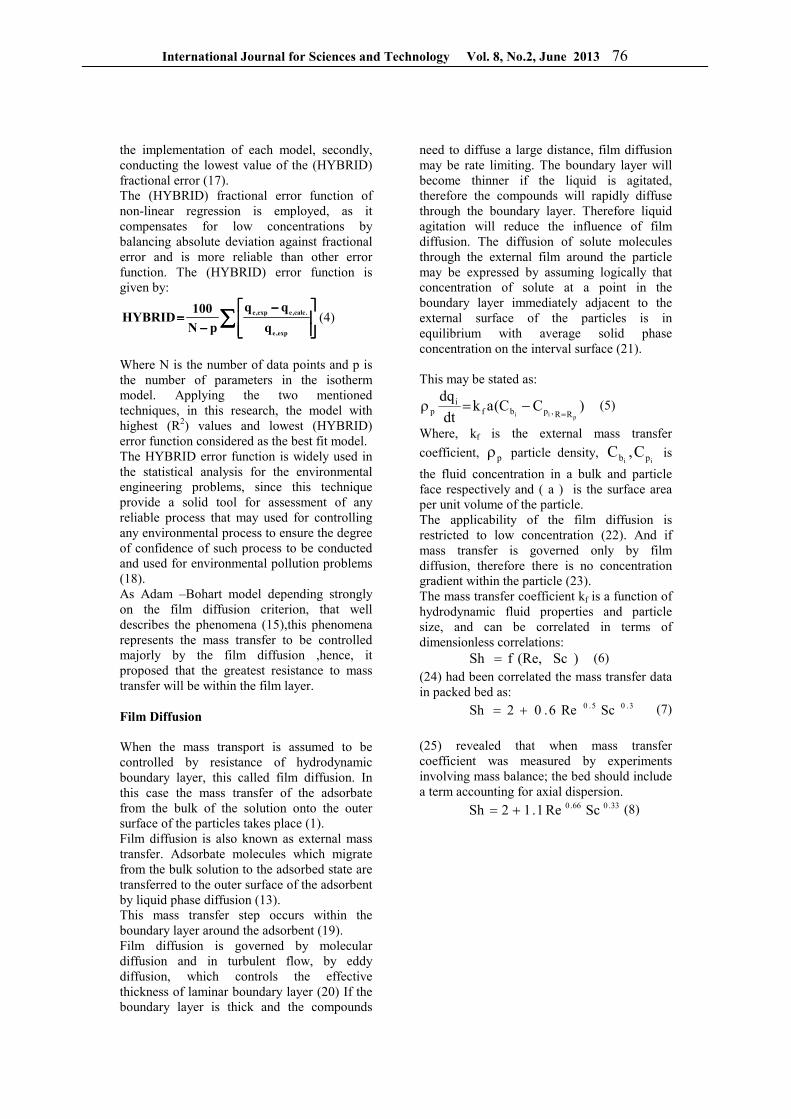
International Journal for Sciences and Technology Vol. 8, No.2, June 2013 76
the implementation of each model, secondly, conducting the lowest value of the (HYBRID) fractional error (17). The (HYBRID) fractional error function of non-linear regression is employed, as it compensates for low concentrations by balancing absolute deviation against fractional error and is more reliable than other error function. The (HYBRID) error function is given by:
∑∑∑∑
−−−−
−−−−====
,expe
.calc,e,expe
q
pN
100HYBRID (4)
Where N is the number of data points and p is the number of parameters in the isotherm model. Applying the two mentioned techniques, in this research, the model with highest (R2) values and lowest (HYBRID) error function considered as the best fit model. The HYBRID error function is widely used in the statistical analysis for the environmental engineering problems, since this technique provide a solid tool for assessment of any reliable process that may used for controlling any environmental process to ensure the degree of confidence of such process to be conducted and used for environmental pollution problems (18). As Adam –Bohart model depending strongly on the film diffusion criterion, that well describes the phenomena (15),this phenomena represents the mass transfer to be controlled majorly by the film diffusion ,hence, it proposed that the greatest resistance to mass transfer will be within the film layer. Film Diffusion When the mass transport is assumed to be controlled by resistance of hydrodynamic boundary layer, this called film diffusion. In this case the mass transfer of the adsorbate from the bulk of the solution onto the outer surface of the particles takes place (1). Film diffusion is also known as external mass transfer. Adsorbate molecules which migrate from the bulk solution to the adsorbed state are transferred to the outer surface of the adsorbent by liquid phase diffusion (13). This mass transfer step occurs within the boundary layer around the adsorbent (19). Film diffusion is governed by molecular diffusion and in turbulent flow, by eddy diffusion, which controls the effective thickness of laminar boundary layer (20) If the boundary layer is thick and the compounds
need to diffuse a large distance, film diffusion may be rate limiting. The boundary layer will become thinner if the liquid is agitated, therefore the compounds will rapidly diffuse through the boundary layer. Therefore liquid agitation will reduce the influence of film diffusion. The diffusion of solute molecules through the external film around the particle may be expressed by assuming logically that concentration of solute at a point in the boundary layer immediately adjacent to the external surface of the particles is in equilibrium with average solid phase concentration on the interval surface (21). This may be stated as:
)CC(akdt
dqpii RR,pbf
ip =
−=ρ (5)
Where, kf is the external mass transfer
coefficient, pρ particle density, ii pb C,C is
the fluid concentration in a bulk and particle face respectively and ( a ) is the surface area per unit volume of the particle. The applicability of the film diffusion is restricted to low concentration (22). And if mass transfer is governed only by film diffusion, therefore there is no concentration gradient within the particle (23). The mass transfer coefficient kf is a function of hydrodynamic fluid properties and particle size, and can be correlated in terms of dimensionless correlations: )Sc(Re,fSh = (6)
(24) had been correlated the mass transfer data in packed bed as: 3.05.0 ScRe6.02Sh += (7)
(25) revealed that when mass transfer coefficient was measured by experiments involving mass balance; the bed should include a term accounting for axial dispersion. 33.066.0 ScRe1.12Sh += (8)
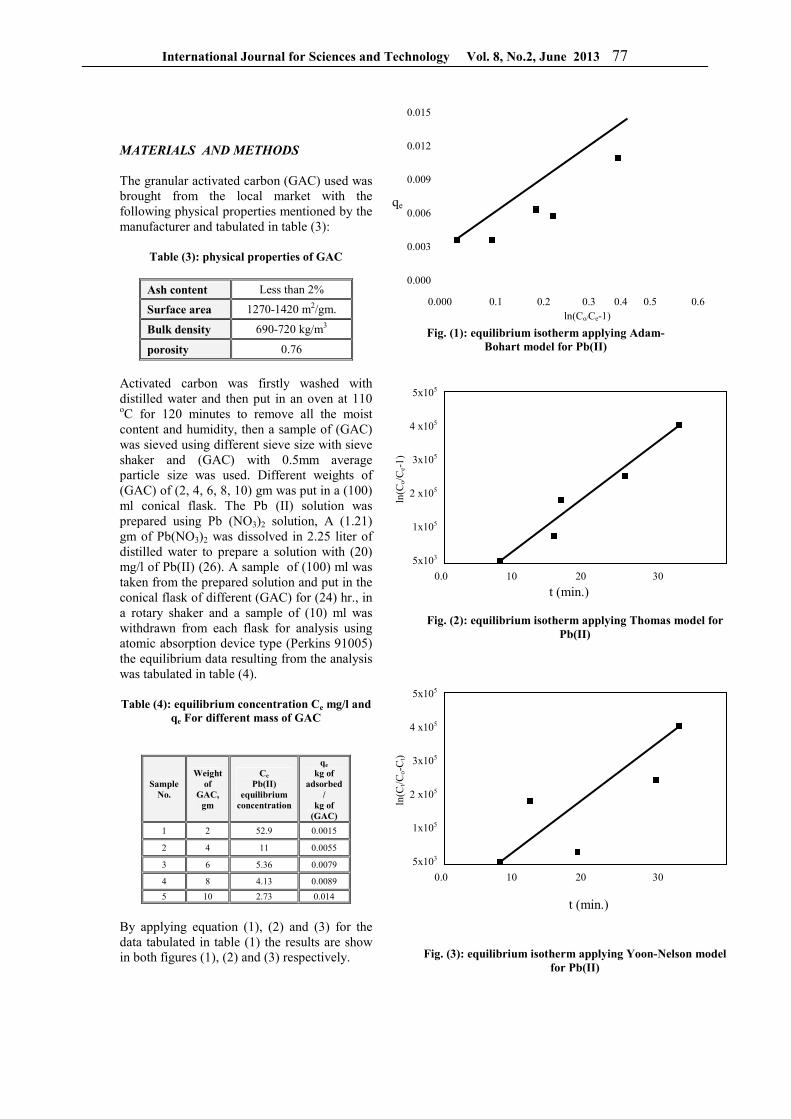
International Journal for Sciences and Technology Vol. 8, No.2, June 2013 77
MATERIALS AND METHODS
The granular activated carbon (GAC) used was brought from the local market with the following physical properties mentioned by the manufacturer and tabulated in table (3):
Table (3): physical properties of GAC
Ash content Less than 2%
Surface area 1270-1420 m2/gm.
Bulk density 690-720 kg/m3
porosity 0.76
Activated carbon was firstly washed with distilled water and then put in an oven at 110 oC for 120 minutes to remove all the moist content and humidity, then a sample of (GAC) was sieved using different sieve size with sieve shaker and (GAC) with 0.5mm average particle size was used. Different weights of (GAC) of (2, 4, 6, 8, 10) gm was put in a (100) ml conical flask. The Pb (II) solution was prepared using Pb (NO3)2 solution, A (1.21) gm of Pb(NO3)2 was dissolved in 2.25 liter of distilled water to prepare a solution with (20) mg/l of Pb(II) (26). A sample of (100) ml was taken from the prepared solution and put in the conical flask of different (GAC) for (24) hr., in a rotary shaker and a sample of (10) ml was withdrawn from each flask for analysis using atomic absorption device type (Perkins 91005) the equilibrium data resulting from the analysis was tabulated in table (4). Table (4): equilibrium concentration Ce mg/l and
qe For different mass of GAC
Sample No.
Weight of
GAC, gm
Ce Pb(II)
equilibrium concentration
qe kg of
adsorbed /
kg of (GAC)
1 2 52.9 0.0015
2 4 11 0.0055
3 6 5.36 0.0079
4 8 4.13 0.0089
5 10 2.73 0.014
By applying equation (1), (2) and (3) for the data tabulated in table (1) the results are show in both figures (1), (2) and (3) respectively.
Fig. (1): equilibrium isotherm applying Adam-Bohart model for Pb(II)
Fig. (2): equilibrium isotherm applying Thomas model for Pb(II)
Fig. (3): equilibrium isotherm applying Yoon-Nelson model
for Pb(II)
qe
ln(Co/Ce-1) 0.000 0.1 0.2 0.3 0.4 0.5 0.6
t (min.) 0.0 10 20 30
5x10⁵
4 x10⁵
3x10⁵
2 x10⁵
1x10⁵
5x10³
ln(C
o/C
e-1)
0.0 10 20 30
5x10⁵
4 x10⁵
3x10⁵
2 x10⁵
1x10⁵
5x10³
ln(C
t/Co-
Ct)
t (min.)
0.015
0.012
0.009
0.006
0.003
0.000
International Journal for Sciences and Technology Vol. 8, No.2, June 2013 78
By applying equation (4) on the data mentioned in table (1) HYBRID error function of each model in found to be 0.281for Adam-Bohart model and 0.335 for Thomas model, and 0.484 for Yoon-Nelson model RESULTS AND DISCUSSION
• The adsorption of Pb (II) by activated
carbon was of a favorable type. • An increase in the equilibrium
concentration accompanied by an increasing in the adsorption uptake (sorption) of activated carbon.
• The three models can be used successfully for expressing the adsorption process of Pb (II) onto activated carbon.
• Adam-Bohart model is the best model to express the data in this research in comparison with Thomas and Yoon-Nelson model since (R2) values of Adam-Bohart model was (0.962) and for Thomas model was (0.937), and for Yoon-Nelson model was (0.924). in addition to the (HFE) values was (0.281) for Adam-Bohart model, and (0.353) for Thomas model, and (0.484) for Yoon-Nelson model.
• Since the research appointed that Adam-Bohart model is the best model to describe the data, that may explained mass transfer of Pb (II) occurred within a multi-layers film that surrounding the (GAC) particles and the gradual concentration gradient was the main driving force of the adsorption process, rather than pore and inter-particle diffusion mechanism.
• It can be concluded that the overall kinetics in the initial part of the adsorption process were dominated by external mass transfer.
REFERENCES
1. Atkenson J.(1997). Removal of Iron from wastewater. Biores. Tech. 51(2): 26-29. 2. Berryl H. (1995). Hazardous waste Handbook. Khana. Pub. 3. Jarian K.(2001). Iron Stabilization in Wastewater. Ch. Eng. 33 (1): 56-60. 4. World Health Organization (WHO). (2002). Drinking Water Guideline. P. 109.
5. Sael Y; Yamaguchi N; and Adachi T. (2000). Mass Transfer Coefficient for Suspended Particles in Agitated Vessels and Bubble Column. J. Chem. Eng. Jap. 7: 255-261. 6. Ahmedna JB. (2004). Adsorption of Lead from Water. Water Res. 11: 991-999. 7. Abdul-Hameed HM.(2009). Competitive Adsorption of Heavy Metals onto Activated Carbon In Fixed Bed Columns .PhD. Thesis. College of Eng.. University of Baghdad. 8. Kalli B. (2003). Activated Carbon: Capsule Report. Indian J. Agri. Res. 20:13-19. 9. Han S. (2005). Activated Carbon Fact Sheet. ICI. 1: 28-32. 10. Zenden R.(2004). Removal of Hg(II) by Adsorption using Coco-Nut Shell. ASCE.. 17:42-48. 11. Massako S. (2005). Effect of Power of Hydrogen Variation on the Adsorption of Fe(II) by Saw Dust", Aggri. Symp., Cali. 5: 101-105. 12. Belfort G. (1980). Adsorption on Carbon: Theoretical Considerations. Envir. Sci. Tech. 14 (8): 910-913. 13. Haussmann R. (2005). Adsorption Models for Heavy Metal Removal from Wastewater. Dutch. Env. J. 115-119. 14. Nadit G. (2004). Adsorption of Hg(II) and Pb(II) from Wastewater. Wastewater Tech. J. 5(3): 22-28. 15. Ruthren JZ. (1989). Removal of Synthetic Dyes from Water. Env. J. 15: 135-137. 16. Garden AJ. (2006). Application of Harkins Model in Adsorption. IAH. J.. 7: 11-14. 17. Casedy E. (2005). Statistics for Environmental Engineering. J. Smith Pub. P. 502- 512. 18. Stewart FJ. (2007). Statistics for Environmental Engineering. Kastil Pub. P. 88. 19. Juang PD. (1999). Physiochemical Process for Water Quality. Wiely. Netherland. P. 269-279. 20. Sonthemir AL. (1989). Modeling of Adsorption Process. Water Res. 14: 19-21. 21. Zucker WJ. (1972). Adsorption of Toxic and Carcinogenic Compounds from Water. AWWA. 74(4): 203-209. 22. John QH. (1997). Film Diffusion Moodily in Adsorption Process. Chem. Eng. J. 10: 55-59. 23. Warren L. and Harriott P. (1995). Unit Operation of Chemical Engineering. McGraw-Hill. P. 469. 24. Ranz WE.(1962). Adsorption modeling. Chem. Eng. Prog. 48: 173.

International Journal for Sciences and Technology Vol. 8, No.2, June 2013 79
25. Wako AY. (1978). Designing of Pilot Plant for Treatment of Wastewater Contaminated by Furfural. Master Thesis. University of Tokyo. Japan. 26. Howared H. (1965). Reduction of Heavy Metal from Wastewater by Adsorption. Turk. J. 12:19-26.
International Journal for Sciences and Technology Vol. 8, No.2, June 2013 80
Congenital cytomegalovirus infection in symptomatic infant in Baghdad and
surrounding area
Faiza L. Tuama (1), Atheer AR. Al- Douri (2), Faisal G. Nasser(1), Deena Moayad (1), Gasem Abas (1), Mysoon Anwar (1) and Saja Nehad (1) (1) General viral infections lab/ Dept. of virology/ Central Public Health laboratory/ Ministry of
Health – Baghdad (2) College of Veterinary Medicine/ Baghdad University/ Iraq
Email:[email protected]
ABSTRACT
Many viral infections are associated with significant maternal and fetal consequences during pregnancy among which cytomegalovirus is one of the most important agent, globally, both primary and recurrent infection due to this virus and its ability to result in fetal infection. Congenital human cytomegalovirus (HCMV) infection is the leading infectious cause of mental retardation and sensorineural deafness. Intrauterine transmission and adverse outcome are mainly related to primary maternal infection. Samples from Congenital Anomalies babies are referred to CPHL from Baghdad based Government hospitals and surrounding areas for diagnosis of congenital infections like Toxoplasma, Rubella, CMV and Herpes. In the present study, accumulated data for the most common teratogenic virus-Cytomegalovirus prevalence as a causative agent for congenital infection in babies at Baghdad and surrounding areas. Samples from 500 symptomatic babies in the age group under one year exhibiting different congenital anomalies were examined between 15th Sep/2009 to 15th Sep/2011. All the blood samples were tested for the detection of Anti-CMV (IgM) antibodies using ELISA technique. Samples from 125 babies (25%) showed positive titers for Anti-CMV-IgM antibodies. Also samples from 51 mothers (10.39%) of positive babies were found positive for Anti-CMV-IgM antibodies and all were serologically exposed to CMV virus previously as their serum samples were positive for CMV-IgG antibodies which indicated primary infection in the past or reactivation/re-infection with a different strain of CMV in the early pregnancy. This study documents symptomatic congenital CMV cases in Baghdad and surrounding Area. Key Words: Congenital abnormalities; congenital CMV infection; herpes virus; pediatric surveillance
الملخص باللغة العربية
من أهم تلك العوامل CMVعديد من االصابات الفيروسية خالل فترة الحمل ويعتبر الفيروس المضخم للخاليا يمكن أن تتعرض األم أو الجنين للة بفيروس المضخم للخاليا االصاب. كال االصابتين االولية واالصابة الثانوية المتكررة ممكن أن تعزى اصابة الجنين لهذا الفيروس: عالميا ..
)HCMV (يسبب تخلف عقلي والعوق بالسمع وتشوهات خلقية اخرى التي غالبا تعود الى االصابة االولية لالم بالفيروس . ارسلت نماذج االطفال المشوهين خلقيا تتراوح اعمارهم ما بين عدة أيام وسنة واحدة الى مختبر الصحة العامة المركزي وهم مرضى راقدون
الفيروس , الحصبة االلمانية , في مستشفيات بغداد والمناطق المحيطة بها لتشخيص العوامل المسببة للتشوهات الخلقية مثل داء المقوسات في دراستنا الحالية تم جمع المعلومات الوبائية للمرضى المصابين بفيروس المضخم للخاليا كعامل مسبب .. المضخم للخاليا وفيروس الهيربس
حيث تم جمع خمسمائة نموذج من اطفال مشوهين خلقيا تتراوح أعمارهم دون السنة استلمت في , تشوهات الخلقية في بغداد والمناطق المحيطة للجميعها تم فحصها بتقنية االليزا وذلك لتشخيص االصابات الحديثة بالفيروس .. 15/9/2011 ولغاية 15/9/2009مختبراتنا على مدى سنتين من
-Antiنموذج عياريتها موجبة لوجود المستضدات ) 500(من %) 25(حالة ) 125( ومنها Anti-CMV-IgMفة وجود مستضدات لمعرCMV-IgMمن الحاالت %) 10,39(اخذت من أمهات االطفال المشوهين خلقيا اي ) 51/492( وكذلك اظهرت النتائج واحد وخمسون نموذجا
وجميع الحاالت أظهرت انها تعرضت مسبقا لالصابة بفيروس مضخم الخاليا حيث أعطت عيارية خاليالديهن اصابة موجبة بفيروس مضخم ال وهذا مؤشر على حدوث اصابة سابقا او حدوث اصابة ثانوية بهذا الفيروس او اصابة بساللة Anti-CMV-IgGموجبة في فحص المستضدات
.جديدة من فيروس مضخم الخاليا في وقت مبكر من الحمل
International Journal for Sciences and Technology Vol. 8, No.2, June 2013 81
INTRODUCTION
Human cytomegalovirus (HCMV) or human herpes virus 5 (HHV-5) is a member of the Herpesviridae family, subfamily Betaherpesvirinae. HCMV is ubiquitous and highly species-specific. HCMV establishes a lifelong relationship with the infected host (once infected, always infected) resulting in primary infection, lifelong latency, and intermittent excretion following reactivation. Such a remarkable property constitutes the basis for the peculiar natural history of HCMV in pregnancy. Well known additional biological features of HCMV include the ability to infect in vivo a broad spectrum of cells (fibroblasts, epithelial and endothelial Cells, macrophages, muscle cells) (1). Maternal infections are now being increasingly recognized as a major cause of birth defect in newborn babies. CMV infection in general is probably one of the most common infections known to human being and is characterized by mild, self limiting infection with fever in healthy individuals. In pregnant women the virus can cross placenta barriers and result in fetal infection. Nearly all symptomatic congenital infections occur when a woman sustains a primary infection with CMV either during or just before pregnancy (2). Infection appears to be associated with progressively increasing viral transmission rates by gestational age, but infections early in gestation probably result in more severe congenital disease (3,4). If infection occurs after conception, approximately 50% of fetuses will become infected, and approximately one-half of those will have symptoms at birth (3).
The prevalence of CMV infection varies from 0.3 to 2.4% and at least 90% of congenital infected infants have no clinical sign (5,6).The disease causes illness ranging from non apparent to major clinical signs disorder and death (7,8).Congenital CMV infections is described in 30000 to 40000 new born each year in the USA and approximately 9000 of these children have permanent neurological to prematurity, encephalitis, deafness and hemolytic squeal (8). The death rate of symptomatic CMV infection is approximately 30% (9). In India, serological surveys in different parts have shown the prevalence of 80-90% seropositivity (10-13) of CMV antibodies (IgG) in women of child bearing age. Studies regarding prevalence of birth defects due to congenital CMV infection are limited in Iraq. In the present study, samples of
babies with signs and symptoms compatible with acute CMV infection and their mothers referred to this CPHL between 15th Sep/2009 to 15th Sep/2011. They were assayed for CMV-IgM antibodies to establish the evidence of congenital CMV infection. MATERIALS AND METHODS
Patients:
During the period of study (15th Sep/2009 to 15th Sep/2011), Five hundred serum samples were collected from babies with various congenital anomalies and their mother’s were referred to General viral infections lab/Virology Department of CPHL from Government hospitals of Baghdad and adjoining areas. Majority of the cases were reported from hospitals located in the crowded zones of Baghdad like Sader-city. The children were in the age group of few days to 12 months. Suspected patients were with various clinical features like Lethargy (Hypotonia), Poor Suck, Jaundice, Splenomegaly, Seizures, Abnormal features…. etc. The referred samples belonged to mixed population of Urban and Rural areas but mostly from patient of lower socio-economic state. Specimens: Blood samples received from all the cases were clotted and centrifuged for serum separation prior to testing. All the sera were stored at -20oC till tested. Serology: The serum samples were tested for CMV-IgM antibodies using commercially available enzyme linked immunoassay (ELISA kits EuroImmune in this study). The specificity of the procedure used is 100% with no specific binding due rheumatoid or other herpetic viruses. Mothers of babies were subjected to CMV-IgG and serology using ELISA kits EuroImmune. Kit instructions were strictly adhered to while processing the samples. Interpretation of the results was based on the controls provided with the kit. Test samples was said to be positive for IgM antibodies when it absorbance value was higher than the absorbance value of cut-off. Positivity of IgM antibodies against CMV in a sample indicates active infection of CMV.
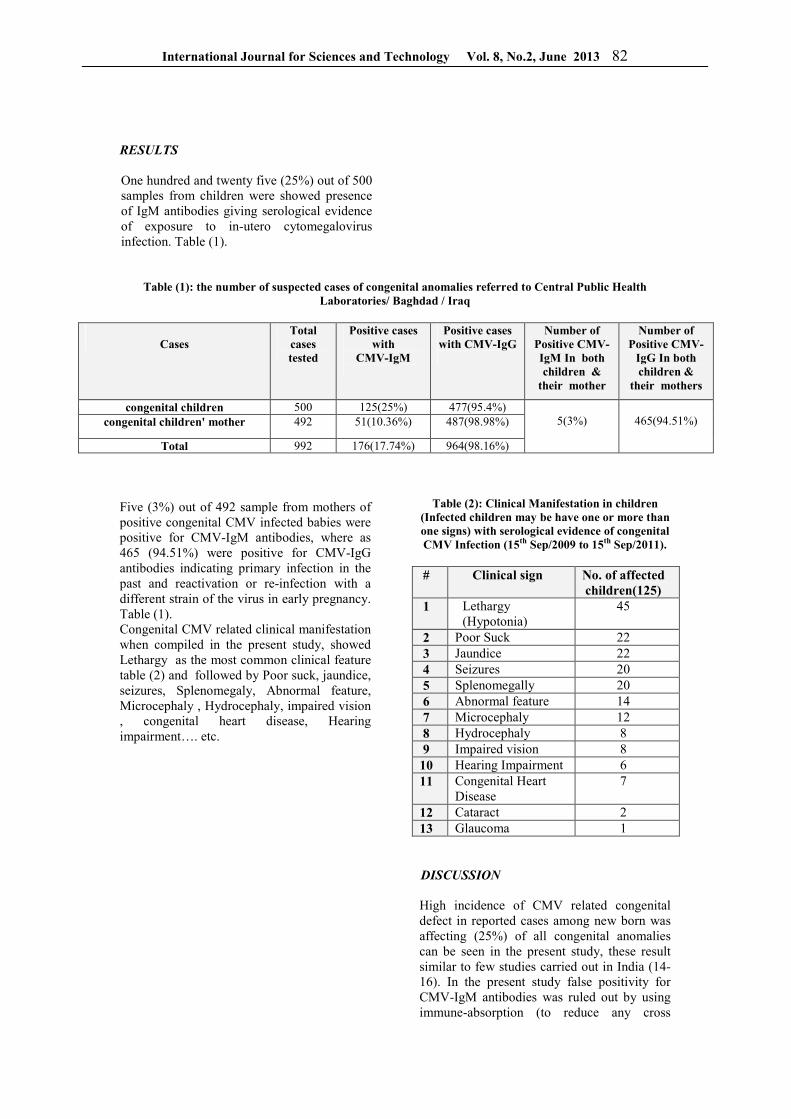
International Journal for Sciences and Technology Vol. 8, No.2, June 2013 82
RESULTS
One hundred and twenty five (25%) out of 500 samples from children were showed presence of IgM antibodies giving serological evidence of exposure to in-utero cytomegalovirus infection. Table (1).
Table (1): the number of suspected cases of congenital anomalies referred to Central Public Health Laboratories/ Baghdad / Iraq
Number of
Positive CMV-IgG In both children &
their mothers
Number of Positive CMV-IgM In both children &
their mother
Positive cases with CMV-IgG
Positive cases with
CMV-IgM
Total cases tested
Cases
477(95.4%) 125(25%) 500 congenital children 487(98.98%) 51(10.36%) 492 congenital children' mother
465(94.51%)
5(3%)
964(98.16%) 176(17.74%) 992 Total Five (3%) out of 492 sample from mothers of positive congenital CMV infected babies were positive for CMV-IgM antibodies, where as 465 (94.51%) were positive for CMV-IgG antibodies indicating primary infection in the past and reactivation or re-infection with a different strain of the virus in early pregnancy. Table (1). Congenital CMV related clinical manifestation when compiled in the present study, showed Lethargy as the most common clinical feature table (2) and followed by Poor suck, jaundice, seizures, Splenomegaly, Abnormal feature, Microcephaly , Hydrocephaly, impaired vision , congenital heart disease, Hearing impairment…. etc.
Table (2): Clinical Manifestation in children (Infected children may be have one or more than one signs) with serological evidence of congenital CMV Infection (15th Sep/2009 to 15th Sep/2011). # Clinical sign No. of affected
children(125) 1 Lethargy
(Hypotonia) 45
2 Poor Suck 22 3 Jaundice 22 4 Seizures 20 5 Splenomegally 20 6 Abnormal feature 14 7 Microcephaly 12 8 Hydrocephaly 8 9 Impaired vision 8
10 Hearing Impairment 6 11 Congenital Heart
Disease 7
12 Cataract 2 13 Glaucoma 1 DISCUSSION
High incidence of CMV related congenital defect in reported cases among new born was affecting (25%) of all congenital anomalies can be seen in the present study, these result similar to few studies carried out in India (14-16). In the present study false positivity for CMV-IgM antibodies was ruled out by using immune-absorption (to reduce any cross
International Journal for Sciences and Technology Vol. 8, No.2, June 2013 83
reaction by CMV-IgG and rheumatoid factors), which lead to a highly specific and sensitive procedure The clinical presentations in infants positive for CMV-IgM antibodies were typical of congenitally acquired CMV infection. Lethargy (Hypotonia) was the commonest clinical feature (45 cases), Next common feature was Poor Suck, Jaundice and Splenomegaly (22-20 cases), Abnormal feature & Microcephaly (14-12 cases) and other notable clinical symptoms like Hydrocephaly, Impaired vision, Congenital Heart Disease, Hearing Impairment, Cataract, Glaucoma. etc. are compatible with congenital CMV infection. This finding is in accordance with other studies from India and Poland (16,17), and the study done in Australia showed in 70 cases of congenital CMV being identified between 1999 and 2003. Nearly all of the cases were symptomatic with the most common clinical sequelae reported in infected infants being jaundice, thrombocytopaenia, hepatomegaly, petechiae, purpura and Splenomegaly. Almost half (43.5%) of the infants had central nervous system (CNS) complications, such as microcephaly, chorioretinitis, sensorineural hearing loss, intracranial calcifications, developmental delay or seizures, with over half presenting two or more CNS abnormalities. Maternal febrile illness was noted in 54.8% of the cases (18). CMV is common in all socio-economic groups but congenital infection with significant impairment is seen at highest rate in population in which women in child bearing age have highest risk of acquired primary infection (10,12,15). In addition to the placenta route. CMV can be transmitted via the maternal genital tract, during the parturition period, breast milk and transfused blood products. Symptomatic cytomegalovirus infection in fetus can occur after maternal recurrent infection but the incidence of these cases is still not established (19). Seropositivity of re-infected mothers by a different strain of cytomegalovirus can transmit the infection to the fetus and deliver a symptomatic child. High rate of seropositivity IgG (80-90%)was observed in child bearing age (12,13). Delivering high number of symptomatic congenital CMV babies (as seen in present study) support the above mentioned studies. Antenatal screening for CMV infection has been widely practiced in most developed countries which can substantially reduce the
incidence of congenital CMV infection by advising MTP in case of intrauterine symptomatic CMV infected fetus diagnosis by amniocentesis or ultrasound (20,21) rather than giving birth to infant having congenital infections with high sequel. However, mandatory testing during antenatal period is rudimentary in Iraq due to various reasons. The diagnosis is done most of the times after the mother gives birth to a baby with congenital anomalies and that is why the incidence of birth defects due to CMV virus is high in Iraq. Good hygiene and general infections control practice is, the best way to prevent transmission of CMV infection in developing countries. Though the only currently available for congenital CMV infection is Ganciclovir (22,23) yet the side effects due to this drug in most patients during the course of therapy has limited its role.
CONCLUSION
The facts presented in the present study conclude beyond doubt that maternal infections like CMV cause considerable burden on society in terms huge number of babies with birth defects. Good hygiene, antenatal screening, antiviral therapies, development and introduction of good vaccine may achieve the goal of controlling CMV related congenital defects in the New Born. The importance may primarily be given to introduction of antenatal screening for CMV viral infections in Iraq as done with other communicable disease , Data generated will help the health authorities to make policy against congenital CMV infection prevailing in Iraq, this also put the proper measures as listed down that contribute to decrease the burden of congenital cytomegalovirus infections, However, there are special times, such as during pregnancy, when CMV infections should be avoided, if possible. The spread of the virus can be controlled by practicing good hygiene techniques as recommended by CDC/ National Congenital CMV Disease Registry to increase health awareness in population: 1-Do not kisses young children fewer than 5 or 6 years of age on the mouth or cheek. Instead, kiss them on the forehead or the top of the head and give them a big long hug. 2-Do not share food, drinks, or items such as utensils or toothbrushes with young children.
International Journal for Sciences and Technology Vol. 8, No.2, June 2013 84
3- Wash your hands with soap and water after diaper changes or after contact with a child's saliva. Day-care center workers also may wear gloves when changing the diapers of young children. 4-Since young children, especially toddlers, frequently put toys in their mouth, it is recommended the toys be washed with soap and water or wiped with a solution of one-part chlorine bleach to nine-part water, followed by a tap water rinse. REFERENCES
1. Sinzger C; Grefte A; Plachter B; Gouw AS; and Jahn G. (1995). Fibroblasts, epithelial cells, endothelial cells and smooth muscle cells are major targets of human cytomegalovirus infection in lung and gastrointestinal tissues. J Gen Virol. 76:741–750.
2. Fowler KB; Stagno S; and Pass RF. (1992). The outcome of congenital cytomegalovirus infection in relation to maternal antibody status. N. Engl. J. Med. 326:663-667.
3. Nigro G; Adler SP; and La Torre R. (2005). Passive immunization during pregnancy for congenital cytomegalovirus infection. N. Engl. J. Med. 353:1350-1362.
4. Pass RF; Fowler KB; and Boppana SB. (2006). Congenital cytomegalovirus infection following first trimester maternal infection: symptoms at birth and outcome. J. Clin. Virol. 35:216-220.
5. Trincado DE; and Rawlison WD.(2001). Congenital and perinatal infection with cytomegalovirus. J. Peadia. Child. Health. 37:187-192.
6. Willson WD; Perry AK; and Yow MD. (1990). Asymptomatic Congenital cytomegalovirus infection. Am. J. Dis. Child. 144: 1365-1368.
7. Harris S; Ahlfors K; Ivarsson S; Lermark B; and Svanberg L. (1984). Congenital Cytomegalovirus infection and sensorineural hearing loss. Ear. Hear. 5: 352-355.
8. Damato EG; and Winnen CW.(2002). Cytomegalovirus infection perinatal implication. J. Obstet. Gynecol. Neonatal. Nurs. 31: 86-92.
9. Peckam C; Tookay P; Logan S; and Glaquinto C. (2001). Screening options for prevention of congenital of congenital cytomegalovirus infection. J. Med. Screen. 8: 119-124.
10. Jindal N; and Aggarwal A. (2005). A pilot seroepidemiological study of cytomegalovirus infection in women of child bearing age. Indian. J. Med. Microbiol. 23: 34-36.
11. Mathur A; Jindal L; and Chaturvedi VC. (1981). A serological study of cytomegalovirus infection at Lucknow. Ind. J. Med. Res. 73: 678-681.
12. Arvind Rai; Kumari S; Khare S; Gandhoke I; Bhatia R; and Datta KK. (1995). Maternal Viral infections and their implications in Congenital defects of new borns. J. Basic. Appl. Biomed. 3(2) : 1-9.
13. Turbadkar D; Mathur M; and Rele M. (2003). Seroprevalence of TORCH Infection in BOH. IJMM. 21:108-110.
14. Thapliyal N; Shukla PK; Kumar B; Upadhyay S; and Jain G. (2005). TORCH infection in women with bad obestric history-a pilot in Kumaon reion. Indian. J. pathol. Microbiol. 48(4) 551-553.
15. Chakravarty A; Kashap B; and Rathi K. (2005). The seroepidemiology study on cytomegalovirus in women of child-bearing age with special reference to pregnancy and maternal-fetal transmission. Indian. J. Pathol. Microbiol. 48(4) :518-521.
16. Abraham M; Abraham P; Jana AK; Kuruvilla KA; Cherian T; Moses PD; Mathal E; John T J; and Sridharan G. (1999). Serology in Congenital Infections: Experience in Selected Symptomatic Infants. Indian. Pediatric. 36: 697-700.
17. Liberek A; Rytlewska M; Szlagatys-Sidorkiewicz A; Bako W; Luczak G; Sikorska-Wisniewska G; and Korzon M. (2002). Cytomegalovirus disease in neonates and infants-clinical presentation diagnosis and therapeutic problems-own experience. 8(12): CR815-20.
International Journal for Sciences and Technology Vol. 8, No.2, June 2013 85
18. Sian C M; Daniel T; Beverley H; and William D R.(2005). Symptomatic infant characteristics of congenital cytomegalovirus disease in Australia. J. Paediatr. Child Health. 41:449–452.
19. Remington JS; McLeod R; and Desonts SG.(1995). Infectious Diseases of Fetus and new born infants. Philadelphia. WB Saunder: 140-267.
20. Revello MG; Zavattoni M; Furione M; Baldanti F; and Gerna G.(1999). Quantification of Human Cytomegalovirus DNA in Amniotic Fluid of Mothers of congenitally Infected Fetuses. J. Clin. Microbiol. 37(10):3350-3352.
21. Holfeld P; Vial Y; Maillard-Brignen C; Vaudauxand B; and Fawer CL. (1991). Cytomegalovirus fetal infection: prenatal diagnosis. Obsterics. Gyn. 78: 615-618.
22. Friedman S; and Ford-Jones EL. (1999). Congenital cytomegalovirus infection: an update. Pediatr. Child. Health. 4(1): 35-38.
23. Benjamin B;, Berkovitch M; Ford-Jones L; and Koren G.(2001). Congenital cytomegalovirus infection. Is there breakthrough? Canad. Fam. Physic. 47: 1179-1181.
International Journal for Sciences and Technology Vol. 8, No.2, June 2013 86
Effect of Non-Thermal Plasma on Antibiotic Sensitivity and Biofilm Formation
of Normal Flora Streptococcus spp. Isolated From Patients Exposed to X-Ray
and From Healthy Persons
Ayad M.A. Fadhil (1), Reem N. Ibrahim (1), and Munira G. Ismail (2)
(1) College of Sciences / Al- Nahrain University- Baghdad (2) Tropical biological research Unit/
College of Sciences / Baghdad University / Iraq
Email : [email protected]
ABSTRACT
This study has been explored to cope determine whether Non-Thermal Plasma was able to affect the antibiotic sensitivity and biofilm formation of the normal flora Streptococcus spp. isolated from healthy persons and X-ray exposed patient. The samples collected from 14persons, 7samples from patients exposed to X-ray and 7 from healthy person from different hospitals and X-ray clinic. Seven isolates from patients exposed to X-ray and seven isolates from healthy persons were obtained depending on morphological and biochemical tests and rapid ID32 system. Culture supernatant of Streptococcus spp isolates selected were exposed to Non-Thermal Plasma for (16,18,20 and 22) seconds . The antibiotic sensitivity and biofilm formation were determined before and after irradiation. All isolates of Streptococcus spp. shows that change in susceptibility to antibiotic after exposure to Non-Thermal Plasma. The Streptococcus spp. exposed to X-Ray shows increase susceptibility in only one antibiotic bacitracin, while normal Streptococcus spp shows increase resistant to three antibiotics cephalothin, cefixime and gentamycin and increase susceptibility to bacitracin. All isolates shows decrease in biofilm formation after exposure to Non-Thermal Plasma.
الملخص باللغة العربية
للمضادات الحساسية على السينية شعةاألو الحرارية غير البالزما ثيرأت هدفت الدراسة الحالية إلى محاولة للكشف عن إمكانية
المعرضين المرضى ومن الطبيعيين شخاصاأل من المعزولة .Streptococcus spp لبكتريا الحيوي الغشاء وتكوين الحيوية .نيةالسي شعةلأل
المستشفيات مختلف من نيالطبيعي شخاصاأل من عينة 20و السينية شعةلأل المعرضين المرضى من 122، عينة 142 جمعت شخاصاأل من عزالت ةوسبع السينية شعةلأل المعرضين المرضى من عزالت ةسبع في بغداد ، وتم اختيارشعةاأل وعيادات مزروع راسب تم تعريض .Rapid ID32 بنظام والتشخيص الكيموحيوية تباراتواالخ المظهرية صفاتها على اعتمادا نيالطبيعي الحيوية للمضادات الحساسية قياس ويقةدق) 22، 20، 18، 16( لمدة الحرارية غير للبالزما Streptococcus spp .بكتريا
.التشعيع وبعد قبل الحيوي الغشاء وتكوين المعزولة العزالت ظهرتأ حيث الحرارية غير للبالزما التعرض بعد الحيوية اتللمضاد حساسيتها في تغير العزالت جميع ظهرتأ
الطبيعيين شخاصاأل من المعزولة ظهرتأ حين في الباستراسين لمضاد حساسيتها في زيادة السينية شعةلأل المعرضين المرضى من جميع ظهرتأ كما .الباستراسين لمضاد حساسيتها يف زيادة و والجنتامايسين السيفكسيم، السيفالوثين لمضادات مقاومتها في زيادة
.الحرارية غير للبالزما التعرض بعد الحيوي الغشاء تكوين في نقصان العزالت
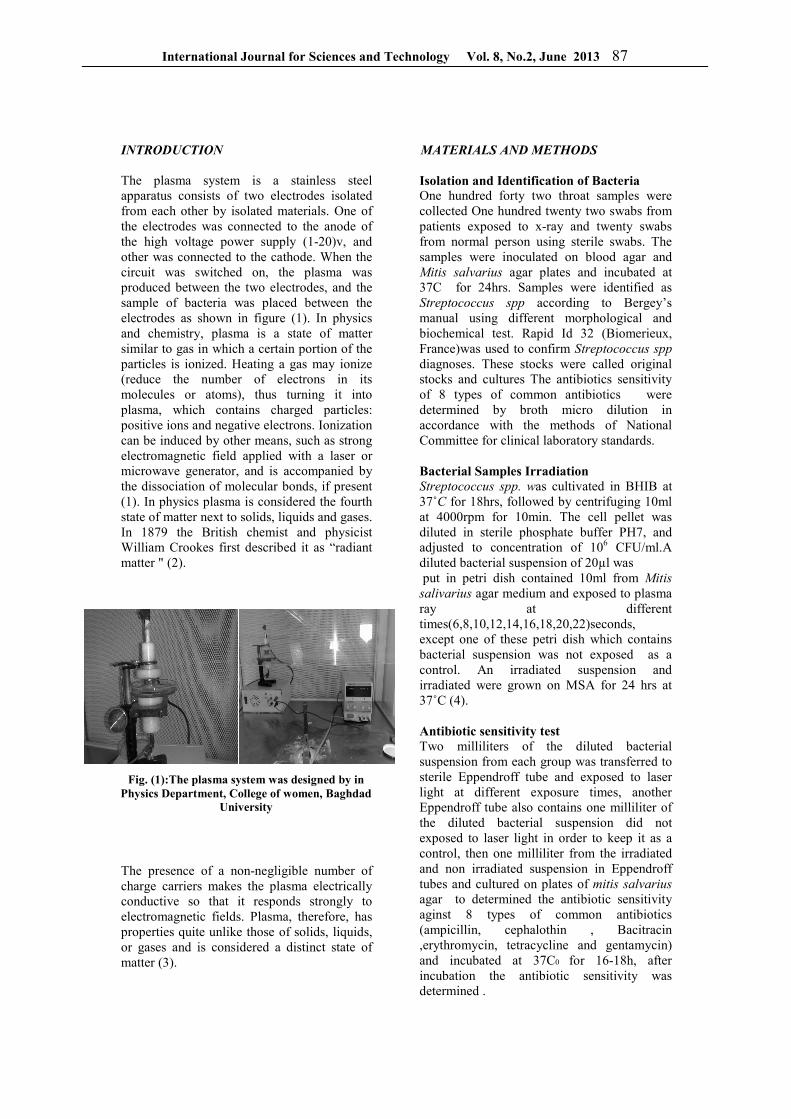
International Journal for Sciences and Technology Vol. 8, No.2, June 2013 87
INTRODUCTION
The plasma system is a stainless steel apparatus consists of two electrodes isolated from each other by isolated materials. One of the electrodes was connected to the anode of the high voltage power supply (1-20)v, and other was connected to the cathode. When the circuit was switched on, the plasma was produced between the two electrodes, and the sample of bacteria was placed between the electrodes as shown in figure (1). In physics and chemistry, plasma is a state of matter similar to gas in which a certain portion of the particles is ionized. Heating a gas may ionize (reduce the number of electrons in its molecules or atoms), thus turning it into plasma, which contains charged particles: positive ions and negative electrons. Ionization can be induced by other means, such as strong electromagnetic field applied with a laser or microwave generator, and is accompanied by the dissociation of molecular bonds, if present (1). In physics plasma is considered the fourth state of matter next to solids, liquids and gases. In 1879 the British chemist and physicist William Crookes first described it as “radiant matter " (2).
Fig. (1):The plasma system was designed by in Physics Department, College of women, Baghdad
University
The presence of a non-negligible number of charge carriers makes the plasma electrically conductive so that it responds strongly to electromagnetic fields. Plasma, therefore, has properties quite unlike those of solids, liquids, or gases and is considered a distinct state of matter (3).
MATERIALS AND METHODS
Isolation and Identification of Bacteria One hundred forty two throat samples were collected One hundred twenty two swabs from patients exposed to x-ray and twenty swabs from normal person using sterile swabs. The samples were inoculated on blood agar and Mitis salvarius agar plates and incubated at 37C for 24hrs. Samples were identified as
Streptococcus spp according to Bergey’s manual using different morphological and biochemical test. Rapid Id 32 (Biomerieux, France)was used to confirm Streptococcus spp diagnoses. These stocks were called original stocks and cultures The antibiotics sensitivity of 8 types of common antibiotics were determined by broth micro dilution in accordance with the methods of National Committee for clinical laboratory standards. Bacterial Samples Irradiation Streptococcus spp. was cultivated in BHIB at 37˚C for 18hrs, followed by centrifuging 10ml at 4000rpm for 10min. The cell pellet was diluted in sterile phosphate buffer PH7, and adjusted to concentration of 106 CFU/ml.A diluted bacterial suspension of 20µl was
put in petri dish contained 10ml from Mitis
salivarius agar medium and exposed to plasma ray at different times(6,8,10,12,14,16,18,20,22)seconds, except one of these petri dish which contains bacterial suspension was not exposed as a control. An irradiated suspension and irradiated were grown on MSA for 24 hrs at 37˚C (4). Antibiotic sensitivity test Two milliliters of the diluted bacterial suspension from each group was transferred to sterile Eppendroff tube and exposed to laser light at different exposure times, another Eppendroff tube also contains one milliliter of the diluted bacterial suspension did not exposed to laser light in order to keep it as a control, then one milliliter from the irradiated and non irradiated suspension in Eppendroff tubes and cultured on plates of mitis salvarius agar to determined the antibiotic sensitivity aginst 8 types of common antibiotics (ampicillin, cephalothin , Bacitracin ,erythromycin, tetracycline and gentamycin) and incubated at 37C0 for 16-18h, after incubation the antibiotic sensitivity was determined .
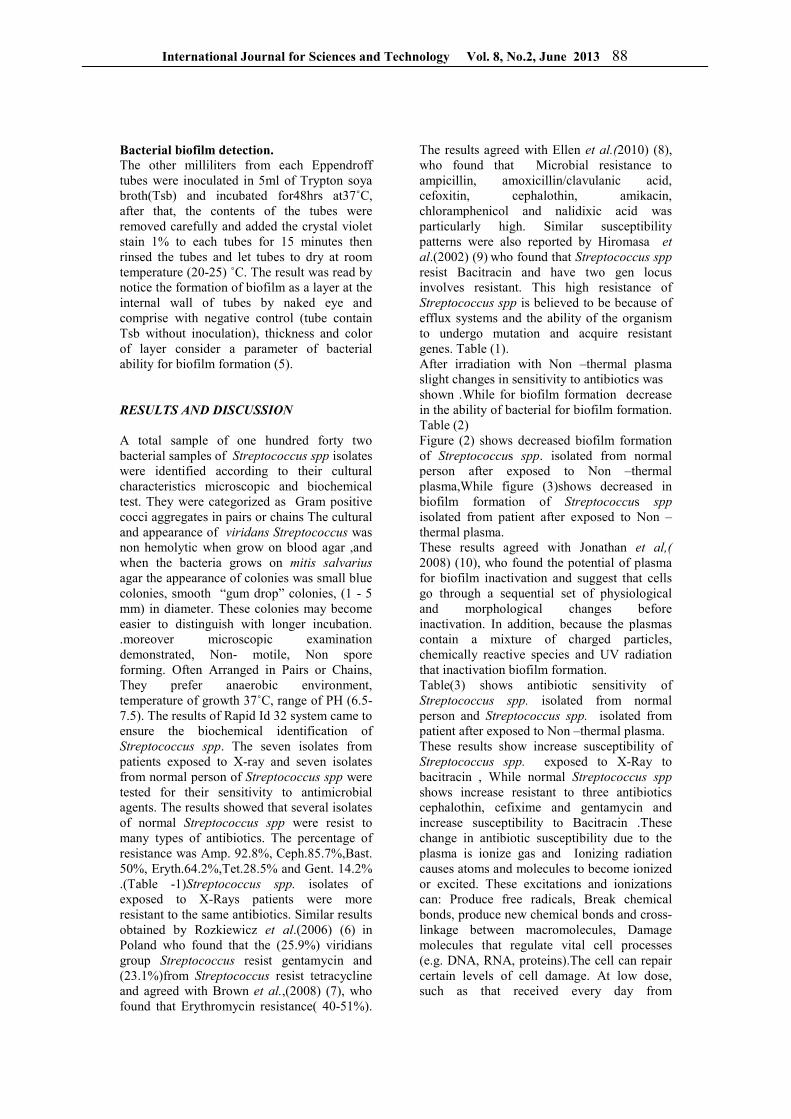
International Journal for Sciences and Technology Vol. 8, No.2, June 2013 88
Bacterial biofilm detection. The other milliliters from each Eppendroff tubes were inoculated in 5ml of Trypton soya broth(Tsb) and incubated for48hrs at37˚C, after that, the contents of the tubes were removed carefully and added the crystal violet stain 1% to each tubes for 15 minutes then rinsed the tubes and let tubes to dry at room temperature (20-25) ˚C. The result was read by notice the formation of biofilm as a layer at the internal wall of tubes by naked eye and comprise with negative control (tube contain Tsb without inoculation), thickness and color of layer consider a parameter of bacterial ability for biofilm formation (5). RESULTS AND DISCUSSION
A total sample of one hundred forty two bacterial samples of Streptococcus spp isolates were identified according to their cultural characteristics microscopic and biochemical test. They were categorized as Gram positive cocci aggregates in pairs or chains The cultural and appearance of viridans Streptococcus was non hemolytic when grow on blood agar ,and when the bacteria grows on mitis salvarius agar the appearance of colonies was small blue colonies, smooth “gum drop” colonies, (1 - 5 mm) in diameter. These colonies may become easier to distinguish with longer incubation. .moreover microscopic examination demonstrated, Non- motile, Non spore forming. Often Arranged in Pairs or Chains, They prefer anaerobic environment, temperature of growth 37˚C, range of PH (6.5-7.5). The results of Rapid Id 32 system came to ensure the biochemical identification of Streptococcus spp. The seven isolates from patients exposed to X-ray and seven isolates from normal person of Streptococcus spp were tested for their sensitivity to antimicrobial agents. The results showed that several isolates of normal Streptococcus spp were resist to many types of antibiotics. The percentage of resistance was Amp. 92.8%, Ceph.85.7%,Bast. 50%, Eryth.64.2%,Tet.28.5% and Gent. 14.2% .(Table -1)Streptococcus spp. isolates of exposed to X-Rays patients were more resistant to the same antibiotics. Similar results obtained by Rozkiewicz et al.(2006) (6) in Poland who found that the (25.9%) viridians group Streptococcus resist gentamycin and (23.1%)from Streptococcus resist tetracycline and agreed with Brown et al.,(2008) (7), who found that Erythromycin resistance( 40-51%).
The results agreed with Ellen et al.(2010) (8),
who found that Microbial resistance to ampicillin, amoxicillin/clavulanic acid, cefoxitin, cephalothin, amikacin, chloramphenicol and nalidixic acid was particularly high. Similar susceptibility patterns were also reported by Hiromasa et
al.(2002) (9) who found that Streptococcus spp resist Bacitracin and have two gen locus involves resistant. This high resistance of Streptococcus spp is believed to be because of efflux systems and the ability of the organism to undergo mutation and acquire resistant genes. Table (1). After irradiation with Non –thermal plasma slight changes in sensitivity to antibiotics was shown .While for biofilm formation decrease in the ability of bacterial for biofilm formation. Table (2) Figure (2) shows decreased biofilm formation of Streptococcus spp. isolated from normal person after exposed to Non –thermal plasma,While figure (3)shows decreased in biofilm formation of Streptococcus spp isolated from patient after exposed to Non –thermal plasma. These results agreed with Jonathan et al,(
2008) (10), who found the potential of plasma for biofilm inactivation and suggest that cells go through a sequential set of physiological and morphological changes before inactivation. In addition, because the plasmas contain a mixture of charged particles, chemically reactive species and UV radiation that inactivation biofilm formation. Table(3) shows antibiotic sensitivity of Streptococcus spp. isolated from normal person and Streptococcus spp. isolated from patient after exposed to Non –thermal plasma. These results show increase susceptibility of Streptococcus spp. exposed to X-Ray to bacitracin , While normal Streptococcus spp
shows increase resistant to three antibiotics cephalothin, cefixime and gentamycin and increase susceptibility to Bacitracin .These change in antibiotic susceptibility due to the plasma is ionize gas and Ionizing radiation causes atoms and molecules to become ionized or excited. These excitations and ionizations can: Produce free radicals, Break chemical bonds, produce new chemical bonds and cross-linkage between macromolecules, Damage molecules that regulate vital cell processes (e.g. DNA, RNA, proteins).The cell can repair certain levels of cell damage. At low dose, such as that received every day from
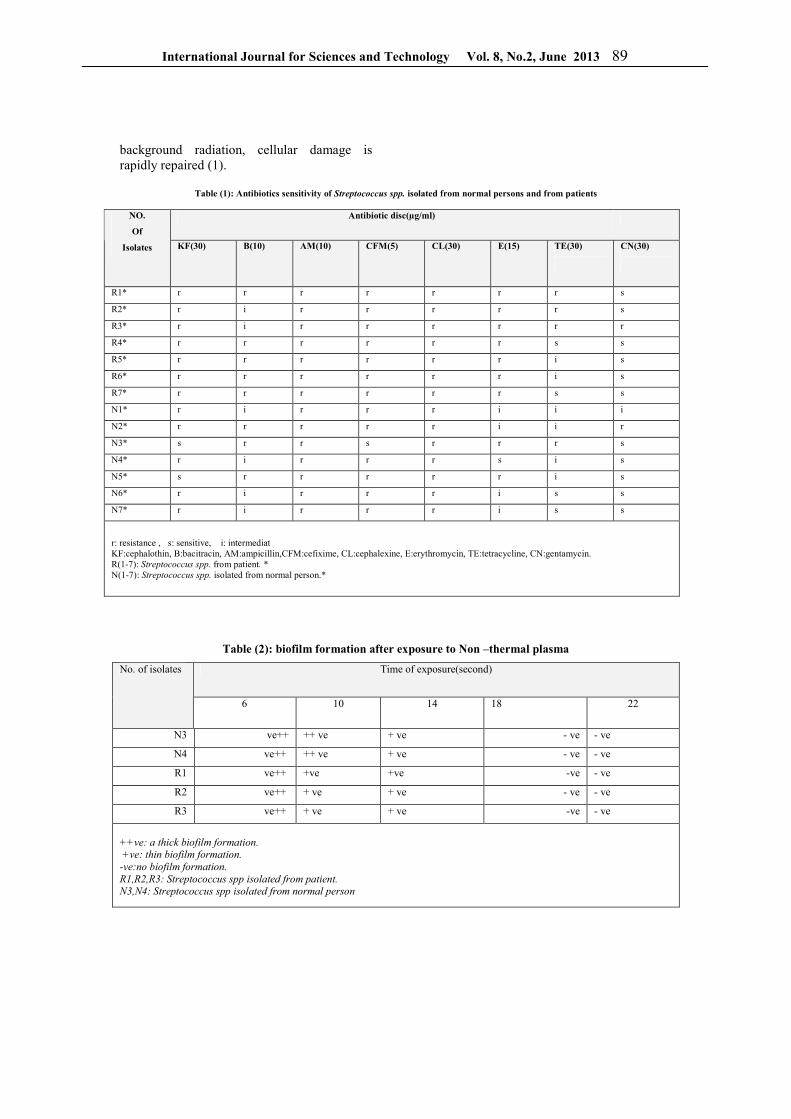
International Journal for Sciences and Technology Vol. 8, No.2, June 2013 89
background radiation, cellular damage is rapidly repaired (1).
Table (1): Antibiotics sensitivity of Streptococcus spp. isolated from normal persons and from patients
Antibiotic disc(µg/ml)
CN(30)
TE(30)
E(15) CL(30) CFM(5) AM(10) B(10) KF(30)
NO.
Of
Isolates
s r r r r r r r R1*
s r r r r r i r R2*
r r r r r r i r R3*
s s r r r r r r R4*
s i r r r r r r R5*
s i r r r r r r R6*
s s r r r r r r R7*
i i i r r r i r N1*
r i i r r r r r N2*
s r r r s r r s N3*
s i s r r r i r N4*
s i r r r r r s N5*
s s i r r r i r N6*
s s i r r r i r N7*
r: resistance , s: sensitive, i: intermediat KF:cephalothin, B:bacitracin, AM:ampicillin,CFM:cefixime, CL:cephalexine, E:erythromycin, TE:tetracycline, CN:gentamycin. R(1-7): Streptococcus spp. from patient. * N(1-7): Streptococcus spp. isolated from normal person.*
Table (2): biofilm formation after exposure to Non –thermal plasma
Time of exposure(second)
22 18 14 10 6
No. of isolates
ve - ve - ve+ ve++ ve++ N3
ve - ve - ve+ ve++ ve++ N4
ve - ve - ve+ ve + ve++ R1
ve - ve - ve+ ve+ ve++ R2
ve - ve - ve+ ve+ ve++ R3
++ve: a thick biofilm formation. +ve: thin biofilm formation.
-ve:no biofilm formation. R1,R2,R3: Streptococcus spp isolated from patient. N3,N4: Streptococcus spp isolated from normal person
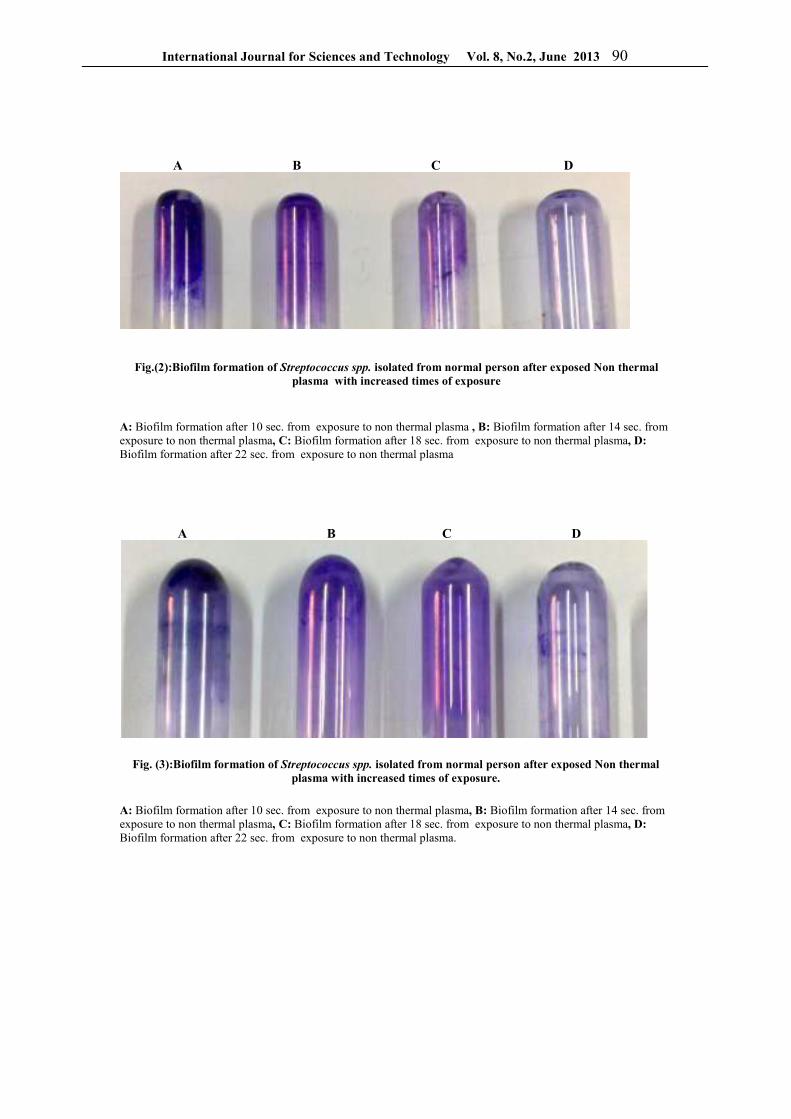
International Journal for Sciences and Technology Vol. 8, No.2, June 2013 90
A B C D
Fig.(2):Biofilm formation of Streptococcus spp. isolated from normal person after exposed Non thermal plasma with increased times of exposure
A: Biofilm formation after 10 sec. from exposure to non thermal plasma , B: Biofilm formation after 14 sec. from exposure to non thermal plasma, C: Biofilm formation after 18 sec. from exposure to non thermal plasma, D: Biofilm formation after 22 sec. from exposure to non thermal plasma
A B C D
Fig. (3):Biofilm formation of Streptococcus spp. isolated from normal person after exposed Non thermal plasma with increased times of exposure.
A: Biofilm formation after 10 sec. from exposure to non thermal plasma, B: Biofilm formation after 14 sec. from exposure to non thermal plasma, C: Biofilm formation after 18 sec. from exposure to non thermal plasma, D: Biofilm formation after 22 sec. from exposure to non thermal plasma.
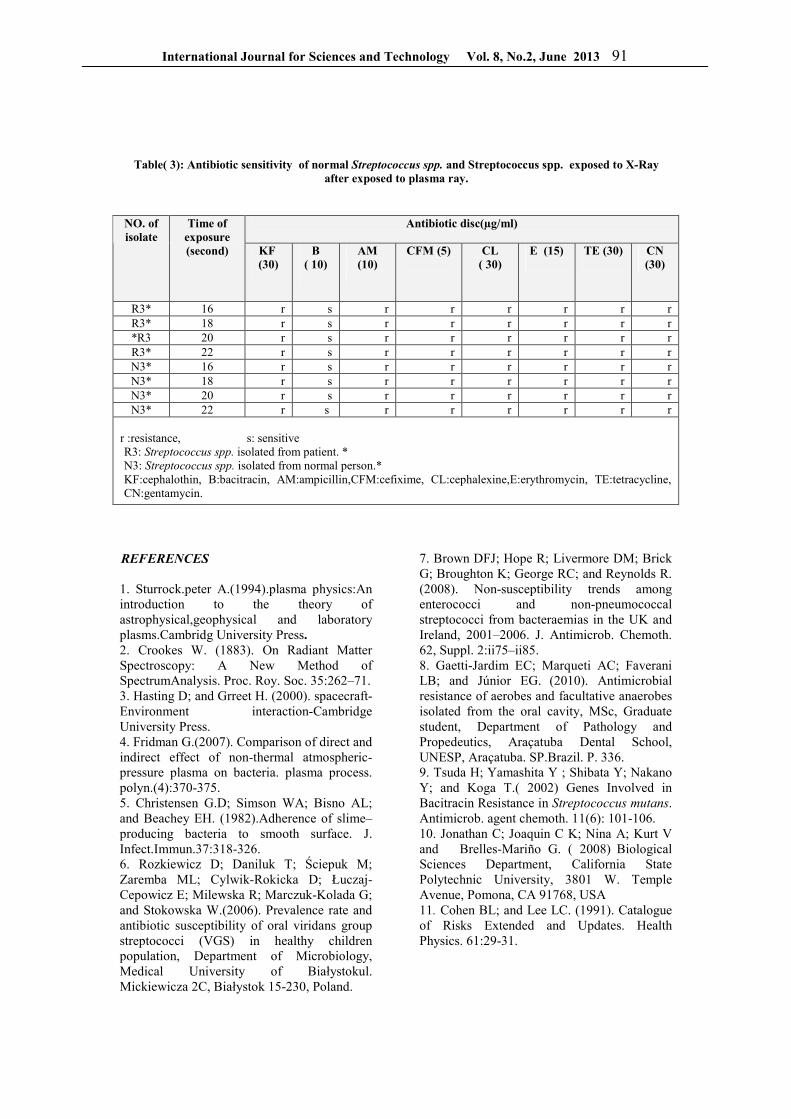
International Journal for Sciences and Technology Vol. 8, No.2, June 2013 91
Table( 3): Antibiotic sensitivity of normal Streptococcus spp. and Streptococcus spp. exposed to X-Ray
after exposed to plasma ray.
Antibiotic disc(µg/ml)
CN (30)
TE (30)
E (15)
CL ( 30)
CFM (5)
AM (10)
B ( 10)
KF (30)
Time of exposure (second)
NO. of isolate
r r r r r r s r 16 R3* r r r r r r s r 18 R3* r r r r r r s r 20 *R3 r r r r r r s r 22 R3* r r r r r r s r 16 N3* r r r r r r s r 18 N3* r r r r r r s r 20 N3* r r r r r r s r 22 N3*
r :resistance, s: sensitive R3: Streptococcus spp. isolated from patient. * N3: Streptococcus spp. isolated from normal person.* KF:cephalothin, B:bacitracin, AM:ampicillin,CFM:cefixime, CL:cephalexine,E:erythromycin, TE:tetracycline, CN:gentamycin.
REFERENCES
1. Sturrock.peter A.(1994).plasma physics:An introduction to the theory of astrophysical,geophysical and laboratory plasms.Cambridg University Press. 2. Crookes W. (1883). On Radiant Matter Spectroscopy: A New Method of SpectrumAnalysis. Proc. Roy. Soc. 35:262–71. 3. Hasting D; and Grreet H. (2000). spacecraft-Environment interaction-Cambridge University Press. 4. Fridman G.(2007). Comparison of direct and indirect effect of non-thermal atmospheric-pressure plasma on bacteria. plasma process. polyn.(4):370-375. 5. Christensen G.D; Simson WA; Bisno AL; and Beachey EH. (1982).Adherence of slime–producing bacteria to smooth surface. J. Infect.Immun.37:318-326. 6. Rozkiewicz D; Daniluk T; Ściepuk M; Zaremba ML; Cylwik-Rokicka D; Łuczaj-Cepowicz E; Milewska R; Marczuk-Kolada G; and Stokowska W.(2006). Prevalence rate and antibiotic susceptibility of oral viridans group streptococci (VGS) in healthy children population, Department of Microbiology, Medical University of Białystokul. Mickiewicza 2C, Białystok 15-230, Poland.
7. Brown DFJ; Hope R; Livermore DM; Brick G; Broughton K; George RC; and Reynolds R. (2008). Non-susceptibility trends among enterococci and non-pneumococcal streptococci from bacteraemias in the UK and Ireland, 2001–2006. J. Antimicrob. Chemoth. 62, Suppl. 2:ii75–ii85. 8. Gaetti-Jardim EC; Marqueti AC; Faverani LB; and Júnior EG. (2010). Antimicrobial resistance of aerobes and facultative anaerobes isolated from the oral cavity, MSc, Graduate student, Department of Pathology and Propedeutics, Araçatuba Dental School, UNESP, Araçatuba. SP.Brazil. P. 336. 9. Tsuda H; Yamashita Y ; Shibata Y; Nakano Y; and Koga T.( 2002) Genes Involved in Bacitracin Resistance in Streptococcus mutans. Antimicrob. agent chemoth. 11(6): 101-106. 10. Jonathan C; Joaquin C K; Nina A; Kurt V and Brelles-Mariño G. ( 2008) Biological Sciences Department, California State Polytechnic University, 3801 W. Temple Avenue, Pomona, CA 91768, USA 11. Cohen BL; and Lee LC. (1991). Catalogue of Risks Extended and Updates. Health Physics. 61:29-31.
International Journal for Sciences and Technology Vol. 8, No.2, June 2013 92
Isolation of Staphylococcus aureus from Eczema patients Zainab K. Yousif
Dept. of Basic Sciences/ College of Density / Al- Anbar University/ Iraq
ABSTRACT
The aim of this study was to explain the effect of bacterial contamination on eczema patients with a special focus on Staphylococcus aureus depending on the sensitivity test , minimal inhibitory concentration ( MIC ) values for selected antimicrobial . Fourty four eczematic patients admitted to Ramadi General Hospital in the department of Dermatology and Venereology were included in this study . Twenty five Staphylococcus aureus were recovered and the antimicrobial profile was studied . Furthermore plasmid curing for resistant isolates for cephalexin antibiotic . Out of 25 isolates of Staphylococcus aureus ( the predominant bacterial isolates ) , MIC was done for three isolates which were resistant for cephalexin antibiotic . Furthermore these three isolates were still resistant to cephalexin antibiotic. Twenty of the total patients were showing positive skin swabs cultures while thirteen patients were showing negative cultures . It is concluded that eczema patients associated with infection showed more severe eczema than patients with eczema without infection. Key Words: eczema patients , bacterial contamination .
الملخص باللغة العربية
المكورات العنقودية الذهبيـة على مرضى األكزيما ببؤرة خاصة على بكتريا تهدف هذه الدراسة إلى توضيح تأثير التلوث البكتيري شـخص فـي 44شملت عينة الدراسـة التركيز المثبط األدنى للمضادات الميكروبية المختارة، اعتمادا على اختبار الحساسية وقيم
مـن للمـرض ) حـدة ( كانوا اكثر شدة شخصا 25مستشفى الرمادي العام في قسم الجلدية والتناسلية، وأظهرت نتائج الدراسة أن بنظـام المـضادات وذلـك بعـد أن عوملـت عينـاتهم بكتيري اولئك المرضى الذين هم في حالة االكزيما غير المصحوب بخمج
. الميكروبية
International Journal for Sciences and Technology Vol. 8, No.2, June 2013 93
INTRODUCTION
Eczema is an acute or chronic non contagious skin disease characterized by redness , itching , blisters , crusting and scaling ( 1 , 2 , 3 ) . Staphylococcus aureus infection plays an important role in atopic eczema ( AE ) because of its ability to produce virulence factors such as superantigens. Epicutaneous application of superantigens induces eczema ( 4 - 6 ) . Regarding the causative triggering factors , eczema may be due to endogenous or exogenous factors or both ( 4 , 5 , 7 , 2 ) . So many evidences indicate the existence of different predisposing factors that influence the disease triggering and progress , among them are genetic and environmental factors ( 4 , 5 , 8 , 9 ) . Infections of different etiology were found to play a role in eczema inciation and propagation ( 10 -13 ) . The word eczema was derived from the Greek word Ekzein which means ( boil out ) or ( to effervesce ) ( 1 , 14 ) . The term eczema was often used synonymously with atopic dermatitis , though eczematous reactions in individuals are with and without other atopic findings such as allergic rhinitis , asthma ( 15 ) . Eczema was described as a pruritic papulovesicular process which in its acute phase is associated with erythema and edema while in it΄s more chronic phases is retaining some of its papulovesicular features dominated by thickening , lichenification and scaling (1, 16 ) . Histologically, eczema was characterized by the presence of predominantly lymphohistiocytic infiltrate around the upper dermal blood vessels associated with varying degrees of spongiosis and acanthosis , the terms “ Eczema ” and “ Dermatitis ” are regarded as synonymous ( 17 ) . Eczema was used as a clinical descriptive term to describe a process that is cleary superficial , erythematous , papulovesicular , oozing , crusting , red - purple , scaly , lichenified and possibly pigmented . Epithelial disruption and non - sharp margination are its characteristics ( 6 ) .
PATIENTS AND METHODS
Fourty four (44) swabs were taken from both sexes of patients admitted to Ramadi Teaching Hospital, in Ramadi city.
The age of the patients was varying between 20 years and 80 years old with the mean of 50 years. Methods: Swabs were cultivated on MSA, NA and incubated aerobically for 24 - 48 hrs at 37C Bacterial isolates were identified using Direct Gram stained smears and biochemical test as described by (18). Bacterial isolates were kept frozen in glycerol brain heart infusion (10%) to be used for Antimicrobial Sensitivity test later. Antibiotic Sensitivity Test Antibiotic sensitivity test was carried to study the multi - drug resistant patterns of Staphylococcus aureus isolates. Different antibiotics namely Rifampin (5mcg) , Cefodizime ( 30 mcg ) , Gentamicin ( 10 mcg ) , Cephalexin ( 30 mcg ) , Nalidixic ( 30 mcg ) , Trimethoprim ( 5 mcg ) , Amoxicillin ( 25 mcg) and Clavulanic acid ( 25 mcg ) (Bioanalyse ) were tested . Muller Hinton agar plates were surface inoculated with 20 Ml of 24 h bacterial inoculum and then discs of different antibiotics were placed uniformly on the surface of the plate. Plates were incubated at 37C° for 24h. The sensitivity and resistance of the isolates were determined according to (19). Preparation of antimicrobial solutions They were prepared as described by ( 20 ) . Cephalexin 500 mg / ml were prepared as stock solution of 1000 µg/ml of antibiotic powders in distilled water, sterilized by filtration through Millipore filter 0.22 µm and stored at - 20 C°. Determination of minimal inhibitory concentration (MIC) The minimal inhibitory concentrations (MIC) were using to know the level of resistance for antibiotics, which were as the following: The double fold dilutions of antimicrobial in five ml volumes of broth were prepared. A starting range of about eight fold higher than the normal MIC for the species has been tested and extended to at least one dilution below that of the control organism . A drug free control tube was included , thereafter one set of tubes was inoculated with a drop of well
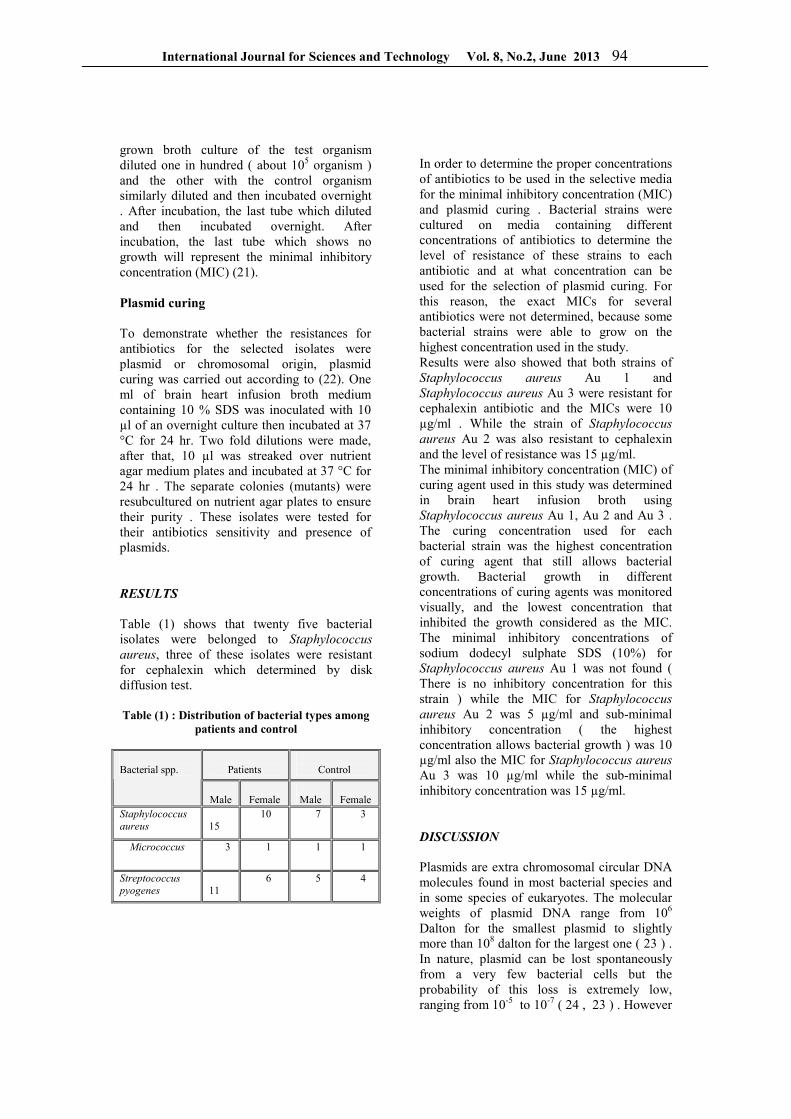
International Journal for Sciences and Technology Vol. 8, No.2, June 2013 94
grown broth culture of the test organism diluted one in hundred ( about 105 organism ) and the other with the control organism similarly diluted and then incubated overnight . After incubation, the last tube which diluted and then incubated overnight. After incubation, the last tube which shows no growth will represent the minimal inhibitory concentration (MIC) (21). Plasmid curing To demonstrate whether the resistances for antibiotics for the selected isolates were plasmid or chromosomal origin, plasmid curing was carried out according to (22). One ml of brain heart infusion broth medium containing 10 % SDS was inoculated with 10 µl of an overnight culture then incubated at 37 °C for 24 hr. Two fold dilutions were made, after that, 10 µl was streaked over nutrient agar medium plates and incubated at 37 °C for 24 hr . The separate colonies (mutants) were resubcultured on nutrient agar plates to ensure their purity . These isolates were tested for their antibiotics sensitivity and presence of plasmids. RESULTS
Table (1) shows that twenty five bacterial isolates were belonged to Staphylococcus aureus, three of these isolates were resistant for cephalexin which determined by disk diffusion test. Table (1) : Distribution of bacterial types among
patients and control
Patients
Control
Bacterial spp.
Male
Female
Male
Female
Staphylococcus
aureus
15
10 7 3
Micrococcus 3 1 1 1
Streptococcus
pyogenes
11
6 5 4
In order to determine the proper concentrations of antibiotics to be used in the selective media for the minimal inhibitory concentration (MIC) and plasmid curing . Bacterial strains were cultured on media containing different concentrations of antibiotics to determine the level of resistance of these strains to each antibiotic and at what concentration can be used for the selection of plasmid curing. For this reason, the exact MICs for several antibiotics were not determined, because some bacterial strains were able to grow on the highest concentration used in the study. Results were also showed that both strains of Staphylococcus aureus Au 1 and
Staphylococcus aureus Au 3 were resistant for cephalexin antibiotic and the MICs were 10 µg/ml . While the strain of Staphylococcus
aureus Au 2 was also resistant to cephalexin and the level of resistance was 15 µg/ml. The minimal inhibitory concentration (MIC) of curing agent used in this study was determined in brain heart infusion broth using Staphylococcus aureus Au 1, Au 2 and Au 3 . The curing concentration used for each bacterial strain was the highest concentration of curing agent that still allows bacterial growth. Bacterial growth in different concentrations of curing agents was monitored visually, and the lowest concentration that inhibited the growth considered as the MIC. The minimal inhibitory concentrations of sodium dodecyl sulphate SDS (10%) for Staphylococcus aureus Au 1 was not found ( There is no inhibitory concentration for this strain ) while the MIC for Staphylococcus
aureus Au 2 was 5 µg/ml and sub-minimal inhibitory concentration ( the highest concentration allows bacterial growth ) was 10 µg/ml also the MIC for Staphylococcus aureus Au 3 was 10 µg/ml while the sub-minimal inhibitory concentration was 15 µg/ml. DISCUSSION
Plasmids are extra chromosomal circular DNA molecules found in most bacterial species and in some species of eukaryotes. The molecular weights of plasmid DNA range from 106 Dalton for the smallest plasmid to slightly more than 108 dalton for the largest one ( 23 ) . In nature, plasmid can be lost spontaneously from a very few bacterial cells but the probability of this loss is extremely low, ranging from 10-5 to 10-7 ( 24 , 23 ) . However
International Journal for Sciences and Technology Vol. 8, No.2, June 2013 95
the majority of plasmids are extremely stable, and require the use of curing agents or other procedures that might increase the plasmid loss , and these form the basis of artificial plasmid elimination ( 25 , 24 , 23 ) . Sodium dodecyl sulphate as a detergent is known to act on the bacterial membrane ( 26 ) . ( 27 ) postulated that SDS might gain access to the membrane via the pili , that the plasmids are attached to membrane close to the pili and may thus be damaged . ( 28 ) found that exposure to SDS lead to selection of clones completely resistant to pilus - specific phages and they concluded that non - susceptibility to SDS is strongly correlated with failure to produce pili . Our results on curing experiments revealed that Staphylococcus aureus Au 1 , Au 2 and Au 3 were very resistant and the MIC was higher than the highest concentration used in this study 15 µg/ml . Samples from subminimal inhibitory concentration sub MIC ( the highest concentration allows bacterial growth ) were taken to test their antibiotic sensitivity and presence of plasmids ( 23 ) . ( 29 ) demonstrated that many plasmids can not be cured ( refractory ) . It should be mentioned that failure of plasmid curing does not imply that the trait is not plasmid - encoded . After the treatment of bacterial strains with the curing agent sodium dodecyl sulphate SDS ( 10% ) no cured cells were obtained from
Staphylococcus aureus Au 1 , Au 2 and Au 3 which means that these cells have not lost resistance marker for cephalexin and this resistance marker were encoded chromosomally . ( 30 ) postulated that the efficiency of curing generally varies from less than 0.1% to more than 99% depending upon the agent involved , the bacterial strain and the conditions used and he assumed that curing activity is generally related to the ability of these compounds to intercalate into the DNA molecule . After treatment of bacterial strains with curing agent sodium dodecyl sulphate SDS ( 10% ) no cured cells were obtained from Staphylococcus aureus Au 1 , Au 2 and Au 3 which means that these cells have not lost resistance marker for cephalexin and this resistance marker for cephalexin were encoded chromosomally.
REFERENCES
1. Domonkos A N; Arnold H L; and Odom RB. (1982). Andrew´s Diseases of the Skin , Clinical Dermatology . 7 th. Ed. Page 82, W. B. SAUNDERS COMPANY Philadelphia London Toronto IGAKU - SHOIN / SAUNDERS Tokyo. 2. Happle R. (1993). Classification of eczemas: an approach using pathogenetic criteria . Eur J Dermatol. 3: 347 – 350 3. Sweeney TM; and Dexter WW. (2003). Cholinergic urticaria in a jogger : ruling out exercise - induced anaphylaxis . Phys Sportsmed. 31( 6 ) :32 – 36. 4. Salt BH; Boguniewicz M; and Leung DY. (2012). Severe refractory atopic dermatitis in adults is highly atopic. J Allergy Clin Immunol . 119: 508–509. 5. Leung D. (2005) . Superantigens, steroid insensitivity and innate immunity in atopic eczema. Acta Derm Venereol ; Suppl 215: 11–15. 6. Akdis CA; Akdis M; Bieber T; Bindslev-Jensn C; Boguniewicz M; EigenmannP; et al. (2006). Diagnosis and treatment of atopic dermatitis in children and adults: European Academy of Allergology and Clinical Immunology/American Academy of Allergy, Asthma and Immunology /PRACTALL Consensus Report. J Allergy Clin Immunol ; 118: 152–169. 7. Al - Sarraf M M. (1989). Distribution of serum polyclonal IgE in a population with atopic allergy : familial predisposition . Master Thesis , University of Baghdad , Baghdad . Iraq. 8. Rajka G. (1989). Essential Aspects of Atopic Dermatitis . Berlin : SpringerVerlag. 9. Bandyopadhyay D. (2001). Atopic Dermatitis ( Atopic Eczema ) . Dermatology Lecture Notes (pediatricdermatology.wordpress.com/.../17-freedownloa). 10. Kotzin B L; Leung D Y M; Kappler J; and Marrack P. (1993). : Superantigens and human disease . Adv . Immunol.54 : 99. 11. Leung DY; Harbeck R; Bina P; Reiser RF; Yang E; Norris DA; Hanifin JM; and Sampson HA. (1993). Presence of IgE antibodies to Staphylococcal exotoxins on the skin of patients with atopic dermatitis . Evidence for a new group of allergens . J Clin Invest . Sep ; 92 ( 3 ) : 1374 – 80
International Journal for Sciences and Technology Vol. 8, No.2, June 2013 96
12. Nomura I; Tanaka K; Tomita H; Katsunuma T; Ohya Y; Ikeda N; Takeda T; Saito H; and Akasawa A. (1999). Evaluation of the Staphylococcal exotoxins and their specific IgE in childhood atopic dermatitis . J Allergy Clin Immunol. 104 ( 2 Pt 1 ) : 441 – 446. 13. Britton J. (2006). Eczema / Diagnosis and causes. 912-920 14. Rudikoff D; and Lebwohl M.(1998). Atopic dermatitis . Lancet , 6 ; 351 ( 9117 ) : 1715 – 21. 15. Wuthrich B; and Schmid - Grendelmeier P. (2003). The atopic eczema / dermatitis syndrome : epidemiology , natural course and immunology of the IgE - associated ( extrinsic) and non allergic ( intrinsic ) AEDS . J Investing Allergol Clin Immunol .13 (1):1- 5. 16. Landow K. ( 1997 ). Atopic dermatitis . Current concepts support old therapies and spur new ones . Postgrad. Med .101 ( 3 ) : 107 - 112. 17. Pirouzi P; and Pirouzi MA. (2003). ECZEMA . The Canadian Encyclopedia Of Dermatology. P. 409. 18. Makie Mc. (1996). Practical Medical Microbiology . 4 th . ed . NEW YORK. 19. National Committee for Clinical Laboratory Standards ( NCCLS ) (1990 ) . Performance standards for antimicrobial disk susceptibility tests . Fourth ed. Approved standard M2 - A4 . National Committee for Clinical Laboratory Standards . Villanova , Pa. 20. Sambrook J; Fritsch EF; and Maniatis T. (1989). Molecular cloning , Laboratory manual , Cold spring Harbor Laboratory . New York. 21. Winn W; Allen S; Janda W; Koneman E; Procop G; and Schreckenberger P. (2006). Konemans Color Atlas and Textbook of Diagnostic Microbiology Sixth edition , Lippincott Williams and Wilkins , Awolters Kluwer company Philadelphia . Baltimore New York , London Buenos Aries. 986 – 987. 22. Tolmasky ME; Actic LA; and Crosa JH. (1993). Virulence plasmid . In , plasmid , A practical approach . Edited by Hardy KG. Oirl press at oxford university press PP. 387 – 389. 23. Trevors JT. (1986). Plasmid curing in bacteria . FEMS Microbiol. Rev. 32 : 149 – 157. 24. Molnar J. (1988) . Antiplasmid activity of tricyclic compounds . Meth . And Find . Exptl . Clin . Pharmacol . 10 ( 7 ) : 467 – 474.
25. Groves DJ. (1979). A temperature gradient technique for the elimination of antibiotic resistance . Canad . J. Microbio . 25 : 1476 – 1484. 26. Tremblay GY; Daniels MJ; and Schaechter M. (1969). Isolation of a cell membrane - DNA nascent RNA complex from bacteria . J. Molec. Biol. 40 : 65 – 76. 27. Tomoeda M; Inuzuka M; Kubo N; and Nakamura S. (1968). Effective elimination of drug resistance and sex factors in Escherichia coli by SDS. J. Bacter. 95 : 1078 – 1089. 28. Salisbury V; Hedges RW; and Naomi D. (1972). Two modes of curing transmissible bacterial plasmids . J. G. Microb. 70 : 443 – 452. 29. Schleif RF; and Wensink PC (1982). Practical Methods in Molecular Biology. New York : Springer – Verlag. P. 219. 30. Lerman LS. (1968). The structure of DNA - acridine complex. Proceedings of the national Academy of sciences, USA; 49: 94 – 100.

International Journal for Sciences and Technology Vol. 8, No.2, June 2013 97
قسم الدراسات العربية
ARABIC SECTION
International Journal for Sciences and Technology Vol. 8, No.2, June 2013 98
توصيف عاثي الرايزوبيوم المعزول من العقد الجذرية لنبات الباقالء
)1(أjg klmn klo\س ،)2 (، efg ه\Zc اa`_]_ي)Z[\]) 1سندس علي
العراق/ جامعة بغداد / لية العلوم للبنات ك) 2(بغداد / وزارة العلوم والتكنولوجيا / دائرة البيئة والمياه ) 1(
الملخص باللغة العربية
تعتبر بكتريا الرايزوبيوم من بين أهم أجناس البكتريا المثبتة للنيتروجين الجوي وتتم العملية من خالل العالقة التعايشية بكتيريا الرايزوبيوم حيث تؤثر ) روساتالفي(بين بكتريا الرايزوبيوم والنباتات البقولية ، وتصيب عاثيات الرايزوبيوم
.على مجتمعات هذه البكتيريا في التربةتهدف الدراسة إلى عزل وتوصيف عاثي الرايزوبيوم الضاري من العقد الجذرية لنبات الباقالء باستخدام عزالت محلية
. Rhizobium leguminosarumمن بكتريا SA كخاليا مضيفة للعاثي ، عزل عاثي الرايزوبيوم R. leguminosarumتم استخدام ستة عزالت من بكتريا
،حيث أظهر شكل العاثي بالمجهر االلكتروني احتواءه على رأس سداسي وذيل قابل Agar overlayباستخدام طريقة .Myoviridae عائلة إلىن العاثي ينتمي فإللتقلص وغير مغلف وحسب المؤتمر العالمي لتصنيف الفيروسات
مليمتر ، لم يتاثر معيار العاثي بالمذيبات العضوية ) 3-1( العاثي بكونها واضحة ودائرية وتراوح قطرها بين Plaquesتميزت بقع الهيدروجيني الحامضي في حين ظل معيار العاثي ثابتا بين لألسالكلوروفورم والداي اثيل االيثر في حين أظهر العاثي حساسيته
. 8-6 الهيدروجيني األسمن جزيئاته عند تعرضه لدرجة % 94م ولمدة ساعة في حين تم تثبيط º 40 معيار العاثي عند تعرضه لدرجة حرارة لم يتأثر .م لمدة ساعةº 50حرارة
حيث أظهرت عزلة واحدة حساسيتها للعاثي ، تلعب عاثيات R. leguminosarum لبكتريا إصابته في اكان العاثي محدد بكتريا أنواع بكتريا الرايزوبيوم في الترب المختلفة ، انتخاب وتحديد أعداديطرة على الريزوبيوم دور مهم من خالل الس
.الرايزوبيوم ، التعرف والتفريق بين سالالت بكتريا الرايزوبيوم وتنميط بكتريا الرايزوبيوم
قالء بكتيريا الرايزوبيوم ، العقد الجذرية ، عاثيات الرايزوبيوم ونبات البا: الكلمات المفتاحية
ABSTRACT
Rhizobia are the most important nitrogen fixing bacteria, which do this process during symbiosis with legumes. Rhizobiophage are viruses that infect rhizobia and affect the bacterial population of the soil. The aim of this study was isolation and characterization of virulent rhizobiophage from root nodules of Vicia faba by using local isolates of Rhizobium leguminosarum . Six isolates of R. leguminosarum used as host cells Rhizobiophage (SA) isolated by using agar overlay method , electron microscopy revealed that the phage had hexagonal head with long contractile tail , non enveloped according to International Committee on taxonomy of viruses , the phage belong to the family Myoviridae. The plaques of the phage were clear and rounded with diameter ranging from (1-3)mm , The phage was found to be un affected by chloroform and diethyl ether more over the phage was sensitive to acidic pH and remain viable between pH 6-8. Thermostability studies showed that the phage remained stable at 40ºC for one hour while 94% of the phage particles were inactivated after heating for one hour at 50ºC. The host range of the phage appeared to be limited since it lysed single isolate of R. leguminosarum.
The major role of Rhizobiophage is controlling the population of rhizobia in different soils, selective elimination of some rhizobia , identification and differentiation of bacterial strains and phage typing of Rhizobium strains.
International Journal for Sciences and Technology Vol. 8, No.2, June 2013 99
المقدمة
م في الزراعة بسبب العالقة هتلعب النباتات البقولية دور ميشية مع بكتريا الرايزوبيوم المثبتة للنيتروجين الجوي التعا
فلهذه البكتريا القدرة على تكوين العقد على جذور النباتات
ولبكتريا الرايزوبيوم خصوصية عالية في ) 1(البقولية
وتحسين اإلنتاجويمكن زيادة ) 2( النبات البقولي إصابةبكتريا خاصة من أنواع إضافةالمحاصيل البقولية من خالل
وذلك من ) 3( التربة الزراعية إلى النشطةالرايزوبيوم خالل استخدام هذه البكتريا كمخصبات بيولوجية
Biological fertilizer بدال من المخصبات الكيميائية Chemical fertilizer ل خطورة تشكأنممكن من التي
على صحة اإلنسان بسبب تلوث البيئة بالمواد الناتجة من هذه المواد إضافة إلى أن المخصبات الكيميائية ممكن تحلل
أحياء التربة من Populationأن تؤثر على مجتمعات
).4(خالل تأثيرها على التركيب الفيزيائي للتربة تعتبر الباقالء المحصول البقولي الذي يحتل المرتبة السابعة
وبالرغم من وجود أكثر من ) 5(من حيث األهمية في العالم
نوع من الباقالء يتم زراعة ثمانية عشر نوع منها فقط 80
مصدر وتعتبر بذور الباقالء الناضجة) 6(بصورة واسعة جيد وغني للبروتين والنشا والمعادن فهي غذاء مهم لإلنسان
).7(والحيوان على حد سواء تتأثر مجتمعات بكتريا الرايزوبيوم في التربة الزراعية
نبات الباقالء بعوامل فيزيائية المكونة للعقد الجذرية لوكيميائية وبيولوجية مثل درجة حموضة التربة ، ملوحة
أما بخصوص ). 8(التربة ، درجة الحرارة والمعادن الثقيلة العوامل البيولوجية فتعتبر عاثيات الرايزوبيوم
Rhizobiophages من بين أهم العوامل البيولوجية التي
).9(م في التربة تؤثر على بكتريا الرايزوبيوتصنف عاثيات الرايزوبيوم إلى نوعين النوع الضاري او
ويحدث Virulent or Lytic Rhizobiophageالمحلل في هذا النوع وبعد إصابة البكتريا وانتهاء دورة تكاثر العاثي تحلل بكتريا الرايزوبيوم مؤديا إلى تقليل أعدادها
لنوع الثاني هي وبالتالي يؤدي إلى انخفاض اإلنتاج، وا ، في Temperate Rhizobiophageالعاثيات المعتدلة
هذا النوع وبعد إصابة العاثي للبكتريا ودخول الحامض النووي للعاثي إلى داخل بكتريا الرايزوبيوم يرتبط مع الحامض النووي للبكتريا دون تحللها محوال البكتريا إلى
هذا النوع ويلعب). Lysogeny) 10النوع الاليزوجيني من العاثي دورا مهما في تبادل المادة الوراثية بين بكتريا الرايزوبيوم مؤديا إلى اكتساب بكتريا الرايزوبيوم صفات
.جديدةوبالنظر لندرة وجود دراسات عن عاثيات بكتريا الرايزوبيوم لذا يهدف البحث إلى عزل وتوصيف عاثي
.نبات الباقالءبكتريا الرايزوبيوم من العقد الجذرية ل
المواد وطرائق العمل
:حقل الدراسة
تم اختيار حقل لنبات الباقالء في منطقة المدائن في محافظة بتاريخ ) اسبانية المنشأ(بغداد زرعت بذور الباقالء
وتم عزل بكتريا الرايزوبيوم والعاثي من 15/9/2012 .نباتات هذا الحقل التي جمعت بصورة عشوائية
:ألوساط الزرعية المستخدمةا
Yeast المانيتول الصلب والسائل –استخدم وسط خميرة Extract Mannitol (YEM) والمتكون من Mannitol
10 g , KH2PO4 0.2 g , K2HPO4 0.8 g , MgSO4.7H2O 0.2 g , NaCl 0.1 g , Yeast Extract 1 g , Agar 15 g , Distilled Water 1 L ,
PH=7.2-7.4ي عزل وتنمية البكتريا وكذلك استخدم ف(Bottom Agar) عزل ودراسة أثناء في تنمية البكتريا
فقد تم تخفيض نسبة (Top Agar) في أما ،صفات العاثيMannitol 0.1% , Yeast Extract 0.05% , Agar
لتقليل كمية المواد السكرية المفرزة من قبل البكتريا 0.6%)11. (
من العقد Rhizobium leguminosarumعزل بكتريا : ةالجذري
للتحري عن عاثي الرايزوبيوم تم استخدام عزالت محلية Host كخاليا مضيفة R.leguminosarumمن بكتريا
Cells. حيث تم الحصول على العقد الجذرية ) 12(اتبعت طريقة
من نباتات الباقالء بقلع النبات بالكامل مع التربة المحيطة التربة العالقة بالمجموع أزيلت, المختبر إلىنقله بجذوره و
الجذري ثم فصلت العقد الجذرية التي تميزت بكبر حجمها مع جزء صغير من ) 1(ولونها الوردي المحمر صورة
الجذر المتصل بها غسلت العقد الجذرية جيدا بالماء المقطر التربة العالقة بالعقد وغمرت إلزالةالمعقم لعدة مرات
ثواني ثم غسلت بالماء 10-5لمدة % 95يثانول بتركيز إلبا الكحول ثم غمرت في آثار إلزالة مرات 5المقطر المعقم
% 3 بتركيز (NaOCl)محلول هايبوكلورايد الصوديوم مرات 5غسلت العقد بالماء المقطر المعقم , دقائق 4لمدة ترشيح أوراق المادة المعقمة ووضعت على آثار إلزالة
الماء العالق بها ثم هرست العقد مع قليل من إلزالةمعقمة 0.1 السائل لعمل معلق بكتيري نقل منه YEMوسط
الصلب بطريقة التخطيط للحصول YEMمليلتر على وسط -24على مستعمرات منفردة بعد تحضينها بالحاضنة لمدة
. م 2±28 ساعة بدرجة حرارة 48
International Journal for Sciences and Technology Vol. 8, No.2, June 2013 100
:لعقد الجذريةعزل عاثي الرايزوبيوم من ا
بعض التحويرات حيث إجراءمع ) 13(تم اتباع طريقة ) كبيرة الحجم ذو لون احمر( عقدة جذرية فعالة أخذت
مليلتر وهرست 25ووضعت في قنينة زجاجية معقمة سعة السائل وتم YEM مليلتر من وسط 10 إليها وأضيف
Magnetic Stirrer بواسطةمجانسة الخليط لمدة دقيقتين رك بدرجة حرارة الغرفة لمدة ساعة ثم نبذ الخليط في وت
10دقيقة لمدة / دورة 3000جهاز الطرد المركزي بسرعة 0.22دقائق ورشح الرائق من خالل مرشحات دقيقة بقطر
0.1 مليلتر من الراشح و 0.1 إضافةتم , ملي مايكرون 3 إلىمليلتر من بكتريا الرايزوبيوم في الطور اللوغارتمي
من %0.6 السائل الحاوي على YEMيلتر من وسط ملAgar 45 بدرجة حرارة م (Top Agar) وتم المزج جيدا
الصلب الحاوي على YEMوصب المزيج على وسط وترك ليتصلب ثم (Bottom Agar) من االكار 1.5%
م وفحصت 28 مقلوبة بدرجة حرارة األطباقحضنت عزل عاثي أكيدت وتم (Plaques) بمالحظة البقع األطباق
منفردة بواسطة ماصة (Plaque)الرايزوبيوم بنقل بقعة 1 زجاجي معقم يحتوي على أنبوب إلىباستور معقمة
مع الرج األنبوب السائل وترك YEMمليلتر من وسط بهدوء في درجة حرارة الغرفة لمدة ساعتين ، نبذ المزيج
يقة دق/ دورة 3000بجهاز الطرد المركزي بسرعة أعاله نفس الطريقة إعادة دقائق ورشح الرائق وتم 5لمدة
من وجود وتنقية للتأكدوكررت هذه العملية لثالث دورات .العاثي
:تحضير عاثي الرايزوبيوم الخزين
Agar Overlayتم استخدام طريقة الوسط المغذي الصلب Method) 14 ( اكبر أظهرت التي األطباقحيث اختيرت YEM مليلتر من وسط 10 إضافة وتم ،لبقععدد من ا
بدرجة حرارة الغرفة األطباق وتركت ،السائل لكل طبق السائل الحاوي على YEM ساعات ثم جمع وسط 3لمدة
دورة 3000العاثي ونبذ في جهاز الطرد المركزي بسرعة دقائق ورشح الرائق من خالل مرشحات 5دقيقة لمدة /
ن وحفظ العاثي بدرجة حرارة ملي مايكرو0.22دقيقة بقطر 4 م .
معايرة عاثي الرايزوبيوم تم إذ ،)14(تم معايرة عاثي الرايزوبيوم باستخدام طريقة
مليلتر من بكتريا الرايزوبيوم في الطور 0.1 إضافة مليلتر من عاثي الرايزوبيوم من كل 0.1اللوغارتمي و
Top(ط مليلتر من وس3 إلى العشرية التخفيفاتتخفيف من (Agar YEM ومزج جيدا وصب 45 بدرجة حرارة م حتى األطباق وتركت (Bottom Agar)على سطح
م وتم اختيار 28تتصلب وحضنت مقلوبة بدرجة حرارة بقعة ) 200-100( التي يتراوح عدد البقع فيها بين األطباق
Plaque Forming Unitوحساب معيار العاثي مقدرا (PFU)قع في مقلوب التخفيف بضرب عدد الب.
:دراسة شكل العاثي بالمجهر االلكتروني
تم دراسة شكل العاثي بالمجهر االلكتروني النافذ حسب 1× 10وضعت قطرة من العاثي بمعيار ) 15(
PFU/ml12 على (Carbon-Coated 400-mesh copper grids) وتم التخلص من القطرة الفائضة باستخدام قطرة من صبغة إضافة بعدها تم ,ورقة الترشيح
Phosphate Tingestic Acid 2% , PH7 وتترك لبضعة دقائق ويتم التخلص من الصبغة الفائضة باستخدام
-Transmissionورقة ترشيح وتم فحص العينة بجهاز.Electron Microscope JEOL (JEM-1400 TEM)
:دراسة شكل بقع العاثي
باستخدام طريقة Plaqueم البقع تم دراسة شكل وحجAgar Overlay Method) 14 ( على وسطYEM
. م 28الصلب والحضانة بدرجة حرارة
:حساسية عاثي الرايزوبيوم للمذيبات الدهنية
لدراسة حساسية العاثي للمذيبات الدهنية ) 16(اتبعت طريقة ع ثنائي اثيل االيثر مأوبمزج مليلتر واحد من الكلوروفورم
19× 10مليلتر واحد من عاثي الرايزوبيوم بمعيار PFU/ml زجاجية معقمة محكمة الغلق حضنت أنابيب في
م مع الرج 30بصورة مائلة لمدة ساعة عند درجة حرارة نبذ المزيج في جهاز الطرد المركزي بسرعة , المتكرر
فصل الجزء العلوي , دقائق 10دقيقة لمدة / دورة 1000كلوروفورم والجزء السفلي في حالة ثنائي اثيل في حالة ال
االيثر وتم معايرتها جنبا الى جنب مع ضابط التجربة المتكون من مليلتر واحد من العاثي ومليلتر واحد من وسط
YEM السائل .
: الهيدروجيني على عاثي الرايزوبيوماألس تأثير
واستخدمت) 17( الهيدروجيني حسب األس تأثيرتم دراسة إضافةحيث تم ، 10-4 الهيدروجيني الواقعة بين األسقيم 9.9 إلى PFU\ml 10 ×19 مليلتر من العاثي بمعيار0.1
مليلتر من الماء المقطر المعقم وبعد حضن النماذج ذات القيم الهيدروجيني لمدة ساعة عند درجة األسالمختلفة من
النموذج ذو المتبقي واعتبر تم معايرة العاثي، م 30حرارة
. كضابط سيطرة للتجربة 7 الهيدروجيني األس
:حساسية العاثي لدرجات الحرارة المختلفة
زجاجية رقيقة أنابيبوذلك باستخدام ) 17(تم اتباع طريقة مليلتر من 9.9الجدران ومحكمة الغلق وضع في كل منها
دقيقة في حمام مائي 30الماء المقطر المعقم وحضنت لمدة درجة ) 60، 50 ،40 ،30(رجات الحرارة المرغوبة عند د
مليلتر من العاثي بمعيار0.1 أضيفمئوية ، بعدها PFU/ml 1×910 لكل انبوب ، سحب نموذج في الوقت
صفر وبعد ساعة واحدة وتم حساب مقدار االنخفاض .الحاصل في معيار العاثي
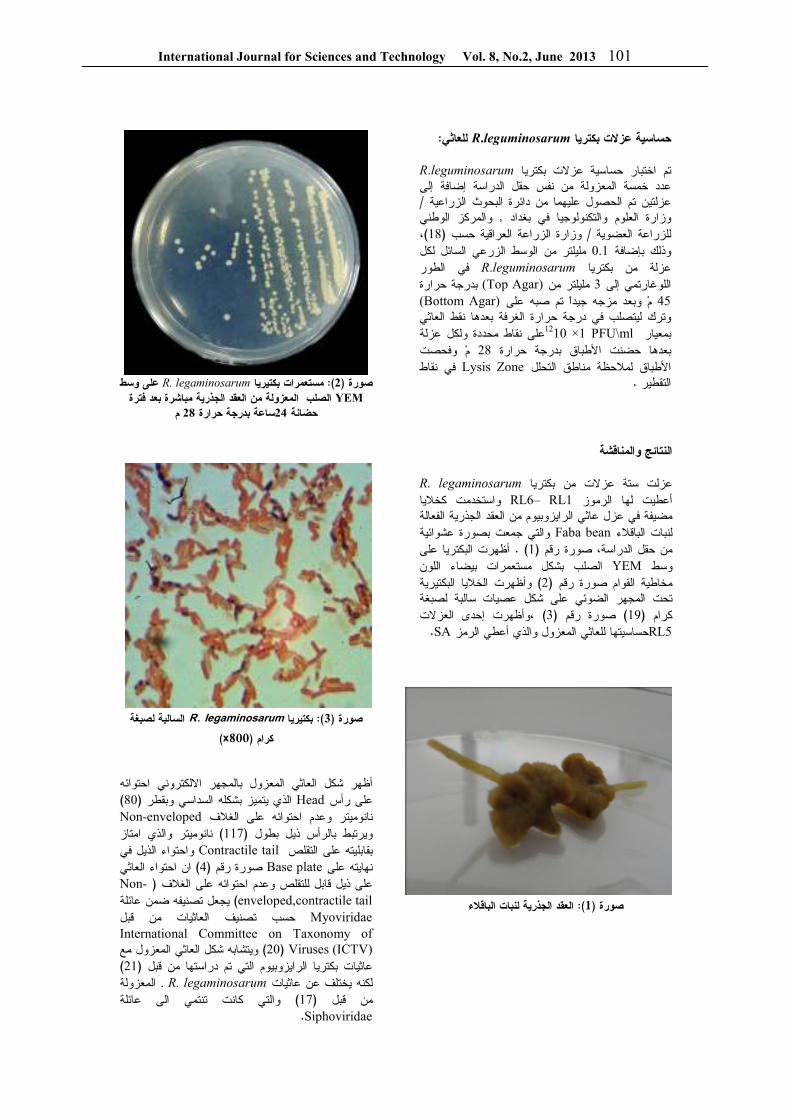
International Journal for Sciences and Technology Vol. 8, No.2, June 2013 101
: للعاثيR.leguminosarumحساسية عزالت بكتريا R.leguminosarumار حساسية عزالت بكتريا تم اختب
إلى إضافةعدد خمسة المعزولة من نفس حقل الدراسة / ا من دائرة البحوث الزراعية معزلتين تم الحصول عليه
والمركز الوطني , والتكنولوجيا في بغدادوزارة العلوم ،)18( حسب العراقيةوزارة الزراعة/ للزراعة العضوية
مليلتر من الوسط الزرعي السائل لكل 0.1 بإضافةوذلك في الطور R.leguminosarumعزلة من بكتريا
بدرجة حرارة (Top Agar) مليلتر من 3 إلىاللوغارتمي (Bottom Agar) م وبعد مزجه جيدا تم صبه على 45
وترك ليتصلب في درجة حرارة الغرفة بعدها نقط العاثي ة ولكل عزلة على نقاط محددPFU\ml 10 ×112بمعيار
م وفحصت 28 بدرجة حرارة األطباقبعدها حضنت في نقاط Lysis Zone لمالحظة مناطق التحلل األطباق .التقطير
والمناقشةالنتائج
R. legaminosarumعزلت ستة عزالت من بكتريا
واستخدمت كخاليا RL6– RL1 لها الرموز تيأعطد الجذرية الفعالة مضيفة في عزل عاثي الرايزوبيوم من العق
والتي جمعت بصورة عشوائية Faba beanلنبات الباقالء أظهرت البكتريا على ) . 1(من حقل الدراسة، صورة رقم
الصلب بشكل مستعمرات بيضاء اللون YEMوسط وأظهرت الخاليا البكتيرية ) 2(مخاطية القوام صورة رقم
تحت المجهر الضوئي على شكل عصيات سالبة لصبغة ،وأظهرت إحدى العزالت ) 3(صورة رقم ) 19(ام كر
RL5 حساسيتها للعاثي المعزول والذي أعطي الرمزSA.
لباقالءالعقد الجذرية لنبات ا): 1(صورة
على وسط R. legaminosarumريا يمستعمرات بكت): 2(صورة
YEM الصلب المعزولة من العقد الجذرية مباشرة بعد فترة م28 بدرجة حرارة ساعة24حضانة
السالبة لصبغة R. legaminosarumبكتيريا ): 3(صورة
)x800(كرام
أظهر شكل العاثي المعزول بالمجهر االلكتروني احتوائه ) 80( الذي يتميز بشكله السداسي وبقطر Headعلى رأس
Non-envelopedنانوميتر وعدم احتوائه على الغالف نانوميتر والذي امتاز ) 117(ويرتبط بالرأس ذيل بطول
واحتواء الذيل في Contractile tailبقابليته على التقلص ان احتواء العاثي ) 4( صورة رقم Base plateنهايته على
-Non( على ذيل قابل للتقلص وعدم احتوائه على الغالف enveloped,contractile tail ( يجعل تصنيفه ضمن عائلة
Myoviridaeلعاثيات من قبل حسب تصنيف اInternational Committee on Taxonomy of
Viruses (ICTV)) 20 ( ويتشابه شكل العاثي المعزول مع) 21(عاثيات بكتريا الرايزوبيوم التي تم دراستها من قبل
المعزولة R. legaminosarum .لكنه يختلف عن عاثيات والتي كانت تنتمي الى عائلة ) 17(من قبل
Siphoviridae.
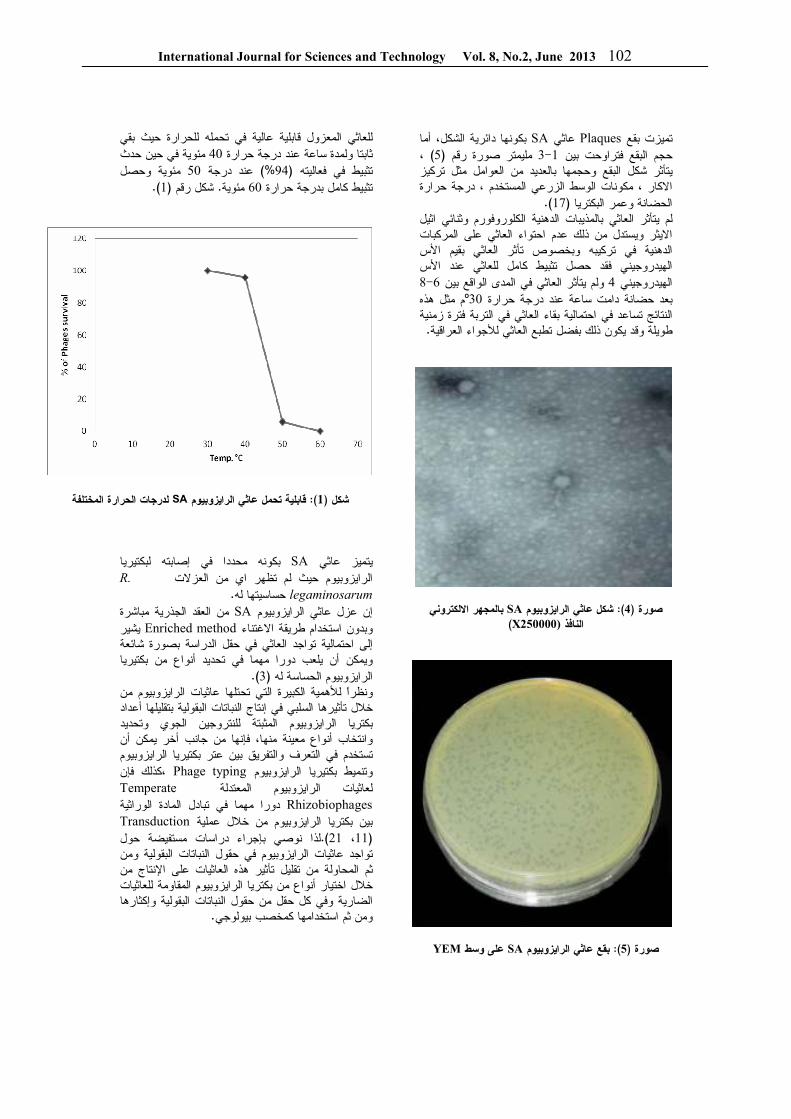
International Journal for Sciences and Technology Vol. 8, No.2, June 2013 102
أما ، بكونها دائرية الشكلSA عاثي Plaquesتميزت بقع ، ) 5( مليمتر صورة رقم 3-1حجم البقع فتراوحت بين
شكل البقع وحجمها بالعديد من العوامل مثل تركيز يتأثراالكار ، مكونات الوسط الزرعي المستخدم ، درجة حرارة
).17(الحضانة وعمر البكتريا بات الدهنية الكلوروفورم وثنائي اثيل العاثي بالمذييتأثرلم
االيثر ويستدل من ذلك عدم احتواء العاثي على المركبات األس العاثي بقيم تأثرالدهنية في تركيبه وبخصوص
األسالهيدروجيني فقد حصل تثبيط كامل للعاثي عند 8-6 العاثي في المدى الواقع بين يتأثر ولم 4الهيدروجيني
م مثل هذه 30º عند درجة حرارة بعد حضانة دامت ساعةالنتائج تساعد في احتمالية بقاء العاثي في التربة فترة زمنية
. تطبع العاثي لألجواء العراقيةطويلة وقد يكون ذلك بفضل
بالمجهر االلكتروني SAشكل عاثي الرايزوبيوم ): 4(صورة )(X250000النافذ
YEMعلى وسط SAبقع عاثي الرايزوبيوم ): 5(صورة
للعاثي المعزول قابلية عالية في تحمله للحرارة حيث بقي مئوية في حين حدث 40ثابتا ولمدة ساعة عند درجة حرارة
مئوية وحصل 50عند درجة %) 94(تثبيط في فعاليته ).1(شكل رقم . مئوية60تثبيط كامل بدرجة حرارة
لدرجات الحرارة المختلفةSAم قابلية تحمل عاثي الرايزوبيو): 1(شكل
بكونه محددا في إصابته لبكتيريا SAيتميز عاثي .Rالرايزوبيوم حيث لم تظهر اي من العزالت
legaminosarumحساسيتها له . من العقد الجذرية مباشرة SAإن عزل عاثي الرايزوبيوم
يشير Enriched methodوبدون استخدام طريقة االغتناء تمالية تواجد العاثي في حقل الدراسة بصورة شائعة إلى اح
ويمكن أن يلعب دورا مهما في تحديد أنواع من بكتيريا ).3(الرايزوبيوم الحساسة له
ونظرا لألهمية الكبيرة التي تحتلها عاثيات الرايزوبيوم من خالل تأثيرها السلبي في إنتاج النباتات البقولية بتقليلها أعداد
زوبيوم المثبتة للنتروجين الجوي وتحديد بكتريا الرايوانتخاب أنواع معينة منها، فإنها من جانب أخر يمكن أن تستخدم في التعرف والتفريق بين عتر بكتيريا الرايزوبيوم
،كذلك فإن Phage typingوتنميط بكتيريا الرايزوبيوم Temperateلعاثيات الرايزوبيوم المعتدلة
Rhizobiophagesا في تبادل المادة الوراثية دورا مهم Transductionبين بكتريا الرايزوبيوم من خالل عملية
لذا نوصي بإجراء دراسات مستفيضة حول ).21، 11(تواجد عاثيات الرايزوبيوم في حقول النباتات البقولية ومن
تأثير هذه العاثيات على اإلنتاج من ثم المحاولة من تقليليا الرايزوبيوم المقاومة للعاثيات خالل اختيار أنواع من بكتر
الضارية وفي كل حقل من حقول النباتات البقولية وإكثارها .ومن ثم استخدامها كمخصب بيولوجي
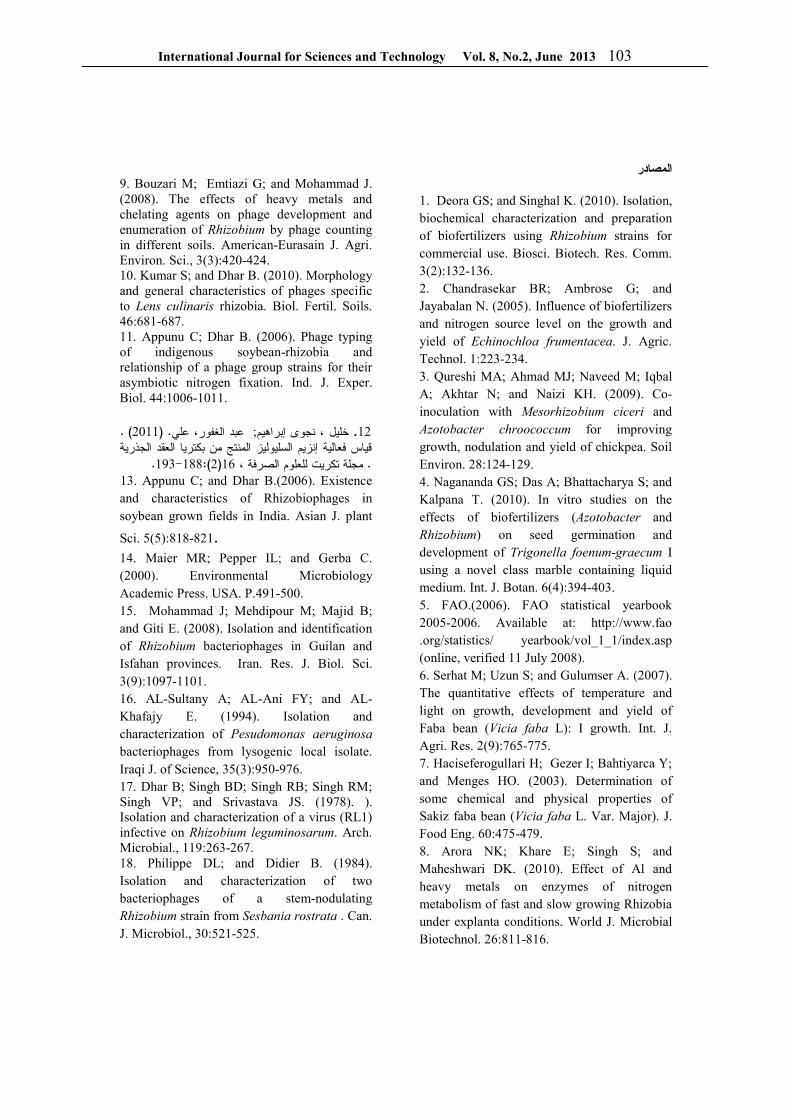
International Journal for Sciences and Technology Vol. 8, No.2, June 2013 103
المصادر
1. Deora GS; and Singhal K. (2010). Isolation, biochemical characterization and preparation of biofertilizers using Rhizobium strains for commercial use. Biosci. Biotech. Res. Comm. 3(2):132-136. 2. Chandrasekar BR; Ambrose G; and Jayabalan N. (2005). Influence of biofertilizers and nitrogen source level on the growth and yield of Echinochloa frumentacea. J. Agric. Technol. 1:223-234. 3. Qureshi MA; Ahmad MJ; Naveed M; Iqbal A; Akhtar N; and Naizi KH. (2009). Co-inoculation with Mesorhizobium ciceri and Azotobacter chroococcum for improving growth, nodulation and yield of chickpea. Soil Environ. 28:124-129. 4. Nagananda GS; Das A; Bhattacharya S; and Kalpana T. (2010). In vitro studies on the effects of biofertilizers (Azotobacter and Rhizobium) on seed germination and development of Trigonella foenum-graecum I using a novel class marble containing liquid medium. Int. J. Botan. 6(4):394-403. 5. FAO.(2006). FAO statistical yearbook 2005-2006. Available at: http://www.fao .org/statistics/ yearbook/vol_1_1/index.asp (online, verified 11 July 2008). 6. Serhat M; Uzun S; and Gulumser A. (2007). The quantitative effects of temperature and light on growth, development and yield of Faba bean (Vicia faba L): I growth. Int. J. Agri. Res. 2(9):765-775. 7. Haciseferogullari H; Gezer I; Bahtiyarca Y; and Menges HO. (2003). Determination of some chemical and physical properties of Sakiz faba bean (Vicia faba L. Var. Major). J. Food Eng. 60:475-479. 8. Arora NK; Khare E; Singh S; and Maheshwari DK. (2010). Effect of Al and heavy metals on enzymes of nitrogen metabolism of fast and slow growing Rhizobia under explanta conditions. World J. Microbial Biotechnol. 26:811-816.
9. Bouzari M; Emtiazi G; and Mohammad J. (2008). The effects of heavy metals and chelating agents on phage development and enumeration of Rhizobium by phage counting in different soils. American-Eurasain J. Agri. Environ. Sci., 3(3):420-424. 10. Kumar S; and Dhar B. (2010). Morphology and general characteristics of phages specific to Lens culinaris rhizobia. Biol. Fertil. Soils. 46:681-687. 11. Appunu C; Dhar B. (2006). Phage typing of indigenous soybean-rhizobia and relationship of a phage group strains for their asymbiotic nitrogen fixation. Ind. J. Exper. Biol. 44:1006-1011.
) . 2011 (.، علي عبد الغفور ; نجوى إبراهيم خليل ، .12 السليوليز المنتج من بكتريا العقد الجذرية إنزيمقياس فعالية
.193-188):2(16مجلة تكريت للعلوم الصرفة ، . 13. Appunu C; and Dhar B.(2006). Existence
and characteristics of Rhizobiophages in soybean grown fields in India. Asian J. plant
Sci. 5(5):818-821. 14. Maier MR; Pepper IL; and Gerba C. (2000). Environmental Microbiology Academic Press. USA. P.491-500. 15. Mohammad J; Mehdipour M; Majid B; and Giti E. (2008). Isolation and identification of Rhizobium bacteriophages in Guilan and Isfahan provinces. Iran. Res. J. Biol. Sci. 3(9):1097-1101. 16. AL-Sultany A; AL-Ani FY; and AL-Khafajy E. (1994). Isolation and characterization of Pesudomonas aeruginosa
bacteriophages from lysogenic local isolate. Iraqi J. of Science, 35(3):950-976. 17. Dhar B; Singh BD; Singh RB; Singh RM; Singh VP; and Srivastava JS. (1978). ). Isolation and characterization of a virus (RL1) infective on Rhizobium leguminosarum. Arch. Microbial., 119:263-267. 18. Philippe DL; and Didier B. (1984). Isolation and characterization of two bacteriophages of a stem-nodulating Rhizobium strain from Sesbania rostrata . Can. J. Microbiol., 30:521-525.
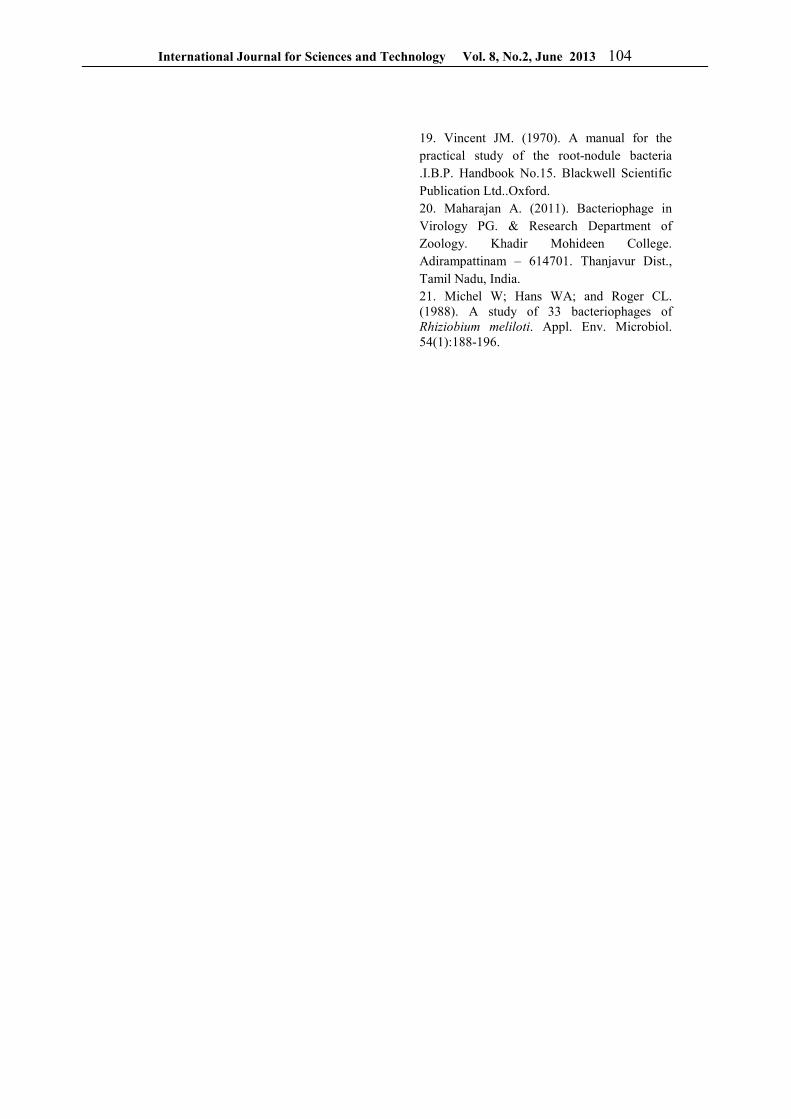
International Journal for Sciences and Technology Vol. 8, No.2, June 2013 104
19. Vincent JM. (1970). A manual for the practical study of the root-nodule bacteria .I.B.P. Handbook No.15. Blackwell Scientific Publication Ltd..Oxford. 20. Maharajan A. (2011). Bacteriophage in Virology PG. & Research Department of Zoology. Khadir Mohideen College. Adirampattinam – 614701. Thanjavur Dist., Tamil Nadu, India. 21. Michel W; Hans WA; and Roger CL. (1988). A study of 33 bacteriophages of Rhiziobium meliloti. Appl. Env. Microbiol. 54(1):188-196.
International Journal for Sciences and Technology Vol. 8, No.2, June 2013 105
في بعض مطاعم المحضرة محليا الميكروبية المعزولة من نوع من السلطات األحياءدراسة مسحية لبعض
بغداد
علياء سعد الحافظ
العراق / جامعة بغداد/ كلية التربية للبنات / قسم االقتصاد المنزلي
الملخص باللغة العربية
عفان من البكتريا السالبة والموجبة لملون غرام واألاإلنسان خطورة على األنواع أكثرعزل وتشخيص إلى هدفت الدراسة عشر موقعا في مدينة بغدادأربعةمن التي تشمل الفطريات والخمائر والطفيليات الملوثة والمعزولة من سلطة التبولة
، مدينة الصدر، األعظميةجادرية، البياع، السيدية، الوشاش، المنصور، الكاظمية، الشعب، الدورة، شارع فلسطين، ال(عزلة ) 61(ن عينة ، عزلت منها ي وستأربعة جمع خاصة لعمل وتحضير وبيع السلطة، تم )، بغداد الجديدةاإلعالمالعامل،
Escherichia coli, Citrobacter freundiiوهي بكتيرية، شملت أنواع بكتيرية سالبة لملون غرام Enterobacter gergoviae,و agglomerans Enterobacterعن نوعين من البكتريا الموجبة لملون غرام فضال Staphyllococcus aureus و Bacillus subtilis ائر عفان التي شملت الخماأل عزلة من 116، وكذلك عزلت
Yeasts وفطر Gutricum candidum و Rudotorula و Alternaria alternate وAspergillus parasticus Ascaris lambricoidesو Trichuris trichuria نوع منها 40 الطفيليات فقد تم تشخيص وأكياس بيوض أما، و Entamoiba histolytica و Balantidium coli و Entrobius vermicularis و Fasciola hepaticaو
Giardia lamblia وEchinococcus granulosus و Entamoiba coli . زرعت النماذج على اوساط زرعيةمختلفة بالنسبة للبكتريا واالعفان وعزلت الطفيليات بطريقة الفحص المباشر بالساليد وقد تم تشخيص العزالت البكتيرية
االعفان فقد شخصت بواسطة المفتاح التصنيفي للفطريات والطفيليات شخصت أما ،لكيموحيويةبوساطة بعض االختبارات ا العزالت أعداد هذه العزالت حسب المناطق، حيث يالحظ ارتفاع أعدادبواسطة االصباغ الخاصة لها ، لقد تفاوتت
مما يدل على اختالف في طرق الف المناطق العزالت باختأنواعالمعزولة من سلطة التبولة في المناطق الشعبية واختالف . التعامل مع تحضير السلطات وحسب ثقافة العاملين ودرجة الوعي لديهم في التعامل مع التحضير والتلوث االحيائي
ABSTRACT
The study aimed to isolate and diagnose the most dangerous species on the rights of the negative and positive gram stained bacteria and molds which include fungi, yeasts and parasites isolated from contaminated salad tabulla were collected from 14 different area in Baghdad city, (Al Jadria, Al Byaa'a, Al Sydya, Al Washaash, Al Mansour, Al kaadhmya, Al Shaab, Al Dorra, Sharaa Palestine, Al A'dhamya, Madyna Al Sadr, Al Amel, AL Elam, New baghdad). ), Especially for the work, preparation and sale of salads . 64 samples were obtained and isolated 61 bacterial isolate from it, it contain negative gram stain bacterial( Citrobacter freundii, Enterobacter gergoviae, Escherichia coli, Enterobacter agglomerans),and tow kind of positive gram stain bacterial (Staphyllococcus aureus, Bacillus subtilis), As well as isolated 116 isolates of molds which included yeasts and molds ( Gutricum candidum و Rudotorula و Alternaria alternate و Aspergillus parasticus) .also to parasite eggs have been diagnosed 40 type included (Trichuris trichuria ,Ascaris lambricoides ,Fasciola hepatica , Entrobius
vermicularis ,Balantidium coli , Entamoiba histolytica, Giardia lamblia ,Echinococcus granulosus,و Entamoiba
coli ). the samples were cultured in different media for bacteria and molds . The parasites isolated manner direct examination. As well as bacterial isolates diagnosed by some biochemical tests. The molds were diagnosed by the taxonomic key fungi and parasites diagnosed by her own dyes . Bacterial isolates number varied in differed areas, where it notes the high numbers of isolates recorded and found in popular areas, which shows the difference in the ways of dealing authorities in the preparation. According to the culture and the degree of awareness of the workers with the preparation and biological contamination.
International Journal for Sciences and Technology Vol. 8, No.2, June 2013 106
المقدمة
الغذاء عماد الحياة وفى سالمته سالمة اإلنسان وهو المقوم من أجل ذلك ليس المطلوب أن األساس الستمرار حياته ،
يكون الغذاء متوافرا فحسب بل األهم هو توفير الغذاء اآلمن المتوازن والطازج الخالي من جميع الملوثات التي تضر
اد المشعة والمواد بصحة اإلنسان كالمواد المضافة والموالمسرطنة والخالية من التغيرات غير المرغوبة سواء كانت ميكروبية أو أنزيمية أو كيميائية وحيث إن الغذاء وسيلة لبقاء
).1(إليه اإلنسان فإنه قد يحمل مخاطر نقل األمراض
و تعد األغذية ذات المصدر النباتي ومن ضمنها الخضار أحد ذاء البشر اليومي وباتت عصبا حيويا في المصادر األساس لغ
حياة الشعوب ومدى ازدهارها وتقدمها مما دفع بالكثير من الدول إلى توجيه اهتمام مكثف حول توفيرها والعناية بمصادرها والسعي الجاد وراء تطوير إنتاجها والحفاظ عليها من اجل الوصول إلى اكتفاء ذاتي حماية القتصادها وأمنها
).2(ي الغذائ
خالل مراحل اإلنتاج أنواعهاتتعرض المقبالت بكل والحفظ والتسويق إلى العديد من الملوثات الكيميائية والملوثات اإلحيائية التي تؤدي إلى تلفه وفساده إذا لم تتخذ اإلجراءات واالحتياطات الالزمة للحفظ والتسويق وفق
ات تكون السبل العلمية الصحيحة، فضال عن أن هذه المنتجعرضة للتلوث بأحياء مرضية عدة التي قد تستل طريقها إلى المستهلك دون علمه، ولذلك وجب دراسة طرائق العناية والسيطرة على إنتاج وحفظ هذه المنتجات لتصل إلى
).3 ( المستهلك بنوعيتها الجيدة واآلمنة من ابتداءتعتبر جميع األغذية الخام سريعة التلف والفساد
وان أحد العوامل األساسية لفساد األغذية . حصادوقت ال من الماء الفعال أنسجتهاغير المصنعة هو مقدار ما تحتويه
لذا فان الفواكه Biological active waterحيويا قليلة فضال عن احتوائها على المواد أياموالخضر تفسد في
).4( الدقيقة األحياءالغذائية الضرورية لنمو ونشاط التلف الناجم عن النمو الميكروبي في األغذية هو عملية إن
نسبية يتباين تعريفها من شخص آلخر حيث ال يمكن وضع حدود للتلف الميكروبي بصورة دقيقة إال أن هناك تعريف عام لتلف األغذية يقصد به أي تغير حسي
)Organoleptic change ( في الغذاء يؤدي إلى جعلبل المستهلك كالتغير في النكهة الغذاء غير مقبول من ق
Flavor والطعم Taste واللون Color والمظهر Appearance لذلك فإن عملية التلف تعتمد على ذوق ،
المستهلك والعادات الغذائية ونوع الغذاء، ويرتبط ذوق المستهلك عادة بالعادات الغذائية للبلد المستهلك على سبيل
المعتقة التي أجري تحلل المثال األسماك واألجبان واللحومبسيط فيها تعد أغذية مرغوب فيها في بلدان مثل مصر ودول شرق آسيا وغربها في حين تعد في بلدان أخرى تالفة وغير مرغوب فيها، أما بالنسبة لنوع الغذاء فنشاط البكتريا في غذاء ما يعد تلفا كما هو نشاط بكتريا حامض الالكتيك
اللحوم فتعد تالفة بينما تضاف في اللحوم حيث تتحمض عمدا إلى الحليب إلنتاج اللبن وهي بكتريا
Lactobacillus ونشاط بكتريا ،Acetobacter في الخل مرغوب به بينما وجودها في العصائر تلفا لها بينما هناك
االعفان لتعطي نكهات إليها كاالجبان تضاف األغذيةبعض لكنها ذات قيمة خاصة تكون غير مرغوبة في منطقتنا
).5(وسعر غال في اوربا
تتكاثر البكتريا بسرعة عند وجود مواد مغذية لها ونتيجة لاليض الناتج عنها وتحليلها للمكونات الغذائية والمواد السكرية بالذات ومؤدية الى زيادة الحموضة في المواد الغذائية وتحللها وظهور روائح غير مرغوبة مما يؤدي الى فقدان صالحيتها لألكل، وتكون لقسم منها القابلية في افراز سموم مضرة بصحة االنسان وتعد من اهم األحياء الدقيقة التي لها
كما ان لبعض انواع البكتريا قابلية .عالقة في فساد األغذيةتكوين السبورات وان تنمو في االغذية وتحدث تغييرات كثيرة
.كتحلل الكاربوهيدرات والبروتينات والتسمم باألحياء المجهرية يقسم إلى نوعين السموم
الناجم عن تلوث الغذاء ببكتريا Endotoxineالداخليةمسببة للتسمم الغذائي وهي ال تفرز السموم في الغذاء بل عند تناولها مع الغذاء يحدث التسمم حيث تتحلل داخل
Endotoxineالجسم وتفرز سمومها وتعد سموم داخلية ، ووجد Sallmonelosisي حالة التسمم بالسالمونيال كما ف
نوعان من العدوى، النوع األول يحدث نتيجة نفوذ األحياء الميكروبية داخل األمعاء حيث تتكاثر وتسبب المرض كما
، أو قد تنفذ من Shigella , Salmonellaفي بكتريا األمعاء إلى أنسجة أخرى بالجسم حيث تبدأ بالتكاثر كما هي
أما النوع الثاني هو نتيجة إفراز سم من ،Brucella حالميكروبات العدوى في أثناء تكاثرها أو تكوينها لسبورات أو
اما Clostridium perfringens تحللها في األمعاء مثل حيث تفرز البكتريا سمومها :Exotoxinالسموم الخارجية
أي Exotoxineفي الغذاء وهو من نوع السموم الخارجية س بالضرورة تناول البكتريا مع الغذاء وإنما السم الموجود لي
Staphylococcusفي الغذاء يحدث التسمم كما في aureasو Clostridium botulinum واألغذية التي
يحدث فيها التسمم الغذائي هي اللحوم والدواجن واألسماك يمكن أن تسبب . والمقبالت والحليب ومنتجاته
وبرغم .للبشر ة مع الماء والغذاء المرضالمترافق الطفيلياتغالبا ما توجد في الدول النامية، فإن الدول الطفيليات أن
المتطورة قد عانت أيضا من تفشي أمراض عديدة منقولة قد تتعرض األغذية للتلوث عن دون . عن طريق الغذاء
قصد بسبب ممارسات معالجة غير مالئمة إما خالل يمكن أن توجد . الزراعة أو خالل مرحلة معالجة الغذاء
عالم وقد تصيب الحيوانات البرية الطفيليات على مستوى الأو قد توجد في الماء فتتسبب في تلويث المحاصيل التي تزرع لالستهالك البشري؛ كما ويمكن أن يكون المرض أكثر خطورة ومزمنا في األفراد الذين يعاونون من نقص
). 6(المناعةأيضات السموم الفطرية والتي هي عبارة عن العفن ينتج
تستطيع أن تسبب أمراضا حادة (Metabolites) ثانويةوتشمل . عند تناولها في الطعام الملوث البشر ومزمنة في
التي تصيب مختلف واألورام السرطانات األمراض واالضطرابات ) القلب والكبد والكلية واألعصاب(األعضاء
.جهاز المناعي ومشاكل في اإلنجابالهضمية والتغيير في ال وغيرها والبنيسيليوم االسبرجلس واالترناريا تنمو أنواع
في السلع الزراعية أو األغذية وتنتج السموم الفطرية مثل aflatoxin و : Deoxynivalenol) و ochratoxin :
Ergot Alkaloids) وسم T-2 و: Zearalenone): Cyclopiazonic) وpatulin وتنتج السموم الفطرية
الشعير والذرة الصفراء (بشكل رئيسي في الحبوب والقهوة ومنتجات األلبان والفواكه والمكسرات ) والحنطة
ركزت السيطرة على السموم الفطرية في . والبهاراتاألغذية على تقليل إنتاج السموم الفطرية في الحقل خالل
السموم بمجرد ظهورها وال يزال التخزين أو تدمير
International Journal for Sciences and Technology Vol. 8, No.2, June 2013 107
االفالتوكسين يعتبر كأهم السموم الفطرية، ويتم افرازه فطر فقط حيث يعتبر االسبرجلس بواسطة بضعة أنواع من
flavus. Aوفطر parasiticus. Aيتأثر . أكثرها إشكاالالتعبير عن األمراض المتعلقة باالفالتوكسين بعدة عوامل
لجنس واألنواع واحتمالية التعرض مثل السن والتغذية وايعتبر الكبد العضو . المتزامن للسموم الفطرية األخرى
الهدف الرئيسي في الثدييات ولذا فإن تسمم أفالتوكسيني هو أما العوامل التي ترفع احتمالية هذا . باألساس مرض كبدي
التسمم في البشر فتشمل توفرا محدودا للغذاء والظروف نمو العفن على المواد الغذائية ونقص البيئية التي تحبذ
أنظمة التنظيم لمراقبة االفالتوكسين والسيطرة عليه، هدفت بكتريا (الدراسة الحالية تقييم درجة ونوع التلوث المايكروبي
لسلطة اإلنسانوالخطر على صحة ) ،فطريات وطفيليات العزالت أعدادالتبولة المحضرة محليا ومدى تفاوت
حسب المناطق ذات المستوى المعيشي المايكروبية ). 7 (المختلف
مصادر التلوث الغذائي
حيث يختلف تواجد ،هناك عدة مصادر لتلوث الغذاء
الكائنات الحية السطحية الطبيعية للنباتات باختالف النبات من البكتريا والخمائر واالعفان ، اأنواعلكنها عادة تضم
وع النبات وبيئته وقد الكائنات على نأعدادحيث تعتمد ماليين في السنتمتر إلى أالف أوتتراوح من عدة مئات
داخل أيضاالمربع الواحد من سطح النبات وقد وجدت التلوث عن أما, درناتها أو للنبات وعلى جذورها األنسجة
طريق الحيوانات فيكون عن طريق مرور الحيوانات على تحمله من طريق ماالنباتات التي يصنع منها الطعام وعن
شعرها وكذلك آو ريشها آو أظافرها أو على جلودها أحياء للتلوث هو مجاري آخروهناك مصدر , من خالل برازها
الصرف الصحي من خالل استخدام مخلفات الصرف األغذية تلوث إلىالصحي غير المعالج للتسميد الذي يؤدي بيوضها ولإلنسانالنباتية الطازجة بالكائنات الممرضة
التلوث من أما المعوية المعدية ،األمراضخاصة التي تسبب التربة التي تعتبر من اكبر مصادر التلوث للنبات الحتوائها
األهمية ضخمة من الكائنات الدقيقة ذات أعدادعلى وكذلك التلوث عن طريق الماء المستخدم لإلنسانالمرضية
لوث حيث في تصنيع الغذاء حيث يعتبر مصدرا مهما للت أو األغذيةيكون ناقال مهما للكائنات الدقيقة القادمة من غسل
، ومن األغذية الثلج المستخدم لحفظ أوتبريدها في المطاعم للتلوث الهواء الذي يعمل على نشر األخرىالمصادر
التنفسية لإلصاباتالكائنات الحية الممرضة وخاصة المسببة كان معرضا إذا خاصة قد يصبح المنتج الغذائي ملوثاأو
). 4(للجو بكتريا ومن البكتريا الملوثة للسلطة والمعزولة من التبولة
عصيات واسعة االنتشار وهي Escherichia coliالقولون أمعاءتتواجد في التربة والمياه والنباتات والحيوانات وفي
والحيوان وان وجودها في الغذاء يعتبر دليل تلوث اإلنسان ال هوائية اختيارا ،فضال أنها كما اإلنسانضالت الغذاء بف
قصير فهي Generation time وقت تكاثرها أنعن والغازات األحماض مجموعة كبيرة من إلىتحلل السكريات
مينية واستغاللها للمواد أ أحماض إلىوتحلل البروتين كمصادر للطاقة األخرىالكربوهيدراتية والعضوية
والنتروجين وكذلك قابليتها على تخليق اغلب الفيتامينات واسعة من درجات أمديةالضرورية لنموها ونموها ب
حساسة جدا تعتبر أنها إال. م) 46-10(الحرارة تبلغ الغذائي فهي التصنيعللحرارة حيث تقتل في درجات حرارة
الظروف وأال تكون السبورات ولذلك ال تتحمل الحرارة
غير األغذيةالبيئية القاسية لذا نرى وجودها وتكاثرها في المكورات العنقودية الذهبية،)8(المطبوخة ومنها السلطات
Staphyllococcus aureus غير متحركة غير كتريا بمكونة ااسبورات اختيارية ومستعمراتها غير منتظمة وتكون
بكتريا اأم .)9(ة مستعراتها دائرية ومحدبة مخاطيBacillus subtilisالمكونة للسبورات ائالت من الع
الزرعية األوساط مستعمراتها على Endosporeالداخلية الصلبة دائرية منتظمة وسطحا معتم غير شفاف مجعدة
قهوائية اللون وتكون سبوراتها شديدة المقاومة أوكريمية ذلك لدرجات الحرارة المستخدمة في التصنيع الغذائي ول
المعاملة حراريا والمعلبة األغذية عن تلف المسئولةتعتبر الطازجة في البلدان الحارة األغذية عن تلف مسئولةوكذلك
المعدية الخطرة األمراضتسبب العديد من . ومنها العراق محبة ( مع درجات الحرارة العالية ألفةولها والنمو بدرجات حرارة تصل Thermophilic)للحرارة
Enterobacter ما جنس ، أ)10( مئوية درجة70 إلى عائلة البكتريا المعوية إلىفهي تنتمي
Enterobacteriaceae وهي عصوية غير مكونة لالبواغ قسما منها له محفظة مستعمراتها على الوسط أن إال
أو الزرعي الصلب كبيرة ذات لون رمادي غامق مخاطية اإلنسان أمعاءغلبها في أجافة وقسما منها متحركة وتتواجد
والحيوان وقد عزلت هذه البكتريا من المستشفيات والمياه لألمراضوالتربة والبذور والفواكه وكان بعضها مسببا
وهي متحسسة األغذيةوالنباتات وعمال المطاعم ومعامل تتميز هذه Cetrobacter جنس أما ،للمضادات الحياتية
من أنماطث تحوي ثالث البكتريا بتركيبها المستضدي حيالمستضدات وهي ال هوائية متحركة وغير مكونة للكبسول
عزلت هذه . E.coliولها صفات مشتركة مع بكتريا البكتريا من النباتات والحيوانات والطيور وكذلك من التربة
عرفت كونها انتهازية مرضية وأنها واألغذيةوالمجاري )11.(
مع كبر حجمها عنها البكتريا بهواالعفان كائنات مجهرية تشنسبيا، ومن مظاهر الشبه مع أغلب أنواع البكتيريا عدم
. القدرة على التغذية الذاتية، لذلك تنمو فوق المواد العضويةفي منتشرة العفن ألف نوعا من فطريات50و وهناك نح
وتتفاوت أضرارها بين إتالف والتربة، والماء الهواءالمحاصيل بأمراض النبات الفطرية وتعفن المواد الغذائية
وتصل بعض أنواعها إلى حد إنتاج . وإتالفهاالمخزونة 250التي يبلغ عددها نحو المسرطنة أصناف من السمومالمتلفة أو المثبطة للمناعة أو لألجنة نوعا، أو المشوهة
أو التهاب الجهاز التنفسي، أو التهاب الكلى أو الجهاز للكبدومن أشهر الفطريات ذات الطبيعة السمية والملوثة العصبي
المفرز لسموم Aspergillus paraciticus فطر للغذاءالذي غالبا ما يلوث ، و(Aflatoxineds) أفالتوكسين
الحبوب والدرنات والبذور الزيتية وبعض الفواكه وأن معدل سرطان تناوله في الطعام يتناسب طرديا مع معدل انتشار
وتصنف معظم .الحيوان أو لإلنسان سواء بالنسبة، الكبد، ويستطيع الفطر الواحد في بتكاثرها الالجنسي الفطريات
، ونظرا النتقال . ظل ظروف معينة أن يتكاثر بأعداد كبيرة مكان الحبوب المعرضة للتلوث بها من مكان اإلنتاج إلى
االستهالك بسبب طول فترة النقل وتهيئة الظروف المسببة ). 12 (لتكاثرها وإفراز سمومها
ترى بالعين المجردة منها أنوالطفيليات كائنات حية يمكن ما تعيش على السطح الخارجي لجسم اإلنسان كالقمل ، وهناك أنواع أخرى تعيش داخل جسم اإلنسان في أعضائه و
كبعض أنواع الديدان ، وعليه يمكن تقسيم أحشائه الداخلية
International Journal for Sciences and Technology Vol. 8, No.2, June 2013 108
التطفل من هذه الناحية إلى تطفل ، أو تطفل (Endoparasitism) داخلي
ويمكن كذلك تقسيم التطفل . (Ectoparasitism) خارجيعلى حسب المدة أو الوقت الذي يستغله الطفيلي في عالقته بالعائل أثناء دورة حياته ، فهناك ما يعرف بالتطفل
حيث ال يعيش الطفيل (Temporary parasitism) مؤقتالطوال حياته متطفال بل يقضي إحدى مراحل دورة الحياة معتمدا على العائل كما يحدث في بعض أنواع يرقات الذباب
Permanent) ، وهناك ما يعرف بالتطفل الدائمparasitism) حيث يقضي الطفيل كل دورة حياته متطفال
يفارقه إال إلى عائل آخر عن طريق العدوى على العائل ال باالتصال المباشر ، حيث أنه لو ترك العائل يموت ، ومثال هذا النوع من الطفيليات هي السوطيات المهبلية التي تصيب اإلناث وال يمكن أن تغادر جسم اإلنسان إال إلى جسم إنسان
Periodic) وهناك أيضا التطفل الدوري. آخر parasitism) حيث يتردد الطفيل في هذه العالقة على
كما يمكن أن يصنف العائل من حين آلخر كالبعوض مثال،التطفل على حسب ظروف الطفيل التكيفية ومدى احتياجه
Obligatory) للعائل ، فهناك التطفل اإلجباريparasitism) وهو عدم مقدرة الطفيلي االستغناء عن عائله
معينة من دورة الحياة أو طوال سواء في مرحلةعائالتهأو كما يمكن أن . حياته ، وهذا ما يحدث مع معظم الطفيليات
ويحدث (Accidental parasitism) يكون التطفل عرضياهذا مع الطفيليات التي تتطفل على عائل غير عائلها الطبيعي األساسي ، ومثاله بعض أنواع الديدان الشريطية
قوارض وفي حالة توفر الفرصة التي تتطفل أساسا على الإلصابة اإلنسان فهي ال تتردد في ذلك بالرغم من أنه ليس
Incidental) كما يوجد التطفل الطارئ.عائلها األساسي parasitism) وهو وجود الطفيل في مكان غير مكانه
( الطبيعي أثناء تطفله ، فمثال نجد أن األميبا المسببة للزحار ميبية تعيش أساسا في أمعاء اإلنسان األ) الدوزينتاريا
الغليظة ، ولكن في ظروف نادرة يمكن أن تصل مع تيار . الدم إلى الدماغ والذي ال يعتبر مكانا أساسيا لمعيشتها
Opportunistic) والنوع األخير وهو التطفل االنتهازيparasitism) ونجده في بعض الكائنات التي تعيش معيشة
اد على عائل و دون أن تموت ، والتطفل حرة دون االعتمغير مفروض عليها وليس ضروريا لها ، ولكنها إذا وجدت عائال تستطيع التطفل عليه ، ومثالها األميبة الحرة التي تعيش في المياه العذبة حرة ولها سوطان يساعدانها على السباحة والتحرك في الماء ، وتحدث اإلصابة للناس الذين
المياه الملوثة حيث يدخل من فتحات األنف ومن يسبحون في ثم تشق طريقها للمخ وذلك في حالة مصادفة اإلنسان وإذا لم تصادفه ال تهلك من دونه وتكمل باقي حياتها حرة طليقة
)13.(
المواد وطرائق العمل
عينة لسلطة التبولة المحلية الطازجة من عدة مناطق 64جمعت من مدينة بغداد خاصة لعمل وتحضير وبيع السلطة مختلفة
عشر موقعا في أربعةبواقع عدة نماذج من كل منطقة ومن الجادرية، البياع، السيدية، الوشاش، (مدينة بغداد وهي
المنصور، الكاظمية، الشعب، الدورة، شارع فلسطين، ) ، بغداد الجديدةاإلعالمعظمية، مدينة الصدر، العامل، األ
المناطق شملت جانبي الكرخ والرصافة وللفترة هذه أن ويالحظ بأكياس، نقلت العينات 2012/من كانون الثاني ولغاية حزيران
عليها الفحوصات بصورة مباشرة، الفحوصات وأجريتمعقمة، مل 90 دقائق مع 5 غم من كل عينة وهرست لمدة 10أخذ :
Sterilized normal salineمن المحلول الملحي المعقم ثالث وعملت منها مل1وترك لمدة نصف ساعة ثم اخذ منه
مل وزرعت 0.1خذ من التخفيف الثالث أ متسلسلة وتخفيفات واكار الماكونكي Nutrient Agar اكار المغذي أوساطعلى
MacConky Agarواكار الدم Blood Agar واكار المانتول جاجي تم وبواسطة الناشر الز Manitol salt Agarالملحي
الزرعية وبعدها حضن على درجة حرارة األوساطفرشها على maltوكذلك اكار المالت . ساعة 24 درجة مئوية لمدة 37
extract agar واكار السابورويد Saboruid agar الزرعية األوساطوبواسطة الناشر الزجاجي تم فرشها على
أيام 3-5 درجة مئوية لمدة25وبعدها حضن على درجة حرارة الكشف عن بيوض الطفيليات أمابالنسبة لعزالت الفطريات ،
مل من محلول 5 المتكيسة فقد تم عن طريق اخذ وأطوارهااالصلي المهروسه فيها السلطة تم وضعها في انابيب جهاز
دورة في الدقيقة لمدة 3000الطرد المركزي وتدويرها بسرعة اسب واضيف عليها ثالث دقائق وبعدها اخذت قطرة من الر
اصباغ خاصة مثل الملكايت كرين وصبغة المثيل ريد وصبغة السودان بالك وفحصت تحت المجهر الضوئي واظهر الفحص وجود بيوض واطوار كيسية لطفيليات خطرة على الصحة
.العامة أجريت الفحوصات الكيموحيوية للعزالت البكتيرية باالعتماد
الفحوصات وإجراءعمرات على ملون كرام ومواصفات المست الكاتليز، االندول، إنزيم االوكسديز ، إنزيم : اآلتيةالكيموحيوية
أما. األحمروتخمر سكر الالكتوز، تحلل الدم، اختبار المثيل العزالت الفطرية فقد تم تشخيصها باستخدام المجهر الضوئي
قطعة من المستعمرة الفطرية ووضعها على شريحة بأخذوذلك قطرة عليها من صبغة الالكتوفينول الزرقاء وإضافةة زجاجي
. ومطابقتها مع المفاتيح التصنيفية لالعفان
:التحليل اإلحصائي
في التحليل اإلحـصائي ) SAS) 2010 البرنامج تم تطبيق في تحليل تأثير العوامـل المدروسـة، وقورنـت الفـروق
-Chi( مربـع كـاي باختبارالمعنوية بين النسب المختلفة square –χ2 test() 14.(
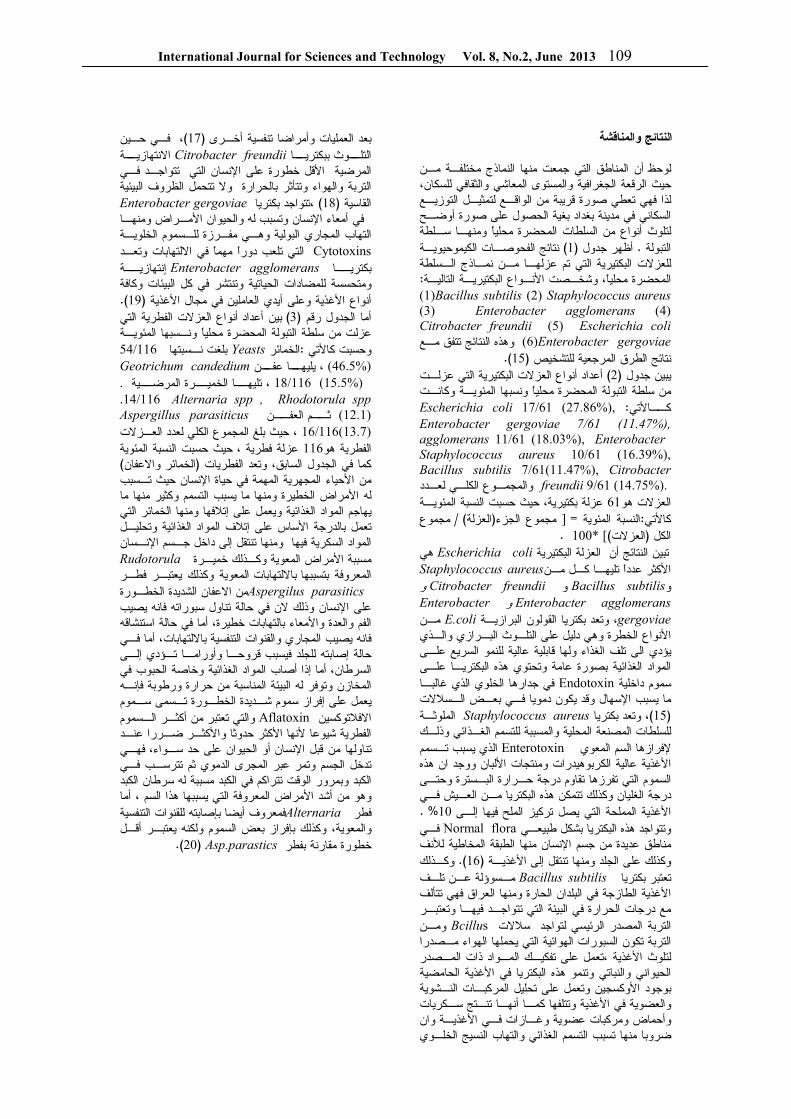
International Journal for Sciences and Technology Vol. 8, No.2, June 2013 109
النتائج والمناقشة
المناطق التي جمعت منها النماذج مختلفـة مـن أن لوحظحيث الرقعة الجغرافية والمستوى المعاشي والثقافي للسكان، لذا فهي تعطي صورة قريبة من الواقـع لتمثيـل التوزيـع
أوضـح السكاني في مدينة بغداد بغية الحصول على صورة من السلطات المحضرة محليا ومنهـا سـلطة أنواعلتلوث نتائج الفحوصـات الكيموحيويـة ) 1(أظهر جدول . التبولة
للعزالت البكتيرية التي تم عزلهـا مـن نمـاذج الـسلطة : البكتيريـة التاليـة األنـواع وشخـصت ،المحضرة محليا
(1)Bacillus subtilis (2) Staphylococcus aureus (3) Enterobacter agglomerans (4) Citrobacter freundii (5) Escherichia coli
(6)Enterobacter gergoviae وهذه النتائج تتفق مـع ). 15 (نتائج الطرق المرجعية للتشخيص
العزالت البكتيرية التي عزلـت أنواع أعداد) 2(يبين جدول نـت ونسبها المئويـة وكا امن سلطة التبولة المحضرة محلي
ــاألتي ,Escherichia coli 17/61 (27.86%):كEnterobacter gergoviae 7/61 (11.47%),
Enterobacter agglomerans 11/61 (18.03%), Staphylococcus aureus 10/61 (16.39%), Bacillus subtilis 7/61(11.47%), Citrobacter
freundii 9/61 (14.75%). والمجمـوع الكلـي لعـدد حيث حسبت النسبة المئويـة ، عزلة بكتيرية 61ت هو العزالمجموع ) / العزلة( مجموع الجزء [= النسبة المئوية :كاألتي .*100 ])العزالت(الكل
هي Escherichia coli العزلة البكتيرية أنتبين النتائج Staphylococcus aureusاألكثر عددا تليهـا كـل مـن
و Citrobacter freundii و Bacillus subtilisوEnterobacter agglomeransو Enterobacter
gergoviae وتعد بكتريا القولون البرازيـة ،E.coli مـن الخطرة وهي دليل على التلـوث البـرازي والـذي األنواع
يؤدي الى تلف الغذاء ولها قابلية عالية للنمو السريع علـى علـى البكتريـا المواد الغذائية بصورة عامة وتحتوي هذه
في جدارها الخلوي الذي غالبـا Endotoxinسموم داخلية ت وقد يكون دمويا فـي بعـض الـسالال اإلسهالما يسبب
الملوثـة Staphylococcus aureusوتعد بكتريا ،)15( المحلية والمسببة للتسمم الغـذائي وذلـك لسلطات المصنعة ل
الذي يسبب تـسمم Enterotoxin السم المعوي إلفرازها ووجد ان هذه األلبان عالية الكربوهيدرات ومنتجات األغذية
السموم التي تفرزها تقاوم درجة حـرارة البـسترة وحتـى درجة الغليان وكذلك تتمكن هذه البكتريا مـن العـيش فـي
% . 10 إلـى المملحة التي يصل تركيز الملح فيها األغذية فـي Normal floraوتتواجد هذه البكتريا بشكل طبيعـي
لألنف منها الطبقة المخاطية اإلنساندة من جسم مناطق عدي وكـذلك . )16( األغذيـة إلىوكذلك على الجلد ومنها تنتقل
مـسوؤلة عـن تلـف Bacillus subtilisتعتبر بكتريا تتألف الطازجة في البلدان الحارة ومنها العراق فهي األغذية
وتعتبـر مع درجات الحرارة في البيئة التي تتواجـد فيهـا ومـن Bcillusبة المصدر الرئيسي لتواجد سالالت التر
التربة تكون السبورات الهوائية التي يحملها الهواء مـصدرا ،تعمل على تفكيـك المـواد ذات المـصدر األغذيةلتلوث
الحامضية األغذيةالحيواني والنباتي وتنمو هذه البكتريا في وتعمل على تحليل المركبـات النـشوية األوكسجينبوجود
تنـتج سـكريات أنهـا وتتلفها كمـا األغذيةالعضوية في و وان األغذيـة ومركبات عضوية وغـازات فـي وأحماض
ضروبا منها تسبب التسمم الغذائي والتهاب النسيج الخلـوي
فـي حـين ، )17( أخـرى تنفسية وأمراضابعد العمليات ــا ــوث ببكتري ــة Citrobacter freundii التل االنتهازي
التي تتواجـد فـي اإلنسانرة على خطو األقلالمرضية وال تتحمل الظروف البيئية التربة والهواء وتتأثر بالحرارة
Enterobacter gergoviae ،تتواجد بكتريا )18(القاسية
ومنهـا األمـراض وتسبب له والحيوان اإلنسان أمعاءفي التهاب المجاري البولية وهـي مفـرزة للـسموم الخلويـة
Cytotoxins لعب دورا مهما في االلتهابات وتعـد التي تــا ــة Enterobacter agglomeransبكتري انتهازي
ومتحسسة للمضادات الحياتية وتنتشر في كل البيئات وكافة ). 19(األغذية العاملين في مجال أيدي األغذية وعلى أنواع
العزالت الفطرية التي أنواع أعدادبين ) 3( الجدول رقم أما ونـسبها المئويـة التبولة المحضرة محلي عزلت من سلطة ا
54/116 بلغت نـسبتها Yeastsالخمائر :كاألتيوحسبت ــن (46.5%) ــا عف Geotrichum candedium ، يليه
ــية (15.5%) 18/116 ــرة المرض ــا الخمي . ، تليهAlternaria spp , Rhodotorula spp .14/116
ــن (12.1) ــم العف Aspergillus parasiticus ث
المجموع الكلي لعدد العـزالت ، حيث بلغ (13.7)16/116حيث حسبت النسبة المئوية ، عزلة فطرية 116الفطرية هو
) الخمائر واالعفان (وتعد الفطريات كما في الجدول السابق، حيث تـسبب اإلنسان المجهرية المهمة في حياة األحياءمن الخطيرة ومنها ما يسبب التسمم وكثير منها ما األمراضله
ومنها الخمائر التي إتالفهايهاجم المواد الغذائية ويعمل على المواد الغذائية وتحليـل إتالف على األساستعمل بالدرجة
اإلنـسان داخل جـسم إلىالمواد السكرية فيها ومنها تنتقل Rudotorula المعوية وكـذلك خميـرة األمراضمسببة
يعتبـر فطـر المعوية وكذلك تبااللتهابا بتسببهاالمعروفة Aspergilus parasitics من االعفان الشديدة الخطـورة
وذلك الن في حالة تناول سبوراته فانه يصيب اإلنسانعلى في حالة استنشاقه أما ، بالتهابات خطيرة واألمعاءالفم والعدة
فـي أما ،فانه يصيب المجاري والقنوات التنفسية بااللتهابات ـ إصابتهحالة إلـى تـؤدي وأورامـا ا للجلد فيسبب قروح
المواد الغذائية وخاصة الحبوب في أصاب إذا أما ،السرطاننـه إالمخازن وتوفر له البيئة المناسبة من حرارة ورطوبة ف
سموم شـديدة الخطـورة تـسمى سـموم إفرازيعمل على والتي تعتبر من أكثـر الـسموم Aflatoxinاالفالتوكسين
ألكثـر ضـررا عنـد الفطرية شيوعا ألنها األكثر حدوثا وا فهـي ، الحيوان على حد سـواء أو اإلنسانتناولها من قبل
تدخل الجسم وتمر عبر المجرى الدموي ثم تترسـب فـي الكبد وبمرور الوقت تتراكم في الكبد مسببة له سرطان الكبد
، أما المعروفة التي يسببها هذا السم األمراضشد أوهو من للقنوات التنفسية هبإصابت أيضافمعروف Alternariaفطر
قـل أ بعض السموم ولكنه يعتبـر بإفراز وكذلك ،والمعوية ). Asp.parastics )20خطورة مقارنة بفطر
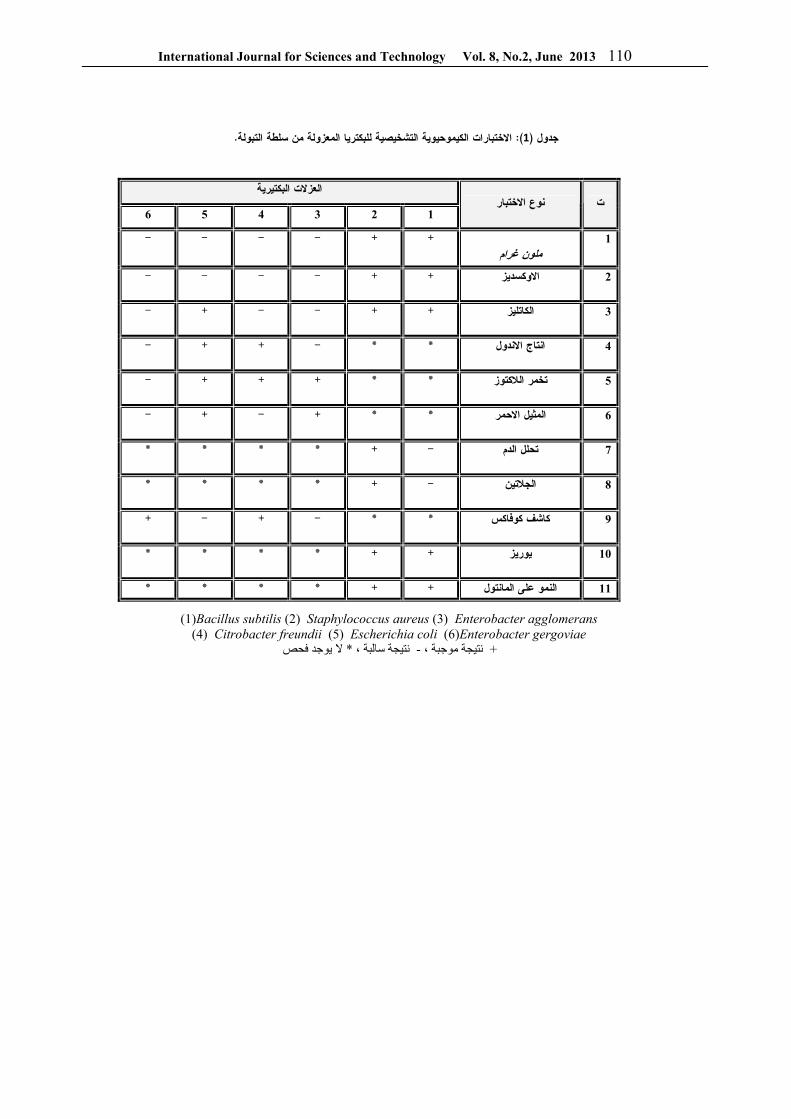
International Journal for Sciences and Technology Vol. 8, No.2, June 2013 110
.االختبارات الكيموحيوية التشخيصية للبكتريا المعزولة من سلطة التبولة): 1(جدول
(1)Bacillus subtilis (2) Staphylococcus aureus (3) Enterobacter agglomerans (4) Citrobacter freundii (5) Escherichia coli (6)Enterobacter gergoviae
، - ، ����� ����� *��� ���� � + ����� �����
العزالت البكتيرية نوع االختبار ت
1 2 3 4 5 6
1 ملون غرام
+ + - - - -
- - - - + + االوكسديز 2
- + - - + + الكاتليز 3
- + + - * * انتاج االندول 4
- + + + * * تخمر الالكتوز 5
- + - + * * المثيل االحمر 6
* * * * + - تحلل الدم 7
* * * * + - الجالتين 8
+ - + - * * كاشف كوفاكس 9
* * * * + + يوريز 10
* * * * + + على المانتولالنمو 11
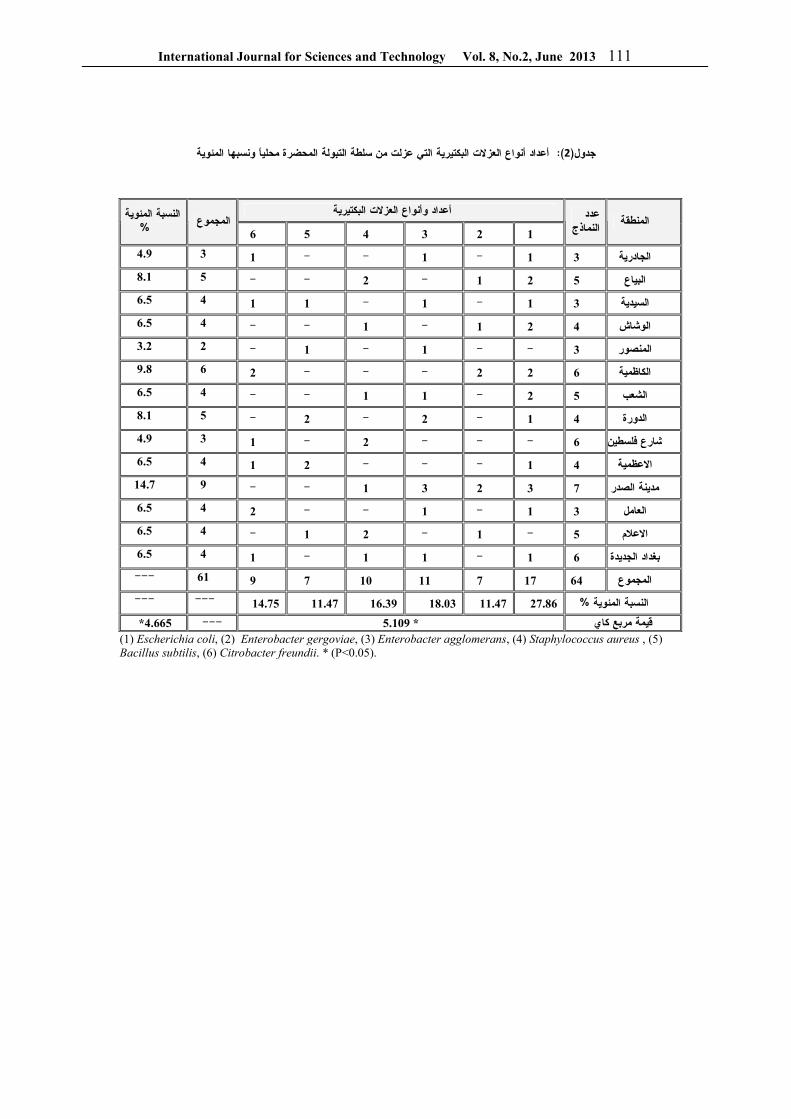
International Journal for Sciences and Technology Vol. 8, No.2, June 2013 111
ونسبها المئويةا العزالت البكتيرية التي عزلت من سلطة التبولة المحضرة محليأنواع أعداد : )2(جدول
(1) Escherichia coli, (2) Enterobacter gergoviae, (3) Enterobacter agglomerans, (4) Staphylococcus aureus , (5) Bacillus subtilis, (6) Citrobacter freundii. * (P<0.05).
العزالت البكتيريةوأنواع أعداد المنطقة
عدد النماذج
1 2 3 4 5 6 المجموع
النسبة المئوية%
4.9 3 1 - - 1 - 1 3 الجادرية
8.1 5 - - 2 - 1 2 5 البياع
6.5 4 1 1 - 1 - 1 3 السيدية
6.5 4 - - 1 - 1 2 4 الوشاش
3.2 2 - 1 - 1 - - 3 المنصور
9.8 6 2 - - - 2 2 6 الكاظمية
6.5 4 - - 1 1 - 2 5 الشعب
8.1 5 - 2 - 2 - 1 4 الدورة
4.9 3 1 - 2 - - - 6شارع فلسطين
6.5 4 1 2 - - - 1 4 االعظمية
14.7 9 - - 1 3 2 3 7 مدينة الصدر
6.5 4 2 - - 1 - 1 3 العامل
6.5 4 - 1 2 - 1 - 5 االعالم
6.5 4 1 - 1 1 - 1 6 بغداد الجديدة
--- 61 9 7 10 11 7 17 64 المجموع
--- --- 14.75 11.47 16.39 18.03 11.47 27.86 %النسبة المئوية
* 4.665 --- * 5.109 قيمة مربع كاي
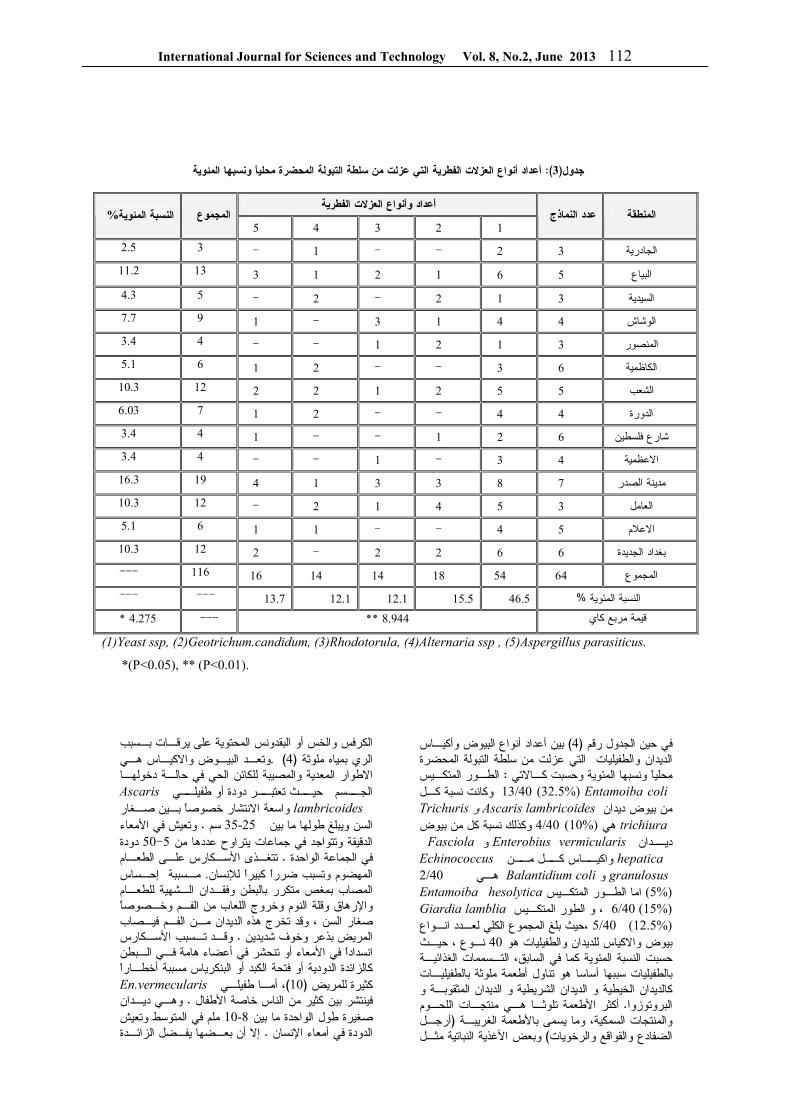
International Journal for Sciences and Technology Vol. 8, No.2, June 2013 112
ونسبها المئويةا التي عزلت من سلطة التبولة المحضرة محليفطرية العزالت الأنواع أعداد :)3(ولجد
العزالت الفطريةوأنواع أعداد عدد النماذج المنطقة
1 2 3 4 5 %النسبة المئوية المجموع
2.5 3 - 1 - - 2 3 الجادرية
11.2 13 3 1 2 1 6 5 البياع
4.3 5 - 2 - 2 1 3 السيدية
7.7 9 1 - 3 1 4 4 الوشاش
3.4 4 - - 1 2 1 3 المنصور
5.1 6 1 2 - - 3 6 الكاظمية
10.3 12 2 2 1 2 5 5 الشعب
6.03 7 1 2 - - 4 4 الدورة
3.4 4 1 - - 1 2 6 شارع فلسطين
3.4 4 - - 1 - 3 4 االعظمية
16.3 19 4 1 3 3 8 7 مدينة الصدر
10.3 12 - 2 1 4 5 3 العامل
5.1 6 1 1 - - 4 5 االعالم
10.3 12 2 - 2 2 6 6 بغداد الجديدة
--- 116 16 14 14 18 54 64 المجموع
--- -- - 13.7 12.1 12.1 15.5 46.5 %نسبة المئوية ال
*4.275 --- **8.944 قيمة مربع كاي
(1)Yeast ssp, (2)Geotrichum.candidum, (3)Rhodotorula, (4)Alternaria ssp , (5)Aspergillus parasiticus.
*(P<0.05), ** (P<0.01).
وأكيـاس البيوض أنواع أعدادبين ) 4(في حين الجدول رقم الديدان والطفيليات التي عزلت من سلطة التبولة المحضرة
الطـور المتكـيس : ونسبها المئوية وحسبت كـاالتي امحليEntamoiba coli 13/40 (32.5%) وكانت نسبة كـل
Trichuris و Ascaris lambricoidesمن بيوض ديدان
trichiura وكذلك نسبة كل من بيوض (%10) 4/40 هي ــدان Fasciola و Enterobius vermicularisدي
hepatica ــن ــل م ــاس ك Echinococcus واكي
granulosus و Balantidium coli 2/40هـي Entamoiba hesolyticaمتكـيس اما الطـور ال (5%)
Giardia lamblia ، و الطور المتكـيس (15%) 6/40
المجموع الكلي لعـدد انـواع ،حيث بلغ 5/40 (12.5%)حيـث ، نـوع 40بيوض واالكياس للديدان والطفيليات هو التـسممات الغذائيـة حسبت النسبة المئوية كما في السابق،
أطعمة ملوثة بالطفيليـات بالطفيليات سببها أساسا هو تناول كالديدان الخيطية و الديدان الشريطية و الديدان المثقوبـة و
أكثر األطعمة تلوثـا هـي منتجـات اللحـوم . البروتوزواأرجـل (والمنتجات السمكية، وما يسمى باألطعمة الغريبـة
وبعض األغذية النباتية مثـل ) الضفادع والقواقع والرخويات
س المحتوية على يرقـات بـسبب الكرفس والخس أو البقدون وتعـد البيـوض واالكيـاس هـي . )4(ملوثة الري بمياه
االطوار المعدية والمصيبة للكائن الحي في حالـة دخولهـا ــي ــر دودة أو طفيل ــث تعتب ــسم حي Ascarisالج
lambricoides واسعة االنتشار خصوصا بـين صـغار ألمعاء وتعيش في ا. سم 25-35السن ويبلغ طولها ما بين
دودة 50-5الدقيقة وتتواجد في جماعات يتراوح عددها من تتغـذى األسـكارس علـى الطعـام . في الجماعة الواحدة
مـسببة إحـساس .المهضوم وتسبب ضررا كبيرا لإلنسان المصاب بمغص متكرر بالبطن وفقـدان الـشهية للطعـام واإلرهاق وقلة النوم وخروج اللعاب من الفـم وخـصوصا
لسن ، وقد تخرج هذه الديدان مـن الفـم فيـصاب صغار ا وقـد تـسبب األسـكارس . المريض بذعر وخوف شديدين
انسدادا في األمعاء أو تنحشر في أعضاء هامة فـي الـبطن كالزائدة الدودية أو فتحة الكبد أو البنكرياس مسببة أخطـارا
En.vermecularis طفيلـي أمـا ،)10(للمريض كثيرة وهـي ديـدان . من الناس خاصة األطفال فينتشر بين كثير ملم في المتوسط وتعيش 8-10 ما بين الواحدةصغيرة طول
إال أن بعـضها يفـضل الزائـدة . الدودة في أمعاء اإلنسان
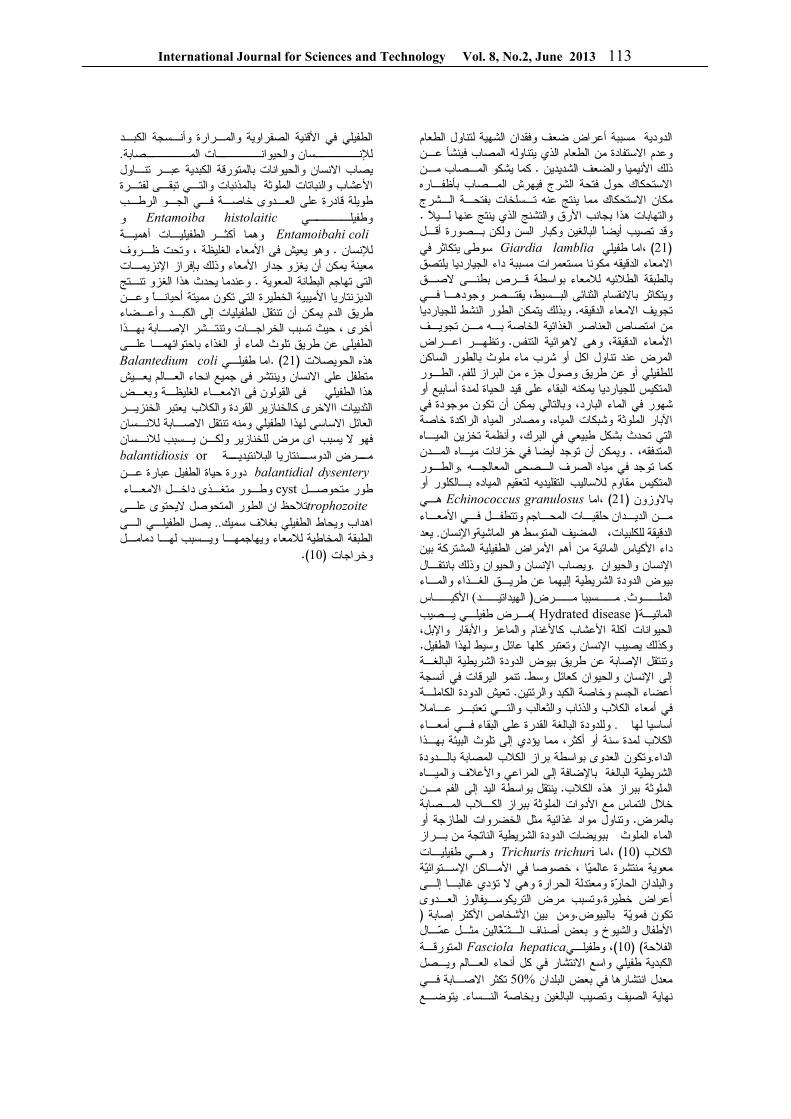
International Journal for Sciences and Technology Vol. 8, No.2, June 2013 113
ضعف وفقدان الشهية لتناول الطعام أعراضالدودية مسببة وعدم االستفادة من الطعام الذي يتناوله المصاب فينشأ عـن
كما يشكو المـصاب مـن . ا والضعف الشديدين ذلك األنيمي االستحكاك حول فتحة الشرج فيهرش المـصاب بأظفـاره مكان االستحكاك مما ينتج عنه تـسلخات بفتحـة الـشرج . والتهابات هذا بجانب األرق والتشنج الذي ينتج عنها لـيال
أقـل وقد تصيب أيضا البالغين وكبار السن ولكن بـصورة سوطى يتكاثر في Giardia lamblia ،اما طفيلي )21(
االمعاء الدقيقه مكونا مستعمرات مسببة داء الجيارديا يلتصق بالطبقة الطالئيه لالمعاء بواسطة قـرص بطنـى الصـق ويتكاثر باالنقسام الثنائى البـسيط، يقتـصر وجودهـا فـي
وبذلك يتمكن الطور النشط للجيارديا . تجويف االمعاء الدقيقه اصر الغذائية الخاصة بـه مـن تجويـف من امتصاص العن
وتظهـر اعـراض . األمعاء الدقيقة، وهى الهوائية التنفس المرض عند تناول اكل أو شرب ماء ملوث بالطور الساكن
الطـور . للطفيلي أو عن طريق وصول جزء من البراز للفم المتكيس للجيارديا يمكنه البقاء على قيد الحياة لمدة أسابيع أو
البارد، وبالتالي يمكن أن تكون موجودة في شهور في الماء اآلبار الملوثة وشبكات المياه، ومصادر المياه الراكدة خاصة التي تحدث بشكل طبيعي في البرك، وأنظمة تخزين الميـاه
ويمكن أن توجد أيضا في خزانات ميـاه المـدن . المتدفقه، والطـور ,كما توجد في مياه الصرف الـصحى المعالجـه
قاوم لالساليب التقليديه لتعقيم المياده بـالكلور أو المتكيس م هـي Echinococcus granulosus ،اما )21 (باالوزون
األمعـاء وتتطفـل فـي المحـاجم حلقيـات مـن الديـدان يعد .واالنسانالماشية هو المضيف المتوسط ،ياتللكلب الدقيقة
داء األكياس المائية من أهم األمراض الطفيلية المشتركة بين ويصاب اإلنسان والحيوان وذلك بانتقـال .اإلنسان والحيوان
بيوض الدودة الشريطية إليهما عن طريـق الغـذاء والمـاء األكيــاس ) الهيداتيــد( مــرض مــسببا.الملــوث
مـرض طفيلـي يـصيب Hydrated disease )(المائيـة الحيوانات آكلة األعشاب كاألغنام والماعز واألبقار واإلبل، . وكذلك يصيب اإلنسان وتعتبر كلها عائل وسيط لهذا الطفيل
وتنتقل اإلصابة عن طريق بيوض الدودة الشريطية البالغـة تنمو اليرقات في أنسجة . وسط إلى اإلنسان والحيوان كعائل
تعيش الدودة الكاملـة . أعضاء الجسم وخاصة الكبد والرئتين في أمعاء الكالب والذئاب والثعالب والتـي تعتبـر عـامال
وللدودة البالغة القدرة على البقاء فـي أمعـاء .أساسيا لهاالكالب لمدة سنة أو أكثر، مما يؤدي إلى تلوث البيئة بهـذا
العدوى بواسطة براز الكالب المصابة بالـدودة وتكون.الداءالشريطية البالغة باإلضافة إلى المراعي واألعالف والميـاه
بواسطة اليد إلى الفم مـن ينتقل .الملوثة ببراز هذه الكالب خالل التماس مع األدوات الملوثة ببراز الكـالب المـصابة
و وتناول مواد غذائية مثل الخضروات الطازجة أ . بالمرضببويضات الدودة الشريطية الناتجة من بـراز الماء الملوث
وهـي طفيليـات Trichuris trichuri ،اما)10(الكالب معوية منتشرة عالميا ، خصوصا في األمـاكن اإلسـتوائية والبلدان الحارة ومعتدلة الحرارة وهي ال تؤدي غالبـا إلـى
العـدوى وتسبب مرض التريكوسـيفالوز .أعراض خطيرة ( ومن بين األشخاص األكثر إصابة .تكون فموية بالبيوض
األطفال والشيوخ و بعض أصناف الـشغالين مثـل عمـال المتورقـة Fasciola hepatica وطفيلـي ،)10) (الفالحة
الكبدية طفيلي واسع االنتشار في كل أنحاء العـالم ويـصل تكثر االصـابة فـي %50معدل انتشارها في بعض البلدان
يتوضـع .ة الصيف وتصيب البالغين وبخاصة النـساء نهاي
الطفيلي في األقنية الصفراوية والمـرارة وأنـسجة الكبـد .لإلنــــــسان والحيوانــــــات المــــــصابة
يصاب االنسان والحيوانات بالمتورقة الكبدية عبـر تنـاول األعشاب والنباتات الملوثة بالمذنبات والتـي تبقـى لفتـرة
فـي الجـو الرطـب طويلة قادرة على العـدوى خاصـة ــي و Entamoiba histolaiticوطفيلـــ
Entamoibahi coli وهما أكثـر الطفيليـات أهميـة وهو يعيش فى األمعاء الغليظة ، وتحت ظـروف . لإلنسان
معينة يمكن أن يغزو جدار األمعاء وذلك بإفراز اإلنزيمـات وعندما يحدث هذا الغزو تنـتج . المعوية التى تهاجم البطانة
الديزنتاريا األميبية الخطيرة التى تكون مميتة أحيانـا وعـن طريق الدم يمكن أن تنتقل الطفيليات إلى الكبـد وأعـضاء أخرى ، حيث تسبب الخراجـات وتنتـشر اإلصـابة بهـذا الطفيلى عن طريق تلوث الماء أو الغذاء باحتوائهمـا علـى
Balantedium coliاما طفيلـي .) 21 (الحويصالتهذه متطفل على االنسان وينتشر فى جميع انحاء العـالم يعـيش
فى القولون فى االمعـاء الغليظـة وبعـض هذا الطفيلي يعتبر الخنزيـر الثدييات ااالخرى كالخنازير القردة والكالب
العائل االساسى لهذا الطفيلي ومنه تنتقل االصـابة لالنـسان اى مرض للخنازير ولكـن يـسبب لالنـسان يسبب فهو ال
ــة ــنتاريا البالنتيدي ــرض الدوس balantidiosis or مbalantidial dysentery دورة حياة الطفيل عبارة عـن
وطـور متغـذى داخـل االمعـاء cyst طور متحوصـل trophozoite تالحظ ان الطور المتحوصل اليحتوى علـى
الطفيلـي الـى يصل ..اهداب ويحاط الطفيلي بغالف سميك الطبقة المخاطية لالمعاء ويهاجمهـا ويـسبب لهـا دمامـل
).10( وخراجات
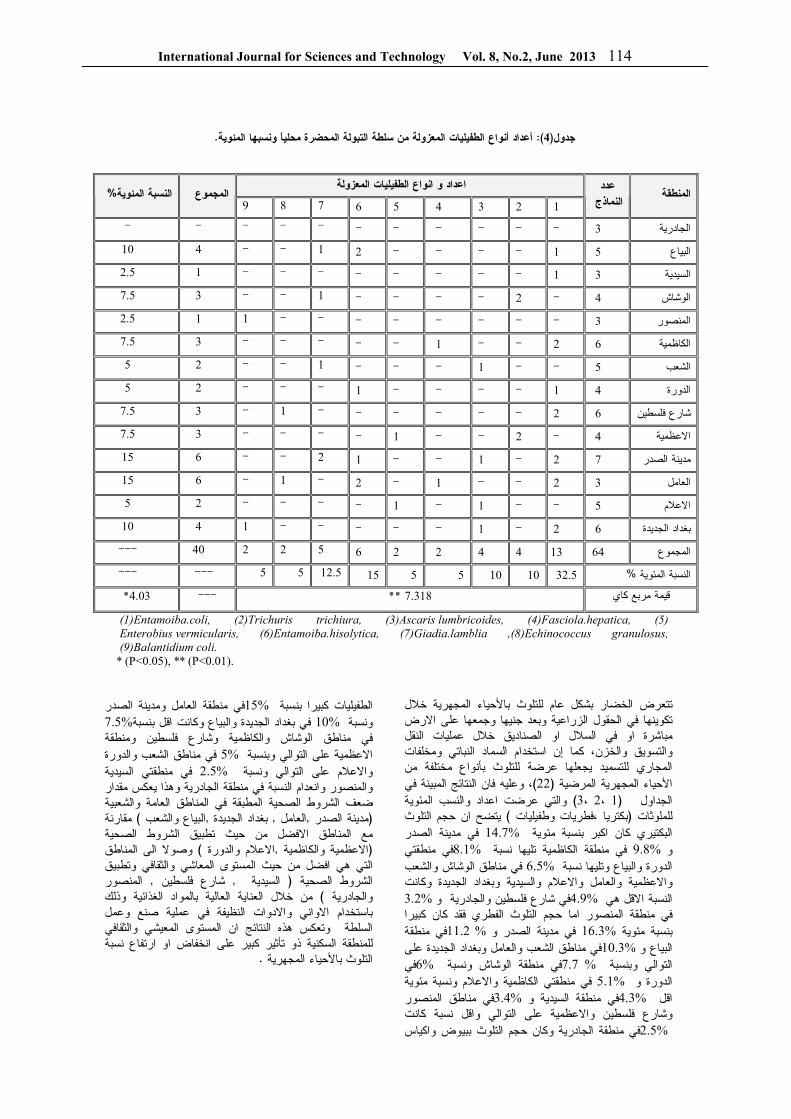
International Journal for Sciences and Technology Vol. 8, No.2, June 2013 114
. ونسبها المئويةا الطفيليات المعزولة من سلطة التبولة المحضرة محليأنواع أعداد :)4(جدول
اعداد و انواع الطفيليات المعزولة المنطقة
عدد 9 8 7 6 5 4 3 2 1 النماذج
%النسبة المئوية المجموع
- - - - - - - - - - - 3 الجادرية
10 4 - - 1 2 - - - - 1 5 البياع
2.5 1 - - - - - - - - 1 3 السيدية
7.5 3 - - 1 - - - - 2 - 4 الوشاش
2.5 1 1 - - - - - - - - 3 المنصور
7.5 3 - - - - - 1 - - 2 6 الكاظمية
5 2 - - 1 - - - 1 - - 5 الشعب
5 2 - - - 1 - - - - 1 4 الدورة
7.5 3 - 1 - - - - - - 2 6 شارع فلسطين
7.5 3 - - - - 1 - - 2 - 4 االعظمية
15 6 - - 2 1 - - 1 - 2 7 مدينة الصدر
15 6 - 1 - 2 - 1 - - 2 3 العامل
5 2 - - - - 1 - 1 - - 5 االعالم
10 4 1 - - - - - 1 - 2 6 بغداد الجديدة
--- 40 2 2 5 6 2 2 4 4 13 64 المجموع
--- -- - 5 5 12.5 15 5 5 10 10 32.5 %نسبة المئوية ال
*4.03 --- **7.318 قيمة مربع كاي
(1)Entamoiba.coli, (2)Trichuris trichiura, (3)Ascaris lumbricoides, (4)Fasciola.hepatica, (5)
Enterobius vermicularis, (6)Entamoiba.hisolytica, (7)Giadia.lamblia ,(8)Echinococcus granulosus,
(9)Balantidium coli.
* (P<0.05), ** (P<0.01).
تتعرض الخضار بشكل عام للتلوث باألحياء المجهرية خالل تكوينها في الحقول الزراعية وبعد جنيها وجمعها على االرض
السالل او الصناديق خالل عمليات النقل مباشرة او فيوالتسويق والخزن، كما ان استخدام السماد النباتي ومخلفات المجاري للتسميد يجعلها عرضة للتلوث بأنواع مختلفة من
وعليه فان النتائج المبينة في ،)22(األحياء المجهرية المرضية ة والتي عرضت اعداد والنسب المئوي) 3 ،2 ،1 ( الجداول يتضح ان حجم التلوث ) بكتريا ،فطريات وطفيليات (للملوثات
في مدينة الصدر %14.7البكتيري كان اكبر بنسبة مئوية في منطقتي %8.1في منطقة الكاظمية تليها نسبة %9.8و
في مناطق الوشاش والشعب %6.5الدورة والبياع وتليها نسبة اد الجديدة وكانت واالعظمية والعامل واالعالم والسيدية وبغد
%3.2في شارع فلسطين والجادرية و %4.9النسبة االقل هي في منطقة المنصور اما حجم التلوث الفطري فقد كان كبيرا
في منطقة % 11.2 في مدينة الصدر و%16.3بنسبة مئوية في مناطق الشعب والعامل وبغداد الجديدة على %10.3البياع و
في %6قة الوشاش ونسبة في منط % 7.7التوالي وبنسبة في منطقتي الكاظمية واالعالم ونسبة مئوية %5.1الدورة و
في مناطق المنصور %3.4في منطقة السيدية و %4.3اقل وشارع فلسطين واالعظمية على التوالي واقل نسبة كانت
في منطقة الجادرية وكان حجم التلوث ببيوض واكياس 2.5%
منطقة العامل ومدينة الصدر في %15الطفيليات كبيرا بنسبة %7.5 في بغداد الجديدة والبياع وكانت اقل بنسبة %10ونسبة
في مناطق الوشاش والكاظمية وشارع فلسطين ومنطقة في مناطق الشعب والدورة %5االعظمية على التوالي وبنسبة
في منطقتي السيدية %2.5واالعالم على التوالي ونسبة بة في منطقة الجادرية وهذا يعكس مقدار والمنصور وانعدام النس
ضعف الشروط الصحية المطبقة في المناطق العامة والشعبية مقارنة ) البياع والشعب ,بغداد الجديدة , العامل ,مدينة الصدر (
مع المناطق االفضل من حيث تطبيق الشروط الصحية وصوال الى المناطق ) االعالم والدورة ,االعظمية والكاظمية (
ي هي افضل من حيث المستوى المعاشي والثقافي وتطبيق التالمنصور , شارع فلسطين , السيدية ( الشروط الصحية
من خالل العناية العالية بالمواد الغذائية وذلك ) والجادرية باستخدام االواني واالدوات النظيفة في عملية صنع وعمل
ثقافي السلطة وتعكس هذه النتائج ان المستوى المعيشي والللمنطقة السكنية ذو تأثير كبير على انخفاض او ارتفاع نسبة
.التلوث باألحياء المجهرية
International Journal for Sciences and Technology Vol. 8, No.2, June 2013 115
التوصيات
المنقولة بالسلطة وتطبيق السالمة األحياءلغرض السيطرة على :الغذائية يجب
التشجيع على النظافة الشخصية وخصوصا لدى -1 . العاملين في مجال التصنيع الغذائي
لتلوث العرضي عن طريق الخزن الصحيح منع ا -2 . واستخدام االدوات واالسطح المطهرة
استخدام الغسل بالماء والمعقمات للخضار الكفيل -3 . الملوثة لألحياء الهائلة األعداد بإزالة
.استخدام طرق التبريد في حفظ المواد الغذائية -4شراء المواد الغذائية من مصادر موثوقة امنة -5
. حياومسيطر عليها ص
المصادر وسـالمة االنـسان صحة ). 2007 ( ايمن مزاهرة، .1
.االردن ، العلمية اليازوري دار. الغذاء
النواوي، محمد عبد الرازق وأسـامة، محمـد محمـد .2التصنيع الغذائي والبيئـة، معهـد . )2003(رضوان
الدراسات والبحوث البيئيـة، جامعـة عـين شـمس، .49: صالقاهرة،
ـ .3 تـاثير . )2006(ديم صـالح الدوري، صالح صعصائر الليمون والفلفل االخضر البارد والبصل الحلو في انواع من البكتريا المعزولـة والملوثـة للـسلطة ،رسالة ماجستير، كلية التربية ابن الهيـثم ، جامعـة
.بغداد االسود، ماجد بشير وعبـد العزيـز، عمـر فـوزي .4
ت مبـادئ الـصناعا . )1993(وسوالقا، امجد بويـا الغذائية، دار الكتب للطباعة والنـشر، وزارة التعلـيم
.العالي والبحث العلمي، جامعة الموصل، الموصل التـسمم الغـذائي، ).1988 (الدليمي، خلف صوفي .5
.الطبعة الثانية المنقحة، جامعة بغداد6. Stafsnes MH; Josefsen KD; Kildahl-
Andersen G; Valla S; Ellingsen TE; and Bruheim P. (2010). Isolation and characterization of marine pigmented bacteria from Norwegian coastal waters and screening for carotenoids with UVA-blue light absorbing properties. J. Clin. Microbiol. 48 (1):16-23.
7. Alexopolous CJ; Charles W; Mims, M; and Blackwell B. (2004). Introductory Mycology, 4th ed, U.S.A. p. 54-56.
8. Jones J. (2004). Control of contamination and gill, C. O. by Escherichia coli from their mouths. Food Microbial. pig. Carcasses. 44:43-48.
9. Tadayuki a; Uehara Y; Shinji H; Tajima A; Seo H; Takada K; Agata T; and Mizunoe Y. (2010). Staphylococcus
epidermidis sp. inhibits Staphylococcus aureus biofilm formation and nasal colonization. Nat. 20:465
الرجب، وفاء جاسم والقزاز، حـسين محمـد علـي .10 علم االحياء المجهرية، وزارة التعليم العالي ).1989(
677 :صوالبحث العلمي، جامعة الموصل،11. Abbott SL; and Janda JM. (1997).
Enterobacter cancerogenous (Enterobacter taylorae) infection associated seuere trauma or crush injuries .Am. J.Clin.Pathol. 107(3):395-361.
ميكروبيولوجيـا ). 2008(الشحات، محمد رمـضان .12 .دار الفكر العربي للطباعة والنشر ،مصر. التخمرات
13. Mitchell RE; Fraser AM; and Bearon LB.(2007). Preventing foodborne illness in foodservice establishments: Broadening the framework for intervention and research on safe food handling behaviors. Int. J. Env. Health Res. 17(1):9-24.
14. SAS. (2010). Statistical Analysis System, User's Guide. Statistical. Version 9.1th ed. SAS. Inst. Inc. Cary. N.C. USA.
15. Ishii S; and Sadowsky MJ. (2008). "Escherichia coli in the Environment: Implications for Water Quality and Human Health. Microbes viron. 23 (2): 101–8.
16. European Food Safety Authority (EFSA) (2010). Scientific opinion on the maintenance of the list of QPS microorganisms intentionally added to food or feed. Panel on Biological Hazards. EFSA J. 8(12):1944.
17. Wang JT; Chang SC; Chen YC. and Luh KT. (2000). Comparison of antimicrobial susceptibility of Citrobacter freundii isolates in two different time periods. J. Microbiol. Immunol. Infec. 33 (4): 258–262.
18. Kim KY; Jordan D; and McDonald GA. (1998). Enterobacter agglomerans, phosphate solubilizing bacteria, and microbial activity in soil: Effect of carbon sources. Soil Biol. Biochem. 30 (8–9): 995-1003.
19. Michael JC ;Sarah CW; and Graham WG. (1996). The fungi. 2nd edition. 892-894.
20. Humphrey T; O'Brien S; and Madsen M. (2007). Parasitic as zoonotic pathogens A food production perspective. Int. J. Food Microbiol. 117(3):237.
21. Doug P. (2008). preventing foreign material contamination of food. Blackwell publishing. 24: 196-204.
22. Holt JG; and Bergey DH. (1994). Bergey's manual of determinative bacteriology. P.: 327-328.
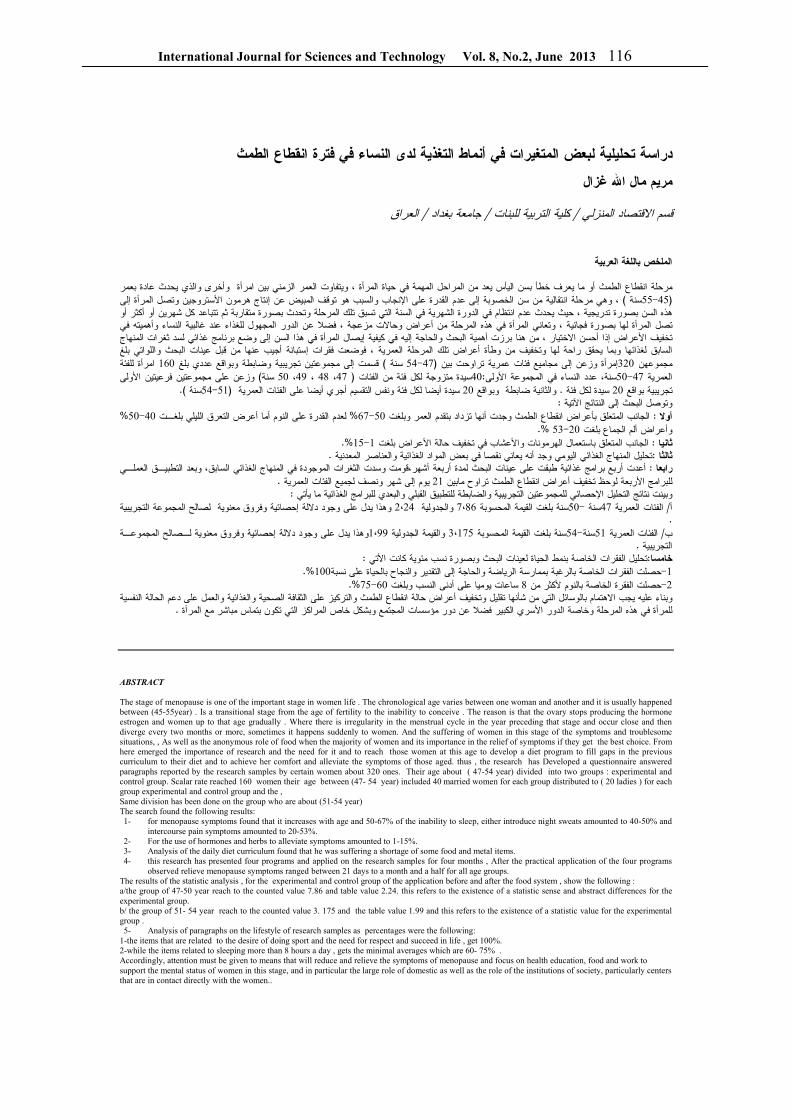
International Journal for Sciences and Technology Vol. 8, No.2, June 2013 116
الطمثانقطاعدراسة تحليلية لبعض المتغيرات في أنماط التغذية لدى النساء في فترة
مريم مال اهللا غزال
العراق/جامعة بغداد / كلية التربية للبنات / قسم االقتصاد المنزلي
الملخص باللغة العربية
وأخرى والذي يحدث عادة بعمر امرأة الطمث أو ما يعرف خطأ بسن اليأس يعد من المراحل المهمة في حياة المرأة ، ويتفاوت العمر الزمني بين اعانقطمرحلة صل المرأة إلى والسبب هو توقف المبيض عن إنتاج هرمون األستروجين وتاإلنجاب من سن الخصوبة إلى عدم القدرة على انتقالية، وهي مرحلة ) سنة 45-55(
في الدورة الشهرية في السنة التي تسبق تلك المرحلة وتحدث بصورة متقاربة ثم تتباعد كل شهرين أو أكثر أو انتظامهذه السن بصورة تدريجية ، حيث يحدث عدم لمجهول للغذاء عند غالبية النساء وأهميته في تصل المرأة لها بصورة فجائية ، وتعاني المرأة في هذه المرحلة من أعراض وحاالت مزعجة ، فضال عن الدور ا
من هنا برزت أهمية البحث والحاجة إليه في كيفية إيصال المرأة في هذا السن إلى وضع برنامج غذائي لسد ثغرات المنهاج ، االختيارتخفيف األعراض إذا أحسن عمرية ، فوضعت فقرات إستبانة أجيب عنها من قبل عينات البحث واللواتي بلغ السابق لغذائها وبما يحقق راحة لها وتخفيف من وطأة أعراض تلك المرحلة ال
مرأة للفئة ا 160قسمت إلى مجموعتين تجريبية وضابطة وبواقع عددي بلغ ) سنة 54-47(إمرأة وزعن إلى مجاميع فئات عمرية تراوحت بين 320مجموعهن األولى فرعيتين مجموعتين على وزعن) سنة 50 ،49 ، 48 ،47 ( الفئات من فئة لكل متزوجة ةسيد40:األولى المجموعة في النساء عددسنة، 50-47العمرية . )سنة 54-51( ونفس التقسيم أجري أيضا على الفئات العمرية فئة لكل أيضا سيدة 20 وبواقع ضابطة والثانية . فئة لكل سيدة 20 بواقع تجريبية
:اآلتيةوتوصل البحث إلى النتائج % 50-40لعدم القدرة على النوم أما أعرض التعرق الليلي بلغـت % 67-50 الطمث وجدت أنها تزداد بتقدم العمر وبلغت انقطاعالجانب المتعلق بأعراض : أوال
%.53-20وأعراض ألم الجماع بلغت %.15-1 الهرمونات واألعشاب في تخفيف حالة األعراض بلغت باستعمالالجانب المتعلق : ثانيا .تحليل المنهاج الغذائي اليومي وجد أنه يعاني نقصا في بعض المواد الغذائية والعناصر المعدنية : ثالثاأعدت أربع برامج غذائية طبقت على عينات البحث لمدة أربعة أشهر،قومت وسدت الثغرات الموجودة في المنهاج الغذائي السابق، وبعد التطبيـق العملـي : رابعا
. شهر ونصف لجميع الفئات العمرية إلى يوم 21 الطمث تراوح مابين انقطاعخفيف أعراض لوحظ تاألربعةللبرامج :يأتي للمجموعتين التجريبية والضابطة للتطبيق القبلي والبعدي للبرامج الغذائية مااإلحصائيوبينت نتائج التحليل
وفروق معنوية لصالح المجموعة التجريبية إحصائية وهذا يدل على وجود داللة 2،24 والجدولية 7،86سنة بلغت القيمة المحسوبة 50-سنة 47الفئات العمرية / أ.
وهذا يدل على وجود داللة إحصائية وفروق معنوية لـصالح المجموعـة 1،99 والقيمة الجدولية 3،175سنة بلغت القيمة المحسوبة 54-سنة51الفئات العمرية / ب .التجريبية
:نمط الحياة لعينات البحث وبصورة نسب مئوية كانت األتي تحليل الفقرات الخاصة ب:خامسا %.100حصلت الفقرات الخاصة بالرغبة بممارسة الرياضة والحاجة إلى التقدير والنجاح بالحياة على نسبة-1 %.75-60 ساعات يوميا على أدنى النسب وبلغت 8حصلت الفقرة الخاصة بالنوم ألكثر من -2
الطمث والتركيز على الثقافة الصحية والغذائية والعمل على دعم الحالة النفسية انقطاعلوسائل التي من شأنها تقليل وتخفيف أعراض حالة بااالهتماموبناء عليه يجب .للمرأة في هذه المرحلة وخاصة الدور األسري الكبير فضال عن دور مؤسسات المجتمع وبشكل خاص المراكز التي تكون بتماس مباشر مع المرأة
ABSTRACT
The stage of menopause is one of the important stage in women life . The chronological age varies between one woman and another and it is usually happened between (45-55year) . Is a transitional stage from the age of fertility to the inability to conceive . The reason is that the ovary stops producing the hormone estrogen and women up to that age gradually . Where there is irregularity in the menstrual cycle in the year preceding that stage and occur close and then diverge every two months or more, sometimes it happens suddenly to women. And the suffering of women in this stage of the symptoms and troublesome situations, , As well as the anonymous role of food when the majority of women and its importance in the relief of symptoms if they get the best choice. From here emerged the importance of research and the need for it and to reach those women at this age to develop a diet program to fill gaps in the previous curriculum to their diet and to achieve her comfort and alleviate the symptoms of those aged. thus , the research has Developed a questionnaire answered paragraphs reported by the research samples by certain women about 320 ones. Their age about ( 47-54 year) divided into two groups : experimental and control group. Scalar rate reached 160 women their age between (47- 54 year) included 40 married women for each group distributed to ( 20 ladies ) for each group experimental and control group and the , Same division has been done on the group who are about (51-54 year) The search found the following results: 1- for menopause symptoms found that it increases with age and 50-67% of the inability to sleep, either introduce night sweats amounted to 40-50% and
intercourse pain symptoms amounted to 20-53%. 2- For the use of hormones and herbs to alleviate symptoms amounted to 1-15%. 3- Analysis of the daily diet curriculum found that he was suffering a shortage of some food and metal items. 4- this research has presented four programs and applied on the research samples for four months , After the practical application of the four programs
observed relieve menopause symptoms ranged between 21 days to a month and a half for all age groups. The results of the statistic analysis , for the experimental and control group of the application before and after the food system , show the following : a/the group of 47-50 year reach to the counted value 7.86 and table value 2.24. this refers to the existence of a statistic sense and abstract differences for the experimental group. b/ the group of 51- 54 year reach to the counted value 3. 175 and the table value 1.99 and this refers to the existence of a statistic value for the experimental group . 5- Analysis of paragraphs on the lifestyle of research samples as percentages were the following:
1-the items that are related to the desire of doing sport and the need for respect and succeed in life , get 100%. 2-while the items related to sleeping more than 8 hours a day , gets the minimal averages which are 60- 75% . Accordingly, attention must be given to means that will reduce and relieve the symptoms of menopause and focus on health education, food and work to support the mental status of women in this stage, and in particular the large role of domestic as well as the role of the institutions of society, particularly centers that are in contact directly with the women..
International Journal for Sciences and Technology Vol. 8, No.2, June 2013 117
المقدمة
إن تقسيم الحياة إلى عدة مراحل حسب النمو تعد وسيلة جيدة
لة ، لعدة أغراض فيما يخص التغذية منها وإن هذا وسه بالمتطلبات الغذائية لكل مرحلة من باالهتمامالتقسيم يسمح كما أن هذا التقسيم هو بحد ذاته تقسيم نوعي . مراحل النمو
الغرض منه متابعة التغيرات في المتطلبات الغذائية لصحية ومن ناحية األهمية ا. الناجمة عن النمو واالختالفات
دورة حياة اعتباروالعوامل المؤثرة في الصحة ، يمكن مستمرة وإن كل مرحلة فيها تعتمد على المرحلة اإلنسان
السابقة لها وكل مرحلة تكون أساسا للمرحلة التالية من مرحلة عمرية إلى مرحلة عمرية أخرى هي فاالنتقال.
د ليست عملية نمو فقط ولكن كثيرا ما يتعرض فيها األفراإلى خصائص وصعوبات جديدة تختلف عن المرحلة السابقة وتعتمد على المرحلة والشخص ، فهناك عدة عوامل تظهر تأثيرات كبيرة والتي ترافق تطور ونمو الشخص البالغ ، ويبدأ األشخاص يشعرون بأن العادات الغذائية والصحية المتبعة تؤثر على حياتهم وذات تأثير على الشخصية سنوات
عمر الوسطى واألخيرة ، كما إن التغيرات الفسيولوجية ال إذ الجسم من الغذاء ، استفادةالناجمة عن كبر السن تقلل من
الهضمية وإنتاج حامض الهيدروكلوريك اإلفرازاتتنخفض الغذاء ومنها امتصاصينخفض وهذا بدوره يؤثر في
وعنصر الحديد ، B12 وC فيتامين امتصاص انخفاضتاج عوامل أخرى مهمة في الجسم قد ينتج عنها إنوانخفاض
)1.( الكالسيوم يقل بتقدم العمر امتصاصن أفقر الدم كما وإن هذا التحول يختلف حسب العمر والجنس، فالنساء مثال
والوقت امرأةالتحول والتغير في أجسامهن حسب جسم كل وهذه الحالة ال) سنوات 8-2(الذي يستغرقه يختلف ما بين
أو عناية طبية ولكن كل ما هنالك ينبغي , ج إلى عالج تحتا تفعله لتفهم تلك الحالة وتتكيف أن تلم المرأة بما تستطيع أن
معها بشكل طبيعي ، والبداية تكون بتصحيح الخطأ , المتعارف بمرحلة انقطاع الطمث والمسماة سن اليأس
وهي المرحلة العمرية في حياة المرأة تتوقف فيها الدورة وتعني كذلك تغيير , اإلنجابلشهرية وهي عالمة لنهاية ا
نمط الحياة بالنسبة لمعظم النساء ، وخاصة بوجود أعراض االنفعال ، وسرعة واإلنهاكشائعة تتمثل بالتعرق الليلي ،
واآلم المفاصل وغيرها ، وقد بينت العديد من األدلة لى والدراسات العلمية على وجود عالقة بين التغذية المث
من هنا تبادر ) .2(وتخفيف تلك األعراض وتقصير مدتها ، تجربة عملية لعينة من النساء في إجراءإلى ذهن الباحثة
تلك المرحلة العمرية ووضع برنامج غذائي مثالي يخفف من بالمصادر العلمية ذات العالقة ، باالستعانةتلك األعراض
كمالت الغذائية ومحاولة تقويم البرنامج الغذائي اليومي بالموالتعرف على الفرق الذي يحدثه البرنامج الغذائي الخاص بالبحث من حيث تخفيف حدة األعراض والشعور بالراحة
.بعد التطبيق لمدة زمنية محددة
المواد وطرائق العمل
من النساء اللـواتي يعـانين انتقائيةعشوائية عينة اختيارتم
) سنة 54 -47(رية الطمث وبفئات عم انقطاعمن أعراض ــع ــة 160( بواق ــة العمري ــة للفئ و ) ســنة 50-47عين
موزعة على أساس ) سنة 54-51 عينة للفئة العمرية 160( : مجموعتين تجريبية وضابطة شملت األتي
سيدة متزوجة 40: عدد النساء في المجموعة األولى -1وزعن على ) سنة 50، 49 ، 48، 47( من الفئات
سيدة 20وضابطة بواقع عددي يبيةمجموعتين تجر .لكل فئة
سيدة متزوجة 40: عدد النساء في المجموعة الثانية -2وزعن علـى ) سنة 54، 53 ، 52، 51(من الفئات
سيدة 20مجموعتين تجريبية وضابطة بواقع عددي .لكل فئة
ومن جانبي الكرخ والرصافة من مدينة بغداد ومـن مـدن رية ، زيونة ، المحمودية ، التاجي ، الغزالية البياع ، الجاد (
) ، الشعلة ووزعت أستمارات أستبانة على العينات وتضمنت معلومات
: خاصة بالبحث شملت األتي واإلجابةتحليل النظام الغذائي وتضمن الفقرات التالية : أوال
:عنها بنعم أو ال . الطعام أو الشراب كل يوم إلى إضافة السكر – 1 . الملح بالطعام استعمال-2 .يوميا) أقداح 3(شرب الشاي ألكثر من -3 .تناول األعشاب الطبية -4ألكثـر ) أسماك ، دجاج ,سالبطاط(تناول الطعام المقلي -5
.من ثالث مرات باألسبوع .تناول اللحوم الحمراء ألكثر من مرتين باألسبوع -6 .الطازجةالطعام اليومي ثلثه من الفواكه والخضروات -7 ) . أقداح باليوم 8(تناول الماء ألكثر من -8 .تتناولين الرز والحبوب الكاملة -9
.تتناولين لتر من الحليب أسبوعيا -10 واإلجابـة تحليل نمط الحياة وتضمن الفقرات التاليـة : ثانيا
:عنها بنعم أو ال ) . ساعات يوميا8(النوم ألكثر من -1 دقيقة 20 للعمل خالل نطالقلالالنهوض من النوم بشوق -2 . للعمل لالنطالقشرب القهوة أو الشاي -3 الطاقة لذلك امتالكتجنب القيام بالتمارين الرياضية لعدم -4الشعور بالنعاس أو الفتور بالهمة خالل النهـار أو بعـد -5
.تناول الطعام . الطاقة وانخفاضفقدان التركيز أحيانا -6 . بالحياة واضحة أهدافك-7 .الحاجة إلى التقدير والنجاح من األمور المهمة لديك -8
الطمـث والـذي انقطـاع الفقرات الخاصة بأعراض : ثالثاذكرته العينات وبالعودة للمصادر العلمية تم توضيح الـسبب
:وشملت الجانب المتعلق بالفيتامينات فكل عارض يمثل نقص فيه/ أ
:وكما يأتي :Dامين نقص فيت: أوال
المفاصل أو تخلخل العظام التهاب-1 .ألم الظهر -2 .تسوس األسنان -3 .فقدان الشعر -4 .تشنج العضالت -5
:Eنقص فيتامين : ثانيا قلة النشاط الجنسي -1 . بعد العمل الخفيف واإلنهاكالتعب -2 .تورم العروق -3
:Cنقص فيتامين : ثالثا .زكام متكرر -1 .نقص الطاقة-2 .التئام بطئ للجروح -3
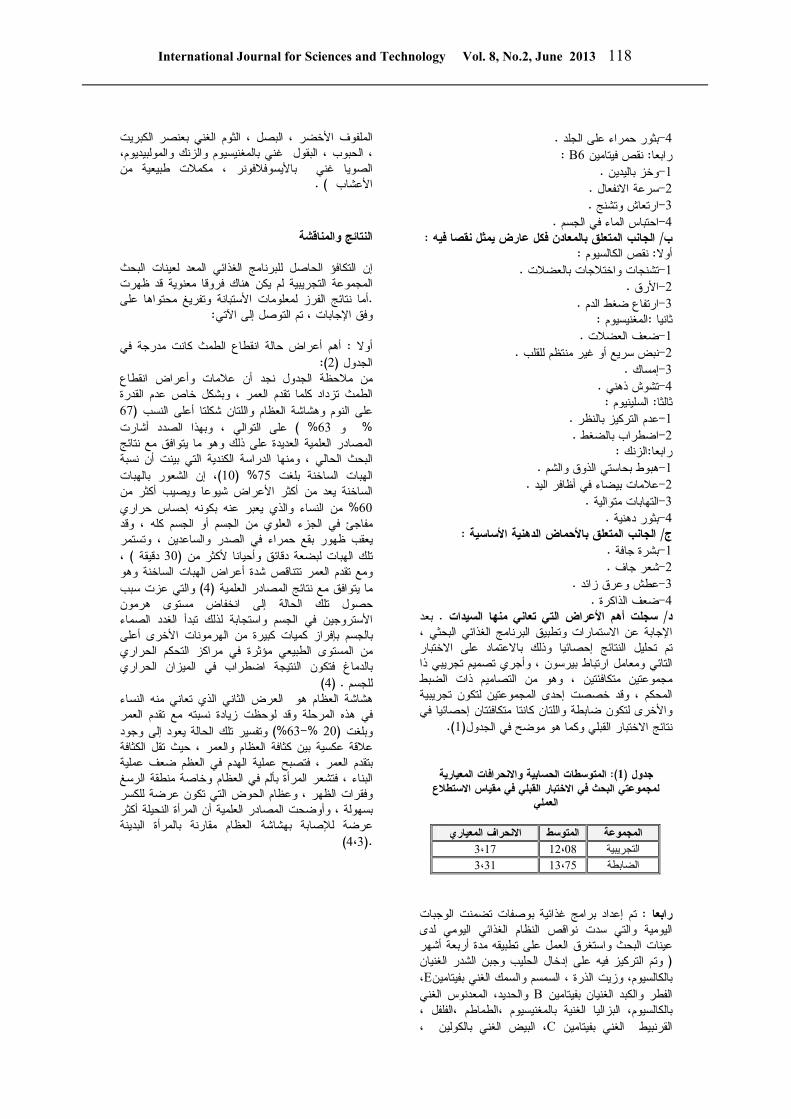
International Journal for Sciences and Technology Vol. 8, No.2, June 2013 118
.بثور حمراء على الجلد -4 :B6نقص فيتامين : رابعا
.وخز باليدين -1 .االنفعالسرعة -2 . وتشنج ارتعاش-3 . الماء في الجسم احتباس-4 :الجانب المتعلق بالمعادن فكل عارض يمثل نقصا فيه / ب
:نقص الكالسيوم : أوال . بالعضالت واختالجاتتشنجات -1 .األرق -2 . ضغط الدم ارتفاع-3
:المغنيسيوم :ثانيا .ضعف العضالت -1 .نبض سريع أو غير منتظم للقلب -2 .إمساك -3 .تشوش ذهني -4
:السلينيوم : ثالثا .عدم التركيز بالنظر -1 . بالضغط اضطراب-2
:الزنك :رابعا .هبوط بحاستي الذوق والشم -1 .عالمات بيضاء في أظافر اليد -2 . متوالية التهابات-3 .بثور دهنية -4 :الجانب المتعلق باألحماض الدهنية األساسية / ج .بشرة جافة -1 .شعر جاف -2 .عطش وعرق زائد -3 .ضعف الذاكرة -4بعد . سجلت أهم األعراض التي تعاني منها السيدات/ د
وتطبيق البرنامج الغذائي البحثي ، االستمارات عن اإلجابة االختبار على باالعتماد وذلك إحصائيانتائج تم تحليل ال
بيرسون ، وأجري تصميم تجريبي ذا ارتباطالتائي ومعامل مجموعتين متكافئتين ، وهو من التصاميم ذات الضبط المحكم ، وقد خصصت إحدى المجموعتين لتكون تجريبية واألخرى لتكون ضابطة واللتان كانتا متكافئتان إحصائيا في
).1( القبلي وكما هو موضح في الجدولاراالختبنتائج
المعيارية واالنحرافات الحسابية المتوسطات: )1(جدول االستطالع القبلي في مقياس االختبارلمجموعتي البحث في
العملي
المعيارياالنحراف المتوسط المجموعة 3،17 12،08 التجريبية 3،31 13،75 الضابطة
ائية بوصفات تضمنت الوجبات تم إعداد برامج غذ: رابعا
اليومية والتي سدت نواقص النظام الغذائي اليومي لدى العمل على تطبيقه مدة أربعة أشهر واستغرقعينات البحث
الغنيان الحليب وجبن الشدرإدخالوتم التركيز فيه على ( ، Eنبفيتاميبالكالسيوم، وزيت الذرة ، السمسم والسمك الغني
والحديد، المعدنوس الغني Bان بفيتامين الفطر والكبد الغني ،الفلفل ، مبالكالسيوم، البزاليا الغنية بالمغنيسيوم ،الطماط
، البيض الغني بالكولين ، C الغني بفيتامين القرنبيط
، البصل ، الثوم الغني بعنصر الكبريت الملفوف األخضر ، الحبوب ، البقول غني بالمغنيسيوم والزنك والمولبيديوم،
الصويا غني باأليسوفالفونر ، مكمالت طبيعية من ) .األعشاب
النتائج والمناقشة
إن التكافؤ الحاصل للبرنامج الغذائي المعد لعينات البحث لم يكن هناك فروقا معنوية قد ظهرت ةالتجريبيالمجموعة
أما نتائج الفرز لمعلومات األستبانة وتفريغ محتواها على . :اآلتي، تم التوصل إلى اإلجاباتوفق
حالة انقطاع الطمث كانت مدرجة في أعراضأهم : أوال
): 2(الجدول انقطاعمن مالحظة الجدول نجد أن عالمات وأعراض
الطمث تزداد كلما تقدم العمر ، وبشكل خاص عدم القدرة 67(على النوم وهشاشة العظام واللتان شكلتا أعلى النسب
ي ، وبهذا الصدد أشارت على التوال% ) 63و % المصادر العلمية العديدة على ذلك وهو ما يتوافق مع نتائج البحث الحالي ، ومنها الدراسة الكندية التي بينت أن نسبة
، إن الشعور بالهبات )10% (75الهبات الساخنة بلغت الساخنة يعد من أكثر األعراض شيوعا ويصيب أكثر من
بكونه إحساس حراري من النساء والذي يعبر عنه% 60مفاجئ في الجزء العلوي من الجسم أو الجسم كله ، وقد يعقب ظهور بقع حمراء في الصدر والساعدين ، وتستمر
، ) دقيقة 30(تلك الهبات لبضعة دقائق وأحيانا ألكثر من ومع تقدم العمر تتناقص شدة أعراض الهبات الساخنة وهو
والتي عزت سبب ) 4 (ما يتوافق مع نتائج المصادر العلمية مستوى هرمون انخفاضحصول تلك الحالة إلى
لذلك تبدأ الغدد الصماء واستجابةاألستروجين في الجسم كميات كبيرة من الهرمونات األخرى أعلى بإفرازبالجسم
من المستوى الطبيعي مؤثرة في مراكز التحكم الحراري ي في الميزان الحراراضطراببالدماغ فتكون النتيجة
) 4. (للجسم هشاشة العظام هو العرض الثاني الذي تعاني منه النساء في هذه المرحلة وقد لوحظت زيادة نسبته مع تقدم العمر
وتفسير تلك الحالة يعود إلى وجود %) 63- %20(وبلغت عالقة عكسية بين كثافة العظام والعمر ، حيث تقل الكثافة
العظم ضعف عملية بتقدم العمر ، فتصبح عملية الهدم في البناء ، فتشعر المرأة بألم في العظام وخاصة منطقة الرسغ وفقرات الظهر ، وعظام الحوض التي تكون عرضة للكسر
النحيلة أكثر المرأةبسهولة ، وأوضحت المصادر العلمية أن بهشاشة العظام مقارنة بالمرأة البدينة لإلصابةعرضة
).4،3 (
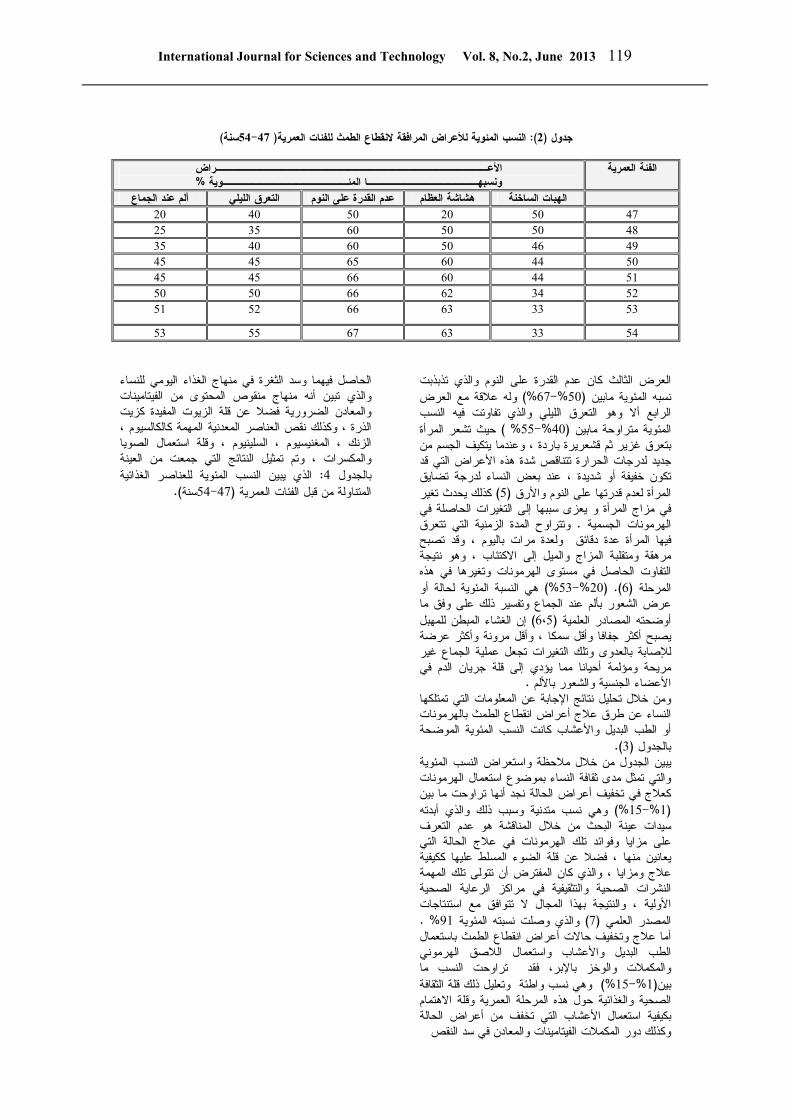
International Journal for Sciences and Technology Vol. 8, No.2, June 2013 119
)سنة54-47( الطمث للفئات العمريةالنقطاعالنسب المئوية لألعراض المرافقة ):2(جدول
األعـــــــــــــــــــــــــــــــــــــراض الفئة العمرية %ونسبهـــــــــــــــا المئـــــــــــــــــوية
جماعألم عند ال التعرق الليلي عدم القدرة على النوم هشاشة العظام الهبات الساخنة
47 50 20 50 40 20 48 50 50 60 35 25 49 46 50 60 40 35 50 44 60 65 45 45 51 44 60 66 45 45 52 34 62 66 50 50 53 33 63 66 52 51
54 33 63 67 55 53
العرض الثالث كان عدم القدرة على النوم والذي تذبذبت عرض وله عالقة مع ال%) 67-%50(نسبه المئوية مابين
الرابع أال وهو التعرق الليلي والذي تفاوتت فيه النسب حيث تشعر المرأة % ) 55-%40(المئوية متراوحة مابين
بتعرق غزير ثم قشعريرة باردة ، وعندما يتكيف الجسم من جديد لدرجات الحرارة تتناقص شدة هذه األعراض التي قد تكون خفيفة أو شديدة ، عند بعض النساء لدرجة تضايق
كذلك يحدث تغير ) 5(المرأة لعدم قدرتها على النوم واألرق في مزاج المرأة و يعزى سببها إلى التغيرات الحاصلة في
وتتراوح المدة الزمنية التي تتعرق . الهرمونات الجسمية فيها المرأة عدة دقائق ولعدة مرات باليوم ، وقد تصبح
وهو نتيجة ، االكتئابمرهقة ومتقلبة المزاج والميل إلى التفاوت الحاصل في مستوى الهرمونات وتغيرها في هذه
هي النسبة المئوية لحالة أو %) 53-%20). (6(المرحلة عرض الشعور بألم عند الجماع وتفسير ذلك على وفق ما
إن الغشاء المبطن للمهبل ) 6،5(أوضحته المصادر العلمية عرضة وأكثريصبح أكثر جفافا وأقل سمكا ، وأقل مرونة
بالعدوى وتلك التغيرات تجعل عملية الجماع غير لإلصابةمريحة ومؤلمة أحيانا مما يؤدي إلى قلة جريان الدم في
.األعضاء الجنسية والشعور باأللم عن المعلومات التي تمتلكها اإلجابةومن خالل تحليل نتائج
النساء عن طرق عالج أعراض انقطاع الطمث بالهرمونات النسب المئوية الموضحة ديل واألعشاب كانت أو الطب الب
).3(بالجدول النسب المئوية واستعراض مالحظة من خالليبين الجدول
الهرمونات استعمالوالتي تمثل مدى ثقافة النساء بموضوع كعالج في تخفيف أعراض الحالة نجد أنها تراوحت ما بين
وهي نسب متدنية وسبب ذلك والذي أبدته %) 15-1%(ت عينة البحث من خالل المناقشة هو عدم التعرف سيدا
على مزايا وفوائد تلك الهرمونات في عالج الحالة التي يعانين منها ، فضال عن قلة الضوء المسلط عليها ككيفية عالج ومزايا ، والذي كان المفترض أن تتولى تلك المهمة النشرات الصحية والتثقيفية في مراكز الرعاية الصحية
، والنتيجة بهذا المجال ال تتوافق مع استنتاجات األولية% . 91والذي وصلت نسبته المئوية ) 7(المصدر العلمي
باستعمال الطمث انقطاعأما عالج وتخفيف حاالت أعراض الالصق الهرموني واستعمالالطب البديل واألعشاب
فقد تراوحت النسب ما باإلبر،والمكمالت والوخز سب واطئة وتعليل ذلك قلة الثقافة وهي ن%) 15-%1(بين
وقلة االهتمامالصحية والغذائية حول هذه المرحلة العمرية األعشاب التي تخفف من أعراض الحالة استعمالبكيفية
وكذلك دور المكمالت الفيتامينات والمعادن في سد النقص
الحاصل فيهما وسد الثغرة في منهاج الغذاء اليومي للنساء أنه منهاج منقوص المحتوى من الفيتامينات والذي تبين
والمعادن الضرورية فضال عن قلة الزيوت المفيدة كزيت الذرة ، وكذلك نقص العناصر المعدنية المهمة كالكالسيوم ،
الصويا استعمالالزنك ، المغنيسيوم ، السلينيوم ، وقلة والمكسرات ، وتم تمثيل النتائج التي جمعت من العينة
الذي يبين النسب المئوية للعناصر الغذائية : 4بالجدول ).سنة54-47(المتناولة من قبل الفئات العمرية
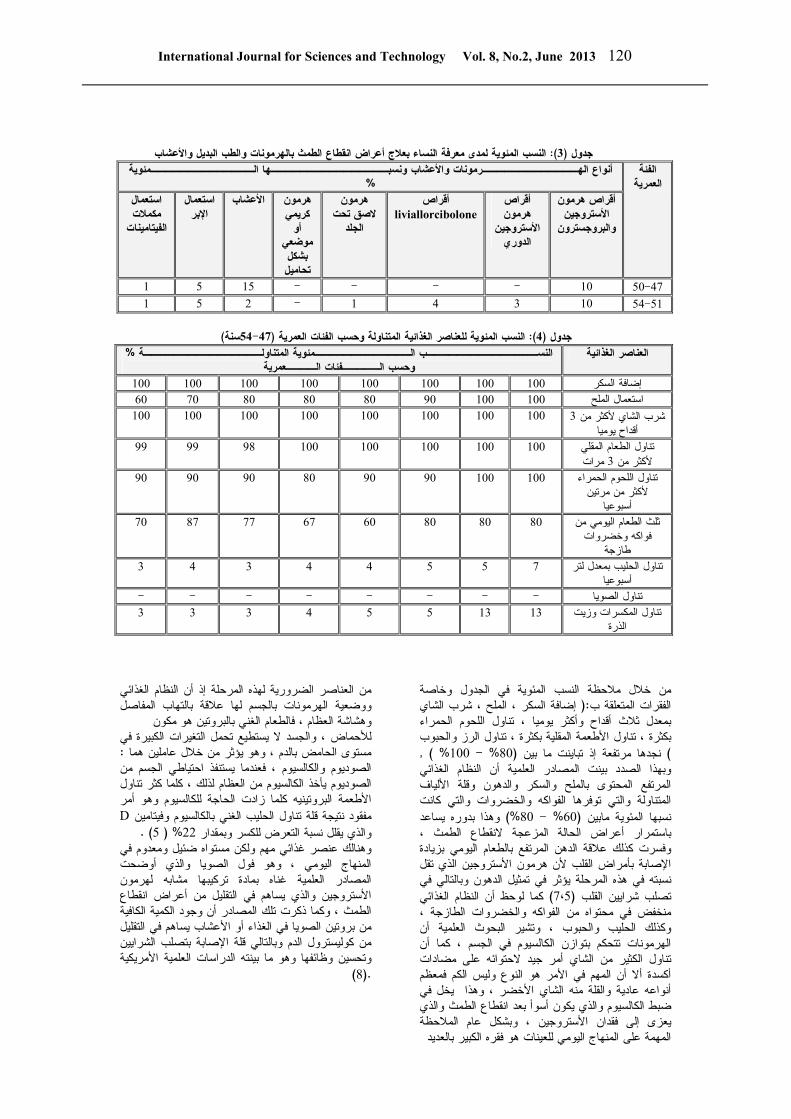
International Journal for Sciences and Technology Vol. 8, No.2, June 2013 120
الطمث بالهرمونات والطب البديل واألعشابانقطاع أعراض بعالج النساء معرفة لمدى النسب المئوية ):3(جدول
ونسبــــــــــــــــها الــــــــــــــمئوية واألعشابــــرمونات الهـــــــــأنواع%
الفئة العمرية
أقراص هرمون األستروجين والبروجسترون
أقراص هرمون
األستروجين الدوري
أقراصliviallorcibolone
هرمون الصق تحت
الجلد
هرمون كريمي
أو موضعي بشكل تحاميل
استعمال األعشاب اإلبر
استعمالمكمالت
ميناتالفيتا
47-50 10 - - - - 15 5 1
51-54 10 3 4 1 - 2 5 1
)سنة54-47(النسب المئوية للعناصر الغذائية المتناولة وحسب الفئات العمرية ): 4(جدول
% النســـــــــــــــب الـــــــــــــمئوية المتناولــــــــــــــــة العناصر الغذائية وحسب الـــــفئات الــــعمرية
100 100 100 100 100 100 100 100 السكرإضافة 60 70 80 80 80 90 100 100 الملحاستعمال
3شرب الشاي ألكثر من أقداح يوميا
100 100 100 100 100 100 100 100
تناول الطعام المقلي مرات3ألكثر من
100 100 100 100 100 98 99 99
تناول اللحوم الحمراء ألكثر من مرتين
أسبوعيا
100 100 90 90 80 90 90 90
ثلث الطعام اليومي من فواكه وخضروات
طازجة
80 80 80 60 67 77
87 70
تناول الحليب بمعدل لتر أسبوعيا
7 5 5 4 4 3 4 3
- - - - - - - - تناول الصوياتناول المكسرات وزيت
الذرة13 13 5 5 4 3 3 3
ة في الجدول وخاصة من خالل مالحظة النسب المئوي إضافة السكر ، الملح ، شرب الشاي :( بالفقرات المتعلقة
بمعدل ثالث أقداح وأكثر يوميا ، تناول اللحوم الحمراء بكثرة ، تناول األطعمة المقلية بكثرة ، تناول الرز والحبوب
, % ) 100 -% 80(نجدها مرتفعة إذ تباينت ما بين ) لمية أن النظام الغذائي وبهذا الصدد بينت المصادر الع
المرتفع المحتوى بالملح والسكر والدهون وقلة األلياف المتناولة والتي توفرها الفواكه والخضروات والتي كانت
وهذا بدوره يساعد %) 80 -% 60(نسبها المئوية مابين الطمث ، النقطاع أعراض الحالة المزعجة باستمرار
عام اليومي بزيادة وفسرت كذلك عالقة الدهن المرتفع بالط بأمراض القلب ألن هرمون األستروجين الذي تقل اإلصابة
نسبته في هذه المرحلة يؤثر في تمثيل الدهون وبالتالي فيكما لوحظ أن النظام الغذائي ) 7،5(تصلب شرايين القلب
منخفض في محتواه من الفواكه والخضروات الطازجة ، العلمية أن وكذلك الحليب والحبوب ، وتشير البحوث
الهرمونات تتحكم بتوازن الكالسيوم في الجسم ، كما أن على مضادات الحتوائهتناول الكثير من الشاي أمر جيد
أكسدة أال أن المهم في األمر هو النوع وليس الكم فمعظم أنواعه عادية والقلة منه الشاي األخضر ، وهذا يخل في
الطمث والذي اعانقطضبط الكالسيوم والذي يكون أسوأ بعد يعزى إلى فقدان األستروجين ، وبشكل عام المالحظة
المهمة على المنهاج اليومي للعينات هو فقره الكبير بالعديد
أن النظام الغذائي إذمن العناصر الضرورية لهذه المرحلة المفاصل بالتهابووضعية الهرمونات بالجسم لها عالقة
مكون بالبروتين هووهشاشة العظام ، فالطعام الغني يستطيع تحمل التغيرات الكبيرة في لألحماض ، والجسد ال
: مستوى الحامض بالدم ، وهو يؤثر من خالل عاملين هما الجسم من احتياطيالصوديوم والكالسيوم ، فعندما يستنفذ
الصوديوم يأخذ الكالسيوم من العظام لذلك ، كلما كثر تناول ادت الحاجة للكالسيوم وهو أمر كلما زالبروتينيهاألطعمة
D الحليب الغني بالكالسيوم وفيتامين تناولمفقود نتيجة قلة ) .5% ( 22والذي يقلل نسبة التعرض للكسر وبمقدار
وهنالك عنصر غذائي مهم ولكن مستواه ضئيل ومعدوم في المنهاج اليومي ، وهو فول الصويا والذي أوضحت
كيبها مشابه لهرمون المصادر العلمية غناه بمادة تر انقطاعاألستروجين والذي يساهم في التقليل من أعراض
الطمث ، وكما ذكرت تلك المصادر أن وجود الكمية الكافية من بروتين الصويا في الغذاء أو األعشاب يساهم في التقليل
بتصلب الشرايين اإلصابةمن كوليسترول الدم وبالتالي قلة ته الدراسات العلمية األمريكية بين وتحسين وظائفها وهو ما
).8 (
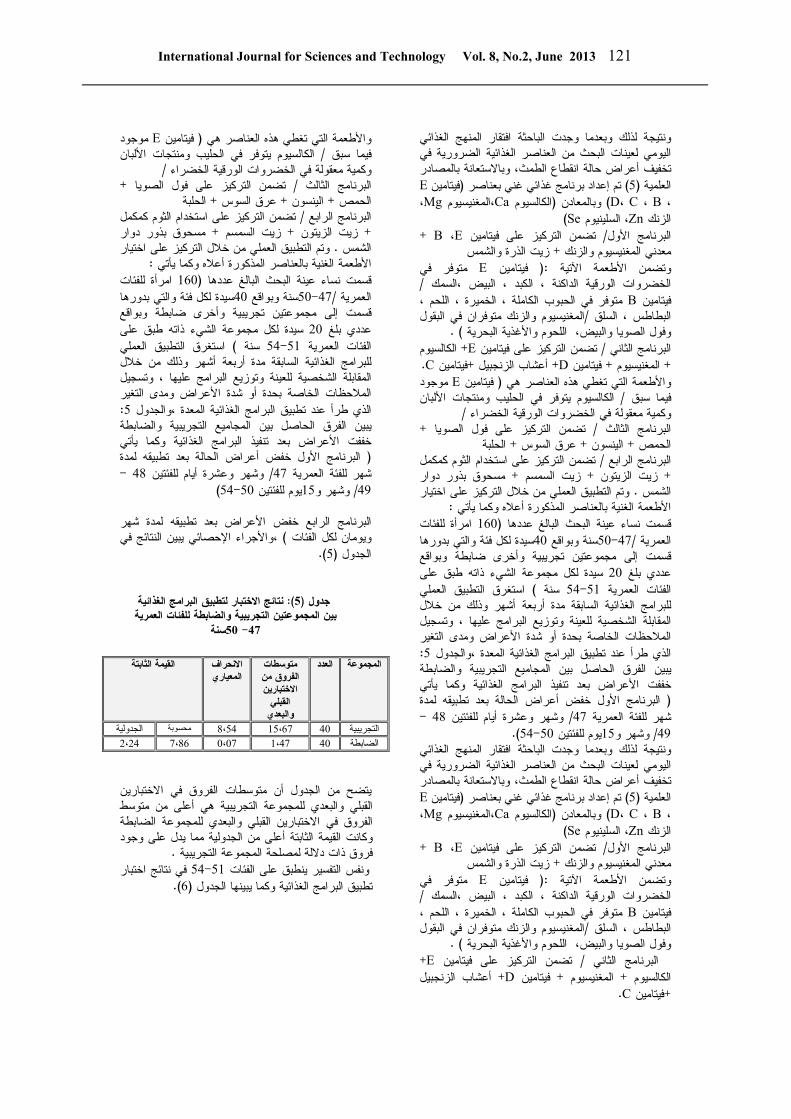
International Journal for Sciences and Technology Vol. 8, No.2, June 2013 121
المنهج الغذائي افتقارونتيجة لذلك وبعدما وجدت الباحثة اليومي لعينات البحث من العناصر الغذائية الضرورية في
بالمصادر وباالستعانة ، الطمثانقطاعتخفيف أعراض حالة Eفيتامين(تم إعداد برنامج غذائي غني بعناصر ) 5(العلمية
،B ، C، D ( وبالمعادن) الكالسيومCa المغنيسيوم،Mg ، )Se، السلينيوم Znالزنك
+ E ،Bتضمن التركيز على فيتامين / البرنامج األول زيت الذرة والشمس + معدني المغنيسيوم والزنك
متوفر في Eفيتامين :( وتضمن األطعمة اآلتية / الخضروات الورقية الداكنة ، الكبد ، البيض ،السمك
متوفر في الحبوب الكاملة ، الخميرة ، اللحم ، Bفيتامين المغنيسيوم والزنك متوفران في البقول / ، السلق سالبطاط
) .وفول الصويا والبيض، اللحوم واألغذية البحرية الكالسيوم + Eتضمن التركيز على فيتامين / البرنامج الثاني
.Cفيتامين +أعشاب الزنجبيل + Dفيتامين + المغنيسيوم + موجود Eفيتامين ( واألطعمة التي تغطي هذه العناصر هي
الكالسيوم يتوفر في الحليب ومنتجات األلبان / فيما سبق / وكمية معقولة في الخضروات الورقية الخضراء
+ تضمن التركيز على فول الصويا / البرنامج الثالث الحلبة + عرق السوس + الينسون + الحمص
تضمن التركيز على استخدام الثوم كمكمل / لرابع البرنامج امسحوق بذور دوار + زيت السمسم + زيت الزيتون +
اختياروتم التطبيق العملي من خالل التركيز على . الشمس :األطعمة الغنية بالعناصر المذكورة أعاله وكما يأتي
للفئات امرأة 160(قسمت نساء عينة البحث البالغ عددها سيدة لكل فئة والتي بدورها 40سنة وبواقع 50-47/العمرية
قسمت إلى مجموعتين تجريبية وأخرى ضابطة وبواقع ذاته طبق على يءالش سيدة لكل مجموعة 20عددي بلغ
التطبيق العملي استغرق) سنة 54-51الفئات العمرية للبرامج الغذائية السابقة مدة أربعة أشهر وذلك من خالل
لعينة وتوزيع البرامج عليها ، وتسجيل المقابلة الشخصية لالمالحظات الخاصة بحدة أو شدة األعراض ومدى التغير
: 5الذي طرأ عند تطبيق البرامج الغذائية المعدة ،والجدول يبين الفرق الحاصل بين المجاميع التجريبية والضابطة
خففت األعراض بعد تنفيذ البرامج الغذائية وكما يأتي امج األول خفض أعراض الحالة بعد تطبيقه لمدة البرن(
- 48وشهر وعشرة أيام للفئتين / 47شهر للفئة العمرية .)54-50يوم للفئتين 15وشهر و/ 49
المنهج الغذائي افتقارونتيجة لذلك وبعدما وجدت الباحثة اليومي لعينات البحث من العناصر الغذائية الضرورية في
بالمصادر وباالستعانة ،لطمث اانقطاعتخفيف أعراض حالة Eفيتامين(تم إعداد برنامج غذائي غني بعناصر ) 5(العلمية
،B ، C، D ( وبالمعادن) الكالسيومCa المغنيسيوم،Mg ، )Se، السلينيوم Znالزنك
+ E ،Bتضمن التركيز على فيتامين / البرنامج األول زيت الذرة والشمس + معدني المغنيسيوم والزنك
متوفر في Eفيتامين :( ألطعمة اآلتية وتضمن ا/ الخضروات الورقية الداكنة ، الكبد ، البيض ،السمك
متوفر في الحبوب الكاملة ، الخميرة ، اللحم ، Bفيتامين المغنيسيوم والزنك متوفران في البقول / ، السلق سالبطاط
) .وفول الصويا والبيض، اللحوم واألغذية البحرية + Eتضمن التركيز على فيتامين / لثاني البرنامج ا
أعشاب الزنجبيل + Dفيتامين + المغنيسيوم + الكالسيوم .Cفيتامين +
موجود Eفيتامين ( واألطعمة التي تغطي هذه العناصر هي الكالسيوم يتوفر في الحليب ومنتجات األلبان / فيما سبق
/ وكمية معقولة في الخضروات الورقية الخضراء + تضمن التركيز على فول الصويا / الثالث البرنامج الحلبة + عرق السوس + الينسون + الحمص
تضمن التركيز على استخدام الثوم كمكمل / البرنامج الرابع مسحوق بذور دوار + زيت السمسم + زيت الزيتون +
اختياروتم التطبيق العملي من خالل التركيز على . الشمس :المذكورة أعاله وكما يأتي األطعمة الغنية بالعناصر
للفئات امرأة 160(قسمت نساء عينة البحث البالغ عددها سيدة لكل فئة والتي بدورها 40سنة وبواقع 50-47/العمرية
قسمت إلى مجموعتين تجريبية وأخرى ضابطة وبواقع ذاته طبق على يءالش سيدة لكل مجموعة 20عددي بلغ
التطبيق العملي قاستغر) سنة 54-51الفئات العمرية للبرامج الغذائية السابقة مدة أربعة أشهر وذلك من خالل المقابلة الشخصية للعينة وتوزيع البرامج عليها ، وتسجيل المالحظات الخاصة بحدة أو شدة األعراض ومدى التغير
: 5الذي طرأ عند تطبيق البرامج الغذائية المعدة ،والجدول يع التجريبية والضابطة يبين الفرق الحاصل بين المجام
خففت األعراض بعد تنفيذ البرامج الغذائية وكما يأتي البرنامج األول خفض أعراض الحالة بعد تطبيقه لمدة (
- 48وشهر وعشرة أيام للفئتين / 47شهر للفئة العمرية )54-50يوم للفئتين 15وشهر و/ 49
شهر البرنامج الرابع خفض األعراض بعد تطبيقه لمدة يبين النتائج في اإلحصائيواألجراء ،)ويومان لكل الفئات
). 5(الجدول
لتطبيق البرامج الغذائية االختبار نتائج ):5(جدول بين المجموعتين التجريبية والضابطة للفئات العمرية
سنة50 -47
متوسطات العدد المجموعة
الفروق من االختبارينالقبلي والبعدي
االنحراف ياريالمع
القيمة الثابتة
الجدولية سوبةمح 8،54 15،67 40 التجريبية 2،24 7،86 0،07 1،47 40 الضابطة
يتضح من الجدول أن متوسطات الفروق في االختبارين القبلي والبعدي للمجموعة التجريبية هي أعلى من متوسط الفروق في االختبارين القبلي والبعدي للمجموعة الضابطة
يمة الثابتة أعلى من الجدولية مما يدل على وجود وكانت الق .فروق ذات داللة لمصلحة المجموعة التجريبية
في نتائج اختبار 54-51ونفس التفسير ينطبق على الفئات ). 6(تطبيق البرامج الغذائية وكما يبينها الجدول
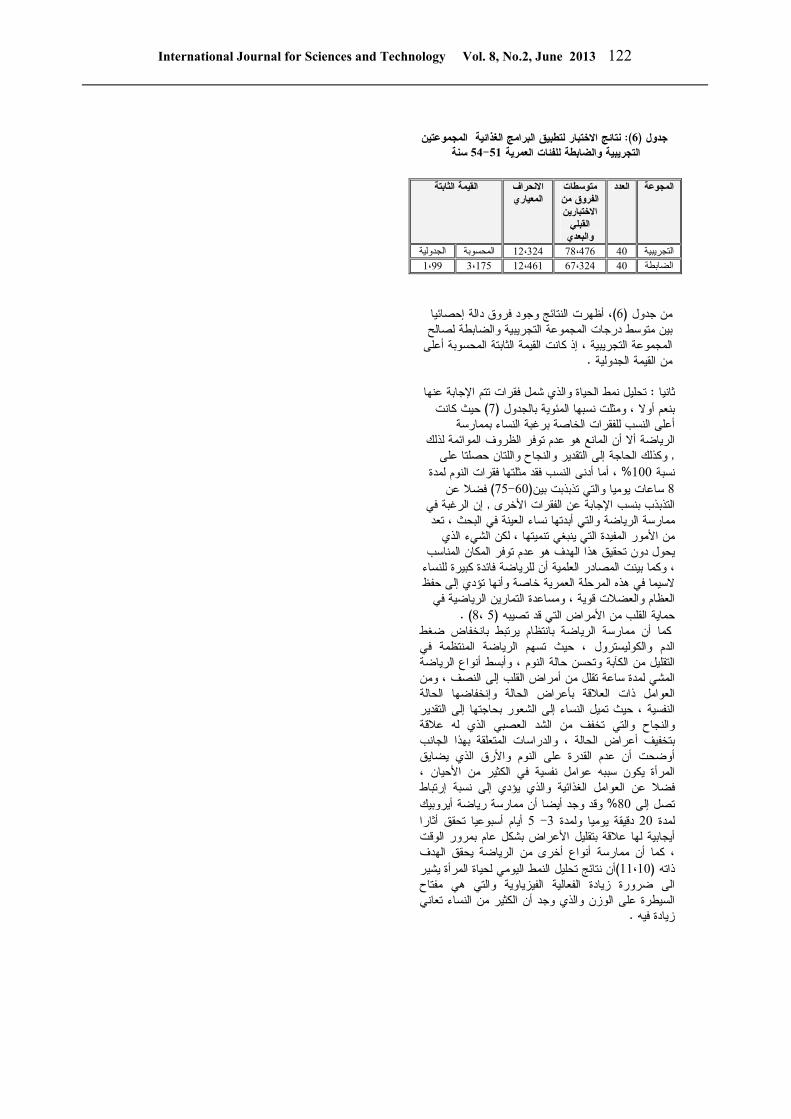
International Journal for Sciences and Technology Vol. 8, No.2, June 2013 122
ين لتطبيق البرامج الغذائية المجموعتاالختبار نتائج ):6(جدول سنة54-51التجريبية والضابطة للفئات العمرية
متوسطات العدد المجوعة
الفروق من االختبارينالقبلي والبعدي
االنحراف المعياري
القيمة الثابتة
الجدولية المحسوبة 12،324 78،476 40 التجريبية 1،99 3،175 12،461 67،324 40 الضابطة
فروق دالة إحصائيا أظهرت النتائج وجود، )6(من جدول بين متوسط درجات المجموعة التجريبية والضابطة لصالح
المجموعة التجريبية ، إذ كانت القيمة الثابتة المحسوبة أعلى .من القيمة الجدولية
عنها اإلجابةتحليل نمط الحياة والذي شمل فقرات تتم : ثانيا
انتحيث ك) 7(بنعم أوال ، ومثلت نسبها المئوية بالجدول أعلى النسب للفقرات الخاصة برغبة النساء بممارسة
الرياضة أال أن المانع هو عدم توفر الظروف الموائمة لذلك التقدير والنجاح واللتان حصلتا على إلىوكذلك الحاجة ,
، أما أدنى النسب فقد مثلتها فقرات النوم لمدة % 100نسبة عن فضال) 75-60( ساعات يوميا والتي تذبذبت بين8
إن الرغبة في , التذبذب بنسب اإلجابة عن الفقرات األخرى ممارسة الرياضة والتي أبدتها نساء العينة في البحث ، تعد
الذي يءمن األمور المفيدة التي ينبغي تنميتها ، لكن الشيحول دون تحقيق هذا الهدف هو عدم توفر المكان المناسب
ة فائدة كبيرة للنساء ، وكما بينت المصادر العلمية أن للرياضالسيما في هذه المرحلة العمرية خاصة وأنها تؤدي إلى حفظ
العظام والعضالت قوية ، ومساعدة التمارين الرياضية في ) . 8 ،5(حماية القلب من األمراض التي قد تصيبه
ضغط بانخفاض يرتبط بانتظامكما أن ممارسة الرياضة ضة المنتظمة في الدم والكوليسترول ، حيث تسهم الريا
التقليل من الكآبة وتحسن حالة النوم ، وأبسط أنواع الرياضة المشي لمدة ساعة تقلل من أمراض القلب إلى النصف ، ومن العوامل ذات العالقة بأعراض الحالة وإنخفاضها الحالة النفسية ، حيث تميل النساء إلى الشعور بحاجتها إلى التقدير
شد العصبي الذي له عالقة والنجاح والتي تخفف من البتخفيف أعراض الحالة ، والدراسات المتعلقة بهذا الجانب أوضحت أن عدم القدرة على النوم واألرق الذي يضايق المرأة يكون سببه عوامل نفسية في الكثير من األحيان ، فضال عن العوامل الغذائية والذي يؤدي إلى نسبة إرتباط
ممارسة رياضة أيروبيك وقد وجد أيضا أن% 80تصل إلى أيام أسبوعيا تحقق أثارا 5 -3 دقيقة يوميا ولمدة 20لمدة
أيجابية لها عالقة بتقليل األعراض بشكل عام بمرور الوقت ، كما أن ممارسة أنواع أخرى من الرياضة يحقق الهدف
أن نتائج تحليل النمط اليومي لحياة المرأة يشير )11،10(ذاته فعالية الفيزياوية والتي هي مفتاح الى ضرورة زيادة ال
السيطرة على الوزن والذي وجد أن الكثير من النساء تعاني .زيادة فيه
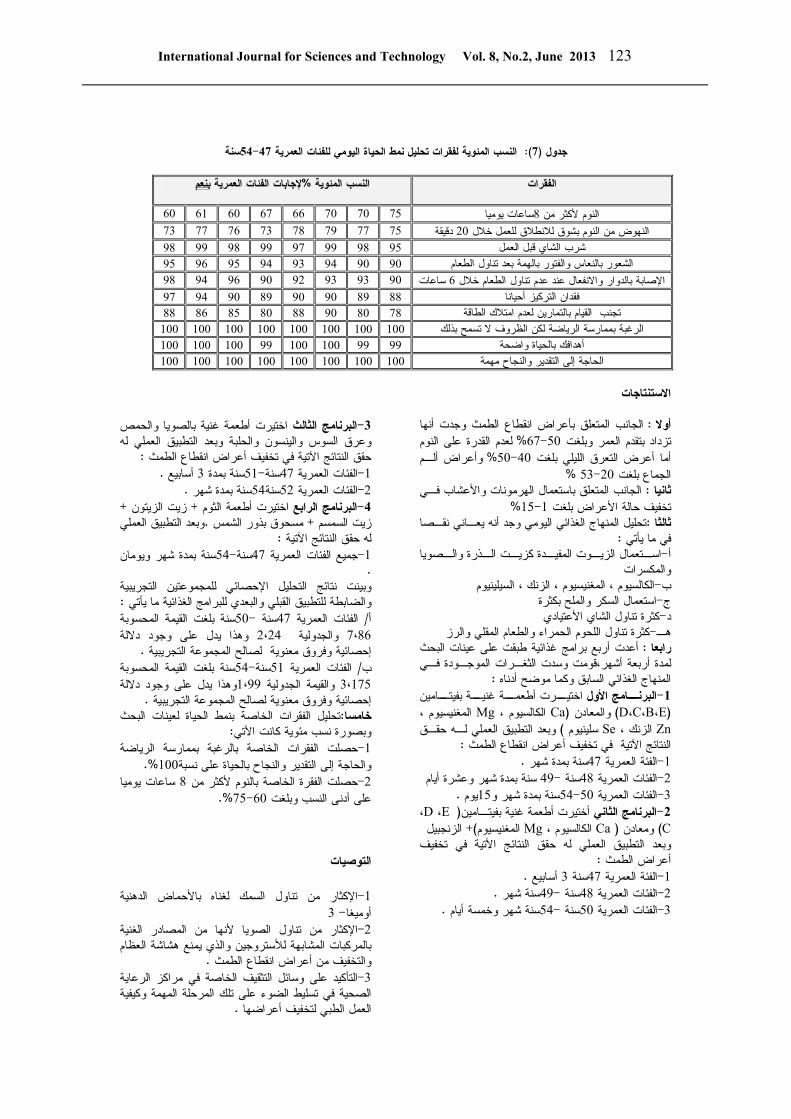
International Journal for Sciences and Technology Vol. 8, No.2, June 2013 123
سنة54-47 النسب المئوية لفقرات تحليل نمط الحياة اليومي للفئات العمرية ):7(جدول
بنعم الفئات العمرية إلجابات%النسب المئوية قراتالف
60 61 60 67 66 70 70 75 ساعات يوميا8النوم ألكثر من
73 77 76 73 78 79 77 75 دقيقة20النهوض من النوم بشوق لالنطالق للعمل خالل
98 99 98 99 97 99 98 95 شرب الشاي قبل العمل 95 96 95 94 93 94 90 90 تناول الطعامالشعور بالنعاس والفتور بالهمة بعد
98 94 96 90 92 93 93 90 ساعات6 عند عدم تناول الطعام خالل واالنفعال بالدوار اإلصابة
97 94 90 89 90 90 89 88 فقدان التركيز أحيانا 88 86 85 80 88 90 80 78 الطاقةامتالكتجنب القيام بالتمارين لعدم
100 100 100 100 100 100 100 100 تسمح بذلك ضة لكن الظروف الالرغبة بممارسة الريا 100 100 100 99 100 100 99 99 أهدافك بالحياة واضحة
100 100 100 100 100 100 100 100 الحاجة إلى التقدير والنجاح مهمة
االستنتاجات
الطمث وجدت أنها انقطاعالجانب المتعلق بأعراض : أواللعدم القدرة على النوم % 67-50لعمر وبلغت تزداد بتقدم ا
وأعراض ألـم % 50-40أما أعرض التعرق الليلي بلغت %53-20الجماع بلغت
الهرمونات واألعشاب فـي باستعمالالجانب المتعلق : ثانيا %15-1تخفيف حالة األعراض بلغت
تحليل المنهاج الغذائي اليومي وجد أنه يعـاني نقـصا :ثالثا :في ما يأتي
الزيــوت المفيــدة كزيــت الــذرة والــصويا اســتعمال-أ والمكسرات
الكالسيوم ، المغنيسيوم ، الزنك ، السيلينيوم -ب السكر والملح بكثرة استعمال-ج كثرة تناول الشاي األعتيادي -د
كثرة تناول اللحوم الحمراء والطعام المقلي والرز -هـينات البحث أعدت أربع برامج غذائية طبقت على ع : رابعا
لمدة أربعة أشهر،قومت وسدت الثغـرات الموجـودة فـي :المنهاج الغذائي السابق وكما موضح أدناه
ــامج األول-1 ــرت البرن ــامين اختي ــة بفيت ــة غني أطعم)E،B،C،D ( والمعادن)Ca ، الكالسيوم Mg ، المغنيسيوم
Zn ، الزنك Se وبعد التطبيق العملي لـه حقـق ) سلينيوم : الطمث انقطاع في تخفيف أعراض يةاآلتالنتائج
.سنة بمدة شهر 47الفئة العمرية -1 سنة بمدة شهر وعشرة أيام 49-سنة 48الفئات العمرية -2 .يوم 15سنة بمدة شهر و54-50الفئات العمرية -3، E ،D(أختيرت أطعمة غنية بفيتـامين البرنامج الثاني -2C ( ومعادن )Ca ، الكالسيوم Mgالزنجبيل + ) المغنيسيوم
وبعد التطبيق العملي له حقق النتائج األتية في تخفيف :أعراض الطمث
. أسابيع 3سنة 47الفئة العمرية -1 .سنة شهر 49-سنة 48الفئات العمرية -2 .سنة شهر وخمسة أيام 54-سنة 50الفئات العمرية -3
أطعمة غنية بالصويا والحمص اختيرتالبرنامج الثالث -3عرق السوس والينسون والحلبة وبعد التطبيق العملي له و
: الطمث انقطاع في تخفيف أعراض اآلتيةحقق النتائج . أسابيع 3سنة بمدة 51-سنة47الفئات العمرية -1 .سنة بمدة شهر 54سنة52الفئات العمرية -2+ زيت الزيتون + أطعمة الثوم اختيرتالبرنامج الرابع -4
وبعد التطبيق العملي .بذور الشمس مسحوق + زيت السمسم :اآلتيةله حقق النتائج
سنة بمدة شهر ويومان 54-سنة47جميع الفئات العمرية -1.
للمجموعتين التجريبية اإلحصائيوبينت نتائج التحليل :والضابطة للتطبيق القبلي والبعدي للبرامج الغذائية ما يأتي
يمة المحسوبة سنة بلغت الق50-سنة 47الفئات العمرية / أ وهذا يدل على وجود داللة 2،24 والجدولية 7،86
. وفروق معنوية لصالح المجموعة التجريبية إحصائيةسنة بلغت القيمة المحسوبة 54-سنة51الفئات العمرية / ب
وهذا يدل على وجود داللة 1،99 والقيمة الجدولية 3،175 .إحصائية وفروق معنوية لصالح المجموعة التجريبية
تحليل الفقرات الخاصة بنمط الحياة لعينات البحث :خامسا :وبصورة نسب مئوية كانت األتي
حصلت الفقرات الخاصة بالرغبة بممارسة الرياضة -1 %.100والحاجة إلى التقدير والنجاح بالحياة على نسبة
ساعات يوميا 8حصلت الفقرة الخاصة بالنوم ألكثر من -2 %.75-60على أدنى النسب وبلغت
التوصيات
من تناول السمك لغناه باألحماض الدهنية اإلكثار-1
3 -أوميغا من تناول الصويا ألنها من المصادر الغنية اإلكثار-2
بالمركبات المشابهة لألستروجين والذي يمنع هشاشة العظام . الطمث انقطاعوالتخفيف من أعراض
الرعاية التأكيد على وسائل التثقيف الخاصة في مراكز -3الصحية في تسليط الضوء على تلك المرحلة المهمة وكيفية
.العمل الطبي لتخفيف أعراضها
International Journal for Sciences and Technology Vol. 8, No.2, June 2013 124
التأكيد على دور المنظمات المعنية بالمرأة في أن يكون -4لها دورا في توفير أماكن أو قاعات لممارسة الرياضة في أماكن العمل أو المحلة وبذلك تتاح فرصة لممارسة الرياضة
.ن مصممة بشكل جيد في أماكالعناية الصحية والغذائية وإعداد برامج ثقافية في وسائل -5
.األعالم عن خصائص المرحلة وأهميتها إجراء دراسات مماثلة للنساء الغير متزوجات وإجراء -6
. راض الحالة مع النساء المتزوجاتمقارنة بين أع
المصادر غازي يـونس ظاهر ،جعفر صادق ، مراجعة العبيدي ، .1 أسس التغذية الـصحية ، الطبعـة األولـى ، دار .)2004(
-255 األردن ص –مجدالوي للنشر والتوزيـع ، عمـان 287.
2. World Health Organization (2003). Health Care of the elderly in the Eastern Mediterranean Region Challenges and perspectives. Cairo World health Organization office for Eastern Mediterranean. P. 27-33.
3. The Menopause Handbook (2006). A companion guide to the Society of Obstetricians and Gynecologists of Canada Menopause Consensus Report.
4. Sternfeld B; Bhat AK; Wang H; Sharp T; and Quesenberry CP.(2005). Menopause, physical activity, and body composition/fat distribution in midlife women. Med Sci. Sports Exec. 37: 1195 5. Alternative Therapies for managing menopausal symptoms national centre for complementary and Alternative medicine . (2002). P. 106-111. 6. Elavsky S; and Mcaauley E. (2005). physiological and ecological correlates of menopause –related quality of life. med. sci. sports execs. 37(5):69-73. 7. Euro American Medical Group (2004).http//www.eamg –med .co 8. ACSM (American college of sports medicine ) (2010). Position stands –recommended quality and quality of Exercise for developing cardio respiratory and muscular fitness and flexibility in adults + Exercise and physical activity. P. 33-36. 9. Pien Gw; Sammel MD; and Freeman EW. (2008). Predictors of sleep quality in women in the menopausal transit. Phyis. Health. 120-126. 10. Freeman Ew;, Sammel MD; and Lin H.(2007). Symptoms associated with menopausal –transition and a reproductive hormone in midi fife women obstetrics and gynecology. Med. 1:16-22.
11. Salwa TA. (2006).What do medical students in Alexandria know about female genital mutilation? East. Mediterran. Health. J. 12 (2): 46-48.


![q be sinceve in study' dean okui demands - Coocanmitacampus.blue.coocan.jp/archive/eijishinnbunn/1956/062.pdf · ... 'o,ty lqlcmeters south of San Franeiseo and the ] ... "iJst i4Lsia-Africa](https://img.pdfslide.us/doc/110x75/5aacf21c7f8b9a2b4c8dd1b5/q-be-sinceve-in-study-dean-okui-demands-oty-lqlcmeters-south-of-san-franeiseo.jpg)