Embed Size (px)
DESCRIPTION
Infrastructure Journal Global PF Review
Citation preview
Global ProjectFinance Infrastructure
Review Full Year2013
Researched and published in January 2014 for Infrastructure Journal, A Euromoney Institutional Investor plc service by Dan Tallis and Muhabbat Mahmudova
Terms of use and copyright conditions
This report is copyrighted. All rights reserved and no part of this publication may be reproduced, stored in a retrieval
system or transmitted in any form without prior permission of the publishers.
We have taken every precaution to ensure that details provided in this report are accurate. The publishers are not liable
for any omissions, errors or incorrect insertions, or for any interpretations made from the report.
For more information please contact:
Infrastructure Journal
A Euromoney Institutional Investor plc service
Nestor House
Playhouse Yard
London EC4V 5EX
T: + 44 0 207 779 8023
www.ijonline.com
2 www.ijonline.com
www.ijonline.com
ContentsHeadline Figures – Project Finance Full Year 2013 4
Executive Summary 5
Regional Analysis 8
Africa & Middle East 9
Americas 10
Asia & Pacific 11
Europe 12
Sector Analysis 13
Oil & Gas 14
Power 16
Renewables 18
Transport 20
Social Infrastructure 22
Water 24
Global Infrastructure League Tables 25
3www.ijonline.com
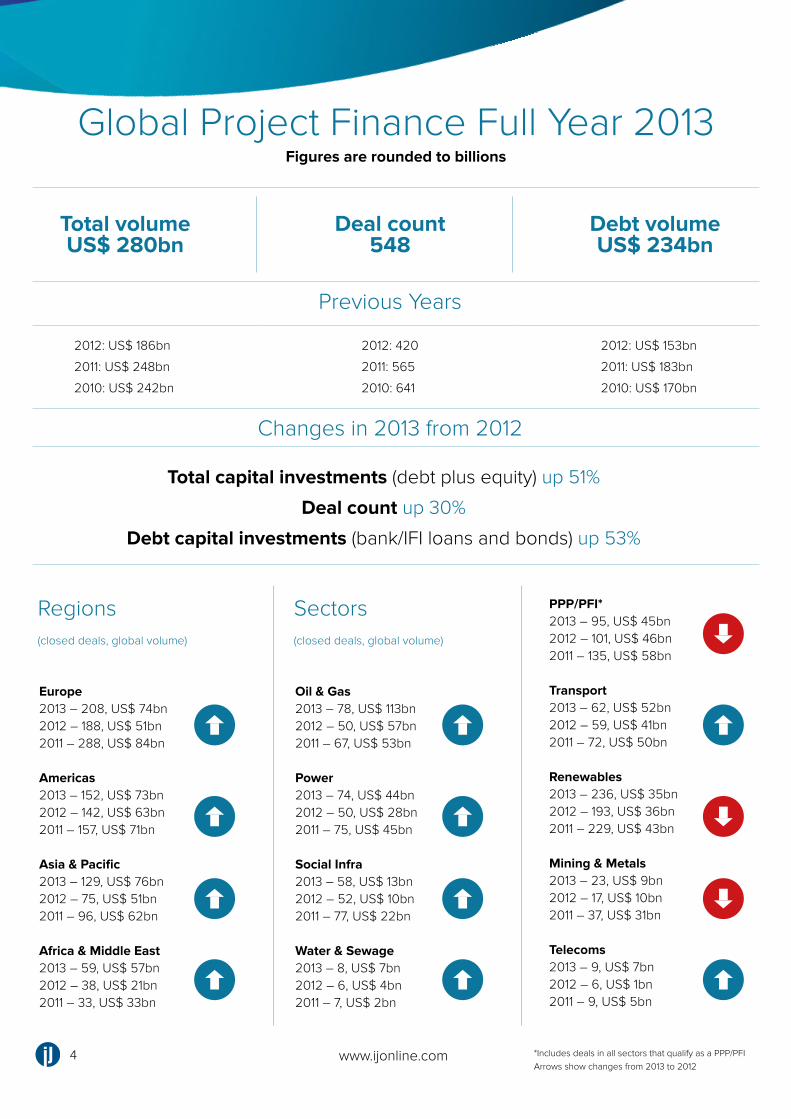
Global Project Finance Full Year 2013Figures are rounded to billions
Previous Years
Changes in 2013 from 2012
Regions Sectors
2012: US$ 186bn 2012: 420 2012: US$ 153bn
2011: US$ 248bn 2011: 565 2011: US$ 183bn
2010: US$ 242bn 2010: 641 2010: US$ 170bn
Europe2013 – 208, US$ 74bn2012 – 188, US$ 51bn2011 – 288, US$ 84bn
Americas2013 – 152, US$ 73bn2012 – 142, US$ 63bn2011 – 157, US$ 71bn
Asia & Pacific2013 – 129, US$ 76bn2012 – 75, US$ 51bn 2011 – 96, US$ 62bn
Africa & Middle East2013 – 59, US$ 57bn2012 – 38, US$ 21bn 2011 – 33, US$ 33bn
Oil & Gas2013 – 78, US$ 113bn2012 – 50, US$ 57bn 2011 – 67, US$ 53bn
Power 2013 – 74, US$ 44bn2012 – 50, US$ 28bn 2011 – 75, US$ 45bn
Social Infra2013 – 58, US$ 13bn2012 – 52, US$ 10bn 2011 – 77, US$ 22bn
Water & Sewage2013 – 8, US$ 7bn2012 – 6, US$ 4bn 2011 – 7, US$ 2bn
PPP/PFI*2013 – 95, US$ 45bn 2012 – 101, US$ 46bn 2011 – 135, US$ 58bn
Transport2013 – 62, US$ 52bn2012 – 59, US$ 41bn2011 – 72, US$ 50bn
Renewables2013 – 236, US$ 35bn2012 – 193, US$ 36bn2011 – 229, US$ 43bn
Mining & Metals2013 – 23, US$ 9bn2012 – 17, US$ 10bn 2011 – 37, US$ 31bn
Telecoms2013 – 9, US$ 7bn2012 – 6, US$ 1bn 2011 – 9, US$ 5bn
*Includes deals in all sectors that qualify as a PPP/PFIArrows show changes from 2013 to 2012
4 www.ijonline.com
Total volumeUS$ 280bn
Deal count548
Debt volumeUS$ 234bn
Total capital investments (debt plus equity) up 51%
Deal count up 30%
Debt capital investments (bank/IFI loans and bonds) up 53%
(closed deals, global volume) (closed deals, global volume)
www.ijonline.com
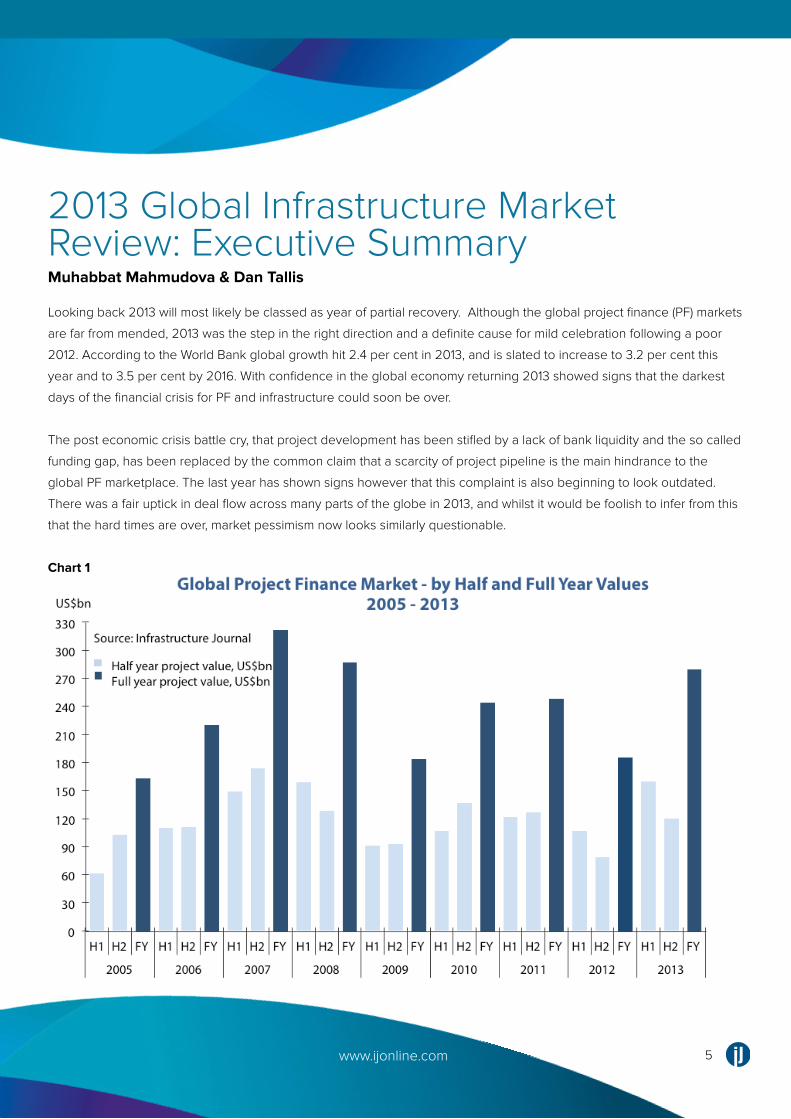
2013 Global Infrastructure Market Review: Executive SummaryMuhabbat Mahmudova & Dan Tallis
*Includes deals in all sectors that qualify as a PPP/PFIArrows show changes from 2013 to 2012
5www.ijonline.com
Looking back 2013 will most likely be classed as year of partial recovery. Although the global project finance (PF) markets
are far from mended, 2013 was the step in the right direction and a definite cause for mild celebration following a poor
2012. According to the World Bank global growth hit 2.4 per cent in 2013, and is slated to increase to 3.2 per cent this
year and to 3.5 per cent by 2016. With confidence in the global economy returning 2013 showed signs that the darkest
days of the financial crisis for PF and infrastructure could soon be over.
The post economic crisis battle cry, that project development has been stifled by a lack of bank liquidity and the so called
funding gap, has been replaced by the common claim that a scarcity of project pipeline is the main hindrance to the
global PF marketplace. The last year has shown signs however that this complaint is also beginning to look outdated.
There was a fair uptick in deal flow across many parts of the globe in 2013, and whilst it would be foolish to infer from this
that the hard times are over, market pessimism now looks similarly questionable.
Chart 1
www.ijonline.com
Regional markets showed good signs of improvement in 2013 with deal value across all regions up on the previous year.
The total global deal value was by 51 per cent at US$280 billion compared to US$180 billion in 2012. Total debt value was
up by 53 per cent and a deal count was up by 30 per cent.
Despite this positive note, and despite the overall increase in debt and equity levels, greenfield activity remains
dampened. The volume of finance for greenfield projects was up on 2012 but still remains considerably down on the high
levels of the pre-crisis years.
Australia and the US remained the top PF markets in 2013, the same positions the two countries occupied in 2012:
Australia in particular had a very successful year with nearly US$50 billion invested across all sectors (energy and
infrastructure). The US saw increased capital injection into energy and infrastructure projects in 2013 despite a fall in the
number of projects that reached financial close.
Saudi Arabia was the third largest country in terms of deal value as a result of closing big-value projects such as US$19
billion Sadara petrochemical complex financing. The UK remains the largest global market for project finance investments
in social and transport infrastructure sectors.
Activity in Eastern Europe was bolstered by a small number of countries which represented 31 per cent of capital
investments and 16.5 per cent of all deal volume in Europe as a whole. Turkey, the fifth biggest market of 2013, saw the
number of deals closed in 2013 rise to 13, up from just 4 in 2012.
Rounding out the top 10 countries were Vietnam with over US$9 billion (figures elevated by the massive US$9 billion Nghi
Son Refinery project), Nigeria with US$8.5 billion, Canada at US$7.6 billion, the United Arab Emirates with US$7.2 billion
and Germany at US$6.9 billion.
In terms of sectors, oil & gas led the way by overall deal value in 2013, netting US$113 billion. Transport was second with
just over US$50 billion, and in a reversal of 2012, power beat renewables into third (the sectors receiving over US$40
billion and US$35 billion respectively).
Despite the constraints facing many public sector budgets the availability of long term debt did not present an obstacle to
financing in 2013. In the small localities where the issue remained new financing solutions were investigated and utilised
to address the problem: for example 2013 saw an increase in the use of capital market financings in infrastructure, a
funding source that many believe has not yet been fully tapped and which could become a huge and widespread source
of infrastructure finance.
6 www.ijonline.com
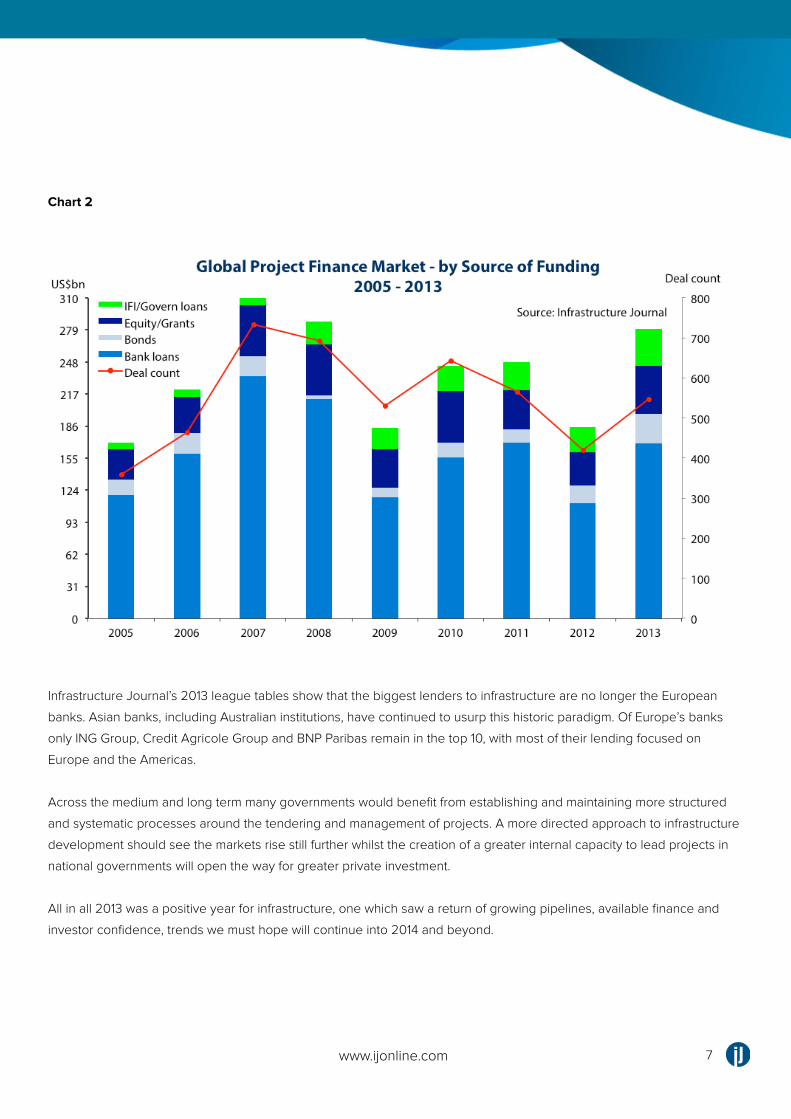
Chart 2
Infrastructure Journal’s 2013 league tables show that the biggest lenders to infrastructure are no longer the European
banks. Asian banks, including Australian institutions, have continued to usurp this historic paradigm. Of Europe’s banks
only ING Group, Credit Agricole Group and BNP Paribas remain in the top 10, with most of their lending focused on
Europe and the Americas.
Across the medium and long term many governments would benefit from establishing and maintaining more structured
and systematic processes around the tendering and management of projects. A more directed approach to infrastructure
development should see the markets rise still further whilst the creation of a greater internal capacity to lead projects in
national governments will open the way for greater private investment.
All in all 2013 was a positive year for infrastructure, one which saw a return of growing pipelines, available finance and
investor confidence, trends we must hope will continue into 2014 and beyond.
7www.ijonline.com
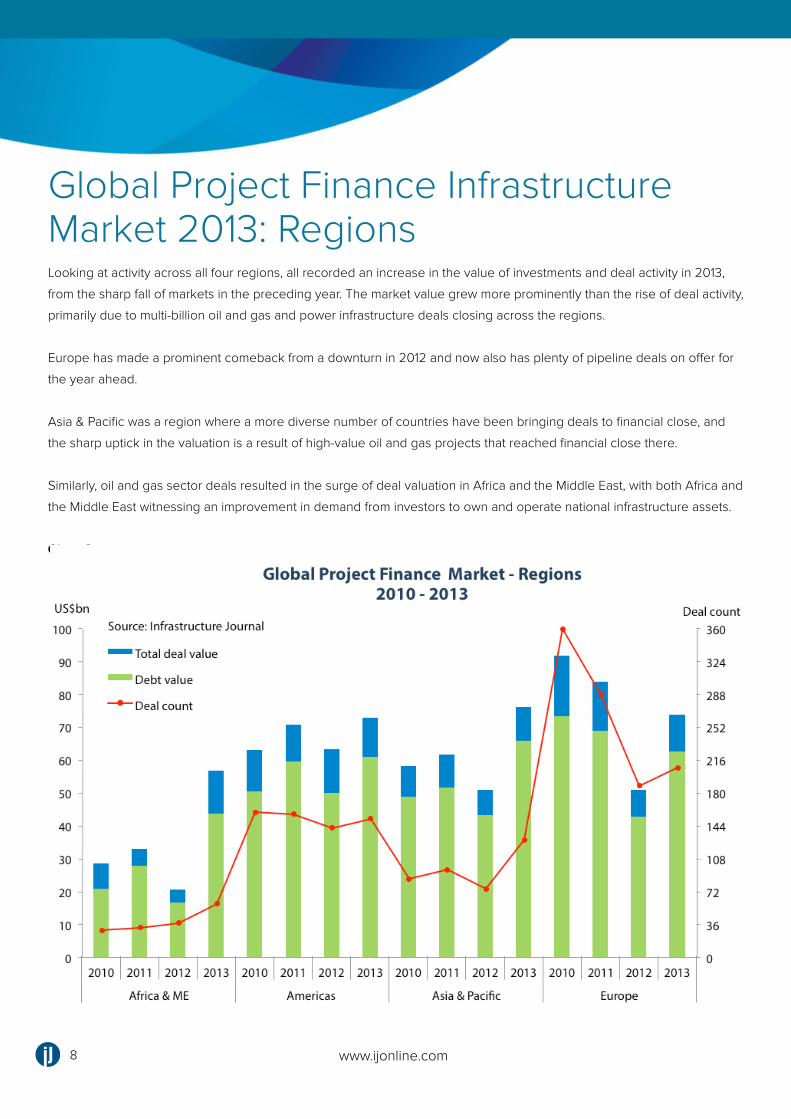
Looking at activity across all four regions, all recorded an increase in the value of investments and deal activity in 2013,
from the sharp fall of markets in the preceding year. The market value grew more prominently than the rise of deal activity,
primarily due to multi-billion oil and gas and power infrastructure deals closing across the regions.
Europe has made a prominent comeback from a downturn in 2012 and now also has plenty of pipeline deals on offer for
the year ahead.
Asia & Pacific was a region where a more diverse number of countries have been bringing deals to financial close, and
the sharp uptick in the valuation is a result of high-value oil and gas projects that reached financial close there.
Similarly, oil and gas sector deals resulted in the surge of deal valuation in Africa and the Middle East, with both Africa and
the Middle East witnessing an improvement in demand from investors to own and operate national infrastructure assets.
Chart 3
Global Project Finance Infrastructure Market 2013: Regions
8 www.ijonline.com
Africa & Middle EastSector Value (US$m) Value (US$m) Financial CloseTop Deal Country
Breakdown
Overall, the region saw a considerable year-on-year increase on investments, up from US$21 billion in 2012, fuelled by
high activity in energy sector. Oil and gas deals dominate the market in Nigeria, Israel, Angola, Ghana, and the Middle
East. Around 34 per cent of the region’s investments went to Sadara Petrochemical Complex, which received a total of
US$19.35 billion in loans/bonds financing.
In Africa, there was a twofold year-on-year increase in investments and deal flow - a total of 12 countries closed 29 deals
worth US$15.2 billion. The uptick in volume in Africa is due to oil and gas infrastructure deals in Nigeria, and Angola, and
renewable energy deals in South Africa. The largest deal in Africa was a US$6.15 billion Olokola Refinery and Petrochemi-
cal Plant in Nigeria.
MENA attracted 73.6 per cent of regional investments, where nine countries closed 30 deals worth US$42 billion, up from
a US$14.2 billion market valuation in 2012. MENA’s investments focused primarily on the oil and gas sector, where 68 per
cent of the capital was invested. Other active assets included Emal’s aluminium smelter, IWPPs in UAE and Kuwait, IPPs in
Saudi Arabia and Morocco, as well as onshore wind, and pv solar facilities in Jordan and Israel.
Across the entire region, countries with the highest value of investments were Saudia Arabia, Nigeria and the UAE.
Around 88 per cent of all the deals were new-build or expansion projects with construction costs, which attracted 92 per
cent all the region’s capital investments in 2013.
The region received US$57 billion in infrastructure investments for 59 projects; out of this US$44 billion was debt. The
Africa & Middle East region was dominated by Oil & Gas (62 per cent) followed by Power (21 per cent) and Mining & Metals
(9 per cent)
9www.ijonline.com
To get access to top deals by sector for Africa & Middle Eastplease contact [email protected]
Americas
Breakdown
TThe infrastructure market in the Americas has become the largest project finance market in 2013, advancing ahead of
Europe and Asia, and attracting 23 per cent of global project finance investments. Investments in infrastructure that have
been growing each year over the past four years, saw a 23 per cent year-on-year increase, and the deal count was up
by 8 per cent, fuelled by energy sector investments. Power sector attracted considerable capital investments in the USA,
Canada, Chile, Peru and Brazil with a total of US$23.8 billion. USA, Brazil and Mexico are the leading markets in the oil
and gas and transport sectors. Renewables sector has been particularly active making the Americas a global leader
in renewables last year, with 45 per cent of the global market share. Although 82 per cent of value concentrated in the
US and Canada, Latin America financed the higher number of deals in wind, pv solar and small hydro. USA and Canada
attracted a total of US$59.1 billion investments for 96 projects.
Latin America attracted a total of US$26.8 billion or 34 per cent of investments in the region, with most investments
focusing on Brazil, Mexico and Chile.
Across the entire region, countries with the highest value of investments were USA with US$38 billion investments,
Canada with US$13 billion, Mexico with US$7.2 billion and Brazil with US$7 billion.
Around 74 per cent of all the deals were new-build or expansion projects with construction costs, which attracted 75 per
cent of the total capital investments in the region in 2013.
The region received US$78 billion in infrastructure investments for 153 projects; out of this US$66 billion was debt. The
Americas was dominated by Power sector (31 per cent), Oil & Gas (29 per cent) followed and Renewables (20 per cent).
Sector Value (US$m) Value (US$m) Financial CloseTop Deal Country
10www.ijonline.com
To get access to top deals by sector for Americas
please contact [email protected]
Breakdown
The region was the second largest global market for infrastructure investments in 2013. Due to the characteristics of
regional trade between Australia, China, Japan and Indonesia, and India there is a prevalence of oil and gas sector
investments and infrastructure that supports these trade links within regional economies, these include LNG infrastructure,
drilling rigs, pipeline and refineries, as well as ports and other transport links.
The largest global transaction in project finance market last year was Australia’s Ichthys LNG project valued over US$20
billion. Traditionally, Australia is a market leader in terms of project finance investments; it closed a total of US$52 billion
worth of deals in 2013.
Besides Australia, another 19 countries raised financing for projects last year. Vietnam in particular has seen a boost in
project finance activity in oil and gas refinery sector.
Renewables have been growing steadily in the region, with an increase in onshore wind farms and pv solar. Onshore
wind farms raised a total of US$3.5 billion up from US$626 million in the year 2012. PV solar attracted a total of US$1.7
billion, up from US$203 million in 2012. Australia, Japan and Thailand are the dominant players in the renewables sector
in the region.
Around 64 per cent of all the deals were new-build or expansion projects, which attracted 67 per cent investments in the
region in 2013.
The region received US$76 billion in infrastructure investments for 129 projects; out of this US$66 billion was debt. The
Asia & Pacific region was dominated by Oil & Gas (50 per cent) followed by Transport (17 per cent) and Power (10 per cent).
Sector Value (US$m) Value (US$m) Financial CloseTop Deal Country
11www.ijonline.com
Asia & Pacific
To get access to top deals by sector for Asia & Pacific
please contact [email protected]
Europe
Breakdown
The region has conceded its dominant position as a global project finance market to the Americas and Asia.
Nevertheless, the region saw a considerable year-on-year improvement in the volume of investments putting a stop to
the decline that started in 2010.
There were 23 active countries that closed 163 greenfield, 27 refinancing and 17 acquisition deals both in Western and
Eastern Europe.
Greenfield investments with a total of US$39.7 billion closed mainly in transport, followed by renewables and social
infrastructure, with the year-on-year increase especially prominent across transport, social, oil and gas and water.
There was an uptick in M&A activity in the region, across oil and gas, power and transport sectors. Oil and gas sector
saw diverse assets reaching financial close that included greenfield LNG, storage, refinery and petrochemical facilities,
acquisition of natural gas networks, drilling rigs, and refinancing of earlier high-profile gas pipelines and storage
acquisition transactions.
Western Europe attracted around 72 per cent of all investments, or US$53 billion. Eastern Europe attracted a total of
US$21 billion investments, primarily in Transport and Power assets.
The UK was the largest project finance market in the region with US$19.7 billion investments in 53 deals. France closed
54 deals worth US$6.5 billion. Turkey is a rapidly growing area for infrastructure investments that closed 14 deals worth
US$13.1 billion, as well as several prominent corporate M&A deals – electricity and ports transactions.
Overall in Europe, around 79 per cent of all the deals were new-build or expansion, which attracted 54 per cent the total
investments. Around 30 per cent of the project finance investments went to refinancing transactions and the remaining 16
per cent financed M&A deals.
The region received US$74 billion in infrastructure investments for 207 projects; out of this US$63 billion was debt. Europe
was dominated by Transport (37 per cent) followed by Oil and Gas (22 per cent) and Renewables (15 per cent) with Social
Infrastructure accounting for (10 per cent).
Sector Value (US$m) Value (US$m) Financial CloseTop Deal Country
12www.ijonline.com
To get access to top deals by sector for Europe
please contact [email protected]
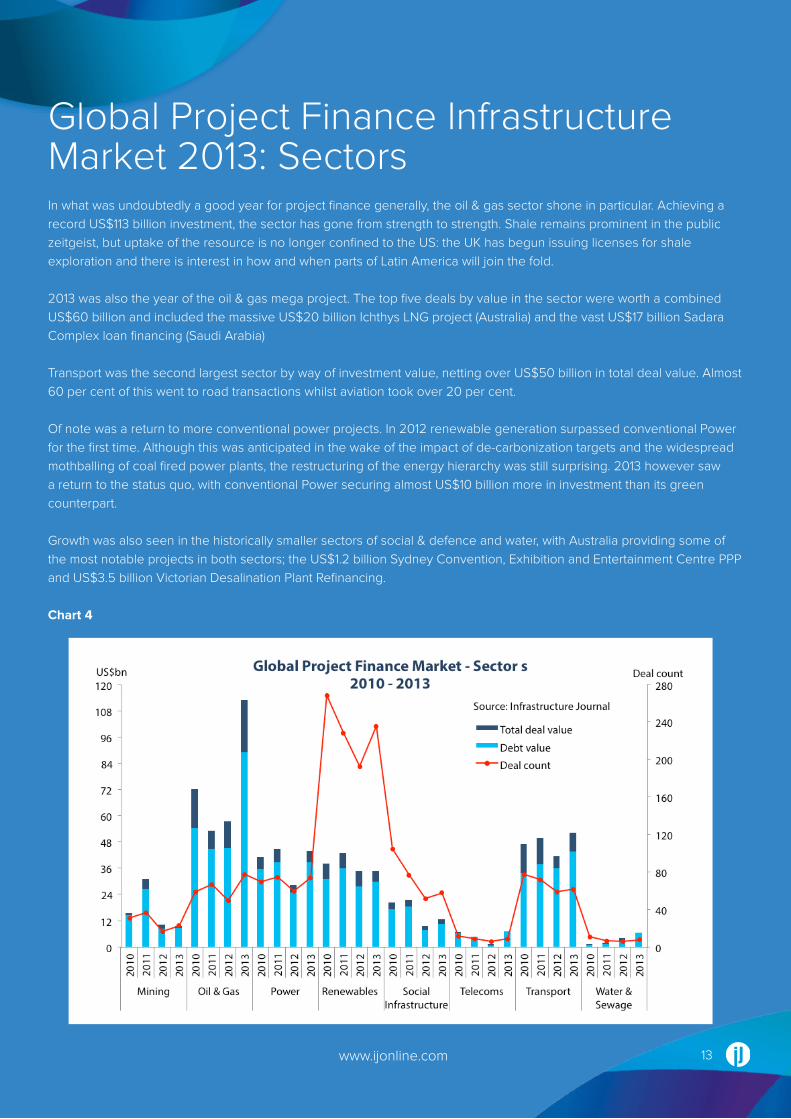
Global Project Finance Infrastructure Market 2013: SectorsIn what was undoubtedly a good year for project finance generally, the oil & gas sector shone in particular. Achieving a record US$113 billion investment, the sector has gone from strength to strength. Shale remains prominent in the public zeitgeist, but uptake of the resource is no longer confined to the US: the UK has begun issuing licenses for shale exploration and there is interest in how and when parts of Latin America will join the fold.
2013 was also the year of the oil & gas mega project. The top five deals by value in the sector were worth a combined US$60 billion and included the massive US$20 billion Ichthys LNG project (Australia) and the vast US$17 billion Sadara Complex loan financing (Saudi Arabia)
Transport was the second largest sector by way of investment value, netting over US$50 billion in total deal value. Almost 60 per cent of this went to road transactions whilst aviation took over 20 per cent.
Of note was a return to more conventional power projects. In 2012 renewable generation surpassed conventional Power for the first time. Although this was anticipated in the wake of the impact of de-carbonization targets and the widespread mothballing of coal fired power plants, the restructuring of the energy hierarchy was still surprising. 2013 however saw a return to the status quo, with conventional Power securing almost US$10 billion more in investment than its green counterpart.
Growth was also seen in the historically smaller sectors of social & defence and water, with Australia providing some of the most notable projects in both sectors; the US$1.2 billion Sydney Convention, Exhibition and Entertainment Centre PPP and US$3.5 billion Victorian Desalination Plant Refinancing.
Chart 4
13www.ijonline.com
Breakdown
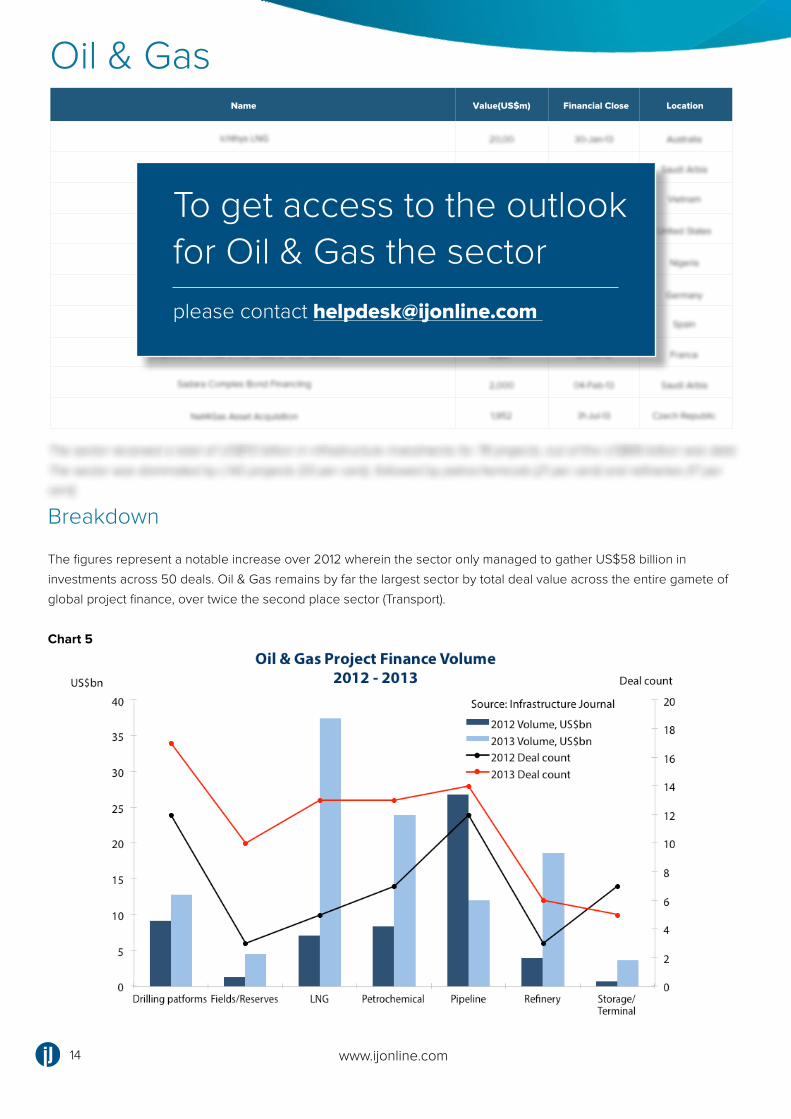
The figures represent a notable increase over 2012 wherein the sector only managed to gather US$58 billion in
investments across 50 deals. Oil & Gas remains by far the largest sector by total deal value across the entire gamete of
global project finance, over twice the second place sector (Transport).
Chart 5
The sector received a total of US$113 billion in infrastructure investments for 78 projects; out of this US$89 billion was debt.
The sector was dominated by LNG projects (33 per cent), followed by petrochemicals (21 per cent) and refineries (17 per
cent).
Oil & GasName Financial Close LocationValue(US$m)
14 www.ijonline.com
To get access to the outlook for Oil & Gas the sector
please contact [email protected]
Regionally, Asia & Pacific was the most active in the sector netting over US$37 billion in investments, narrowly beating
Africa & the Middle East into second with US$35 billion. Asia & Pacific also secured the
most debt, both in real terms (US$33 billion, nearly US$10 billion more than any other region) and in proportion to the total
value of all deals closed in the region, nearly 87 per cent of total deal value was debt (Europe had the second highest
ratio at 82 per cent but this was over the smallest total deal value US$16.7 billion and smallest total debt value US$13.8
billion).
Drivers & Risks
In the US shale continues to play a significant part in defining the landscape of Oil & Gas. Sabine Pass, Louisiana, closed
on its Liquefaction trains 3 & 4 in 2013, further developing the site’s capacity for export and other projects have begun
catching up; Freeport LNG, Texas, closed on two debt financings early in January 2014. The ramifications of US LNG are
now beginning to be felt across the globe, with industry claims that the cheap fuel will sound the death knell for Australian
mega projects.
Furthermore, with Europe changing from oil indexation to spot pricing, there are market rumours that Asia is investigating
a similar move. Though unlikely in the near term, any such change could have a major impact on US exports. Additionally
lower cost US coal has filtered into Europe affecting the traditional Russian supply chain.
Shale is no longer just a US phenomenon however, with the UK issuing licenses to begin exploratory production.
Hydraulic fracking still faces a large amount of public opposition in the UK however, and despite government attempts to
quell protests by offering financial incentives to local authorities, the extent to which UK shale will be explored remains
uncertain.
Oil production will be a notable driver for general economic growth in certain key African countries moving into 2014 and
beyond, enabling the region as a whole to develop through stimulating investment in other sectors e.g. transport.
15www.ijonline.com
Breakdown
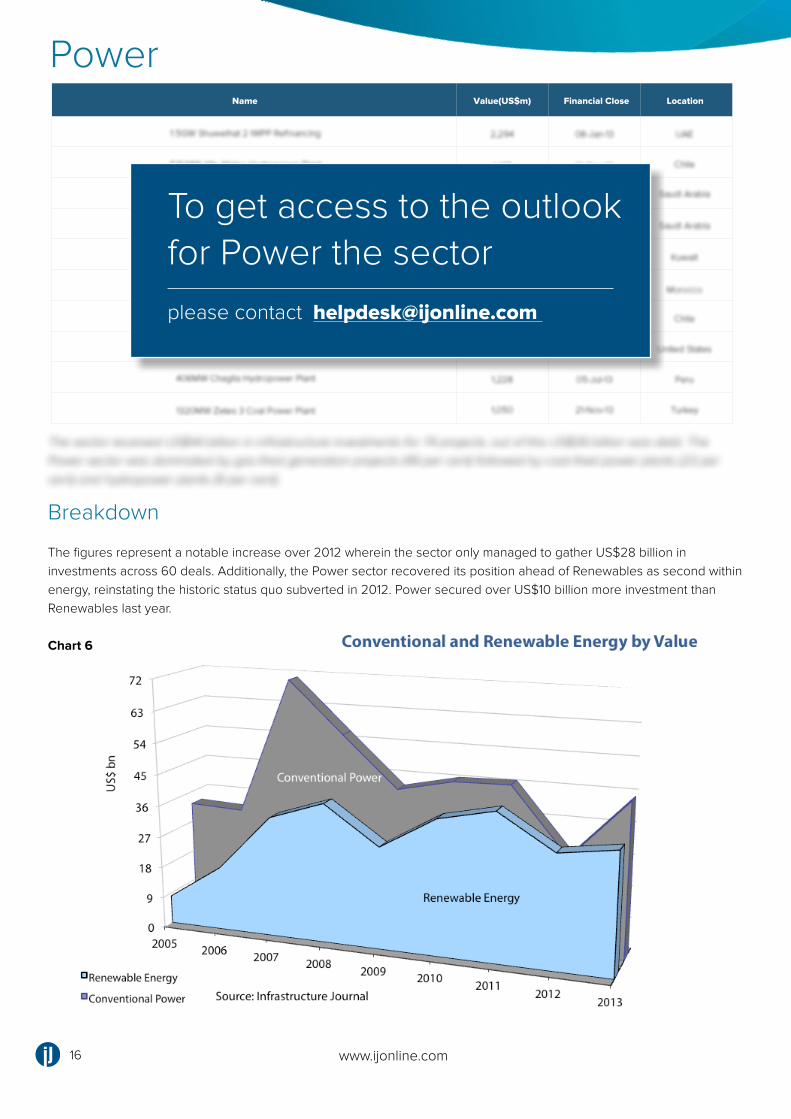
The figures represent a notable increase over 2012 wherein the sector only managed to gather US$28 billion in investments across 60 deals. Additionally, the Power sector recovered its position ahead of Renewables as second within energy, reinstating the historic status quo subverted in 2012. Power secured over US$10 billion more investment than Renewables last year.
Chart 6
The sector received US$44 billion in infrastructure investments for 74 projects; out of this US$39 billion was debt. The Power sector was dominated by gas-fired generation projects (49 per cent) followed by coal-fired power plants (23 per cent) and hydropower plants (9 per cent).
Name Financial Close LocationValue(US$m)
16 www.ijonline.com
Power
To get access to the outlook for Power the sector
please contact [email protected]
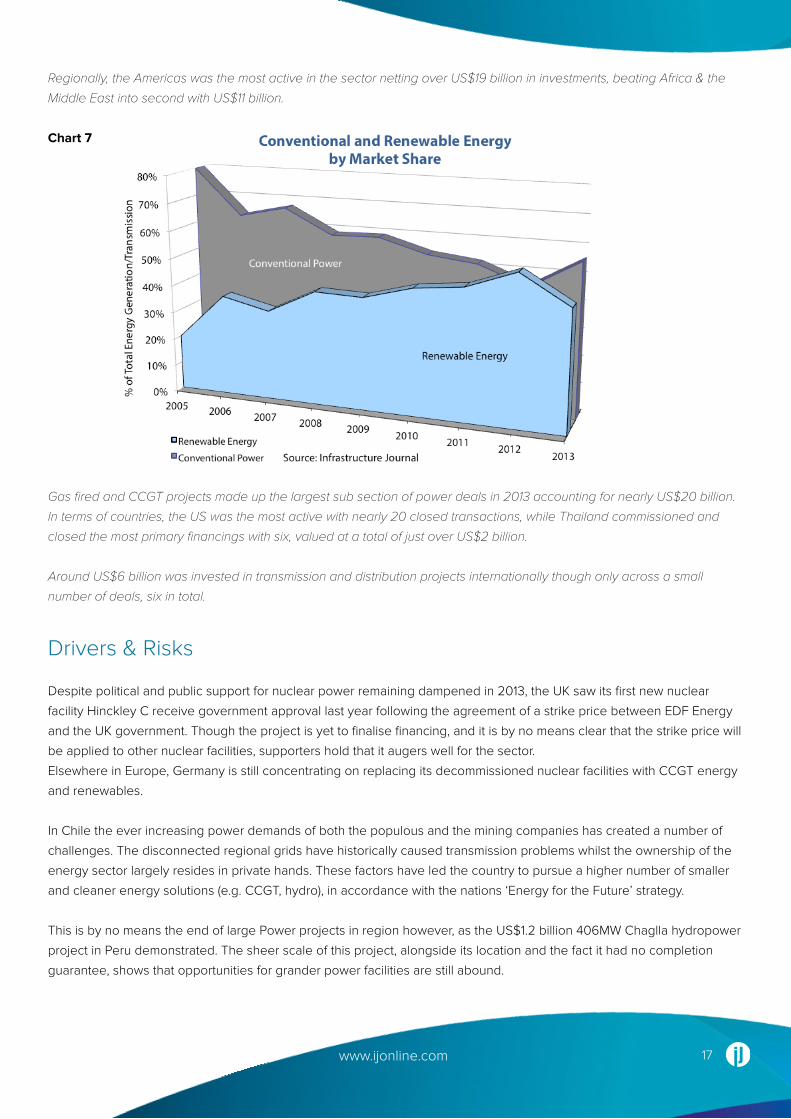
Regionally, the Americas was the most active in the sector netting over US$19 billion in investments, beating Africa & the
Middle East into second with US$11 billion.
Chart 7
Drivers & Risks
Despite political and public support for nuclear power remaining dampened in 2013, the UK saw its first new nuclear
facility Hinckley C receive government approval last year following the agreement of a strike price between EDF Energy
and the UK government. Though the project is yet to finalise financing, and it is by no means clear that the strike price will
be applied to other nuclear facilities, supporters hold that it augers well for the sector.
Elsewhere in Europe, Germany is still concentrating on replacing its decommissioned nuclear facilities with CCGT energy
and renewables.
In Chile the ever increasing power demands of both the populous and the mining companies has created a number of
challenges. The disconnected regional grids have historically caused transmission problems whilst the ownership of the
energy sector largely resides in private hands. These factors have led the country to pursue a higher number of smaller
and cleaner energy solutions (e.g. CCGT, hydro), in accordance with the nations ‘Energy for the Future’ strategy.
This is by no means the end of large Power projects in region however, as the US$1.2 billion 406MW Chaglla hydropower
project in Peru demonstrated. The sheer scale of this project, alongside its location and the fact it had no completion
guarantee, shows that opportunities for grander power facilities are still abound.
Gas fired and CCGT projects made up the largest sub section of power deals in 2013 accounting for nearly US$20 billion.
In terms of countries, the US was the most active with nearly 20 closed transactions, while Thailand commissioned and
closed the most primary financings with six, valued at a total of just over US$2 billion.
Around US$6 billion was invested in transmission and distribution projects internationally though only across a small
number of deals, six in total.
17www.ijonline.com
Breakdown
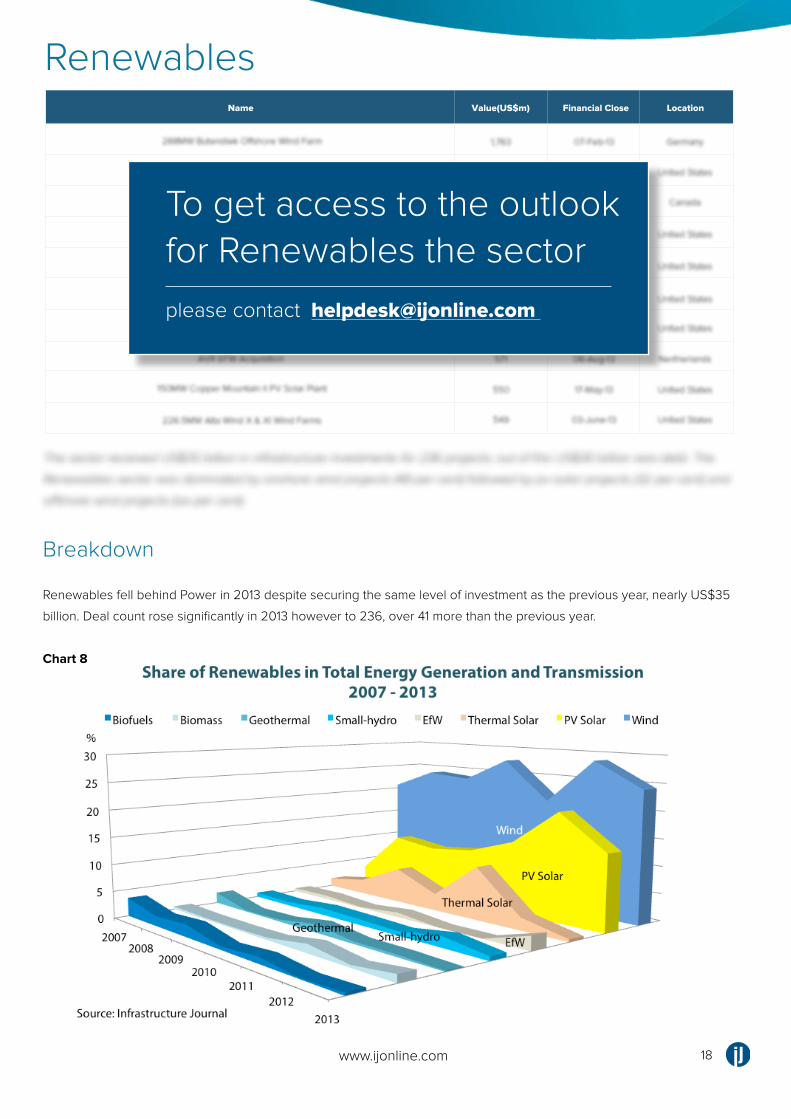
Renewables fell behind Power in 2013 despite securing the same level of investment as the previous year, nearly US$35
billion. Deal count rose significantly in 2013 however to 236, over 41 more than the previous year.
Chart 8
Name Financial Close LocationValue(US$m)
18www.ijonline.com
Renewables
The sector received US$35 billion in infrastructure investments for 236 projects; out of this US$30 billion was debt. The
Renewables sector was dominated by onshore wind projects (49 per cent) followed by pv solar projects (32 per cent) and
offshore wind projects (six per cent).
To get access to the outlook for Renewables the sector
please contact [email protected]
www.ijonline.com
Unsurprisingly the stalwarts of Renewables generation, the Americas and Europe, took the majority of investments, US$26
billion in total: the Americas secured top spot with US$15.5 billion in investment, Europe closed on nearly US$11 billion worth
of financing for Renewable projects.
Wind and solar still make up the vast majority of closed deals in 2013, with the usual suspects of the US, UK, France
Germany, Italy Canada and Australia taking the lions share of the projects.
Drivers & Risks
India has grand plans for renewable energy, aiming to deliver 20,000MW of grid connected renewable capacity by 2022
under its National Solar Mission, and whilst slow and unreliable procurement process present an obstacle to this target,
local Indian banks are beginning to show more interest in the technology.
South Africa’s impressive REIPP programme continued apace in 2013 with financial closure for a range of renewables
projects. The model looks to be working well and should provide continued opportunities in the future.
The now labored story of regulatory uncertainty still dogs US renewables, and with various incentives set to expire in the
immanent future the sector looks set to remain elastic in the near to medium term.
In terms of sub sectors, the technological risk of offshore wind, a traditional obstruction to project uptake, are beginning
to reduce. Major turbine manufactures like Vestas and Siemens are being joined by industrial giants like Hyundai, which
could lower the cost of equipment and make projects more cost effective.
The onshore sector in Europe is still beleaguered by the economic crisis, with many governments withdrawing support for
renewable projects under political and public pressure. Despite this some countries, e.g., France are trying to encourage
Renewable generation through new PPA contract structures.hands in the next 12 months. A boom in M&A activity may
signal overconfidence in the market, however, M&A deal volume is expected to grow, there are not many assets on sale,
and overall demand outstrips supply, therefore pushing prices up across the assets.
19 www.ijonline.com
Breakdown
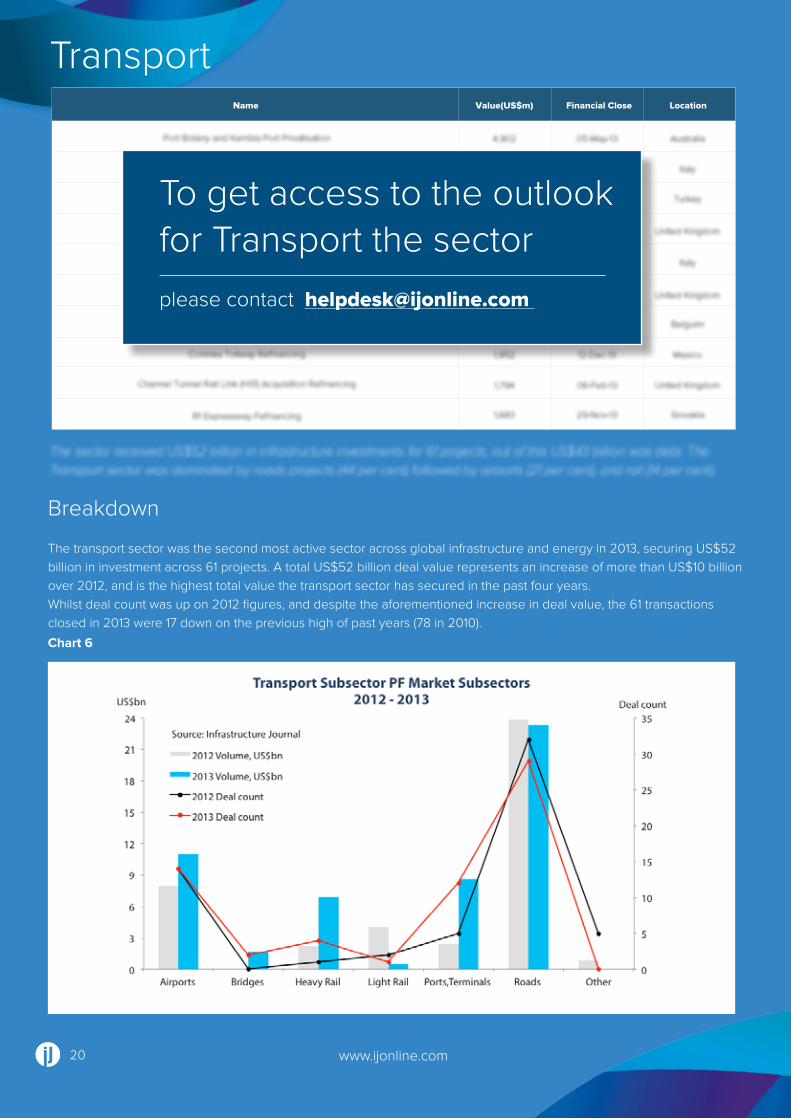
The transport sector was the second most active sector across global infrastructure and energy in 2013, securing US$52 billion in investment across 61 projects. A total US$52 billion deal value represents an increase of more than US$10 billion over 2012, and is the highest total value the transport sector has secured in the past four years.Whilst deal count was up on 2012 figures, and despite the aforementioned increase in deal value, the 61 transactions closed in 2013 were 17 down on the previous high of past years (78 in 2010).
Chart 6
TransportName Financial Close LocationValue(US$m)
20 www.ijonline.com
The sector received US$52 billion in infrastructure investments for 61 projects; out of this US$43 billion was debt. The Transport sector was dominated by roads projects (44 per cent) followed by airports (21 per cent), and rail (14 per cent).
To get access to the outlook for Transport the sector
please contact [email protected]
Only three regions were active in this sector last year, the Americas, Asia & Pacific and Europe. Among those Europe was
far and away the sector leader, securing over US$27 billion in investment, over twice the combined total of the Americas
and Asia & Pacific combined (US$12.1 and US$12.9 billion respectively).
Drivers & Risks
The US is continuing to promote innovative schemes to tempt institutional investors into the transport space to fill the
need left by reduced government funding; for example the Chicago Infrastructure Trust and The West Coast Infrastructure
Exchange advocate a bundling approach to projects in an attempt to entice pension funds and the like and replace
reduced municipal bond financing.
The aviation sector faces many challenges in the short and medium term, including capacity constraints, connection
with associated transported networks and environmental impacts. Whilst this could well affect the amount of greenfield
developments the secondary market should remain active.
The toll model has been hit in certain regions, largely the result of squeezed public cash-flow, with projects in Italy and
the UK reporting falling traffic figures and reduced revenue. Whilst the model remains viable in countries long used it, e.g.
US, Australia, France, new projects in countries unfamiliar with the structure may struggle.
Also of note is the European Commission’s EU Project Bond Initiative, something which aims to attract institutional
investors to infrastructure and which is spearheaded by the European Investment Bank (EIB).
21www.ijonline.com
Breakdown
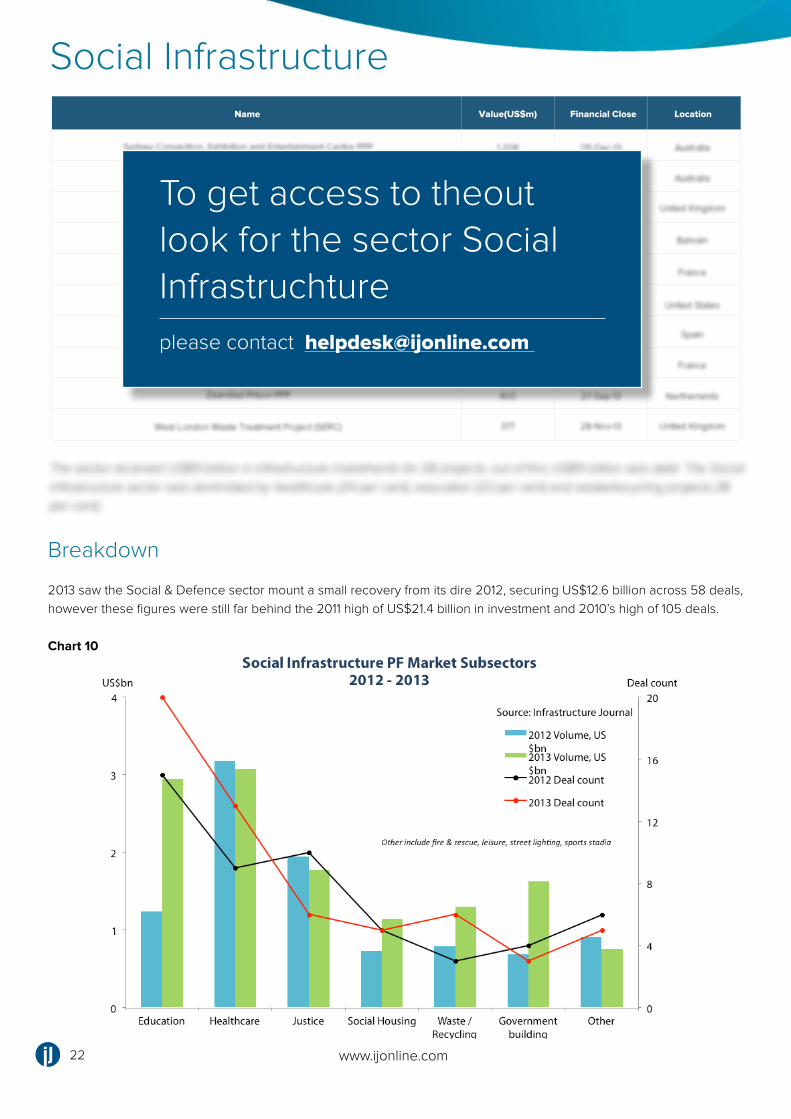
2013 saw the Social & Defence sector mount a small recovery from its dire 2012, securing US$12.6 billion across 58 deals, however these figures were still far behind the 2011 high of US$21.4 billion in investment and 2010’s high of 105 deals.
Chart 10
Name Financial Close LocationValue(US$m)
22 www.ijonline.com
Social Infrastructure
The sector received US$13 billion in infrastructure investments for 58 projects; out of this US$10 billion was debt. The Social infrastructure sector was dominated by healthcare (24 per cent), education (23 per cent) and waste/recycling projects (18 per cent).
To get access to theout look for the sector Social Infrastruchtureplease contact [email protected]
23www.ijonline.com
Drivers & Risks
Government spending reductions are still adversely affecting the global pipeline of social and defence projects, with
various national administrations reluctant to antagonise the electorate with high capital spending programmes, particularly
as the early signs of economic recovery are beginning to be felt in various parts of the globe.
That being said there have been notable moves in some areas by countries looking to strengthen existing infrastructure,
bringing additional capacity to ailing public facilities e.g. French prison PPPs.
Breakdown
In 2013 the Water sector secured US$6.6 billion in investment spread across eight deals, an increase of over US$2 billion on 2012 figures. Deal count was the highest in three years in the sector (beating 2012’s six and 2011’s 7), though was still below the 2012 high of 11.
Asia & Pacific led the way with US$5.178 billion in investment, of which US$5.114 billion was debt. This figure far outstripped the second most active region, Africa & Middle East, which secured just US$835 million in investment. Australia was the only country to close more than one water project in 2013, the Victorian and Sydney Desalination plants.The majority of the water projects closed in 2013 were desalination projects, and these expensive projects account for the majority of the total value of all water transactions closed last year e.g. the US$3.5 billion Victorian Desalination Plant refinancing, Australia. The remaining few projects were in the pipe network and water treatment subsectors.
Drivers & Risks
The traditional risks associated with the Water sector, namely high capital, low return and long payback periods, still remain but there are little signs the sector is developing. Driven by population growth, urbanization, historic underinvestment, quality regulation and climate change the sector is beginning to see interest in new projects in various regions across the globe.
The sector received US$6.6 billion in infrastructure investments for eight projects; out of this US$6.4 billion was debt.
Name Financial Close LocationValue(US$m)
24 www.ijonline.com
Water
To get access to the outlook for the Water sector
please contact [email protected]

www.ijonline.com
Global Infrastructure League Tables The IJ League Tables are available on www.ijonline.com
About IJ’s League Tables
Measuring market activity for legal, technical and finance professionals engaged in the investment and
development of infrastructure assets, IJ’s League Tables are published twice yearly and are widely
recognized as a key bellwether for the project finance market.
Enter your details here to gain access to the top 20 Mandated Lead Arrangers (MLAs), Bond Arrangers,
Financial Advisers, Legal Advisers, Technical Advisers and Sponsors in the infrastructure industry.
Alternatively, sign up for a free trial to the full subscription service and create custom league tables for your
specific sectors, regions, and even countries to identify the main players and landmark deals in your markets.
Already a subscriber? Login here to view the full report. This will include an overview of the League Tables
and will give you an outlook for all sectors and regions.
25www.ijonline.com
Register for access to the League Tables
Sign up for a free trial
You might also be interested in a free trial to Infrastructure JournalRegister for free access to IJ and realise the value of asset and transaction databases, our market leading news, league tables and much more.
Infrastructure Journal is an online information resource that tracks global market activity to deliver real-time news, insight and data to underpin your investment decisions.
Already an IJ subscriber? Login here access the full report.
Sign up for a free trial

All content © Copyright 2014 Euromoney Institutional Investor plc, all rights reserved.