Embed Size (px)
Citation preview

IInd Half Yearly Monitoring Report on
Mid-Day-Meal - Bihar State
1st October 2014 to 31st March 2015
(Part - I)
Districts Monitored
Sheohar
Saharsa
Khagria
Siwan
Munger
Prof. B.K. Bajpai
Giri Institute of Development Studies, Lucknow July 2015

2
3
PREFACE
The National Programme of Nutritional Support for Primary Education—
NPNSPE i.e. National Mid Day Meal Scheme—(MDMS) was initiated by India in the
year1995. The programme was launched with a view to enhancing enrollment, retention
and attendance and simultaneously improving Nutritional levels among children and to
have an important social values and foster equality as children learn to sit together and
share a common meal. One can expect some erosion of caste prejudices and class
inequality.
Mid-day Meal in Bihar is implemented with the joint efforts of the Government
of India and state government. The present Mid-day Meal Programme covers all the
primary and Middle Schools of the state. The Giri Institute of Development Studies,
Lucknow was commissioned by Ministry to conduct Monitoring and Evaluation of Sarva
Shiksha Abhiyan (SSA) including MDM in the selected districts of Bihar. We are
thankful to Secretary and Additional Secretary, Department of School Education and
Literacy and the Director, MDM, Shri Gaya Prasad for their cooperation and support for
undertaking the study.
The survey for the present study was conducted during February & March 2015. The
survey covered prescribed number of sample primary and middle schools of the districts
Sheohar, Saharsa, Khagaria, Siwan and Munger district of Bihar, as suggested by the
Ministry of Human Resource Development, Department of School Education and
Literacy, Government of India.
Besides Monitoring and Evaluation of SSA programme in the district, the
working of MDM was separately monitored and evaluated. The Institute has prepared the
present report in Sheohar, Saharsa, Khagaria, Siwan and Munger district of Bihar the
capacity of monitoring and evaluation agency for the evaluation of MDM programme in
districts of Bihar.
We express our deep sense of gratitude to Director MDM and State Project
Director of Bihar Education Project Council for extending all possible support for
present study. We are also thankful to OSD for making all possible cooperation for data
collection.
4
The credit of successful completion of task also goes to the Director of the
Institute Prof. Surindra Kumar who has created required research insight and atmosphere
in the Institute for the same. I express my gratitude to him.
I am also thankful to the members of research team for their hard work in
collecting and tabulating the data. My thanks are also due to Dr. R.K.Jaisawal, Mr. Ajay
Kumar Singh, Mohd. Kaleem, Mr. Ajay Kr Dubey, Mr Atul Srivastav, Mr Surya Nandan
Kr Singh, Mr. Chandresh Kr yadav, Mr. Virendra Pal, Mr. Sandeep Kr Singh, Mr . D.D.
Mishra and Mr.Ramchandra, for assisting in the drafting of the final report.
Finally yet importantly, my thanks are due to Mr. Krishan Kumar Verma and Ms
Geeta Bisht, for their support in giving final shape to this report and to Mr. R. S. Bisht
for maintaining official records.
Dr. B.K. Bajpai
Professor
July 2015 Nodal Officer,
Monitoring and Evaluation of MDM
Giri Institute of Development
Studies, Lucknow- 226024

5
CONTENTS TITLE Sheohar Saharsa Khagaria Siwan Munger
(Page No.) 1-38 39-70 71-98 99-130 131-159
Introduction 1 - - - -
Mid-Day Meal Programme
(MDM)
1 - - - -
Objectives of MDM Programme 2 - - - -
Monitoring and Evaluation of
MDM
2 - - - -
Methodology 3 - - - -
Criteria of Sample Selection 3 - - - -
Sample Design of the Study 3 39 71 99 131
Tools 4 40 72 100 132
Implementation of MDM
Programme
5 41 73 101 133
Regularity in supply of Food
Grains to Schools
5 41 73 101 133
Timely Release of Funds 6 42 73 102 134
Cost of Cooking Received 7 42 74 102 134
Information Regarding Cooks 8 43 74 103 135
Regularity in Serving Meal 9 44 76 104 136
Quality and Quantity of Menu 10 45 77 105 137
Variety of Menu 11 46 77 106 137
Display of Information under
Right to Education Act, 2009
12 46 78 106 138
Distribution of MDM 12 47 78 107 139
Discrimination in Cooking: 13 47 79 107 139
Health Cards and Health Check 13 48 80 108 140
Drinking Water and Sanitation 15 49 81 109 141
Ceasefire Available in School: 15 50 82 110 142
Kitchen Devices: 16 50 82 111 142
Infrastructure of Kitchen 17 51 83 112 143
Availability of Cover Drum 18 53 84 113 144
Availability of Toilets 19 53 85 114 144
IT Infrastructure (computer) in
school
19 54 85 114 145
Safety and Hygiene 20 54 86 115 145
Encouragement to Children to
adopt Good Practices
20 55 86 115 146
Serving Meal to students before
tasting
21 56 87 116 147
Community Participation and
Awareness
21 56 87 116 147
Awareness about MDM 22 57 88 117 148
VSS meetings 23 58 88 118 148
Inspection & Supervision 23 58 89 118 149
Inspection and Supervision of
MDM
24 59 89 119 149
Impact of MDM 25 60 91 120 150
Social Harmony 25 60 91 121 151
Grievance Redressal
Mechanism
25 61 91 121 151

6
Views of Investigator on other
Issues of MDM Implementation
26 61 92 121 151
Centralized Kitchen 27 - - - -
Introduction 27 - - - -
Organization 28 - - - -
No. of Schools and Students
Receiving MDM from NGO
28 - - - -
Location and Area of
Centralized Kitchen
28 - - - -
Surrounding and Accessibility
of Centralized Kitchen
28 - - - -
Infrastructural Facilities in
Centralized Kitchen
28 - - - -
Procurement and Storage of
Raw Food Items in Centralized
Kitchen
29 - - - -
Positioning of Container/Bags
of Raw Food Items
29 - - - -
Type of Quality Parameters
Verified in Raw Food Items
29 - - - -
Source, Availability and
Storage of water in Centralized
Kitchen
29 - - - -
Preparation of MDM in
Centralized Kitchens
29 - - - -
Quality of Spices and Salt Used
for Preparation of MDM
30 - - - -
ORGANIZATION OF THE
CENTRALIZED KITCHEN
30 - - - -
Management of Uneaten Food
Left by Students in Schools
30 - - - -
Methods of Washing of Utensils
in Centralized Kitchen
30 - - - -
Staff Details of Centralized
Kitchen
30 - - - -
Personal Hygiene of Staff in
Centralized Kitchen
30 - - - -
Methods of Kitchen-Waste
Disposal
30 - - - -
Modes for Transporting MDM
to Schools
31 - - - -
Precautions Taken during
Transporting MDM
31 - - - -
Estimation of MDM on
Different Parameters
31 - - - -
Major Findings 32-35 63-65 93-95 123-126 153-155
Annexure 36-38 66-70 96-98 127-130 156-159

1
District-1: Sheohar

2

1
Chapter I
Introduction
Mid-Day Meal Programme (MDMP)
Mid-day Meal is implemented as a joint effort of the Government of India and
the State Government of Bihar. The Government of India implemented this scheme from
15 August, 1995. Under the scheme, students from government- and state-aided primary
schools, from classes 1-5, who have minimum 80 percent attendance, were provided 3 kg
of wheat or rice per month. However, it was observed that the benefits of the scheme did
not completely go to the students and the grains were distributed among their family
members.
Therefore, to make the scheme student-focused, the Supreme Court, in 2004,
directed to implement the Mid-day Meal Programme in the form of ‘cooked meal’ in
primary schools. Subsequently, keeping in view the success of the programme, mid-day
meal scheme is also being implemented in the middle schools in the educationally
backward blocks since October, 2007. The programme has since been further extended to
cover all blocks primary and middle schools in urban areas too.
The present Mid-day Meal Programme covers all the primary and middle schools
of the State. The State Government has constituted a Mid-day Meal Authority since
October, 2006 for the effective implementation of the programme. Under the scheme,
boys and girls are provided tasty, cooked food during the daily school interval. The
provision is to provide food made of rice during six days in a week. The Government of
India provides hundred grams (100 gms) per student per day (Rice) for primary classes
and one hundred fifty grams (150 gms) per student per day in middle schools classes.
The provision is for the conversation cost from food grains to cooked food. The
government provides Rs. 3.37 per student per day for Primary Schools and Rs. 5.0 per
student per day in middle schools in the form of conversation cost and for the
arrangement of other materials. The Food Corporation of India ensures the availability of
food grains. The VSS gets the food prepared in the kitchen shed on the school premises.
Certain Voluntary Agencies have also been involved in the preparation of food in urban
area. The government has set the menu and provision has been made for a separate

2
kitchen on the school premises. Strict monitoring and inspection mechanisms have been
involved for the desired and effective implementation of the scheme.
Objectives of MDM Programme
Major objectives of the Mid Day Meal Scheme are:
To make available nutritious food to children enrolled in Classes 1-8 in schools
(Govt. Local Body, Govt. Aided schools, Govt. Aided Maqtab & Madarsa, AIE
centers and NCLP schools).
To develop the grasping power of children by improving their nutrition level.
To enhance the enrollment of children in schools.
To develop a tendency in the children to stay in school, especially during school-
interval, and to reduce the drop-out rate.
To foster the feeling of brotherhood and to develop positive outlook through co-
eating and combined food preparation for the children belonging to different
religions and castes and socio-economic backgrounds.
Monitoring and Evaluation of MDM
The followings are the major aspects of monitoring and evaluation of Mid-day
Meal Programme (MDM) in Sheohar district:
Regularity in MDM Supply
Use of MDM
Supply of food grains
Regular payment of food grain cost
Social equity in MDM
MDM supply as per menu
Satisfaction of students with quantity and quality of MDM
Status on personal hygiene of cooks
MDM infrastructure
Safety and hygiene
Community participation
Inspection and supervision
Impact of MDM

3
Methodology
A total number of 18 primary schools and 15 middle schools were selected for
the study in the Sheohar district as per norms provided by the ministry.
Criteria of Sample Selection
The following criteria were followed in the selection of sample primary and
middle schools in Sheohar district:
1. Higher gender gap in enrolment,
2. Higher proportion of SC/ST students,
3. Low retention rate and higher drop-out rate,
4. Schools with a minimum of three CWSN.
5. The habitation where the school is located has a sizeable number of OoSC.
6. The habitation where the school is located has in-bound and out-bound seasonal
migration.
7. The habitation where the school is located is known to have a sizable number of
urban deprived children.
8. The school is located in a forest or far-flung area.
9. The habitation where the school is located witnesses recurrent floods or some
other natural calamity.
10. Pupil-Teacher Ratio (PTR) at school level
Sample Design of the Study
A total of 33 schools have been taken as sample from Sheohar district as shown in Table
1.1. Out of these 33 schools, 18 are primary and 15 are middle schools.
Table 1.1: Number of Sample Schools
Sl. No. Name of Blocks Primary Schools Middle Schools Total
1 Sheohar (Urban) 5 3 8
2 Sheohar (Rural) 5 4 9
3 Tariyani 3 5 8
4 Piprahi 5 3 8
Total 18 15 33
Table-1.2 reflects all 33 sample schools selected from Sheohar district. Keeping
in view, that each types of school as per the selection criteria, to be represented list of
sample schools.

4
Table 1.2: School-wise list of Sample Schools
Sl.
No.
Name of the schools U-DIES Code Category of
schools PS/ MS
Criteria for Selection
1 Sheohar (West) 10030202103 PS Flood Area, P.T.R. and S.C.
2 Sheohar (Ward-2) 10030202107 PS Flood Area, Slum Area
3 Rasidpur (Ward-7) 10030202303 PS Gender Gap and Civil Work
4 Shanaza 10030202201 PS Flood Area and Civil Work
5 Islampur (Ward-15) 10030202110 PS CWSN, P.T.R., Gender Gap
6 Mathurapur 10030204101 PS CWSN and Civil Work
7 Sonvarsa 10030203031 PS CWSN
8 Piprahi Kala 10030101901 PS Flood Area
9 Gauspur Marhalla 10030301301 PS Civil Work
10 Govt. Parsauni 10030101703 PS P.T.R. and S.C.
11 Urdu Mesaura 10030102604 PS Civil Work
12 Kushahar Kasba Tola 10030201602 PS CWSN
13 Buniyadiganj 10030101401 PS SC and CWSN
14 Garhwa 10030202601 PS Gender Gap
15 Belwa 10030103201 PS P.T.R. and Civil Work
16 Khajepur 10030103802 PS Flood Area P.T.R.
17 Araji Chhatauni Tola 10030301404 PS Flood Area and Gender Gap
18 Harnahiya 10030201201 PS CWSN and Flood Area
19 Rasidpur (Mushar Tola) 10030202301 MS P.T.R.
20 Babhan Toli 10030202105 MS P.T.R., Gender Gap, Civil
Work
21 Kanya Sheohar (Ward-13) 10030202104 MS Computer, Gender Gap,
CWSN
22 Aura 10030300901 MS Computer, CWSN, Civil
Work
23 Chamanpur 10030202501 MS Civil Work
24 Fathapur 10030200902 MS Civil Work
25 Mushari 10030304701 MS CWSN and Civil Work
26 Piprahi 10030101902 MS Gender Gap
27 Sundarpur 10030204501 MS Civil Work and CWSN
28 Chhatauni 10030301402 MS Gender Gap and CWSN
29 Pojhiyan 10030300404 MS Flood Area
30 Kushahar 10030201601 MS Gender Gap, CWSN, Civil
Work
31 Dhankaul 10030101402 MS CWSN and Gender Gap
32 Amba Kala 10030101202 MS Gender Gap and Computer
33 Belhiya 10030304501 MS Flood Area and Civil Work Source: Office of the District Education Officer, Sheohar
Tools
A well-structured questionnaire was prepared to collect primary data from the
selected primary and middle schools. Separate schedule have been also used for the
NGO, which provided MDM to the schools.

5
Chapter II
Implementation of MDM Programme
Regularity in Supply of Food Grains
The regularity in delivering food grains to sample primary and middle schools
has been examined. Out of the 18 primary schools, it was found that food was cooked on
the schools premises by VSS in only 12 schools. In the remaining 6 primary schools,
food was provide by an NGO namely Bal Vikash Sewa Sansthan. A similar situation
existed in 3 out of 15 middle schools also where the food was provided by the same
NGO. Hence, of the total sample of 33 schools, in 24 schools MDM cooked by VSS in
schools premises while remaining to the 9 schools (in 8 Seohar- urban and one school of
piparahi- rural blocks) food was provided to the students by the same NGO.
Table 2.1 shows that about 72 percent primary and 67 percent middle schools
from the sample were receiving food grains within one month. It was also found that the
food grains were delivered to the lifting agency within proper time in about 72 percent
primary and 67 percent middle schools. If the lifting agency did not deliver the food
grains to the school on time, no alternate arrangement was present, in any of the schools,
for its transportation. It has also been observed that the quality of food supplied was as
per FAQ mark in all sample primary and middle schools (Table: 2.1). In all sample
schools, food grains were released after adjusting the unspent balance grains of the
previous month.
Annexure 2.1 The names of schools where Food grains facility not available in
advance for One month.

6
Table 2.1: Regularity in supply of Food Grains
Sl.No. Particulars
No. of PS No. of MS
VSS/
Schools NGO Total
VSS/
School
s
NGO Total
1
If Food grains facility
available in advance
for One month
7
(58.33)
6
(100.0)
13
(72.22)
7
(58.33)
3
(100.0)
10
(66.67)
2
Food grains delivered
to lifting agency
within proper time
7
(58.33)
6
(100.0)
13
(72.22)
7
(58.33)
3
(100.0)
10
(66.67)
3
If lifting agency is not
delivering the food
grains to the school
how is the food grains
transported up to the
schools
No any arrangement No any arrangement
4
Whether the food
grains is of FAQ
Mark - grade A
12
(100.0)
6
(100.0)
18
(100.0)
12
(100.0)
3
(100.0)
15
(100.0)
5
Whether food grains
are released to school
after adjusting the
unspent balance of
the previous month
12
(100.0)
6
(100.0)
18
(100.0)
12
(100.0)
3
(100.0)
15
(100.0)
Total No. of Schools 12
(100.0)
6
(100.0)
18
(100.0)
12
(100.0)
3
(100.0 )
15
(100.0)
Source: Primary Data Based.
Timely Release of Funds
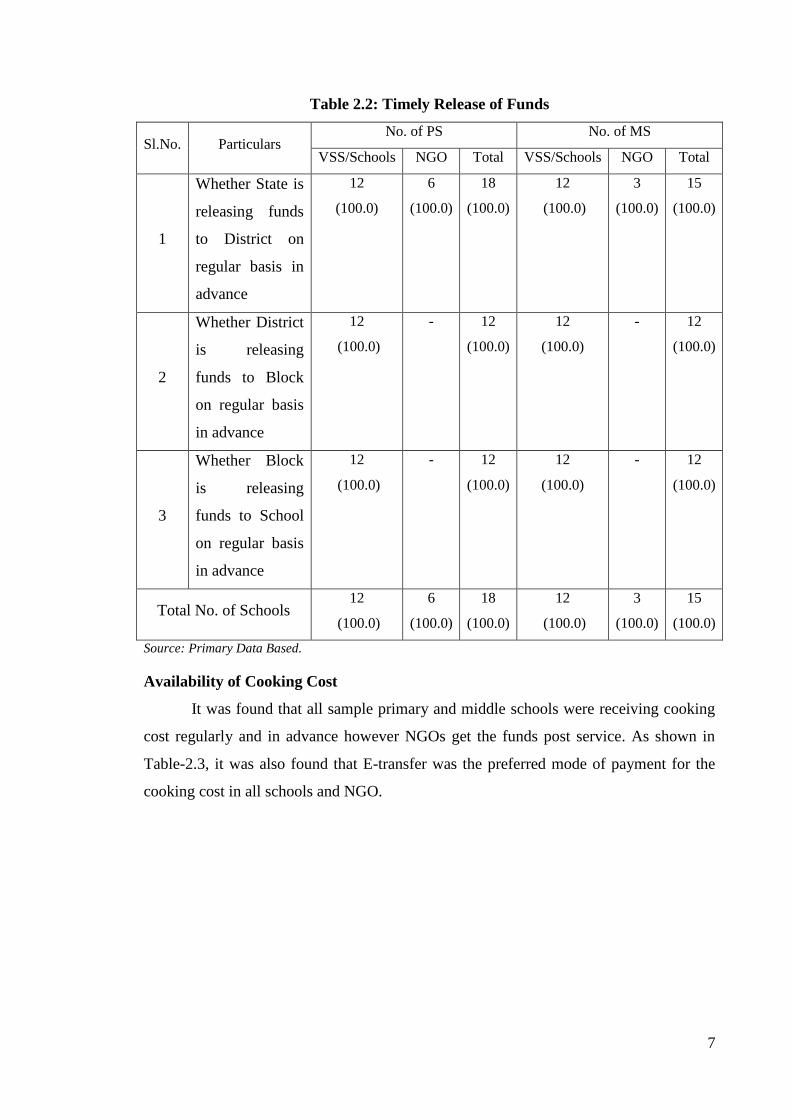
It was found that a timely release of funds was done regularly by state, district
and block-level in all samples primary and middle schools of the district, as shown in
Table-2.2.
7
Table 2.2: Timely Release of Funds
Sl.No. Particulars No. of PS No. of MS
VSS/Schools NGO Total VSS/Schools NGO Total
1
Whether State is
releasing funds
to District on
regular basis in
advance
12
(100.0)
6
(100.0)
18
(100.0)
12
(100.0)
3
(100.0)
15
(100.0)
2
Whether District
is releasing
funds to Block
on regular basis
in advance
12
(100.0)
- 12
(100.0)
12
(100.0)
- 12
(100.0)
3
Whether Block
is releasing
funds to School
on regular basis
in advance
12
(100.0)
- 12
(100.0)
12
(100.0)
- 12
(100.0)
Total No. of Schools 12
(100.0)
6
(100.0)
18
(100.0)
12
(100.0)
3
(100.0)
15
(100.0)
Source: Primary Data Based.
Availability of Cooking Cost
It was found that all sample primary and middle schools were receiving cooking
cost regularly and in advance however NGOs get the funds post service. As shown in
Table-2.3, it was also found that E-transfer was the preferred mode of payment for the
cooking cost in all schools and NGO.

8
Table 2.3: Availability of Cooking Cost
Sl.No. Particulars No. of PS No. of MS
VSS
/Schools NGO Total VSS/Schools NGO Total
1
No. of schools in
which cooking cost
was received
regularly and in
advance
12
(100.0)
- 12
(100.0)
12
(100.0)
- 12
(100.0)
2
How
much
delay in
receiving
the
cooking
cost in
advance
Days - - - - - -
one
Months
- 6
(100.0)
6
(100.0) -
3
(100.0)
3
(100.0)
4
In case of delay,
how does the
school/
implementing
agency manages to
ensure that there is
no disruption in the
feeding programme
-
NGO
Self
Manage
-
NGO
Self
Manage
5
Mode of
payment
of
cooking
cost
Cheque - - - - - -
E-
transfer
12
(100.0)
6
(100.0)
18
(100.0)
12
(100.0)
3
(100.0)
15
(100.0)
Total No. of Schools 12
(100.0)
6
(100.0)
18
(100.0)
12
(100.0)
3
(100.0)
15
(100.0) Source: Primary Data Based.
Information Regarding Cooks Cum-Helpers
It was found that in all sample primary and middle schools, MDM was being
served by the appointed cook-cum-helpers, 48 in primary and 62 in middle schools. In all
the sample primary and middle schools the number cooks were sufficient as per GOI
norms. The cooks were mostly females and their salary was Rs. 1000/ per month. The
salary of the cooks was paid through the cheques. Out of total appointed cooks, the share
of general category cooks appointed only 1.61 percent in middle and 18.75 percent in
primary schools. The OBC cooks were found about 58 percent in primary and 71 percent
in middle schools. The Minority cooks were appointed in only primary schools (14.59

9
percent). The proportion of SC cooks was observed in 8.33 percent of primary and 27.42
percent in middle schools as evident from Table-2.4.
A training module for the cook-cum-helpers is available in all sample primary
and middle schools. This module is provided to all the cooks. The MDM Coordinator in
all sample primary and middle schools imparts training to the working cook-cum-
helpers. Medical check-up of the cooks was done in 50 percent primary and 45.16
percent middle schools.
Table 2.4: Availability of Cook-cum-helpers
Sl.No. Particulars No. of Schools
PS MS
1 Mode of appointment of cook-cum-
helper in schools
By VSS/SMC 18 (100.0) 15 (100.0)
2 No. of schools cooks were sufficient as per GOI norms 18 (100.0) 15 (100.0)
3 No. of Cooks in schools
Male 8 (16.67) 8 (12.90)
Female 40 (83.33) 54 (87.10)
Total 48 (100.0) 62 (100.0)
4 Monthly salary of cook-cum-helpers Rs. 1000/- 48 (100.0) 62 (100.0)
5 Mode of Payment By Cheque 48 (100.0) 62 (100.0)
6 Payment is regular Yes 48 (100.0) 62 (100.0)
7
No. of cooks per social category
1. SC 4 (8.33) 17 (27.42)
2 .OBC 28 (58.33) 44 (70.97)
3 .Minority 7 (14.59) 0 (0.0)
4. General 9 (18.75) 1 (1.61)
8. Availability of Training Modules Yes 48 (100.0) 62 (100.0)
9. If Yes, provided modules Yes 48 (100.0) 62 (100.0)
10. Training of Cooks Yes 48 (100.0) 62 (100.0)
11.
If Yes, what was the training venue BRC 48 (100.0) 62 (100.0)
12. Who is the Trainer MDM
Coordinators
48 (100.0) 62 (100.0)
13. Meal prepared and transported by the Centralized kitchen/
NGO, whether cook-cum-helpers have been engaged to
serve the meal to the children at school level.
6 (100.0) 3 (100.0)
14. Is there any medical checkup of the cooks Yes 24 (50.0) 28 (45.16)
No 24 (50.0) 34 (54.84)
Source: Primary Data Based.
Regularity in Serving Meal
It was found that in all sample primary and middle schools, hot, cooked meal was
provided to the students on a daily basis. Regularity in supplying of hot cooked meal to
the students of these schools has been observed by enquiring from the students, teachers,

10
parents as well as MDM registers was also verified. It is reflected from the Table 2.5 that
during the last three months (Nov., Dec. 14 and January 2015) how much day’s food not
served to the students.
The list of sample primary and middle schools where MDM was not served during last
three months is given in Annexure 2.5.
Table 2.5: Regularity in Serving Meal
Sl.No. Particulars
No. of Schools
PS MS
Yes No Yes No
1. Everyday served Hot Cooked Meal 18 (100.0) 0 15 (100.0) 0
2.
Last three
months how
much days food
not served
Nov.
1-8 1 (33.33) 4 (100.00)
8-15 2 (66.67) -
Total 3 (16.67) 4 (26.67)
Dec.
1-8 4 (80.00) 3 (100)
8-15 1 (20.00) -
Total 5 (27.78) 3 (20.0)
Jan.
1-8 - 1 (100)
8-15 1 (100) -
Total 1 (5.56) 1 (6.67)
3.
Item (ii) Reason for not served food (Multiple response)
Nov. Food grains not available 3 (100.0) 3 (75.0)
Nov. MDM not supplied by NGO - 1 (25.0)
Dec. Food grains not available 3 (60.0) 1 (33.33)
Dec. MDM not supplied by NGO 2 (40.0) -
Dec. Fuel not available - 3 (100.00)
Jan. Food grains not available 1 (100.0) 1 (100.0)
Total No. of Schools 18 (100.0) 15 (100.0)
Source: Primary Data Based.
Quality and Quantity of Menu
The quality and quantity of MDM was examined and it was found that in 66.67
percent primary and 73.33 percent middle schools the quality of meal was good while in
the remaining primary and middle schools it was found to be normal. The quantity of the
meal supplied was sufficient in all sample primary and middle schools. It was found that
all selected primary and middle schools were providing the prescribed quantity of mid
day meal to students (Table 2.6).

11
Table 2.6: Quality and Quantity of Meal
Sl.No. Particulars No. of Schools
PS MS
1. Quality of meal Good 12 (66.67) 11 (73.33)
Normal 6 (33.33) 4 (26.67)
2. Quantity of meal Sufficient 18 (100.0) 15 (100.0)
3. Quantity of pulses used in the meal
(20 gram/student PS and 30gram/student MS)
18 (100.0) 15 (100.0)
4. Quantity of green leafy vegetable in the meal
(50 gram/student PS and 75 gram/student MS)
18 (100.0) 15 (100.0)
5. Iron / Iodine mixed salt used in Meal Yes 18 (100.0) 15 (100.0)
6. Children were satisfied with the
Served meal
Yes 18 (100.0) 15 (100.0)
7. Method for measuring the food grains and ( Kg) 18 (100.0) 15 (100.0)
8. Method for measuring the served meal (As per
Requirement)
18 (100.0) 15 (100.0)
9. Children were not satisfied the meal give Reasons - -
Total No. of Schools 18 (100.0) 15 (100.0)
Source: Primary Data Based.
Variety of Menu
District authorities decide the weekly menu in all sample primary and middle
schools. 83.33 percent primary and all middle schools display weekly menu at a
noticeable place. All sample primary and middle schools follow weekly menu and use
locally available ingredients. The students of all the sample schools get sufficient
calories from MDM as is evident from Table 2.7.
Table 2.7: Variety of the Menu of MDM
Sl.No. Particulars No. of Schools
PS MS
1. Who decides the weekly menu District
Officials
18 (100.0) 15 (100.0)
2. Weekly menu was displayed at school
noticeable place `
Yes 15 (83.33) 15 (100.0)
No 3 (16.67) -
3. If Yes, All people can see the menu Yes 15 (100.0) 15 (100.0)
4. Weakly menu followed Yes 18 (100.0) 15 (100.0)
5. Menu includes locally available in
ingredients Yes 18 (100.0) 15 (100.0)
6. Sufficient calories from MDM Yes 18 (100.0) 15 (100.0) Source: Primary Data Based.

12
Display of Information under Right to Education Act, 2009
It has been found that all the sample primary and middle schools which cooked
MDM on their premises received rice for the preparation of MDM. Daily menu has been
shown at the right place in the school. In the last month 26806 students of sampled
primary and 21941 students of middle schools have taken MDM. Display of MDM Logo
was not found in any sample primary and middle schools (Table-2.8).
The name of sample primary and middle schools where MDM Logo was not displayed is
given in Annexure 2.8
Table 2.8: Display of information at the School level at prominent place
Source: Primary Data Based.
Distribution of MDM
The number of students of primary and middle schools availing MDM was
counted on the day of visit. Their number was also verified from the MDM register.
Table-2.9 indicates that 4117 students were enrolled in all 18 sample primary and 5445
students were enrolled in 15 sampled middle schools of Sheohar district. On the day of
visit 61.02 percent students of primary and 61.30 percent students of middle schools
were present in the school. It is also found that all students were availing MDM as per
MDM register on the day of visits in middle schools. But in primary level only 90
percent students were availing MDM as per MDM register on the day of visits
comparison with number of students attending the school on the day of visit.
S. No. Particulars No. of Schools
PS MS
1 Food Grain received Wheat - -
Rice 12 (100.0) 12 (100.0)
2 Other material purchase & use 12 (100.0) 12 (100.0)
3 Last month how many student take MDM 26806 21941
4 Daily Menu followed (including NGO Supply) 18 (100.0) 15 (100.0)
5 Display MDM Logo on school Building - -

13
Table 2.9: Children Availing MDM on the Day of Visit and as per School Registers
Source: Primary Data Based.
Discrimination in Cooking
Queue was observed for serving and seating arrangement for eating of food in all
sample primary and middle schools of Sheohar district. It has been observed that in none
of the sample primary and middle schools gender, caste or community discrimination in
cooking and serving or seating arrangement was observed as shown in Table-2.10.
Table 2.10: Discrimination in Cooking, Serving and Seating Arrangement of
Students
Sl.
No Particulars
No. of Schools
PS MS
Seating
arrangement
in Queue
Scattered
Seating
arrangement
in Queue
Scattered
1 System of serving and seating
arrangement for eating 18 (100.0) - 15 (100.0) -
2
Observe any gender or caste
or community discrimination
in cooking or serving or
seating arrangement
PS MS
Yes No Yes No
- 18 (100.0) - 15
(100.0)
Total No. of schools 18 (100.0) 15 (100.0) Source: Primary Data Based.
Health Cards and Health Check
Issues regarding the child health care and related aspects were also examined in
the district. It was found that health cards were maintained in 77.78 percent primary and
66.67 percent middle schools. The frequency of health check-up was once a year in
71.43 percent primary and 80 percent middle schools; the rate was twice a year in the
remaining 28.57 percent primary and 20 percent middle schools. As the Table 2.11
shows, all students of sample primary and middle schools were given micronutrients
medicine periodically. In primary schools, 38.89 percent by ANMs and 61.11 percent by
S.
No. Particulars
No. of Schools
PS MS
1 No. of children enrolled in schools 4117
(100.0)
5445
(100.0)
2 No. of children attending the school on the day of
visit
2512
(61.02)
3338
(61.30)
3 No. of children availing MDM as per MDM register 2263
(90.09)
3338
(100.0)
4 No. of children actually availing MDM on the day
of visit
2263
(100.0)
3338
(100.0)

14
teacher, In case of middle schools, 26.67 percent by ANMs and 73.33 percent by teacher.
In 55.56 percent primary and 53.33 percent middle schools the medicine was
administered once. In the remaining 44.44 percent primary and 46.67 percent middle
schools it was administered twice. 14 primary and 10 middle schools maintain height and
weight records of their children and indicate it in the school health card, where health
card were found. 33.33 percent primary and 46.67 percent middle schools maintain first
aid medical kit in the school. Out of 18 PS and 15 MS, 14 primary and 10 middle schools
done dental and eye checkup of their children and indicate it in the school health card,
where health card were found.
The names of the sample primary and middle schools where health cards, height
and weight records, dental and eye check-up was not done and first-aid kit etc. was not
available are given in Annexure 2.11.
Table 2.11: Health Cards, Health Check-up
Sl.No Particulars
PS MS
Yes No Yes No
14 (77.78) 4 (22.22) 10 (66.67) 5 (33.33)
2 Frequency of
health check-up
One time 10 (71.43) 8 (80.00)
Two time 4 (28.57) 2 (20.00)
3
Whether
children are
given
micronutrients
medicine
periodically
Iron, Folic acid,
Vitamin A dosage,
De-worming
18
(100.0) -
15
(100.0) -
4
If yes, Name of
the department
who
administered
these medicines
By
whom
1. ANM 7 (38.89) 4 (26.67)
2. Teacher 11 (61.11) 11 (73.33)
How
many
time
1 time 10 (55.56) 8 (53.33)
2 time 8 (44.44) 7 (46.67)
5
Whether height and weight record of
the children is being indicated in the
school health card.
14(100.0) - 10(100.0) -
6 Whether any referral during the period
of monitoring. - 14 (100.0) - 10(100.0)
7. Instances of medical emergency during
the period of monitoring. - - - -
8. Availability of the first aid medical kit
in the school. 6 (33.33) 12(66.67) 7(46.67) 8(53.33)
9. Dental and eye check-up included in
the screening. 14(100.0) - 10(100.0) -
10. If yes, distribution of spectacles to
children suffering from refractive error. - 14 (100.0) - 10(100.0)
Total No. of school 18 (100.0) 15 (100.0)
Source: Primary Data Based.

15
Drinking Water and Sanitation
Table 2.12 shows that 94.44 percent primary and all sample middle schools have
potable water in convergence with drinking water and sanitation in Sheohar district.
Multiple responses were received while surveying the source of potable water. In 33.33
percent primary schools water was an available through tap water and in 38.89 percent
primary schools water was available through local Hand Pumps. In case of middle
schools, in 27.78 percent water was available through tap water, 44.44 percent water was
available through local hand pumps and the rest through India Mark-II Hand pump and
jet pump. Among all the funding agencies maximum water supply was done by PHED
scheme in both categories of schools.
Table 2.12: Drinking Water and Sanitation
Sl.No. Particulars
No. of Schools
PS MS
Yes No Yes No
1
Whether potable water is available for
drinking purpose in convergence with
Drinking Water and Sanitation
17
(94.44)
1
(5.56)
15
(100.0) 0
2
Available of potable
water
(Multiple Response)
Tap water 6 (33.33) 5 (27.78)
Local Hand
pump 7(38.89) 8 (44.44)
India Mark-II
Hand pump 5 (27.78) 4 (22.22)
Jet Pump 0 1 (5.55)
3. Which scheme
(Multiple Response)
SSA Scheme 6 (35.29) 8 (44.44)
PHED 11 (64.71) 10 (55.56)
Total No. of School 18 (100.0) 15 (100.0)
Source: Primary Data Based.
Availability of Ceasefire in School
According to information it was found that 44.44 percent sample primary and 93.33
percent middle schools have ceasefire as shown in Table 2.13. Annexure 2.13 has the
name of schools where ceasefire was not available.

16
Table 2.13: Availability of Ceasefire in School
Sl.No. Particulars
No. of Schools
PS MS
Yes No Yes No
1 Ceasefire Available 8 (44.44) 10 (55.56) 14 (93.33) 1 (6.67)
2. If yes, Name of Ceasefire Excel, Falcon,fire shild
Source: Primary Data Based.
Kitchen Devices
Table 2.14 shows the availability of kitchen utensils in schools. The data shows
that the cooking utensils in all sample primary and middle schools and the centralized
kitchen in the NGO had available. All the cooking and serving utensils kitchen devices in
the primary and middle schools were funded through kitchen devices funds while in case
of NGO, has purchased by own sources. Only 16.67 percent primary and 93.33 percent
middle schools had available eating plates for students through the MME funds.
The list of schools where utensils/kitchen devices were not sufficient is given in
Annexure 2.14.
Table 2.14: Kitchen Devices
Sl.
No
.
Particulars
No. of Schools
PS MS
Self NGO Total Self NGO Total
1 Cooking utensils are available
in the school
12
(100)
6
(100)
18
(100)
12
(100)
3
(100)
15
(100)
2.
Cooking
utensils are
available
Sufficient 12
(100)
6
(100)
18
(100)
12
(100)
3
(100)
15
(100)
3
Source of
funding for
cooking and
serving utensils
kitchen devices
Kitchen
devices
Fund
12
(100) -
12
(100)
12
(100) -
12
(100)
MME - - - - - -
Other NGO
Self -
6
(100)
6
(100) -
3
(100)
3
(100)
4 Eating plates etc. are available
in the schools 3 (16.67) 14 (93.33)
5 If yes, utensils kitchen devices
sufficient 0 (0.0) 7 (50.0)
6
Source of
cooking and
serving utensils
kitchen devices
MME 3 (100.0) 14 (100.0)
Community
contribution 0 (0.0) 0 (0.0)
Total No. of School 18 (100.0) 15 (100.0) Source: Primary Data Based.

17
Infrastructure of Kitchen
Informatio n related to infrastructure of kitchen in sample primary and middle
schools in Sheohar district was analyzed. It was found that 66.67 percent in sampled
primary and 60 percent middle schools were having kitchen. The pucca kitchen cum
store was available in 66.67 percent primary and 77.77 percent in middle schools while
only kitchen was available in 33.33 percent primary and 22.22 percent middle schools.
The pucca kitchen-cum-store was constructed and being used in all primary and 85.71
percent middle schools while only kitchens were constructed and being used in 50
percent primary and 100 percent middle schools.
Kitchen-cum-store was constructed through MDM in 37.50 percent primary
schools and 28.57 percent in middle schools while 62.50 percent kitchen-cum-stores in
primary and 71.43 percent in middle schools were constructed through SSA. Similarly,
only kitchen were constructed through MDM in 25 percent primary schools while
through SSA in 75 percent primary and 100 percent middle schools. Kitchen has been
constructed but not in use in 2 primary and 1 middle schools as MDM is provided by the
NGO.
Two primary schools and four middle schools prepared MDM in additional room.
Schools store their food grains and other ingredients in kitchen-cum-store while the
remaining 20.0 percent primary and 25.0 percent middle schools respectively store them
in an additional room. All sample primary and middle schools have kitchen and store
away from classrooms. In all primary and middle schools food is prepared by firewood.
The list of schools where the kitchen is not available and where kitchen is constructed
but not in use because they have a NGO Supply is given in Annexure 2.15.

18
Table 2.15: Infrastructure of Kitchen
Sl.No. Particulars No. of Schools
PS MS
1 Kitchens are available 12(66.67) 9(60.0)
2
No. of schools in which
pucca kitchen-cum store
available?
Kitchen-cum –store 8(66.67) 7(77.77)
Kitchen 4(33.33) 2(22.22)
(a)
No. of school in which
pucca kitchen constructed
and used?
Kitchen-cum –store 8(100.0) 6(85.71)
Kitchen 2(50.0) 2(100.0)
(b)
Under which scheme
Kitchen- cum-store
constructed?
MDM Kitchen cum
store
3(37.50) 2(28.57)
Kitchen 1(25.00) 0
SSA Kitchen cum
store
5(62.50) 5(71.43)
Kitchen 3(75.0) 2(100.0)
(c) Constructed but not in use (Due to food provided by
NGO)
2(50.0) 1(100.0)
(d) Not Sanctioned 6(33.33) 6(40.0)
3
In case the pucca kitchen-
cum store is not available,
where is the food being
cooked?
Additional Rooms 2 (25.00) 4(66.67)
Open field - -
NGO Supply 6 (75.00) 2(33.33)
4
Where the food grains/
other ingredients are
being stored?
Kitchen cum store 8(80.00) 6( 75.0)
Kitchen 0 -
Additional Room 2(20.00) 2 (25.0)
5 Kitchen-cum-store is neat
and cleaned
Kitchen cum store 8(100.00) 6 (100.0)
Kitchen 2(100.00) 2 (100.0)
6 Kitchen & store away from class room of school 12(100.0) 12(100.0)
7
MDM is being cooked by
using firewood or LPG
based cooking?
Fire wood 12(100.0) 12(100.0)
LPG - -
8 On any day there was interruption due to non-
availability of firewood or LPG?
- 3 (25.0)
Total No. of Schools MDM Supplied by School 12(66.67) 12 (80.00)
MDM Supplied by NGO 6 (33.33) 3 (20.00)
Total 18 (100.0) 15 (100.0) Source: Primary Data Based.
Availability of Covered Drums
As Table 2.16 indicates only 72.22 percent primary and all middle schools have
covered drums for storage the food grains. The rest of the primary schools did not have
covered drums as the food was provided by the NGO hence there was no need to store
the food grains. Covered drums in all primary and middle schools were made available
through MME (Management, Monitoring & Evaluation) scheme.

19
List of schools where covered drums for storage the food grains are not available
is given in Annexure 2.16.
Table 2.16: Availability of Covered Drum
Sl.No. Particulars No. of Schools
PS MS
1 Availability of cover drum of food grains
in schools
13(72.22) 15(100.0)
2. If yes, which
scheme
SSA through - -
MME 13(100.0) 15(100.0)
Total No. of Schools 18 15 Source: Primary Data Based.
Availability of Toilets
It was found that in 66.67 percent primary and 93.33 percent middle schools have
separate toilet for boys and girls. Out of these, 83.33 percent primary and 92.86 percent
middle schools use toilets properly. 5.56 percent primary and 46.67 percent middle
schools have common toilets and all of them are used properly.
Annexure 2.17 contains the list of sample schools which do not have separate toilet for
boys and girls or common toilets are not available.
Table 2.17: Availability of Toilets
Sl.
No.
Particulars No. of Schools
PS MS
Yes No Yes No
1 Availability of separate toilets for
boys and girls in schools
12(66.67) 6(33.33) 14(93.33) 1(6.67)
2 If yes, Proper use of toilet 10(83.33) 2(16.67) 13(92.86) 1(7.14)
3 Is there available common toilets 1(5.56) 17(94.44) 7(46.67) 8(53.33)
4 If yes, Proper use of toilets 1(100.0) 0 7(100.0) 0
Total No. of Schools 18(100.0) 15(100.0) Source: Primary Data Based.
IT Infrastructure (Computers) in Schools
As Table 2.18 indicates only 20 percent middle schools have computers. None of
the primary schools possess any IT infrastructure. None of them have an internet
connection and thus cannot use any IT enabled services.

20
Table 2.18: IT infrastructure available (Computer) School level
Sl.
No. Particulars
No. of Schools
PS MS
Yes No Yes No
1. Is Computer available in Schools - 18(100.0) 3(20.0) 12(80.0)
2. If yes give the no. of Computers - 8
3. Available of internet connection - - - 3(100.0)
4. Using any IT/ IT enable services based
(like E-learning etc.)
- - - 3(100.0)
Source: Primary Data Based.
Safety and Hygiene
Environment, safety and hygiene were found satisfactory in majority of the
primary and middle schools. As Table 2.19 shows that environment was good in 16.67
percent of primary and 33.33 percent middle schools. Safety was good in 11.11 percent
primary and 33.33 percent middle schools. The hygiene was observed to be in good
condition in 16.67 percent primary and 33.33 percent middle schools. Only in primary
level 5.55 percent environment, 11.11 percent in safety and hygiene were found to be
unsatisfactory.
Table 2.19: General Impression of Environment, Safety and Hygiene
Source: Primary Data Based.
Encouragement of Students to Adopt Good Practices
As shown in Table-2.20, in all sample primary and middle schools, students were
encouraged to wash their hands before and after meals. Children were encouraged to
receive MDM in orderly manner in all schools. It is also found that in all schools
students were educated about conservation of water. Cooking process and storage of fuel
was found to be safe from fire hazard in all sample primary and middle schools.
Sl.
No
Particulars
No. of Schools
PS MS
Good Satisfactory Unsatisfactory Good Satisfactor
y
Unsat
isfact
ory
1 Environment 3(16.67) 14(77.78) 1(5.55) 5(33.33) 10(66.67) -
2 Safety 2(11.11) 14(77.78) 2(11.11) 5(33.33) 10(66.67) -
3 Hygiene 3(16.67) 13(72.22) 2(11.11) 5(33.33) 10(66.67) -
Total No. of
Schools
18(100.0) 15(100.0)

21
Table 2.20: Encouragement to Students to adopt Good Practices
Source: Primary Data Based.
Serving Meal to students before tasting
Before the meal was served to students it was tasted by the teachers, VSS and
Parents. It was found that MDM was tasted daily by teachers of all primary and middle
schools. It was seldom tasted by VSS and parents in all primary and middle schools.
Table 2.21: Tasting of Meals
Source: Primary Data Based.
Community Participation and Awareness
Around 83 percent parents of primary school students and 66.67 percent parents
of middle schools children supervised MDM on a daily basis and found it to be
satisfactory. In case of VSSs it was 88.88 percent in primary and 80 percent in middle
schools. Supervision by Panchayat/urban bodies was found satisfactory in 61.11 percent
primary and 46.67 percent middle schools. In 5.56 percent parents from primary and
33.33 percent parents from middle schools, 5.56 percent VSSs from primary and 20
percent SMC/VSSs from middle schools and only 6.67 percent Panchayat/Urban bodies
from middle schools rated the MDM as good during daily supervision.
At the time of monitoring of MDM, it was rated as satisfactory by 83.33 percents
parents, 88.88 percent VSSs and 61.11 percent panchayat/urban bodies in primary
schools. Similarly, 66.67 percents parents, 80 percent VSSs and 46.67 percent
Sl.
No.
Particulars No. of Schools
PS No MS No
1 Children encouraged to wash hands
before and after eating
18(100.0) 0 15(100.0) 0
2 Children take MDM in orderly 18(100.0) 0 15(100.0) 0
3 Conservation of water 18(100.0) 0 15(100.0) 0
4 Cooking process and storage of fuel
is safe from fire hazard.
18(100.0) 0 15(100.0) 0
Total No. of Schools 18(100.0) 15(100.0)
Sl.
No. Particulars
No. of Schools
PS MS
Daily Seldom Daily Seldom
1 Tasted by Teacher 18(100.0) 0 15(100.0) 0
2 Tasted by VSS 0 18(100.0) 0 15(100.0)
3 Tasted by Parents 0 18(100.0) 0 15(100.0)
Total No. of Schools 18(100.0) 15(100.0)

22
panchayat/urban bodies in middle schools rated the monitoring of MDM as satisfactory.
MDM was monitored to be good by 5.56 percent parents and VSSs in primary schools
and 33.33 percent parents, 20.0 percent VSSs and 6.67 panchayat/urban bodies in middle
schools.
Table 2.22: Participation of Parents/VSSs/Urban bodies in Monitoring of MDM
Sl.
No Particulars
PS MS
Parents VSSs
Panchayat/
Urban
bodies
Parents VSSs
Panchayat/
Urban
bodies
Supervision of Daily MDM
1 Good 1(5.56) 1(5.56) - 5(33.33) 3(20.0) 1(6.67)
2 Satisfactory 15(83.33) 16(88.88) 11(61.11) 10(66.67) 12(80.0) 7(46.67)
3 None 2(11.11) 1(5.56) 7(38.89) - - 7(46.67)
Monitoring of MDM
1 Good 1(5.56) 1(5.56) - 5(33.33) 3(20.0) 1(6.67)
2 Satisfactory 15(83.33) 16(88.88) 11(61.11) 10(66.67) 12(80.0) 7(46.67)
3 None 2(11.11) 1(5.56) 7(38.89) - - 7(46.67)
Total No. of
schools
18(100.0) 15(100.0)
Source: Primary Data Based.
Awareness about MDM
It was found that community members maintained roaster for supervision of
MDM in 22.22 percent primary and 20 percent middle schools. Table 2.23 shows that
83.33 percent primary and 93.33 percent in middle schools have social audit mechanism
in the schools.
The list of schools where roster was not being maintained by the community members
for supervision of the MDM is given in Annexure 2.23.
Table 2.23: Awareness regarding MDM
Sl.
No. Particulars
No. of Schools
PS MS
Yes No Yes No
1 Roster being maintained by the
community members for
supervision of the MDM
4(22.22) 14(77.78) 3(20.0) 12(80.0)
2 Is there any Social Audit
mechanism in the schools
15(83.33) 3(16.67) 14(93.33) 1(6.67)
Source: Primary Data Based.

23
VSS Meetings
Table 2.24 shows that VSSs meeting monitoring time was one to two times in
22.22 percent primary and in 20 percent middle schools was found three to four time , 5
times and above in 77.78 percent primary and 80 percent middle schools. The frequency
of VSS meeting for MDM related discussion was observed once or twice in 22.22
percent primary and 6.67 percent middle schools, three to four times in 33.33 percent
primary and 46.66 percent middle schools, 5 times and above scenarios in 44.44 percent
primary and 46.67 percent middle schools.
Table 2.24: VSS Meetings
Sl.
No.
Particulars PS MS
1-2 time 3-4 time 5 &
above
time
Total 1-2
time
3-4 time 5 &
above
time
Total
1. No. of VSS
meeting till
the visit
2
(11.11)
2
(11.11)
14
(77.78)
18
(100.0)
- 3
(20.00)
12
(80.00)
15
(100.0)
2. No. of VSS
meeting to
MDM related
discussion
4
(22.22)
6
(33.33)
8
(44.44)
18
(100.0)
1
(6.67)
7
(46.66)
7
(46.67)
15
(100.0)
Total No. of Schools 18 (100.0) 15 (100.0)
Source: Primary Data Based.
Availability of Inspection Registers
Inspection register was available in 88.89 percent primary and in all middle
schools. It has been found that 38.89 percent primary and 20 percent middle schools
have received fund under MME component. The regular inspection of MDM was
reported in all sample primary and middle schools of the district.
Table 2.25: Inspection and Supervision of MDM by Educational Authorities
Sl.
No.
Particulars No. of Schools
PS MS
Yes No Yes No
1 Is there any Inspection Register
available at school level?
16
(88.89)
2
(11.11)
15
(100.0)
0
2 Whether school has received any
funds under MME component?
7
(38.89)
11
(61.11)
3
(20.00)
12
(100.0)
3 Are regular inspections of MDM? 18
(100.0)
0 15
(100.0)
0
Source: Primary Data Based.

24
Inspection and Supervision of MDM
The regular inspection of MDM was reported in all sample primary and middle
schools of the district. The inspection was done by the BEO, BDO, MDM Coordinator,
CRC Coordinator, BRP and DPO. As Table 2.26 shows in case of primary school
maximum inspection and supervision were done by BRP (43.48 percent) and for middle
schools it was mostly by BEO (31.58 percent) in Sheohar district. There was no state
level inspecting authorities visited in the schools for MDM programme. Maximum
inspections were made by block level authorities in primary and middle schools. Mostly
this inspection was made often in both categories of schools.
The visiting authorities remarked for good quality of MDM should be provided in
55.56 percent primary and 60.0 percent middle schools. Cleanliness of kitchen and store
should be ensured in 27.78 percent primary and 26.67 percent middle schools.
Table 2.26: Inspections and Supervision of MDM
(Multiple Responses)
Sl.
No. Particulars
No. of Schools
PS MS
1 Regular inspection of the MDM 18 (100.0) 15 (100.0)
2 Inspection
by
BEO 5 (21.73) 6 (31.58)
BDO - 1 (5.26)
MDM Coordinator 3 (13.04) 3 (15.79)
CRC Coordinator 4 (17.39) 4 (21.05)
BRP 10 (43.48) 3 (15.78)
DPO 1 (4.35) 2 (10.53)
3
Inspecting
authority
District 1 (4.35) 2 ( 10.53)
Block 18 (78.26) 13 (68.42)
CRC 4 (17.39) 4 (21.05)
4
Frequency
of
inspections
Weekly 5 (21.74) 2 (10.52)
Fortnightly 7 (30.43) 7 (36.84)
Often 11 (47.82) 10 (52.63)
5 Remarks
made by
the visiting
officials
Good Quality of
MDM should be
provided.
10 (55.56) 9 (60.0)
Cleanliness of kitchen
& store 5 (27.78) 4 (26.67)
Source: Primary Data Based.

25
Impact of MDM
As indicated in Table 2.27 impact of MDM in all sample primary and middle
schools has improved enrollment of students, attendance of students and full time
presence of students in schools.
Table 2.27: Impact of the MDM
Sl.
No.
Particulars No. of Schools
PS MS
1 Mid day meal improved Enrollment of student 18 (100.0) 15 (100.0)
Attendance of student 18 (100.0) 15 (100.0)
Present of students full
time in schools
18 (100.0) 15 (100.0)
Total No. of Schools 18 (100.0) 15 (100.0) Source: Primary Data Based.
Social Harmony
In all sample primary and middle schools MDM has improved social harmony
and nutritional status of students. Table 2.28 shows that there is no other incidental
benefit due to serving of meal in schools.
Table 2.28: Social Harmony
Sl.
No. Particulars
No. of Schools
PS MS
Yes No Yes No
1 Whether mid day meal has helped in
improvement of the social harmony
18
(100.0)
0 15
(100.0)
0
2 Whether mid day meal has helped in
improvement of the nutritional
status of the children.
18
(100.0)
0 15
(100.0)
0
3 Is there any other incidental benefit
due to serving of meal in schools
0 18
(100.0)
0 15
(100.0) Source: Primary Data Based.
Grievance Redressal Mechanism
As Table 2.29 indicates that all sample primary and middle schools have
grievances redressal mechanism in the district for MDMs and the district/block/ school
not have toll free number.

26
Table 2.29: Grievance Redressal Mechanisms
Sl.
No. Particulars
No. of Schools
PS MS
Yes No Yes No
1 Is any grievance redressal mechanism in
the district for MDM?
18
(100.0)
0 15
(100.0)
0
2 Whether the district/block/ school having
any toll free number?
0 18
(100.0)
0 15
(100.0) Source: Primary Data Based.
Views of Investigator on other Issues of MDM Implementation
The investigators views were that monitoring and evaluation of MDM should be
regular basis at school level. Wheat also should be provided to schools for MDM in
16.67 percent primary and 13.33 percent middle schools. LPG should be used for
cooking in 66.67 percent primary and middle schools each. Use of green vegetables must
be encouraged in 33.33 percent primary and 20 percent middle schools in the Sheohar
district as shown in Table-2.30.
Table 2.30: Views of Investigators regarding MDM
Sl.
No.
Issues relevant to MDM implementation No. of Schools
PS MS
1 Monitoring & Evaluation of MDM should be Regular 18 (100.0) 15 (100.0)
2 Arrangement and availability of LPG for cooking
purpose
12 (66.67) 10 (66.67)
3 Wheat also should be Provided to Schools for MDM 3 (16.67) 2 (13.33)
4 Use of Green Vegetable must be used in MDM 6 (33.33) 3 (20.00)
Total No. of School 18 (100.0) 15 (100.0) Source: Primary Data Based.

27
Chapter III
Centralized Kitchen in District Sheohar
Introduction
The primary objective of the MDM scheme is to provide hot cooked meal to
children of primary and middle classes; with other objectives of improving nutritional
status of children, encouraging poor children, belonging to disadvantaged sections, to
attend school more regularly and help them concentrate on classroom activities, thereby
increasing the enrolment, retention and attendance rates.
To ensure proper and complete implementation of the scheme, two models have
been designed and are in practice.
In the decentralized model the meals are cooked for an exact number of students
in the school, by a cook, helper, and organizer, right on the school premises and
the fresh meal is served to the children.
In the centralized model, mostly through a public-private partnership, an
external organization cooks and delivers the meal to schools. The advantages of
centralized kitchen include ensuring the provision of hygienic and nutritious food
as well as allowing for the optimum utilization of infrastructural facilities. The
centralized kitchen model offers the benefit of preparing a cooked meal under
strict supervision in a safe environment ensuring hygienic standard and provision
of quality food to a large number of children in time. This model addresses the
challenges of poor infrastructure, susceptibility to fire accidents and drain on
teaching time faced by schools by attempting to prepare the meal themselves.
Further, the transport of food is closely monitored and delivered to the schools at
the stipulated time.

28
Organization
During the monitoring and evaluation of MDM programme in Sheohar district, it
was found that Bal Vikash Sewa Shansthan (NGO) served the MDM in Sheohar- urban
and some schools of piparahi- rural blocks from the year 2009-10.
No. of Schools and Students Receiving MDM from NGO
Out of the 18 primary and 15 middle schools, it was found that MDM was
cooked and supplied by Bal Vikash Sewa Sansthan for 6 primary and 3 sample middle
schools. The survey also shows that in total 19 schools (13 PS and 6 MS) of the district
Sheohar are served MDM prepared by the NGO. Hence a total of 7161 students from the
4652 primary schools and 2509 students from the middle schools across the blocks
receive MDM prepared by the NGO in the district.
Location and Area of Centralized Kitchen
The centralized kitchen running by NGO in Sheohar is located in the urban area
and its total covered area approximately 3000sq. ft.
Surrounding and Accessibility of Centralized Kitchen
The quality was satisfaction level of the centralized kitchen with respect to its
atmosphere surroundings. The centralized kitchen in Sheohar-Urban block was rated as
good for accessibility.
Infrastructural Facilities in Centralized Kitchen
The infrastructural facilities in the centralized kitchen in district Sheohar,
different types of facilities were surveyed to analyze the infrastructural facilities. The
survey reveals the following observations:
i. FOOD ITEMS: Adequate space was available to receive the food grains/food
articles. Regarding the cleanliness of the food items received, the rating given
was good location. Location received dry food grains.
ii. STORAGE SPACE for food items was adequate in sample centralized kitchen. The
cleanliness of the storage space was rated fair locations. Also, the storage space
was found to be dry, well lit and ventilated location.
iii. There was adequate space for PRE-PREPARATION OF MDM sample kitchen.
Cleanliness during pre-preparation was fair kitchen. The space was dry, well-lit
and ventilated centralized kitchens.

29
iv. COOKING SPACE was adequate, dry, well lit and ventilated in the sample
centralized kitchens. Cleanliness maintained during cooking was rated as good.
FOOD ASSEMBLY AND SERVING SPACE was adequate, dry, well-lit and ventilated.
Similarly, the cleanliness maintained in this area was also rated as good locations.
v. The WASHING AREA of centralized kitchen was found to be adequate in space, dry,
well lit and ventilated. However, on the cleanliness parameter, the area was rated
as good.
Procurement and Storage of Raw Food Items in Centralized Kitchen
The information regarding procurement and storage of raw food items in the
sample centralized kitchen. It was observed that in any single purchase, the maximum
purchase made was on pulses, followed by cereals, then vegetables, fats and oils and then
spices. The frequency of purchase was monthly for all food items except for vegetable
which were bought on a daily basis. It was found that all the raw food items were stored
in plastic containers in centralized kitchens. Along with this, jute bags and laminated
gunny bags were also used to store cereals, pulses vegetables and spices. Along with
plastic containers to store fats and oils, tin containers were also being used.
Positioning of Container/Bags of Raw Food Items
The positions of the storage containers / bags of the raw foods' items in the
centralized kitchen of urban block of district Sheohar. As observed in the field, the
containers/bags were placed on a raised platform.
Type of Quality Parameters Verified in Raw Food Items
The different types of quality parameters which were verified in the raw food
items received in the sample centralized kitchen. Stones, insects, over-ripeness and bad
odor were checked for in the raw food items.
Source, Availability and Storage of water in Centralized Kitchen
The data regarding source, availability and storage of water in the sample
centralized kitchen. It was found that source of water was bore-well as well as hand
pump available and water was stored on covered utensils in centralized kitchens.
Preparation of MDM in Centralized Kitchens
The survey revealed that regarding the preparation of MDM in the centralized
kitchen the food items were washed before preparation. LPG was used for preparing
food in sample centralized kitchens. It was observed that after preparation, food items

30
were kept covered. Also, the maximum time lapse between preparing and packaging of
food was found to be 1 hour. Steel drums and steel buckets were used to pack food by
kitchen. Likewise, clean packing material was used in the kitchen.
Quality of Spices and Salt Used for Preparation of MDM
It was found that only seal-packed Agmark spices were used for preparation of
MDM in centralized kitchen. Also, double fortified salt (iron and iodine) was used in
sample kitchen.
ORGANIZATION OF THE CENTRALIZED KITCHEN
Management of Uneaten Food Left by Students in Schools
It was observed that management of food left uneaten by children in schools in
the urban block of District Sheohar the leftover food was packed and taken home by
cook cum helpers. More importantly, leftovers was not consumed by the suppliers or
thrown away.
Methods of Washing of Utensils in Centralized Kitchen
Scrubber, detergent/soap and water were used to wash the kitchen utensils in
centralized kitchen.
Staff Details of Centralized Kitchen
Total 16 persons were employed in the central kitchen. The kitchen had 1 kitchen
and store in-charge each; 1 purchase in-charge and 1 head cooks, 7 cooks. The remaining
employees were handlers and distributors, guards and sweepers.
Personal Hygiene of Staff in Centralized Kitchen
It was observed that personal hygiene maintained by the employees of the sample
central kitchens clean uniforms, wearing of headgears, short and clean fingernails,
gloves-wearing while handling food was in practice. Central kitchens had toilet facility
for staff. None of the staff suffered from cold, cough, throat infection or diarrhea etc. No
unhygienic activities were observed among the food handlers.
Methods of Kitchen-Waste Disposal
The survey shows that various methods of kitchen-waste disposal used in
centralized kitchen. Kitchen used garbage bins with lids for waste disposal. Garbage bins
were removed from the kitchen premises at frequent intervals, emptied and cleaned. It

31
was also found that no garbage was found lying around in the vicinity of the sample
centralized kitchen.
Modes for Transporting MDM to Schools
It was found that the NGO used Vans for transporting food from the centralized
kitchen to the schools in the catchment areas by. No car or refrigerated/insulated vehicles
were used.
Precautions Taken during Transporting MDM
Various precautions were observed by the centralized kitchens while transporting
MDM to the schools. The survey revealed that centralized kitchen used properly covered
containers during transporting food in vehicles. The food compartment of the vehicles
was kept clean and dry and a person accompanied the packed food from the centralized
kitchens to schools.
Estimation of MDM on Different Parameters
The appearance and texture of the food was rated as fair. The taste and smell of
the food prepared in centralized kitchen was rated as also fair.
The overall acceptability of MDM, prepared and provided to the students of
primary and middle schools by sample centralized kitchens, was rated as good.

32

32
Chapter IV
Major Findings
Monitoring and evaluation of Sarva Shiksha Abhiyan (SSA) was conducted by
the Giri Institute of Development Studies, Lucknow during 15 March to 31 March, 2015.
The survey covered 18 primary schools and 15 middle schools in the Sheohar district as
suggested by the Ministry of Human Resource Development, Department of School
Education and Literacy, Government of India. Besides monitoring and evaluation of SSA
programme in the district, the working of MDM was also monitored and evaluated. The
focus of monitoring of MDM was limited to cover only key components of the MDM
programme. These components of MDM for monitoring and evaluations were suggested
by the Ministry. On the basis of field survey of primary and middle schools, following
conclusions about the MDM programme have been arrived at:
Out of the 18 primary and 15 middle sample schools, it was found that MDM was
cooked and supplied by NGO namely, Bal Vikash Sewa Sansthan for 6 primary
and 3 sample middle schools. Rest of sample schools MDM cooked in premises
of schools campus.
During the monitoring and evaluation of MDM programme in Sheohar district, it
was found that Bal Vikash Sewa Shansthan (NGO) served the MDM in Sheohar-
urban and some schools of piparahi- rural block from the year 2009-10.
During the visits of schools of district Sheohar 13 (72.22 percent) sample primary
schools and 10 (66.67 percent) middle schools reported to have received food
grains within one month and its quality was good.
There was reported timely release of MDM funds from state, district and block-
level in all samples primary and middle schools of the district. It was also
observed that there were all sample schools where MDM cooked have received
MDM fund in advance and regularly.

33
It was found that all 33 sample schools hot cooked meal was provided to students
regularly. This fact was confirmed from students, teachers, parents and from
MDM registers of the concerning schools.
Due to unavailability of food grains and meals not supplied by NGO etc in 7 PS 8
MS in few days of last three months food not served to the students.
There was no difference between the number of students for whom the MDM
was prepared and those who got the MDM.
There was no difference between MDM registers and head count of students on
the day of visit of monitoring team to the sample schools.
MDM was cooked by VSS appointed cook-cum-helpers. Majority of cooks were
females and of OBC castes and they were paid monthly salary of Rs.1000/
regularly through the cheques.
It has been observed that in none of the sample primary and middle schools
gender, caste or community discrimination in cooking and serving or seating
arrangement.
The meal was tasted by the teachers before it was served to the students.
The MDM was served by cooks and the students received MDM in queue.
The menu was displaced at noticeable places in 83.33 percent primary and all
middle schools and it is also verified that the all sample schools followed the
menu in the district.
MDM logo was not displayed in any of the sample schools campus.
The prescribed quantity of MDM was given to students and was found to be
sufficient. The quality of MDM was found to be good in 66.67 percent primary
and 73.33 percent middle schools.
Health cards were maintained in 77.78 percent primary and 66.67 percent middle
schools. Likewise all students of sample primary and middle schools were given
micronutrients medicine periodically by ANM as well Teachers.

34
The availability of potable water through difference sources was found in all
sample primary and middle schools.
Kitchens were available in only 12(66.67 percent) primary and 9(60.0 percent)
middle schools. In all the sample primary and middle schools, food was cooked
using fire wood.
It was found that 44.44 percent sample primary and 93.33 percent middle schools
have ceasefire.
The kitchen utensils were available in all sample primary and middle schools.
The availability of covered drums was found in 72.22 percent primary and all 15
middle schools. Cover drums were reported to have been purchased from MME
funds.
Separate toilets for boys and girls were available in only 66.67 percent primary
and 93.33 percent middle schools.
The Computers was available in only 3 (20.0 percent) middle schools only.
The condition of environment, safety and hygiene was satisfactory in majority of
primary and middle schools.
It was observed that students were encouraged to wash their hand before and after
the meal. The students were seen receiving the MDM in queue in all the schools.
The practice of water conservation was seen, cooking process and storage of fuel
were found to be safe from fire hazards in all sample schools.
The awareness of parents and community about MDM was found to be
satisfactory in most of the schools.
The frequency of VSS meeting for MDM related discussion was observed once
or twice in 22.22 percent primary and 6.67 percent middle schools, three to four
times in 33.33 percent primary and 46.66 percent middle schools, 5 times and
above scenarios in 44.44 percent primary and 46.67 percent middle schools.
Inspection and supervision MDM by district and block officials on regular basis
covered all schools

35
It was observed that MDM was helpful in improving the social harmony. The
grievance redressal mechanism was active.
The impact of MDM was found to be positive in all sample primary and middle
schools. MDM has improved enrollment of students, attendance of students and
full time presence of students in all schools.
The views of investigators about different aspect of implementation of MDM in
the district were found to be positive. The investigators views were that
monitoring and evaluation of MDM should be regular basis at school level,
Wheat also should be provided to schools for MDM and LPG should be ensured
for cooking instead of woods.
It was found that MDM was also cooked and supplied by Bal Vikash Sewa
Sansthan (A NGO) for total 19 schools (13 PS and 6 MS) in the district of
Sheohar. Hence a total of 7161 students, (from the 4652 primary schools and
2509 students from the middle schools) were benefited with MDM cooked by
centralized kitchen managed by NGO.
The overall acceptability of MDM, prepared and provided to the students of
primary and middle schools by sample centralized kitchens, was rated as good.

36
ANNEXURE Annexure 2.1 Food grains facility not available in advance for One month
Primary Schools
1 Sonvarsa 4 Araji Chhatauni Tola
2 Gauspur Marhalla 5 Harnahiya
3 Khajepur
Middle Schools
1 Aura 4 Amba Kala
2 Piprahi 5 Belhiya
3 Kushahar
Food Grains not delivered to Lifting Agency within Proper Time
Primary Schools
1 Sonvarsa 4 Araji Chhatauni Tola
2 Gauspur Marhalla 5 Harnahiya
3 Khajepur
Middle Schools
1 Aura 4 Amba Kala
2 Piprahi 5 Belhiya
3 Kushahar
Annexure 2.5 In Last three months, few days food not served due to Various Reasons
Primary Schools
1 Rasidpur (Ward-7) 5 Khajepur
2 Sonvarsa 6 Araji Chhatauni Tola
3 Gauspur Marhalla 7 Harnahiya
4 Govt. Parsauni
Middle Schools
1 Kanya Sheohar (Ward-13) 5 Chhatauni
2 Aura 6 Kushahar
3 Piprahi 7 Amba Kala
4 Sundarpur 8 Belhiya
Annexure 2.7 Weekly Menu was not Displayed in Primary Schools at a Noticeable Place
1 Sheohar (West)
2 Sheohar (Ward-2)
3 Urdu Mesaura
Annexure 2.11
Health Card not Maintained for each Child in Schools
Primary Schools
1 Rasidpur (Ward-7) 3 Gauspur Marhalla
2 Shanaza 4 Kushahar Kasba Tola
Middle Schools
1 Chamanpur 4 Chhatauni
2 Mushari 5 Pojhiyan
3 Sundarpur
First aid Medical Kit not available in the School
Primary Schools
1 Sheohar (West) 7 Kushahar Kasba Tola
2 Sheohar (Ward-2) 8 Garhwa
3 Rasidpur (Ward-7) 9 Belwa
4 Shanaza 10 Khajepur
5 Mathurapur 11 Araji Chhatauni Tola
6 Piprahi Kala 12 Harnahiya

37
Middle Schools
1 Babhan Toli 5 Chhatauni
2 Aura 6 Kushahar
3 Chamanpur 7 Amba Kala
4 Mushari 8 Belhiya
Annexure 2.13 Cease fire not available
Primary Schools
1 Sheohar (West) 6 Garhwa
2 Sheohar (Ward-2) 7 Belwa
3 Rasidpur (Ward-7) 8 Khajepur
4 Islampur (Ward-15) 9 Araji Chhatauni Tola
5 Piprahi Kala 10 Harnahiya
Middle School
1 Sundarpur
Annexure 2.14
Eating Plates etc. are not available
Primary Schools
1 Rasidpur (Ward-7) 9 Urdu Mesaura
2 Shanaza 10 Kushahar Kasba Tola
3 Islampur (Ward-15) 11 Garhwa
4 Mathurapur 12 Belwa
5 Sonvarsa 13 Khajepur
6 Piprahi Kala 14 Araji Chhatauni Tola
7 Gauspur Marhalla 15 Harnahiya
8 Govt. Parsauni
Middle School
1 Rasidpur (Mushar Tola)
Utensils/Kitchen Devices are not Sufficient
Primary Schools
1 Sheohar (West) 3 Buniyadiganj
2 Sheohar (Ward-2)
Middle Schools
1 Aura 5 Sundarpur
2 Chamanpur 6 Kushahar
3 Mushari 7 Dhankaul
4 Piprahi
Annexure 2.15: Kitchens not Available
Primary Schools
1 Sheohar (West) 3 Shanaza 5 Mathurapur
2 Sheohar (Ward-2) 4 Islampur (Ward-15) 6 Piprahi Kala
Middle Schools
1 Rasidpur (Mushar Tola) 3 Aura 5 Piprahi
2 Babhan Toli 4 Mushari 6 Chhatauni
Interruption in Preparation of MDM due to non-availability of Firewood or LPG on any
given day
Middle Schools
1 Sundarpur 3 Chhatauni
2 Aura
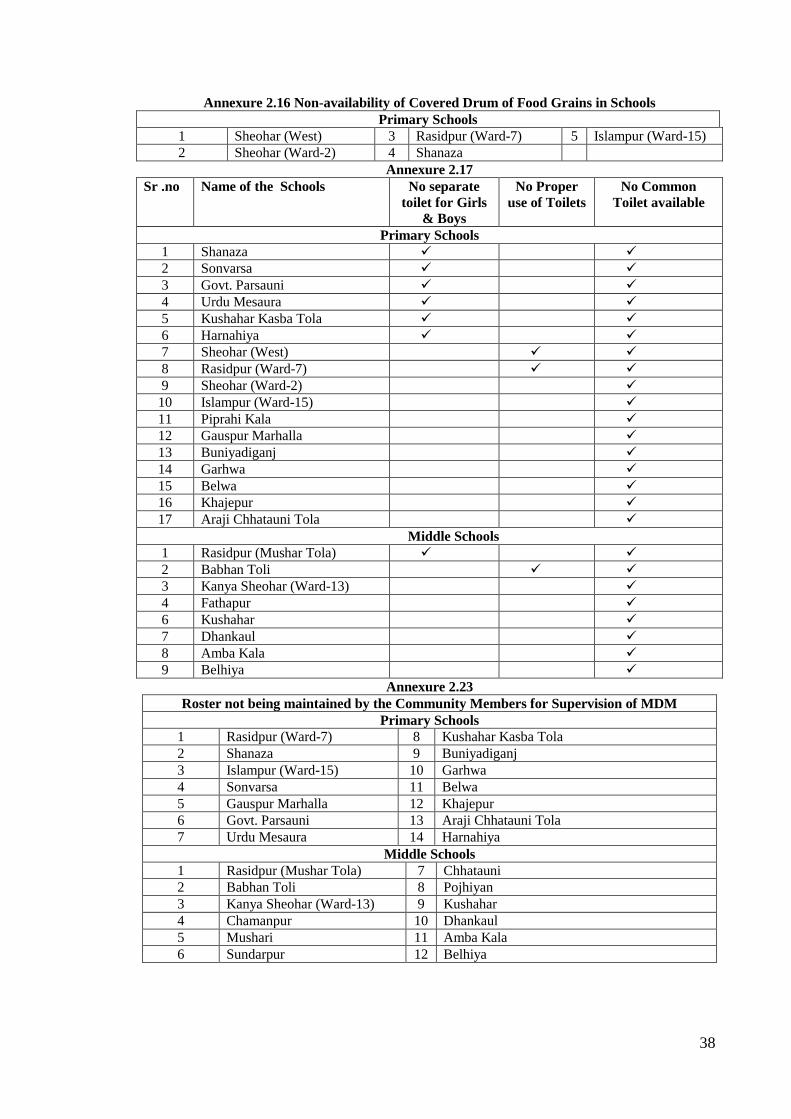
38
Annexure 2.16 Non-availability of Covered Drum of Food Grains in Schools
Primary Schools
1 Sheohar (West) 3 Rasidpur (Ward-7) 5 Islampur (Ward-15)
2 Sheohar (Ward-2) 4 Shanaza
Annexure 2.17
Sr .no Name of the Schools No separate
toilet for Girls
& Boys
No Proper
use of Toilets
No Common
Toilet available
Primary Schools
1 Shanaza
2 Sonvarsa
3 Govt. Parsauni
4 Urdu Mesaura
5 Kushahar Kasba Tola
6 Harnahiya
7 Sheohar (West)
8 Rasidpur (Ward-7)
9 Sheohar (Ward-2)
10 Islampur (Ward-15)
11 Piprahi Kala
12 Gauspur Marhalla
13 Buniyadiganj
14 Garhwa
15 Belwa
16 Khajepur
17 Araji Chhatauni Tola
Middle Schools
1 Rasidpur (Mushar Tola)
2 Babhan Toli
3 Kanya Sheohar (Ward-13)
4 Fathapur
6 Kushahar
7 Dhankaul
8 Amba Kala
9 Belhiya
Annexure 2.23
Roster not being maintained by the Community Members for Supervision of MDM
Primary Schools
1 Rasidpur (Ward-7) 8 Kushahar Kasba Tola
2 Shanaza 9 Buniyadiganj
3 Islampur (Ward-15) 10 Garhwa
4 Sonvarsa 11 Belwa
5 Gauspur Marhalla 12 Khajepur
6 Govt. Parsauni 13 Araji Chhatauni Tola
7 Urdu Mesaura 14 Harnahiya
Middle Schools
1 Rasidpur (Mushar Tola) 7 Chhatauni
2 Babhan Toli 8 Pojhiyan
3 Kanya Sheohar (Ward-13) 9 Kushahar
4 Chamanpur 10 Dhankaul
5 Mushari 11 Amba Kala
6 Sundarpur 12 Belhiya

39
District-2: Saharsa

40

39
Chapter I
Introduction
Sample Design of the Study
A total of 37 schools have been taken as sample from Saharsa district as shown in
Table-1.1. Out of these 37 schools, 22 are primary schools and 15 middle schools.
Table 1.1: Number of Sample Schools
Sl. No. Name of Block Primary
schools
Middle schools Total
1 Kahra 5 4 9
2 Sattar kataiya 4 2 6
3 Sonbarsa 6 4 10
4 Simri Bakhtiyarpur 7 5 12
Total 22 15 37
Table-1.2 Depicts all 37-sample schools selected from Saharsa district. Care has been
taken that each type of school, as per the selection criteria, is represented in the sample.
Table 1.2: School-wise list of Sample Schools
Sl.
No.
Name of the schools U-DIES
Coade
Category of
schools PS/
MS
Criteria for Selection
1 N.P.S. Radhanagar 10120404504 PS High P.T.R.
2 N.P.S. Dumrail 10120406601 PS CWSN
3 N.P.S. Naya Bazar 10120403302 PS CWSN
4 P.S. Gangjala 10120404901 PS High P.T.R.
5 P.S. Sarahi 10120403501 PS CWSN
6 Primary Maqtab
Bhoraha
10120803801 PS CWSN, Civil Work
7 P.S.Simari Harizan
Colony
10120800805 PS CWSN
8 P.S. Rani Bag 10120804505 PS CWSN,
9 P.S.Ganj 10120804504 PS High P.T.R.
10 N.P.S. Badiya Harizan
Tola
10120807301 PS CWSN, Droup out
11 Urdu Primary Maqtab
Usrahi
10120803701 PS Civil Work
12 P.S. Ganga Prasad 10120800404 PS SC Dominated, Gender
Gap
13 P.S. Sapatiyahi 10120200102 PS Gender Gap

40
Sl.
No.
Name of the schools U-DIES
Coade
Category of
schools PS/
MS
Criteria for Selection
14 P.S.Bhelwa 10120202002 PS Out of School, CWSN
15 P.S. Lalganj 10120200702 PS Flood Effected
16 P.S.Patori 10120201702 PS CWSN
17 N.P.S. Navtol 10120704803 PS High P.T.R.
18 P.S. Gadery Tola 10120701206 PS High P.T.R.
19 N.P.S. Paswan Tola 10120700105 PS Civil Work, SC
Dominated, High P.T.R.
20 P.S. Shahu Tola 10120704802 PS High P.T.R.
21 N.P.S. Gwalpada 10120704103 PS SC Dominated, Flood
Effected
22 Kanya P.S. Bhada 10120704601 PS SC Dominated, Out of
School
23 Govt. M.S. D.B. Colony 10120404002 MS SC Dominated, Slum Area
24 M.S. Koshi Colony 10120405001 MS SC Dominated, Gender
Gap, High P.T.R.
25 M.S.Buchchan Shah 10120403601 MS CWSN, High P.T.R.
26 M.S.Arakshi Kendra 10120403201 MS CWSN
27 M.S. Sardiha 10120801102 MS Computer, CWSN
28 U.M.S.Jamuniya 10120804002 MS SC Dominated, Flood
Effected
29 M.S.Gopal Balwahat 10120806102 MS CWSN
30 Urdu Kanya M.S. Panch
Bighi
10120800401 MS CWSN, Civil Work
31 M.S. Bali Teghara 10120801801 MS Computer
32 M.S. Haqpada 10120204301 MS CWSN
33 M.S.Barah Sher 10120201201 MS CWSN, Computer, Out of
School
34 U.M.S.Dumara 10120700102 MS Flood Effected, CWSN
35 U.M.S.Manauri 10120704301 MS High P.T.R.
36 Adarsh M.S. Shahpur
Aanchal
10120704801 MS High P.T.R.
37 Kanya M.S. Badivan 10120705901 MS Flood Effected, Source: DPO Office, SSA Programme, District Saharsa, Bihar
Tools
A well-structured was prepared to collect primary data from the selected schools.
Separate schedules have been used for primary and middle schools.
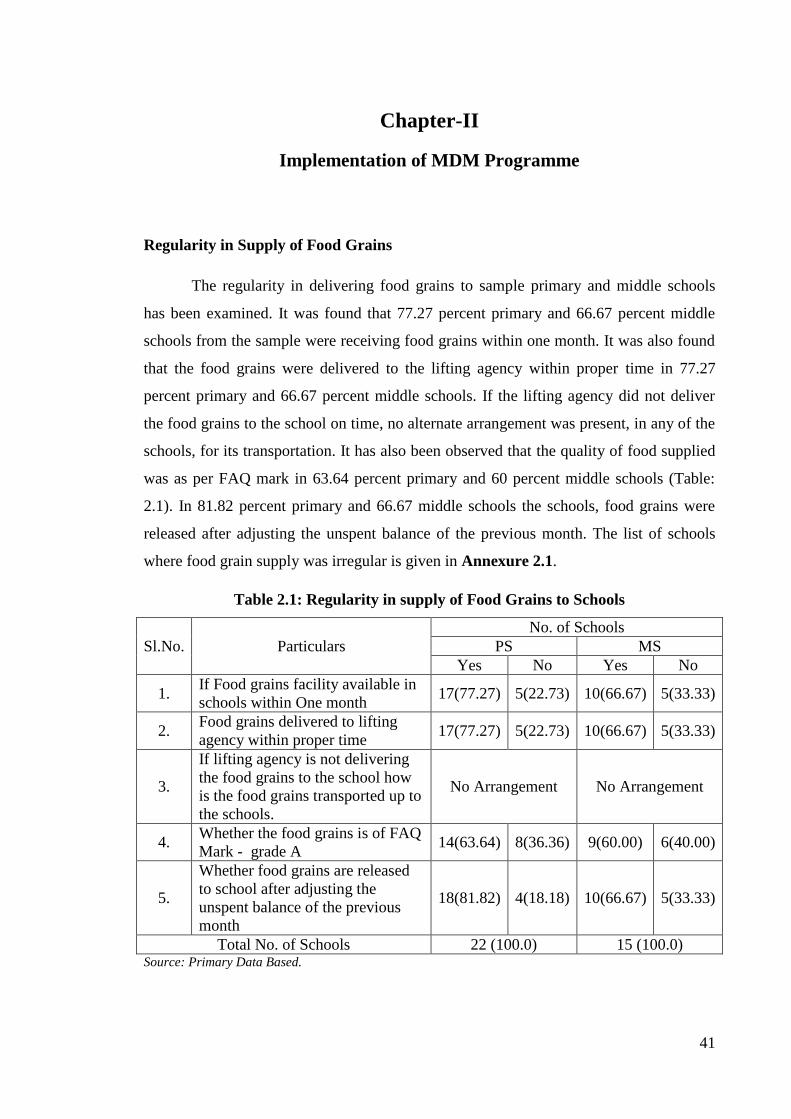
41
Chapter-II
Implementation of MDM Programme
Regularity in Supply of Food Grains
The regularity in delivering food grains to sample primary and middle schools
has been examined. It was found that 77.27 percent primary and 66.67 percent middle
schools from the sample were receiving food grains within one month. It was also found
that the food grains were delivered to the lifting agency within proper time in 77.27
percent primary and 66.67 percent middle schools. If the lifting agency did not deliver
the food grains to the school on time, no alternate arrangement was present, in any of the
schools, for its transportation. It has also been observed that the quality of food supplied
was as per FAQ mark in 63.64 percent primary and 60 percent middle schools (Table:
2.1). In 81.82 percent primary and 66.67 middle schools the schools, food grains were
released after adjusting the unspent balance of the previous month. The list of schools
where food grain supply was irregular is given in Annexure 2.1.
Table 2.1: Regularity in supply of Food Grains to Schools
Sl.No. Particulars
No. of Schools
PS MS
Yes No Yes No
1. If Food grains facility available in
schools within One month 17(77.27) 5(22.73) 10(66.67) 5(33.33)
2. Food grains delivered to lifting
agency within proper time 17(77.27) 5(22.73) 10(66.67) 5(33.33)
3.
If lifting agency is not delivering
the food grains to the school how
is the food grains transported up to
the schools.
No Arrangement
No Arrangement
4. Whether the food grains is of FAQ
Mark - grade A 14(63.64) 8(36.36) 9(60.00) 6(40.00)
5.
Whether food grains are released
to school after adjusting the
unspent balance of the previous
month
18(81.82) 4(18.18) 10(66.67) 5(33.33)
Total No. of Schools 22 (100.0) 15 (100.0) Source: Primary Data Based.

42
Timely Release of Funds
It was found that all sample primary and middle schools timely recicved funds at
State level, 95.45 percent primary and 93.33 percent middle schools timely recicved
funds at District level and 100.0 percent primary and 93.33 percent middle schools
timely recicved funds at at Block-level, as shown in Table-2.2.
Table 2.2: Timely Release of Funds
S.No Particulars No. of Schools
PS MS
1 Whether State is releasing funds to District on regular
basis in advance 22(100.0) 15(100.0)
2 Whether District is releasing funds to Block on regular
basis in advance 21(95.45) 14(93.33)
3 Whether Block is releasing funds to School on regular
basis in advance 22(100.0) 14(93.33)
Total No. of schools 22(100.0) 15(100.0) Source: Primary Data Based.
Cost of Cooking Received
It was found that 90.91 percent primary and 86.67 percent middle schools were
receiving cooking cost regularly in advance. It was found that 2 primary school receive
cooking cost delayed by 10 days and 1 middle school receive cooking cost delayed by10
days, 1 middle schools delay by 2 month as shown in Table-2.3, it was also found that E-
transfer was the preferred mode of payment for the cooking cost in all sample schools.
Table 2.3: Availability of Cooking Cost
S.No Particulars No. of Schools
PS MS
1 No. of schools in which cooking cost was received
regularly and in advance 20(90.91) 13(86.67)
2
How much delay in receiving the
cooking cost in advance
10 days 2 (100.0) 1(50.0)
20 days - -
2 Months - 1(50.0)
4
In case of delay, how does the school/implementing
agency manages to ensure that there is no disruption in
the feeding programme
No Any
Arangement -
5
Mode of payment of cooking Cost In cash - -
By Cheque - -
E-Transfer 22 (100.0) 15(100.0)
Total No. of schools 22 (100.0) 15(100.0)
Source: Primary Data Based.

43
Information Regarding Cooks
It was found that in all sample primary schools and middle schools, MDM was
being cooked by the VEC/SMC appointed cook-cum-helper. In 63.64 percent primary
and 40.0 percent middle schools the number cooks were sufficient as per GOI norms.
The cooks were mostly female and their salary was Rs. 1000/ per month. The salary of
the cooks was paid via cheques and was a regular exercise in a large number of cases.
Out of total appointed cooks, the share of gengral cooks 8 to 14 percent in middle
schools. The OBC cooks were about 39 to 50 percent in primary and middle schools. The
Minority cooks were about 12 to 16 percent in primary and middle schools. The SC
cooks were about 24 to 36 percent in primary and middle schools as evident from Table-
2.4.
Medical check-up of the cooks was done in all primary and middle schools.
Annexure 2.4 has the names of schools in which cooks were not sufficient in number
as per GOI.
Table 2.4: Availability of Cook-cum-helpers
Sl.No. Particulars No. of Schools
PS MS
1 Mode of appointment of cook-
cum-helper in Schools
By VEC/SMC 22 (100.0) 15 (100.0)
2 Number of schools in which cooks were sufficient in
number as per GOI
14(63.64) 6(40.00)
3 No. of Cooks in schools
Male 11(18.03) 12(24.00)
Female 50(81.97) 38(76.00)
Total 61(100.0) 50(100.0)
4 Monthly salary of cook Rs. 1000/- per
month
61(100.0) 50(100.0)
Rs. 2000/- per
month
- -
5 Mode of Payment
By Cash - -
By Cheque 61(100.0) 50(100.0)
6 Payment is regular Yes 61(100.0) 50(100.0)
No - -
7
No. of cooks per social category
1. SC 22(36.07) 12(24.00)
2. ST - -
3 .OBC 24(39.34) 25(50.00)
4 .Minority 10(16.39) 6(12.00)
5. Others(GEN) 5(8.20) 7(14.00)
8. Availability of Training Modules
for Cooks
Yes 61(100.0) 50(100.0)
No - -

44
9. If Yes, provided modules Yes 61(100.0) 50(100.0)
No - -
10. Training of Cooks Yes 61(100.0) 50(100.0)
No - -
11.
If Yes, what was the training
venue
BRC 61(100.0) 50(100.0)
CRC - -
Any other - -
12. Who is the Trainer MDM
Coordinator
61(100.0) 50(100.0)
13. Is the meal prepared and transported by the
Centralized kitchen/ NGO, whether cook-cum-helpers
have been engaged to serve the meal to the children at
school level.
NA
14. Is there any medical checkup of
the cooks
Yes 61(100.0) 50(100.0)
No - - Source: Primary Data Based.
Regularity in Serving Meal
It was found that in all sample primary and middle schools hot, cooked meal was
provided to the students on a regular basis. Regularity in supplying of hot cooked meal to
the students of these schools has been observed by enquiring from the students, teachers,
parents and through MDM register. This fact has been confirmed from students, teachers,
and parents and from MDM register of the concerned school (Table-2.5).
Annexure 2.5 the names of schools in which no Regularity in Serving Meals in last three
months.
Table 2.5: Regularity in Serving Meal
Sl.No. Particulars No. of Schools
PS MS
Yes No Yes No
1. Everyday served Hot Cooked Meal 22(100.0) - 15(100.0) -
2.
last three
months how
much days
food not served
(Multipale
response)
Nov.
1-8 1(20.0) 1(100.0)
8-15 3(60.0) -
15-24 1(20.0) -
Total 5(22.73) 1(6.67)
Dec.
1-8 3(75.0) 1(50.0)
8-15 - -
15-24 1(25.0) 1(50.0)
Total 4(18.18) 2(13.33)
Jan.
1-8 - 1(50.0)
8-15 4(66.67) -
15-24 2(33.33) 1(50.0)
Total 6(27.27) 2(13.33)
3.
Item (ii) Reason for not served food (Multipale response)
Nov
.
Food grains not available 3(60.00) 1(100.0)
Lack of cooking cost 1(20.00) -
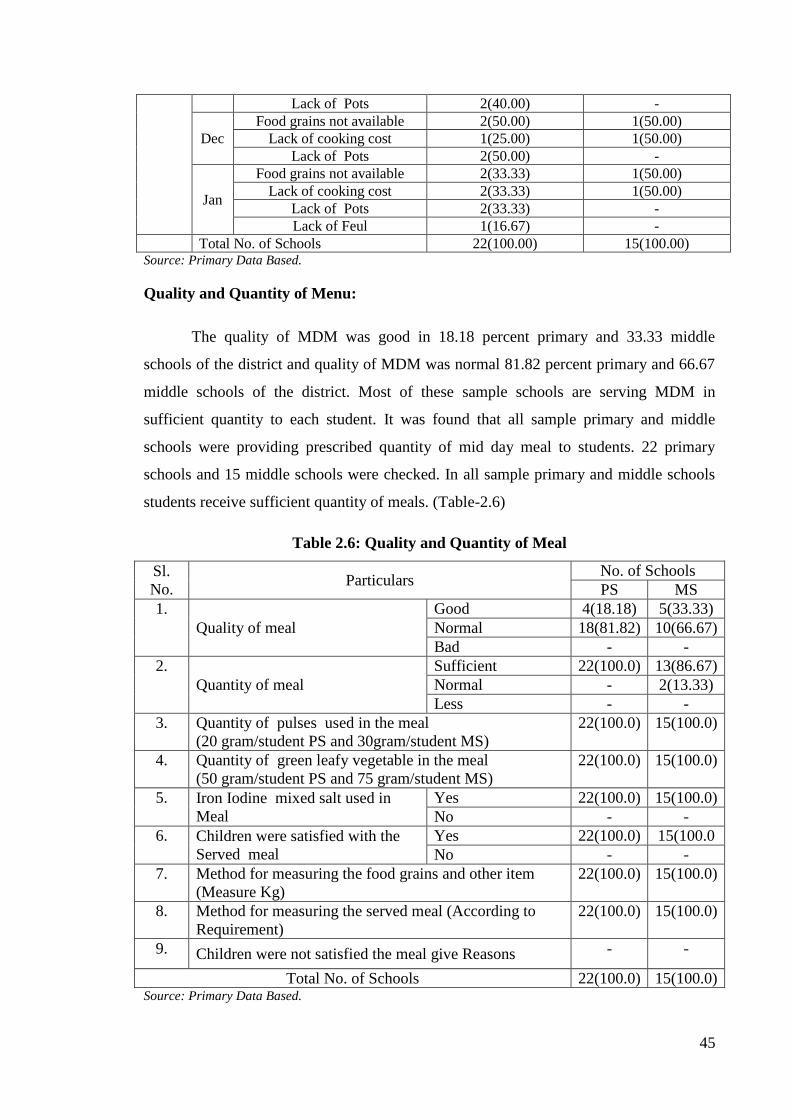
45
Lack of Pots 2(40.00) -
Dec
Food grains not available 2(50.00) 1(50.00)
Lack of cooking cost 1(25.00) 1(50.00)
Lack of Pots 2(50.00) -
Jan
Food grains not available 2(33.33) 1(50.00)
Lack of cooking cost 2(33.33) 1(50.00)
Lack of Pots 2(33.33) -
Lack of Feul 1(16.67) -
Total No. of Schools 22(100.00) 15(100.00) Source: Primary Data Based.
Quality and Quantity of Menu:
The quality of MDM was good in 18.18 percent primary and 33.33 middle
schools of the district and quality of MDM was normal 81.82 percent primary and 66.67
middle schools of the district. Most of these sample schools are serving MDM in
sufficient quantity to each student. It was found that all sample primary and middle
schools were providing prescribed quantity of mid day meal to students. 22 primary
schools and 15 middle schools were checked. In all sample primary and middle schools
students receive sufficient quantity of meals. (Table-2.6)
Table 2.6: Quality and Quantity of Meal
Sl.
No. Particulars
No. of Schools
PS MS
1.
Quality of meal
Good 4(18.18) 5(33.33)
Normal 18(81.82) 10(66.67)
Bad - -
2.
Quantity of meal
Sufficient 22(100.0) 13(86.67)
Normal - 2(13.33)
Less - -
3. Quantity of pulses used in the meal
(20 gram/student PS and 30gram/student MS)
22(100.0) 15(100.0)
4. Quantity of green leafy vegetable in the meal
(50 gram/student PS and 75 gram/student MS)
22(100.0) 15(100.0)
5. Iron Iodine mixed salt used in
Meal
Yes 22(100.0) 15(100.0)
No - -
6. Children were satisfied with the
Served meal
Yes 22(100.0) 15(100.0
No - -
7. Method for measuring the food grains and other item
(Measure Kg)
22(100.0) 15(100.0)
8. Method for measuring the served meal (According to
Requirement)
22(100.0) 15(100.0)
9. Children were not satisfied the meal give Reasons - -
Total No. of Schools 22(100.0) 15(100.0) Source: Primary Data Based.
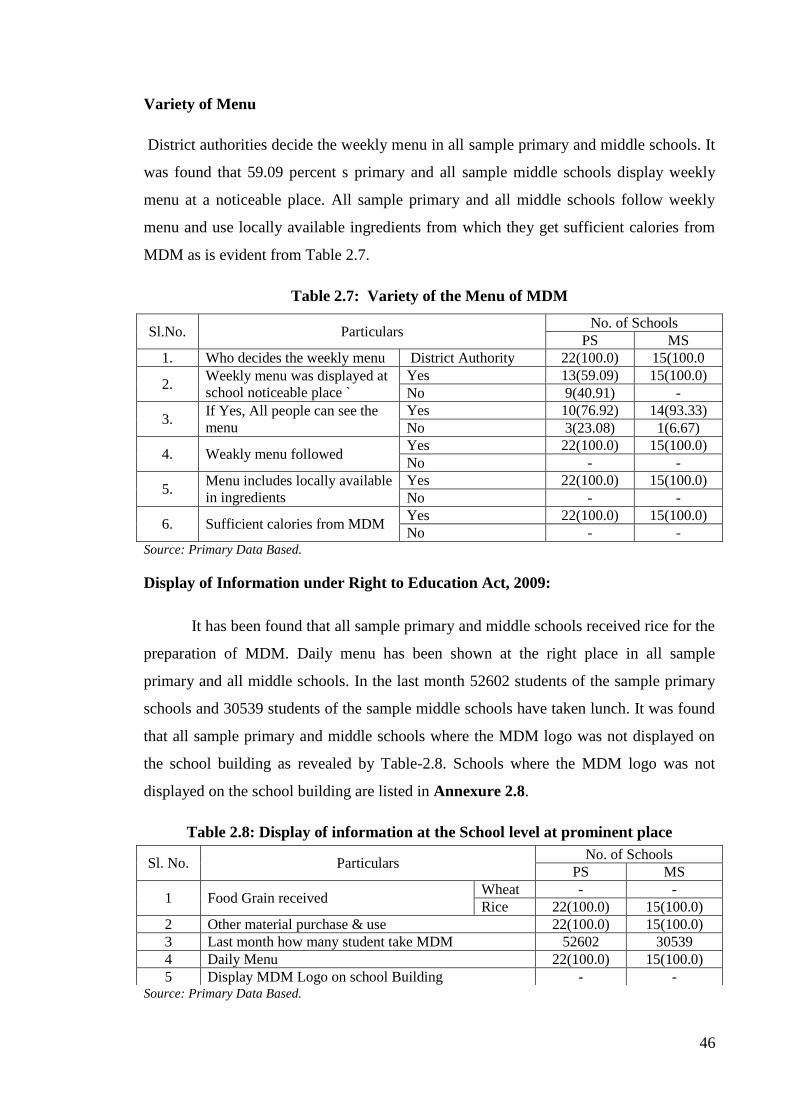
46
Variety of Menu
District authorities decide the weekly menu in all sample primary and middle schools. It
was found that 59.09 percent s primary and all sample middle schools display weekly
menu at a noticeable place. All sample primary and all middle schools follow weekly
menu and use locally available ingredients from which they get sufficient calories from
MDM as is evident from Table 2.7.
Table 2.7: Variety of the Menu of MDM
Sl.No. Particulars No. of Schools
PS MS
1. Who decides the weekly menu District Authority 22(100.0) 15(100.0
2. Weekly menu was displayed at
school noticeable place `
Yes 13(59.09) 15(100.0)
No 9(40.91) -
3. If Yes, All people can see the
menu
Yes 10(76.92) 14(93.33)
No 3(23.08) 1(6.67)
4. Weakly menu followed Yes 22(100.0) 15(100.0)
No - -
5. Menu includes locally available
in ingredients
Yes 22(100.0) 15(100.0)
No - -
6. Sufficient calories from MDM Yes 22(100.0) 15(100.0)
No - - Source: Primary Data Based.
Display of Information under Right to Education Act, 2009:
It has been found that all sample primary and middle schools received rice for the
preparation of MDM. Daily menu has been shown at the right place in all sample
primary and all middle schools. In the last month 52602 students of the sample primary
schools and 30539 students of the sample middle schools have taken lunch. It was found
that all sample primary and middle schools where the MDM logo was not displayed on
the school building as revealed by Table-2.8. Schools where the MDM logo was not
displayed on the school building are listed in Annexure 2.8.
Table 2.8: Display of information at the School level at prominent place
Source: Primary Data Based.
Sl. No. Particulars No. of Schools
PS MS
1 Food Grain received Wheat - -
Rice 22(100.0) 15(100.0)
2 Other material purchase & use 22(100.0) 15(100.0)
3 Last month how many student take MDM 52602 30539
4 Daily Menu 22(100.0) 15(100.0)
5 Display MDM Logo on school Building - -

47
Distribution of MDM
The number of students of primary and middle schools availing MDM was
counted on the day of our visit in these sample schools. Their number was also verified
from the MDM register. Table-2.9 indicates that 5161 students were enrolled in 22
sample primary and 4620 were enrolled in 15 sampled middles chools of Saharsa district.
On the day of visit 53.13 percent children of primary schools and 41.02 percent children
of middle schools were present in the school. In both types of schools almost children
were availing MDM as per MDM register on the day of visit.
Table 2.9: Children Availing MDM on the Day of Visit and as per School Registers
Source: Primary Data Based.
Discrimination in Cooking
Queue was observed for serving and seating arrangement for eating of food in all
sample primary and 86.67 percent middle schools of Saharsa district. It has been
observed that all sample primary and middle schools observe no gender or caste or
community discrimination in cooking and serving or seating arrangement as Table-2.10
shows.
Sl.
No. Particulars
No. of Schools
PS MS
1 No. of children enrolled in schools 5161
(100.0)
4620
(100.0)
2 No. of children attending the school on the day of
visit
2742
(53.13)
1895
(41.02)
3 No. of children availing MDM as per MDM register 2466
(89.93)
1854
(97.84)
4 No. of children actually availing MDM on the day
of visit
2403
(87.63)
1716
(90.55)
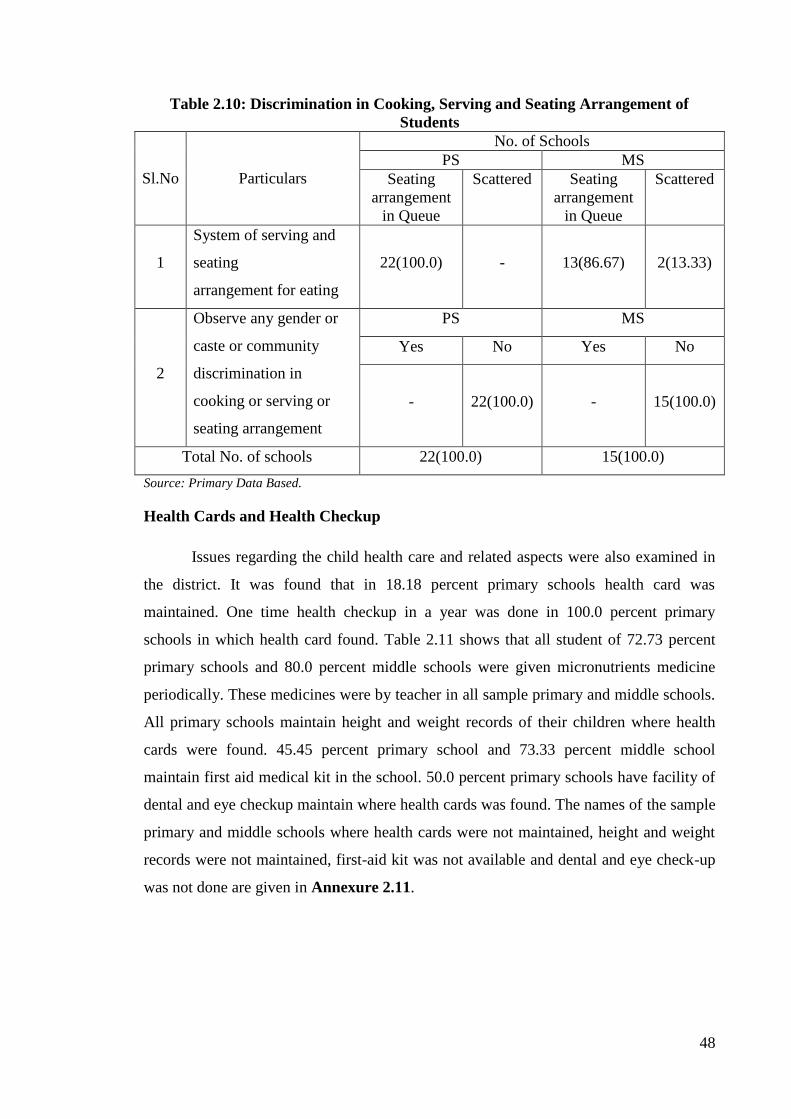
48
Table 2.10: Discrimination in Cooking, Serving and Seating Arrangement of
Students
Sl.No Particulars
No. of Schools
PS MS
Seating
arrangement
in Queue
Scattered Seating
arrangement
in Queue
Scattered
1
System of serving and
seating
arrangement for eating
22(100.0) - 13(86.67) 2(13.33)
2
Observe any gender or
caste or community
discrimination in
cooking or serving or
seating arrangement
PS MS
Yes No Yes No
- 22(100.0) - 15(100.0)
Total No. of schools 22(100.0) 15(100.0)
Source: Primary Data Based.
Health Cards and Health Checkup
Issues regarding the child health care and related aspects were also examined in
the district. It was found that in 18.18 percent primary schools health card was
maintained. One time health checkup in a year was done in 100.0 percent primary
schools in which health card found. Table 2.11 shows that all student of 72.73 percent
primary schools and 80.0 percent middle schools were given micronutrients medicine
periodically. These medicines were by teacher in all sample primary and middle schools.
All primary schools maintain height and weight records of their children where health
cards were found. 45.45 percent primary school and 73.33 percent middle school
maintain first aid medical kit in the school. 50.0 percent primary schools have facility of
dental and eye checkup maintain where health cards was found. The names of the sample
primary and middle schools where health cards were not maintained, height and weight
records were not maintained, first-aid kit was not available and dental and eye check-up
was not done are given in Annexure 2.11.

49
Table 2.11: Health Cards, Health Checkup
Sl.No. Particulars
No. of Schools
PS MS
Yes No Yes No
1 Health card maintained for each child
in school 4(18.18) 18(81.82) - 15(100.0)
2
Frequency of
health check-
up
One time 4(100.0) -
Two time - -
More than two time - -
3
Whether
children are
given
micronutrients
medicine
periodically
Iron, Folic acid,
Vitamin A dosage,
De-worming
16(72.73) 6(27.27) 12(80.00) 3(20.00)
4
If yes, Name
of the
department
who
administered
these
medicines
By
whom
1. ANM - -
2. Health
Dept. - -
3. Teacher 16 (100.0) 12(100.0)
How
many
time
1 time 16(100.0) 12(100.0)
2 time -
3 time - -
5
Whether height and weight record of
the children is being indicated in the
school health card.
4(100.0) - - -
6 Whether any referral during the
period of monitoring. - 4(100.0) - -
7. Instances of medical emergency
during the period of monitoring. - - - -
8. Availability of the first aid medical kit
in the school. 10(45.45) 12(54.55) 11(73.33) 4(26.67)
9. Dental and eye check-up included in
the screening. 2(50.00) 2(50.00) - -
10.
If yes, distribution of spectacles to
children suffering from refractive
error.
- 2(100.00) - -
Total No. of school 22(100.0) 15(100.0)
Source: Primary Data Based.
Drinking Water and Sanitation
Table 2.12 shows that in 86.36 percent primary and all sample middle schools
have potable water for drinking purposes in convergence with drinking water and
sanitation in Saharsa district. In 10.53 percent primary and 100.0 percent middle schools
water was available through India Marka Hand Pump and 89.47 percent primary schools
through local hand pump. 89.47 sample primary water supplies were done by SSA. 10.53

50
percent sample primary and 100.0 percent middle schools water supply was done by
PHED (Public Health Engineering Department).
Table 2.12: Drinking Water and Sanitation
Sl.No. Particulars
No. of Schools
PS MS
Yes No Yes No
1
Whether poTable water is available for
drinking purpose in convergence with
Drinking Water and Sanitation
19
(86.36)
3
(13.64)
15
(100.00) -
2
Available of
potable water
(Multiple
Response)
Tap water - -
India Marka Hand
pump 2(10.53) 15(100.00)
Local Hand pump 17(89.47) -
Jet Pump - -
3. Which
scheme
SSA Scheme 17(89.47) -
PHED 2(10.53) 15(100.00)
Total No. of School 22(100.0) 15(100.0)
Source: Primary Data Based.
Ceasefire Available in School
According to information it was found that 40.91 percent sample primary and
80.0 percent middle schools have ceasefire, as shown in Table 2.13.
Annexure 2.13 has the name of schools where ceasefire was not available.
Table 2.13: Ceasefire Available in School
Sl.No. Particulars
No. of Schools
PS MS
Yes No Yes No
1 Ceasefire Available 9(40.91) 13(59.09) 12(80.00) 3(20.00)
2. If yes, Name of ceasefire ABC and Millomax Source: Primary Data Based.
Kitchen Devices
The general information of kitchen devices available in the schools shows that
cooking utensils were available in 95.45 percent sample primary and all middle schools
of Saharsa district. It was found that 61.91 percent primary and 80.0 percent middle
schools had sufficient cooking utensils and rest school have unsfficient cooking utensils.
42.86 percent primary and 46.67 percent middle schools were funded for kitchen devices
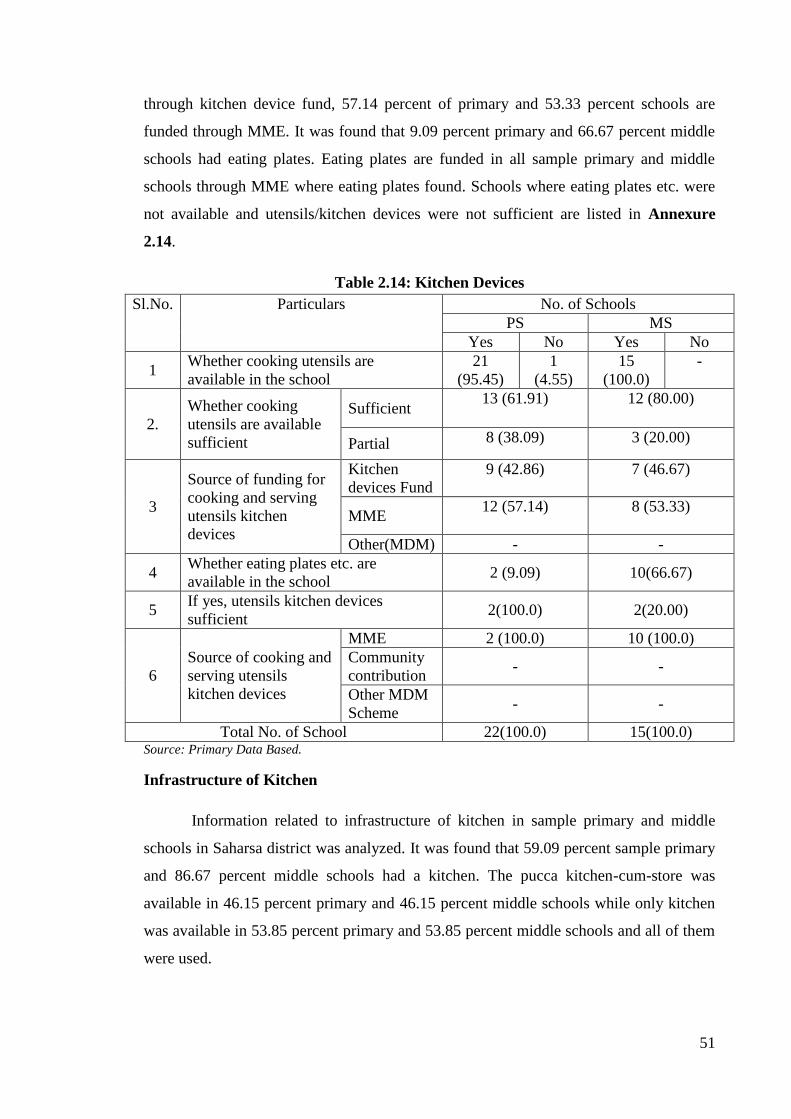
51
through kitchen device fund, 57.14 percent of primary and 53.33 percent schools are
funded through MME. It was found that 9.09 percent primary and 66.67 percent middle
schools had eating plates. Eating plates are funded in all sample primary and middle
schools through MME where eating plates found. Schools where eating plates etc. were
not available and utensils/kitchen devices were not sufficient are listed in Annexure
2.14.
Table 2.14: Kitchen Devices
Sl.No. Particulars No. of Schools
PS MS
Yes No Yes No
1 Whether cooking utensils are
available in the school
21
(95.45)
1
(4.55)
15
(100.0)
-
2.
Whether cooking
utensils are available
sufficient
Sufficient 13 (61.91) 12 (80.00)
Partial 8 (38.09) 3 (20.00)
3
Source of funding for
cooking and serving
utensils kitchen
devices
Kitchen
devices Fund
9 (42.86) 7 (46.67)
MME 12 (57.14) 8 (53.33)
Other(MDM) - -
4 Whether eating plates etc. are
available in the school 2 (9.09) 10(66.67)
5 If yes, utensils kitchen devices
sufficient 2(100.0) 2(20.00)
6
Source of cooking and
serving utensils
kitchen devices
MME 2 (100.0) 10 (100.0)
Community
contribution - -
Other MDM
Scheme - -
Total No. of School 22(100.0) 15(100.0) Source: Primary Data Based.
Infrastructure of Kitchen
Information related to infrastructure of kitchen in sample primary and middle
schools in Saharsa district was analyzed. It was found that 59.09 percent sample primary
and 86.67 percent middle schools had a kitchen. The pucca kitchen-cum-store was
available in 46.15 percent primary and 46.15 percent middle schools while only kitchen
was available in 53.85 percent primary and 53.85 percent middle schools and all of them
were used.

52
In 33.33 percent primary and 33.33 percent middle schools kitchen-cum-store
was constructed under MDM scheme, 42.86 percent middle schools kitchen was
constructed under MDM as shown in Table-2.15. In 66.67 percent primary and 66.67
percent middle schools kitchen-cum-store was constructed through SSA scheme. 100.0
percent primary and 57.14 percent middle schools kitchen was constructed through SSA
scheme. 7 primary schools and 2 middle schools prepared MDM in additional room. 2
primary school prepared food at the venu of villegers. In 72.73 percent primary and 60.0
percent middle schools have kitchen and store away from classrooms. In 95.15 percent
primary and all middle schools food is prepared firewood.
Annexure 2.15 contains the names of schools where kitchen is not available or
there was interruption is preparation of MDM due to non-availability of firewood or LPG
on any given day.
Table 2.15: Infrastructure of Kitchen
Sl.No. Particulars No. of Schools
PS MS
Kitchens are available 13(59.09) 13(86.67)
1 No. of school in which
pucca kitchen-cum store
available
Kitchen-cum –store 6(46.15) 6(46.15)
Kitchen 7(53.85) 7(53.85)
(a) No. of school in which
pucca kitchen constructed
and used
Kitchen-cum –store 6(100.0) 6(100.0)
Kitchen 7(100.0) 7(100.0)
(b) Under which scheme
Kitchen- cum-store
constructed
MDM Kitchen cum
store
2(33.33) 2(33.33)
Kitchen - 3(42.86)
SSA Kitchen cum
store
4(66.67) 4(66.67)
Kitchen 7(100.0) 4(57.14)
(c) Constructed but not in use - -
(d) Under construction - -
(e) Sanctioned, but not started - -
(f) Not sanctioned 9(40.91) 2(13.33)
2 In case the pucca kitchen-
cum store is not available,
where is the food being
cooked?
Additional Room 7(77.78) 2(100.0)
At the venu of villegers 2(22.22) -
3
Where the food grains/
other ingredients are
being stored?
Kitchen cum store 6(27.27) 6(40.00)
Kitchen - -
Additional Room 15(68.18) 9(60.00)
community hall 1(100.00) -

53
4
Kitchen-cum-store is neat
and cleaned
Kitchen cum store 6(27.27) 6(40.00)
Kitchen 7(31.82) 7(46.67)
Additional Room 7(31.82) 2(13.33)
At the venu of villegers 2(9.09) -
5 Is there kitchen & store away from class room of
school
16(72.73) 9(60.00)
6
Whether MDM is being
cooked by using firewood
or LPG based cooking?
Fire wood 21(95.15) 15(100.0)
Coal - -
LPG - -
7 Whether on any day there was interruption due to non-
availability of firewood or LPG?
1(4.76) -
Total No. of School 22(100.0) 15(100.0) Source: Primary Data Based.
Availability of Cover Drum
It was found that 90.91 percent primary and all sample middle schools have
covered drums for the food grains. In all sample primary and middle schools of these
covered drums available through MME scheme in Saharsa district. Annexure-2.16
shows that Non-availability of Covered Drum of Food Grains in School
Table 2.16: Availability of Cover Drum
Sl.No. Particulars No. of Schools
PS MS
Yes No Yes No
1 Availability of cover drum of food
grains in school
20
(90.91)
2
(9.09)
15
(100.0)
-
2. If yes, which
scheme
SSA through - -
Management,
Monitoring &
Evaluation
20 (100.0)
15 (100.0)
Total No. of Schools 22(100.0) 15(100.0)
Source: Primary Data Based.
Availability of Toilets
It was found that 54.55 percent primary and 86.67 percent middle schools have
separate toilet for boys and girls. Out of these, 66.67 percent primary and 92.31 percent
middle school use toilets properly. 36.36 percent primary and 26.67 percent middle
schools have common toilets.All primary and middle schools used its properly.
Annexure 2.17 contains the names of the sample primary and middle schools which do
not have separate toilets for boys and girls and common toilets, etc.

54
Table 2.17: Availability of Toilets
Sl.No. Particulars No. of Schools
PS MS
Yes No Yes No
1 Availability of separate toilet for
boys and girls in school
12(54.55) 10(45.45) 13(86.67) 2(13.33)
2. If yes, Proper use of toilet 8(66.67) 4(33.33) 12(92.31) 1(7.67)
3 Is there available common toilet 8(36.36) 14(63.64) 4(26.67) 11(73.33)
4 If yes, Proper use of toilet 8(100.0) - 4(100.0) -
Total No. of School 22 (100.0) 15 (100.0) Source: Primary Data Based.
IT Infrastructure (computer) in school
As Table 2.18 indicates only 20.0 percent middle schools have IT infrastructure
in school while others lack it. However, none of middle schools had an internet
connection and therefore none of them could be used for any IT based services like E-
Learning etc. None of the primary schools had any IT infrastructure.
Table 2.18: IT infrastructure available (Computer) School level
Sl.No. Particulars No. of Schools
PS MS
Yes No Yes No
1. Is computer available in school - - 3
(20.00)
12
(80.00)
2. If yes give the no. of computer - 5(100.0)
3. Available of internet connection - - - 3(100.0)
4. Using any IT/ IT enable services based
(like E-learning etc.)
- - 3(100.0)
Source: Primary Data Based.
Safety and Hygiene
Environment, safety and hygiene were found satisfactory in majority of the
primary and middle schools. As Table 2.19 shows environment was good in 22.73
percent of primary and 60.0 percent in middle schools. Safety was good in 9.09 percent
in primary and 46.67 percent in middle schools. The hygiene was observed to be in good
condition in 9.09 percent primary and 13.33 percent in middle schools. Environment was
satisfactory in 63.64 percent primary and 40.0 percent middle schools. Safety level was
satisfactory in 36.36 percent in primary and 33.33 percent middle schools. Hygiene level
was satisfactory in 72.73 percent in primary and 60.0 percent middle schools.
Environment was unsatisfactory in 13.64 percent primary schools. Safety level was

55
unsatisfactory in 54.55 percent in primary and 20.0 percent middle schools. Hygiene
level was unsatisfactory in 18.18 percent in primary and 26.67 percent middle schools.
Table 2.19: General Impression of Environment, Safety and Hygiene
Source: Primary Data Based.
Encouragement of Children to adopt Good Practices
In 68.18 percent primary and 100.0 percent middle schools, children were
encouraged to wash their hands before and after meals. Children were encouraged to
receive MDM in orderly manner in all sample primary and middle schools. In all sample
primary and 93.33 percent middle schools children were taught about conservation of
water. Cooking process and storage of fuel was found to be safe from fire hazard in
81.82 percent primary and 93.33 percent middle schools as shown in Table-2.20.
Schools where students did not wash their hands before and after eating and
where MDM was not served in an orderly manner are listed in Annexure 2.20.
Table 2.20: Encouragement of Children to adopt Good Practices
Source: Primary Data Based.
Sl. No
Particulars No. of Schools PS MS
Good Satisfactory Un
satisfactory Good Satisfactory
Un- satisfactory
1 Environment 5(22.73) 14(63.64) 3(13.64) 9(60.00) 6(40.00) - 2 Safety 2(9.09) 8(36.36) 12(54.55) 7(46.67) 5(33.33) 3(20.00) 3 Hygiene 2(9.09) 16(72.73) 4(18.18) 2(13.33) 9(60.00) 4(26.67) 4 Total No. of
School 22(100.0) 15(100.0)
Sl.
No.
Particulars No. of Schools
PS MS
Yes No Yes No
1 Children encouraged to wash hands
before and after eating
15(68.18) 7(31.82) 15(100.0) -
2 Children take MDM in an orderly 22(100.0) - 15(100.0) -
3 Conservation of water in school 22(100.0) - 14(93.33) 1(6.67)
4 Cooking process and storage of fuel
is safe from fire hazard.
18(81.82) 3(18.18) 14(93.33) 1(6.67)
5 Total No. of School 22 (100.0) 15(100.0)

56
Tasting Meals before Serving to Students
Before the meal was served to students it was tasted by the teachers were all
sample primary and middle schools. It was tasted seldom by SMC in all sample primary
schools and middle schools. It was tasted seldom by parents in all primary schools and
middle schools.
Table 2.21: Tasting Meals before Serving to Students
Source: Primary Data Based.
Community Participation and Awareness
Parents from 9.09 percent primary and 13.33 percent middle schools supervised
MDM on a daily basis and found it good. SMC/VSS supervised it in 13.64 percent
primary and 26.67 percent middle schools were good. Supervision by Panchayat/urban
bodies was found good in 13.33 percent middle school.
Parents from 72.73 percent primary and around 80.0 percent middle schools
supervised MDM on a daily basis and found it satisfactory. SMC/VSS supervised it in
72.72 percent primary and 66.67 percent middle schools were satisfactory. Supervision
by Panchayat/urban bodies was found satisfactory in 63.64 percent primary and 86.67
percent middle school.
In 9.09 percent parents of primary and 13.33 percent of middle schools
monitoring of MDM was found good. In case of SMC/VSS it was 13.64 percent in
primary and 26.67 percent in middle schools were good. Monitoring by Panchayat/urban
bodies was found good in 13.33 percent middle school.
In 72.73 percent parents of primary and 80.0 percent of middle schools monitoring of
MDM was found satisfactory. In case of SMC/VSS it was 72.72 percent in primary and
Sl.
No. Particulars
No. of Schools
PS MS
Daily Seldom Daily Seldom
1 Tasted by Teacher 22(100.0) - 15(100.0) -
2 Tasted by SMC - 22(100.0) - 15(100.0)
3 Tasted by Parents - 22(100.0) - 15(100.0)
Total No. of School 22 (100.0) 15 (100.0)

57
66.67 percent in middle schools were satisfactory. Monitoring by Panchayat/urban
bodies was found satisfactory in 68.18 percent primary and 86.67 percent middle school.
Table 2.22: Participation of Parents/VSS/Urban bodies in Monitoring of MDM
Sl.
No
Particulars PS MS
Parents VSS Panchayat/
Urban
bodies
Parents VSS Panchayat/
Urban bodies
Supervision of daily MDM
1 Good 2
(9.09)
3
(13.64)
- 2
(13.33)
4
(26.67)
2
(13.33)
2 Satisfactory 16
(72.73)
16
(72.72)
14
(63.64)
12
(80.00)
10
(66.67)
13
(86.67)
3 None 4
(18.18)
3
(13.64)
8
(36.36)
1
(6.67)
1
(6.7)
-
Monitoring of the MDM
1 Good 2
(9.09)
3
(13.64)
- 2
(13.33)
4
(26.67)
2
(13.33)
2 Satisfactory 16
(72.73)
16
(72.72)
15
(68.18)
12
(80.00)
10
(66.67)
13
(86.67)
3 None 4
(18.18)
3
(13.64)
7
(31.82)
1
(6.67)
1
(6.67)
-
4 Total No. of
school 22
(100.0)
15
(100.0) Source: Primary Data Based.
Awareness about MDM
It was found that community members maintained roster for supervision of MDM
in 72.73 percent primary and 53.33 percent in middle schools. Table 2.23 shows that all
sample primary and middle schools have social audit mechanism in the school. The list
of schools where roster was not being maintained by the community members for
supervision of the MDM is given in Annexure 2.23.
Table 2.23: Awareness regarding MDM
Sl.
No.
Particulars No. of Schools
PS MS
Yes No Yes No
1 Roster being maintained by the
community members for
supervision of the MDM
16
(72.73)
6
(27.27)
8
(53.33)
7
(46.67)
2 Is there any social audit
mechanism in the school
22
(100.0)
- 15
(100.0)
-
Source: Primary Data Based.

58
VSS Meetings
As Table 2.24 explains SMC/VSS meeting monitoring time was once or twice in
9.09 percent primary and 6.67 percent middle schools, three or four times was in 27.27
percent primary and 26.67 percent middle schools, 5 times and above in 63.64 percent
primary and 66.67 percent middle schools. MDM related discussion was for once or
twice in 40.91 percent primary and 46.67 percent middle schools, three to four times was
in 45.45 percent primary and 46.67 percent middle school, 5 times and above in 13.64
percent primary and 6.66 percent middle schools.
Table 2.24: SMC/VEC meetings
Sl.
No
.
Particular
s
PS MS
1-2 3-4 5 &
above
Total 1-2 3-4 5 &
above
Total
1. No. of
SMC/
VEC
meeting
till
monitorin
g time
2
(9.09)
6
(27.27)
14
(63.64)
22
(100.0)
1
(6.67)
4
(26.67)
10
(66.67)
15
(100.0)
2. No. of
SMC/VE
C meeting
to MDM
related
discussion
9
(40.91)
10
(45.45)
3
(13.64)
22
(100.0)
7
(46.67)
7
(46.67)
1
(6.66)
15
(100.0)
Total No.
of school
22 (100.0)
15 (100.0)
Source: Primary Data Based.
Inspection & Supervision
The regular inspection of MDM was reported in 95.45 percent primary schools
and 100.0 percent middle schools of the district. Inspection register was available at
school level in 68.18 percent primary schools and 80.0 percent middle schools. It has
been found that 95.45 percent primary and 100.0 percent middle schools have received
fund under MME component.
The list of schools where inspection register was not available and fund not received
under MME is given in Annexure 2.25

59
Table 2.25: Inspection and Supervision of MDM by Educational Authorities
Sl.No. Particulars No. of Schools
PS MS
Yes No Yes No
1 Is there any Inspection Register
available at school level?
15(68.18) 7(31.82) 12 (80.0) 3(20.0)
2 Whether school has received any
funds under MME component?
21(95.45) 1(4.55) 15(100.0) -
3 Is regular inspections of MDM 21(95.45) 1(4.55) 15(100.0) -
Source: Primary Data Based.
Inspection and Supervision of MDM
Regular inspection of the MDM food was be done in all sample primary and
middle schools of the district. The inspection was also done by the BEO, MDM BRP,
CRC Coordinator, DPO, District MDM Officer and VEC. As Table 2.26 shows all
sample primary schools and middle schools maximum inspection and supervision were
done by CRC Coordinator in Saharsa district. There was no state level inspecting
authorities. Maximum inspections were made by Block level authorities in primary and
middle school. Mostly this inspection was made monthly in both categories of schools.
The visiting authorities remarked for menu based food and told Good Quality of
MDM should be provided in all sample primary schools and middle schools.
Table 2.26: Inspections and Supervision of MDM (Multiple Responses)
Sl.No. Particulars No. of Schools
PS MS
1 Regular inspection of the MDM food 22(100.0) 15(100.0)
2 Inspection by
DPO 12 (16.0) 9(16.07)
District MDM Officer 8 (10.66) 5(8.92)
MDM BRP 10(13.33) 10(17.85)
BEO 17(22.66) 11(19.64)
CRC Coordinator 21(28.0) 15(26.78)
VSS 7(9.33) 6(10.71)
3 Inspecting authority
State level - -
District 20(26.66) 14 (25.0)
Tehsil - -
Block 27(36.0) 21(37.5)
CRC 21 (28.0) 15 (26.78)
Village 7(9.33) 6 (10.71)
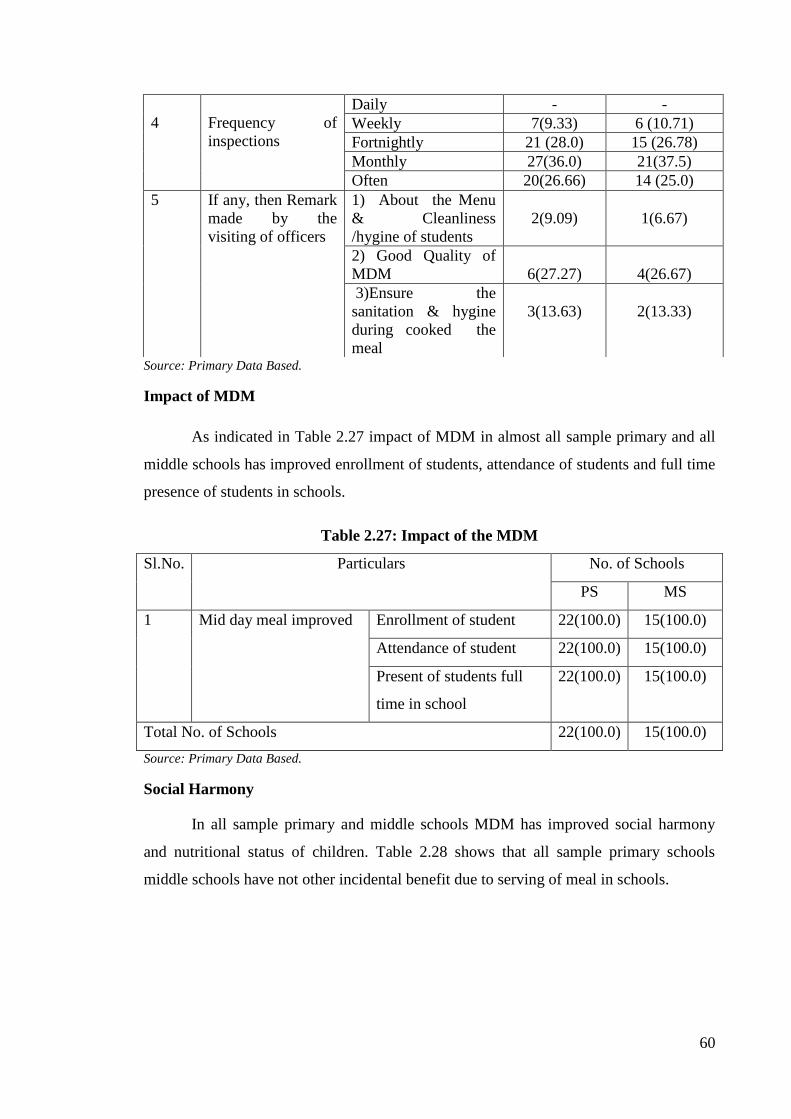
60
Source: Primary Data Based.
Impact of MDM
As indicated in Table 2.27 impact of MDM in almost all sample primary and all
middle schools has improved enrollment of students, attendance of students and full time
presence of students in schools.
Table 2.27: Impact of the MDM
Sl.No. Particulars No. of Schools
PS MS
1 Mid day meal improved Enrollment of student 22(100.0) 15(100.0)
Attendance of student 22(100.0) 15(100.0)
Present of students full
time in school
22(100.0) 15(100.0)
Total No. of Schools 22(100.0) 15(100.0)
Source: Primary Data Based.
Social Harmony
In all sample primary and middle schools MDM has improved social harmony
and nutritional status of children. Table 2.28 shows that all sample primary schools
middle schools have not other incidental benefit due to serving of meal in schools.
4
Frequency of
inspections
Daily - -
Weekly 7(9.33) 6 (10.71)
Fortnightly 21 (28.0) 15 (26.78)
Monthly 27(36.0) 21(37.5)
Often 20(26.66) 14 (25.0)
5 If any, then Remark
made by the
visiting of officers
1) About the Menu
& Cleanliness
/hygine of students
2(9.09)
1(6.67)
2) Good Quality of
MDM
6(27.27)
4(26.67)
3)Ensure the
sanitation & hygine
during cooked the
meal
3(13.63)
2(13.33)

61
Table 2.28: Social Harmony
Sl.No. Particulars No. of Schools
PS MS
Yes No Yes No
1 Whether mid day meal has helped
in improvement of the social
harmony
22(100.0) - 15(100.0) -
2 Whether mid day meal has helped
in improvement of the nutritional
status of the children.
22(100.0) - 15(100.0) -
3 Is there any other incidental
benefit due to serving of meal in
schools
- 22(100.0) - 15(100.0)
Source: Primary Data Based.
Grievance Redressal Mechanism
As Table 2.29 indicates that all sample primary and middle schools have
grievances redressal mechanism in the district for MDMs and all sample primary and
middle schools have the district/block and school have not toll free number.
Table 2.29: Grievance Redressal Mechanisms
Sl.No. Particulars No. of Schools
PS MS
Yes No Yes No
1 Is any grievance redressal
mechanism in the district for
MDMS
22(100.0) - 15(100.0) -
2 Whether the district/block/ school
having any toll free number?
- 22(100.0) - 15(100.0)
Source: Primary Data Based.
Views of Investigator on other Issues of MDM Implementation
The investigators opined that monitoring and evaluation of MDM team should be
regular in 54.55 percent primary schools and 66.67 percent middle schools. Use of wheat
should be increased in 27.27 percent primary schools and 26.67 percent middle schools.
LPG should be used for cooking in majority primary and middle schools and convenient
arrangement should be made for its availability. Use of green vegetables must be
encouraged in 22.73 percent primary and 40.0 percent middle schools in Saharsa districts
as shown in (Table-2.30).

62
Table 2.30: Investigator’s views and observations regarding MDM
Sl.No. Issues relevant to MDM implementation No. of Schools
PS MS
1 Monitoring & Evaluation of MDM team should be
regular
12(54.55) 10 (66.67)
2 Arrangement and availability of LPG for cooking
purpose
16(72.73) 12(80.00)
3 Use of wheat of MDM 6(27.27) 4(26.67)
4 Use of Green VegeTable must be used in MDM 5(22.73) 6 (40.0)
Total No. of Schools 22 (100.0) 15(100.0)
Source: Primary Data Based.

63
Chapter-III
Major Findings
Monitoring and evaluation of Sarva Shiksha Abhiyan (SSA) was conducted by the
Giri Institute of Development Studies, Lucknow during 15 March to 31 March, 2015.
The survey covered 22 primary schools and 15 middle schools in the Saharsa district as
suggested by the Ministry of Human Resource Development, Department of School
Education and Literacy, Government of India. Besides monitoring and evaluation of SSA
programme in the district, the working of MDM was also monitored and evaluated. The
focus of monitoring of MDM was limited to cover only key components of the MDM
programme. These components of MDM monitoring and evaluations were selected by
the Ministry. On the basis of field survey of primary and middle schools where MDM is
being implemented, following conclusions have been arrived at:
17(77.27 percent) sample primary schools and 10(66.67 percent) middle schools
reported to have received food grains within one month and its quality was good.
There was 20(100.0 percent) sample primary schools and 15(100.0 percent)
middle schools reported timely release of MDM funds from state, 21(95.45
percent) sample primary schools and 14(93.33 percent) middle schools reported
timely release of MDM funds from district and 22(100.0 percent) sample primary
schools and 14(93.33 percent) middle schools reported timely release of MDM
funds from the block.
There were 20(90.91 percent) primary schools and 13(86.67 percent) middle
schools reported to have received MDM fund in advance and regularly.
Due to unavailability of food grains etc in 7 PS 2 MS in few days of last three
months food not served to the students.
It was found that all sample primary schools and all middle schools hot cooked
meal was provided to students regularly. This fact was confirmed from students,
teachers, parents and from MDM registers of the concerning schools.
There was no difference between the number of students for whom the MDM
was prepared and those who got the MDM.

64
There was no difference between MDM registers and head count of students on
the day of visit of research team to the sample schools.
MDM was cooked by VEC/SMC appointed cooks. Majority of cooks were of
OBC castes and they were paid monthly salary of Rs.1000/ regularly through the
banks.
Discrimination was not found in cooking, serving of food and seating
arrangement.
The meal was tasted by the teachers before it was served to the students.
The MDM was served by cooks and the students received MDM in queue.
The menu was displaced at noticeable places in all primary schools and percent
middle schools and all schools followed the menu.
MDM logo was not displayed on any sample primary schools and middle schools
buildings.
The prescribed quantity of MDM was given to students and was found to be
sufficient. The quality of MDM was found to be ‘Normal’ in 18(81.82 percent)
primary and 10(66.67 percent) middle schools.
Health card of students were maintained in 4(18.18 percent) primary schools.
Likewise Iron Folic Acid and Vitamins were given to the majority of students.
The availability of potable water through Local hand pumps was found in almost
all primary and India Marka hand pumps was found all middle schools.
Kitchens were available in only 13(59.09 percent) primary and 13(86.67 percent)
middle schools. In all the sample primary and middle schools, food was cooked
using maximum fire wood.
The kitchen utensils were available in 21(95.45 percent) primary and all sample
middle schools.

65
The availability of covered drums was found in 20(90.91 percent) primary and
15(100.0 percent) middle schools. Cover drums were reported to have been
purchased from funds of MME Scheme.
Separate toilets for boys and girls were available in 12(54.55 percent) primary
and 13(86.67 percent) middle schools.
The IT infrastructure was available in only 3(20.0 percent) middle schools.
The condition of environment, safety and hygiene was satisfactory in almost all
primary schools and good in almost all middle schools.
It was observed that students were encouraged to wash their hand before and after
the meal. The students were seen receiving the MDM in queue in almost all the
schools. The practice of water conservation was seen in the schools and cooking
process and storage of fuel were found to be safe from fire hazards in almost all
schools.
The awareness of parents and community about MDM was found to be
satisfactory in most of the schools.
The number of VEC meetings relating to MDM was frequent.
Inspection and supervision by district officials on often basis covered in
21(95.45) primary and 15(100.0 percent) middle schools. Process of inspection,
supervision of MDM was found to be adequate.
It was observed that MDM was helpful in improving the social harmony. The
grievance redressal mechanism was active and maximum schools having no toll
free number.
The impact of MDM was found to be positive in all sample primary and middle
schools. MDM has improved enrollment of students, attendance of students and
full time presence of students in all 22(100 percent) primary and 15(100 percent)
middle schools.
The views of investigators about different aspect of implementation of MDM in
the district were not found to be positive.

66

66
ANNEXURE
Annexure 2.1
Schools in which Food Grains Facility not available within One Month
Primary School
1 Primary Maqtab Bhoraha 4 Urdu Primary Maqtab Usrahi
2 P.S.Simari Harizan Colony 5 P.S. Ganga Prasad
3 P.S. Rani Bag
Middle School
1 M.S. Koshi Colony 4 M.S. Bali Teghara
2 M.S.Gopal Balwahat 5 M.S.Barah Sher
3 Urdu Kanya M.S. Panch
Bighi
Food Grains not delivered to Lifting Agency within Proper Time
Primary School
1 Primary Maqtab Bhoraha 4 Urdu Primary Maqtab Usrahi
2 P.S.Simari Harizan Colony 5 P.S. Ganga Prasad
3 P.S. Rani Bag
Middle School
1 M.S. Koshi Colony 4 M.S. Bali Teghara
2 M.S.Gopal Balwahat 5 M.S.Barah Sher
3 Urdu Kanya M.S. Panch
Bighi
Annexure 2.4
Number of schools in which cooks were sufficient in number as per GOI
Primary School
1 N.P.S. Naya Bazar 5 P.S. Sapatiyahi
2 P.S. Sarahi 6 P.S. Lalganj
3 P.S. Rani Bag 7 N.P.S. Navtol
4 P.S. Ganga Prasad 8 P.S. Shahu Tola
Middle School
1 Govt. M.S. D.B. Colony 6 M.S.Barah Sher
2 M.S.Buchchan Shah 7 U.M.S.Dumara
3 M.S.Arakshi Kendra 8 U.M.S.Manauri
4 M.S. Sardiha 9 Adarsh M.S. Shahpur Aanchal
5 M.S. Haqpada
Annexure 2.5
In Last three months, few days food not served due to Various Reasons
Primary School
1. P.S.Simari Harizan Colony 5. P.S. Sapatiyahi
2. P.S. Rani Bag 6 P.S.Bhelwa
3. P.S.Ganj 7 P.S. Gadery Tola
4. Urdu Primary Maqtab
Usrahi
Middle School
1. Urdu Kanya M.S. Panch
Bighi
2. U.M.S.Dumara
Annexure 2.8
MDM Logo not Displayed on School Building
Primary School
1 N.P.S. Radhanagar 12 P.S. Ganga Prasad
2 N.P.S. Dumrail 13 P.S. Sapatiyahi

67
3 N.P.S. Naya Bazar 14 P.S.Bhelwa
4 P.S. Gangjala 15 P.S. Lalganj
5 P.S. Sarahi 16 P.S.Patori
6 Primary Maqtab Bhoraha 17 N.P.S. Navtol
7 P.S.Simari Harizan Colony 18 P.S. Gadery Tola
8 P.S. Rani Bag 19 N.P.S. Paswan Tola
9 P.S.Ganj 20 P.S. Shahu Tola
10 N.P.S. Badiya Harizan Tola 21 N.P.S. Gwalpada
11 Urdu Primary Maqtab Usrahi 22 Kanya P.S. Bhada
Middle School
1 Govt. M.S. D.B. Colony 9 M.S. Bali Teghara
2 M.S. Koshi Colony 10 M.S. Haqpada
3 M.S.Buchchan Shah 11 M.S.Barah Sher
4 M.S.Arakshi Kendra 12 U.M.S.Dumara
5 M.S. Sardiha 13 U.M.S.Manauri
6 U.M.S.Jamuniya 14 Adarsh M.S. Shahpur Aanchal
7 M.S.Gopal Balwahat 15 Kanya M.S. Badivan
8 Urdu Kanya M.S. Panch Bighi
Annexure 2.11
Health Card not Maintained for each Child in School
Primary School Middle School
1. N.P.S. Radhanagar 1 Govt. M.S. D.B. Colony
2. P.S. Gangjala 2 M.S. Koshi Colony
3 Primary Maqtab Bhoraha 3 M.S.Buchchan Shah
4 P.S.Simari Harizan Colony 4 M.S.Arakshi Kendra
5 P.S. Rani Bag 5 M.S. Sardiha
6 P.S.Ganj 6 U.M.S.Jamuniya
7 N.P.S. Badiya Harizan Tola 7 M.S.Gopal Balwahat
8 Urdu Primary Maqtab
Usrahi
8 Urdu Kanya M.S. Panch Bighi
9 P.S. Ganga Prasad 9 M.S. Bali Teghara
10 P.S. Sapatiyahi 10 M.S. Haqpada
11 P.S.Bhelwa 11 M.S.Barah Sher
12 P.S. Lalganj 12 U.M.S.Dumara
13 P.S.Patori 13 U.M.S.Manauri
14 N.P.S. Navtol 14 Adarsh M.S. Shahpur Aanchal
15 P.S. Gadery Tola 15 Kanya M.S. Badivan
16 N.P.S. Paswan Tola
17 P.S. Shahu Tola
18 Kanya P.S. Bhada
First aid Medical Kit not available in the School
Primary School
1. N.P.S. Radhanagar 7 P.S. Ganga Prasad
2. N.P.S. Dumrail 8 P.S. Sapatiyahi
3. Primary Maqtab Bhoraha 9 N.P.S. Navtol
4. P.S. Rani Bag 10 P.S. Gadery Tola
5. P.S.Ganj 11 N.P.S. Gwalpada
6. N.P.S. Badiya Harizan Tola 12 Kanya P.S. Bhada
Middle School
1. M.S.Gopal Balwahat 3 M.S.Barah Sher
2 M.S. Bali Teghara 4 Adarsh M.S. Shahpur Aanchal

68
No Dental and Eye Check-up
Primary School
1. N.P.S. Dumrail
2. N.P.S. Gwalpada
Annexure 2.13
Cease fire not available
Primary School
1 N.P.S. Radhanagar 8 P.S.Ganj
2 N.P.S. Dumrail 9 N.P.S. Badiya Harizan Tola
3 N.P.S. Naya Bazar 10 Urdu Primary Maqtab Usrahi
4 P.S. Gangjala 11 N.P.S. Navtol
5 P.S. Sarahi 12 P.S. Gadery Tola
6 P.S. Sapatiyahi 13 N.P.S. Gwalpada
7 P.S.Simari Harizan Colony
Middle School
1 M.S. Koshi Colony 3 Adarsh M.S. Shahpur Aanchal
2 M.S. Haqpada
Annexure 2.14
Cooking Utensils are not available
1 P.S.Bhelwa
Eating Plates etc. are not available
Primary School
1 N.P.S. Radhanagar 11 P.S. Sapatiyahi
2 N.P.S. Dumrail 12 P.S.Bhelwa
3 N.P.S. Naya Bazar 13 P.S. Lalganj
4 P.S. Gangjala 14 P.S.Patori
5 P.S. Sarahi 15 N.P.S. Navtol
6 Primary Maqtab Bhoraha 16 P.S. Gadery Tola
7 P.S.Simari Harizan Colony 17 N.P.S. Paswan Tola
8 P.S. Rani Bag 18 P.S. Shahu Tola
9 P.S.Ganj 19 N.P.S. Gwalpada
10 Urdu Primary Maqtab Usrahi 20 Kanya P.S. Bhada
Middle School
1 M.S.Arakshi Kendra 4 Adarsh M.S. Shahpur Aanchal
2 U.M.S.Dumara 5 Kanya M.S. Badivan
3 U.M.S.Manauri
Annexure 2.15
Sr .no Name of Schools Kitchen Not
Available
Additional
Room
At the Venue of
Villagers
Primary School
1 N.P.S. Radhanagar
2 N.P.S. Dumrail
3 P.S. Gangjala
4 P.S. Sarahi
5 P.S. Rani Bag
6 P.S. Sapatiyahi
7 N.P.S. Gwalpada
8 P.S. Lalganj
9 N.P.S. Navtol

69
Middle School
1 Govt. M.S. D.B. Colony
2 M.S. Koshi Colony
Annexure 2.16
Non-availability of Covered Drum of Food Grains in School
Primary Schools
1. P.S. Sapatiyahi
2. P.S.Bhelwa
Annexure 2.17: Non-availability of Toilets
Sr
.no
Name of the Schools No
separate
toilet for
Girls &
Boys
No Proper
use of
Toilets
No Common
Toilet
available
No Proper
Maintained
Primary School
1 N.P.S. Radhanagar
2 N.P.S. Dumrail
3 N.P.S. Naya Bazar
4 P.S.Simari Harizan Colony
5 P.S. Rani Bag
6 P.S.Ganj
7 P.S. Lalganj
8 N.P.S. Navtol
9 P.S. Shahu Tola
10 N.P.S. Gwalpada
11 P.S. Gangjala
12 Primary Maqtab Bhoraha
13 N.P.S. Badiya Harizan Tola
14 Urdu Primary Maqtab Usrahi
15 P.S. Sapatiyahi
16 P.S.Bhelwa
17 P.S. Gadery Tola
18 N.P.S. Paswan Tola
19 Kanya P.S. Bhada
Middle School
1 M.S.Buchchan Shah
2 U.M.S.Dumara
3 M.S. Koshi Colony
4 U.M.S.Jamuniya
5 M.S.Gopal Balwahat
6 Urdu Kanya M.S. Panch
Bighi
7 M.S. Bali Teghara
8 M.S. Haqpada
9 M.S.Barah Sher
10 U.M.S.Manauri
11 Adarsh M.S. Shahpur
Aanchal
12 Kanya M.S. Badivan

70
Annexure 2.20
Children does not encouraged to wash hand before and after eating
Sl. No. Primary Schools
1 N.P.S. Radhanagar 5 N.P.S. Paswan Tola
2 P.S.Simari Harizan Colony 6 P.S. Shahu Tola
3 P.S. Rani Bag 7 Kanya P.S. Bhada
4 P.S.Ganj
Annexure 2.23
Roster not being maintained by the Community Members for Supervision of MDM
Sl. No. Primary School
1. N.P.S. Radhanagar 4. P.S. Ganga Prasad
2. Primary Maqtab Bhoraha 5. N.P.S. Gwalpada
3. N.P.S. Badiya Harizan Tola 6. Kanya P.S. Bhada
Middle School
1. Govt. M.S. D.B. Colony 5. Urdu Kanya M.S. Panch Bighi
2. M.S. Koshi Colony 6. M.S. Bali Teghara
3. M.S.Buchchan Shah 7. M.S.Barah Sher
4. M.S.Gopal Balwahat
Annexure 2.25
Sl. No. Name of Schools No any Inspection
Register available at
school level.
School has not received any
funds under MME
Component?
Primary School
1 N.P.S. Radhanagar
2 P.S.Simari Harizan Colony
3 P.S. Rani Bag
4 P.S.Ganj
5 N.P.S. Badiya Harizan Tola
6 P.S. Shahu Tola
7 Kanya P.S. Bhada
8 P.S. Ganga Prasad
Middle School
1 Govt. M.S. D.B. Colony
2 M.S.Buchchan Shah
3 Urdu Kanya M.S. Panch
Bighi

71

66
District: 3. Khagaria

67
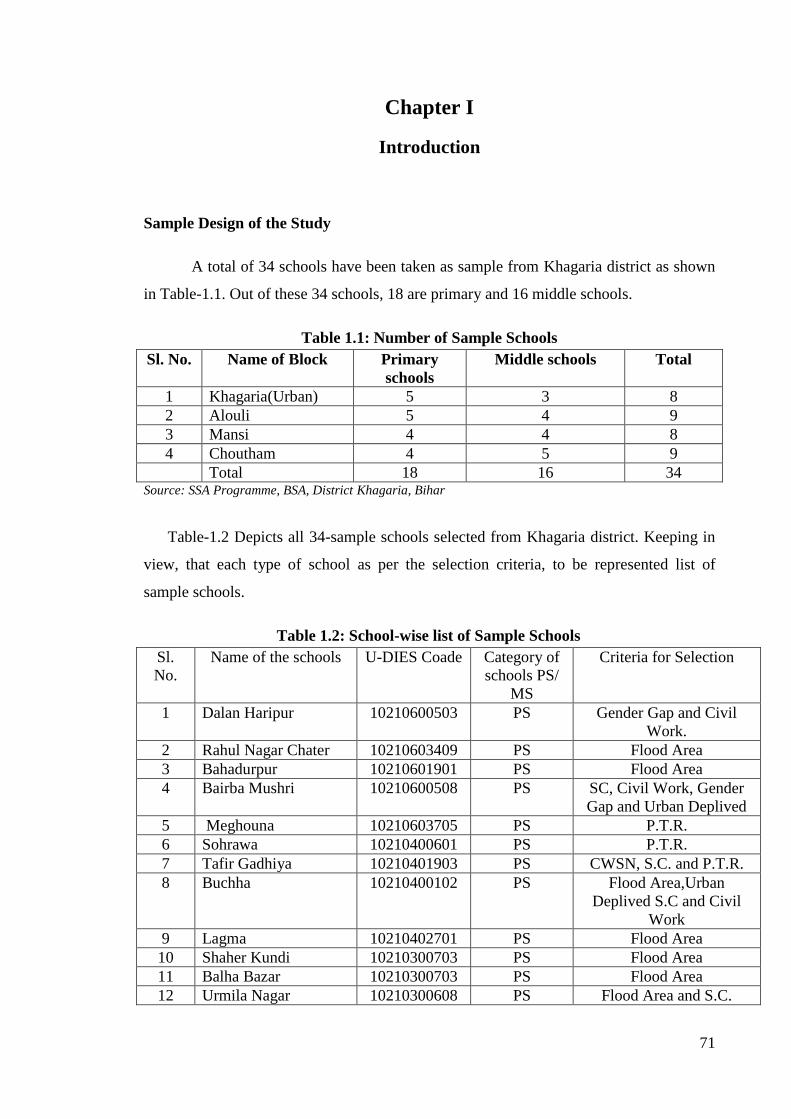
71
Chapter I
Introduction
Sample Design of the Study
A total of 34 schools have been taken as sample from Khagaria district as shown
in Table-1.1. Out of these 34 schools, 18 are primary and 16 middle schools.
Table 1.1: Number of Sample Schools
Sl. No. Name of Block Primary
schools
Middle schools Total
1 Khagaria(Urban) 5 3 8
2 Alouli 5 4 9
3 Mansi 4 4 8
4 Choutham 4 5 9
Total 18 16 34 Source: SSA Programme, BSA, District Khagaria, Bihar
Table-1.2 Depicts all 34-sample schools selected from Khagaria district. Keeping in
view, that each type of school as per the selection criteria, to be represented list of
sample schools.
Table 1.2: School-wise list of Sample Schools
Sl.
No.
Name of the schools U-DIES Coade Category of
schools PS/
MS
Criteria for Selection
1 Dalan Haripur 10210600503 PS Gender Gap and Civil
Work.
2 Rahul Nagar Chater 10210603409 PS Flood Area
3 Bahadurpur 10210601901 PS Flood Area
4 Bairba Mushri 10210600508 PS SC, Civil Work, Gender
Gap and Urban Deplived
5 Meghouna 10210603705 PS P.T.R.
6 Sohrawa 10210400601 PS P.T.R.
7 Tafir Gadhiya 10210401903 PS CWSN, S.C. and P.T.R.
8 Buchha 10210400102 PS Flood Area,Urban
Deplived S.C and Civil
Work
9 Lagma 10210402701 PS Flood Area
10 Shaher Kundi 10210300703 PS Flood Area
11 Balha Bazar 10210300703 PS Flood Area
12 Urmila Nagar 10210300608 PS Flood Area and S.C.

72
Sl.
No.
Name of the schools U-DIES Coade Category of
schools PS/
MS
Criteria for Selection
13 Dharmchak 10210300411 PS CWSN and P.T.R
14 Dantola 10210104204 PS CWSN
15 Durgasthan Babugang 10210014301 PS S.C
16 Railway No-2 10210104202 PS CWSN
17 Mil Road 10210100401 PS Slum Area
18 Sanhouli 10210100502 PS S.C
19 Tofir Gadhiya 10210401902 MS Civil Work and CWSN
20 Thuddi 10210400901 MS P.T.R.
21 Bhutouli Malpa 10210402801 MS Computer
22 Paharchak 10210402101 MS Flood Area and P.T.R
23 Pipra 10210402201 MS Flood Area and CWSN
24 Sonversha Ghat 10210400801 MS Flood Area
25 Kamathan 10210602604 MS CWSN
26 Dighni 10210603601 MS S.C
27 Haripur 10210600501 MS P.T.R.
28 Hajipur Utter 10210104901 MS Civil Work
29 Baluahi 10210105103 MS Computer
30 Hajipur Awas Board 10210105106 MS Gender Gap CWSN and
Civil Work
31 Amni 10210300501 MS Computer
32 Matihani 10210300202 MS Flood Area
33 Saidpur 10210300601 MS Flood Area and Civil
Work
34 Balha Saidpur 10210300701 MS P.T.R. Source: BSA Office, SSA Programme, District Khagaria, Bihar
Tools
A well-structured questionnaire was prepared to collect primary data from the
selected primary and middle schools.

73
Chapter-II
Implementation of MDM Programme
Regularity in Supply of Food Grains:
Table 2.1 shows that all sample primary and middle schools from the sample
were receiving food grains within one month. It was also found that the food grains were
delivered to the lifting agency within proper time in all sample primary and middle
schools. It has also been observed that the quality of food supplied was as per FAQ mark
in all sample primary and middle schools (Table: 2.1). In all sample schools, food grains
were released after adjusting the unspent balance grains of the previous month.
Table 2.1: Regularity in supply of Food Grains to Schools
Sl.
No. Particulars
No. of Schools
PS MS
Yes No Yes No
1. If Food grains facility available in
schools within One month 18(100.0) - 16(100.0) -
2. Food grains delivered to lifting
agency within proper time 18(100.0) - 16(100.0) -
3.
If lifting agency is not delivering
the food grains to the school how
is the food grains transported up to
the schools.
- -
4. Whether the food grains is of FAQ
Mark - grade A 18(100.0) - 16(100.0) -
5.
Whether food grains are released
to school after adjusting the
unspent balance of the previous
month
18(100.0) - 16(100.0) -
Total No. of Schools 18 (100.0) 16 (100.0) Note: Figures in brackets indicate percentage to total
Source: Survey conducted in the Sample Schools using the structured schedule.
Timely Release of Funds:
It was found that a timely release of funds was done regularly by state, district
and block-level in all samples primary and middle schools of the district, as shown in
Table-2.2.

74
Table 2.2: Timely Release of Funds
S.
No Particulars
No. of Schools
PS MS
1 Whether State is releasing funds to District on regular
basis in advance 18(100.0) 16(100.0)
2 Whether District is releasing funds to Block on regular
basis in advance 18(100.0) 16(100.0)
3 Whether Block is releasing funds to School on regular
basis in advance 18(100.0) 16(100.0)
Total No. of schools 18(100.0) 16(100.0)
Note: Figures in brackets indicate percentage to total
Source: Survey conducted in the Sample Schools using the structured schedule.
Cost of Cooking Received
It was found that all sample primary and middle schools were receiving cooking
cost regularly and in advance. As shown in Table-2.3, it was also found that E-transfer
was the preferred mode of payment for the cooking cost in all schools.
Table 2.3: Availability of Cooking Cost
S.
No Particulars
No. of Schools
PS MS
1 No. of schools in which cooking cost was received
regularly and in advance 18(100.0) 16(100.0)
2
How much delay in receiving the
cooking cost in advance
10 days - -
20 days - -
2 Months - -
4
In case of delay, how does the school/implementing
agency manages to ensure that there is no disruption in
the feeding programme
- -
5
Mode of payment of cooking Cost In cash - -
By Cheque - -
E-Transfer 18(100.0) 16(100.0)
Total No. of schools 18(100.0) 16(100.0)
Note: Figures in brackets indicate percentage to total
Source: Survey conducted in the Sample Schools using the structured schedule.
Information Regarding Cooks
It was found that in all sample primary and middle schools, MDM was being
served by the appointed cook-cum-helper, 50 in primary and 68 in middle schools. In all
sample primary and middle schools the number cooks were sufficient as per GOI norms.
The cooks were mostly female and their salary was Rs. 1000/ per month. The salary of

75
the cooks was paid through the cheques. Out of total appointed cooks, the share of
general cooks appointed only 2.94 percent in middle schools. The OBC cooks were
found about 64 percent in primary and 75 percent in middle schools. The SC cooks were
about 36 percent in primary and 22.06 percent in middle schools as evident from Table-
2.4.
A training module for the cook-cum-helpers is available in all sample primary
and middle schools. This module is provided to all the cooks. The MDM Coordinator in
all sample primary and middle schools imparts training to the working cook-cum-
helpers. Medical check-up of the cooks was done in all sample primary and middle
schools.
Table 2.4: Availability of Cook-cum-helpers
Sl.No. Particulars No. of Schools
PS MS
1 Mode of appointment of cook-
cum-helper in Schools
By VEC/SMC 18 (100.0) 16 (100.0)
2 Number of schools in which cooks were sufficient in
number as per GOI
18 (100.0) 16 (100.0)
3 No. of Cooks in schools
Male 4(8.00) 3(4.41)
Female 46(92.00) 65(95.59)
Total 50(100.0) 68(100.0)
4 Monthly salary of cook Rs. 1000/- per
month
50(100.0) 68(100.0)
Rs. 2000/- per
month
- -
5 Mode of Payment
By Cheque 50(100.0) 68(100.0)
6 Payment is regular Yes 50(100.0) 68(100.0)
No - -
7
No. of cooks per social category
1. SC 18(36.00) 15(22.06)
2. ST - -
3 .OBC 32(64.00) 51(75.00)
4 .Minority - -
5. Others(GEN) - 2(2.94)
8. Availability of Training Modules
for Cooks
Yes 50(100.0) 68(100.0)
No - -
9. If Yes, provided modules Yes 50(100.0) 68(100.0)
No - -
10. Training of Cooks Yes 50(100.0) 68(100.0)
No - -
11.
If Yes, what was the training
venue
BRC 50(100.0) 68(100.0)
CRC - -
Any other - -
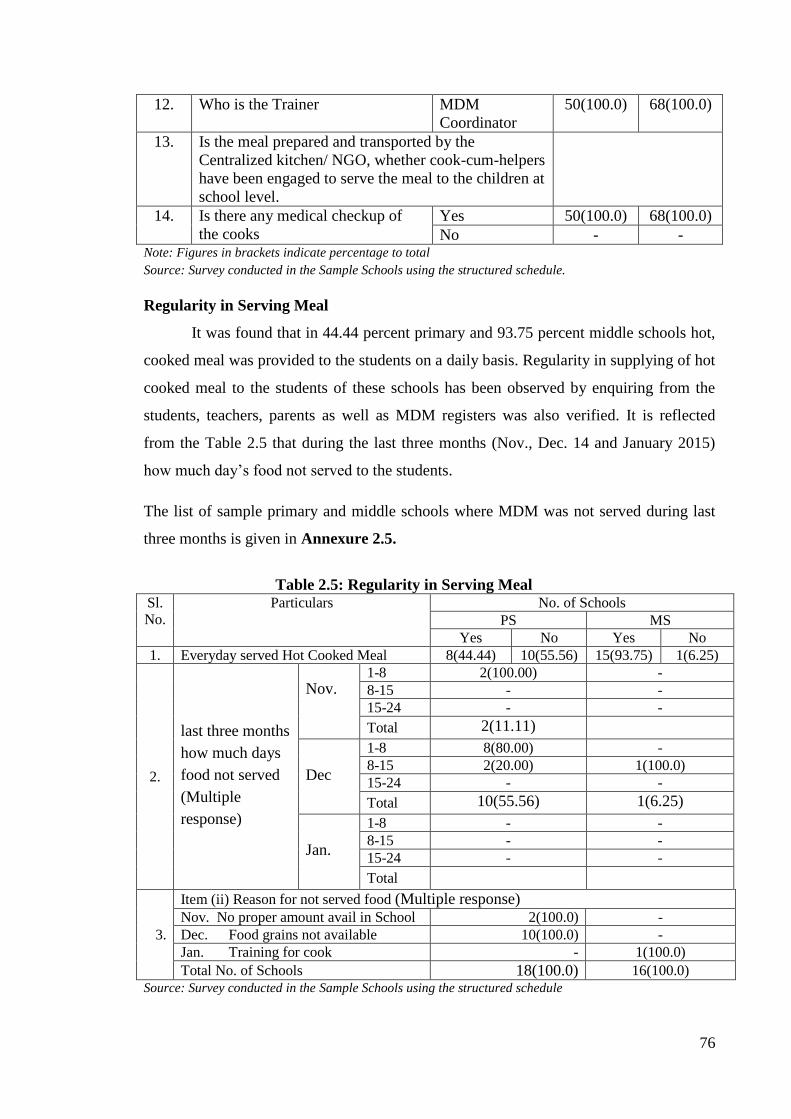
76
12. Who is the Trainer MDM
Coordinator
50(100.0) 68(100.0)
13. Is the meal prepared and transported by the
Centralized kitchen/ NGO, whether cook-cum-helpers
have been engaged to serve the meal to the children at
school level.
14. Is there any medical checkup of
the cooks
Yes 50(100.0) 68(100.0)
No - - Note: Figures in brackets indicate percentage to total
Source: Survey conducted in the Sample Schools using the structured schedule.
Regularity in Serving Meal
It was found that in 44.44 percent primary and 93.75 percent middle schools hot,
cooked meal was provided to the students on a daily basis. Regularity in supplying of hot
cooked meal to the students of these schools has been observed by enquiring from the
students, teachers, parents as well as MDM registers was also verified. It is reflected
from the Table 2.5 that during the last three months (Nov., Dec. 14 and January 2015)
how much day’s food not served to the students.
The list of sample primary and middle schools where MDM was not served during last
three months is given in Annexure 2.5.
Table 2.5: Regularity in Serving Meal Sl.
No.
Particulars No. of Schools
PS MS
Yes No Yes No
1. Everyday served Hot Cooked Meal 8(44.44) 10(55.56) 15(93.75) 1(6.25)
2.
last three months
how much days
food not served
(Multiple
response)
Nov.
1-8 2(100.00) -
8-15 - -
15-24 - -
Total 2(11.11)
Dec
1-8 8(80.00) -
8-15 2(20.00) 1(100.0)
15-24 - -
Total 10(55.56) 1(6.25)
Jan.
1-8 - -
8-15 - -
15-24 - -
Total
3.
Item (ii) Reason for not served food (Multiple response) Nov. No proper amount avail in School 2(100.0) -
Dec. Food grains not available 10(100.0) -
Jan. Training for cook - 1(100.0)
Total No. of Schools 18(100.0) 16(100.0)
Source: Survey conducted in the Sample Schools using the structured schedule

77
Quality and Quantity of Menu
The quality and quantity of MDM was examined and it was found that in all sample
primary and middle schools the quality of meal was good. The quantity of the meal
supplied was sufficient in all sample primary and middle schools. It was found that all
selected primary and middle schools were providing the prescribed quantity of mid day
meal to students (Table 2.6).
Table 2.6: Quality and Quantity of Meal
Sl.
No. Particulars
No. of Schools
PS MS
1.
Quality of meal
Good 18(100.0) 16(100.0)
Normal - -
Bad - -
2.
Quantity of meal
Sufficient 18(100.0) 16(100.0)
Normal - -
Less - -
3. Quantity of pulses used in the meal
(20 gram/student PS and 30gram/student MS)
18(100.0) 16(100.0)
4. Quantity of green leafy vegetable in the meal
(50 gram/student PS and 75 gram/student MS)
18(100.0) 16(100.0)
5. Iron Iodine mixed salt used in
Meal
Yes 18(100.0) 16(100.0)
No - -
6. Children were satisfied with the
Served meal
Yes 18(100.0) 16(100.0)
No - -
7. Method for measuring the food grains and other item
(Measure Kg)
18(100.0) 16(100.0)
8. Method for measuring the served meal (According to
Requirement)
18(100.0) 16(100.0)
9. Children were not satisfied the meal give Reasons - -
Total No. of Schools 18(100.0) 16(100.0) Note: Figures in brackets indicate percentage to total
Source: Survey conducted in the Sample Schools using the structured schedule
Variety of Menu
District authorities decide the weekly menu in all sample primary and middle schools. It
was found that all sample primary and all middle schools display weekly menu at a
noticeable place. All sample primary and all middle schools follow weekly menu and use
locally available ingredients. The students of all the sample schools get sufficient
calories from MDM as is evident from Table 2.7.

78
Table 2.7: Variety of the Menu of MDM
Sl.No. Particulars No. of Schools
PS MS
1. Who decides the weekly
menu District Authority 18(100.0) 16(100.0)
2. Weekly menu was displayed
at school noticeable place `
Yes 18(100.0) 16(100.0)
No - -
3. If Yes, All people can see
the menu
Yes 18(100.0) 16(100.0)
No - -
4. Weakly menu followed Yes 18(100.0) 16(100.0)
No - -
5. Menu includes locally
available in ingredients
Yes 18(100.0) 16(100.0)
No - -
6. Sufficient calories from
MDM
Yes 18(100.0) 16(100.0)
No - - Note: Figures in brackets indicate percentage to total
Source: Survey conducted in the Sample Schools using the structured schedule
Display of Information under Right to Education Act, 2009
It has been found that all sample primary and middle schools received rice for the
preparation of MDM. Daily menu has been shown at the right place in all sample
schools. In the last month 23818 students of the sampled primary schools and 31956
students of middle schools have taken MDM. Display of MDM Logo was found in all
sample primary and middle schools (Table-2.8).
Table 2.8: Display of information under Right to Education Act, 2009 at the School
level at prominent place
Note: Figures in brackets indicate percentage to total
Source: Survey conducted in the Sample Schools using the structured schedule
Distribution of MDM
The number of students of primary and middle schools availing MDM was
counted on the day of visit. Their number was also verified from the MDM register.
Table-2.9 indicates that 4296 students were enrolled in 18 sample primary and 5022
were enrolled in 16 sample middles schools of Khagaria district. On the day of visit
Sl. No. Particulars No. of Schools
PS MS
1 Food Grain received Wheat - -
Rice 18(100.0) 16(100.0)
2 Other material purchase & use 18(100.0) 16(100.0)
3 Last month how many student take MDM 23818 31956
4 Daily Menu 18(100.0) 16(100.0)
5 Display MDM Logo on school Building 18(100.0) 16(100.0)

79
67.78 percent student of primary and 53.15 percent student of middle schools were
present in the school. It is also found that all students were availing MDM as per MDM
register on the day of visits in middle schools. But in middle level only 99.44 percent
students were availing MDM actually on the day of visits comparison with number of
students in MDM register of school on the day of visit.
Table 2.9: Children Availing MDM on the Day of Visit and as per School Registers
Note: Figures in brackets indicate percentage to total
Source: Survey conducted in the Sample Schools using the structured schedule
Discrimination in Cooking
Queue was observed for serving and seating arrangement for eating of food in all
sample primary and middle schools of Khagaria district. It has been observed that in
none of the sample primary and middle schools gender, caste or community
discrimination in cooking and serving or seating arrangement was observed as shown in
Table-2.10.
Table 2.10: Discrimination in Cooking, Serving and Seating Arrangement of
Students
Sl.No Particulars
No. of Schools
PS MS
Seating
arrangement
in Queue
Scattered Seating
arrangement
in Queue
Scattered
1
System of serving and
seating
arrangement for eating
18(100.0) - 16(100.0) -
2
Observe any gender or
caste or community
discrimination in
cooking or serving or
seating arrangement
PS MS
Yes No Yes No
- 18(100.0) - 16(100.0)
Total No. of schools 18(100.0) 16(100.0) Note: Figures in brackets indicate percentage to total
Source: Survey conducted in the Sample Schools using the structured schedule
Sl.
No. Particulars
No. of Schools
PS MS
1 No. of children enrolled in schools 4296(100.0) 5022(100.0)
2 No. of children attending the school on the day of
visit
2912(67.78) 2669(53.15)
3 No. of children availing MDM as per MDM register 2912(100.0) 2669(100.0)
4 No. of children actually availing MDM on the day
of visit
2912(100.0) 2654(99.44)

80
Health Cards and Health Check
Issues regarding the child health care and related aspects were also examined in
the district. It was found that health cards were maintained in 88.89 percent primary and
81.25 percent schools. The frequency of health check-up was once a year in 62.50 percent
primary and 92.31 percent middle schools; the rate was twice a year in the remaining
37.50 percent primary and 7.69 percent middle schools. As the Table 2.11 shows, all
student of 88.89 percent primary and 93.75 percent middle schools were given
micronutrients medicine periodically. These medicines in all sample primary and middle
schools by teacher. In 56.25 percent primary and 80.0 percent middle schools the
medicine was administered once. In the remaining 43.75 percent primary and 20.0
percent middle schools it was administered twice. 16 primary and 13 middle schools
maintain height and weight records of their children and indicate it in the school health
card, where health card were found. 50.0 percent primary school and 75.0 percent middle
school maintain first aid medical kit in the school. Out of 18 PS and 16 MS, 16 primary
and 13 middle schools done dental and eye checkup of their children and indicate it in
the school health card, where health card were found.
The names of the sample primary and middle schools where health cards and first-aid kit
not available are given in Annexure 2.11.
Table 2.11: Health Cards, Health Check
Sl.No. Particulars
No. of Schools
PS MS
Yes No Yes No
1 Health card maintained for each child in
school 16(88.89) 2(11.11) 13(81.25) 3(18.75)
2 Frequency of
health check-up
One time 10(62.50) 12(92.31)
Two time 6(37.50) 1(7.69)
More than two time - -
3
Whether children
are given
micronutrients
medicine
periodically
Iron, Folic acid,
Vitamin A dosage,
De-worming
16(88.89) 2(11.11) 15(93.75) 1(6.25)
4
If yes, Name of
the department
who
administered
these medicines
By
whom
1. ANM - -
2. Health
Dept. - -
3. Teacher 16(100.0) 15(100.0)
How
many
time
1 time 9(56.25) 12(80.0)
2 time 7(43.75) 3(20.0)
3 time - -

81
5
Whether height and weight record of the
children is being indicated in the school
health card.
16(100.0) - 13(100.0) -
6 Whether any referral during the period of
monitoring. - 16(100.0) - 13(100.0)
7. Instances of medical emergency during
the period of monitoring. - - - -
8. Availability of the first aid medical kit in
the school. 9(50.00) 9(50.00) 12(75.00) 4(25.00)
9. Dental and eye check-up included in the
screening. 16(100.0) - 13(100.0) -
10. If yes, distribution of spectacles to
children suffering from refractive error. - 18(100.0) - 16(100.0)
Total No. of school 18(100.0) 16(100.0)
Note: Figures in brackets indicate percentage to total
Source: Survey conducted in the Sample Schools using the structured schedule
Drinking Water and Sanitation
Table 2.12 shows that 88.89 percent primary and all sample middle schools have
potable water in convergence with drinking water and sanitation in Khagaria district.
Multiple responses were received while surveying the source of potable water In 6.25
percent primary and 25.0 percent middle schools water was available through tap water
and in 93.75 percent primary and 75.0 percent middle schools water was available
through local hand pump. Among all the funding agencies maximum water supply was
done by SSA scheme in both categories of schools.
Table 2.12: Drinking Water and Sanitation
Sl.No. Particulars
No. of Schools
PS MS
Yes No Yes No
1
Whether potable water is available for
drinking purpose in convergence with
Drinking Water and Sanitation
16
(88.89)
2
(11.11)
16
(100.0) -
2
Available of
potable water
(Multiple
Response)
Tap water 1(6.25) 1(25.00)
Local Hand pump 15(93.75) 15(75.00)
3. Which
scheme
SSA Scheme 15(93.75) 15(75.0)
MLA Fund 1(6.25) 1(25.0)
Total No. of School 18(100.0) 16(100.0)
Note: Figures in brackets indicate percentage to total
Source: Survey conducted in the Sample Schools using the structured schedule
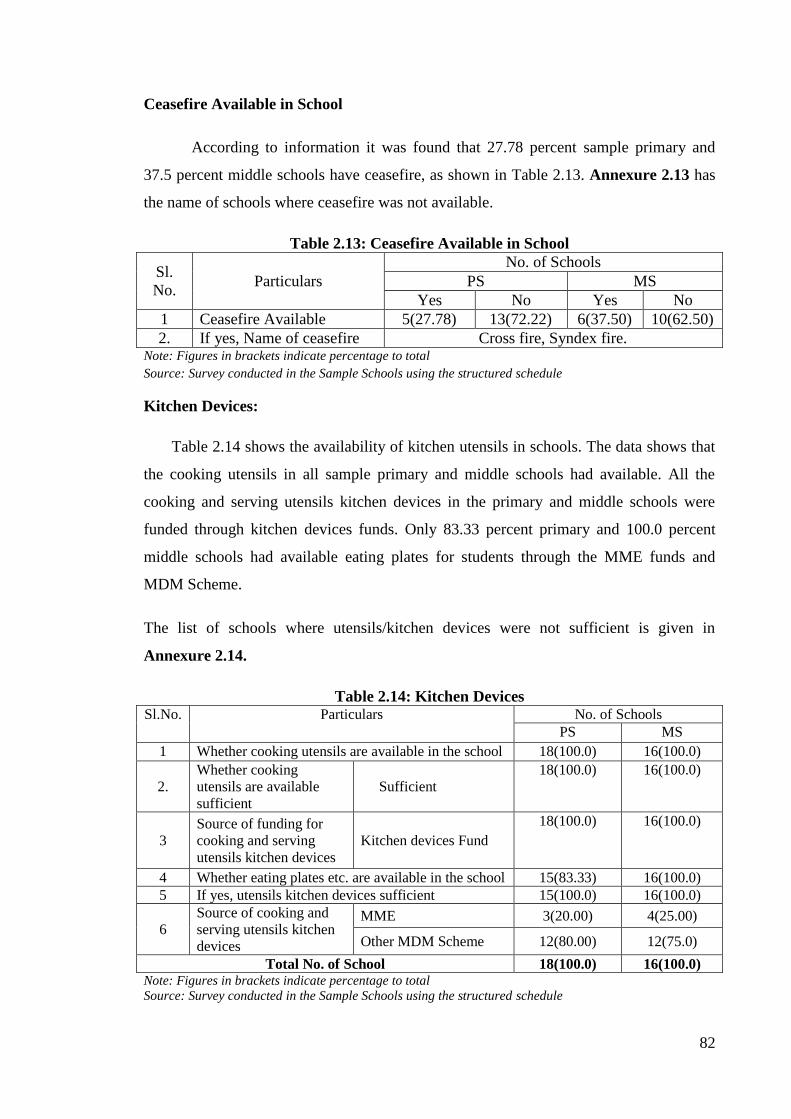
82
Ceasefire Available in School
According to information it was found that 27.78 percent sample primary and
37.5 percent middle schools have ceasefire, as shown in Table 2.13. Annexure 2.13 has
the name of schools where ceasefire was not available.
Table 2.13: Ceasefire Available in School
Sl.
No. Particulars
No. of Schools
PS MS
Yes No Yes No
1 Ceasefire Available 5(27.78) 13(72.22) 6(37.50) 10(62.50)
2. If yes, Name of ceasefire Cross fire, Syndex fire. Note: Figures in brackets indicate percentage to total
Source: Survey conducted in the Sample Schools using the structured schedule
Kitchen Devices:
Table 2.14 shows the availability of kitchen utensils in schools. The data shows that
the cooking utensils in all sample primary and middle schools had available. All the
cooking and serving utensils kitchen devices in the primary and middle schools were
funded through kitchen devices funds. Only 83.33 percent primary and 100.0 percent
middle schools had available eating plates for students through the MME funds and
MDM Scheme.
The list of schools where utensils/kitchen devices were not sufficient is given in
Annexure 2.14.
Table 2.14: Kitchen Devices Sl.No. Particulars No. of Schools
PS MS
1 Whether cooking utensils are available in the school 18(100.0) 16(100.0)
2.
Whether cooking
utensils are available
sufficient
Sufficient
18(100.0) 16(100.0)
3
Source of funding for
cooking and serving
utensils kitchen devices
Kitchen devices Fund
18(100.0) 16(100.0)
4 Whether eating plates etc. are available in the school 15(83.33) 16(100.0)
5 If yes, utensils kitchen devices sufficient 15(100.0) 16(100.0)
6
Source of cooking and
serving utensils kitchen
devices
MME 3(20.00) 4(25.00)
Other MDM Scheme 12(80.00) 12(75.0)
Total No. of School 18(100.0) 16(100.0) Note: Figures in brackets indicate percentage to total
Source: Survey conducted in the Sample Schools using the structured schedule

83
Infrastructure of Kitchen:
Information related to infrastructure of kitchen in sample primary and middle
schools in Khagaria district was analyzed. It was found that 88.89 percent primary and
93.75 percent middle schools were having kitchen. The pucca kitchen-cum-store was
available in 6.25 percent primary and 26.67 percent middle schools while only kitchen
was available in 93.57 percent primary and 73.33 percent middle schools and all of them
were used. Two primary and one middle school were not sanctioned kitchen.
In all sample primary and 75.0 percent middle schools kitchen-cum-store was
constructed under MDM scheme while 73.33 percent primary and 36.36 percent middle
schools kitchen was constructed under MDM scheme as shown in Table-2.15. In 25.0
percent middle schools kitchen-cum-store was constructed through SSA scheme while
26.67 percent primary and 63.64 percent middle schools kitchen was constructed through
SSA scheme. Two primary schools and one middle school prepared MDM in additional
room. One primary schools prepared MDM in open field. In all sample primary and
middle schools have kitchen and store away from classrooms. In all sample primary and
all middle schools food is prepared firewood.
Annexure 2.15 contains the names of schools where kitchen is not available.
Table 2.15: Infrastructure of Kitchen
Sl.No. Particulars No. of Schools
PS MS
Kitchens are available 16(88.89) 15(93.75)
1 No. of school in which
pucca kitchen-cum store
available
Kitchen-cum –store 1(6.25) 4(26.67)
Kitchen 15(93.75) 11(73.33)
(a) No. of school in which
pucca kitchen constructed
and used
Kitchen-cum –store 1(100.0) 4(100.0)
Kitchen 15(100.0) 11(100.0)
(b) Under which scheme
Kitchen- cum-store
constructed
MDM Kitchen cum
store
1(100.0) 3(75.0)
Kitchen 11(73.33) 4(36.36)
SSA Kitchen cum
store
- 1(25.0)
Kitchen 4(26.67) 7(63.64)
(c) Constructed but not in use - -
(d) Under construction - -
(e) Sanctioned, but not started - -
(f) Not sanctioned 2(11.11) 1(6.25)
2 In case the pucca kitchen-
cum store is not available,
Additional Room 1(50.0) 1(100.0)
Open field 1(50.0) -

84
where is the food being
cooked?
3
Where the food grains/
other ingredients are
being stored?
Kitchen cum store - -
Kitchen - -
Additional Room 18(100.0) 16(100.0)
community hall - -
4
Kitchen-cum-store is neat
and cleaned
Kitchen cum store -
Kitchen 18(100.0) 16(100.0)
Additional Room - -
At the venue of villegers - -
5 Is there kitchen & store away from class room of
school
18(100.0) 16(100.0)
6
Whether MDM is being
cooked by using firewood
or LPG based cooking?
Fire wood 18(100.0) 16(100.0)
Coal - -
LPG - -
7 Whether on any day there was interruption due to non-
availability of firewood or LPG?
- -
Total No. of School 18(100.0) 16(100.0) Note: Figures in brackets indicate percentage to total
Source: Survey conducted in the Sample Schools using the structured schedule
Availability of Cover Drum
As Table 2.16 indicates only 72.22 percent primary and 93.75 percent middle
schools have covered drums for the food grains. Covered drums in all primary and
middle schools were made available through MME (Management, Monitoring &
Evaluation) scheme.
List of schools where covered drums for storage the food grains are not available
is given in Annexure 2.16.
Table 2.16: Availability of Cover Drum
Sl.No. Particulars No. of Schools
PS MS
Yes No Yes No
1 Availability of cover drum of food
grains in school
13(72.22) 5(27.78) 15(93.75) 1(6.25)
2. If yes, which
scheme
SSA through - -
Management,
Monitoring &
Evaluation
13(100.0) 15(100.0)
Total No. of School 18(100.0) 16(100.0)
Note: Figures in brackets indicate percentage to total
Source: Survey conducted in the Sample Schools using the structured schedule

85
Availability of Toilets
It was found that in 77.78 percent primary and 87.50 percent middle schools have
separate toilet for boys and girls. Out of these 92.86 percent primary and 85.71 percent
middle school use toilets properly. 33.33 percent primary school and 56.25 percent
middle schools have common toilets and out of these all primary and middle school use
common toilets properly.
Annexure 2.17 contains the list of sample schools which do not have separate toilet for
boys and girls or common toilets are not available.
Table 2.17: Availability of toilets
Sl.No. Particulars No. of Schools
PS MS
Yes No Yes No
1 Availability of separate toilet for
boys and girls in school
14(77.78) 4(22.22) 14(87.50) 2(12.50)
2. If yes, Proper use of toilet 13(92.86) 1(7.14) 12(85.71) 2(14.29)
3 Is there available common toilet 6(33.33) 12(66.67) 9(56.25) 7(43.75)
4 If yes, Proper use of toilet 6(100.0) - 9(100.0) -
Total No. of School 18 (100.0) 16 (100.0) Note: Figures in brackets indicate percentage to total
Source: Survey conducted in the Sample Schools using the structured schedule
IT Infrastructure (computer) in school
As Table 2.18 indicates only 18.75 percent middle schools have computer. None
of the primary schools possess any IT infrastructure. None of them have an internet
connection and thus cannot use any IT enabled services.
Table 2.18: IT infrastructure available (Computer) School level
Sl.No. Particulars No. of Schools
PS MS
Yes No Yes No
1. Is computer available in school - 18(100.0) 3(18.75) 15(81.25)
2. If yes give the no. of computer - 9
3. Available of internet connection - - - 3(100.0)
4. Using any IT/ IT enable services based
(like E-learning etc.)
- - 3(100.0)
Note: Figures in brackets indicate percentage to total
Source: Survey conducted in the Sample Schools using the structured schedule

86
Safety and Hygiene
Environment, safety and hygiene were found satisfactory in majority of the
primary and middle schools. As Table 2.19 shows environment was good in 38.89
percent primary and 56.25 percent middle schools. Safety was good in 27.18 percent in
primary and 37.5 percent in middle schools. The hygiene was observed to be in good
condition in 16.67 percent primary and 25.0 percent middle schools.
Table 2.19: General Impression of Environment, Safety and Hygiene
Note: Figures in brackets indicate percentage to total
Source: Survey conducted in the Sample Schools using the structured schedule
Encouragement of Children to adopt Good Practices
As shown in Table-2.20, in all sample primary and middle schools, students were
encouraged to wash their hands before and after meals. Students were encouraged to
receive MDM in orderly manner in all sample schools. It is also found that in all schools
students were educated about conservation of water. Cooking process and storage of
fuel was found to be safe from fire hazard in all sample schools
Table 2.20: Encouragement of Children to adopt Good Practices
Note: Figures in brackets indicate percentage to total
Source: Survey conducted in the Sample Schools using the structured schedule
Sl. No
Particulars No. of Schools PS MS
Good Satisfactory Un
satisfactory Good Satisfactory
Un- satisfactory
1 Environment 7(38.89) 11(61.11) - 9(56.25) 7(43.75) - 2 Safety 5(27.18) 13(72.22) - 6(37.50) 10(62.50) - 3 Hygiene 3(16.67) 15(83.33) - 4(25.00) 12(75.00) - 4 Total No. of
School
18(100.0) 16(100.0)
Sl.
No.
Particulars No. of Schools
PS MS
Yes No Yes No
1 Children encouraged to wash
hands before and after eating
18(100.0) - 16(100.0) -
2 Children take MDM in an orderly 18(100.0) - 16(100.0) -
3 Conservation of water in school - 18(100.0) 16(100.0)
4 Cooking process and storage of
fuel is safe from fire hazard.
18(100.0) - 16(100.0) -
5 Total No. of School 18 (100.0) 16(100.0)

87
Serving Meal to students before tasting
Before the meal was served to students it was tasted by the teachers VSS and
Parents It was found that MDM was tasted daily by teachers of all sample primary and
middle schools. It was seldom tasted by VSS and parents in all primary and middle
schools.
Table 2.21: before serving meal to students by whom tasted
Note: Figures in brackets indicate percentage to total
Source: Survey conducted in the Sample Schools using the structured schedule
Community Participation and Awareness:
Around 16.67 percent parents of primary and 12.5 percent parents of middle
schools supervised MDM on a daily basis and found it to be good and rest sample
schools found satisfactory. SMC/VSS supervised it in 50.0 percent primary and 43.75
percent middle schools were good and rest sample schools found satisfactory. They also
Supervision by Panchayat/urban bodies was found good in 11.11 percent primary and
12.5 percent middle schools and rest sample schools found satisfactory.
At the time of monitoring of MDM, it was found that parents from 5.56 percent
primary and 12.5 percent middle schools monitoring of MDM was found good and rest
sample schools found satisfactory. In case of SMC/VSS it was 50.0 percent primary and
50.0 percent middle schools were found good and rest sample schools found satisfactory.
Monitoring by Panchayat/urban bodies was found good in 12.5 percent middle school
and rest sample schools found satisfactory.
Sl.
No. Particulars
No. of Schools
PS MS
Daily Seldom Daily Seldom
1 Tasted by Teacher 18(100.0) - 16(100.0) -
2 Tasted by SMC - 18(100.0) - 16(100.0)
3 Tasted by Parents - 18(100.0) - 16(100.0)
Total No. of School 18 (100.0) 16 (100.0)
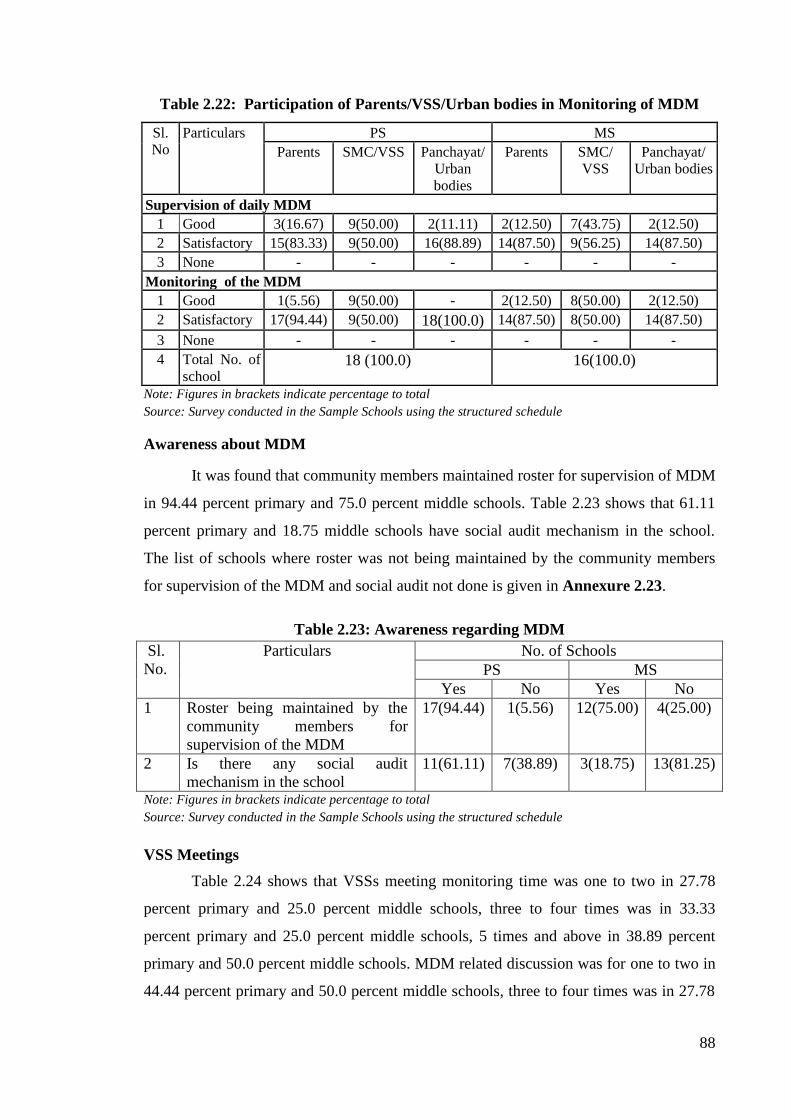
88
Table 2.22: Participation of Parents/VSS/Urban bodies in Monitoring of MDM
Sl.
No
Particulars PS MS
Parents SMC/VSS Panchayat/
Urban
bodies
Parents SMC/
VSS
Panchayat/
Urban bodies
Supervision of daily MDM
1 Good 3(16.67) 9(50.00) 2(11.11) 2(12.50) 7(43.75) 2(12.50)
2 Satisfactory 15(83.33) 9(50.00) 16(88.89) 14(87.50) 9(56.25) 14(87.50)
3 None - - - - - -
Monitoring of the MDM
1 Good 1(5.56) 9(50.00) - 2(12.50) 8(50.00) 2(12.50)
2 Satisfactory 17(94.44) 9(50.00) 18(100.0) 14(87.50) 8(50.00) 14(87.50)
3 None - - - - - -
4 Total No. of
school 18 (100.0) 16(100.0)
Note: Figures in brackets indicate percentage to total
Source: Survey conducted in the Sample Schools using the structured schedule
Awareness about MDM
It was found that community members maintained roster for supervision of MDM
in 94.44 percent primary and 75.0 percent middle schools. Table 2.23 shows that 61.11
percent primary and 18.75 middle schools have social audit mechanism in the school.
The list of schools where roster was not being maintained by the community members
for supervision of the MDM and social audit not done is given in Annexure 2.23.
Table 2.23: Awareness regarding MDM
Sl.
No.
Particulars No. of Schools
PS MS
Yes No Yes No
1 Roster being maintained by the
community members for
supervision of the MDM
17(94.44)
1(5.56) 12(75.00) 4(25.00)
2 Is there any social audit
mechanism in the school
11(61.11) 7(38.89) 3(18.75) 13(81.25)
Note: Figures in brackets indicate percentage to total
Source: Survey conducted in the Sample Schools using the structured schedule
VSS Meetings
Table 2.24 shows that VSSs meeting monitoring time was one to two in 27.78
percent primary and 25.0 percent middle schools, three to four times was in 33.33
percent primary and 25.0 percent middle schools, 5 times and above in 38.89 percent
primary and 50.0 percent middle schools. MDM related discussion was for one to two in
44.44 percent primary and 50.0 percent middle schools, three to four times was in 27.78

89
percent primary and 12.5 percent middle school, 5 times and above in 27.78 percent
primary and 37.5 percent middle schools.
Table 2.24: VSS Meetings
Sl.
No
.
Particulars PS MS
1-2 3-4 5 &
above
Total 1-2 3-4 5 &
above
Total
1. No. of VSS
meeting till
monitoring
time
5
(27.78)
6
(33.33)
7
(38.89)
18
(100.0)
4
(25.0)
4
(25.0)
8
(50.0)
16
(100.0)
2. No. of VSS
meeting to
MDM related
discussion
8
(44.44)
5
(27.78)
5
(27.78)
18
(100.0)
8
(50.0)
2
(12.5)
6
(37.50)
16
(100.0)
Total No. of
school
18 (100.0)
16 (100.0)
Note: Figures in brackets indicate percentage to total
Source: Survey conducted in the Sample Schools using the structured schedule
Inspection & Supervision:
Inspection register was available in 94.44 percent primary and all sample middle
schools. It has been found that 66.67 percent primary and 43.75 percent middle schools
have received fund under MME component. The regular inspection of MDM was
reported in all sample primary and middle schools of the district.
The list of schools where inspection register was not available and fund not
received under MME is given in Annexure 2.25
Table 2.25: Inspection and Supervision of MDM by Educational Authorities
Sl.No. Particulars No. of Schools
PS MS
Yes No Yes No
1 Is there any Inspection Register
available at school level?
17(94.44) 1(5.56) 16(100.0) -
2 Whether school has received any
funds under MME component?
12(66.67) 6(33.33) 7(43.75) 9(56.25)
3 Is regular inspections of MDM 18(100.0) - 16(100.0) - Note: Figures in brackets indicate percentage to total
Source: Survey conducted in the Sample Schools using the structured schedule
Inspection and Supervision of MDM
The regular inspection of MDM was reported in all sample primary and middle
schools of the district. The inspection was also done by the BEO, MDM Coordinator,
CRC Coordinator, DPO, and BRP. As Table 2.26 shows in case of primary school

90
maximum inspection and supervision were done by BRP (50.0 percent) and for middle
schools it was mostly by BRP (75.0 percent) in Khagaria district. There was no state
level inspecting authorities visited in the schools for MDM programme. Maximum
inspections were made by block level authorities in primary and middle schools. Mostly
this inspection was made often in both categories of schools.
The visiting authorities remarked for good quality of MDM should be provided in
27.78 percent primary and 25.0 percent middle schools. About the Menu & Cleanliness
/ hygine of students in 33.33 percent primary and 31.25 percent middle schools.
Table 2.26: Inspections and Supervision of MDM (Multiple Responses)
Note: Figures in brackets indicate percentage to total
Source: Survey conducted in the Sample Schools using the structured schedule
Sl.No. Particulars No. of Schools
PS MS
1 Regular inspection of the MDM food 18(100.0) 16(100.0)
2 Inspection by
BEO 9(50.00) 11(68.75)
MDM Co-odinator 7(38.89) 5(31.25)
CRC coordinator 9(50.00) 4(25.00)
BRP 9(50.00) 12(75.00)
DPO 1(5.56) 5(31.25)
3 Inspecting authority
State level - -
District 1(5.56) 5(31.25)
Tehsil - -
Block 18(100.0) 16(100.0)
CRC 16(88.89) 16(100.0)
Village - -
4
Frequency of
inspections
Daily - -
Weekly - -
Fortnightly 6(33.33) 9(25.71)
Monthly 12(66.67) 13(37.14)
Often 17(94.44) 15(42.86)
5 If any, then Remark
made by the
visiting of officers
1) About the Menu
& Cleanliness
/hygine of students
6(33.33) 5(31.25)
2) Good Quality of
MDM
5(27.78) 4(25.00)

91
Impact of MDM
As indicated in Table 2.27 impact of MDM in almost all sample primary and all
middle schools has improved enrollment of students, attendance of students and full time
presence of students in schools.
Table 2.27: Impact of the MDM
Sl.No. Particulars No. of Schools
PS MS
1 Mid day meal improved Enrollment of student 17(94.44) 16(100.0)
Attendance of student 18(100.0) 16(100.0)
Present of students full
time in school
16(88.89) 16(100.0)
2 Total No. of School 18(100.0) 16(100.0) Note: Figures in brackets indicate percentage to total
Source: Survey conducted in the Sample Schools using the structured schedule
Social Harmony
It was found that all sample primary and middle schools MDM has improved
social harmony and nutritional status of student. Table 2.28 shows that there is no other
incidental benefit due to serving of meal in all sample schools.
Table 2.28: Social Harmony
Sl.No. Particulars No. of Schools
PS MS
Yes No Yes No
1 Whether mid day meal has helped
in improvement of the social
harmony
18(100.0) - 16(100.0) -
2 Whether mid day meal has helped
in improvement of the nutritional
status of the children.
18(100.0) - 16(100.0) -
3 Is there any other incidental
benefit due to serving of meal in
schools
- 18(100.0) - 16(100.0)
Note: Figures in brackets indicate percentage to total
Source: Survey conducted in the Sample Schools using the structured schedule
Grievance Redressal Mechanism
As Table 2.29 indicates that all sample primary and middle schools have
grievances redressal mechanism in the district for MDMs and the district/block and
school have toll free number.
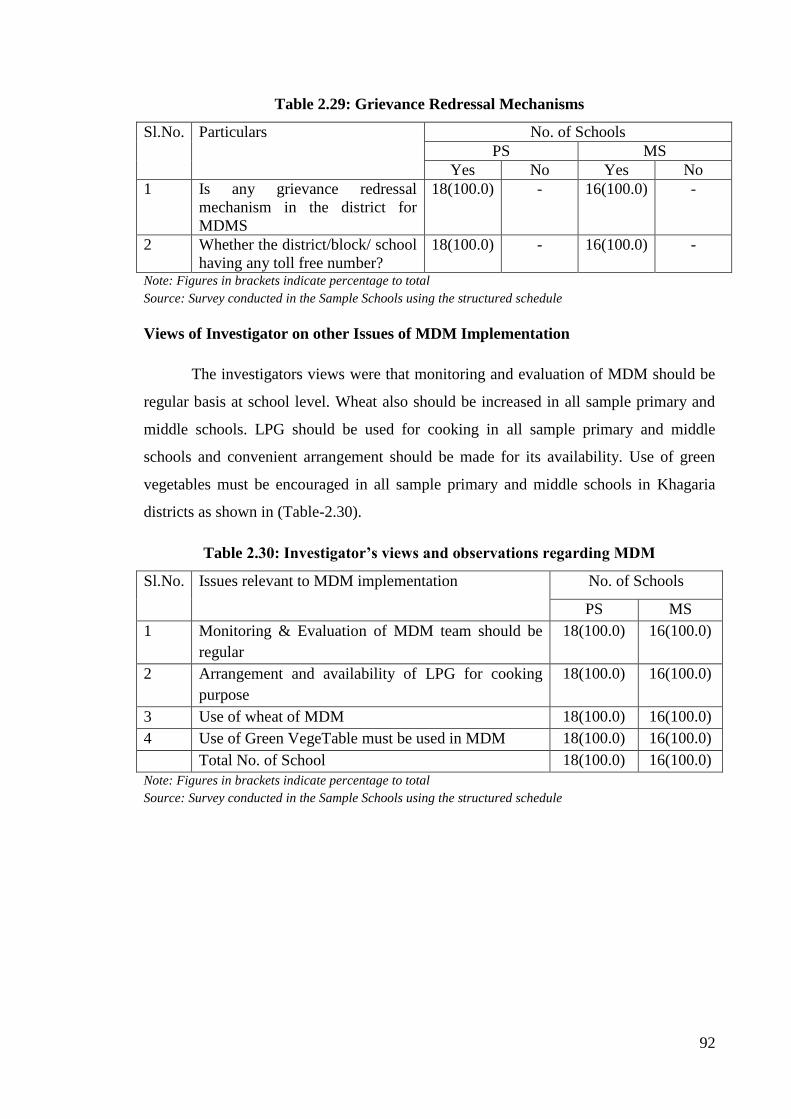
92
Table 2.29: Grievance Redressal Mechanisms
Sl.No. Particulars No. of Schools
PS MS
Yes No Yes No
1 Is any grievance redressal
mechanism in the district for
MDMS
18(100.0) - 16(100.0) -
2 Whether the district/block/ school
having any toll free number?
18(100.0) - 16(100.0) -
Note: Figures in brackets indicate percentage to total
Source: Survey conducted in the Sample Schools using the structured schedule
Views of Investigator on other Issues of MDM Implementation
The investigators views were that monitoring and evaluation of MDM should be
regular basis at school level. Wheat also should be increased in all sample primary and
middle schools. LPG should be used for cooking in all sample primary and middle
schools and convenient arrangement should be made for its availability. Use of green
vegetables must be encouraged in all sample primary and middle schools in Khagaria
districts as shown in (Table-2.30).
Table 2.30: Investigator’s views and observations regarding MDM
Sl.No. Issues relevant to MDM implementation No. of Schools
PS MS
1 Monitoring & Evaluation of MDM team should be
regular
18(100.0) 16(100.0)
2 Arrangement and availability of LPG for cooking
purpose
18(100.0) 16(100.0)
3 Use of wheat of MDM 18(100.0) 16(100.0)
4 Use of Green VegeTable must be used in MDM 18(100.0) 16(100.0)
Total No. of School 18(100.0) 16(100.0)
Note: Figures in brackets indicate percentage to total
Source: Survey conducted in the Sample Schools using the structured schedule

93
Chapter-III
Major Findings
Monitoring and evaluation of Sarva Shiksha Abhiyan (SSA) was conducted by the
Giri Institute of Development Studies, Lucknow during 15 March to 31 March, 2015.
The survey covered 18 primary schools and 16 middle schools in the Khagaria district as
suggested by the Ministry of Human Resource Development, Department of School
Education and Literacy, Government of India. Besides monitoring and evaluation of SSA
programme in the district, the working of MDM was also monitored and evaluated. The
focus of monitoring of MDM was limited to cover only key components of the MDM
programme. These components of MDM monitoring and evaluations were selected by
the Ministry. On the basis of field survey of primary and middle schools where MDM is
being implemented, following conclusions have been arrived at:
During the visits of schools of district Khagaria 18(100.0 percent) sample
primary schools and 16(100.0 percent) middle schools reported to have received
food grains within one month and its quality was good.
There was reported timely release of MDM funds from state, district and block-
level in all samples primary and middle schools of the district. It was also
observed that there were all sample schools where MDM cooked have received
MDM fund in advance and regularly.
Due to unavailability of food grains etc in 10 PS 1 MS in few days of last three
months food not served to the students.
It was found that 8(44.44 percent) primary and 15(93.75 percent) middle schools
hot cooked meal was provided to students regularly. This fact was confirmed
from students, teachers, parents and from MDM registers of the concerning
schools.
There was minor difference between the number of students for whom the MDM
was prepared and those who got the MDM.
There was no difference between MDM registers and head count of students on
the day of visit of research team to the sample schools.

94
MDM was cooked by VSS appointed cook-cum-helpers. Majority of cooks were
females and of OBC castes and they were paid monthly salary of Rs.1000/
regularly through the cheques.
It has been observed that in none of the sample primary and middle schools
gender, caste or community discrimination in cooking and serving or seating
arrangement.
The meal was tasted by the teachers before it was served to the students.
The MDM was served by cooks and the students received MDM in queue.
The menu was displaced at noticeable places in all primary and percent middle
schools it is also verified that the all sample schools followed the menu in the
district.
MDM logo was displayed in all sample primary and middle schools buildings.
The prescribed quantity of MDM was given to students and was found to be
sufficient. The quality of MDM was found to be ‘Good’ in all sample primary
and middle schools.
Health cards were maintained in 16(88.89 percent) primary and 13(81.25 percent)
middle schools. Likewise Iron Folic Acid and Vitamins were given to the
majority of students.
The availability of potable water through Local hand pumps was found in almost
all sample primary and middle schools.
Kitchens were available in only 16(88.89 percent) primary and 15(93.75 percent)
middle schools. In all the sample primary and middle schools, food was cooked
using maximum fire wood.
The kitchen utensils were available in all sample primary and middle schools.
The availability of covered drums was found in 72.22 percent primary and 93.75
percent middle schools. Cover drums were reported to have been purchased
majorly from funds of MME Scheme.

95
Separate toilets for boys and girls were available in 77.78 percent primary and
87.5 percent middle schools.
The Computers was available in only 3(18.75 percent) middle schools.
The condition of environment, safety and hygiene was satisfactory in almost
primary schools and good in almost middle schools.
It was observed that students were encouraged to wash their hand before and after
the meal. The students were seen receiving the MDM in queue in almost all the
schools. The practice of water conservation was seen, cooking process and
storage of fuel were found to be safe from fire hazards in almost all sample
schools.
The awareness of parents and community about MDM was found to be
satisfactory in most of the schools.
The frequency of VSS meeting for MDM related discussion was observed one to
two in 44.44 percent primary and 50.0 percent middle schools, three to four times
was in 27.78 percent primary and 12.5 percent middle school, 5 times and above
in 27.78 percent primary and 37.5 percent middle schools.
Inspection and supervision MDM by district and block officials on regular basis
covered all schools
It was observed that MDM was helpful in improving the social harmony. The
grievance redressal mechanism was active.
The impact of MDM was found to be positive in all sample primary and middle
schools. MDM has improved enrollment of students, attendance of students and
full time presence of students in all sample schools.
The views of investigators about different aspect of implementation of MDM in
the district were found to be positive. The investigators views were that
monitoring and evaluation of MDM should be regular basis at school level,
Wheat also should be provided to schools for MDM and LPG should be ensured
for cooking instead of woods.

96

96
ANNEXURE
Annexure 2.5
In Last three months, few days food not served due to Various Reasons
Primary Schools
1. Dalan Haripur 6 Durgasthan Babugang
2. Tafir Gadhiya 7 Mil Road
3. Lagma 8 Sanhouli
4. Shaher Kundi 9 Balha Bazar
5. Dharmchak 10 Dantola
Middle Schools
1. Baluahi
Annexure 2.11
Health Card not Maintained for each Child in Schools
Primary Schools
1. Meghouna 2. Sohrawa
Middle Schools
1. Thuddi 3 Sonversha Ghat
2. Pipra
First aid Medical Kit not available in the Schools
Primary Schools
1. Bairba Mushri 6. Shaher Kundi
2. Meghouna 7 Urmila Nagar
3. Sohrawa 8 Dantola
4. Tafir Gadhiya 9 Railway No-2
5. Buchha
Middle Schools
1. Thuddi 3 Sonversha Ghat
2 Paharchak 4 Hajipur Awas Board
Annexure 2.13
Cease fire not available
Primary Schools
1. Dalan Haripur 8 Balha Bazar
2 Rahul Nagar Chater 9 Urmila Nagar
3 Bairba Mushri 10 Dharmchak
4 Tafir Gadhiya 11 Durgasthan Babugang
5 Buchha 12 Railway No-2
6 Lagma 13 Mil Road
7 Shaher Kundi
Middle Schools
1 Tofir Gadhiya 6 Dighni
2 Thuddi 7 Baluahi
3 Bhutouli Malpa 8 Matihani
4 Pipra 9 Saidpur
5 Sonversha Ghat 10 Balha Saidpur
Annexure 2.14
Eating Plates etc. are not available
Primary Schools
1. Dalan Haripur
2. Tafir Gadhiya
3. Dantola

97
Annexure 2.15
Name of Schools Kitchen Not Sanctioned Additional
Room
Open Field
Primary Schools
1. Durgasthan Babugang
2. Railway No-2
Middle Schools
1. Thuddi
Annexure 2.16
Non-availability of Covered Drum of Food Grains in Schools
Primary Schools
1. Dalan Haripur 4. Dantola
2. Tafir Gadhiya 5. Durgasthan Babugang
3. Shaher Kundi
Middle Schools
1. Amni
Annexure 2.17: Non-availability of Toilets
Sr .no Name of the Schools No separate
toilet for Girls
& Boys
No Proper use
of Toilets
No Common
Toilet available
Primary Schools
1 Dalan Haripur
2 Rahul Nagar Chater
3 Bairba Mushri
4 Meghouna
5 Tafir Gadhiya
6 Buchha
7 Lagma
8 Shaher Kundi
9 Balha Bazar
10 Urmila Nagar
11 Dharmchak
12 Dantola
13 Durgasthan Babugang
14 Railway No-2
15 Sanhouli
Middle Schools
1 Tofir Gadhiya
2 Thuddi
3 Bhutouli Malpa
4 Pipra
5 Kamathan
6 Dighni
7 Haripur
8 Hajipur Utter
9 Baluahi
10 Hajipur Awas Board
11 Amni
12 Saidpur

98
Annexure 2.23
Sr.No Name of School Roster not being
maintained by the
Community Members
for Supervision of MDM
Is there no any social audit
mechanism in the MDM
Primary Schools
1. Tafir Gadhiya
2. Dalan Haripur
3. Rahul Nagar Chater
4. Shaher Kundi
5. Urmila Nagar
6. Railway No-2
7. Sanhouli
Middle Schools
1. Pipra
2. Sonversha Ghat
3. Dighni
4. Haripur
5. Tofir Gadhiya
6. Thuddi
7. Bhutouli Malpa
8. Kamathan
9. Hajipur Utter
10. Baluahi
11. Matihani
12. Saidpur
13. Balha Saidpur
Annexure 2.25
Sr.No Name of School Is there no any
Inspection Register
available at school level?
School has not received any
funds under MME
component?
Primary Schools
1. Meghouna
2. Dalan Haripur
3. Rahul Nagar Chater
4. Bahadurpur
5. Balha Bazar
6. Railway No-2
Middle Schools
1. Tofir Gadhiya
2. Thuddi
3. Pipra
4. Sonversha Ghat
5. Kamathan
6. Dighni
7. Hajipur Utter
8. Baluahi
9. Matihani

99

100
District-4: Siwan

101

99
Chapter I
Introduction
Sample Design of the Study
A total of 37 schools have been taken as sample from Siwan district as shown in
Table-1.1. Out of these 37 schools, 22 are primary schools and 15 middle schools.
Table 1.1: Number of Sample Schools
Sl. No. Name of Block Primary
schools
Middle schools Total
1 Siwan (Urban) 5 3 8
2 Basantpur 4 4 8
3 Raghunathpur 6 4 10
4 Ziradei 7 4 11
Total 22 15 37 Source: SSA Programme, BSA, District Siwan, Bihar
Table-1.2 reflects all 37 sample schools selected from Siwan district. Keeping in
view, that each types of school as per the selection criteria, to be represented list of
sample schools.
Table 1.2: School-wise list of Sample Schools
Sl.
No.
Name of the schools U-DIES Coade Category of
schools PS/
MS
Criteria for Selection
1 Lakhrawn 10161508302 PS CWSN
2 Bathani 10161905102 PS CWSN
3 Rajapur 10160307602 PS CWSN
4 Belvasa 10161905101 PS Civil Work
5 Nawadhih 10161300601 PS CWSN
6 Khuzwa 10161301902 PS Civil Work
7 Haripalpur 10161310601 PS Gender Gap and CWSN
8 Makdoom Saray 10161509601 PS PTR and Gender Gap
9 Rajapur Mallahi Tola 10160307603 PS CWSN and PTR
10 Titra 10161901002 PS PTR and CWSN
11 Navalpur 10161901003 PS PTR
12 Ahir Tola
(Raghunathpur)
10161306906 PS Gender and PTR
13 Konauli 10160304103 PS SC, PTR and Civil Work
14 Naza Khila 10161509801 PS Slum Area and CWSN
15 Dalitodhar 10161508601 PS Civil Work and PTR

100
Sl.
No.
Name of the schools U-DIES Coade Category of
schools PS/
MS
Criteria for Selection
16 Mirzapur 10161305401 PS Flood Area
17 Bharthui Garh 10161906202 PS Gender and PTR
18 Ziradei Kanya 10161906102 PS PTR
19 Ganesh Smarak 10161509501 PS SC
20 Basantpur Kanya 10160307904 PS PTR and CWSN
21 Pipra 10161312302 PS SC
22 Ruiya 10161906001 PS Flood Area, PTR, SC
23 Khori Pakad 10160307801 MS Civil Work
24 Rajapur 10160307601 MS Gender Gap and PTR
25 Ripura 10161907401 MS Flood, SC, Gender Gap
26 Rajapur 10161305902 MS Computer
27 Samardha 10160303801 MS Civil Work and CWSN
28 Kaheri 10161509002 MS Gender Gap
29 Tari 10161312401 MS Gender Gap, PTR, CWSN
30 Lohgajar 10161905601 MS Flood Area and CWSN
31 Maniya 10161903701 MS CWSN
32 Govt. Ziradei 10161906103 MS Computer, Gender Gap,
Civil Work
33 Chakri 10161301601 MS Gender Gap
34 Govt. Basantpur 10160307902 MS Computer, CWSN, Civil
Work
35 Karsar 10161308601 MS Gender Gap and CWSN
36 Govt. Urdu Naya
Bazar
10161509802 MS Gender Gap, CWSN, Civil
Work, Minority
37 Sri Nagar 10161508201 MS Gender Gap Source: BSA Office, SSA Programme, District Siwan, Bihar
Tools
A well-structured was prepared to collect primary data from the selected primary
and middle schools.

101
Chapter-II
Implementation of MDM Programme
Regularity in Supply of Food Grains
Table 2.1 shows that about 86.36 percent primary and 93.33 percent middle
schools from the sample were receiving food grains within one month. It was also found
that the food grains were delivered to the lifting agency within proper time in about
95.45 percent primary and all sample middle schools. If the lifting agency did not deliver
the food grains to the school on time, no alternate arrangement was present, in any of the
schools, for its transportation. It has also been observed that the quality of food supplied
was as per FAQ mark in all sample primary and middle schools (Table: 2.1). In all
sample schools, food grains were released after adjusting the unspent balance grains of
the previous month.
Annexure 2.1 The names of schools where Food grains facility not available in
advance for One month.
Table 2.1: Regularity in supply of Food Grains to Schools
Sl.No. Particulars
No. of Schools
PS MS
Yes No Yes No
1. If Food grains facility available in schools
within One month
19
(86.36)
3
(13.64)
14
(93.33)
1
(6.67)
2. Food grains delivered to lifting agency
within proper time
21
(95.45)
1
(4.55)
15
(100.0)
-
3.
If lifting agency is not delivering the food
grains to the school how is the food grains
transported up to the schools.
No Arrangement
No Arrangement
4. Whether the food grains is of FAQ Mark -
grade A
22
(100.0)
- 15
(100.0)
-
5.
Whether food grains are released to
school after adjusting the unspent balance
of the previous month
22
(100.0)
- 15
(100.0)
-
Total No. of Schools 22 (100.0) 15 (100.0) Note: Figures in brackets indicate percentage to total
Source: Survey conducted in the Sample Schools using the structured schedule.

102
Timely Release of Funds:
It was found that all sample primary and middle schools timely recicved funds at
State, District level and 81.82 percent primary and 80.0 percent middle schools timely
recicved funds at Block-level, as shown in Table-2.2.
Table-2.2: Timely Release of Funds
S.No Particulars No. of Schools
PS MS
1 Whether State is releasing funds to District on regular
basis in advance 22(100.0) 15 (100.0)
2 Whether District is releasing funds to Block on regular
basis in advance 22(100.0) 15 (100.0)
3 Whether Block is releasing funds to School on regular
basis in advance
18(81.82) 12 (80.0)
Total No. of schools 22(100.0) 15 (100.0) Note: Figures in brackets indicate percentage to total
Source: Survey conducted in the Sample Schools using the structured schedule.
Cost of Cooking Received
It was found that 86.36 percent primary and 80.0 percent middle schools were
receiving cooking cost regularly in advance. It was found that one primary and one
percent middle schools receive cooking cost delayed by 10 days, one primary schools
receive cooking cost delayed by 1 month and one middle schools receive cooking cost in
advance delayed by 20 days as shown in Table-2.3; it was also found that E-transfer was
the preferred mode of payment for the cooking cost in all sample schools.
Table-2.3: Availability of Cooking Cost
S.No Particulars No. of Schools
PS MS
1 No. of schools in which cooking cost was received
regularly and in advance 19 (86.36) 12 (80.0)
2
How much delay in receiving the cooking
cost in advance
10 days 1 (33.33) 1 (33.33)
20 days - 2 (66.67)
1 Months 2 (66.67) -
4
In case of delay, how does the school/implementing
agency manages to ensure that there is no disruption in
the feeding programme
- -
5
Mode of payment of cooking Cost In cash - -
By Cheque - -
E-Transfer 22 (100.0) 15(100.0)
Total No. of schools 22 (100.0) 15(100.0) Note: Figures in brackets indicate percentage to total
Source: Survey conducted in the Sample Schools using the structured schedule.

103
Information Regarding Cooks
It was found that in all sample primary schools and middle schools, MDM was
being served by the appointed cook-cum-helpers, 55 in primary and 76 in middle
schools. In all sample primary and middle schools the number cooks were sufficient as
per GOI norms. The cooks were mostly females and their salary was Rs. 1000/ per
month. The salary of the cooks was paid through the cheques. Out of total appointed
cooks, the share of general category cooks appointed only 1.31 percent in middle
schools. The OBC cooks were found about 52.73 percent in primary and 68.42 percent in
middle schools. The Minority cooks were appointed in 7.27 percent primary and 6.58
percent middle schools. The proportion of SC cooks was observed in 30.91 percent of
primary and 21.05 percent in middle schools as evident from Table-2.4.
A training module for the cook-cum-helpers is available in all sample primary
and middle schools. This module is provided to all the cooks. The MDM Coordinator in
all sample primary and middle schools imparts training to the working cook-cum-
helpers. Medical check-up of the cooks was done in 81.82 percent primary and 53.95
percent middle schools.
Table 2.4: Availability of Cook-cum-helpers Sl.No. Particulars No. of Schools
PS MS
1 Mode of appointment of cook-cum-
helper in Schools
By VEC/SMC 22 (100.0) 15 (100.0)
2 Number of schools in which cooks were sufficient in
number as per GOI 22 (100.0) 15 (100.0)
3 No. of Cooks in schools
Male 7 (2.73) 21 (27.64)
Female 48 (87.27) 55 (72.36)
Total 55 (100.0) 76 (100.0)
4 Monthly salary of cook Rs. 1000/- per
month 55 (100.0) 76 (100.0)
Rs. 2000/- per
month
- -
5 Mode of Payment
By Cash - -
By Cheque 55 (100.0) 76 (100.0)
6 Payment is regular Yes 55 (100.0) 76 (100.0)
No - -
7
No. of cooks per social category
1. SC 17 (30.91) 16 (21.05)
2. ST 5 (9.09) 2 (2.64)
3 .OBC 29 (52.73) 52 (68.42)
4 .Minority 4 (7.27) 5 (6.58)
5. Others(GEN) - 1 (1.31)

104
8. Availability of Training Modules for
Cooks
Yes 55 (100.0) 76 (100.0)
No - -
9. If Yes, provided modules Yes 55 (100.0) 76 (100.0)
No - -
10. Training of Cooks Yes 55 (100.0) 76 (100.0)
No - -
11.
If Yes, what was the training venue BRC 55 (100.0) 76 (100.0)
CRC - -
Any other - -
12. Who is the Trainer MDM
Coordinator 55 (100.0) 76 (100.0)
13. Is the meal prepared and transported by the Centralized
kitchen/ NGO, whether cook-cum-helpers have been
engaged to serve the meal to the children at school level.
NA
14. Is there any medical checkup of the
cooks
Yes 45 (81.82) 41 (53.95)
No 10 (18.18) 35 (46.05) Note: Figures in brackets indicate percentage to total
Source: Survey conducted in the Sample Schools using the structured schedule.
Regularity in Serving Meal
It was found that in all sample primary and middle schools hot, cooked meal was
provided to the students on a daily basis. Regularity in supplying of hot cooked meal to
the students of these schools has been observed by enquiring from the students, teachers,
parents as well as MDM registers was also verified. It is reflected from the Table 2.5 that
during the last three months (Dec. 14, Jan and Feb 2015) how much day’s food not
served to the students.
Table 2.5: Regularity in Serving Meal
Sl.No. Particulars No. of Schools
PS MS
Yes No Yes No
1. Everyday served Hot Cooked Meal 22 (100.0) - 15(100.0) -
2.
last three
months how
much days
food not
served
(Multipale
response)
Dec.
1-8 3 (60.0) 7 (87.5)
8-15 2 (40.0) 1 (12.5)
Total 5 (22.72) 8 (53.33)
Jan.
1-8 1 (14.29) 6 (100.0)
8-15 6 (85.71) -
Total 7 (31.82) 6 (40.0)
Feb.
1-8 5 (45.45) 5 (71.43)
8-15 6 (54.55) 2 (28.57)
Total 11 (50.0) 7 (46.66)
3. Item (ii) Reason for not served food (Multipale response)
Dec. Fuel Not available 2 (40.00) 1 (12.5)

105
Dec. Fund not available 3 (60.00) 3 (37.5)
Jan. Food grains not available 5 (71.43) 4 (66.67)
Jan. Fund not available 2 (28.57) 1 (16.67)
Jan. Fuel not available 1 (14.29) 3 (50.0)
Feb. Food grains not available 5 (45.45) 1 (14.29)
Feb. Fund not available 5 (45.45) 1 (14.29)
Feb. Due to H.M. Transfer 1 (9.09) 6 (85.71)
Quality and Quantity of Menu
The quality and quantity of MDM was examined and it was found that in 45.45
percent primary and 40.0 percent middle schools the quality of meal was good while in
the remaining primary and middle schools it was found to be normal. The quantity of the
meal supplied was sufficient in all sample primary and middle schools. It was found that
all selected primary and middle schools were providing the prescribed quantity of mid
day meal to students (Table 2.6).
Table 2.6: Quality and Quantity of Meal
Sl.
No. Particulars
No. of Schools
PS MS
1.
Quality of meal
Good 10(45.45) 6 (40.0)
Normal 12(54.55) 9 (60.0)
Bad - -
2.
Quantity of meal
Sufficient 22(100.0) 15(100.0)
Normal - -
Less - -
3. Quantity of pulses used in the meal
(20 gram/student PS and 30gram/student MS)
22(100.0) 15(100.0)
4. Quantity of green leafy vegetable in the meal
(50 gram/student PS and 75 gram/student MS)
22(100.0) 15(100.0)
5. Iron Iodine mixed salt used in
Meal
Yes 22(100.0) 15(100.0)
No - -
6. Children were satisfied with the
Served meal
Yes 22(100.0) 15(100.0)
No - -
7. Method for measuring the food grains and other item
(Measure Kg)
22 100.0) 15(100.0)
8. Method for measuring the served meal (According to
Requirement)
22(100.0) 15(100.0)
9. Children were not satisfied the meal give Reasons - -
Total No. of Schools 22(100.0) 15(100.0)
Note: Figures in brackets indicate percentage to total
Source: Survey conducted in the Sample Schools using the structured schedule

106
Variety of Menu
District authorities decide the weekly menu in all sample primary and middle
schools. All sample primary and middle schools display weekly menu at a noticeable
place. All sample primary and middle schools follow weekly menu and use locally
available ingredients. The students of all the sample schools get sufficient calories from
MDM as is evident from Table 2.7.
Table 2.7: Variety of the Menu of MDM
Sl.No. Particulars No. of Schools
PS MS
1. Who decides the weekly
menu District Authority 22(100.0) 15(100.0)
2. Weekly menu was displayed
at school noticeable place `
Yes 22(100.0) 15(100.0)
No - -
3. If Yes, All people can see
the menu
Yes 22(100.0) 15(100.0)
No - -
4. Weakly menu followed Yes 22(100.0) 15(100.0)
No - -
5. Menu includes locally
available in ingredients
Yes 22(100.0) 15(100.0)
No - -
6. Sufficient calories from
MDM
Yes 22(100.0) 15(100.0)
No - - Note: Figures in brackets indicate percentage to total
Source: Survey conducted in the Sample Schools using the structured schedule
Display of Information under Right to Education Act, 2009:
It has been found that all the sample primary and middle schools which cooked MDM on
their premises received rice for the preparation of MDM. Daily menu has been shown at
the right place in the all sample school. In the last month 52838 students of the sample
primary schools and 62888 students of the sample middle schools have taken MDM.
MDM. Display of MDM Logo was not found in any sample primary and middle schools
(Table-2.8).
The name of sample primary and middle schools where MDM Logo was not displayed is
given in Annexure 2.8

107
Table-: 2.8 Display of information under Right to Education Act, 2009 at the School
level at prominent place
Note: Figures in brackets indicate percentage to total
Source: Survey conducted in the Sample Schools using the structured schedule
Distribution of MDM
The number of students of primary and middle schools availing MDM was
counted on the day of our visit in these sample schools. Their number was also verified
from the MDM register. Table-2.9 indicates that 4338 students were enrolled in 22
sample primary and 7425 students were enrolled in 15 sampled middle schools of Siwan
district. On the day of visit 71.54 percent children of primary schools and 63.04 percent
student of middle schools were present in the school. In both types of schools all student
were availing MDM as per MDM register on the day of visit.
Table-2.9: Children Availing MDM on the Day of Visit and as per School Registers
Note: Figures in brackets indicate percentage to total
Source: Survey conducted in the Sample Schools using the structured schedule
Discrimination in Cooking
Queue was observed for serving and seating arrangement for eating of food in all
sampled primary and middle schools of Siwan district. It has been observed that in none
of the sample primary and middle schools gender, caste or community discrimination in
cooking and serving or seating arrangement was observed as shown in Table-2.10.
Sl. No. Particulars No. of Schools
PS MS
1 Food Grain received Wheat - -
Rice 22 (100.0) 15 (100.0)
2 Other material purchase & use 22 (100.0) 15 (100.0)
3 Last month how many student take MDM 52838 62888
4 Daily Menu 22 (100.0) 15 (100.0)
5 Display MDM Logo on school Building - -
Sl.
No. Particulars
No. of Schools
PS MS
1 No. of children enrolled in schools 4338(100.0) 7425(100.0)
2 No. of children attending the school on the day of
visit 3103(71.54) 4681(63.04)
3 No. of children availing MDM as per MDM register 3103(100.0) 4681(100.0)
4 No. of children actually availing MDM on the day
of visit 3103(100.0) 4681(100.0)
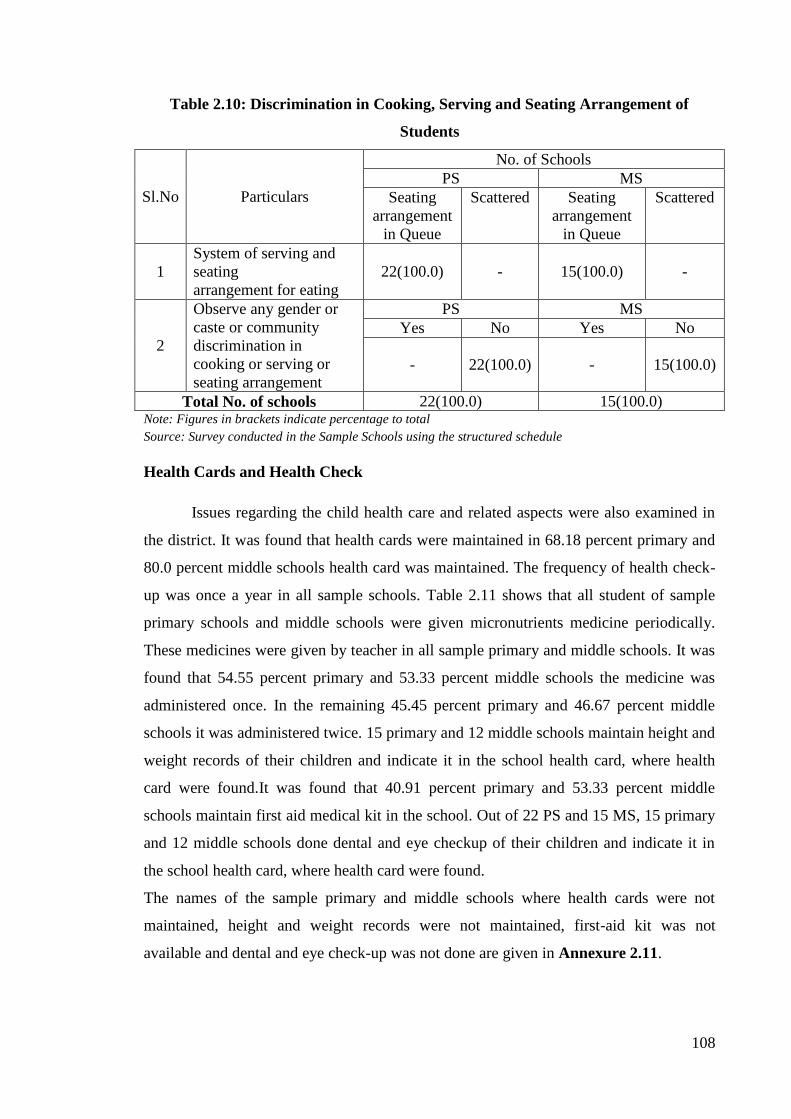
108
Table 2.10: Discrimination in Cooking, Serving and Seating Arrangement of
Students
Sl.No Particulars
No. of Schools
PS MS
Seating
arrangement
in Queue
Scattered Seating
arrangement
in Queue
Scattered
1
System of serving and
seating
arrangement for eating
22(100.0) - 15(100.0) -
2
Observe any gender or
caste or community
discrimination in
cooking or serving or
seating arrangement
PS MS
Yes No Yes No
- 22(100.0) - 15(100.0)
Total No. of schools 22(100.0) 15(100.0) Note: Figures in brackets indicate percentage to total
Source: Survey conducted in the Sample Schools using the structured schedule
Health Cards and Health Check
Issues regarding the child health care and related aspects were also examined in
the district. It was found that health cards were maintained in 68.18 percent primary and
80.0 percent middle schools health card was maintained. The frequency of health check-
up was once a year in all sample schools. Table 2.11 shows that all student of sample
primary schools and middle schools were given micronutrients medicine periodically.
These medicines were given by teacher in all sample primary and middle schools. It was
found that 54.55 percent primary and 53.33 percent middle schools the medicine was
administered once. In the remaining 45.45 percent primary and 46.67 percent middle
schools it was administered twice. 15 primary and 12 middle schools maintain height and
weight records of their children and indicate it in the school health card, where health
card were found.It was found that 40.91 percent primary and 53.33 percent middle
schools maintain first aid medical kit in the school. Out of 22 PS and 15 MS, 15 primary
and 12 middle schools done dental and eye checkup of their children and indicate it in
the school health card, where health card were found.
The names of the sample primary and middle schools where health cards were not
maintained, height and weight records were not maintained, first-aid kit was not
available and dental and eye check-up was not done are given in Annexure 2.11.
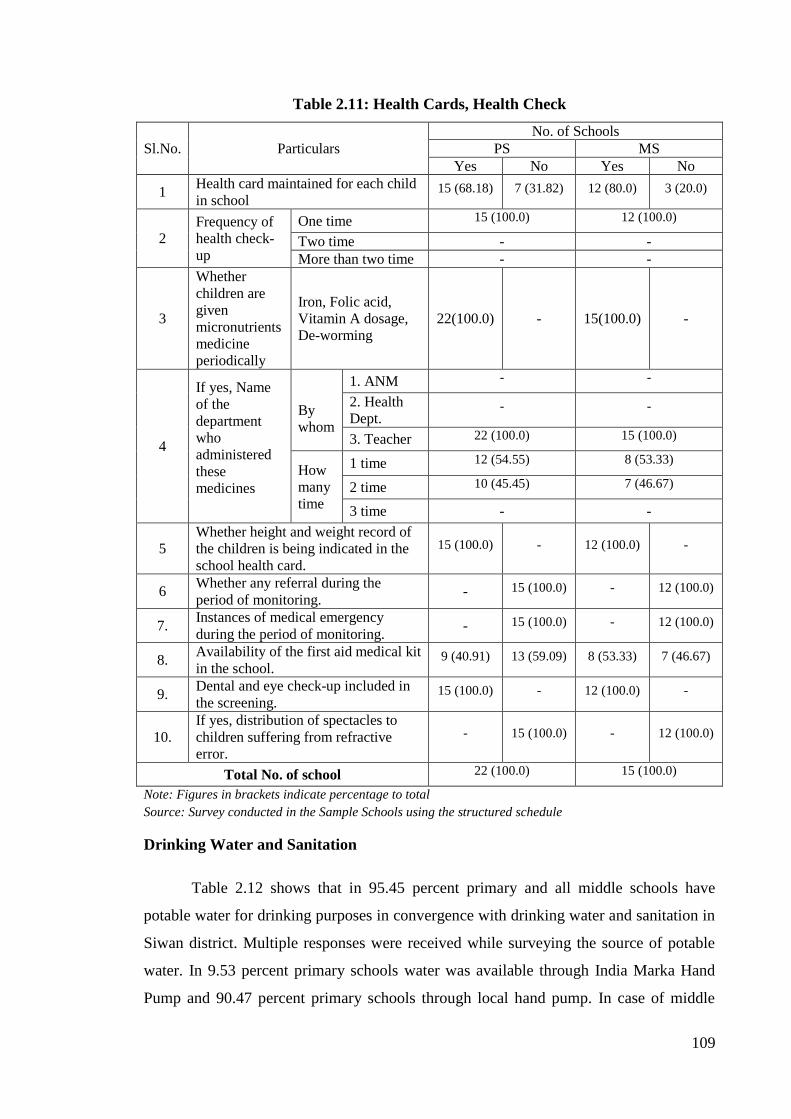
109
Table 2.11: Health Cards, Health Check
Sl.No. Particulars
No. of Schools
PS MS
Yes No Yes No
1 Health card maintained for each child
in school 15 (68.18) 7 (31.82) 12 (80.0) 3 (20.0)
2
Frequency of
health check-
up
One time 15 (100.0) 12 (100.0)
Two time - -
More than two time - -
3
Whether
children are
given
micronutrients
medicine
periodically
Iron, Folic acid,
Vitamin A dosage,
De-worming
22(100.0) - 15(100.0) -
4
If yes, Name
of the
department
who
administered
these
medicines
By
whom
1. ANM - -
2. Health
Dept. - -
3. Teacher 22 (100.0) 15 (100.0)
How
many
time
1 time 12 (54.55) 8 (53.33)
2 time 10 (45.45) 7 (46.67)
3 time - -
5
Whether height and weight record of
the children is being indicated in the
school health card.
15 (100.0) - 12 (100.0) -
6 Whether any referral during the
period of monitoring. - 15 (100.0) - 12 (100.0)
7. Instances of medical emergency
during the period of monitoring. - 15 (100.0) - 12 (100.0)
8. Availability of the first aid medical kit
in the school. 9 (40.91) 13 (59.09) 8 (53.33) 7 (46.67)
9. Dental and eye check-up included in
the screening. 15 (100.0) - 12 (100.0) -
10.
If yes, distribution of spectacles to
children suffering from refractive
error.
- 15 (100.0) - 12 (100.0)
Total No. of school 22 (100.0) 15 (100.0)
Note: Figures in brackets indicate percentage to total
Source: Survey conducted in the Sample Schools using the structured schedule
Drinking Water and Sanitation
Table 2.12 shows that in 95.45 percent primary and all middle schools have
potable water for drinking purposes in convergence with drinking water and sanitation in
Siwan district. Multiple responses were received while surveying the source of potable
water. In 9.53 percent primary schools water was available through India Marka Hand
Pump and 90.47 percent primary schools through local hand pump. In case of middle

110
school 6.67 percent water was available through India Marka hand pumps and 93.33
percent through local hand pumps. It was found that 42.86 percent primary and 53.33
percent middle schools water supply was done by SSA and 57.14 percent primary and
46.67 percent middle schools water supply was done by PHED (Public Health
Engineering Department).
Table 2.12: Drinking Water and Sanitation
Sl.No. Particulars
No. of Schools
PS MS
Yes No Yes No
1
Whether poTable water is available for
drinking purpose in convergence with
Drinking Water and Sanitation
21
(95.45)
1
(4.55)
15
(100.0) -
2
Available of
potable water
(Multiple
Response)
Tap water - -
India Marka Hand
pump 2 (9.53) 1 (6.67)
Local Hand pump 19 (90.47) 14 (93.33)
Jet Pump - -
3. Which
scheme
SSA Scheme 9 (42.86) 8 (53.33)
PHED 12 (57.14) 7 (46.67)
Total No. of School 22(100.0) 15(100.0)
Note: Figures in brackets indicate percentage to total
Source: Survey conducted in the Sample Schools using the structured schedule
Ceasefire Available in School
According to information it was found that 59.09 percent primary and 60.0
percent middle schools have ceasefire, as shown in Table 2.13. Annexure 2.13 has the
name of schools where ceasefire was not available.
Table 2.13: Ceasefire Available in School
Sl.No. Particulars
No. of Schools
PS MS
Yes No Yes No
1 Ceasefire Available 13 (59.09) 9 (40.91) 9 (60.0) 6 (40.0)
2. If yes, Name of ceasefire ABC Laxmi Note: Figures in brackets indicate percentage to total
Source: Survey conducted in the Sample Schools using the structured schedule

111
Kitchen Devices
The general information of kitchen devices available in the schools shows that
cooking utensils were available in all the sample primary and middle schools of Siwan
district. It was found that all sample schools had sufficient cooking utensils. It was found
that 50.00 percent primary and 40.0 percent middle schools were funded for kitchen
devices through kitchen device fund, 18.18 percent primary and 6.67 middle schools are
funded through MME fund and 31.82 percent primary schools and 53.33 percent middle
schools were funded through MDM fund. It was found that eating plates are available in
50 percent primary and 73.33 percent middle schools. It was found out of 11 PS and 11
MS, 9 primary and 7 middle schools had sufficient eating plates. Cooking and serving
utensils kitchen devices are funded 6 primary and 10 middle schools through MME and
5 primary and 1 middle schools through MDM and other sources.
The list of schools where utensils/kitchen devices were not sufficient and eating plates
not available is given in Annexure 2.14.
Table 2.14: Kitchen Devices
Sl.No. Particulars No. of Schools
PS MS
Yes No Yes No
1 Whether cooking utensils are
available in the school
22(100.0) - 15(100.0) -
2.
Whether cooking
utensils are available
sufficient
Sufficient 22(100.0) 15(100.0)
Partial -
-
3
Source of funding for
cooking and serving
utensils kitchen
devices
Kitchen
devices Fund
11 (50.0) 6 (40.0)
MME 4 (18.18) 1 (6.67)
Other(MDM) 7 (31.82) 8 (53.33)
4 Whether eating plates etc. are
available in the school 11 (50.0) 11 (73.33)
5 If yes, utensils kitchen devices
sufficient 9 (81.82) 7 (63.64)
6
Source of cooking and
serving utensils
kitchen devices
MME 6 (54.55) 10 (90.91)
Community
contribution - -
Other MDM
Scheme 5 (45.45) 1 (9.09)
Total No. of School 22(100.0) 15(100.0) Note: Figures in brackets indicate percentage to total
Source: Survey conducted in the Sample Schools using the structured schedule

112
Infrastructure of Kitchen
Information related to infrastructure of kitchen in all sample primary and middle
schools in Siwan district was analyzed. It was found that 59.09 percent primary and 80.0
percent middle schools were having kitchen. The pucca kitchen-cum-store was available
in 38.46 percent primary schools and 33.33 percent middle schools while only kitchen
was available in 61.54 percent primary and 66.67 percent middle schools and all of them
were used.
In 80.0 percent primary and 75.0 percent middle schools kitchen-cum-store was
constructed under MDM scheme, 62.5 percent primary and 50.0 percent middle schools
kitchen was constructed under MDM as shown in Table-2.15. In 20.0 percent primary
and 25.0 percent middle schools kitchen-cum-store was constructed through SSA
scheme, 37.5 percent primary and 50.0 percent middle schools kitchen was constructed
through SSA scheme. It was find that 4 primary schools and 4 middle schools prepared
MDM in additional room, 5 primary school and 1 percent middle school prepared food in
open fields. All primary and middle schools have kitchen and store away from
classrooms. In 90.91 percent primary and 73.33 percent middle schools food is prepared
firewood, 20.0 percent middle schools food is prepared coal and 9.01 percent primary
and 6.67 middle schools LPG is used for cooking food.
Annexure 2.15 The list of schools where the kitchen is not available
Table 2.15: Infrastructure of Kitchen
Sl.No. Particulars No. of Schools
PS MS
Kitchens are available 13 (59.09) 12 (80.0)
1 No. of school in which
pucca kitchen-cum store
available
Kitchen-cum –store 5 (38.46) 4 (33.33)
Kitchen 8 (61.54) 8 (66.67)
(a) No. of school in which
pucca kitchen constructed
and used
Kitchen-cum –store 5 (100.0) 4 (100.0)
Kitchen 8 (100.0) 8 (100.0)
(b) Under which scheme
Kitchen- cum-store
constructed
MDM Kitchen cum
store
4 (80.0) 3 (75.0)
Kitchen 5 (62.5) 4 (50.0)
SSA Kitchen cum
store
1 (20.0) 1 (25.0)
Kitchen 3 (37.5) 4 (50.0)
(c) Constructed but not in use - -
(d) Under construction - -

113
(e) Sanctioned, but not started - -
(f) Not sanctioned 9 (100.0) 3 (100.0)
2 In case the pucca kitchen-
cum store is not available,
where is the food being
cooked?
Additional Room 4 (44.44) 2 (66.67)
Open field 5 (55.56) 1 (33.33)
3
Where the food grains/
other ingredients are
being stored?
Kitchen cum store 5 (22.73) 4 (26.67)
Kitchen 2 (9.09) -
Additional Room 15 (68.18) 11(73.33)
4 Kitchen-cum-store is neat
and cleaned
Kitchen cum store 5 (100.0) 4 (100.0)
Kitchen 8 (100.0) 8 (100.0)
5 Is there kitchen & store away from class room of
school
13 (100.0) 12(100.0)
6
Whether MDM is being
cooked by using firewood
or LPG based cooking?
Fire wood 20 (90.91) 11(73.33)
Coal - 3 (20.0)
LPG 2 (9.01) 1 (6.67)
7 Whether on any day there was interruption due to non-
availability of firewood or LPG?
- -
Total No. of School 22 (100.0) 15(100.0) Note: Figures in brackets indicate percentage to total
Source: Survey conducted in the Sample Schools using the structured schedule
Availability of Cover Drum
As Table 2.16 indicates only 86.36 percent primary and 93.33 percent middle
schools have covered drums for the food grains. All sample primary school of these
covered drums available through M.M.E scheme in primary school. In case of middle
schools 7.14 percent was available through SSA and 92.86 percent through MME
scheme in Siwan district.
List of schools where covered drums for food grains are not available is given in
Annexure 2.16.
Table 2.16: Availability of Cover Drum
Sl.No. Particulars No. of Schools
PS MS
Yes No Yes No
1 Availability of cover drum of food
grains in school
19(86.36) 3(13.64) 14(93.33) 1 (6.67)
2. If yes, which
scheme
SSA through - 1 (71.42)
Management,
Monitoring &
Evaluation
19 (100.0) 13 (92.86)
Total No. of School 22 (100.0) 15 (100.0) Note: Figures in brackets indicate percentage to total
Source: Survey conducted in the Sample Schools using the structured schedule

114
Availability of Toilets
It was found that 59.09 percent primary and 93.33 percent middle schools have
separate toilet for boys and girls. Out of these, 84.62 percent primary and 92.86 percent
middle school use toilets properly. It was found that 40.91 percent primary and 26.67
percent middle schools have common toilets. Out of these, 77.78 percent primary and all
middle schools use common toilets properly.
Annexure 2.17 contains the names of the sample primary and middle schools which do
not have separate toilets for boys and girls and common toilets, etc.
Table 2.17: Availability of toilets
Sl.No. Particulars No. of Schools
PS MS
Yes No Yes No
1 Availability of separate toilet for
boys and girls in school
13(59.09) 9 (40.91) 14(93.33) 1 (6.67)
2. If yes, Proper use of toilet 11(84.62) 2 (15.38) 13(92.86) 1 (7.14)
3 Is there available common toilet 9 (40.91) 13(59.09) 4 (26.67) 11(73.33)
4 If yes, Proper use of toilet 7 (77.78) 2 (22.22) 4 (100.0) -
Total No. of School 22 (100.0) 15 (100.0) Note: Figures in brackets indicate percentage to total
Source: Survey conducted in the Sample Schools using the structured schedule
IT Infrastructure (computer) in school
As Table 2.18 indicates only 20.0 percent middle schools have computers. None
of the primary schools possess any IT infrastructure. None of them have an internet
connection and thus cannot use any IT enabled services.
Table 2.18: IT infrastructure available (Computer) School level
Sl.No. Particulars No. of Schools
PS MS
Yes No Yes No
1. Is computer available in school - 22(100.0) 3 (20.0) 12 (80.0)
2. If yes give the no. of computer - 9
3. Available of internet connection - - - 3 (100.0)
4. Using any IT/ IT enable services based
(like E-learning etc.)
- - - 3 (100.0)
Note: Figures in brackets indicate percentage to total
Source: Survey conducted in the Sample Schools using the structured schedule

115
Safety and Hygiene
Environment, safety and hygiene were found satisfactory in majority of the
sample primary and middle schools. As Table 2.19 shows that environment was good in
9.09 percent primary and 26.67 percent middle schools. Safety was good in 13.64
percent primary and 26.67 percent middle schools. The hygiene was observed to be in
good condition in 13.63 percent primary and 33.33 percent in middle schools.
Environment was satisfactory in 86.36 percent primary and 73.33 percent middle
schools. Safety level was satisfactory in 72.72 percent primary and 60.0 percent middle
schools. Hygiene level was satisfactory in 81.82 percent primary and 60.0 percent middle
schools. Environment was unsatisfactory in 4.55 percent primary school. Safety level
was unsatisfactory in 13.64 percent primary and 13.33 percent middle schools. Hygiene
level was unsatisfactory in 4.54 percent in primary and 6.67 percent middle schools.
Table 2.19: General Impression of Environment, Safety and Hygiene
Note: Figures in brackets indicate percentage to total
Source: Survey conducted in the Sample Schools using the structured schedule
Encouragement of Children to adopt Good Practices
It was found that 95.45 percent primary and 80.0 percent middle schools were
encouraged Students to wash their hands before and after meals. Students were
encouraged to receive MDM in orderly manner in 95.45 percent primary school and 80.0
percent middle schools. It is also found that in 77.27 percent primary and all middle
schools children were taught about conservation of water. Cooking process and storage
of fuel was found to be safe from fire hazard in 95.45 percent primary and all middle
schools.
Schools where students did not wash their hands before and after eating and
where MDM was not served in an orderly manner are listed in Annexure 2.20.
Sl. No
Particulars No. of Schools PS MS
Good Satisfactory Un
satisfactory Good Satisfactory
Un- satisfactory
1 Environment 2 (9.09) 19 (86.36) 1 (4.55) 4 (26.67) 11 (73.33) -
2 Safety 3 (13.64) 16 (72.72) 3 (13.64) 4 (26.67) 9 (60.0) 2 (13.33)
3 Hygiene 3 (13.63) 18 (81.82) 1 (4.54) 5 (33.33) 9 (60.0) 1 (6.67)
4 Total No. of
School 22(100.0) 15(100.0)

116
Table 2.20: Encouragement of Children to adopt Good Practices
Note: Figures in brackets indicate percentage to total
Source: Survey conducted in the Sample Schools using the structured schedule
Serving Meal to students before tasting
Before the meal was served to students it was tasted by the teachers, VSS and
Parents. It was found that MDM was tasted daily by teachers of all primary and middle
schools. It was seldom tasted by VSS and parents in all primary and middle schools.
Table 2.21: Before serving meal to students by whom tasted
Note: Figures in brackets indicate percentage to total
Source: Survey conducted in the Sample Schools using the structured schedule
Community Participation and Awareness
Around 68.18 percent parents of primary school students and 73.34 percent
parents of middle schools children supervised MDM on a daily basis and found it to be
satisfactory. In case of VSSs it was 77.27percent in primary and 60.0 percent in middle
schools. Supervision by Panchayat/urban bodies was found satisfactory in 54.55 percent
primary and 46.67 percent middle schools. In 4.55 percent parents from primary and
13.33 percent parents from middle and only 6.67 percent VSSs bodies from middle
schools rated the MDM as good during daily supervision.
Sl.
No.
Particulars No. of Schools
PS MS
Yes No Yes No
1 Children encouraged to wash hands
before and after eating
21(95.45) 1 (4.55) 12 (80.0) 3 (20.0)
2 Children take MDM in an orderly 21(95.45) 1 (4.55) 12 (80.0) 3 (20.0)
3 Conservation of water in school 17(77.27) 5(22.73) 15(100.0) -
4 Cooking process and storage of fuel
is safe from fire hazard.
21(95.45) 1 (4.55) 15(100.0) -
5 Total No. of School 22 (100.0) 15 (100.0)
Sl.
No. Particulars
No. of Schools
PS MS
Daily Seldom Daily Seldom
1 Tasted by Teacher 22(100.0) - 22(100.0) -
2 Tasted by SMC - 22(100.0) - 15(100.0)
3 Tasted by Parents - 22(100.0) - 15(100.0)
Total No. of School 22 (100.0) 15 (100.0)

117
At the time of monitoring of MDM, it was rated as satisfactory by 95.45 percents
parents, 100.0 percent VSSs and 54.55 percent panchayat/urban bodies in primary
schools. Similarly, 86.67 percents parents, 73.34 percent VSSs and 53.33 percent
panchayat/urban bodies in middle schools rated the monitoring of MDM as satisfactory.
MDM was monitored to be good by 4.55 percent parents in primary schools. Similarly,
13.33 percent parents, 6.67 percent VSSs in middle schools.
Table 2.22: Participation of Parents/VSS/Urban bodies in Monitoring of MDM
Sl.
No
Particulars PS MS
Parents SMC/VSS Panchayat/
Urban
bodies
Parents SMC/
VSS
Panchayat/
Urban bodies
Supervision of daily MDM
1 Good 1 (4.55) - - 2 (13.33) 1 (6.67) -
2 Satisfactory 15(68.18) 17 (77.27) 12 (54.55) 11(73.34) 9 (60.0) 7 (46.67)
3 None 6 (27.27) 5 (22.73) 10 (45.45) 2 (13.33) 5(33.33) 8 (53.33)
Monitoring of the MDM
1 Good 1 (4.55) - - 2 (13.33) 1 (6.67) -
2 Satisfactory 21(95.45) 22 (100.0) 12 (54.55) 13(86.67) 11(73.34) 8 (53.33)
3 None - - 10 (45.45) - 3 (20.0) 7 (46.67)
4 Total No. of
school
22 (100.0) 15 (100.0)
Note: Figures in brackets indicate percentage to total
Source: Survey conducted in the Sample Schools using the structured schedule
Awareness about MDM
It was found that community members maintained roster for supervision of MDM
in 63.64 percent primary and 46.67 percent middle schools. Table 2.23 shows that 86.36
percent primary and 93.33 percent middle schools have social audit mechanism in the
school.
The list of schools where roster was not being maintained by the community members
for supervision of the MDM is given in Annexure 2.23.

118
Table 2.23: Awareness regarding MDM
Sl.
No.
Particulars No. of Schools
PS MS
Yes No Yes No
1 Roster being maintained by the
community members for
supervision of the MDM
14(63.64) 8(36.36) 7 (46.67) 8(53.33)
2 Is there any social audit
mechanism in the school
19(86.36) 3(13.64) 14(93.33) 1 (6.67)
Note: Figures in brackets indicate percentage to total
Source: Survey conducted in the Sample Schools using the structured schedule
VSS Meetings
Table 2.24 shows that SMC/VSS meeting monitoring time was one to two in 9.09
percent primary schools and three to four times was in 27.27 percent primary schools and
20.0 percent middle schools and 5 times and above in 63.64 percent primary and 80.0
percent middle schools. MDM related discussion was for one to two in 22.73 percent
primary and for three to four times was in 45.45 percent primary and 60.0 percent
middle school and 5 times and above in 31.82 percent primary and 40.0 percent middle
schools.
Table-:2.24 VSS Meetings
Sl.
No.
Particulars PS MS
1-2 3-4 5 &
above
Total 1-2 3-4 5 &
above
Total
1. No. of SMC/
VEC
meeting till
monitoring
time
2
(9.09)
6
(27.27)
14
(63.64)
22
(100.0)
- 3 (20.0) 12
(80.0
)
15
(100.0)
2. No. of
SMC/VEC
meeting to
MDM
related
discussion
5
(22.73)
10
(45.45)
7
(31.82)
22
(100.0)
- 9 (60.0) 6
(40.0
)
15
(100.0)
Total No. of
school
22 (100.0) 15 (100.0)
Note: Figures in brackets indicate percentage to total
Source: Survey conducted in the Sample Schools using the structured schedule
Inspection & Supervision
Inspection register was available in 95.45 percent primary and in all middle
schools. It has been found that 72.73 percent primary and 46.67 percent middle schools

119
have received fund under MME component. The regular inspection of MDM was
reported in all sample schools of the district.
The list of schools where inspection register was not available and fund not
received under MME is given in Annexure 2.25
Table 2.25: Inspection and Supervision of MDM by Educational Authorities
Sl.No. Particulars No. of Schools
PS MS
Yes No Yes No
1 Is there any Inspection Register
available at school level?
21
(95.45)
1
(4.55)
15
(100.0)
-
2 Whether school has received any
funds under MME component?
16
(72.73)
6
(27.27)
7
(46.67)
8
(53.33)
3 Is regular inspections of MDM 22
(100.0)
- 15
(100.0)
-
Note: Figures in brackets indicate percentage to total
Source: Survey conducted in the Sample Schools using the structured schedule
Inspection and Supervision of MDM
The regular inspection of MDM was reported in all sample primary and middle
schools of the district. The inspection was also done by the BEO, Pradhan, MDM
Coordinator, CRC Coordinator, BRCP, DPO and VEC. As Table 2.26 shows all sample
primary schools and middle schools maximum inspection and supervision were done by
MDM BRP in Siwan district. There were no state level and tehsil level inspecting
authorities visited in the schools for MDM programme. Maximum inspections were
made by block level authorities in primary and middle school. Mostly this inspection was
made monthly in both categories of schools.
The visiting authorities remarked for good quality of MDM should be provided in
all sample schools.

120
Table: -2.26 Inspections and Supervision of MDM (Multiple Responses)
Note: Figures in brackets indicate percentage to total
Source: Survey conducted in the Sample Schools using the structured schedule
Impact of MDM
As indicated in Table 2.27 impact of MDM in all primary and middle school has
improved enrollment of students, attendance of students and full time presence of
students in schools.
Table 2.27: Impact of the MDM
Sl.No. Particulars No. of Schools
PS MS
1 Mid day meal improved Enrollment of student 22(100.0) 15(100.0)
Attendance of student 22(100.0) 15(100.0)
Present of students full
time in school
22(100.0) 15(100.0)
2 Total No. of School 22(100.0) 15(100.0) Note: Figures in brackets indicate percentage to total
Source: Survey conducted in the Sample Schools using the structured schedule
Sl.No. Particulars No. of Schools
PS MS
1 Regular inspection of the MDM food 22 (100.0) 15 (100.0)
2 Inspection by
BEO 6 (18.75) 5 (22.73)
BDO - -
Pradhan - -
MDM Co-odinator 7 (21.88) 4 (18.18)
CRC coordinator 3 (9.37) 2 (9.09)
MDM BRP 11 (34.37) 9 (40.91)
DPO 5 (15.63) 2 (9.09)
VEC - -
3 Inspecting authority
State level - -
District 12 (37.5) 6 (27.27)
Tehsil - -
Block 20 (62.5) 18 (72.73)
CRC - -
Other - -
4
Frequency of
inspections
Daily - -
Weekly - 1 (4.57)
Fortnightly 10 (31.25) 5 (22.72)
Monthly 14 (43.75) 10 (45.45)
Often 8 (25.0) 6 (27.27)
5 If any, then Remark
made by the
visiting of officers
Good Quality of
MDM should be
provided. 22 (100.0) 15 (100.0)

121
Social Harmony
In all sample primary and middle schools MDM has improved social harmony. It
was found that 90.91 percent primary and all sample middle schools help in
improvement of the nutritional status of children. Table 2.28 shows that there is 31.82
percent primary school and 46.67 percent middle schools have other incidental benefit
due to serving of meal in schools.
Table 2.28: Social Harmony
Sl.No. Particulars No. of Schools
PS MS
Yes No Yes No
1 Whether mid day meal has helped
in improvement of the social
harmony
22
(100.0)
- 14
(93.33)
1
(6.67)
2 Whether mid day meal has helped
in improvement of the nutritional
status of the children.
20
(90.91)
2
(9.09)
15
(100.0)
-
3 Is there any other incidental
benefit due to serving of meal in
schools
7
(31.82)
15
(68.18)
7
(46.67)
8
(53.33)
Note: Figures in brackets indicate percentage to total
Source: Survey conducted in the Sample Schools using the structured schedule
Grievance Redressal Mechanism
As Table 2.29 indicates that 81.82 percent primary and 60.0 percent middle
school have grievances redressal mechanism in the district for MDMs and 45.45 percent
primary and 33.33 percent schools have the district/block and school have toll free
number.
Table 2.29: Grievance Redressal Mechanisms
Sl.No. Particulars No. of Schools
PS MS
Yes No Yes No
1 Is any grievance redressal mechanism in
the district for MDMS
18
(81.82)
4
(18.18)
9
(60.0)
6
(40.0)
2 Whether the district/block/ school
having any toll free number?
10
(45.45)
12
(54.55)
5
(33.33)
10
(66.67) Note: Figures in brackets indicate percentage to total
Source: Survey conducted in the Sample Schools using the structured schedule
Views of Investigator on other Issues of MDM Implementation
The investigators opined that monitoring and evaluation of MDM team should be
regular in 63.64 percent primary schools and 60.0 percent middle schools. Use of wheat
should be increased in 81.82 percent primary schools and 60.0 percent middle schools.

122
LPG should be used for cooking in majority primary and middle schools and convenient
arrangement should be made for its availability. Use of green vegetables must be
encouraged in 22.73 percent primary and around 26.67 percent middle schools in Siwan
districts as shown in (Table-2.30).
Table 2.30: Investigator’s views and observations regarding MDM
Sl.No. Issues relevant to MDM implementation No. of Schools
PS MS
1 Monitoring & Evaluation of MDM team should be
regular
14(63.64) 9(60.0)
2 Arrangement and availability of LPG for cooking
purpose
12(54.55) 7(46.67)
3 Use of wheat of MDM 18(81.82) 9(60.0)
4 Use of Green VegeTable must be used in MDM 5(22.73) 4(26.67)
Total No. of School 22(100.0) 15(100.0)
Note: Figures in brackets indicate percentage to total
Source: Survey conducted in the Sample Schools using the structured schedule

123
Chapter-III
Major Findings
Monitoring and evaluation of Sarva Shiksha Abhiyan (SSA) was conducted by the
Giri Institute of Development Studies, Lucknow during 15 March to 31 March, 2015.
The survey covered 22 primary schools and 15 middle schools in the Siwan district as
suggested by the Ministry of Human Resource Development, Department of School
Education and Literacy, Government of India. Besides monitoring and evaluation of SSA
programme in the district, the working of MDM was also monitored and evaluated. The
focus of monitoring of MDM was limited to cover only key components of the MDM
programme. These components of MDM monitoring and evaluations were selected by
the Ministry. On the basis of field survey of primary and middleschools where MDM is
being implemented, following conclusions have been arrived at:
During the visits of schools of district Siwan 86.36 percent sample primary and
93.33 percent middle schools reported to have received food grains within one
month and its quality was good.
There was 90.91 percent primary and 86.67 percent middle schools reported
timely release of MDM funds from state, 90.91 percent sample primary and 93.33
percent middle schools reported timely release of MDM funds from district and
81.82 percent sample primary schools and 80.0 percent middle schools reported
timely release of MDM funds from the block.
There was 86.36 percent primary and 80.0 percent middle schools reported to
have received MDM fund in advance and regularly.
Due to unavailability of food grains etc in 11 PS 7 MS in few days of last three
months food not served to the students.
It was found that all sample primary and middle schools, hot cooked meal was
provided to students regularly. This fact was confirmed from students, teachers,
parents and from MDM registers of the concerning schools.

124
There was no difference between the number of students for whom the MDM
was prepared and those who got the MDM.
There was no difference between MDM registers and head count of students on
the day of visit of research team to the sample schools.
MDM was cooked by VSS appointed cooks. Majority of cooks were of OBC
castes and they were paid monthly salary of Rs.1000/ regularly through the
cheques.
It has been observed that in none of the sample primary and middle schools
gender, caste or community discrimination in cooking and serving or seating
arrangement.
The meal was tasted by the teachers before it was served to the students.
The MDM was served by cooks and the students received MDM in queue.
The menu was displaced at noticeable places in all primary schools and percent
middle schools and it is also verified that the all sample schools followed the
menu in the district.
MDM logo was not displayed on any sample primary and middle schools
buildings.
The prescribed quantity of MDM was given to students and was found to be
sufficient. The quality of MDM was found to be ‘Good’ in 45.45 percent primary
and 40.0 percent middle schools; while the quality was ‘Normal’ in 45.55 percent
primary and 60.0 percent middle schools.
Health card were maintained in 68.18 percent primary and 80.0 percent middle
schools. Likewise all students of sample primary and middle schools were given
micronutrients medicine periodically by Teachers.
The availability of potable water through Local hand pumps was found in almost
all primary and middle schools.

125
Kitchens were available in only 59.09 percent primary and 80.0 percent middle
schools. In all the sample primary and middle schools, food was cooked using
maximum fire wood.
It was found that 59.09 percent primary and 60.0 percent middle schools have
ceasefire.
The kitchen utensils were available in all sample primary and middle schools.
The availability of covered drums was found in 86.36 percent primary and 93.33
percent middle schools. Cover drums were reported to have been purchased
majorly from funds of MME Scheme.
Separate toilets for boys and girls were available in 59.09 percent primary and
93.33 percent middle schools.
The Computers was available in only 3(20.0 percent) middle schools.
The condition of environment, safety and hygiene was satisfactory in majority
primary and middle schools.
It was observed that students were encouraged to wash their hand before and after
the meal. The students were seen receiving the MDM in queue in almost all the
schools. The practice of water conservation was seen in the schools and cooking
process and storage of fuel were found to be safe from fire hazards in almost all
schools.
The awareness of parents and community about MDM was found to be
satisfactory in most of the schools.
The frequency of VSS meeting MDM related discussion was for one to two in
22.73 percent primary and for three to four times was in 45.45 percent primary
and 60.0 percent middle school and 5 times and above in 31.82 percent primary
and 40.0 percent middle schools.
Inspection and supervision by district officials on monthly basis covered in 95.45
percent primary and all sample middle schools. Process of inspection, supervision
of MDM was found to be adequate.

126
It was observed that MDM was helpful in improving the social harmony. The
grievance redressal mechanism was active and maximum schools not having toll
free number.
The impact of MDM was found to be positive in all sample primary and middle
schools. MDM has improved enrollment of students, attendance of students and
full time presence of students in all sample schools.
The views of investigators about different aspect of implementation of MDM in
the district were found to be positive. The investigators views were that
monitoring and evaluation of MDM should be regular basis at school level,
Wheat also should be provided to schools for MDM and LPG should be ensured
for cooking instead of woods.

127
ANNEXURE
Annexure 2.1
Schools in which Food Grains Facility not available within One Month
Primary Schools
1 Bathani 3 Pipra
2 Rajapur Mallahi Tola
Middle School
1 Govt. Basantpur
Food Grains not delivered to Lifting Agency within Proper Time
Primary School
1 Govt. Basantpur
Annexure 2.8
MDM Logo not Displayed on School Building
Primary Schools
1 Lakhrawn 12 Ahir Tola (Raghunathpur)
2 Bathani 13 Konauli
3 Rajapur 14 Naza Khila
4 Belvasa 15 Dalitodhar
5 Nawadhih 16 Mirzapur
6 Khuzwa 17 Bharthui Garh
7 Haripalpur 18 Ziradei Kanya
8 Makdoom Saray 19 Ganesh Smarak
9 Rajapur Mallahi Tola 20 Basantpur Kanya
10 Titra 21 Pipra
11 Navalpur 22 Ruiya
Middle Schools
1 Khori Pakad 9 Maniya
2 Rajapur 10 Govt. Ziradei
3 Ripura 11 Chakri
4 Rajapur 12 Govt. Basantpur
5 Samardha 13 Karsar
6 Kaheri 14 Govt. Urdu Naya Bazar
7 Tari 15 Sri Nagar
8 Lohgajar
Annexure 2.11
Health Card not Maintained for each Child in School
Primary Schools
1 Bathani 5 Mirzapur
2 Haripalpur 6 Ganesh Smarak
3 Makdoom Saray 7 Ruiya
4 Ahir Tola (Raghunathpur)
Middle Schools
1 Tari 3 Karsar
2 Govt. Ziradei
First aid Medical Kit not available in the Schools
Primary Schools
1 Bathani 7 Mirzapur
2 Belvasa 8 Bharthui Garh
3 Titra 9 Ziradei Kanya
4 Konauli 10 Ganesh Smarak
5 Naza Khila 11 Basantpur Kanya
6 Dalitodhar 12 Pipra
13 Ruiya

128
Middle Schools
1 Ripura 5 Maniya
2 Rajapur 6 Govt. Ziradei
3 Samardha 7 Chakri
4 Tari
Annexure 2.13
Cease fire not available
Primary Schools
1 Bathani 6 Ziradei Kanya
2 Haripalpur 7 Ganesh Smarak
3 Naza Khila 8 Pipra
4 Dalitodhar 9 Ruiya
5 Mirzapur
Middle Schools
1 Ripura 4 Maniya
2 Kaheri 5 Govt. Ziradei
3 Tari 6 Govt. Urdu Naya Bazar
Annexure 2.14
Eating Plates etc. are not available
Primary Schools
1 Bathani 7 Naza Khila
2 Haripalpur 8 Dalitodhar
3 Makdoom Saray 9 Mirzapur
4 Rajapur Mallahi Tola 10 Ziradei Kanya
5 Navalpur 11 Ganesh Smarak
6 Ahir Tola (Raghunathpur)
Middle Schools
1 Rajapur 3 Govt. Urdu Naya Bazar
2 Kaheri 4 Sri Nagar
Utensils/Kitchen Devices are not Sufficient
Primary Schools
1 Lakhrawn 2 Titra
Middle Schools
1 Rajapur 3 Lohgajar
2 Tari 4 Karsar
Annexure 2.15
Kitchens not Available
Primary Schools
1 Lakhrawn 6 Naza Khila
2 Bathani 7 Dalitodhar
3 Makdoom Saray 8 Ganesh Smarak
4 Titra 9 Basantpur Kanya
5 Konauli
Middle Schools
1 Kaheri 3 Sri Nagar
2 Maniya
Annexure 2.16
Non-availability of Covered Drum of Food Grains in School
1 Makdoom Saray 3 Dalitodhar
2 Naza Khila
Middle Schools
1 Samardha

129
Annexure 2.17
Non-availability of Toilets
Sr
.no
Name of the Schools No separate
toilet for
Girls &
Boys
No Proper
use of
Toilets
No Common
Toilet
available
No Proper use
of Toilets
Primary Schools
1 Lakhrawn
2 Makdoom Saray
3 Rajapur Mallahi Tola
4 Konauli
5 Naza Khila
6 Dalitodhar
7 Bharthui Garh
8 Ziradei Kanya
9 Ganesh Smarak
10 Lakhrawn
11 Bathani
12 Rajapur
13 Titra
14 Navalpur
15 Ahir Tola
(Raghunathpur)
16 Mirzapur
17 Basantpur Kanya
18 Pipra
19 Rajapur
20 Haripalpur
Middle Schools
1 Kaheri
2 Tari
3 Rajapur
4 Samardha
5 Lohgajar
6 Maniya
7 Govt. Ziradei
8 Chakri
9 Govt. Basantpur
10 Govt. Urdu Naya Bazar
11 Sri Nagar
Annexure 2.20
Hands not Washed before and after Eating
Primary Schools
1 Rajapur Mallahi Tola
Middle Schools
1 Ripura 3 Karsar
2 Govt. Ziradei
MDM not Served in an Orderly Manner
Primary Schools Middle Schools
1 Makdoom Saray 1 Samardha
2 Govt. Ziradei
3 Karsar

130
Annexure 2.23
Roster not being maintained by the Community Members for Supervision of MDM
Primary Schools
1 Rajapur Mallahi Tola 4 Ganesh Smarak 7 Bharthui Garh
2 Nawadhih 5 Basantpur Kanya 8 Ruiya
3 Bathani 6 Pipra
Middle Schools
1 Ripura 4 Lohgajar 7 Karsar
2 Kaheri 5 Maniya 8 Govt. Urdu Naya Bazar
3 Tari 6 Govt. Ziradei
Annexure 2.25
No any Inspection Register available at School Level
Primary Schools
1 Mirzapur
School has not received any funds under MME component
Primary Schools
1 Naza Khila 4 Basantpur Kanya
2 Dalitodhar 5 Pipra
3 Ganesh Smarak 6 Ruiya
Middle Schools
1 Kaheri 5 Govt. Ziradei
2 Tari 6 Govt. Basantpur
3 Lohgajar 7 Karsar
4 Maniya 8 Govt. Urdu Naya Bazar

131
District-5: Munger

132

131
Chapter I
Introduction
Sample Design of the Study
A total of 34 schools have been taken as sample from Munger district as shown in
Table-1.1. Out of these 34 schools, 20 are primary schools and 14 middle schools.
Table 1.1: Number of Sample Schools
Sl. No. Name of Block Primary
schools
Middle schools Total
1 Munger (Sadar) 9 3 12
2 Tatiya Bambar 3 4 7
3 Dharhra 5 4 9
4 Asarganj 3 3 6
Total 20 14 34 Source: SSA Programme, BSA, District Munger, Bihar
Table-1.2 Depicts all 37-sample schools selected from Munger district. Care has been
taken that each type of school, as per the selection criteria, is represented in the sample.
Table 1.2: School-wise list of Sample Schools
Sl.
No.
Name of the schools U-DIES Coade Category of
schools PS/
MS
Criteria for Selection
1 Govt. PS Asarganj 10240902001 PS PTR
2 PS Chapha 10240901901 PS PTR
3 PS Damodarpur 10240901801 PS PTR
4 PS Dharhra Town 10240803101 PS Civil Work
5 PS Adalpur 10240805901 PS PTR
6 PS Choti Lagma
Paswan Tola
10240806303 PS Civil Work/Flood
Effacted/PTR
7 PS. Dharhra No.2 10240803103 PS PTR
8 PS Khirodharpur 10240800801 PS PTR/Drop-out
9 PS Nauagarhi 10240104301 PS Civil Work/PTR
10 Kanya PS Chowk
Bazar
10240101703 PS CWSN
11 PS Hasanpur Mufsil 10240104801 PS CWSN
12 PS Nawada Sakarpur 10240105904 PS CWSN
13 PS Navtoliya 10240102802 PS PTR
14 PS Sheetapur 10240103602 PS PTR
15 PS Nath Tola Akela 10240108701 PS PTR/Gender Gap
16 PS Tarapur Diyara 10240104004 PS Civil Work

132
Sl.
No.
Name of the schools U-DIES Coade Category of
schools PS/
MS
Criteria for Selection
17 PS Hardiyabad 10240107602 PS PTR
18 PS Manjura Arazi
Tilkari
10240601602 PS Civil Work/PTR
19 PS Barsanda 10240604001 PS Civil Work/CWSN
20 PS Kahartoli 10240604101 PS CWSN
21 Kanya MS Hathinath 10240903504 MS Computer / Gender Gap
22 MS Jalalabad 10240902101 MS Computer
23 MS Masoomganj 10240901702 MS PTR
24 MS Hemzapur 10240806502 MS PTR/Gender Gap
25 MS Mahrna 10240805304 MS PTR
26 MS Dharahra 10240805302 MS Computer/ Civil Work
27 MS Phulka 10240800301 MS CWSN /PTR
28 MS Vasudevpur 10240100401 MS Computer/Civil
Work/PTR/Gender Gap
29 MS Sadalpur 10240102701 MS PTR
30 Balak MS Lallu
Pokhar
10240102201 MS CWSN/Computer
31 MS Lagma 10240601901 MS PTR
32 MS Kalai 10240601002 MS CWSN
33 Govt. Buniyadi PS
Tetiya Bambar
10240605204 MS PTR
34 Kanya MS Teliya MS PTR Source: BSA Office, SSA Programme, District Munger, Bihar
Tools
A well-structured was prepared to collect primary data from the selected schools.
Separate schedules have been used for primary and middle schools.

133
Chapter-II
Implementation of MDM Programme
Regularity in Supply of Food Grains
Table 2.1 shows that about 95.0 percent primary and all sample middle schools from the
sample were receiving food grains within one month. It was also found that the food
grains were delivered to the lifting agency within proper time in about 95.0 percent
primary and all sample middle schools. If the lifting agency did not deliver the food
grains to the school on time, no alternate arrangement was present, in any of the schools,
for its transportation. It has also been observed that the quality of food supplied was as
per FAQ mark in 95.0 percent primary and all sample middle schools (Table: 2.1). 95.0
percent primary and all sample middle schools, food grains were released after adjusting
the unspent balance grains of the previous month.
Annexure 2.1 The names of schools where Food grains facility not available in
advance for One month and Food grains not delivered to lifting agency within proper time.
Table 2.1: Regularity in supply of Food Grains to Schools
Sl.No. Particulars
No. of Schools
PS MS
Yes No Yes No
1. If Food grains facility available in
schools within One month
19(95.0)
1(5.00) 14(100.0) -
2. Food grains delivered to lifting agency
within proper time
19(95.0) 1(5.00) 14(100.0) -
3.
If lifting agency is not delivering the
food grains to the school how is the food
grains transported up to the schools.
No Arrangement
-
4. Whether the food grains is of FAQ Mark
- grade A
19(95.0) 1(5.00) 14(100.0) -
5.
Whether food grains are released to
school after adjusting the unspent
balance of the previous month
19(95.0) 1(5.00) 14(100.0) -
Total No. of Schools 20 (100.0) 14 (100.0) Source: Primary Data Based

134
Timely Release of Funds
It was found that 95.0 percent primary and all sample middle schools timely
received funds at State, 95.0 percent primary and all sample middle schools timely
received funds at District level and 95.0 percent primary and all sample middle schools
timely received funds at Block-level, as shown in Table-2.2.
Table 2.2: Timely Release of Funds
S.No Particulars No. of Schools
PS MS
1 Whether State is releasing funds to District on regular
basis in advance
19(95.0)
14(100.0)
2 Whether District is releasing funds to Block on regular
basis in advance
19(95.0) 14(100.0)
3 Whether Block is releasing funds to School on regular
basis in advance
19(95.0) 14(100.0)
Total No. of schools 20(100.0) 14 (100.0) Source: Primary Data Based
Cost of Cooking Received
It was found that 95.0 percent primary and all sample middle schools were
receiving cooking cost regularly in advance. One sample primary school receive cooking
cost delayed by 1 month as shown in Table-2.3, it was also found that E-transfer was the
preferred mode of payment for the cooking cost in all schools.
Table 2.3: Availability of Cooking Cost
S.No Particulars No. of Schools
PS MS
1 No. of schools in which cooking cost was received
regularly and in advance 19 (95.0) 14(100.0)
2 How much delay in receiving the
cooking cost in advance 1 Months 1 (100.0) -
4
In case of delay, how does the school/implementing
agency manages to ensure that there is no disruption
in the feeding programme
No Any
Arrangement -
5
Mode of payment of cooking Cost In cash - -
By Cheque - -
E-Transfer 20 (100.0) 14(100.0)
Total No. of schools 20 (100.0) 14(100.0)
Source: Primary Data Based
.

135
Information Regarding Cooks
It was found that in all sample primary and middle schools, MDM was being
served by the appointed cook-cum-helpers, 51 in primary and 58 in middle schools. In all
the sample primary and middle schools the number cooks were sufficient as per GOI
norms. The cooks were mostly females and their salary was Rs. 1000/ per month. The
salary of the cooks was paid through the cheques. Out of total appointed cooks, the share
of general category cooks appointed only 6.89 percent in middle schools. The OBC
cooks were found about 86.27 percent in primary and 65.52 percent in middle schools.
The proportion of SC cooks was observed in 13.73 percent of primary and 27.59 percent
in middle schools as evident from Table-2.4.
A training module for the cook-cum-helpers is available in all sample primary
and middle schools. This module is provided to all the cooks. The MDM Coordinator in
all sample primary and middle schools imparts training to the working cook-cum-
helpers. Medical check-up of the cooks was done in all sample schools.
Table 2.4: Availability of Cook-cum-helpers Sl.No. Particulars No. of Schools
PS MS
1 Mode of appointment of cook-cum-
helper in Schools
By VEC/SMC 20 (100.0) 14 (100.0)
2 Number of schools in which cooks were sufficient in
number as per GOI 20 (100.0) 14 (100.0)
3 No. of Cooks in schools
Male 7(13.73) 7(12.07)
Female 44(86.27) 51(87.93)
Total 51(100.0) 58(100.0)
4 Monthly salary of cook Rs. 1000/- per
month 51 (100.0) 58 (100.0)
Rs. 2000/- per
month
- -
5 Mode of Payment
By Cash - -
By Cheque 51 (100.0) 58 (100.0)
6 Payment is regular Yes 51 (100.0) 58 (100.0)
No - -
7
No. of cooks per social category
1. SC 7(13.73) 16(27.59)
2. ST - -
3 .OBC 44(86.27) 38(65.52)
4 .Minority - -
5. Others(GEN) - 4(6.89)
8. Availability of Training Modules for
Cooks
Yes 51 (100.0) 58 (100.0)
No - -
9. If Yes, provided modules Yes 51 (100.0) 58 (100.0)
No - -
10. Training of Cooks Yes 51 (100.0) 58 (100.0)
No - -

136
11.
If Yes, what was the training venue BRC 51 (100.0) 58 (100.0)
CRC - -
Any other - -
12. Who is the Trainer MDM
Coordinator 51 (100.0) 58 (100.0)
13. Is the meal prepared and transported by the Centralized
kitchen/ NGO, whether cook-cum-helpers have been
engaged to serve the meal to the children at school level.
NA
14. Is there any medical checkup of the
cooks
Yes 51 (100.0) 58 (100.0)
No - - Source: Primary Data Based
Regularity in Serving Meal
It was found that in 95.0 percent primary and all sample middle schools hot,
cooked meal was provided to the students on a daily basis. Regularity in supplying of hot
cooked meal to the students of these schools has been observed by enquiring from the
students, teachers, parents as well as MDM registers was also verified. It is reflected
from the Table 2.5 that during the last three months (December 2014, January and Feb.
2015) how much day’s food not served to the students.
The list of sample primary and middle schools where MDM was not served during last
three months is given in Annexure 2.5.
Table 2.5: Regularity in Serving Meal
Sl.No. Particulars No. of Schools
PS MS
Yes No Yes No
1. Everyday served Hot Cooked Meal 19(95.0) 1(5.00) 14(100.0) -
2.
last three
months how
much days
food not
served
(Multipale
response)
Dec.
1-8 1(100.0) -
8-15 - -
Total 1(5.0) -
Jan.
1-8 1(100.0) -
8-15 - -
Total 1(5.0) -
Feb.
1-8 1(100.0) -
8-15 -
Total 1(5.0) -
3.
Item (ii) Reason for not served food (Multiple response)
Dec. Fuel Not available - -
Dec. Food grains not available 1(100.0) -
Jan. Food grains not available 1(100.0) -
Jan. Fund not available - -
Jan. Fuel not available - -
Feb. Food grains not available 1(100.0) - Source: Primary Data Based

137
Quality and Quantity of Menu
The quality and quantity of MDM was examined and it was found that in 95.0
percent primary and all sample middle schools the quality of meal was good while in the
remaining primary schools it was found to be normal. The quantity of the meal supplied
was sufficient in 95.0 percent primary and all sample middle schools. It was found that
all selected primary and middle schools were providing the prescribed quantity of mid
day meal to students (Table 2.6).
Table 2.6: Quality and Quantity of Meal
Sl.
No. Particulars
No. of Schools
PS MS
1.
Quality of meal
Good 19(95.0) 14(100.0)
Normal - -
Bad - -
2.
Quantity of meal
Sufficient 19(95.0) 14(100.0)
Normal - -
Less - -
3. Quantity of pulses used in the meal
(20 gram/student PS and 30gram/student MS)
19(95.0) 14(100.0)
4. Quantity of green leafy vegetable in the meal
(50 gram/student PS and 75 gram/student MS)
19(95.0) 14(100.0)
5. Iron Iodine mixed salt used in
Meal
Yes 19(95.0) 14(100.0)
No - -
6. Children were satisfied with the
Served meal
Yes 19(95.0) 14(100.0)
No - -
7. Method for measuring the food grains and other item
(Measure Kg)
20(100.0) 14(100.0)
8. Method for measuring the served meal (According to
Requirement)
20(100.0) 14(100.0)
9. Children were not satisfied the meal give Reasons - -
Total No. of Schools 20(100.0) 14(100.0) Source: Primary Data Based
Variety of Menu
District authorities decide the weekly menu in all sample primary and middle schools.
All sample primary and middle schools display weekly menu at a noticeable place. 95.0
percent primary and all sample middle schools follow weekly menu and use locally
available ingredients. The students of 95.0 percent primary and all sample middle
schools get sufficient calories from MDM as is evident from Table 2.7.

138
Table 2.7: Variety of the Menu of MDM
Sl.No. Particulars No. of Schools
PS MS
1. Who decides the weekly
menu District Authority
20 (100.0) 14(100.0)
2. Weekly menu was displayed
at school noticeable place `
Yes 20 (100.0) 14(100.0)
No - -
3. If Yes, All people can see
the menu
Yes 20 (100.0) 14(100.0)
No - -
4. Weakly menu followed Yes 19(95.0) 14(100.0)
No 1(5.00) -
5. Menu includes locally
available in ingredients
Yes 19(95.0) 14(100.0)
No 1(5.00) -
6. Sufficient calories from
MDM
Yes 19(95.0) 14(100.0)
No 1(5.00) - Source: Primary Data Based
Display of Information under Right to Education Act, 2009
It has been found that all the sample primary and middle schools which cooked MDM on
their premises received rice for the preparation of MDM. Daily menu has been shown at
the right place in the 95.0 percent primary school and all sample middle school. In the
last month 38505 students of the sample primary schools and 38436 students of the
sample middle schools have taken MDM. Display of MDM Logo was found in 20.0
percent primary and 28.57 percent middle schools (Table-2.8).
The name of sample primary and middle schools where MDM Logo was not displayed
is given in Annexure 2.8
Table 2.8: Display of information at the School level at prominent place
Source: Primary Data Based
Sl. No. Particulars No. of Schools
PS MS
1 Food Grain received Wheat - -
Rice 20 (100.0) 14(100.0)
2 Other material purchase & use 19(95.0) 14(100.0)
3 Last month how many student take MDM 38505 38436
4 Daily Menu 19(95.0) 14(100.0)
5 Display MDM Logo on school Building 4(20.0) 4(28.57)
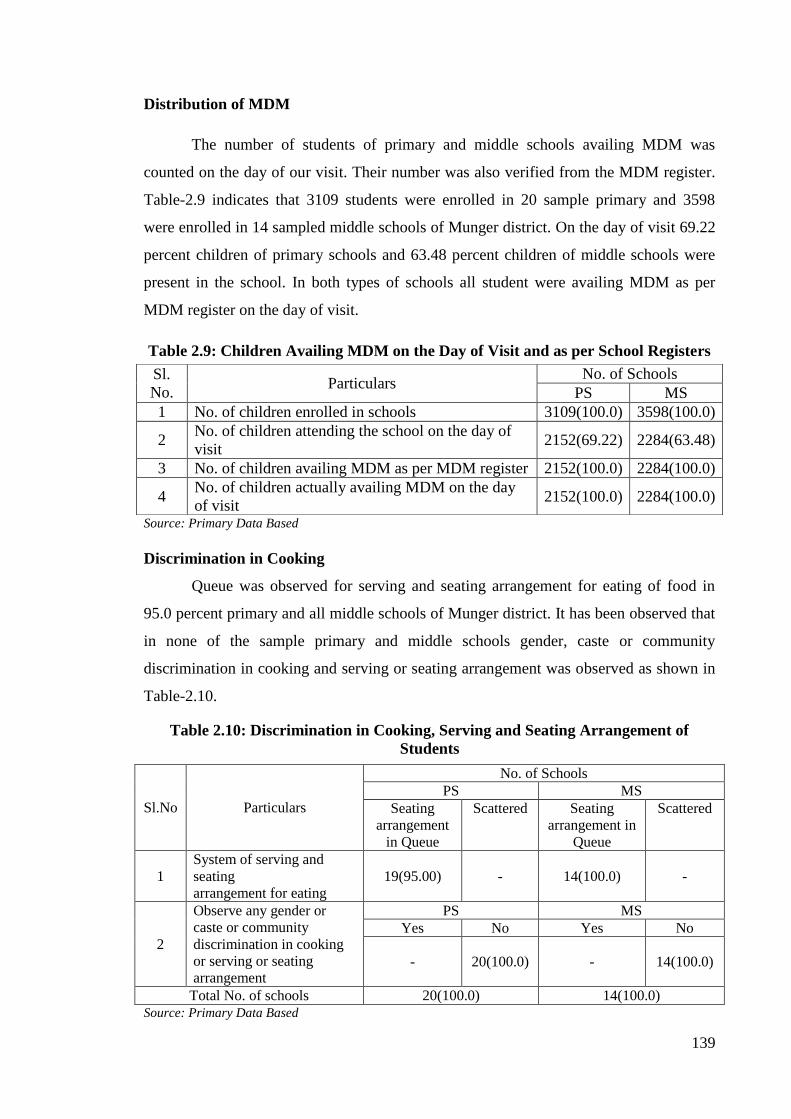
139
Distribution of MDM
The number of students of primary and middle schools availing MDM was
counted on the day of our visit. Their number was also verified from the MDM register.
Table-2.9 indicates that 3109 students were enrolled in 20 sample primary and 3598
were enrolled in 14 sampled middle schools of Munger district. On the day of visit 69.22
percent children of primary schools and 63.48 percent children of middle schools were
present in the school. In both types of schools all student were availing MDM as per
MDM register on the day of visit.
Table 2.9: Children Availing MDM on the Day of Visit and as per School Registers
Source: Primary Data Based
Discrimination in Cooking
Queue was observed for serving and seating arrangement for eating of food in
95.0 percent primary and all middle schools of Munger district. It has been observed that
in none of the sample primary and middle schools gender, caste or community
discrimination in cooking and serving or seating arrangement was observed as shown in
Table-2.10.
Table 2.10: Discrimination in Cooking, Serving and Seating Arrangement of
Students
Sl.No Particulars
No. of Schools
PS MS
Seating
arrangement
in Queue
Scattered Seating
arrangement in
Queue
Scattered
1
System of serving and
seating
arrangement for eating
19(95.00) - 14(100.0) -
2
Observe any gender or
caste or community
discrimination in cooking
or serving or seating
arrangement
PS MS
Yes No Yes No
- 20(100.0) - 14(100.0)
Total No. of schools 20(100.0) 14(100.0)
Source: Primary Data Based
Sl.
No. Particulars
No. of Schools
PS MS
1 No. of children enrolled in schools 3109(100.0) 3598(100.0)
2 No. of children attending the school on the day of
visit 2152(69.22) 2284(63.48)
3 No. of children availing MDM as per MDM register 2152(100.0) 2284(100.0)
4 No. of children actually availing MDM on the day
of visit 2152(100.0) 2284(100.0)

140
Health Cards and Health Checkup
Issues regarding the child health care and related aspects were also examined in
the district. It was found that health cards were maintained in 50.0 percent primary and
57.14 percent middle schools health card was maintained. The frequency of health
check-up was once a year in all sample schools. Table 2.11 shows that all student of 80.0
percent primary and all sample middle schools were given micronutrients medicine
periodically. These medicines were given by health dept. in 25.0 percent primary and
35.71 percent middle schools and given by teacher in 75.0 percent primary and 64.29
percent middle schools. In all sample primary and middle schools the medicine was
administered once. 10 primary and 8 middle schools maintain height and weight records
of their children and indicate it in the school health card, where health card were found.
30.0 percent primary school and 78.57 percent middle school maintain first aid medical
kit in the school. Out of 20 PS and 14 MS, 10 primary and 8 middle schools done dental
and eye checkup of their children and indicate it in the school health card, where health
card were found.
The names of the sample primary and middle schools where health cards were not
maintained, height and weight records were not maintained, first-aid kit was not
available and dental and eye check-up was not done are given in Annexure 2.11.
Table 2.11: Health Cards, Health Checkup
Sl.No. Particulars
No. of Schools
PS MS
Yes No Yes No
1 Health card maintained for each child in
school 10(50.0) 10(50.0) 8(57.14) 6(42.86)
2 Frequency of
health check-up
One time 10(100.0) 8(100.0)
Two time - -
More than two time - -
3
Whether children
are given
micronutrients
medicine
periodically
Iron, Folic acid,
Vitamin A dosage,
De-worming
16(80.0) 4(20.0) 14(100.0) -
4
If yes, Name of
the department
who
administered
these medicines
By
whom
1. ANM - -
2. Health
Dept. 4(25.0) 5(35.71)
3. Teacher 12(75.0) 9(64.29)
How
many
time
1 time 16(100.0) 14(100.0)
2 time - -
3 time - -

141
5
Whether height and weight record of
the children is being indicated in the
school health card.
10(100) - 8(100.0) -
6 Whether any referral during the period
of monitoring. - 20(100.0) - 8(100.0)
7. Instances of medical emergency during
the period of monitoring. - - - -
8. Availability of the first aid medical kit
in the school. 6(30.00) 14(70.00) 11(78.57) 3(21.43)
9. Dental and eye check-up included in the
screening. 10(100) - 8(100.0) -
10. If yes, distribution of spectacles to
children suffering from refractive error. - 10(100.0) - 8(100.0)
Total No. of school 20(100.0) 14(100.0)
Source: Primary Data Based
Drinking Water and Sanitation
Table 2.12 shows that in 90.0 percent primary and all sample middle schools
have potable water for drinking purposes in convergence with drinking water and
sanitation in Munger district. Multiple responses were received while surveying the
source of potable water. In 55.56 percent primary schools water was available through
India Marka Hand Pump and 44.44 percent primary schools through local hand pump. In
case of middle school 42.86 percent water was available through India Marka hand
pumps and 57.14 percent through local hand pumps. 55.56 percent sample primary and
71.43 percent middle schools water supply was done by SSA. 44.44 percent sample
primary and 28.57 percent middle schools water supply was done by PHED (Public
Health Engineering Department).
Table 2.12: Drinking Water and Sanitation
Sl.No. Particulars
No. of Schools
PS MS
Yes No Yes No
1
Whether poTable water is available for
drinking purpose in convergence with
Drinking Water and Sanitation
18
(90.00)
2
(10.0)
14
(100.0) -
2
Available of
potable water
(Multiple
Response)
Tap water - -
India Marka Hand
pump 10(55.56) 6(42.86)
Local Hand pump 8(44.44) 8(57.14)
Jet Pump - -
3. Which
scheme
SSA Scheme 10(55.56) 10(71.43)
PHED 8(44.44) 4(28.57)
Total No. of School 20(100.0) 14(100.0) Source: Primary Data Based

142
Ceasefire Available in School
According to information it was found that 75.0 sample primary and 78.57
percent middle schools have ceasefire, as shown in Table 2.13.
Annexure 2.13 has the name of schools where ceasefire was not available.
Table 2.13: Ceasefire Available in School
Sl.No. Particulars
No. of Schools
PS MS
Yes No Yes No
1 Ceasefire Available 15(75.00) 5(25.00) 11(78.57) 3(21.43)
2. If yes, Name of ceasefire ABC casefire Source: Primary Data Based
Kitchen Devices
Table 2.14 shows the availability of kitchen utensils in schools. The data shows that
the cooking utensils in all sample primary and middle schools had available. All the
cooking and serving utensils kitchen devices in the primary and middle schools were
funded through kitchen devices funds. Only 68.42 percent primary and all sample middle
schools had available eating plates for students through the MME funds and Vikas
Anudan.
The list of schools where eating plates were not available is given in Annexure 2.14.
Table 2.14: Kitchen Devices Sl.
No.
Particulars No. of Schools
PS MS
Yes No Yes No
1 Whether cooking utensils are available in the
school
20(100.0) - 14(100.0) -
2. Whether cooking utensils
are available sufficient
Sufficient 14(70.00) 14(100.0)
Partial 6(30.00) -
3
Source of funding for
cooking and serving utensils
kitchen devices
Kitchen devices
Fund
20(100.0) 14(100.0)
4 Whether eating plates etc. are available in the
school 13(68.42) 14(100.0)
5 If yes, utensils kitchen devices sufficient 13(100.0) 14(100.0)
6
Source of cooking and
serving utensils kitchen
devices
MME 4(30.77) 5(35.71)
Vikas Anudan 9(69.23) 9(64.29)
Other MDM
Scheme - -
Total No. of School 20(100.0) 14(100.0) Source: Primary Data Based

143
Infrastructure of Kitchen
Information related to infrastructure of kitchen in sample primary and middle
schools in Munger district was analyzed. It was found that 65.0 percent sample primary
and all sample middle schools were having kitchen. The pucca kitchen-cum-store was
available in 53.85 percent primary and 35.71 percent middle schools while only kitchen
was available in 46.15 percent primary and 64.29 percent middle schools and all of them
were used.
In 28.58 percent schools kitchen-cum-store was constructed under MDM scheme
66.67 percent primary and 66.67 percent middle schools kitchen was constructed under
MDM as shown in Table-2.15. In 71.42 percent primary and 100.0 percent middle
schools kitchen-cum-store was constructed through SSA scheme. 33.33 percent primary
and 33.33 percent middle schools kitchen was constructed through SSA scheme. Three
primary schools prepared MDM in additional room and four primary school prepared
food in open fields. All primary and middle schools have kitchen and store away from
classrooms. In all primary and 85.71 percent middle schools food is prepared firewood,
14.29 percent middle schools LPG is used for cooking food.
The list of schools where the kitchen is not available is given in Annexure 2.15.
Table 2.15: Infrastructure of Kitchen
Sl.No. Particulars No. of Schools
PS MS
Kitchens are available 13(65.00) 14(100.0)
1 No. of school in which
pucca kitchen-cum store
available
Kitchen-cum –store 7(53.85) 5(35.71)
Kitchen 6(46.15) 9(64.29)
(a) No. of school in which
pucca kitchen constructed
and used
Kitchen-cum –store 7(100.0) 5(100.0)
Kitchen 6(100.0) 9(100.0)
(b) Under which scheme
Kitchen- cum-store
constructed
MDM Kitchen cum
store
2(28.58) -
Kitchen 4(66.67) 6(66.67)
SSA Kitchen cum
store
5(71.42) 5(100.0)
Kitchen 2(33.33) 3(33.33)
(c) Constructed but not in use - -
(d) Under construction - -
(e) Sanctioned, but not started - -
(f) Not sanctioned - -
2 In case the pucca kitchen- Additional Room 3(42.86) -

144
cum store is not available,
where is the food being
cooked?
Open field 4(57.14) -
3
Where the food grains/
other ingredients are
being stored?
Kitchen cum store 7(35.00) 5(35.71)
Kitchen - -
Additional Room 13(65.00) 9(64.29)
4 Kitchen-cum-store is neat
and cleaned
Kitchen cum store 7(100.0) 5(100.0)
Kitchen 6(100.0) 9(100.0)
5 Is there kitchen & store away from class room of
school
20(100.0) 14(100.0)
6
Whether MDM is being
cooked by using firewood
or LPG based cooking?
Fire wood 20(100.0) 12(85.71)
Coal - -
LPG - 2(14.29)
7 Whether on any day there was interruption due to non-
availability of firewood or LPG?
- -
Total No. of School 20 (100.0) 14(100.0) Source: Primary Data Based
Availability of Cover Drum
As Table 2.16 indicates only all sample schools have covered drums for the food
grains. It was found that 15.0 percent primary and 21.43 percent middle schools of these
covered drums available through SSA scheme while 85.0 percent primary and 78.57
percent middle schools of these covered drums available through MME scheme in
Munger district.
Table 2.16: Availability of Cover Drum
Sl.No. Particulars No. of Schools
PS MS
Yes No Yes No
1 Availability of cover drum of food
grains in school
20(100.0) - 14(100.0) -
2. If yes, which
scheme
SSA through 3(15.0) 3(21.43)
Management,
Monitoring &
Evaluation
17(85.0) 11(78.57)
Total No. of School 20(100.0) 14(100.0)
Source: Primary Data Based
Availability of Toilets
It was found that 60.0 percent primary and all sample middle schools have
separate toilet for boys and girls. Out of these, 83.33 percent primary and 85.71 percent

145
middle school use toilets properly. 45.0 percent primary and 35.71 percent middle
schools have common toilets and out of these all primary and 80.0 percent middle school
use common toilets properly.
Annexure 2.17 The names of sample primary and middle schools which do not have
separate toilets for boys and girls and common toilets, etc.
Table 2.17: Availability of toilets
Sl.No. Particulars No. of Schools
PS MS
Yes No Yes No
1 Availability of separate toilet for
boys and girls in school
12(60.00) 8(40.00) 14(100.0) -
2. If yes, Proper use of toilet 10(83.33) 2(16.67) 12(85.71) 2(14.29)
3 Is there available common toilet 9(45.00) 11(55.00) 5(35.71) 9(64.29)
4 If yes, Proper use of toilet 9(100.0) - 4(80.00) 1(20.00)
Total No. of School 20 (100.0) 14 (100.0) Source: Primary Data Based
Availability of Computer in Schools
As Table 2.18 indicates only 28.57 percent middle schools have IT infrastructure
in school while others lack it. However, none of middle schools had an internet
connection and therefore none of them could be used for any IT based services like E-
Learning etc. None of the primary schools had any IT infrastructure.
Table 2.18: Availability of Computer in Schools
Sl.No. Particulars No. of Schools
PS MS
Yes No Yes No
1. Is computer available in school - 20(100.0) 4(28.57) 10(71.43)
2. If yes give the no. of computer - 10
3. Available of internet connection - - - 4(100.0)
4. Using any IT/ IT enable services based
(like E-learning etc.)
- - 4(100.0)
Source: Primary Data Based
Safety and Hygiene
Environment, safety and hygiene were found satisfactory in majority of the primary and
middle schools. As Table 2.19 shows that environment was good in 35.0 percent of
primary and 78.57 percent in middle schools. Safety was good in 20.0 percent in primary

146
and 71.43 percent in middle schools. The hygiene was observed to be in good condition
in 30.0 percent primary and 71.43 percent in middle schools. Environment was
satisfactory in 65.0 percent primary and 21.43 percent middle schools. Safety level was
satisfactory in 80.0 percent in primary and 28.57 percent middle schools. Hygiene level
was satisfactory in 70.0 percent in primary and 28.57 percent middle schools.
Table 2.19: General Impression of Environment, Safety and Hygiene
Source: Primary Data Based
Encouragement of Children to adopt Good Practices
As shown in Table-2.20, in 95.0 percent primary and all sample middle schools
student were encouraged to wash their hands before and after meals.Student were
encouraged to receive MDM in orderly manner in 95.0 percent primary and all sample
middle schools. In all sample primary and middle schools children were not taught about
conservation of water. Cooking process and storage of fuel was found to be safe from
fire hazard in 95.0 percent primary and all sample middle schools as shown in Table-
2.20.
Schools where students did not wash their hands before and after eating and
where MDM was not served in an orderly manner are listed in Annexure 2.20.
Table 2.20: Encouragement of Children to adopt Good Practices
Source: Primary Data Based
Sl. No
Particulars No. of Schools PS MS
Good Satisfactory Un
satisfactory Good Satisfactory
Un- satisfactory
1 Environment 7(35.00) 13(65.00) - 11(78.57) 3(21.43) -
2 Safety 4(20.00) 16(80.00) - 10(71.43) 4(28.57) -
3 Hygiene 6(30.00) 14(70.00) - 10(71.43) 4(28.57) -
4 Total No. of
School 20(100.0) 14(100.0)
Sl.
No.
Particulars No. of Schools
PS MS
Yes No Yes No
1 Children encouraged to wash hands
before and after eating
19(95.0) 1(5.0) 14(100.0) -
2 Children take MDM in an orderly 19(95.0) 1(5.0) 14(100.0) -
3 Conservation of water in school - 19(95.0) - 14(100.0)
4 Cooking process and storage of fuel
is safe from fire hazard.
19(95.0) 1(5.00) 14(100.0) -
Total No. of School 20 (100.0) 14 (100.0)

147
Tasting Meal before Serving to Students
Before the meal was served to students it was tasted by the teachers were 95.0 percent in
primary and all middle schools. It was tasted seldom by VSS in 95.0 percent primary
schools and all sample middle schools. It was tasted seldom by parents in 95.0 percent
primary schools and all sample middle schools.
Table 2.21: Tasting Meal before Serving to Students
Source: Primary Data Based
Community Participation and Awareness
Around 85.0 percent parents of primary school students and 71.43 percent parents
of middle schools student supervised MDM on a daily basis and found it to be
satisfactory, In case of VSSs it was 90.0 percent in primary and 50.0 percent in middle
schools. Supervision by Panchayat/urban bodies was found satisfactory in 100.0 percent
primary and 78.57 percent middle schools. In 15.0 percent parents from primary and
28.57 percent parents from middle schools, 10.00 percent VSSs from primary and 50.0
percent VSSs from middle schools and only 21.43 percent Panchayat/Urban bodies from
middle schools rated the MDM as good during daily supervision.
At the time of monitoring of MDM, it was rated as satisfactory by 90.0 percents
parents, 85.0 percent VSSs and 100.0 percent panchayat/urban bodies in primary
schools. Similarly, 64.29 percents parents, 50.00 percent VSSs and 78.57 percent
panchayat/urban bodies in middle schools rated the monitoring of MDM as satisfactory.
MDM was monitored to be good by 10.00 percent parents and VSSs in 15.0 percent
primary schools and 35.71 percent parents, 50.00 percent VSSs and 21.43
panchayat/urban bodies in middle schools.
Sl.
No. Particulars
No. of Schools
PS MS
Daily Seldom Daily Seldom
1 Tasted by Teacher 19(95.00) - 14(100.0) -
2 Tasted by SMC - 19(95.00) - 14(100.0)
3 Tasted by Parents - 19(95.00) - 14(100.0)
Total No. of School 20 (100.0) 14 (100.0)

148
Table 2.22: Participation of Parents/VSS/Urban bodies in Monitoring of MDM
Sl.
No
Particulars PS MS
Parents VSS Panchayat/
Urban
bodies
Parents VSS Panchayat/
Urban bodies
Supervision of daily MDM
1 Good 3(15.0) 2(10.0) - 4(28.57) 7(50.0) 3(21.43)
2 Satisfactory 17(85.0) 18(90.0) 20(100.0) 10(71.43) 7(50.0) 11(78.57)
3 None - - - - - -
Monitoring of the MDM
1 Good 2(10.0) 3(15.0) - 5(35.71) 7(50.0) 3(21.43)
2 Satisfactory 18(90.0) 17(85.0) 20(100.0) 9(64.29) 7(50.0) 11(78.57)
3 None - - - - - -
4 Total No. of
school 20 (100.0) 14 (100.0)
Source: Primary Data Based
Awareness about MDM
It was found that community members maintained roster for supervision of MDM
in 80.0 percent primary and all sample middle schools. Table 2.23 shows that all sample
primary and middle schools have not social audit mechanism in the school. The list of
schools where roster was not being maintained by the community members for
supervision of the MDM is given in Annexure 2.23.
Table 2.23: Awareness regarding MDM
Sl.
No.
Particulars No. of Schools
PS MS
Yes No Yes No
1 Roster being maintained by the
community members for
supervision of the MDM
16(80.0) 4(20.00) 14(100.0) -
2 Is there any social audit
mechanism in the school
- 20(100.0) - 14(100.0)
Source: Primary Data Based
Number of VSS Meetings
As Table 2.24 explains VSS meeting monitoring time was one to two in 10.0 percent
primary schools and three to four times was in 15.0 percent primary and 28.57 percent
middle schools and 5 times and above in 75.0 percent primary and 71.43 percent middle
schools. For MDM related discussion was for one to two in 25.0 percent primary and
21.43 percent middle schools. For three to four times was in 60.0 percent primary and

149
42.86 percent middle school and 5 times and above in 15.0 percent primary and 35.71
percent middle schools.
Table 2.24: Number of VSS Meetings
Sl.
No
.
Particulars PS MS
1-2 3-4 5 &
above
Total 1-2 3-4 5 &
above
Total
1. No. of VSS
meeting till
monitoring time
2
(10.0)
3
(15.0)
15
(75.0)
20
(100.0)
- 4
(28.57)
10
(71.43)
14
(100.0)
2. No. of VSS
meeting to MDM
related discussion
5
(25.0)
12
(60.0)
3
(15.0)
20
(100.0)
3
(21.43)
6
(42.86)
5
(35.71)
14
(100.0)
Total No. of schools 20 (100.0) 14 (100.0)
Source: Primary Data Based
Inspection & Supervision
Inspection register was available in all sample schools. It has been found that all sample
primary and middle schools have not received fund under MME component. The regular
inspection of MDM was reported in 95.0 percent primary and all sample middle schools
of the district.
The list of schools where fund not received under MME is given in Annexure
2.25
Table 2.25: Inspection and Supervision of MDM by Educational Authorities
Sl.No. Particulars No. of Schools
PS MS
Yes No Yes No
1 Is there any Inspection Register
available at school level?
20(100.0) - 14(100.0) -
2 Whether school has received any
funds under MME component?
- 20(100.0) - 14(100.0)
3 Is regular inspections of MDM 19(95.00) 1(5.00) 14(100.0) - Source: Primary Data Based
Inspection and Supervision of MDM
The regular inspection of MDM was reported in all sample primary and middle schools
of the district. The inspection was also done by the BEO, Pradhan, MDM Coordinator,
CRC Coordinator, BRCP, DPO and VEC. As Table 2.26 shows all sample primary
schools and middle schools maximum inspection and supervision were done by MDM
BRP in Munger district. There was no state level inspecting authorities visited in the
schools for MDM programme. Maximum inspections were made by block level

150
authorities in primary and middle school. Mostly this inspection was made monthly in
both categories of schools.
The visiting authorities remarked for good quality of MDM should be provided in
all sample schools.
Table 2.26: Inspections and Supervision of MDM (Multiple Responses)
Source: Primary Data Based
Impact of MDM
As indicated in Table 2.27 impact of MDM in almost all sample primary and all
middle schools has improved enrollment of students, attendance of students and full time
presence of students in schools.
Sl.No. Particulars No. of Schools
PS MS
1 Regular inspection of the MDM food 19(95.00) 14(100.0)
2 Inspection by
BEO 10(50.00) 11(78.57)
BDO 3(15.00) -
Pradhan - -
MDM Co-odinator 10(50.00) 9(64.29)
CRC coordinator 4(20.00) 1(7.14)
BRP MDM 12(60.00) 11(78.57)
DEO 3(15.00) 1(7.14)
3 Inspecting authority
State level - -
District 15(75.00) 12(85.71)
Tehsil - -
Block 18(90.00) 10(71.43)
CRC 9(45.00) 11(78.57)
4
Frequency of
inspections
Daily - -
Weekly 5(25.00) 2(14.29)
Fortnightly 8(40.00) 8(57.14)
Monthly 17(85.00) 13(92.86)
Often 12(60.00) 10(71.43)
5 If any, then Remark
made by the
visiting of officers
Good Quality of
MDM should be
provided. 19 (100.0) 14 (100.0)

151
Table 2.27: Impact of the MDM
Sl.No. Particulars No. of Schools
PS MS
1 Mid day meal improved Enrollment of student 19(95.00) 14(100.0)
Attendance of student 19(95.00) 14(100.0)
Present of students full
time in school 19(95.00) 14(100.0)
Total No. of Schools 20(100.0) 14(100.0) Source: Primary Data Based
Social Harmony
In 95.0 percent primary and all middle schools MDM has improved social
harmony and nutritional status of children. Table 2.28 shows that all sample primary and
middle schools have not other incidental benefit due to serving of meal in schools.
Table 2.28: Social Harmony
Sl.No. Particulars No. of Schools
PS MS
Yes No Yes No
1 Whether mid day meal has helped
in improvement of the social
harmony
19(95.00) 1(5.00) 14(100.0) -
2 Whether mid day meal has helped
in improvement of the nutritional
status of the children.
19(95.00) 1(5.00) 14(100.0) -
3 Is there any other incidental
benefit due to serving of meal in
schools
- 20(100.0) - 14(100.0)
Source: Primary Data Based
Grievance Redressal Mechanism
As Table 2.29 indicates that all sample primary and middle schools have grievances
redressal mechanism in the district for MDMs and the district/block/ school have toll free
number.
Table-:2.29 Grievance Redressal Mechanisms
Sl.No. Particulars No. of Schools
PS MS
Yes No Yes No
1 Is any grievance redressal mechanism
in the district for MDMS
20(100.0) - 14(100.0) -
2 Whether the district/block/ school
having any toll free number?
20(100.0) - 14(100.0) -
Source: Primary Data Based

152
Views of Investigator on other Issues of MDM Implementation
The investigators views were that monitoring and evaluation of MDM should be
regular basis at school level. Use of wheat should be increased in 95.0 percent primary
schools and all sample middle schools. LPG should be used for cooking in majority
primary and middle schools and convenient arrangement should be made for its
availability. Use of green vegetables must be encouraged in 95.0 percent primary and
around all middle schools in Munger districts as shown in (Table-2.30).
Table-2.30: Investigator’s views and observations regarding MDM
Sl.No. Issues relevant to MDM implementation No. of Schools
PS MS
1 Monitoring & Evaluation of MDM team should be
regular
19(95.00) 14(100.0)
2 Arrangement and availability of LPG for cooking
purpose
19(95.00) 14(100.0)
3 Use of wheat of MDM 19(95.00) 14(100.0)
4 Use of Green VegeTable must be used in MDM 19(95.00) 14(100.0)
Total No. of School 20(100.0) 14(100.0)
Source: Primary Data Based

153
Chapter-III
Major Findings
Monitoring and evaluation of Sarva Shiksha Abhiyan (SSA) was conducted by
the Giri Institute of Development Studies, Lucknow during 15 March to 31 March, 2015.
The survey covered 20 primary schools and 14 middle schools in the Munger district as
suggested by the Ministry of Human Resource Development, Department of School
Education and Literacy, Government of India. Besides monitoring and evaluation of SSA
programme in the district, the working of MDM was also monitored and evaluated. The
focus of monitoring of MDM was limited to cover only key components of the MDM
programme. These components of MDM monitoring and evaluations were selected by
the Ministry. On the basis of field survey of primary and middle schools where MDM is
being implemented, following conclusions have been arrived at:
During the visits of schools of district Munger 95.0 percent sample primary
schools and all sample middle schools reported to have received food grains
within one month and its quality was good.
There was 95.0 percent sample primary and all sample middle schools reported
timely release of MDM funds from state, 95.0 percent sample primary and all
sample middle schools reported timely release of MDM funds from district and
95.0 percent sample primary and all sample middle schools reported timely
release of MDM funds from the block.
It was found that 33 sample schools hot cooked meal was provided to students
regularly. This fact was confirmed from students, teachers, parents and from
MDM registers of the concerning schools.
Due to unavailability of food grains in one primary school in few days of last
three months food not served to the students.
There was no difference between the number of students for whom the MDM
was prepared and those who got the MDM.
There was no difference between MDM registers and head count of students on
the day of visit of research team to the sample schools.

154
MDM was cooked by VSS appointed cook-cum-helpers. Majority of cooks were
of OBC castes and they were paid monthly salary of Rs.1000/ regularly through
the banks.
It has been observed that in none of the sample primary and middle schools
gender, caste or community discrimination in cooking and serving or seating
arrangement.
The meal was tasted by the teachers before it was served to the students.
The MDM was served by cooks and the students received MDM in queue.
The menu was displaced at noticeable places in all sample primary and middle
schools and all schools followed the menu.
MDM logo was displayed in 20.0 percent primary and 28.57 percent middle
schools buildings.
The prescribed quantity of MDM was given to students and was found to be
sufficient. The quality of MDM was found to be ‘Good’ in 95.0 percent primary
and all sample middle schools.
Health cards were maintained in 50.0 percent primary and 57.14 percent middle
schools. Likewise Iron Folic Acid and Vitamins were given to the majority of
students.
The availability of potable water through Local hand pumps was found in almost
all primary and local hand pumps was found in almost in all middle schools.
Kitchens were available in only 65.0 percent primary all sample middle schools.
In all the sample primary and middle schools, food was cooked using maximum
fire wood.
The kitchen utensils were available in all sample primary and middle schools.
The availability of covered drums was found in all sample primary and middle
schools. Cover drums were reported to have been purchased majorly from funds
of MME Scheme.
Separate toilets for boys and girls were available in 60.0 percent primary and all
sample middle schools.

155
The Computers was available in only 28.57 percent middle schools.
The condition of environment, safety and hygiene was satisfactory in majority of
primary schools and good in almost all middle schools.
It was observed that students were encouraged to wash their hand before and after
the meal. The students were seen receiving the MDM in queue in almost all
sample schools. The practice of water conservation was seen in the schools and
cooking process and storage of fuel were found to be safe from fire hazards in
almost all schools.
The awareness of parents and community about MDM was found to be
satisfactory in most of the schools.
The frequency of VSS meeting for MDM related discussion was observed one to
two in 25.0 percent primary and 21.43 percent middle schools, three to four times
in 60.0 percent primary and 42.86 percent middle school, 5 times and above 15.0
percent primary and 35.71 percent middle schools.
Inspection and supervision by district officials on often basis covered in 85.0
percent primary and 92.86 percent middle schools. Process of inspection,
supervision of MDM was found to be adequate.
It was observed that MDM was helpful in improving the social harmony. The
grievance redressal mechanism was active and maximum schools having toll free
number.
The impact of MDM was found to be positive in all sample primary and middle
schools. MDM has improved enrollment of students, attendance of students and
full time presence of students in all sample primary and middle schools.
The views of investigators about different aspect of implementation of MDM in
the district were found to be positive. The investigators views were that
monitoring and evaluation of MDM should be regular basis at school level,
Wheat also should be provided to schools for MDM and LPG should be ensured
for cooking instead of woods.

156

156
ANNEXURE
Annexure 2.1
Schools in which Food Grains Facility not available within One Month
Primary School
1 PS Nawada Sakarpur
Food Grains not delivered to Lifting Agency within Proper Time
Primary School
1 PS Nawada Sakarpur
Annexure 2.5
In Last three months, few days food not served due to Various Reasons
Primary School
1 PS Nawada Sakarpur
Annexure 2.8
MDM Logo not Displayed on School Building
Primary Schools
1 PS Chapha 9 PS Nawada Sakarpur
2 PS Damodarpur 10 PS Navtoliya
3 PS Dharhra Town 11 PS Sheetapur
4 PS Adalpur 12 PS Nath Tola Akela
5 PS Choti Lagma Paswan Tola 13 PS Tarapur Diyara
6 PS Khirodharpur 14 PS Hardiyabad
7 PS Nauagarhi 15 PS Manjura Arazi Tilkari
8 Kanya PS Chowk Bazar 16 PS Barsanda
Middle Schools
1 Kanya MS Hathinath 6 MS Sadalpur
2 MS Masoomganj 7 Balak MS Lallu Pokhar
3 MS Hemzapur 8 MS Lagma
4 MS Phulka 9 MS Kalai
5 MS Vasudevpur 10 Govt. Buniyadi PS Tetiya Bambar
Annexure 2.11
Health Card not Maintained for each Child in Schools
Primary Schools
1 Govt. PS Asarganj 6 PS Navtoliya
2 PS Choti Lagma Paswan Tola 7 PS Nath Tola Akela
3 PS Nauagarhi 8 PS Tarapur Diyara
4 PS Hasanpur Mufsil 9 PS Barsanda
5 PS Nawada Sakarpur 10 PS Kahartoli
Middle Schools
1 Kanya MS Hathinath 4 MS Phulka
2 MS Jalalabad 5 MS Vasudevpur
3 MS Hemzapur 6 MS Sadalpur
Whether children are not given micronutrients medicine periodically
Primary Schools
1 Govt. PS Asarganj 3 PS Nawada Sakarpur
2 PS Hasanpur Mufsil 4 PS Kahartoli
First aid Medical Kit not available in the School
Primary Schools
1 Govt. PS Asarganj 8 PS Sheetapur
2 PS Chapha 9 PS Nath Tola Akela
3 PS Adalpur 10 PS Tarapur Diyara

157
4 PS Khirodharpur 11 PS Manjura Arazi Tilkari
5 PS Hasanpur Mufsil 12 PS Barsanda
6 PS Nawada Sakarpur 13 PS Kahartoli
7 PS Navtoliya 14 Kanya PS Chowk Bazar
Middle Schools
1 MS Jalalabad 3 Govt. Buniyadi PS Tetiya Bambar
2 MS Lagma
Annexure 2.13
Cease fire not available
Primary Schools
1 Govt. PS Asarganj 4 PS Manjura Arazi Tilkari
2 PS Choti Lagma Paswan Tola 5 PS Kahartoli
3 PS. Dharhra No.2
Middle Schools
1 MS Dharahra 3 MS Lagma
2 Balak MS Lallu Pokhar
Annexure 2.14
Eating Plates etc. are not available
Primary Schools
1 PS Damodarpur 5 PS Sheetapur
2 PS Dharhra Town 6 PS Tarapur Diyara
3 PS Choti Lagma Paswan Tola 7 PS Manjura Arazi Tilkari
4 PS Khirodharpur
Annexure 2.15
Kitchens not Available
Primary Schools
1 PS Dharhra Town 5 PS Nawada Sakarpur
2 PS Adalpur 6 PS Nath Tola Akela
3 PS. Dharhra No.2 7 PS Hardiyabad
4 Kanya PS Chowk Bazar
Annexure 2.17
Non-availability of Toilets
Sr
.no
Name of the Schools No separate
toilet for
Girls &
Boys
No Proper
use of
Toilets
No Common
Toilet
available
No Proper use
of Toilets
Primary Schools
1 Govt. PS Asarganj
2 PS Adalpur
3 PS. Dharhra No.2
4 Kanya PS Chowk Bazar
5 PS Nawada Sakarpur
6 PS Navtoliya
7 PS Nath Tola Akela
8 PS Manjura Arazi Tilkari
9 PS Sheetapur
10 PS Hardiyabad
11 PS Chapha
12 PS Dharhra Town
13 PS Choti Lagma Paswan
Tola

158
14 PS Hasanpur Mufsil
15 PS Sheetapur
16 PS Tarapur Diyara
17 PS Hardiyabad
18 PS Kahartoli
Middle Schools
1 MS Sadalpur
2 Balak MS Lallu Pokhar
3 Kanya MS Hathinath
4 MS Jalalabad
5 MS Dharahra
6 MS Phulka
7 MS Vasudevpur
8 MS Sadalpur
9 MS Dharahra
10 MS Lagma
11 MS Kalai
12 Kanya MS Teliya
13 MS Hemzapur
14 Govt. Buniyadi PS
Tetiya Bambar
Annexure 2.20
Hands not Washed before and after Eating
Primary School
1 PS Nawada Sakarpur
MDM not Served in an Orderly Manner
Primary School
1 PS Nawada Sakarpur
Annexure 2.23
Roster not being maintained by the Community for Supervision of MDM
Primary Schools
1 PS. Dharhra No.2 3 PS Nawada Sakarpur
2 PS Nauagarhi 4 PS Hardiyabad
No any social audit mechanism in the school
Primary Schools
1 Govt. PS Asarganj 11 PS Hasanpur Mufsil
2 PS Chapha 12 PS Nawada Sakarpur
3 PS Damodarpur 13 PS Navtoliya
4 PS Dharhra Town 14 PS Sheetapur
5 PS Adalpur 15 PS Nath Tola Akela
6 PS Choti Lagma Paswan
Tola
16 PS Tarapur Diyara
7 PS. Dharhra No.2 17 PS Hardiyabad
8 PS Khirodharpur 18 PS Manjura Arazi Tilkari
9 PS Nauagarhi 19 PS Barsanda
10 Kanya PS Chowk Bazar 20 PS Kahartoli
Middle Schools
1 Kanya MS Hathinath 8 MS Vasudevpur
2 MS Jalalabad 9 MS Sadalpur
3 MS Masoomganj 10 Balak MS Lallu Pokhar
4 MS Hemzapur 11 MS Lagma
5 MS Mahrna 12 MS Kalai
6 MS Dharahra 13 Govt. Buniyadi PS Tetiya Bambar
7 MS Phulka 14 Kanya MS Teliya

159
Annexure 2.25
Schools has not received any funds under MME component
Primary Schools
1 Govt. PS Asarganj 11 PS Hasanpur Mufsil
2 PS Chapha 12 PS Nawada Sakarpur
3 PS Damodarpur 13 PS Navtoliya
4 PS Dharhra Town 14 PS Sheetapur
5 PS Adalpur 15 PS Nath Tola Akela
6 PS Choti Lagma Paswan Tola 16 PS Tarapur Diyara
7 PS. Dharhra No.2 17 PS Hardiyabad
8 PS Khirodharpur 18 PS Manjura Arazi Tilkari
9 PS Nauagarhi 19 PS Barsanda
10 Kanya PS Chowk Bazar 20 PS Kahartoli
Middle Schools
1 Kanya MS Hathinath 8 MS Vasudevpur
2 MS Jalalabad 9 MS Sadalpur
3 MS Masoomganj 10 Balak MS Lallu Pokhar
4 MS Hemzapur 11 MS Lagma
5 MS Mahrna 12 MS Kalai
6 MS Dharahra 13 Govt. Buniyadi PS Tetiya Bambar
7 MS Phulka 14 Kanya MS Teliya