Embed Size (px)
Citation preview

IIjL :? i!)23MAILED
2z?-TECHNICAIINOTES
# . .:- .IONAL ADVISORY COMMITTiE FOR AERONAUTICS.
No. 147.
SPEED MEASUREMENTS MADE BY DIVISION ‘An OF THE
AIRPLANE DIRECTORATE (FLUGZEUGMEISTEREI),SUBDIVISION
FOR FLIGHT EXPERIMENTS.
By V. Heidelberg and A. Hblzel.
From Technische Berichte, Volume 111, No. 5, (1918).
. .
July, 1923.
https://ntrs.nasa.gov/search.jsp?R=19930081071 2018-07-16T15:53:45+00:00Z
1.
2.
3.
4.
5.
NATIONAL ADVISORY COMMITTEE FOR AERONAUTICS.
TECHNICAL NOTE NO. 147.
SPEED MEASUREMENTS MADE BY DIVISION “An OF THE
AIRPLANE DIR13cT0RAm (FLUGZEUGMEISTEREI),summmIoN
“FORFLIGHT EXPERIMENTS.*
By V. Heidelberg and A. E61zel.
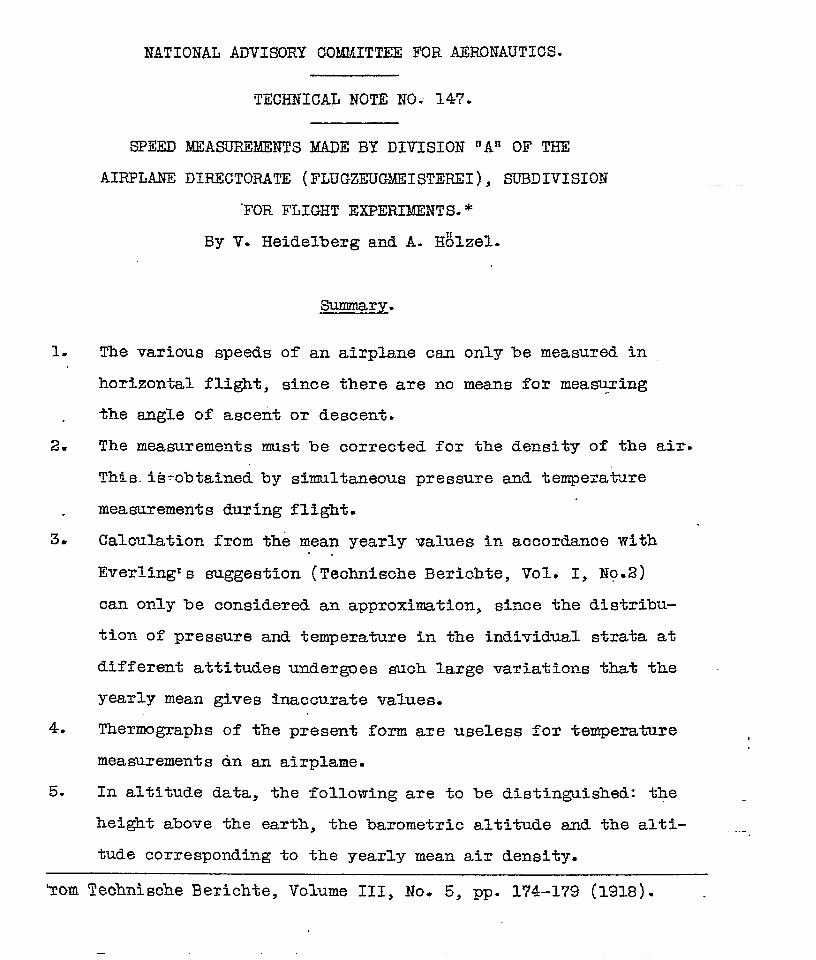
The various speeds
horizontal flight,
summary*
of an airplane can only be measured in
since there are no means for mea~ing
— .—
the angle of ascent or descent.
The measurements must be corrected for the density of the air.
Th!is.i9~obtained by simultaneous pressure and temperakme
measurements during flight.
Calculation from the mean yearly values in accordance with. .
Everlingts suggestion (Technische Berichte, Vol. 1, No-2)
can only be considered an approximation, since the distribu-
tion of pressure and temperature in the individual strata at
different attitudes undergoes such large variations that the ~
yearly mean gives inaccurate values.
Thernmgraphs of the present form are useless for temperature
measurements &n an airplane=
In altitude data, the following are to be distinguished: the
height above the earth, the barometric altitude and the al%i-
tude corresponding to the yearly mean air density.
‘TomTechnische Berichte, Volume 111, No. 5, pp. 174-179 (1918). .
—

-2-
5* Varioneters are not suited for the mechanical contzml of high
altitude flight.
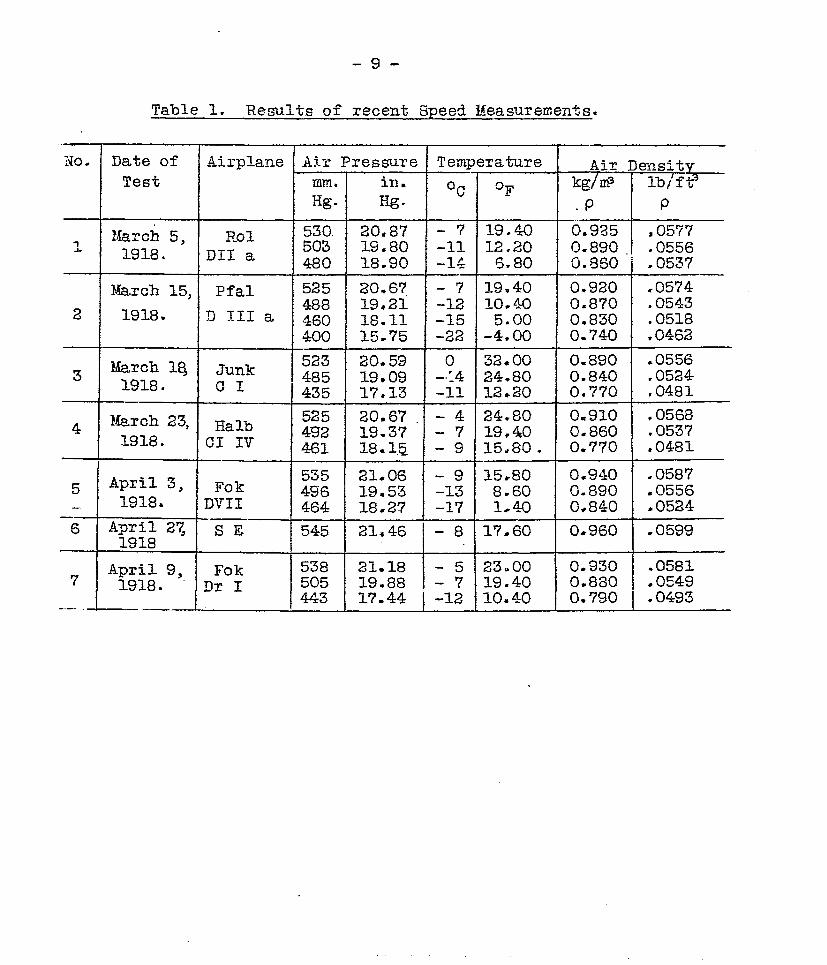
mrangement and Procedure followed in the Experiments.
Speed measurements were made on seven different airplanes at
zltitudes of 2500 to 4000 meters (8200 to 13100 fee~), using
Jacoby!s method (TechnischeBerichte, Volume XI, No.1, p.99). with
theodolites from two fixed points. The base was 1.4 kilometers
[.87 mile) long. The effect of the wind was eliminatedby a trian-
=Wlar flight; each side of the triangle requiring about two minutes
flying time. The readings were taken abcut every 30 seconds or six
times on each leg. The airplanes
for the flight.
The airplane speeds obtained
carried the required useful load
were corrected for the density of
the air. For the sake of clearness, the altitude figures corre-
sponding to the yearly mean on the assumption of normal distribu-
tion of pressure and temperature, are given in the tables and dia-
grams. The air densities were determined in each fliglhtfrom .bar-
ograph curves regarded as pure pres~re curves and from temperature
readings on
ters agreed
In the
computation
alcohol thermometers. The readings of three thermome-
closely.
calculation of these air densities, it is apparent that
from the yearly mean, accorciingto Everlingts method,
is not reliable and can only be employed as an approximation, since
the distribution of pressure and temperature in the individual
strata is subject to considerable variations. This result was ex-
—

-3-
pected when Everling’s method was adopted.
In temperature measurements it was foUnd that alcolbl thermom-
eters lagged SG much tlnatreadings during ordinary gliding flight
were inaccurate, although, on the other hand, theY reg~stered wick- -
ly enough during climbing flight. In oxdey to avoid errors due to
lag of the thermometer, readings were not taken until after the tri–
angular flight. Comparison of the remdings of thermometers and
thermographs showed great inaccuracy in the latter, due to the great
difficulw in preventing the oscillation ami vibration of the air-
plane from being transmitted to the thermographs, the recorded
curves being so thick
certainty.
The measurements
that the mean value could not be obtained with
are recorded in Table I, three values being
given for the altitudes:
1. The actual height above the ground as measured by the theodo-
lites, i.e., the vertical projection.
2. The barometric altitude indicated by the barographs, which
corresponds to a calculated air pressure for the yearly mean
at all altitudes.
and a tempera~re
graph curves were
A ground temperature of 10°C is assumed
decrease of 0.5°C per 100 meters+ The baro–
compared with their calibration curves which
were obtained by regularly changing the air pressure in a
vacuum chamber.
3. From the curve of
ture and pressure
air density p cs.lculatedfrom the tempera-
cbservations, an altitude curve is finally

-4-
obtained, which took into considerati~n the fall in pressl.uceand
temperature. In Figs. 1, 2 and 3, the barograph curve, the ordi-
nates of which are origi~lly a.TCS of circles, is shown by a dotted
line. Beside these dotted curves, the mean yearly altitudes, corre-
sponding to the air dens:ties are given.
In Figs, 4 to 8, the temperatmes observed in the test flights
are plotted against the observed air pressures. The course of the
temperature curve for Pfalz D III a and Junkezs C
noteworthy. Although both flights lie within the
range, their difference iS S-hOWn up to 8°C. With
temperature falls from +1 to -4°C between 2.5 and
I airplanes, is
same pressure
Halb CL IV, the
3 kilometers
(8200 and 9800 feet) altitude. These e-~mples show that all calcu-
lations which depend on the assumption of a tempe~ature fall of ~7C -..
per 200 meters (656 feet) can claim only a~~oxi~te accuracy in any.-particular case. .
Since the flight characteristics depend only on the air density,
all comparative values are to be corrected accordingly. It follows
that, in speed flights, neither the actual nor the barometric alti-
tudes are alone involved and we must consequently employ for ve~ocitY
measurements an air density indicator, wb.ichis used in speed flights
in “placeof a barograph and renders superfluous all aPQ~oximate Cal- .
culations, of the inaccuracy of which, we ha~e been convinced for
some time.
In Figs. 9 t~ 11, the climbing speed for the standard a>r dea-
sity is given, the curve being obtained by differentiating the baro-
-5-.-
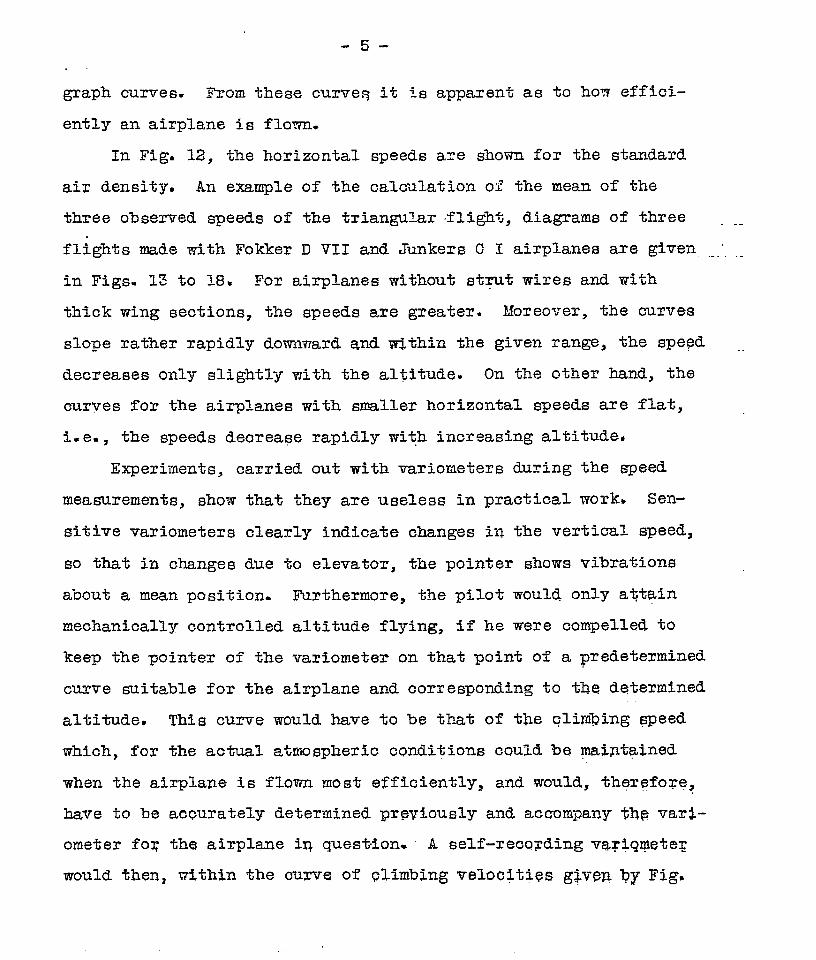
graph curves. From these curveq it is apparent as to how effici-
ently an airplane is flmn.
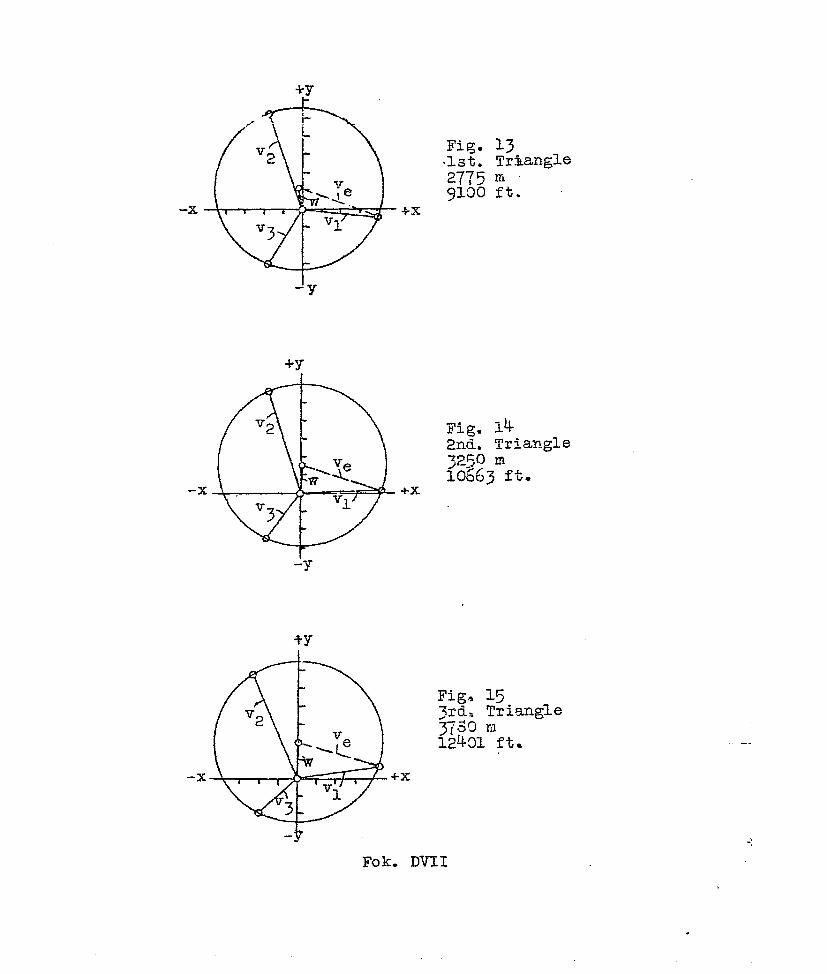
In Fig. 12, the horizontal speeds axe shown for the standard
air densityo An example of the cal~~lation 01 the mean of the
three observed speeds of the triangular fli@t, dia~ams of three -_
flights made tith Fokker D VII and Junkers C I airPlanes =e gi~n _“ _
in Figs. 13 to 1S, For airplanes without st~t wires and with
thick wing sections, the speeds are greater. Moreover, the curves
slope rather rapidly downward and within the given ranges the sPe~d
decreases only slightly with the al$itude. On the other hand, the
curves for the airplanes with smaller horizontal speeds are flat,
i.e., the speeds deorease rapidly with increasing altitude~
Experiments, carried out with variometers duxing the speed
measurements, show
sitive variometers
so that in changes
that they are useless in practical work> Sen-
clea~ly indicate changes in the verti~l ~eed~
due to elevator, the pointer shows vibrations
about a mean position. Furthermore, the pilot would only a$tain
mechanically controlled altitude flying, if he were compelled tO
keep the pointer of the variometer on that point of a predetermined
curve suitable for the airplane and corresponding to the determined
alti~des This curve would ha.~eto be that of the qlim~ing 6peed
which, for the actual atmospheric conditions could be yaintqined
when the airplane is flown most efficiently~ and would, thqr~fore,
have to be accurately determined previously and accompany the vari-
ometer fox the airplane iq question. A self-recoyding v3Tiqr&te~
would thenj withtn the curve of ~limbtng velocities g~ve~ by Fig.

-6-
19, give a record similar to that shovn. In using the variameter, —
a further difficulty arises with C and D types* of airplanes,
in consequence of the very great range of their vertical Gpeeds.
For horizontal flight, a variometer, which has high sensitivity in
the neighborhood of the zero position and a large oscillation
range-would have to be used and the nozzle adjustment would there-
fore be great. Since the downward speeds possess high values in
C and D types of airplanes, up to 25 m/see (82 ft/see) an Una~- .
justable instrument suitable for horizontal flight fails in @iQing
flight, Nozzle ad.justnentsfor horizontal, climbing and gliding
flight might eliminate a part of this difficulty, but it is not
suitable for practical use on C!and D airplanes, although it can be .
used in the present case for scientific experiments, In G and R
types, having a small rate of change in climbing speed, it would be
applicable to a limited extent. Moreover, a V.2TiOIIIeteris not ab-
solutely essential for horizontal flight, while the large series of ,
experiments has shown that, with the help of a good altimeter, hori-
zontal flight can be carried out with Sufficientaccuracy, since
the barographs are so
even small changes of
flight (arcs of about
sensitive that,-.inthe baro~am (Fig. 20),
altitude, in the necessarily short turning
3000), are clearly seen.
Error of the Theodolite Measuring Method.
In a large series of flights with the same airplanes and under
similar conditions, it was found that the base of 1.4 kilometers,
used in the present case, is not reliable for altitudes of over* Observation and pu~suit airplanes.

-7-.
~)(’jo~et~rs, since the sighting lines
angle. Hence the values for 4500 and
intersect at too sharp an
!5000meters are omitteth
At an altitude of 4000 meters the greatest error was found to be.
~3~, from comparisons of a series of measurements= The measure-
ments can also be made for altitudes of 4000 to 7000 meters
(13100 to 23000 feet) if a larger base is chosen for the theodo-
lites. The errors are alsd-emaller, if three theodolites are en–
Woyed, the readings follow more quickly after each other, and the ..
accuracy of the auto~tic recording theodolites is increased, The
above measurements are only the beginning of a larger work on speed
measurements, which has been planned for Lake Muritz. A base of
3000 or 5000 metezs (9so0 or 16400 feet) is there taken and the
sequence of readings may be shortened to 1/2 second. It must be
left to these detailed e~eriments to determine the lirlitsof error— ..
of-the theodolites Up to an altitude of 6000 meters (19700 feet).
Yet it may be expected that this method can be improved so as to _______
serve for T calibrating speed indicators for use on airplaries5
(Pitottubes, Venturi tubes, etc.).
The sole aim of’the present paper is to remedy the coq~ete ..
lack of data from actual flights and to give the orde~ of magnitude _
of airplane speeds rather than t-heiraccurate values. The investi-
gations described above show, hovever, that the previously assumed
horizontal speeds of airplanes are very far from having been attain-
ed and have led to quite erroneous views, not only with us but also ,
in other countries. This astonishing fact is due to not having
* Bombing airplanes~

-f3-..
carried out reliable speed measurements above 2000 meters (6560
feet). According to English and French reports their customarY __
measuz%ng mehhods (with camera obscura, etc.) can onlY be used
up to altitudes of 1500meters (4900 feet).
Translated byNatimal Advisory Committeefor Aeronautics.
. .
-9-
Table 1. Results of recent Speed Measurements.
NO● Date ofTest
w Rol II530 20.87
DII a 503 19.80480 18.90
March 15, Pfal 525 20.67
2 1918.488 19.21
D III a 460 18● 11400 15.75
JunkCI
20.!5919● 0917.13
1 April 3, 535 21.065 FOk
1918.496 19● 53DJT~I 464 18.27
‘6 April Z? SE 545 21.461918 J
Temperature
-7 19.40-11 12.20-14 5,80
-7 19v40-12 10.40-15 5.00-22 -4*OO
o“4---
_l~
-4-7-9
32.0024.8012 ● 20
24.8019,4015.80.
---1-- 9 15.80–13 8.60-17 1.40
- 8 17.60
T- 5 23.00- 7 19.40-12 10.40
Air DeilSZtV
kg/@ lb/’ft3
.P IP
().925 ,05770.890 .05560.S60 “I.0537
0.920 .05740.870 ● 05430.830 .05180.740 .0462
0.8900.8400,770
0.910Q.8600.770
.0556
.0524,0481
,0568.0537.0481
0.940I.0587
0.890 ,05560,840 .0524
0.960 I .05990.930 .05810.880 ● 05490.790 .0493

-1o-.
Table I. Results of recent Speed Measurements (Cont.)
No a Climbing Climbing:.Speed Height Speed Heightm/see. Tn. ft/sec ft.
.- 2842 –- 93241 —- 3350 -– 10991
-— 3750 –- 12303
1:95 2955 6.40 9695
21.85 3450 6.07 113191.65 3980 5*41 130580.70 5000 2.30 16404
2;~Q 2900 6.89 9!5143 1.60 3350 5,25 10991
0.80 4300 2.62 14108
3.00 2775 9.84 91045 2.55 3250 8.37 10663
2*2O 3780 7.22.- 1240~
6 2,00 2620 6.56 8596
4.00 2780 13.12 91217 3.80 3200 la.47 10499
2.20 4180 7.22 13714
Barh
a.
290G33@o3700
3om357540005100
300036004450
300035004000
285034503950
2700
280033004300
metricight
ft.
95141082712139
9842117291312316732
98421181114600
98421148313123
93501131912959
8858
91861082714~08
Height based onyearly mean.
— .—tn. ft.
2900 9514 -3250 106633550 11647
2960 9711
I3’450 113193900 I-27954900 16076
3250 106633750 )-23034!500 14764
3050 100073550 116474070 13353
2750 9022 “3250 106633750 12303
2580 8465—
2800 918”6 ‘“3300 1082I$4300 14108

-11-
Table 1. Results cf recent Speed Measurements (Cont.)
m ● Horizontal Speed. Corrected horizontal Speed.
m/see. ft/sec. ktn/hr. M.P.11 In/see.
-4-41*4
1 39,737*7
40,5
‘ t 37,0
1-44.73 43,6
43.0
I 41*I4 37.3
T34.1
45’05 44.5
43,2..
135,83130.25123.69
132,87133.2?0123,69121.39
146.65143,04141,08
134*E?4122.37111,88
147.64146,00141.73
149.0142,9135.7
14-5.8146,0135.7133‘o
161.0156.0156.0
14$3?o134,0123● o
162.016U,O156,0
92,5888-7984.52
41,433.737,7
90=6090.72S4,3282,64
10CJ.0496s9396.93”
41*439.838.533*9
44*744.043.0
91.9G 41*183,26 3’7.376,4.3 34,1
100.6699.4296.93
45.044.543,2
1 I I
43*6 143,04 15?● o 97.55 43*37 40.9 134.19 147.0 91.34 41*3
38,8 127+30 139.0 86*37 38-4
ft/6ec. km/hr. M.P.H, .
.135.83 149*O 92?58”130,25 242.9 98.79123r69 135,7 84s32 .
135.83 149.0 92,58130.58 143b2 813~9S126.31 138.5 86.06111.22 129.2 80.28
146.65 161,0 loopo4144.36 158.5 9s.4~141.0!3 154,6 96.06
134.!34 148.0 91,9?52.22.37 134.0 83.26111,E@ 123.0 76,43
147:64 162,0 100:66 -146s00 16U,0 99,42141.73 156.0 96.93 .-137*79 151.2 93*95 -
1~2.06 155.8 96.81 ‘-’135*50 148.9 92.52125.98 138.0 85.75

12
14
16
18
% 2022
2k
26
28
30
300
400 _
500 _
600 a
y00
mmin.
Fig. 1
Hg
Fig. 2
16
1s
20
22Hg
24
26
23
“ 30
in.
o 10 20 30 4* 50 min.Climbing timePfal.DIIIa..
16
M
20
22
24
26
2s
30
.g “050
=9
1.0
.055
.060
.@j l-lII
l-l & .O-7Q -
1.2 .075
in. c) 10 20 3~ min.Climbimz time
. 04cl
. Wj
, *CJ
.070
FOk. 5VII
4(JU
500. a~$.
600
‘mmo 10 20 30 40 rnin
Climbing timeFig.“3 Junk= CI
,055
*
—

mm of Hg600 qcm 400
12
s
4-
Oco
-4
-~
-12
Fig.
mm of Hg- 600 yx) 400
-u
-b
-6‘c
-12
-1625 20
in. of HgFig. 4 Rol. DVI
.-. — - _-
— -., ., . ._,
-- .. . , ., .—.
~
I
25 20in. of Hg
6 Junk, CI
-o
a = 1.0 km = -4.3281 ft.
b = 1.5 km = -~4921 ft. oC
c= 2.0 km =65G2 ft.
–12
d= 2.5 km=6202 ft.
-16”
-20
-u
-4
-6o~
–12
-16
-20
-r#l-25 20
in. of HgFig. 5 Pfal. DIIIa
00~
25 20in. of Hg
Fig. T Halb. CLIV
nun of Hg600 ~oo 400
-d-d! Ii} I { IiI ItI 4J-10
25 20in. of Hg
Fig. 8 Fok. DVI1
—

~ =lb/ft3
4
c1
0.
Fig. 9
4
Mlc+-21.+
IAomolnom~r-@wl-mmd-000000
*W *.* **
v-lDE
2v
01.2
1-——
——
~ nkglm~Fig. 10 Wnk.CI

p=lb/ft3
S
“9 3.0
1“0 2.0
Fig. 12
● ✎✍✎ ✎✍
4
c1
hi)c
0
1*2
Fig. 11 Fok. IWII
‘3 a=3.O km=oa) 9G&2 ft.w
W%3 ft.5 % c=4=.o.JaU=‘
.-dl-lc
o
13123 ft.
. . .
M.P.H.75 go 85 90 95 100 lo~
.
9
●
*
120 130 140 150 160 170lm/hr,
Ibrizental fltght
045050oq~060
16000
12000
moo
-x
-x
-x
+-y
-Y
13Trianglem’ft.
+x
Fig. 14-2nd..Trian.gl32~0 m10W3 ft.
+-x
+y
+x
Fok. DVII
.e
e
-.
.
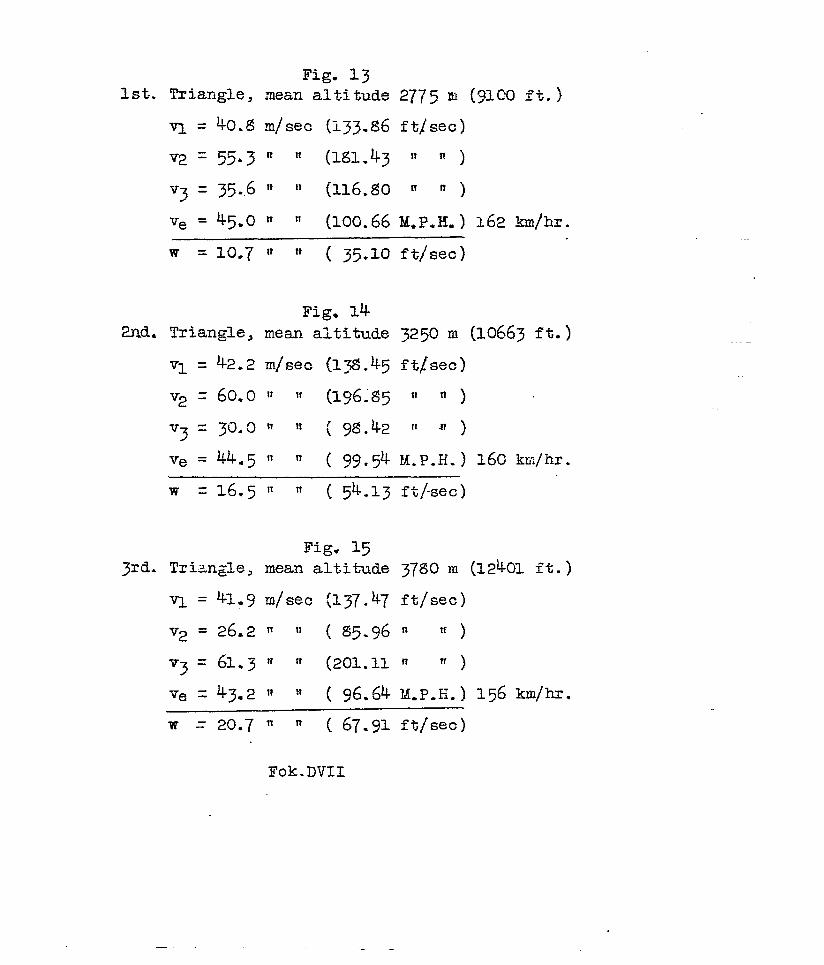
Fig. 13lst-.Triangle, mean altitude 21Tcjm (91C0 ft.)
v~ = 45.0 II n (100.66 M.P.H.) 162 km/hr.
w = 1~*7 Ir n ( 3!j.~0 ft/see)
Fig. 14Wd. Triangle, mean altitude 3250 m (10663 ft.)
VI = %.2 zn/sec(1X.45 ft~sec)
Ve = 44.5 ~ ~ ( 99.54 M.P.H.) 16c k~:/hr.
w = 16.5 11 n ( 54.13 ft/-sec)
Fig. 153rd. Triangle, mean altitude 3780 m (12401 ft.)
n = 41.9 m/see (137.47 ft/see)
V2 = 26.2 m n ( 85.96 II n )
—
Ve = 43=2 n n ( 96.64 M.P.H.) 156 km/hr.
w= 20.7 ~ ~ ( 6i’.g1 ft/see)
—
Fok.DVII
I
+y
-$
+-x
+-y
-’Y
+-y
+x
-Y
Junk. Cl
.
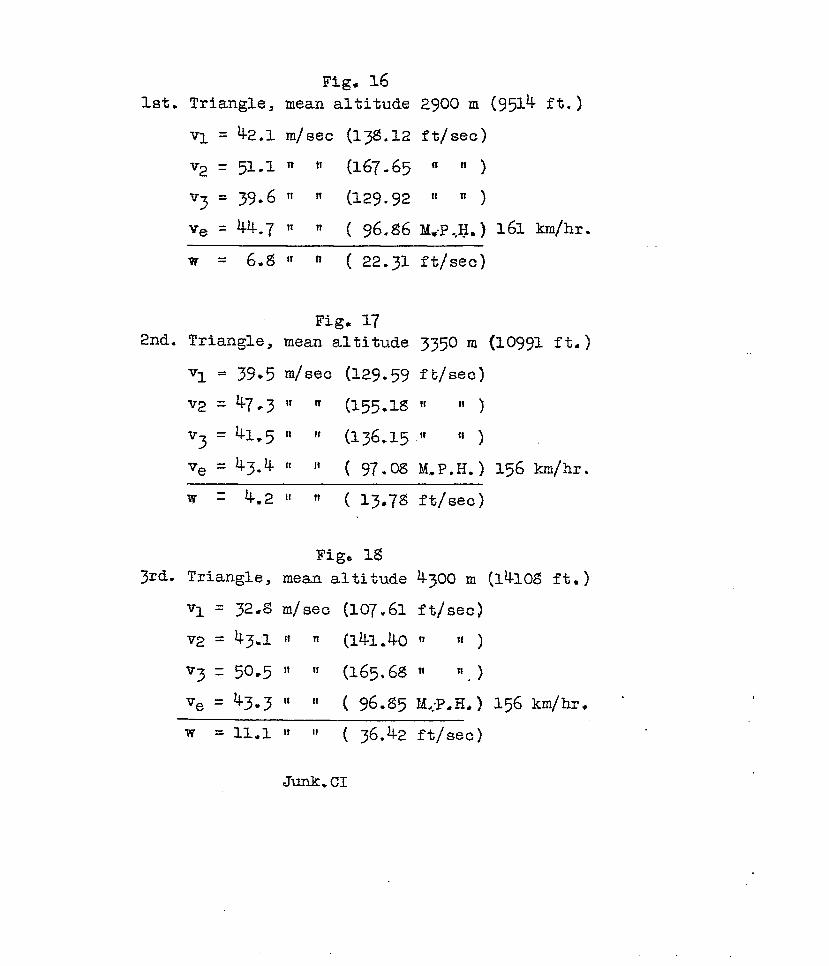
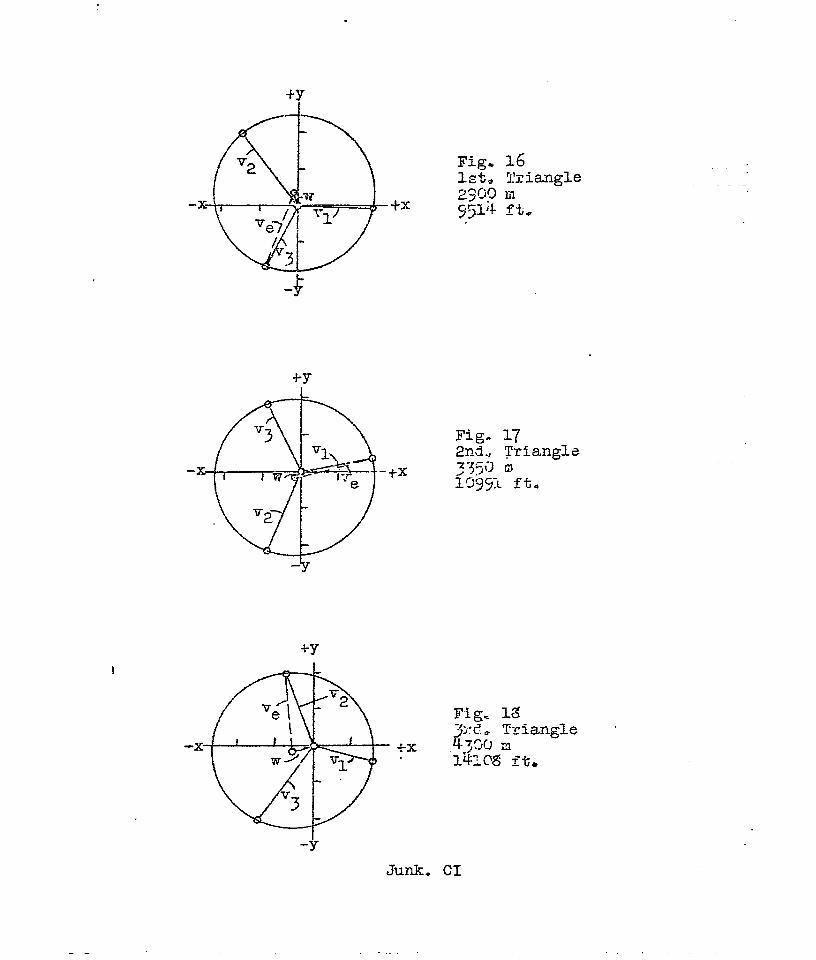
Fig. 16lst, Triangle, mean altitude ZgOO m (9514 ft.)
V1 = k.I. m/see [138.12 ft/see)
‘3 = 39.6 “ “ (129.92 “ n )
Ye = 44.7 11 ~ ( 96. ~6 M.-P.,H.) 161 km/hr.
w= 6.~ ‘I “ ( 22.31 ft/see)
Fig. 172nd. Triangle, mean altitude 3350 m (1099I ft.)
VI = 3!?.5m/see (12g.~$1ft/see)
VP = 47.3 “ m (155.18 “ “ )
Fig, 183rd. Triangle, mean altitude 4300 m (l!lOg ft,)
VI = 32.8 m/see (1oT.61 ft/see)
V2 = 43.1 “ ~ (141.40 w f{)
‘3 = 50.5 “ ~ (165.68 H “.)
Ve = 43*3 It 11 ( 96.85 M,:P.H.) 1~6 km/hr. -
w = 11*1 n IT( 36.42 ft/see)
Junk.CI

1 2 3 4m/see
Fig. 19
6080
~ooo
4000
3900
2000
1000
r--l4=%1
● 050
.055
& 060
● C@”
.070
ft.
2?NO0
16CG0
12000
8000
4000
c= :/30 “ “ = ;O=G n “ = “cl’ 0?.TT1:fiz.gml~=alr
12000
~ooo
4000
.—
Fig, 20 Junk. CI