Embed Size (px)
Citation preview

THE AERONAUTICAL DATA LINK: TAXONOMY, ARCHITECTURAL
ANALYSIS, AND OPTIMIZATION
A. Terry Morris and Plesent W. Goode
NASA Langley Research Center, Hampton, Virginia
Abstract
The future Communication, Navigation, and
Surveillance/Air Traffic Management (CNS/ATM)
System will rely on global satellite navigation, and
ground-based and satellite based communications
via Multi-Protocol Networks (e.g. combinedAeronautical Telecommunications Network
(ATN)/Internet Protocol (IP)) to bring about needed
improvements in efficiency and safety of operations
to meet increasing levels of air traffic. This paper
will discuss the development of an approach that
completely describes optimal data link architecture
configuration and behavior to meet the multiple
conflicting objectives of concurrent and different
operations functions. The practical application of
the approach enables the design and assessment of
configurations relative to airspace operations
phases. The approach includes a formal taxonomic
classification, an architectural analysis
methodology, and optimization techniques. The
formal taxonomic classification provides amultidimensional correlation of data link
performance with data link service, information
protocol, spectrum, and technology mode; and to
flight operations phase and environment. The
architectural analysis methodology assesses the
impact of a specific architecture configuration and
behavior on the local ATM system performance.
Deterministic and stochastic optimization
techniques maximize architectural design
effectiveness while addressing operational,
technology, and policy constraints.
1 Introduction
The purpose of the future CNS/ATM system is
safe, efficient, and expeditious movement of aircraft
in the airspace. In order to achieve this purpose, the
CNS/ATM system (see Figure 1) will rely on global
satellite navigation as well as ground-based and
satellite-based communications via multi-protocol
networks (e.g., the combined Aeronautical
Telecommunications Network (ATN)/Internet
Protocol (IP)) to bring about needed improvements
in efficiency and safety of operations to meet
increasing levels of air traffic [1]. Necessarily,
these improvements must meet stringent accuracy,
integrity, availability and continuity of function
requirements as evidenced by the rules, regulations
and standards established by the Federal Aviation
Administration (FAA), the International Civil
Aviation Organization (ICAO), the Radio Technical
Commission for Aeronautics (RTCA), the Airlines
Electronic Engineering Committee (AEEC), and
various other contributing groups and consortiums.
The primary elements of the CNS/ATM system
are airspace; air navigation facilities, equipment and
services; airports and landing areas; aeronautical
information and services; rules, regulations, and
procedures; data link information and technologies;
iiiiiiiiiiiiiiiiiiiiiiiiiiiiiiiiiiiiiiiiiiiiiiiiiiiiiiiiiiiiiiiiiii!!!!!!!!!!! ! iiiiiiiiiiiiiiiiiiiiiiiiii iiiiiiiiiiiiiiiiiiiiiiiiiiiiiiiiiiiiiiiiiiiiiiiiiii iiiiiiiiiiiiiiiiiiiiiiiiiiiiiiiiiiiiiiiiiiiiiiiiiiiiiiiiiiiiiiiiiiiiiiiiiiiiiiiiii!!!!!! iiiiiiiiiiii iiiiiiiiiiiiiiiiiiiiiiiiiiiiiiiiiiiiiiiii iiiiiiiiiiiiiiiiiiiiiiiiiiiiiiiiiiiiiii i iiiiiiiiiiiiii!!!!iiiiiiiiiiiiiiiiiiiiiiiiiiiiiiiiiiiiiiiiiiiiiii!! iiiiiiiiiiiIiiiiiiiiiiiiiiiiiiiiiiiiiiiiiiiiiiiiiiiiiiiiiiiiiiiiiiiiiiiiiiiiiiiiiiiiiiiiiiiiiiiiiiiiiiiiiiiiiiiiiiiiiiiiiiiiiiiiiiiiiiiiiiiiiiiiiiiiiiiiiiiiiiiiiiiiiiiii iiiiiiiiiiiiiiiiiiiiiiiiiiiiill!!!iiiiiiiiiiiiiiiiiiiiii
Figure 1. CNS/ATM Environment
and work force, including flight crews, air traffic
controllers, and traffic managers [2]. The ATN will
be the complex, global aeronautical network that
will integrate CNS/ATM system components with
ground networks and automation systems in order
to provide seamless, interoperable data

communicationsaroundthe world. At present,therearevery few intuitivetoolsandobjectivemethodologiesin placethatcanaidadiversesetofusersinanalyzingoroptimizinglargecomplexdatalinkarchitecturesthatareATNcompliant.
Thispaperwill discussthedevelopmentof anapproachthat completelydescribesoptimaldatalinkarchitectureconfigurationandbehaviortomeetthe multipleconflictingobjectivesof concurrentanddiverseoperationsfunctions.Theapproachispremisedon the developmentof a formaltaxonomicclassificationof CNS/ATMsystems,services,requirementsand technologies.Thistaxonomyauthorizesa coherentmethodologyfordatalink architecturalanalysisfrom a top-downperspectiveand/or a bottom-upperspective.Additionally,the processpermitsthe use ofdeterministicand stochasticoptimizationtoolsincludingthe use of Bayesiannetworkscoringtechniquesto managedecisionuncertaintyaswellas tools used to addresstrade-off concernsparticularly between competing data linkarchitecturalconfigurations. The practicalapplicationoftheapproachenablesdatalinkusers,developers,manufacturers,andintegratorstoassessthe effectivenessand integrity of particulararchitectural designs while simultaneouslyaddressingflight objectives,requirementsandinformationalservices.
1.1 A TN Background
Data link, the conduit that enables information
transfer in the fluid world of aviation, is a network
that allows for increased digital transmission of data
to various users within the National Airspace
System (NAS) with greater efficiency, reliability
and ease. By managing and exchanging
information and services between air-to-ground and
air-to-air systems, the data link conduit enhances
safety, improves operational efficiency, and
increases capacity to all users in the global aviationenvironment. The backbone of the data link
communication infrastructure will be composed of
multiple independent subnetworks (or air/ground
data links) including Mode S, Satellites and VHF
Radio links. The global network that will "glue" or
bind these data links with ground networks and
automation systems to provide seamless,
interoperable, point-to-point data communications
is the ATN. The ATN will accomplish this
interconnectivity and information routing using the
Open Systems Interconnect (OSI) layered
communications protocols [3]. Within the 70SI
layers, the top four layers (i.e., application,
presentation, session, and transport) are referred to
as "upper layers" and the bottom three layers (i.e.,
physical, data link, and network) are referred to as
the "lower layers". There is also considerable
interest in adopting the IP as the global aeronautical
network [ 1]. The IP differs from the ATN primarily
in the upper four OSI layers. The lower three 3
layers are common to both. It is in the lower layers
where various data links utilize different techniques
and protocols.
1.2 Analyzing Data Link Architectures
In order to design, configure, and analyze data
link systems and architectures that are ATN- (or IP)
compliant, future airspace users will have to
understand the intricacies of data link complexity.
This necessarily involves understanding various
data link services (applications), numerous data link
technologies, detailed protocols, and sundry
airspace regulations as well as spectrum limitations.
Various data link applications, for instance, impose
very different communications requirements in
terms of latency, coverage, capacity, integrity, and
Required Communication Performance (RCP).
These issues must be acknowledged and addressed
in any system that will comply with the ATN and
other communications protocols. The problem for
future airspace users is making objective and
meaningful decisions when configuring the requiredinformational infrastructure needed and when
selecting compatible data link fimctions, services
and technologies to implement the infrastructure.
Additionally, modeling and simulation capabilities
will need to be incorporated in the decision process
in order to assess data link integrity and its impact
on the ATN and the CNS/ATM system. A system
designer, for instance, will need to employ tools
with sufficient modeling power and convenience to
capture the complex behavior of a large system of
fimctionally diverse subsystems while still
affording timely and efficient data link analysis.
Analyzing, selecting and configuring data link
components and architectures that meet or improve
critical information exchange is a complex decision
analysis problem particularly when constrained by
cost-effectiveness and unbiased objectivity.

1.3 Problems with the Current Process
Airspace users who desire to utilize data link
services or technologies to solve particular
problems currently acquire government, academic,
or commercial experts who are proficient with any
number of data link solutions. In general, these
experts use their expertise to extract user
requirements and then design or select a data link
system (a component or architecture) whose
implementation fulfils the requirements. There are,
however, problems with this process for data link
solution selection. First, the process is ad hoc, that
is, there is not a widespread objective framework by
which to analyze and assess data link solution
performance. Second, the current process
inherently involves the possibility of missing
information. Overlooking (purposely or
unintentionally) available information in a complex
decision analysis tends to increase solution
uncertainty. Third, there is always the ever-real
danger of homing in on a particular solution too
fast. This generally stems from previous user
experiences with particular solutions as well as user
impatience. Fourth, users often have difficulty
framing their problem statement or they become
confused when analyzing expert reports and are not
able to determine which questions to ask and where
to ask them. Fifth, there is general ignorance of
how to apply formal tools to aid in analyzingscenarios for decision validation. Sixth, there is the
possibility of the decision-maker being biased by
economics, external relationships with solution
providers, or other legitimate influences that do not
permit objective decision analysis. For these
reasons, there needs to be an objective methodology
that allows users to analyze data link configuration
and behavior in the presence of multiply conflicting
objectives. The process must permit the use of
formal tools to allow users to select optimal data
link functions, services and technologies that meet
safety, integrity and operational requirements.
1.4 Assumptions and Organization
There is an explicit assumption that a data link
database exists and is populated with relevant,
accurate and complete informational content for
each taxonomic classification area. Although, in
reality, such a database does not exist as a single
entity, the data that would comprise it exists in
distributed locations. Methods and techniques that
create a virtual database from distributed sources
exist [20]. The assumption is thus realistic in some
future time. Additionally, the acquisition of
assessment tools is outside the scope of the
methodology.
This paper is organized as follows. Section 1
(the introduction) provides background information
on the ATN and the motivation that guided the
development of the data link decision framework.
Section 2 (the decision framework) will describe, in
detail, the various components of the methodology,
including the taxonomy, architectural analysis,
uncertainty management, and optimization
technique for competing solutions. Section 3 (an
example) will apply the decision analysis process to
a Small Aircraft Transportation System (SATS)
Operational Concept. Though the SATS example
will be limited in scope, the analysis will provide
sufficient insight into how to pose "what if'
questions, where to incorporate external analysis
tools, ways to manage decision uncertainty, and
techniques used to select optimized data link
architectures in the presence of conflictingconstraints.
2 Data Link Decision Framework
This section will discuss, in detail, the
components of the data link decision framework.The framework is intended to be a decision aid that
can be utilized by a diverse set of users. The
partitioned structure of the framework allows users
with vastly different goals to become engaged in the
methodology. User goals determine the level of
involvement as well as the type of assessment to be
employed.
2.1 Decision Framework Description
The data link decision framework is a decision
analysis tool that aids users in obtaining optimized
data link architecture configurations and behaviors.
The primary components include a taxonomy of
data link services (applications) and technologies, amulti-dimensional database that contains the
taxonomic content, and a formal decision
methodology that incorporates the use of applicable
tools and modeling techniques. Descriptions of
assessment tools (and when they should be applied)
will be provided.

Figure 2. Data Link Decision Framework
2.1.1 The Data Link MethodologyThe decision methodology in Figure 2 is a
decision-analytic process that simplifies data linkcomplexity by partitioning the analysis among four
different levels (Levels 0-3). The vast amount ofinformation required for objective and meaningfulanalysis is clustered in a multi-dimensionaldatabase organized according to a data linktaxonomy. Conceptually, the process of data linksolution selection can be posed as a multi-objectivedecision analysis problem. Using this modelingformulation, data link assessment can be
characterized by a p-dimensional vector ofobjective functions
z(x) = [z 1(x), z 2 (x),...,Zp (x)] (1)
and a feasible region X where X is defined as
X : {x" x_ 9_n,g,(x) < Ofor alli}
and the constraints gi(x) are defined on an n-
dimensional Euclidean vector space of decision
variables, that is, x=(xl,x2,...,xn)_ _ with
values in the set of real numbers, 9_. The goal of
multi-objective analysis is to seek a set of"nondominated" solutions that are a subset of the
feasible region X. Optimization in this context isnot appropriate since one cannot, in general,optimize a priori a vector of objective functions.
For this reason, the analysis will describetechniques that can be used for the selectiondecision in the presence of uncertainties.
Deterministic and stochastic optimizationtechniques will be described when they can be usedin an appropriate context.
Following the arrows in the decisionmethodology (Figure 2), each of the four levelspartitions the multi-objective analysis from high-level constituents (mostly qualitative decisionvariables) to low-level constituents (quantitativedecision variables). Level 0 involves informationrelated to high-level operational concepts. Level 1contains information capabilities (required and
available) that guide data link services. Level 2includes information (required and available)related to system level data link performancewhereas Level 3 comprises information (required oravailable) related to various data link technologies.The traversal between levels (starting at Level 0)involves the acquisition of more detailed parametricinformation. The highest level (Level 0) can bethought of as a conceptual level whereas the lowest
level (Level 3) consists of parameters that can beimplemented in hardware.
Identifying the Informational Infrastructure
The transformation between Level 0 and Level
1 involves identifying and extracting the
informational components required to perform theoperational functions and the derivation ofrequirements necessary the enable the operationalfunctions. Level 0 to Level 1 mapping establishesin a very basic form the informational infrastructureneeded to support the required operations andoperational functions. Data link services are thenidentified from this infrastructure. In order to
interact at Level 0, the user needs to have, at aminimum, an operational concept containing
operational requirements as well as othermiscellaneous information (airport dependent,aircraft specific, ATC, and aircraft/vehiclecontroller information). The diagram in Figure 3graphically depicts the Level 0 to Level 1transformation process. It should be noted thatinformational components are the informationrequired to perform the operational functions.
Applicable tools for this transformation processinclude causal networks, dynamic programming,queuing models, etc.
4

Figure 3. Level 0 to Level 1 Transformation
Identifying System Level Parameters
The transformation between Level 1 and Level 2
involves identifying the detailed system levelperformance requirements for the informational
Infrastructure. A graphical depiction of this processis shown in Figure 4. In this diagram, system leveldata link information (from standards documents,etc.) is found in the data link database. Informationin the reverse process (from Level 2 to Level 1) canbe extracted from experiments and reports that arealso contained in the database.
Level 0 requh'ed
capab t esLevel 2
System level
performoxlee
requirements
for implementing
lhe irffolxn alion
infi-aslmchu-e
Figure 4. Level 1 to Level 2 Transformation
Identifying Technology Parameters that EnableSystem Behaviors
In general, the conversion between Level 2(system parameters) and the technology parametersin Level 3 (transformation not shown) is difficult.It requires a model that describes how technologyperformance parameters functionally relate tosystem behavior. Designers and computationaldevelopers with intimate system knowledge andtechnology expertise who desire to develop
hardware performance parameters from systemlevel data link parameters primarily use thistransformation. Information in Level 3 includes
technology parameters described in the 3 lower OSIlayers (e.g., modulation, bit error rate, etc.). Thereverse process (from Level 3 to Level 2), notshown, describes system behaviors that are possiblefrom particular data link technologies.
2.1.2 Top-Down versus Bottom-Up ScenariosThis decision framework authorizes a practical
and coherent approach for data link architectural
analysis from both top-down and bottom-upperspectives. The top-down perspective (scenarios-) operational requirements -) required
capabilities -) required system performance -_required technical performance) allows a user toformulate a data link design concept and thensuccessively refine the capability, system andtechnology requirements. In a bottom-upperspective (available technical performance "_available system performance "_ available
capabilities "_ operational requirements -_scenarios), the user acquires data link technologiesalready available and gradually builds larger systemlevel architectures. Clearly, mature design is somecombination of top-down and bottom-up analysis.With reference to Figure 2, top-down analysisinvolves traversing from Levels 0 to 1, Levels 1 to
2, and/or Levels 2 to 3. In like manner, bottom-upanalysis involves the reverse, that is, Levels 3 to 2,Levels 2 to 1, and/or Levels 1 to 0.
2.2 Data Link Taxonomy
2.2.1 The Need for a Formal TaxonomyGiven the vast demand of information required
for airspace operations, there has been a need toprovide a tool for classifying this information in amanner that is both meaningful and useful. Thedata link taxonomy (Figure 5) is organizedhierarchically, that is, from conceptual toimplementation information types (Levels 0 to 3,respectively). The taxonomy is also relational inthat all the information on one level is mapped
vertically to each adjacent level as well ashorizontally to elements and parameters on thesame level.
2.2.2 Data Link Taxonomy DescriptionThe data link taxonomy (Figure 5) has the
following major partitions: operation scenarios,operational functions/capabilities, informationcapabilities, data link services, technologyrequirements, and various data link technologies.Taxonomy content (Figure 5) is linked with levels
in the decision methodology (Figure 2) in the

DataLinkTaxonomyInforrr ati on Orga nizati on
Operation Nerlario
E Highl N Interactive, Irlforrralion Centric Airspace Operations ]
Operational Functions Capabilily
Data Link Service
Te c_ noq_gy_[e_uir ern6nts
Data Link Techrmlouies
Figure 5. Data Link Taxonomy
following way: Level 0 includes operation scenarios
and operational function/capability information,
Level 1 contains information capabilities, Level 2
comprises data link services, and Level 3
encompasses information related to technology
requirements and data link technologies. Totransition between the levels in the decision
methodology (Figure 2), there is an information
transformation matrix that must be tailored per data
link assessment. Examples of these will be shown
in the SATS example (described later in section 3).Elements of each transition matrix will be
comprised of instantiated information described in
subsection 2.1.1 (depending on the type of analysis
performed). This instantiated information willinclude data link taxonomic content related to data
link services, functional capabilities, etc. The
information in figure 5 describes general categorical
information. Data link services, for example, are
subdivided further into groups: the ATC group, the
Navigation group, the Surveillance group, the ATS
group, and the Airline Operations group. Each of
these groups can be partitioned further. In similar
fashion, the data link technology partition captures
detailed information related to a large selection of
technology solutions such as VHF Data Link Mode
1 (VDLM1), VDLM4, VDLMS, UAT, SATCOM,
etc. The parameters, constraints, and guidelines
associated with each data link capability (service),
operational phase, technology solution and so onare contained in the database.
2.2.3 The Multi-Dimensional Database
The data link database is multi-dimensional to
best accommodate the information content and
relational aspects of the data link taxonomy. For
proper analysis, the database is intended to be
accurate and complete. Information that will be
used to populate the database will come from data
link equipment manufacturers and experimental
testing reports. Information contained in data link
standards documents (e.g., RTCA MOPS, MASPS,
etc.) will also be included.
2.3 Architectural Analysis
Architectural analysis is the process of utilizing
analytical tools to answer qualitative or quantitative
questions regarding data link architectures (whether
informational, system-level, or technology-based).
Given the combinatorial explosion of the decision
variables, there are a large number of possible
architectures from which to choose. Simply stated,
the process of finding a candidate set of
functionally compatible architectures involves
identifying the data link services (applications)
required, determining the constraints used to
confine the feasible region of solutions, and
applying an analytical tool to select the mostdesirable candidate from the set.
2.3.1 Top-Down Scenarios
In top-down analysis, the user has higher-level
information and/or concepts and wants some lower
level component that behaves in such a way as to
satisfy the goal. The goal here is to instantiate the
higher-level informational components by
traversing from Levels 0 to 1, Levels 1 to 2, and/or
Levels 2 to 3 depending on the depth of specificity.
For instance, let's say a user knows the capabilities
required and wants to determine the system
parameters required to instantiate the capabilities.
The user would employ the Level 1 to Level 2
information transformation matrix, which requires
information related to required capabilities as well
as information parameters suitable for those
capabilities (i.e., timeliness, integrity, and accuracy
parameters). The information transformation from
Level 1 to Level 2 (Figure 4) would also requireadditional information obtained from the database
to produce system level parameters whose
behavioral performance conforms to the required
Level 1 capabilities. When more than one set of
informationparameterssatisfiestheuser'srequiredcapabilities,thefinal selectioncanbearbitraryorcanbemadeusingtoolsappropriatefor competingsolutions.An exampleof top-downanalysisisdescribedinsection3.
2.3.2 Bottom-Up Scenarios
In bottom-up analysis, the user has one or more
lower-level components or parameters that are
available and wants to determine higher-level
descriptive performance characteristics. In real-
world cases, this is accomplished through
exhaustive testing or insightful experiments.
Information required to perform bottom-up analysis
can be reasonably obtained. An example of
bottom-up data link analysis (Level 3 to Level 2) is
described by Jones [4]. In this report, Jones
produces system level performance behavior of a
VDL Mode 2 data link technology using the PetriNet formalism. When more than one set of
components (an architectural unit) satisfies the
needs of the user, trade-off analysis tools can help
to manage decision uncertainty.
2.3.3 Combined Analysis
In many real-world scenarios, combined
analysis (top-down and bottom-up) is preferable.
Using this approach, a user employs top-down
analysis to select capabilities and operational
functions that enable higher-level requirements.
Similarly, bottom-up analysis is used to determine
technologies and system-level performance
parameters currently available to meet the required
capabilities. Advantages of a combined approach
include the identification of gaps between the
higher-level requirements and lower level suitable
technologies. The gaps can then be addressed by
design or by standards. An example of the
combined approach (Level 0 to Level 2 and Level 3
to Level 1) can be found in the Technology
Evaluation Report for the Airborne Internet (AI)
performed by CNS, Inc. [5]. In this report,
candidate AI architectures were developed from a
combined perspective, that is, using AI (top-down)
requirements and potential communication and
networking technologies (bottom-up).
2.4 Competing Solutions and Analysis Tools
Whether the analysis is guided from a top-
down, bottom-up, or combined approach, the
possibility of competing solutions will always be
present (except for the trivial case). When severalcandidate solutions sets are revealed as a result of
an analysis, the user needs some technique or
process that selects the most desirable candidate
from the set. When all the required data is present
to evaluate an informational, system, or technology
architecture, techniques can be employed to make
the selection decision with certainty. This is
generally called optimization. However, there are
various decision analysis problems that are made
under uncertainty. More often than not, this latter
case exists for complex decisions and thus requires
more input from the user to guide the selection
process. There are also times when severalcandidate solution sets can be used with no one
superior choice. Techniques in this case
incorporate the ability to address trade-offs between
competing solutions.
2.4.1 Optimization ToolsWhen the user is faced with a selection
decision, optimization tools may be appropriate.
Optimization models are sets of mathematical
relationships that represent, or approximate, a realsituation. These models can be used to choose a
particular candidate solution from a set of possible
solutions particularly when the goals of the user are
achievable. Various optimization techniques thatcan be used in this context include linear
programming, network flow models, critical path
models, shortest path models, integer-programming
formulations, and nonlinear programming models.
Generally, when all the decision variables are
known and the user's goal is clear, deterministic
optimization techniques are appropriate. However,
if all the inputs to the problem are not known or
forecasting is utilized, then stochastic optimization
(such as Petri Net models [6], discrete-event
simulation tools and Monte Carlo techniques)should be used.
2.4.2 Managing Decision Uncertainty
Decision making under uncertainty is the
condition that exists when there is missinginformation, some of the decision variables are
qualitative in nature, forecast models are employed,
there is considerable complexity involved, or the
problem to be solved is multi-objective. Regardless
of the specifics, analyzing problems that include

uncertainties frequently involve choosing among
alternative options, using probability assessments to
encode uncertainties, identifying causal
dependencies that exist in the process, quantifying
the value of information, and determining
acceptable levels of risk. Some of the tools that can
be used to manage decision uncertainty include
decision trees, influence diagrams, Bayesian
networks, utility functions, goal programming, and
sensitivity analysis to name a few [7].
With respect to the decision analysis
methodology (Figure 2), uncertainty generally
exists to a greater degree in the upper levels of the
framework (Levels 0 and 1). This is due primarily
to the qualitative nature of operational scenarios,
the impact of inadequate requirements, and the
evolving function of data link capabilities and
standards. Uncertainty also exists (to a lesser
degree) in the lower 2 levels (Levels 2 and 3). Its
presence becomes manifest when required
information is missing, when a user's subjective
preferences are inadequately quantified, and when
specific environmental factors (weather, airspace
density, loading, legal, cost) that influence the
selection decision are hard to acquire.
2.4.3 Addressing Trade-Offs
Whenever one candidate solution is not clearly
superior to others in a set or there are advantages
and disadvantages to each solution, trade-off
analysis should be employed. Trade-offs provide a
mechanism to mitigate the risks of data link
solution acceptance by selecting a candidate
solution that minimizes undesirable performance
characteristics while maximizing its benefits.
Regardless of where trade-off analysis is
implemented in the decision framework, its
application is integral to the data link evaluation
process. Some of the techniques used for trade-off
analysis include Saaty's Analytical Hierarchy
Process (AHP) [8], multi-attribute utility theory
(MAUT) [9], iterative techniques (multi-objective
programming, goal programming, and Pareto
optimality), and outranking techniques. Trade-off
analysis is covered in the general area of multi-
criteria decision analysis (MCDA) [10]. An
interesting example of trade-off analysis applied to
data link architecture selection (Level 3 to Level 0)
is described by Koczo [11]. In his process to
evaluate integrated airport surface operations,
Koczo examines possible allocations of CNS/ATM
data link applications to respective data link
candidates. He uses these allocations to postulate aset of candidate data link architectures for Terminal
Area Productivity (TAP). In his analysis, he uses
trade-offs to determine the suitability of various
data link architectures optimized by resource usage
and capabilities required.
2.4.4 Bayesian Network ScoringA promising tool that can be used for a number
of purposes in the data link decision analysis
framework is the Bayesian Network Scoring
technique. This acceptance methodology utilizes a
Bayesian network (BN) as a globally coherent
model and employs trade-off analyses in order to
select optimal data link candidates subject to
various constraints in the presence of uncertainty.
The technique has been used previously as an
acceptance methodology for commercial-off-the-
shelf (COTS) software [12] and as an independent
assessment tool for selecting COTS components in
the Shuttle [13]. Bayesian networks are directed
acyclic graphs (DAGs) in which the nodes represent
decision variables, the arcs signify the existence of
direct causal influences between the variables, and
the strengths of these influences are expressed by
forward conditional probabilities [14]. In the
context of data link architectures, the methodology
is intuitive, uses probabilities to encode
uncertainties, and incorporates the use of trade-offs.
The Bayesian network in Figure 6 can be used
to illustrate the process of accepting suitable datalink architectures from a set of candidate solutions.
In this example, the decision analysis is performed
between Levels 2 and 1 using a bottom-up
perspective, that is, the user desires to find the data
link architecture that best optimizes the required
capabilities. It is assumed that the system-level
parameters and a Bayesian network structure (that
represents how system-level parameters influence
data link capabilities) have been previously
acquired or computed. For each candidate
architecture, the BN would input its system-level
parameters and then propagate this information into
the network to produce probabilistic scores for each
of the required capabilities (BN outputs). Multi-
criteria decision analysis tools would then be used
to make trade- offs between each product's scores.
This phase is used to incorporate a user's data link
1
%Parameter_ I I r
(L:wl 2) ]
Muhi- C ri_ ria
Decision Anal.'_is
Trade offs between each Asch_c_re )
candidate' s RequiredCapability scores
Figure 6. Data Link Bayesian Network
capability preferences (in a multi-objective sense).The result of which is a selected data link
architecture that meets required capabilities while
simultaneously incorporating user preferences.
3 Example Data Link
Analysis -) SATS CONOPS
The following example applies the data link
analysis framework described in the preceding
sections to a proposed operations scenario. The
scenario is one of the four operating capabilities of
the Small Aircraft Transportation System (SATS)
concept currently under development by NASA, the
FAA, and local aviation and airport authorities. A
draft Concept of Operations (CONOPS) document
[16] defines the 2010 SATS consisting of
• Higher Volume Operation (HVO) at Non-
Towered/Non-Radar Airports,
• Lower Landing Minimums at Minimally
Equipped Landing Facilities,
• Increased Single-Pilot Crew Safety and Mission
Reliability, and En Route Procedures, and
• Systems for Integrated Fleet Operations.
The decision analysis framework will be applied to
the HVO capability.
As described above, the framework is a
decision support tool that guides the decision
process in both top-down and bottom-up directions.
The top-down direction translates operational
requirements into increasingly detailed information
requirements from desired data link capability
through data link system performance requirements
to implementation technology performance
requirements. The bottom-up assessment delineates
and selects data link capability options from
available technologies. The framework consists of
four levels designated zero through three. Each
level is a matrix whose elements are the quantitative
performance requirements for the next level. The
tool is designed such that a decision process can be
initiated at any level or conducted in any direction,
depending on the required decision and theavailable data.
The objectives of the HVO application are to
derive the required operations and operational
functions from the CONOPS, determine the
quantitative information performance required to
support the operational functions, determine the
data link capabilities needed to provide the
information performance, and determine the
capability's system performance requirements. The
application is a Level 0 through Level 2 top-down
process resulting in the selection of a data link
service and a confirmation of its capability to
provide the information performance to support the
required operations. The transition to Level 3
(Figure 11), which specifies the performance oft he
underlying technology in terms of the bottom three
OSI layer parameters, is not done. The transition
requires models, tools, and expertise that the
authors do not currently possess. An alternate
approach that can be used to model the available
underlying technologies (i.e. VDL Modes 1 through
4, Mode S, etc.) in terms of the OSI parameters is to
simulate the selected data link operation and then
collect system performance data for the Level 2
information elements. A comparative analysis of
the Level 2 solutions (resulting from this bottom-up
approach) and the top-down Level 2 results would
be performed to select the optimum implementing
technologies. Tools are available to perform the
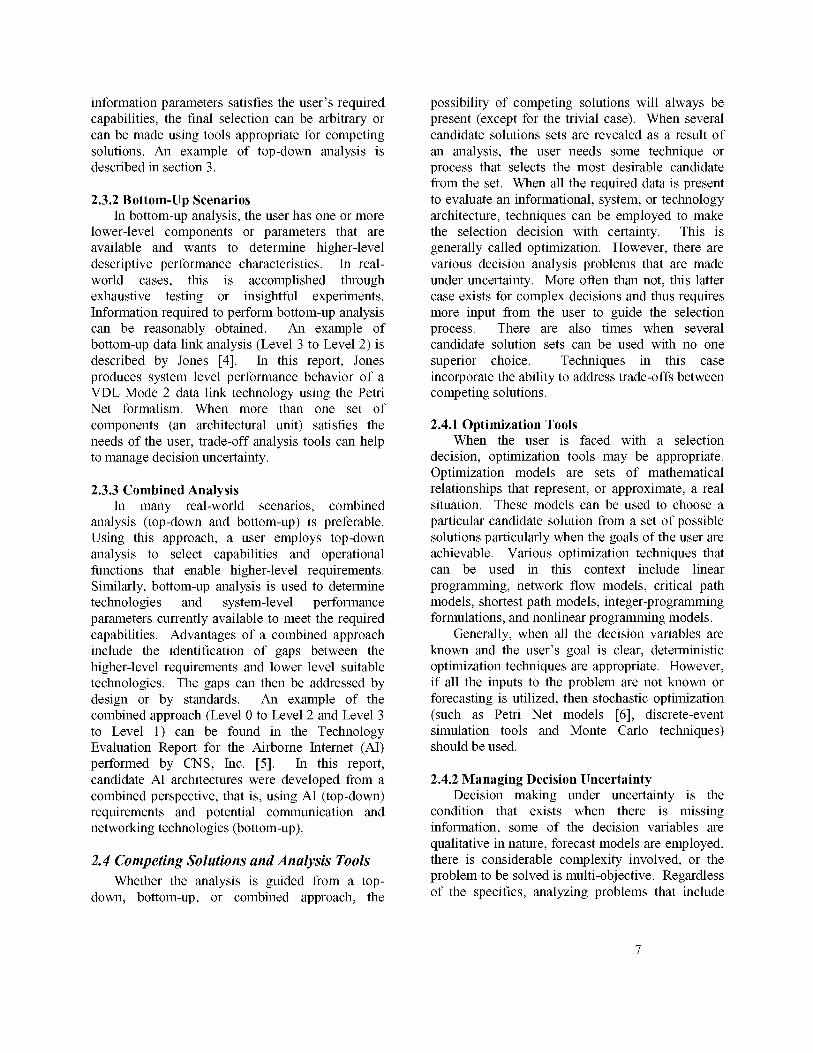
modeling and analyses [7, 17].The information in the Level 0 matrix for HVO
(Figure 7) is derived from the draft SATS CONOPS
2010 document [16]. The matrix encapsulates the
required operations (horizontal label), the functions
necessary to complete the operations (vertical
label), and the performance parameters required to
execute the functions (matrix elements). In order to
transition to Level 1, estimated values for the
performance parameters are required. The
estimation techniques can range from back-of-the-
envelop calculations to high fidelity modeling and
simulation [18, 19] depending on the preferences

Supported Operations
HVO Operational Requirements - Level 0
Required Operation
Operational FileHVOIIFR Depaduler Depadure/ Takeoff/ Transition
Function Flight Plan Arrival Arrival Approach To/FromRequest Assignment ATO
Traffic Density # Aircran # Aircraft
Op Time Windov
Requested NaY
Parameters _eqst Sign_
• Dep/Arr Fix Dest Pos
• Dep/Arr Time Time• #VC State Pos A/el
Assigned NaY
Parameters
• Sequence Queue Pus
• Dep fArr Time Time
• Velocity 1_ Leg Vel
Self Sequencing Traj Intent Praj Intent
Self Separation Req'd NaYPerf Acc'y
Release To/From (nm. kt_)
ATC Sig Acq
Range
Figure 7. Level 0 Matrix
and rigor requirements of the user. For this
example, a linear programming method called goal
programming is used [21 ]. The primary reasons for
selecting this method are the ability to model
trajectories with multiple heading changes for any
number of aircraft, the implicit computation of
trajectory deviation while optimizing the
performance parameter of interest, and the wide
availability of computational tools for the method.
Most commercial spreadsheet applications include
optimization capability and there are several books
[7, 17] that develop goal programming models
within the applications.
The goal programming model for HVO is:
min Z = Y_(d: + d: )i
subject to :
+.ssec(O,)t% t+.Ssec(O,)t,V,,V,j t <-VM_,
V,j<_VM_,
v,,t> v.,N, (3)V,j>_VM,N,
i=l,M and j=2i
where
M = number of legs,
d_ -- underachievement of the goal,+
d_ -- overachievement of the goal,
Xs_ -- initial position of Aircraft K for leg i,
O_ -- relative heading of leg i,
+ d/- d + = XD,, (2)
Estimation of Level 0 Performance Parameters
Information Performance Requirements - Level 0
Performance
Parameter
Aircraft #
Initial Velocity (kts
Initial Velocity (kts
Initial Velocity (kts
Leg I Dist (nm)Leg I Time (rain)
Leg ILeg I NP (nm)
Leg I NP (m/s)
Leg 2 Dist (rim)
Leg 2 Rel. Hdg. (°;
Leg 2 Time (rain)
Leg 2 Velocity (kLS
Leg 2 Velocity (kLS
Leg 2 Velocity (kts
Approach Vel (kLSApproach Vel (kLS
Approach Vel (kts
Leg 2 NP (rim)
Leg 2 NP (m/s)
Figure 8. HVO 4 Aircraft Landing Operation
t_ =elasped time on leg i,
_j = velocity of Aircraft K at start of leg i,
_j t = velocity of Aircraft K at end of leg i,
XD_ = destination of Aircraft K for leg i,
V_x = maximum speed for Aircraft K,
VMIx = minimum speed for Aircraft K.
The model consists of a set of trajectory goals (2)
for each aircraft involved in the operation(s). Each
goal in an aircraft's goal set represents a distance
and relative heading along one leg. Additional
goals represent the bounds (3) on allowed aircraftvelocities. The bounds are the lowest maximum
and highest minimum velocity capability in the
group of aircraft. The effect of the method is to
determine the maximum velocity along each leg
while minimizing the deviation from the goal
position. The modeler inputs the elapsed time for
each leg, and the distance and heading relative to
the previous leg for each leg. The modeler also has
the flexibility to constrain the deviations from the
goal position to meet required navigational
accuracy values.
For this example, the units of velocity are
knots, the units of time are minutes, and the units of
distance are nautical miles. An arbitrary two-leg
trajectory including one trajectory change was
drawn for each of four arriving aircraft. Under theHVO scenario, the distances, times, and relative
headings for each first leg are derived from aircraft
requests. The distances, times, and relative
headings (inputs to the model) for subsequent legs
are derived from the self-sequencing and self-
10

Data Link Service
Capability Requirements - Level 1............................................................................................................................................... :::t:
Required Data Link Capability
Information
Requirement
Timeliness
• Initial Acq(nm)• Alert Time
Integrity
• Availability
• NaY Integrity
• Related Traffic
Density
Accuracy
• NACp(n m)•NAOu(m#s )
Aid IQVisual
Acq
10N/A
95%
95%
21
('1 O nm)
ConflictAvoidance
99 9%95%
6
(<20 rim)
SeparationAssurance &
Sequencing
2 _in
999%95%
120
(<40 nm)
Airport Flight PathSurface DecenfliGion
Planning
5 _5_e 9045 mn
99.9% 95%_5% 95%
150 30
(_5 nm) (<90 nm)
3
Bimulianeous
Approach
1510ec
95%95%
32
(landing)
Figure 9. Level 1 Matrix
separation functions. For this example, the leg
distances are taken from the drawn trajectories and
the leg times are distance-weighted divisions of the
total time to complete the operation. This approach
allows the modeler to vary the total time available
for the operation. Additional assumptions are that
the upper bound on velocity is 123 knots, the lower
bound on velocity is 61 knots, the final velocity is a
typical approach speed of 1.3 times the lower
bound, and the desired solution requires common
leg velocities for all aircraft. The method computes
the velocities required at the beginning and end of
each leg and the over and under deviations of
aircraft position from each leg's target position.
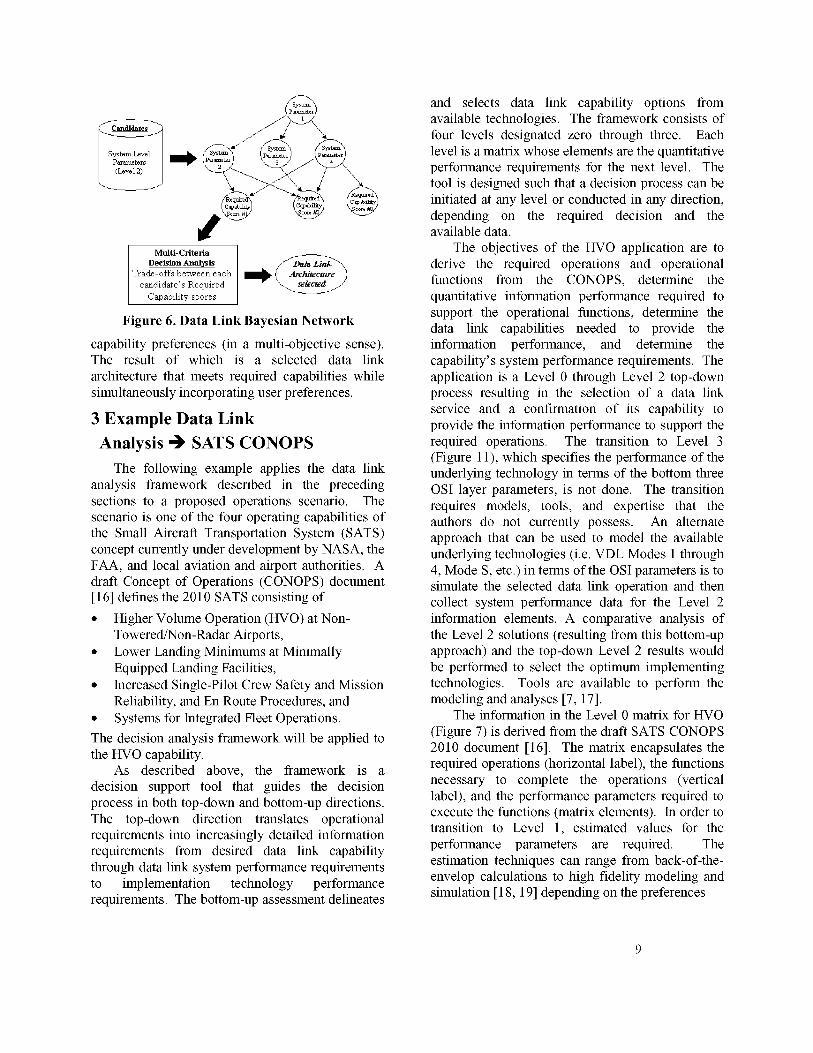
The input and computed values yield sufficient
information to quantify the Level 0 information
performance parameters. Figure 8 shows the
estimated information performance requirements
for a four-aircraft landing operation using three
different operation completion times.
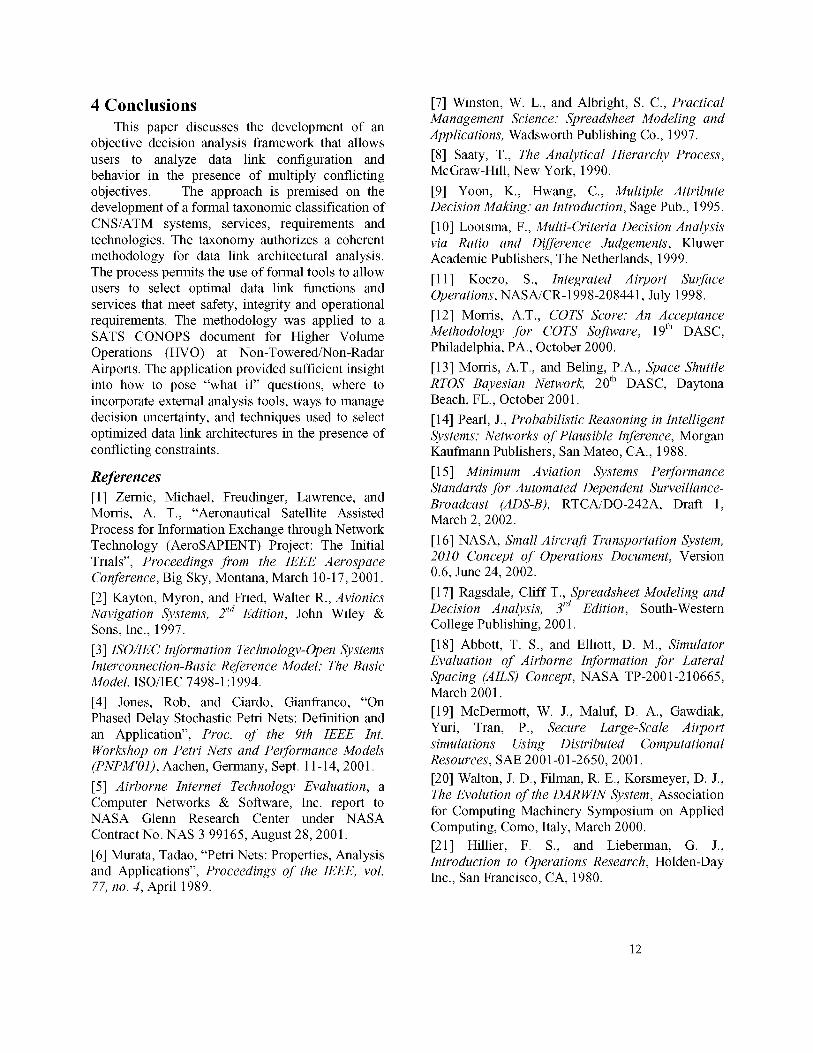
The transition to Level 1 requires the data link
capability(ies) needed to provide the information
performance derived in Level 0. The transition
process is a search to map the Level 0 operational
functions to data link service capabilities, and to
confirm that the capabilities' timeliness, accuracy,
and integrity meets the information performance
requirements of Level 0. A manual search of
RTCA Minimum Aviation System Performance
Standards (MASPS) documents for data link
services yielded the Level 1 matrix in Figure 9. Forthe HVO scenario, the data link service that
provides the needed information performance
capability is Automatic Dependent Surveillance
Broadcast (ADS-B) [15]. An automated search
Data Link ApplicationPerformance Requirements Level 2
Information
Element
state vedor
Accuracy
Updale IRale
Acquie_io n Range
Latency
Mode Status
Up_ate R_e
Acqui_ion Range
Air Ref Veloc_
Update Rate
Acqui_ion Range
Tar et State,On.
Update Rate
_oquie_i_n Range
Availabilitz
System Performance Requirements - A2 Equipage
_h Simu_ane
............. )Fli_ ffflP [! i i
surtace ec,Sequencing PI, nnii_ _n Appr°a{
,,:°:4
Figure 10. Level 2 Matrix
Data Link ApplicationPerformance Requirements - Level 3
Technology Performance Requirements
Performance J1°l )d flic Separation Airp°rt Flight path Simu_arParameter ua ,, an Assurance & Nut face Decon fliclio n Appro
Sequencing Planning
_ _'_ _'_ _'_ _'
Layer1 Modulation
Layer1-Bit RNe
Layer1-BER
LayerI-BR_BW
Layer1EbiNo
Layerl-Bb_T
Layerl-DtU
Layer2 MAC
Layer2 DLS
Layer2LME
Layer3-NNL
Layer3 Me_CoNen±
Figure 11. Level 3 Matrix
process would be preferable to a manual search
process for the transition to Level 1. The process
would require the electronic availability of data link
MASPS documents to a widely distributed
information infrastructure, and an appropriate
search engine. Wide area information network
capabilities are proposed [20] that enable such an
automated search process.
The Level 2 Matrix (Figure 10) defines the
specific performance requirements of the
information elements that provide the selected data
link service's timeliness, accuracy, and integrity.
The performance value of each information element
that is required to enable each capability is available
in the MASPS [15] for the selected data link
service. For this example, the transition to Level 2
was also accomplished by a manual search, and the
previous discussion about an automated search
process apply to this level as well.
11
4 Conclusions
This paper discusses the development of anobjective decision analysis framework that allows
users to analyze data link configuration andbehavior in the presence of multiply conflictingobjectives. The approach is premised on thedevelopment of a formal taxonomic classification ofCNS/ATM systems, services, requirements andtechnologies. The taxonomy authorizes a coherentmethodology for data link architectural analysis.
The process permits the use of formal tools to allowusers to select optimal data link functions andservices that meet safety, integrity and operationalrequirements. The methodology was applied to aSATS CONOPS document for Higher VolumeOperations (HVO) at Non-Towered/Non-RadarAirports. The application provided sufficient insightinto how to pose "what if' questions, where to
incorporate external analysis tools, ways to managedecision uncertainty, and techniques used to selectoptimized data link architectures in the presence ofconflicting constraints.
References
[1] Zernic, Michael, Freudinger, Lawrence, andMorris, A. T., "Aeronautical Satellite Assisted
Process for Information Exchange through NetworkTechnology (AeroSAPIENT) Project: The InitialTrials", Proceedings from the IEEE AerospaceConference, Big Sky, Montana, March 10-17, 2001.
[2] Kayton, Myron, and Fried, Walter R., AvionicsNavigation Systems, 2nd Edition, John Wiley &Sons, Inc., 1997.
[3] ISO/IEC Information Technology-Open Systems
Interconnection-Basic Reference Model: The BasicModel. ISO/IEC 7498-1:1994.
[4] Jones, Rob, and Ciardo, Gianfranco, "OnPhased Delay Stochastic Petri Nets: Definition andan Application", Proc. of the 9th IEEE Int.Workshop on Petri Nets' and Pe(ormance Models'(PNPM'O1), Aachen, Germany, Sept. 11-14, 2001.
[5] Airborne Internet Technology Evaluation, aComputer Networks & Software, Inc. report toNASA Glenn Research Center under NASA
Contract No. NAS 3 99165, August 28, 2001.
[6] Murata, Tadao, "Petri Nets: Properties, Analysisand Applications", Proceedings of the IEEE, vol.77, no. 4, April 1989.
[7] Winston, W. L., and Albright, S. C., PracticalManagement Science: Spreadsheet Modeling andApplications, Wadsworth Publishing Co., 1997.
[8] Saaty, T., The Analytical Hierarchy Process,McGraw-Hill, New York, 1990.
[9] Yoon, K., Hwang, C., Multiple AttributeDecision Malting: an Introduction, Sage Pub., 1995.
[10] Lootsma, F., Multi-Criteria Decision Analysis'
via Ratio and Difference Judgements', KluwerAcademic Publishers, The Netherlands, 1999.
[11] Koczo, S., Integrated Airport Su(aceOperations, NASA/CR-1998-208441, July 1998.
[12] Morris, A.T., COTS Score: An AcceptanceMethodology for COTS Software, 19th DASC,
Philadelphia, PA., October 2000.
[13] Morris, A.T., and Beling, P.A., Space ShuttleRTOS Bayesian Network, 20 th DASC, DaytonaBeach, FL., October 2001.
[14] Pearl, J., Probabilistic Reasoning in Intelligent
Systems: Networks' of Plausible Inference, MorganKaufmann Publishers, San Mateo, CA., 1988.
[15] Minimum Aviation Systems Pe(ormanceStandards' for Automated Dependent Surveillance-Broadcast (ADS-B), RTCA/DO-242A, Draft 1,March 2, 2002.
[16] NASA, Small Aircraft Transportation System,2010 Concept of Operations Document, Version0.6, June 24, 2002.
[17] Ragsdale, Cliff T., Spreadsheet Modeling andDecision Analysis, 3rd Edition, South-WesternCollege Publishing, 2001.
[18] Abbott, T. S., and Elliott, D. M., SimulatorEvaluation of Airborne Information for LateralSpacing (AILS) Concept, NASA TP-2001-210665,March 2001.
[19] McDermott, W. J., Maluf, D. A., Gawdiak,Yuri, Tran, P., Secure Large-Scale Airportsimulations Using Distributed ComputationalResources, SAE 2001-01-2650, 2001.
[20] Walton, J. D., Filman, R. E., Korsmeyer, D. J.,The Evolution of the DARWIN System, Association
for Computing Machinery Symposium on AppliedComputing, Como, Italy, March 2000.
[21] Hillier, F. S., and Lieberman, G. J.,Introduction to Operations Research, Holden-DayInc., San Francisco, CA, 1980.
12