Embed Size (px)
Citation preview
III.C. Environmental Documents / 86
III.C.3. Seismic Hazard Investigation
A3GEO, Inc., was retained in 2014 by Center Street Partners, LLC, to complete a draft Geotechnical Investigations Report that provides data and interpretations pertaining to geotechni-cal, geologic and seismic conditions, and presents preliminary conclusions and recommendations. The report has remained as a “draft” pending review by the City and further refinement of the development proposal, after which it can be finalized to fully address related issues and concerns.
Key conclusions in the A3GEO Report (pages 8 and 20) include:
• The site is not within or proximate to any California Geo-logical Survey (CGS) hazard zones (for earthquake fault rupture, earthquake-induced landsliding or earthquake-induced liquefaction), as indicated by the City of Berkeley’s environmental constraints map.
• In downtown Berkeley, the official CGS liquefaction zone is confined to a narrow area directly adjacent to Strawberry Creek. Specifically, the City of Berkeley’s environmental constraints map indicates that the CGS liquifaction zone is one block south of the site.
• A USGS liquefaction susceptibility map prepared by Knud-sen, et al. (2000) shows all of downtown Berkeley as an area of “low” liquefaction susceptibility.
• Site characteristics are classified as “Site Class C - Very Dense Soil and Soft Rock,” according to the “Classification Procedure for Seismic Design” outlined in Chapter 20 of the ASCE 7-10 Standard.
While the A3GEO Report assumed a mixed-use high rise ris-ing to 180 feet, some project components have changed since the Report was prepared. Most notably, no below-grade levels are proposed as part of the current project. Thus, the effects of excavation and high water table are less relevant. The current project also has a lower floor area ratio (FAR) that was previ-ously proposed.
(See Attachment 2 for complete report.)

Geotechnical Investigation Report
2129 Shattuck ProjectShattuck Avenue and Center StreetBerkeley, California
SUBMITTED TO:
Center Street Partners, LLCc/o Charles W. Trainor980 Fulton AvenueSacramento, California [email protected]
March 24, 2014 DRAFT
A3GEO, Inc. 1331 Seventh Street, Unit E, Berkeley CA 94710
March 24, 2014 Center Street Partners, LLC c/o Charles W. Trainor 980 Fulton Avenue Sacramento, California 95825 [email protected] Geotechnical Investigation Report 2129 Shattuck Project Shattuck Avenue and Center Street Berkeley, California
Draft Report – Not for Final Design Dear Mr. Trainor, This draft report presents the results our geotechnical investigation for the proposed 2129 Shattuck project in downtown Berkeley, California. We provided our services in accordance with our January 10, 2014 Professional Services Agreement with Center Street Partners, LLC. This draft report includes data and interpretations pertaining to geotechnical, geologic and seismic conditions and presents preliminary conclusions and recommendations for the project, as it is currently envisioned. We obtained information about the project primarily from schematic-level drawings prepared by JRDV Urban International (the project Architect) and Tipping-Mar (the project Structural Engineer). The interpretations, conclusions and recommendations presented in this report were developed in accordance with generally-accepted geotechnical principles and practices at the time that this report was prepared. We recommend that this report remain in draft form until a future design phase when more details involving the project are known. We look forward to receiving written comments from you and the design team pertaining to this draft report. Should you have any questions concerning our findings, the geotechnical concepts discussed or our recommendations, please do not hesitate to call. Sincerely, A3GEO, Inc.
DRAFT
Wayne Magnusen, P.E., G.E. Principal Engineer Cell: (510) 325-5724

Report
2129 SHATTUCK PROJECT BERKELEY, CALIFORNIA

Page 1 of 29 March 24, 2014 DRAFT
1.00 INTRODUCTION This report presents the results of a geotechnical investigation by A3GEO for the 2129 Shattuck Project in Berkeley, California. We obtained information regarding the project conceptual design from the Project design team, which includes JRDV Urban International (Architecture) and Tipping/Mar (Structural Engineering). We provided our investigation phase services in accordance with our Professional Services Agreement with Center Street Partners LLC, executed on 10 January 2014. The Project location is indicated on the attached Vicinity Map, Plate 1. 1.01 Project Overview As shown on Plate 2, the 2129 Shattuck site is located in downtown Berkeley at the northeast corner of Shattuck Avenue and Center Street. The site measures about 160 feet by 250 feet in maximum plan dimensions; roughly the western half of the site is presently occupied by the downtown Berkeley branch of the Bank of America (Plate 2). The remainder of the site includes walkways, landscaping and an asphalt-concrete paved parking lot. The project site is directly adjacent to the University of California’s Berkeley Art Museum / Pacific Film Archives (BAM/PFA) project, which is presently (March 2014) under construction. The location of the Bay Area Rapid Transit (BART) system’s downtown Berkeley underground station/tunnel is indicated on Plate 2. As currently envisioned, the 2129 Shattuck development will include a 16-story mixed-use hotel high-rise over a single level basement. The basement and lower levels of the building occupy virtually all of the available site area; floors 6 through 16 have “L”-shaped floor plans surrounding a central structural core. JRDV’s 10 March 2014 architectural schematics show the top of the basement floor about 11 feet below ground floor level with a 2 percent downward slope toward the west. Tipping/Mar’s 12 December 2013 structural schematics show the building supported on a stepped structural mat foundation that is thicker in the area beneath and surrounding the central core. The site is about ¾ mile away from the Hayward fault; a major regional fault with the highest probability of producing a large magnitude earthquake in the San Francisco Bay Area. Accordingly, seismic design is a significant consideration for the project. 1.02 Purpose and Approach The primary purpose of this investigation was to provide geotechnical input to the design team in support of the schematic design phase. Our investigative approach included reviewing existing data, drilling one high-quality geotechnical boring extending into bedrock, conducting a geophysical survey within the open borehole, installing a well to monitor groundwater levels and conducting geotechnical laboratory tests. Based on the existing and newly-acquired data, we interpreted subsurface conditions across the site for the purpose of providing: 1) estimates of static long-term settlement under new building loads; 2) seismic criteria (a preliminary response spectrum) for initial structural analyses; and 3) preliminary geotechnical engineering recommendations pertaining to the design and construction of the project. It is our intent that this report remain in DRAFT format until a future final design phase when details involving the project are more firmly established. As part of a future final design phase, we would develop design earthquake ground motions for the project, conduct any supplemental investigations deemed necessary in support of the final project design, provide geotechnical comments on preliminary versions of the Contract Documents and provide earthquake engineering support during anticipated seismic design peer reviews. We anticipate that scope of our future design phase services (not in our present scope) will be influenced by project technical requirements, constraints and opportunities posed by the project schedule and the comments we receive pertaining to the contents of this draft geotechnical investigation report.

Page 2 of 29 March 24, 2014 DRAFT
1.03 Scope of Geotechnical Investigation The scope of our geotechnical investigation included:
Reviewing/interpreting geologic, seismic and historical information. Conducting a geotechnical field investigation with one boring and a downhole geophysical survey. Installing one monitoring well (piezometer) and measuring groundwater depths. Reviewing/interpreting existing geotechnical data from BART and the adjacent BAM/PFA Project. Characterizing geotechnical, geologic and seismic conditions at the site. Conducting engineering analyses and developing geotechnical and seismic design criteria. Preparing this geotechnical report presenting data, conclusions and recommendations.
Our scope was limited to geotechnical services and did not include investigation of the site for the presence of hazardous, toxic or corrosive materials or environmental consultation relating to soil reuse or offsite disposal. Other limitations of our study are discussed in Section 7.00. 1.04 This Report This report was prepared by Wayne Magnusen, P.E., G.E. of A3GEO in consultation with Dona Mann, P.E., G.E. of A3GEO and Shahriar (Shah) Vahdani, PhD., P.E. of Applied Geodynamics, Inc. (AGDI), our earthquake engineering subconsultant. The remainder of this report is organized into the following sections:
Section 2 describes our methods of investigation; Section 3 describes the project setting based on our review of existing information; Section 4 describes the site conditions and the results of onsite investigations; Section 5 presents geotechnical evaluations and conclusions for the project; Section 6 presents geotechnical recommendations for the project; Section 7 summarizes the limitations of our study; and Section 8 presents a list of selected references.
Following the written portion of this report are illustrative Plates, technical Figures and four Appendices: Appendix A presents the logs of our onsite test boring; Appendix B presents the Suspension Velocity Survey report obtained from Norcal Geophysical Consultants, Inc.; Appendix C presents our geotechnical laboratory test results; Appendix D presents existing nearby data obtained from BART and the BAM/PFA project; and Appendix E presents the preliminary response spectrum developed by AGDI.

Page 3 of 29 March 24, 2014 DRAFT
2.00 METHODS OF INVESTIGATION 2.01 Review of Geologic, Seismic and Historical Information We reviewed geologic maps and literature pertaining to geologic and seismic conditions as well as historic maps and photographs relating to the development of downtown Berkeley. A list of selected items that we reviewed as part of this study is presented in Section 8.00, “References.” 2.02 Rotary Wash Boring On February 5 and 6, 2014, we explored subsurface conditions by drilling one geotechnical boring (Boring B-1) at the approximate location shown on the Site Plan, Figure 1. The boring was drilled by Pitcher Drilling Company, Inc. of East Palo Alto using truck-mounted rotary wash drilling equipment. During drilling, our Certified Engineering Geologist logged the subsurface materials encountered and obtained samples at frequent intervals for examination and laboratory testing. The log of Boring B-1 is attached in Appendix A. Boring B-1 extended to a total depth of 91.5 feet with the bottom 39.5 feet within bedrock. We obtained samples of the subsurface materials using the following equipment:
2-inch outside diameter (O.D.) Standard Penetration Test (SPT) drive sampler without liners; 3-inch O.D. California Modified drive sampler with liners; and Pitcher Barrel sampler equipped with 36-inch-long 3-inch O.D. thin-walled steel tubes.
The SPT and Modified California drive samplers were advanced using a 140-pound automatic-trip hammer falling 30 inches. The hammer blows required to drive the sampler the final 12 inches of each 18-inch drive are presented on the boring logs. Where the sampler met early refusal, the number of hammer blows and the corresponding depth of penetration (in inches) are indicated. The Pitcher barrel was used to collect relatively undisturbed thin-wall samples at depths of 20, 30 and 40 feet for the purpose of evaluating soil strength and compressibility characteristics. Our Geotechnical Engineer (Dona Mann) reviewed samples in the laboratory to check field classifications and select suitable specimens for testing. Soils were classified in general accordance with ASTM D2488, which is based on the Unified Soil Classification System (USCS). The USCS is described on the Key to Exploratory Boring Logs, Figure A1. Rock was classified in general accordance with the Physical Properties for Rock Descriptions described on Figure A2. The attached log depicts interpreted subsurface conditions at the approximate location shown on the Site Plan (Figure 1) on the particular date designated on the log; the passage of time may result in changes in the subsurface conditions. The boring location indicated on the Site Plan was determined by measuring from existing improvements and should be considered approximate. Generalized descriptions of the conditions encountered at the location of Boring B-1 can be found in Section 4.02, “Subsurface Conditions.” 2.03 Downhole Geophysical Survey On February 6, 2014, Norcal Geophysical Consultants, Inc. (Norcal) conducted a downhole suspension velocity survey within Boring B-1. The downhole suspension velocity survey utilizes an elongated tool equipped with a source and receivers, which is lowered into a fluid-filled borehole. The source generates a pressure wave, which is converted to seismic pressure and shear waves (P- and S-waves) at the borehole wall. The elapsed time between the arrivals of the waves at the receivers is used to evaluate average P- and S-wave velocities at stationary intervals within the column of soil/rock that surrounds the borehole. Norcal’s suspension velocity survey report is presented in Appendix B. Three P-and S-wave measurements/calculations were made at each depth interval, which are reported together with an average value for that interval. The suspension velocity table in Appendix B presents data for 1 to 1.5-foot vertical intervals for depths between 8 and 75 feet. These data are also presented graphically on Norcal’s Figure 1 (Appendix B). .

Page 4 of 29 March 24, 2014 DRAFT
2.04 Piezometer Installation and Groundwater Depth Measurements On February 6, 2014, Boring B-1 was completed as a standpipe piezometer to allow for the future monitoring of groundwater depths/elevations (groundwater depths were not measured at the time of drilling as the borehole was filled with drilling fluid). The standpipe consists of 40 feet of 2-inch-diameter plastic pipe, the bottom 30 feet of which is slotted (0.020-inch slots). The top of the piezometer installation is fitted with a flush-mount surface enclosure. Other details pertaining to piezometer construction are summarized in the following table
Piezometer Construction Details
Approximate Depth Interval Annular Backfill
Surface to 1 foot Concrete (Surface Enclosure) 1 foot – 5.0 feet Neat Cement Grout
5.0 feet - 6.5 feet Bentonite Pellet Seal 6.5 feet – 42.0 feet No. 3 Monterey Sand
42.0 feet to 91.5 feet Bentonite Chips 2.05 Geotechnical Laboratory Testing The following geotechnical laboratory analyses were performed:
Consolidation Tests per ASTM Test Designation D-2435 Water content per ASTM D-2216; Dry density per ASTM D-2937; Atterberg Limits per ASTM D-4318; Particle size analysis per ASTM D-422; and Unconsolidated-undrained triaxial test per ASTM D-2850.
The preceding tests were conducted in general accordance with the current edition of the referenced ASTM standards at the time the tests were performed. The results of the tests are presented on the boring log presented in Appendix A at the appropriate sample depths. Laboratory data sheets are included in Appendix C. 2.06 Review of BART and BAM/PFA Data We retrieved logs of two nearby borings drilled for BART (boring designations R-005-13 and R-005-14) from our in-house geotechnical database. We also obtained geotechnical data and other information for the adjacent BAM/PFA site from the University of California, Berkeley’s (UCB’s) Project Manager. These sources of data/information included:
Geotechnical Report - AMEC, 2013, “Geotechnical Investigation, Berkeley Art Museum and Pacific Film Archive, University of California at Berkeley, California,” consulting report dated March 26, 2013. Shoring Plans - Degenkolb, 2013, “BAM/PFA Shoring and Construction Means & Methods, Conformance Set #1 dated 7/23/2013”. Design Drawings - DS+R/EHDD, 2013,“ Berkeley Art Museum / Pacific Film Archive, University of California, Berkeley, U.C. #12259A, 100% Construction Documents, August 14, 2013,” Volume 1 – Civil; Volume 2 - Structural; Sheets A8.01 – A8.03 – waterproofing details
The Site Plan presented on Figure 1 includes the locations of nearby borings for which geotechnical data is available; selected subsurface data from these sources are attached in Appendix D.

Page 5 of 29 March 24, 2014 DRAFT
3.00 GEOLOGIC, SEISMIC AND HISTORICAL SETTING 3.01 Regional Geology The project site lies within the Coast Ranges geomorphic province of northern California, which is characterized by northwest-trending mountain ranges and valleys that generally parallel major regional geologic structures, such as the San Andreas, Hayward, and Calaveras faults. Among the oldest rocks in the region are basement rocks of the Great Valley, Franciscan and Salinian complexes (Plate 3), which are mostly Cretaceous-Jurassic in age (about 66 to 200 million years old). These basement rocks are locally overlain by younger sedimentary and volcanic rocks of Tertiary age (65 million to 1.8 million years old). Since deposition, the basement and Tertiary-age rocks have been extensively deformed by repeated episodes of folding and faulting. The San Francisco Bay Area experienced several episodes of uplift and faulting during the late Tertiary Period (about 1.8 million to 25 million years ago) that produced the region’s characteristic northwest-trending mountain ranges and valleys, such as San Francisco Bay and Berkeley Hills. World-wide climatic fluctuations occurred during the Pleistocene epoch (about 1.8 million to 11,000 years ago), which resulted in several distinct glacial periods. A lowering of sea level accompanied each glacial advance; melting of the continental glaciers during warmer climatic intervals caused corresponding rises in sea level. The most recent glacial period ended about 11,000 years ago. During the maximum extent of this most recent glacial period, sea levels lowered about 300 to 400 feet below its present elevation, and the valley currently occupied by San Francisco Bay drained to the Pacific Ocean more than 30 miles west of the Golden Gate.Near the beginning of the Holocene epoch (about 11,000 years ago), sea level had risen and re-entered the Golden Gate, which resulted in the accumulation of sediments within San Francisco Bay and the surrounding plains. Sediments covering the bottom of San Francisco Bay and blanketing much of the adjacent floodplains and are less than 11,000 years in age. Because of their geologically-recent deposition, these materials are generally less dense, weaker, and more compressible than the older, well-consolidated, Pleistocene-aged soils that predate the last sea level rise. 3.02 Bay Area Active Faults San Francisco Bay Area is located within a broad region of deformation at the boundary between the North American and Pacific tectonic plates. This region includes a series of major active northwest-trending faults, which include the San Andreas, Hayward, Rodgers Creek, Calaveras, San Gregorio, Concord-Green Valley, West Napa, and Greenville faults (Plate 4). The major regional faults shown on Plate 4 are near-vertical in orientation, and generally exhibit right-lateral, strike-slip movement (which means that movement along these faults is predominantly horizontal, and when viewed from one side of the fault to the other, the opposite side of the fault is observed as being displaced to the right). Faults that are defined as active exhibit one or more of the following: (1) evidence of Holocene-age (within about the past 11,000 years) displacement, (2) measurable seismic fault creep, (3) close proximity to linear concentrations or trends of earthquake epicenters, and/or (4) tectonic-related geomorphology. Potentially active faults are defined as those that have evidence of Quaternary-age displacement (within the past 11,000 to 2 million years), but have not been definitively shown to lack Holocene movement. The closest known active fault to the project site is the Hayward fault, which runs along the base of the Berkeley Hills about 0.73 mile northeast of the site. The Hayward fault is roughly 74 miles long, trending northwest from San Jose through several East Bay cities into San Pablo Bay. Further northward of San Pablo Bay is the Rodgers Creek fault, which is offset slightly eastward of the Hayward fault. Both Hayward and Rodgers Creek faults are considered to be interconnected by a series of en echelon fault strands, that are inferred to step eastward beneath San Pablo Bay. To the south, the Hayward fault also is considered to merge with the Calaveras fault, which lies to the south of San Jose. The Calaveras fault extends northward and merges with other unnamed faults within San Ramon Valley, which is located further eastward of the Hayward fault.

Page 6 of 29 March 24, 2014 DRAFT
Approximate distances and directions to major active Bay Area faults from the project site are shown in the following table (Jennings and Bryant, 2010).
Approximate Distances and Directions to Active Faults
Active Fault Approximate
Distance from Site (miles)
Approximate Direction from Site
Hayward 0.6 Northeast Calaveras 12.1 East Rodgers Creek 14.2 Northwest Concord-Green Valley 14.5 Northeast San Andreas 17.8 Southwest Greenville 18.6 Northeast West Napa 19.1 North San Gregorio 20.3 Southwest
3.03 Bay Area Seismicity The greater San Francisco Bay Area region is characterized by a high level of seismic activity. Historically, this region has experienced strong ground shaking from large earthquakes, and will continue to do so in the future. Since 1800, five earthquakes with Moment Magnitudes (M) of 6.5 or greater have occurred in the Bay Area (Bakun, 1999). These include the 1) 1836 M6.5 event east of Monterey Bay; 2) 1838 M6.8 event on the Peninsula section of the San Andreas fault; 3) 1868 M6.8-7.0 Hayward event on the Southern Hayward fault; 4) 1906 M7.9 San Francisco event on the San Andreas fault; and 5) 1989 M6.9 Loma Prieta event in the Santa Cruz Mountains. In 2003, The Working Group on California Earthquake Probabilities (WGCEP, 2003), in conjunction with the United States Geological Survey (USGS), published an updated report evaluating the probabilities of significant earthquakes occurring in the Bay Area over the next three decades, (2002-2031), which has since been updated on a state-wide scale in 2008 for the time span of 2007 through 2036. The WGCEP 2008 report indicates that there is a 0.63 (63 percent) probability that at least one magnitude 6.7 or greater earthquake will occur in the San Francisco Bay region before 2037. This probability is an aggregate value that considers seven principal Bay Area fault systems and unknown faults (background values – WGCEP, 2003). The findings of the WGCEP 2008 report are summarized in the following table:
WGCEP (2008) Probabilities
Fault System Probability of At Least One Magnitude 6.7
or Larger Earthquake in 2007-2036
Hayward/Rodgers Creek 0.31 San Andreas 0.21 Calaveras 0.07 San Gregorio 0.07 Concord-Green Valley 0.03 Greenville 0.03 Mount Diablo Thrust 0.01 Background *(2002-2031) 0.14*
The published background values are not explicitly stated in the WGCEP (2008) and thus the WGCEP (2003) values were used. The background values indicate that between 2002 and 2031 there is a 14 percent chance that an earthquake with a magnitude of greater than 6.7 may occur in the Bay Area on a

Page 7 of 29 March 24, 2014 DRAFT
fault system not characterized in the study. 3.04 Local Geology The site is situated near the eastern edge of a broad, gently-sloping plain deposited by streams flowing westward from the Berkeley Hills. Franciscan complex bedrock, which is present near the ground surface within the UCB Main Campus to the east, underlies the alluvial deposits at the site. The U.S. Geological Survey (USGS) regional geologic map on Plate 5 (Graymer, 2000) maps the near surface soils at the site as alluvial and fluvial deposits of Holocene age (map symbol Qhaf). Knudsen et al. (2000) describes the Qhaf unit as follows:
(Qhaf): Sediments deposited by streams emanating from mountain canyons onto alluvial valley floors or alluvial plains as debris flows, hyperconcentrated mudflows, or braided stream flows. Alluvial fan sediment includes sand, gravel, silt, and clay, and is moderately to poorly sorted and moderately to poorly bedded. Sediment clast size and general particle size typically decrease downslope from the fan apex. Many Holocene alluvial fans exhibit levee/interlevee topography, particularly the fans associated with the fans flowing west from the eastern San Francisco Bay hills. Alluvial fan deposits are identified primarily on the basis of fan morphology and topographic expression. Holocene alluvial fans are relatively undissected, especially, when compared to older alluvial fans. In places, Holocene deposits may be only a thin veneer over Pleistocene deposits. Soils are typically entisols, inceptisols, mollisols and vertisols. Greater than 5 percent of the nine-county San Francisco Bay Area is covered by Holocene alluvial fan deposits. It is the most extensive Quaternary map unit in the region.
Alluvial fan and fluvial deposits of Pleistocene age (map symbol Qpaf) are mapped several blocks north of the site (Plate 5). Knudsen et al. (2000) describes these older alluvial deposits as follows:
(Qpaf): Latest Pleistocene alluvial fan sediment was deposited by streams emanating from mountain canyons onto alluvial valley floors or alluvial plains as debris flows, hyperconcentrated mudflows, or braided stream flows. Alluvial fan sediment typically includes sand, gravel, silt, and clay, and is moderately to poorly sorted, and moderately to poorly bedded. Sediment clast size and general particle size typically decreases downslope from the fan apex. Latest Pleistocene alluvial fan sediment is approximately 10 percent denser than Holocene alluvial fan sediment and has penetration resistance values about 50 percent greater than values for Holocene alluvial fan sediment. Deposits are typically very stiff to hard or medium-dense to very dense.
Franciscan complex sandstone (map symbol KJfs) and mélange (map symbol KJfm) are mapped on the UCB Main Campus to the east of the site (Plate 5). Graymer (2000) describes these basement rock units as follows:
(KJfs): Franciscan complex sandstone, undivided (Late Cretaceous to Late Jurassic)--Graywacke and meta-graywacke. (KJfm): Franciscan complex mélange (Cretaceous and/or Late Jurassic)- Sheared black argillite, graywacke, and minor green tuff, containing blocks and lenses of graywacke and meta-graywacke (fs ), chert (fc), shale, metachert, serpentinite (sp), greenstone (fg), amphibolite, tuff, eclogite, quartz schist, greenschist, basalt, marble, conglomerate, and glaucophane schist (fm). Blocks range in size from pebbles to several hundred meters in length. Only some of the largest blocks are shown on the map.
Radbruch (1957) maps the surfical deposits at the site as Temescal Formation, a Quaternary (younger than about 1.8 million years) deposit described as “gravel, clayey; clay, sandy, silty; and sand-clay-silt mixtures.”

Page 8 of 29 March 24, 2014 DRAFT
3.05 Geologic Hazard Mapping The City of Berkeley’s environmental constraints map (Plate 6) includes geologic hazard zones mapped by the California Geological Survey (CGS). As shown on Plate 6, the site is not within nor proximate to any of the mapped CGS hazard zones (earthquake fault rupture, earthquake-induced landsliding or earthquake-induced liquefaction1). In downtown Berkeley, the official CGS liquefaction zone is confined to a narrow area directly adjacent to Strawberry Creek. This zone is mapped about one block south of the site. A USGS liquefaction susceptibility map prepared by Knudsen, et al. (2000) shows all of downtown Berkeley as an area of “low” liquefaction susceptibility. The Knudsen, et al. (2000) map also shows recorded instances of past ground effect occurrences resulting from earthquake shaking. The nearest such instance is mapped in the vicinity of the Berkeley Marina, about 2.5 miles west-southwest of the site. A professional paper on earthquake damage from the 1906 San Francisco earthquake (Youd and Hoose, 1978) suggests that there are no documented cases of liquefaction-induced ground failures having occurred in Berkeley as a result of the 1906 event. A 1990 report on the geotechnical aspects of the Loma Prieta Earthquake (Seed, et al., 1990) suggests that documented occurrences of soil liquefaction in Berkeley associated with Loma Prieta were confined to areas that are underlain by fill (the Berkeley Marina and areas surrounding Highway 80 west of Aquatic Park). In general, the references that we reviewed do not include any reported incidents of liquefaction in the general project vicinity. 3.06 Site Development Prior to development, the Berkeley plain was dissected by a series of east-west trending creeks that flowed from the Berkeley Hills west towards San Francisco Bay. During the development of downtown Berkeley, which occurred during the mid to late 1800s, culverts were installed within the creek beds, the creeks were filled in, and the mostly rectangular grid of streets was laid out and graded. There is no record of how much fill was placed in specific areas in this initial stage of development; however, generally deeper fills exist in former low-lying areas adjacent to creeks. The 1878 map presented on Plate 7 shows Strawberry Creek, the most significant creek in downtown Berkeley, once flowed through the corner of what is now Shattuck Avenue and Allston street about one block south of the site. The 1897 Campus Map (Plate 8) includes topographic contour lines that generally show the site along the northern edge of the Strawberry Creek floodplain. The creek map presented on Plate 9 (Sowers, 1993) generally shows the site midway between Strawberry Creek and a former tributary creek to the northwest. Most of the parcels in downtown Berkeley have experienced multiple phases of building and demolition in the past 100 or more years. Historical photographs from the late 1800’s and early 1900’s (Plate 10) generally show two- and three-story wooden buildings at the site. The 1923 photograph presented on Plate 11 shows the 5-story building directly north of the site, which is known locally as the F. D. Chase Building. The series of historical photographs on Plate 12 show a six-story structure at the northeast corner of Center Street and Shattuck Avenue identified on a circa 1918 photograph as the Berkeley National Bank Building. The 1971 photograph on Plate 12 shows the former bank building being demolished. We did not have the opportunity to review plans or any other technical information pertaining to the existing Bank of America facility that currently occupies the 2129 Shattuck site. The adjacent BAM/PFA project, which is presently under construction, includes a basement excavation with temporary shoring elements (soil nails) that extend beneath the eastern edge of the Bank of America parking lot. A construction photograph that looks west across the BAM/PFA project site is presented on Plate 13.
1 Liquefaction is a phenomenon whereby susceptible soils, when submerged, can lose strength, compress (settle) and sometimes gain mobility in response to earthquake ground shaking.
Page 9 of 29 March 24, 2014 DRAFT
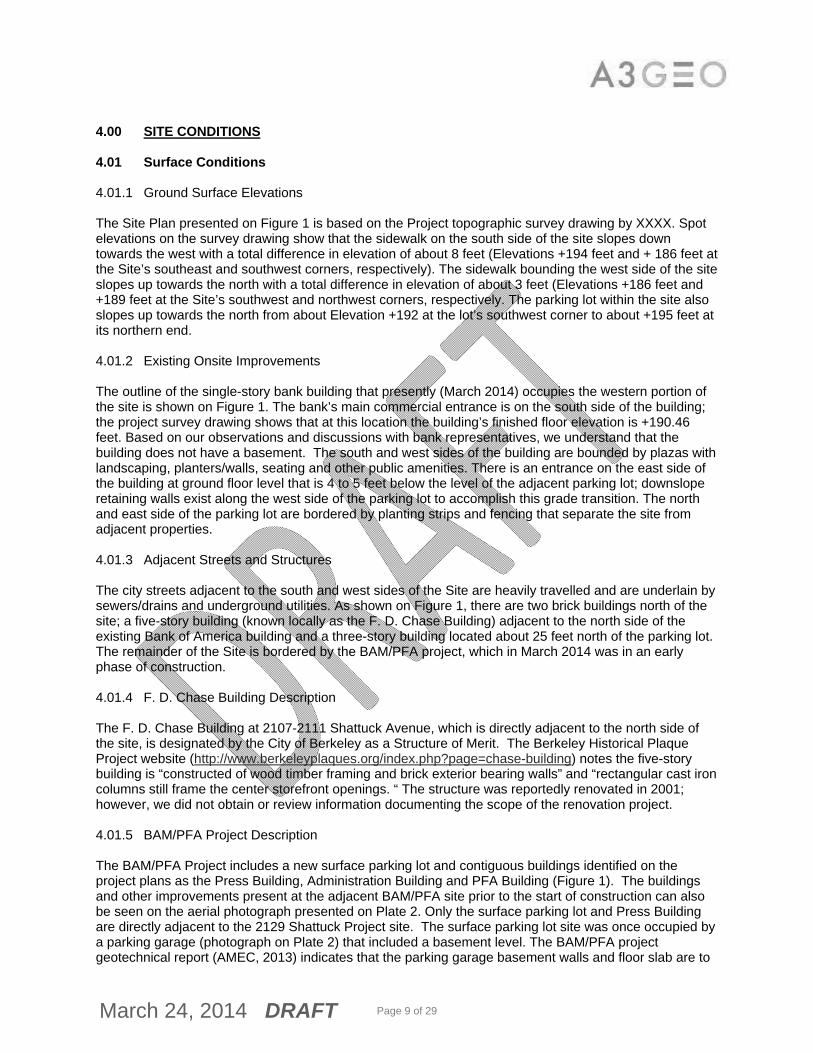
4.00 SITE CONDITIONS 4.01 Surface Conditions 4.01.1 Ground Surface Elevations The Site Plan presented on Figure 1 is based on the Project topographic survey drawing by XXXX. Spot elevations on the survey drawing show that the sidewalk on the south side of the site slopes down towards the west with a total difference in elevation of about 8 feet (Elevations +194 feet and + 186 feet at the Site’s southeast and southwest corners, respectively). The sidewalk bounding the west side of the site slopes up towards the north with a total difference in elevation of about 3 feet (Elevations +186 feet and +189 feet at the Site’s southwest and northwest corners, respectively. The parking lot within the site also slopes up towards the north from about Elevation +192 at the lot’s southwest corner to about +195 feet at its northern end. 4.01.2 Existing Onsite Improvements The outline of the single-story bank building that presently (March 2014) occupies the western portion of the site is shown on Figure 1. The bank’s main commercial entrance is on the south side of the building; the project survey drawing shows that at this location the building’s finished floor elevation is +190.46 feet. Based on our observations and discussions with bank representatives, we understand that the building does not have a basement. The south and west sides of the building are bounded by plazas with landscaping, planters/walls, seating and other public amenities. There is an entrance on the east side of the building at ground floor level that is 4 to 5 feet below the level of the adjacent parking lot; downslope retaining walls exist along the west side of the parking lot to accomplish this grade transition. The north and east side of the parking lot are bordered by planting strips and fencing that separate the site from adjacent properties. 4.01.3 Adjacent Streets and Structures The city streets adjacent to the south and west sides of the Site are heavily travelled and are underlain by sewers/drains and underground utilities. As shown on Figure 1, there are two brick buildings north of the site; a five-story building (known locally as the F. D. Chase Building) adjacent to the north side of the existing Bank of America building and a three-story building located about 25 feet north of the parking lot. The remainder of the Site is bordered by the BAM/PFA project, which in March 2014 was in an early phase of construction. 4.01.4 F. D. Chase Building Description The F. D. Chase Building at 2107-2111 Shattuck Avenue, which is directly adjacent to the north side of the site, is designated by the City of Berkeley as a Structure of Merit. The Berkeley Historical Plaque Project website (http://www.berkeleyplaques.org/index.php?page=chase-building) notes the five-story building is “constructed of wood timber framing and brick exterior bearing walls” and “rectangular cast iron columns still frame the center storefront openings. “ The structure was reportedly renovated in 2001; however, we did not obtain or review information documenting the scope of the renovation project. 4.01.5 BAM/PFA Project Description The BAM/PFA Project includes a new surface parking lot and contiguous buildings identified on the project plans as the Press Building, Administration Building and PFA Building (Figure 1). The buildings and other improvements present at the adjacent BAM/PFA site prior to the start of construction can also be seen on the aerial photograph presented on Plate 2. Only the surface parking lot and Press Building are directly adjacent to the 2129 Shattuck Project site. The surface parking lot site was once occupied by a parking garage (photograph on Plate 2) that included a basement level. The BAM/PFA project geotechnical report (AMEC, 2013) indicates that the parking garage basement walls and floor slab are to

Page 10 of 29 March 24, 2014 DRAFT
be abandoned in place and 5 to 10 feet of fill will be placed to construct the new surface parking lot. The new Press Building incorporates the south façade of the UC Printing Plant Building that formerly occupied the site (Plate 2). The BAM/PFA project geotechnical report (AMEC, 2013) indicates that the bottom of the new mat foundation for the Press Building bears upon a newly-excavated subgrade that is up to about 24 feet lower than the former UC Printing Plant Building main shop floor.
The Foundation Plan Lower Level (Sheet S2.00F of the BAM/PFA Design Drawings) shows the mat foundation in the portion of the Press Building closest to the 2129 Shattuck site to be 36 inches thick. We understand that the Press Building basement walls and mat are waterproofed and equipped with a permanent subsurface drainage system intended to prevent groundwater from rising to the level of the mat.
The Foundation Rough Grading Plan (Sheet C4.02 of the BAM/PFA Project Plans) shows a design subgrade elevation of +176.56 feet within the portion of the Press Building directly adjacent to the 2129 Shattuck Avenue site. The BAM/PFA Shoring Plans show the vertical cut along the east side of the 2129 Shattuck Avenue property retained by a shotcrete shoring wall with three rows of soil nails. The soil nail schedule presented on Sheet SH5.01 of the BAM/PFA Shoring Plans show soil nails at this location consisting of #8 (1 inch diameter) steel reinforcing bars that are 16 feet long installed at a downward angle of 15 degrees from the horizontal (plus or minus 2 degrees). 4.02 Subsurface Conditions 4.02.1 Generalized Subsurface Conditions Figure 2 presents an interpretive east-west cross section through the site based on data from our Boring B-1 (Appendix A) and the logs of previous borings by others (Appendix C). The location of Cross Section A-A’ is indicated on the Site Plan, Figure 1. In general, the cross section depicts a thin layer of surficial fill overlying natural alluvial deposits overlying Franciscan Complex bedrock. Depths/elevations of fill, alluvial deposits and bedrock obtained from the logs of each of the borings shown on Figure 1 are shown in the following table:
Material Depth/Elevation Data from Boring Logs
Boring Top of Boring
Elevation* (feet)
Fill Depth (feet)
Top of Natural Alluvium Elevation
(feet)
Top of Bedrock
Depth (feet)
Top of Bedrock Elevation
(feet) B-1 194.0 3.0 191.0 52.0 142.0
GB-1 192.0 - 192.0 - - GB-2 192.0 2.5 189.5 - - GB-3 194.0 8.0 186.0 48.5 145.5 GB-4 200.0 - 200.0 24.0 176.0 (highest) GB-5 201.5 - 201.5 62.0 139.5 WC-2 200.5 3.0 197.5 54.0 146.5
R-005-13 185.0 2.5 182.5 52.0 133.0 (lowest) R-005-14 187.0 2.0 185.0 44.0 143.0
* Ground surface elevations obtained from logs of borings - Not encountered
The highest bedrock elevation was encountered in Boring GB-4, which is located on the UC Campus about 310 feet east of the site. The lowest bedrock elevation was encountered in Boring R-005-13, which is located on Center Street about 120 feet southwest of the site. The logs of the remaining four borings that encountered bedrock (B-1, GB-3, GB-4, WC-2 and R-005-14) show bedrock at elevations ranging from +139.5 feet to +146.5 feet (an elevation interval of 7.0 feet).

Page 11 of 29 March 24, 2014 DRAFT
The logs of recent borings (A3GEO, 2104 and AEC, 2013) generally show the natural alluvial soils overlying bedrock consist predominantly of clay with interbedded layers/lenses of clayey sand. The 1963 logs for BART show coarse-grained sand with gravel between depths of 46 and 51 feet in Boring R-005-13 and between depths of 10 and 20 feet in Boring R-005-14. Cross Section A-A’ (Figure 2) presents one possible interpretation of the distribution of sandier deposits beneath and surrounding the Site. The subsections that follow include more detailed information pertaining to the materials encountered at the location of our Boring B-1. The project as presently envisioned involves a basement with a mat foundation; for discussion purposes, we have assumed that the base of the mat may be near Elevation +177 feet. This elevation, which represents a possible future depth of excavation, is also depicted on Cross Section A-A’ (Figure 2). 4.02.2 Fill (above Elevation + 177 Feet) Boring B-1 encountered about 5 inches of asphalt concrete pavement underlain by about 2 feet of poorly-graded sand with gravel, which we generally characterize as fill. At the bottom of the sand with gravel layer, Boring B-1 encountered about 6 inches of concrete rubble fill overlying natural alluvium. The source of the concrete-derived fill material is not known; however, various buildings and other improvements once existed at the site that are no longer present. We anticipate that fill materials and remnants of former structures may also exist beneath other areas of the site that have not been explored by borings. Depths/thicknesses of these sorts of materials could vary significantly, and it is possible that substantially deeper fills are present at the site related to old depressions, pits or basements. However based on the information referenced in this report, we consider it generally unlikely that any fill materials present at the site would extend below the level of the planned 2129 Shattuck basement and mat foundation. 4.02.3 Alluvium above Elevation +177 Feet Below the fill, Boring B-1 encountered stiff clay of varying plasticity extending to a depth of about 14 feet. An Atterberg Limits determination performed on a sample of clayey alluvial soil from a depth of about 6 feet produced a Plasticity Index (PI) of 33, which is generally indicative of soil with high expansion potential (expansive soils generally shrink and swell with changes in moisture content). Between depths of 14 and 16 feet (Elevations +180 feet to +178 feet, Boring B-1 encountered a two-foot-thick layer of clayey sand with gravel. A Modified California sampler driven within this layer produced an adjusted N-value of 21 blows per foot; upon retrieval, the sample appeared saturated and highly disturbed (i.e. slough-like). A subsequent sieve analysis performed on the sample resulted in 20 percent gravel, 41 percent sand and 39 percent fines (silt and clay). Although only 2 feet thick at the location of Boring B-1, a similar but substantially thicker layer is shown on the log of Boring GB-3, drilled about 125 feet to the southeast. 4.02.4 Alluvium below Elevation +177 Feet Based on the presence of clayey sands in Borings B-1 and GB-3, we interpret that excavation in the east and southeast portion of the site may expose soils that are predominantly granular. Sampler blow count data presented on the log of Boring B-1 (Appendix A) and GB-3 (Appendix D) generally indicates that the clayey sand layer ranges from medium dense to dense. Based on the condition of the sample we retrieved from within this layer (from Boring B-1) and anecdotal information from the BAM/PFA project pertaining to groundwater, we interpret that this layer may be: 1) easily disturbed when saturated; and 2) a possible source of high groundwater flows. The interpretive cross section presented on Figure 2, which is based on limited subsurface data, shows clayey soils present at planned excavation depth (Elevation +177 feet) within the western portion of the Site. This interpretation is based on the assumption that the granular soils present in Borings GB-3 and B-1 “pinch out” towards the northwest. However, based on the data from Boring R-005-14, it is also permissible

Page 12 of 29 March 24, 2014 DRAFT
to interpret granular soils to exist at planned excavation depth in the west-northwest region of the site. This alternate interpretation, although equally valid, is not illustrated on Figure 2. Between depths of 16 feet and 34 feet (Elevation +178 to +160 feet), Boring B-1 encountered about 18 feet of stiff clay. Two triaxial-undrained shear strength tests performed on samples from this depth interval produced undrained shear strength (SU) values of 1569 and 1828 pounds per square foot (psf). Between depths of 34 and 40 feet, Boring B-1 encountered about 6 feet of clayey sand containing an estimated 30 percent moderately plastic fines. Below the clayey sand, Boring B-1 encountered very stiff clayey soils extending down to the surface of bedrock (52 feet). A triaxial-undrained shear strength test performed on a sample from near the top of this clay layer produced an SU value of 2065 psf. 4.02.6 Franciscan Complex Bedrock The bedrock encountered Boring B-1 generally consisted of shale that was friable to weak, little to moderately weathered, intensely fractured, pervasively sheared low hardness. In general, the bedrock surface was clearly-defined; an SPT sampler driven at/near the top of the bedrock surface produced blow counts of 45 and 47 over two 6-inch measurement intervals (92 blows for one foot of penetration). 4.02.7 Groundwater Natural groundwater levels at the Site would be expected to fluctuate on an annual basis as well as over longer intervals depending upon climate and long-term weather patterns. In addition, it can be expected that actual groundwater levels may vary to non-natural causes, such as groundwater pumping, subsurface drainage facilities, underground structures that impede natural groundwater flow and water entering the ground from surface/subsurface drains and sewers. The following table summarizes groundwater depth/elevation data from: 1) our current investigation; 2) the geotechnical investigation report for the BAM/PFA project (AMEC, 2013); and 3) the log of BART Boring R-005-13.
Groundwater Monitoring Data
Boring Top of Boring
Elevation (feet)
Groundwater Measurement
Date
Groundwater Depth (feet)
Groundwater Elevation
(feet) B-1 194.0 3/17/14 19.8 174.2 Note A
GB-1 192.0 12/06/12 9.0 183.0 Note B GB-2 192.0 12/06/12 5.0 187.0 Note B GB-3 194.0 1/16/13 13.1 180.9 Note B GB-4 200.0 12/06/12 11.5 188.5 Note B
R-005-13 185.0 11/63 9.0 176.0 Note C In reviewing the preceding raw data, please note:
A. Our investigation was conducted during an unusually dry winter at a time when the adjacent BAM/PFA project site was being dewatered.
B. AMEC’s 2013 report contains data from six groundwater monitoring events, conducted between May 8, 2008 and January 1, 2013. The table that follows presents data only for the highest groundwater level recorded at each piezometer location.
C. The groundwater depth/elevation measurement on the log of Boring R-005-13 was made before BART station and tunnel was constructed and the influence of underground BART structures and improvements on local hydraulic/hydrogeologic conditions is not known.
Hydrogeologically, the Site is located on a gently-sloping alluvial plain through which water flows from the Berkeley Hills west-southwest towards San Francisco Bay. The natural piezometeric surface in the vicinity of the site is therefore not level, but also slopes down towards the west-southwest. Groundwater flow tends to be greater in soils with higher permeability; particularly where permeable layers are continuous

Page 13 of 29 March 24, 2014 DRAFT
and connected to a source of high water flows. In general, the sandier soils depicted on Cross Section A-A’ may have permeabilities that are orders of magnitude higher than the clayier soils. During our investigation, persons involved in the adjacent BAM/PFA reported to us that very high groundwater flows were encountered at the southeast corner of the BAM/PFA site (i.e. near the southeast corner of the 2129 Shattuck site).

Page 14 of 29 March 24, 2014 DRAFT
5.00 EVALUATIONS AND CONCLUSIONS. 5.02 Geologic Hazard Assessment 5.02.1 Earthquake Ground Shaking The San Francisco Bay Area is subject to periodic earthquake ground shaking and strong ground shaking is likely to occur at the site within the life of the project as a result of future earthquakes. The site is about 0.6 mile from the Hayward fault, the fault with the highest probability of producing a large (M 6.7 or larger) earthquake in the San Francisco Bay Area. Structures at the site will be designed to resist strong ground shaking in accordance with the requirements of the California Building Code (CBC) and local design practice. The California Building Code (CBC) outlines standard procedures for seismic design intended to account for the effects of earthquake shaking. In recent versions of the CBC, the effect of soil conditions on surface ground motions is accounted for through the use of site classifications. In the 2013 CBC, sites are classified as A through F based on average properties for the upper 100 feet of underlying material (soil or rock). In our judgment, the S-wave velocity data presented in Appendix C justifies a Site Class C designation (very dense soil and soft rock), which corresponds to average S-wave velocities of 1,200 to 2,500 feet per second (ft/s). The Probabilistic Seismic Hazards Ground Motion Interpolator (2008) on the CGS website (http://www.quake.ca.gov/gmaps/PSHA/psha_interpolator.html) provides the following Peak Ground Acceleration (PGA) estimates for a 10 percent probability of exceedence in 50 years (475-year return period) level of hazard:
CGS PGA Estimates for 475-year Return Period Earthquake
S-wave Velocity PGA 1200 ft/s (365 m/s) 0.709g 2500 ft/s (762m/s) 0.659g
Geotechnical parameters for use with the 2013 CBC are presented in Section 6.01, “Building Code Seismic Design Parameters.” The seismic design provisions of the CBC also allow the use of earthquake ground motions developed through a site-specific probabilistic seismic hazard assessment (PSHA). Preliminary PSHA-derived ground motions developed for use in the schematic design phase are presented in Appendix E. 5.01.2 Soil Liquefaction Liquefaction is a phenomenon under which ground shaking can cause certain types of susceptible soils under groundwater to lose strength, compress (settle) and/or gain mobility (flow). Soils generally considered most susceptible to liquefaction include loose, clean, coarse-grained soils (i.e., sands and gravels) that are below groundwater. Submerged, fine-grained soils (i.e., silts and clays) with very low plasticity can also experience generally similar cyclic degradation in response to earthquake shaking and are considered susceptible to liquefaction if certain criteria are met. Liquefaction and similar phenomena within fine-grained soils is a topic of ongoing research. However, there appears to be an emerging consensus that: 1) the Plasticity Index (PI) is one good indicator of liquefaction susceptibility; and 2) there exists a fines content threshold (FCthr) above which a soil will behave like the fines and not the coarser matrix soil. Typically, the FCthr is between about 20 and 35 percent depending on factors such as the soil’s full gradational characteristics, mineralogical composition, particle shapes, and depositional environment. Review of the official seismic hazard map for this area prepared by the California Geological Survey (CGS, 2003) indicates that the site is not within a mapped zone for which an evaluation of soil liquefaction

Page 15 of 29 March 24, 2014 DRAFT
is required. The nearest CGS Seismic Hazard Zone for liquefaction approximately corresponds with the location of the former Strawberry Creek channel, which is located about one block south of the site. Data presented on the log of Boring B-1 (Appendix A) generally indicates that most of the soils encountered below groundwater are of sufficient density and/or plasticity to preclude liquefaction. The clayey sand layers encountered in Boring B-1 (also depicted in cross section on Figure 2) may be considered “borderline” in terms of their liquefaction potential; the following table presents information and data pertaining to these specific layers.
Clayey Sands Logged in Boring B-1
Depth Interval Elevation Interval Blow Count (adjusted)
Fines Content Fines Characteristics
14 to 16 feet +180 to +178 feet 23 39% Low Plasticity 34 to 40 feet +160 to +154 feet 21 30% (estimated) Moderate Plasticity
In general, we judge there to be a generally low potential for significant liquefaction to occur within either layer as a result of a design-level earthquake. Were liquefaction to occur, the principal consequence would be settlement; based on the available data we estimate that seismic-related settlement at the site would be small, probably less than about 1 inch. Accordingly, based on the available data, we judge the overall potential for liquefaction to pose a significant hazard to the planned building to be low. 5.01.3 Surface Fault Rupture The references that we reviewed indicate the closest mapped active fault is the Hayward fault, which is approximately 0.73 miles northeast of the site. The site is not within an Alquist-Priolo Special Study Zone (CDMG, 1982) and no mapped fault traces pass through the site. Consequently, we judge that the likelihood of surface fault rupture occurring at the site is very low. 5.01.4 Landsliding The site and surrounding area are nearly level. No landslides are present that could cause movement of material on or into the site. The site is not within a mapped landslide or an area considered to have a potential landslide hazard; therefore, we judge that the potential for landsliding at the site is nil. 5.01.5 Inundation The site is located approximately two miles from San Francisco Bay near Elevation +200 feet; inundation by tsunami or seiche is therefore not a concern. To our knowledge, there are no dams or large reservoirs upslope of the site that could pose an inundation hazard to the Berkeley Way facility. There are no creeks or other significant drainages in the direct vicinity and we consider the overall risk of large-scale inundation of the site to be essentially nil. 5.02 Foundation Settlement
5.02.1 Overview The 2129 Shattuck building will be supported on a reinforced concrete mat foundation that bears on natural undisturbed alluvial soils. For a basement-level mat foundation founded near Elevation +177 feet, about 35 feet of clayey alluvial soil would underlie the mat at the location of Boring B-1. Clayey soils can compress slowly in response to increases in sustained loads; a process commonly known as consolidation. One objective of this schematic-level geotechnical study was to evaluate the magnitude of possible long-term consolidation-related settlements that could occur as a result of the added weight of the planned 2129 Shattuck building.

Page 16 of 29 March 24, 2014 DRAFT
5.02.2 Mat Foundation Settlement We conducted laboratory consolidation tests on samples of natural alluvium obtained from depths of 20, 30 and 40 feet in Boring B-1. Each of the samples consisted predominantly of clay; all three were within the depth interval between the bottom of the planned mat foundation and the top of bedrock. The following table presents a summary of consolidation parameters based on the laboratory test results.
Interpreted Consolidation Parameters
Sample Depth
Sample Elevation
Initial Void
Ratio, e0
Preconsolidation Pressure Pp Recompression
Index Cr Compression
Index Cr Overconsolidation
Ratio OCR (feet) (feet) (psf)
20 +174 1.132 8,000 0.036 0.471 4.05
30 +164 0.706 8,000 0.020 0.183 3.14
40 +154 0.594 9,000 0.013 0.171 2.88
We evaluated consolidation settlement using the geotechnical analysis program Settle 3D. Inputs to the Settle 3D program include the size/shape of the loaded area, the magnitude of the applied loads and the applicable consolidation parameters. In our settlement analyses, we made the following simplifying assumptions:
Level ground conditions with a mat foundation founded 15 feet below the ground surface. Averaged approximate mat foundation stress contours based on column dead plus live load
estimates provided by the Structural Engineer minus the weight of the soil removed for the 11-foot-high basement level.
Long term groundwater levels at the bottom of the mat foundation. Using the loads, parameters, and assumptions outlined, Settle 3D calculates approximately 1½ inches of total consolidation settlement beneath the central core area. At the perimeter of the building where column loads are lighter, there is a net reduction in bearing pressure at foundation depth due to soil unloading effects. In these perimeter areas, Settle 3D calculates no long-term consolidation settlement with some “rebound” at the base of the excavation due to unloading. In our judgment, the amounts of consolidation settlement predicted are not excessive and can be addressed in the structural design of the project. The areal distribution of settlements will depend upon the applied bearing pressures, which will be influenced by the stiffness of the structural mat foundation. If settlement is viewed as a concern, additional geotechnical analyses could be performed during a later phase as the project structural design is being refined. 5.02.3 Consolidation Settlement due to Groundwater Pumping Lowering of the groundwater level can also cause consolidation settlement due to reductions in soil buoyancy. Because consolidation occurs at slow rate, consolidation settlements related to temporary dewatering are often less of a concern than those associated with permanent subsurface drainage. Based on the characteristics of the subsurface materials and the magnitude of permanent groundwater lowering, we anticipate that any future consolidation-related settlements associated with the BAM/PFA underdrainage system are likely to be small. The same observation would generally apply to an underdrainage system associated with the BAM/PFA project.
Page 17 of 29 March 24, 2014 DRAFT
5.03 Design Considerations Relating to Groundwater 5.03.1 Groundwater Levels As noted in Section 4.02.7, in December 2012 groundwater was reportedly measured in offsite Boring GB-2 at a depth of 5 feet below the ground surface (Elevation +187 feet). Based on our local experience, this groundwater depth/elevation measurement is fairly typical for a downtown Berkeley site under natural winter conditions. At the time of our investigation, the BAM/PFA project was being dewatered using a system of wellpoints and groundwater levels in the vicinity were artificially low. In March 2014, groundwater was present at a depth of 19.8 feet (Elevation +174.2 feet) within the piezometer we installed in Boring B-1. We understand that the BAM/PFA project, when completed, will include a permanent subsurface drainage system extending down to the level of the basement subgrade (elevations shown on Figure 2) from which water will be actively pumped. This permanent drainage system is likely to have a significant effect on future groundwater levels in the eastern portion of the 2129 Shattuck site but may have little effect farther to the west depending upon site hydrogeologic characteristics. It is also possible that at some time in the future the system could stop functioning, at which point groundwater would be expected to rise closer to its natural level. In this report, we recommend assuming a maximum (high) groundwater level that is 5 feet below the adjacent street grades for structural design purposes. We recommend assuming a minimum (lowest) natural groundwater surface that is below the level of the mat foundation. This is consistent with our static settlement analysis, in which our vertical load calculations were based on non-buoyant conditions 5.03.2 Basement Design Options Available options for the design of basements that extend below groundwater include: 1) designing basement walls and floor slabs to resist lateral and uplift hydrostatic pressures and waterproofing the structure; or 2) providing a system of retaining wall backdrains and slab/mat underdrains that prevent groundwater from contacting waterproofing (or moisture barriers) installed on the structure’s exterior. Basements designed for hydrostatic pressures mays require deep foundation elements (such as tiedowns) to resist net uplift forces. We understand that uplift-resisting elements are not presently planned, however uplift resistance may be a consideration around the perimeter of the structure where structural loads are light. If a watertight basement is required, it is our opinion that recommendations pertaining to the selection, design and implementation of an appropriate waterproofing system should be provided by an experienced waterproofing consultant retained by the project design team. Hydrostatic forces are generally not a consideration for basements that are fully drained. However, if the structure is not designed for hydrostatic forces, it is critically important that any subsurface drainage systems needed to keep groundwater levels below the bottom of the structure function as intended. For basements that extend below “design” groundwater levels, this requirement obligates current and future property owners to maintain and operate active underdrainage systems in perpetuity to ensure that groundwater does not rise above levels assumed in the project design. 5.04 Soil Expansion Potential Expansive soils shrink and swell with changes in moisture and have the potential to damage improvements unless appropriately mitigated. In local practice, correlations with Plasticity Index (PI) are often used to evaluate expansion potential. For example, “non-expansive fill” is commonly required to have a PI of 15 or less. Expansion potential is mostly a concern for soils that are shallow (i.e. near the ground surface) as deeper soils are typically less affected by seasonal drying.

Page 18 of 29 March 24, 2014 DRAFT
The Atterberg Limits determination we performed performed on a sample of clayey alluvial soil from a depth of about 6 feet in Boring B-1 produced a Plasticity Index (PI) of 33. The geotechnical investigation report for the adjacent BAM/PFA project indicates that Atterberg Limits determinations performed on samples from a depth of 11 to 11.5 feet in Borings GB-1 and GB-3 produced PIs of 30 and 20, respectively. Based on all the available data, we conclude that the near surface soils in and surrounding the site include materials that are moderately to highly expansive. In this report, we recommend that subgrades beneath exterior flatwork be underlain by at least 18 inches of non-expansive material to reduce the potential for damaging expansive soil effects. Expansive soils, where present at subgrade level, will be overexcavated and replaced with non-expansive engineered fill. Expansive soils are not a concern below the basement level as it is significantly deeper than the near-surface zone affected by seasonal wetting and drying. 5.05 Construction Considerations 5.05.1 Shoring, Underpinning and Temporary Excavation Slopes Before excavating for the new basement, the sides of the excavation will need to be supported by temporary shoring to prevent unacceptable movements of adjacent streets, parking lots and structures. Where excavation cuts extend below an imaginary plane projecting downward at 45 degrees (1:1, horizontal to vertical) from existing foundations, the existing foundations should either be underpinned or shoring should be designed to keep construction settlement of the foundations within acceptable limits. In this report, we emphasize that the contractor is responsible for shoring, underpinning, temporary excavation slopes and the protection of adjacent offsite improvement throughout all phases of construction. All excavations deeper than 4 feet that will be entered by workers will need to be shored or sloped for safety in accordance with applicable California Occupational Safety and Health Administration (Cal-OSHA) standards. The depth of the foundations that support the adjacent 5-Story brick building to the north are presently unknown and it does not appear to us that the building has a basement. The contractor should anticipate that this 5-story brick building will need to be underpinned or shored with a rigid shoring system designed to deflect minimally under all applicable loads (including building surcharge loads). As shown schematically on the cross section (Figure 2), the depth of excavation at 2129 Shattuck is close to the level of the adjacent BAM/PFA foundation subgrade. The actual depth of excavation at 2129 Shattuck has not been determined as it depends on architectural, structural and drainage/waterproofing considerations. The contractor should anticipate that shoring or underpinning may be needed adjacent to the BAM/PFA building(s) and that the granular drainage layer below BAM/PFA mat foundation(s) may tend to cave or flow into site excavations unless retained. The contractor should further anticipate that excavation cuts elsewhere may encounter relatively granular soils with little to no clay/silt binder that may tend to cave or flow into excavations. It is the contractor’s responsibility to prevent undermining and ground loss from caving and/or flowing soils throughout the period of excavation and construction. 5.05.2 Dewatering The contractor should expect that excavation for the planned basement will extend below the water table and that the site will need to be dewatered in order to: 1) accomplish the planned excavation; and 2) prepare a suitable undisturbed natural subgrade suitable for mat foundation support. During excavation and mat foundation construction, the groundwater level should be lowered to a depth sufficient to provide an adequate factor of safety against bottom heave and/or blowout. We anticipate that the site will likely need to be dewatered using a system of wellpoints in order to achieve this objective. If the building is designed to have a waterproof basement designed for hydrostatic pressures, groundwater levels must be continuously maintained below the bottom of the excavation until sufficient structural weight is available to resist hydrostatic uplift.

Page 19 of 29 March 24, 2014 DRAFT
The design, permitting, installation, monitoring, and abandonment of site dewatering and discharge systems are the contractor’s responsibility. These responsibilities also include any special regulatory or health and safety requirements that may be associated with the disposal and/or discharge of construction water. We note that significant groundwater inflows were reported at the adjacent BAM/PFA project site and that information/data pertaining to groundwater pumping requirements may be able to be obtained from UC Berkeley for the contractor’s use. 5.05.3 Excavation We anticipate that soils present at the site can be excavated using conventional heavy earth-moving equipment. However, subsurface obstructions may be encountered during excavation related to previous buildings and other onsite improvements. The near-surface materials may contain bricks, wood and debris that would not be suitable for onsite re-use. Subsurface obstructions such as old footings, concentrations of debris, or floor slabs from old basements, pits or vaults may also be present. The contractor should anticipate that the existing fill materials at the site may include subsurface obstructions that would require equipment capable of cutting steel and/or breaking concrete to remove. It is important that the mat subgrade consist of natural undisturbed soil and extreme care should be exercised to avoid subgrade disturbance. Recommendations for mat subgrade trimming are presented in Section 6.02.2. 5.05.4 Monitoring We recommend that the contractor be required to thoroughly document the condition of nearby buildings, streets, storm drains and sewers by video or other means prior to the commencement of site dewatering and excavation. The contractor should also perform regular surveys during excavation and throughout the period of dewatering to monitor and document any observed settlement of nearby streets and structures. 5.05.5 Wet Weather Construction Although it is possible that construction can proceed during or immediately following the wet winter months, a number of geotechnical problems may occur which may increase costs and cause project delays. Rises in groundwater levels, seepage and other factors may increase site dewatering requirements. The water content of on-site soils may also increase during the winter, making it more difficult to achieve the required levels of compaction. If unshored excavations are left open, caving of the trench walls may occur. We suggest that additional budget be set aside for contingencies, should foundation construction be scheduled to occur in winter or early spring to account for these and other factors. 5.05.6 Environmental Considerations Environmental services were not within the scope of this initial geotechnical study. We did not review any information pertaining to potential chemical constituents and/or hazardous substances in the soils and/or groundwater at the site. Environmental constituents, if present in significant concentrations, could affect soil offhaul and disposal costs, groundwater treatment and discharge costs, worker health and safety protocols and other aspects of the envisioned sitework. In our opinion, the project’s best interests could be served by an appropriately-scoped environmental study, if such a study has not already been conducted for the site.
Page 20 of 29 March 24, 2014 DRAFT
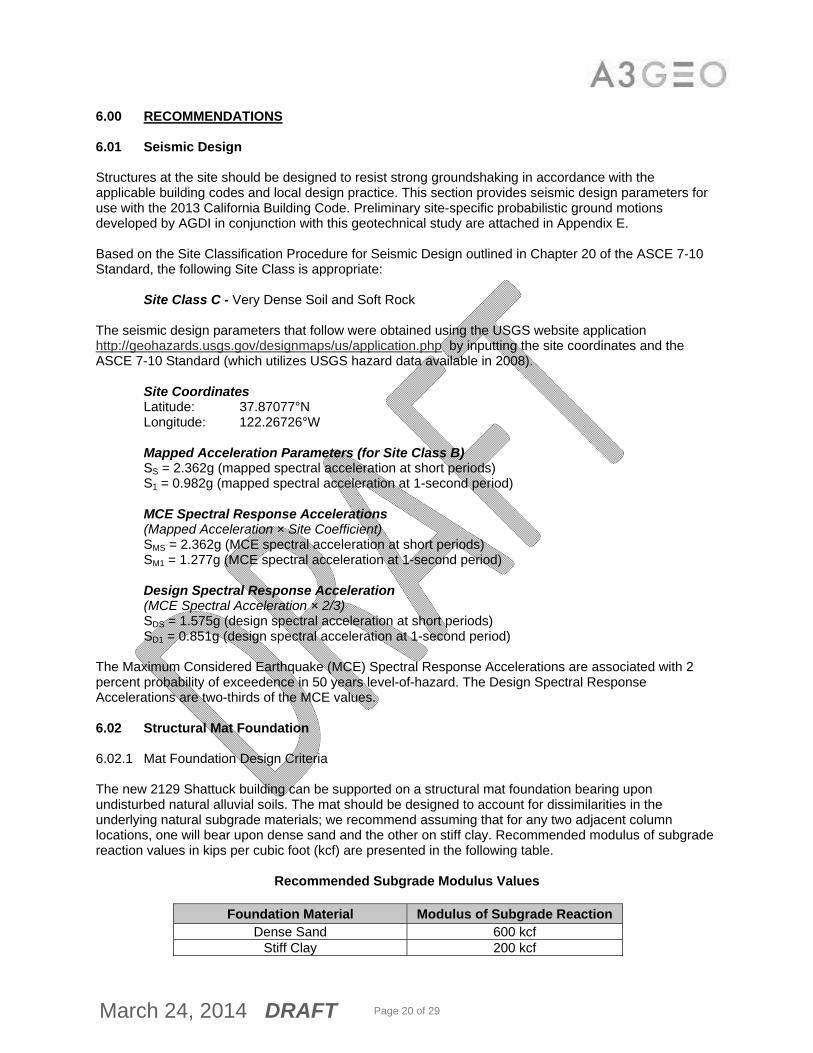
6.00 RECOMMENDATIONS 6.01 Seismic Design Structures at the site should be designed to resist strong groundshaking in accordance with the applicable building codes and local design practice. This section provides seismic design parameters for use with the 2013 California Building Code. Preliminary site-specific probabilistic ground motions developed by AGDI in conjunction with this geotechnical study are attached in Appendix E. Based on the Site Classification Procedure for Seismic Design outlined in Chapter 20 of the ASCE 7-10 Standard, the following Site Class is appropriate:
Site Class C - Very Dense Soil and Soft Rock
The seismic design parameters that follow were obtained using the USGS website application http://geohazards.usgs.gov/designmaps/us/application.php by inputting the site coordinates and the ASCE 7-10 Standard (which utilizes USGS hazard data available in 2008).
Site Coordinates Latitude: 37.87077°N Longitude: 122.26726°W
Mapped Acceleration Parameters (for Site Class B) SS = 2.362g (mapped spectral acceleration at short periods) S1 = 0.982g (mapped spectral acceleration at 1-second period) MCE Spectral Response Accelerations (Mapped Acceleration × Site Coefficient) SMS = 2.362g (MCE spectral acceleration at short periods) SM1 = 1.277g (MCE spectral acceleration at 1-second period) Design Spectral Response Acceleration (MCE Spectral Acceleration × 2/3) SDS = 1.575g (design spectral acceleration at short periods) SD1 = 0.851g (design spectral acceleration at 1-second period)
The Maximum Considered Earthquake (MCE) Spectral Response Accelerations are associated with 2 percent probability of exceedence in 50 years level-of-hazard. The Design Spectral Response Accelerations are two-thirds of the MCE values. 6.02 Structural Mat Foundation 6.02.1 Mat Foundation Design Criteria The new 2129 Shattuck building can be supported on a structural mat foundation bearing upon undisturbed natural alluvial soils. The mat should be designed to account for dissimilarities in the underlying natural subgrade materials; we recommend assuming that for any two adjacent column locations, one will bear upon dense sand and the other on stiff clay. Recommended modulus of subgrade reaction values in kips per cubic foot (kcf) are presented in the following table.
Recommended Subgrade Modulus Values
Foundation Material Modulus of Subgrade Reaction Dense Sand 600 kcf
Stiff Clay 200 kcf

Page 21 of 29 March 24, 2014 DRAFT
The above values are for a one-foot-square plate. When calculating settlement using equivalent spread footings, the above value should be scaled to account for footing size effects. Structural mat foundations designed and constructed in accordance the recommendations presented in this report can be designed using the bearing pressures presented in the following table (DL=Dead Loads; LL=Live Loads; Total=DL+LL+ wind or seismic):
Mat Foundation Bearing Pressures
Load Case Bearing Pressure (psf) Factor of Safety DL Allowable 3000 3.0
DL+LL Allowable 4500 2.0 Total Allowable 6000 1.5
Ultimate 9000 1.0 Resistance to lateral loads can be provided by friction along the base of the mat foundations and by passive pressures developing on the sides of below-grade structural elements. Passive resistance can be evaluated using an equivalent fluid weight of 300 pounds per cubic foot (pcf) up to a maximum value of 3,000 psf. These values can be increased by one-third for dynamic loading. Passive resistance should be applied starting at a depth of one foot, unless the adjacent ground surface is confined by an adjacent pavement or slab (in which case passive resistance can assumed to act starting at the ground surface). A friction coefficient of 0.25 can be used to evaluate frictional resistance along the bottoms of mats that are waterproofed or underlain by a heavy-duty impermeable membrane. The above passive and frictional resistance values include a factor of safety of at least 1.5 and can be fully mobilized with deformations of less than 1/2- and 1/4-inch, respectively. 6.02.2 Hydrostatic Uplift Hydrostatic uplift should be considered in the structural design unless an effective underdrainage system is provided that will continuously and permanently prevent water levels from rising to above the level of the mat foundation. For a fully-watertight basement with no subsurface drainage, we recommend a design groundwater level that is 5 feet below adjacent street grades be used to evaluate hydrostatic uplift pressures. This design groundwater level slopes down towards the west-southwest. 6.02.3 Mat Subgrade Trimming The contractor should exercise extreme care when excavating down to mat subgrade level to avoid disturbing the underlying alluvial soils. At the time of subgrade trimming, groundwater levels at the site should be continuously maintained at least 3 feet below the level of planned excavation. We recommend that the final 18 inches of subgrade excavation be accomplished using an excavator (or similar equipment) equipped with a smooth non-toothed bucket. Construction equipment (backhoes, excavators, etc.) should not be allowed to operate directly upon the trimmed subgrade to avoid disturbing the exposed natural bearing soils. The trimmed subgrade should be maintained in a moist condition until it is covered by a mud mat to prevent drying and disturbance. 6.02.4 Mat Underdrainage An underdrainage layer should be installed below the mat unless the below-grade portion of the building is waterproofed and designed for hydrostatic pressures. The underdrainage system should include a continuous layer of compacted Caltrans Class 2 Permeable Material and a system of 4-inch minimum-diameter SDR 35 or Schedule 40 PVC perforated pipes. The continuous layer of permeable material below the mat should be at least 8 inches thick. The perforated pipes should be spaced no more than 15 feet apart, include a perimeter perforated pipe within 5 feet of the building perimeter, and connect to non-perforated collector pipes that drain by gravity to an appropriate discharge or to sumps containing

Page 22 of 29 March 24, 2014 DRAFT
submersible pumps. Perforated pipes should be placed, perforations down, on a 2-inch-thick layer of permeable material making sure that the pipes are fully supported. The remainder of the continuous permeable material layer should be placed around and above the pipes to mat subgrade level. The underdrainage layer should be uniformly compacted using a vibrating baseplate compactor and care should be exercised not to damage the system of drainage pipes. 6.02.5 Waterproofing and Moisture Retarder We recommend that mat foundation waterproofing be designed, detailed and specified by the project Architect, Structural Engineer or an experienced waterproofing consultant retained by the project design team. A moisture retarder should only be used in conjunction with a complete mat underdrainage drainage system that can effectively, reliably and permanently prevent groundwater from rising to the level of the base of the mat. A moisture retarder should include a heavy-duty impermeable membrane (Stego® wrap 15-mil or an approved equivalent) installed and taped in accordance with the manufacturer’s recommendations. In all cases, specifications for the mat should require that moisture emission tests be performed prior to the installation of flooring. No flooring should be installed until safe moisture emission levels are recorded for the type of flooring to be used. 6.03 Basement Retaining Walls 6.03.1 Design Lateral Pressures This section presents lateral earth pressures for the design of permanent basement retaining walls. The recommended static earth pressure distribution is based on at-rest earth pressures, which are appropriate for walls that not free to rotate to a degree that would allow active earth pressures to be used. The recommended seismic earth pressure distribution is based on active earth pressures plus a dynamic increment that increases linearly with depth. For both the static and seismic cases, the recommended earth pressure distribution is triangular with a resultant force acting at a height of H/3 above the base of the wall (where H is the total height of retained earth). Based on simplified analyses (e.g. Sitar, et al.), it can be assumed that the active plus seismic lateral pressures will not exceed the static at-rest pressure distributions (seismic lateral pressure above groundwater is approximately equivalent to an active earth pressure of 40 pcf plus a 30 pcf dynamic increment). Lateral pressures for basement wall design are presented in the following table.
Lateral Earth Pressures for Basement Retaining Walls
Loading Condition Design Lateral Pressure
Distribution Above groundwater 70 pcf, triangular Below groundwater 95 pcf, triangular pcf = pounds per cubic foot
We recommend a uniform lateral pressure of 100 psf be applied over the top 10 feet of walls where it is physically possible for vehicles (such as fire trucks) to be present behind the top of the wall. We recommend that large and/or concentrated surcharge loads be evaluated on a case-by-case basis; the contractor should be responsible for evaluating and protecting basement walls from all construction-related surcharge loadings. The recommended lateral pressure distributions presented in this section are unfactored and should be viewed as reasonable approximates of actual lateral pressures under the specified loading conditions. 6.04.2 Retaining Wall Backdrainage Walls that are not designed for hydrostatic pressure should be fully drained. Backdrainage should be provided to within approximately 2 feet of the top of the retained soil using one of the following:

Page 23 of 29 March 24, 2014 DRAFT
Prefabricated drainage material or drainage mat (Miradrain or an approved alternative); or A drain rock layer at least 12 inches in horizontal thickness.
The upper 2 feet of retained soil behind the wall should be backfilled with low permeability soil to limit surface water infiltration into the wall backdrainage system. The ground surface behind the wall should be sloped to drain away from the top of the wall towards a suitable gravity discharge. Prefabricated drainage material should be in direct contact with the retained soil/rock materials behind the wall and should be designed to drain into a perforated plastic pipe or other approved prefabricated drainage conduit. If prefabricated drainage material is used, the elements comprising the wall backdrainage system should be specified and detailed in accordance with the manufacturer’s recommendations. Drainage material should have sufficient crushing strength to support the expected lateral earth pressures. Drain rock should conform to Caltrans specifications for Class 2 Permeable Material. Alternatively, locally available, clean, ½- to ¾-inch maximum size, open-graded rock could be used, provided it is encapsulated in a non-woven geotextile filter fabric (such as Mirafi 140N or an approved alternative). The Caltrans Class 2 Permeable Material or geotextile-encapsulated open-graded rock should be in direct contact with the retained soil/rock materials behind the wall. Drain rock should drain into a perforated plastic pipe installed (with perforations down) on a 2-inch-thick bed of drain rock. The upslope end of the perforated drain pipe should be extended to near the ground surface with a non-perforated pipe that serves as a cleanout. The pipe/cleanout should be in an accessible location, capped and fitted with an enclosure (Christy box or similar), where appropriate. Water from the backdrainage system should be conveyed in non-perforated collector pipes by gravity to a suitable discharge facility. Perforated and non-perforated plastic pipe used in the drainage system should consist of 4-inch-diameter or larger SDR 35 or Schedule 40 PVC. A moisture barrier or waterproofing should be applied to the exterior of retaining walls in all areas where seepage or moisture transmission through the walls would be considered objectionable. The architect, structural engineer or another qualified design team consultant should specify and detail wall moisture barriers and/or waterproofing and observation during their installation. 6.05 Earthwork 6.05.1 Fill Materials General fill can be used as engineered fill, except where non-expansive material is specifically required. The upper 12 inches of material underlying any Asphalt Concrete (AC) and Aggregate Base (AB) pavement sections should consist of non-expansive material. The upper 18 inches of soil beneath concrete slabs that are cast on-grade should also consist of non-expansive material. The granular layer beneath concrete slabs that are cast on-grade can be counted toward the required 18 inches of non-expansive material. Fill materials should conform to the requirements presented below:
General Fill - General fill material should have an organic content of less than 3 percent by volume and should not contain rocks or lumps larger than 6 inches in greatest dimension. Non-Expansive Fill - Non-expansive fill material should:
Be free of 6-inch plus material with no more than 15 percent of material larger than 2.5 inches;
Be free of organic material, debris and environmental contaminants; Have a Plasticity Index of 12 or less; and Have a Liquid Limit of 40 or less.
All proposed fill materials should be approved by A3GEO prior to their use. Some of the materials cleared
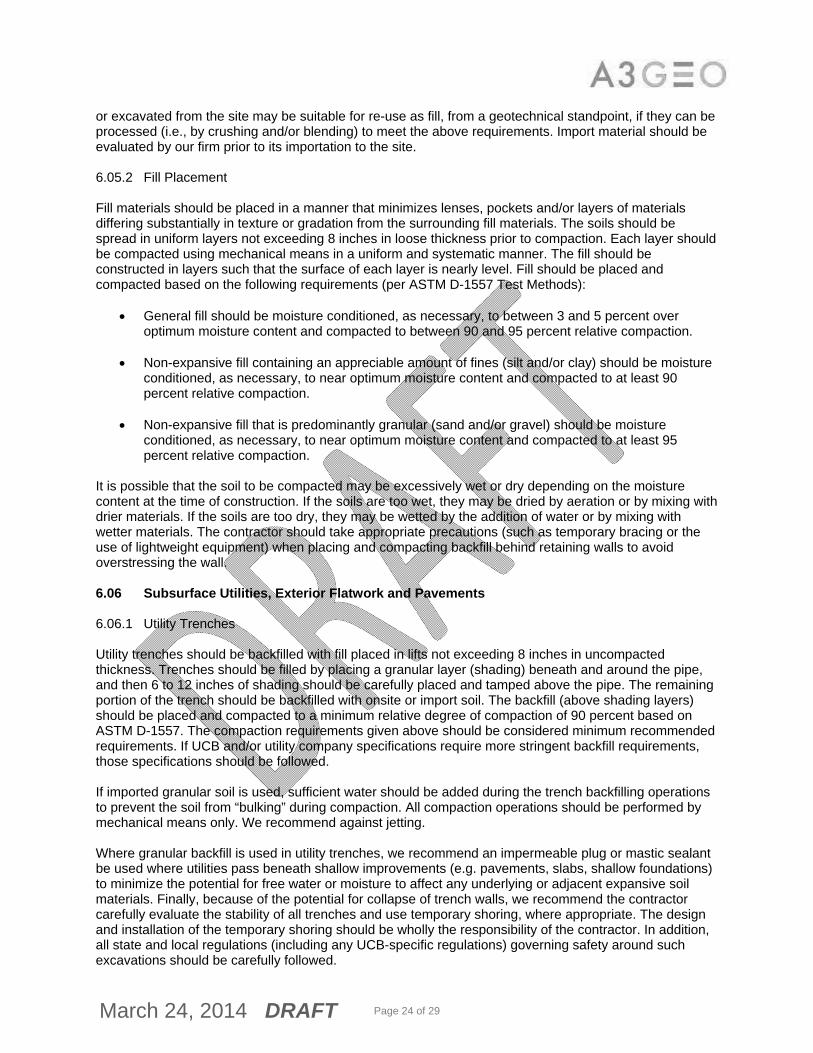
Page 24 of 29 March 24, 2014 DRAFT
or excavated from the site may be suitable for re-use as fill, from a geotechnical standpoint, if they can be processed (i.e., by crushing and/or blending) to meet the above requirements. Import material should be evaluated by our firm prior to its importation to the site. 6.05.2 Fill Placement Fill materials should be placed in a manner that minimizes lenses, pockets and/or layers of materials differing substantially in texture or gradation from the surrounding fill materials. The soils should be spread in uniform layers not exceeding 8 inches in loose thickness prior to compaction. Each layer should be compacted using mechanical means in a uniform and systematic manner. The fill should be constructed in layers such that the surface of each layer is nearly level. Fill should be placed and compacted based on the following requirements (per ASTM D-1557 Test Methods):
General fill should be moisture conditioned, as necessary, to between 3 and 5 percent over optimum moisture content and compacted to between 90 and 95 percent relative compaction.
Non-expansive fill containing an appreciable amount of fines (silt and/or clay) should be moisture conditioned, as necessary, to near optimum moisture content and compacted to at least 90 percent relative compaction.
Non-expansive fill that is predominantly granular (sand and/or gravel) should be moisture
conditioned, as necessary, to near optimum moisture content and compacted to at least 95 percent relative compaction.
It is possible that the soil to be compacted may be excessively wet or dry depending on the moisture content at the time of construction. If the soils are too wet, they may be dried by aeration or by mixing with drier materials. If the soils are too dry, they may be wetted by the addition of water or by mixing with wetter materials. The contractor should take appropriate precautions (such as temporary bracing or the use of lightweight equipment) when placing and compacting backfill behind retaining walls to avoid overstressing the wall. 6.06 Subsurface Utilities, Exterior Flatwork and Pavements 6.06.1 Utility Trenches Utility trenches should be backfilled with fill placed in lifts not exceeding 8 inches in uncompacted thickness. Trenches should be filled by placing a granular layer (shading) beneath and around the pipe, and then 6 to 12 inches of shading should be carefully placed and tamped above the pipe. The remaining portion of the trench should be backfilled with onsite or import soil. The backfill (above shading layers) should be placed and compacted to a minimum relative degree of compaction of 90 percent based on ASTM D-1557. The compaction requirements given above should be considered minimum recommended requirements. If UCB and/or utility company specifications require more stringent backfill requirements, those specifications should be followed. If imported granular soil is used, sufficient water should be added during the trench backfilling operations to prevent the soil from “bulking” during compaction. All compaction operations should be performed by mechanical means only. We recommend against jetting. Where granular backfill is used in utility trenches, we recommend an impermeable plug or mastic sealant be used where utilities pass beneath shallow improvements (e.g. pavements, slabs, shallow foundations) to minimize the potential for free water or moisture to affect any underlying or adjacent expansive soil materials. Finally, because of the potential for collapse of trench walls, we recommend the contractor carefully evaluate the stability of all trenches and use temporary shoring, where appropriate. The design and installation of the temporary shoring should be wholly the responsibility of the contractor. In addition, all state and local regulations (including any UCB-specific regulations) governing safety around such excavations should be carefully followed.
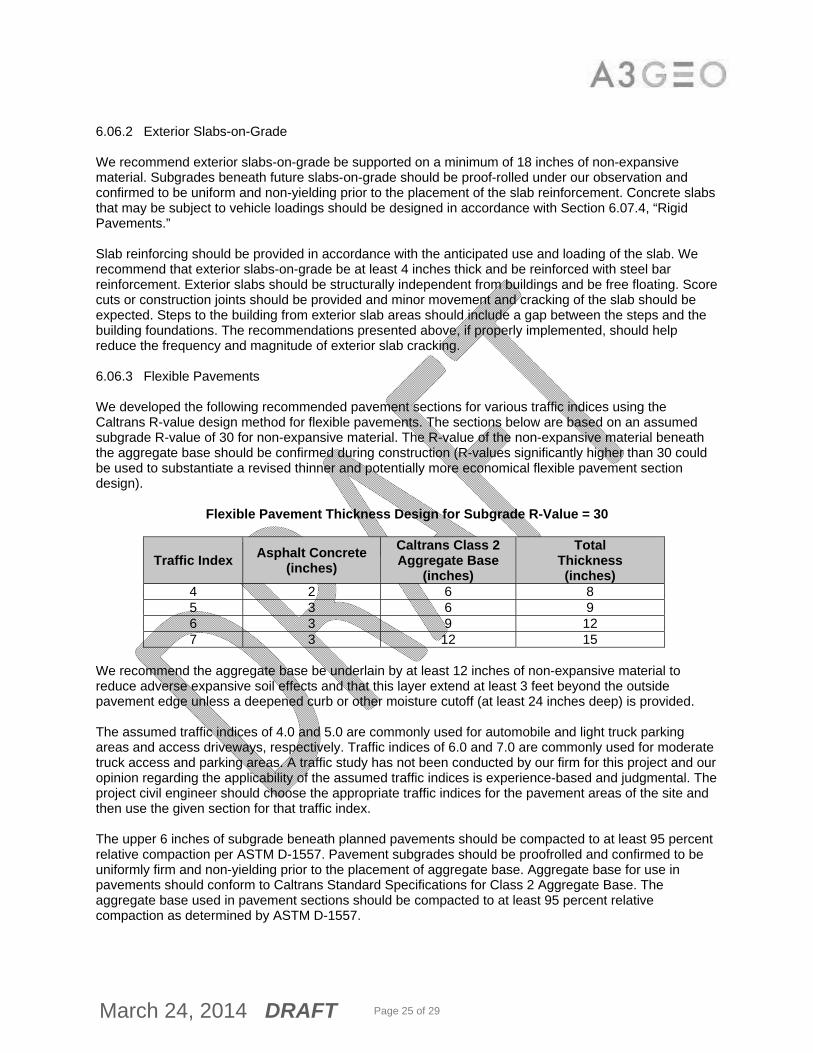
Page 25 of 29 March 24, 2014 DRAFT
6.06.2 Exterior Slabs-on-Grade We recommend exterior slabs-on-grade be supported on a minimum of 18 inches of non-expansive material. Subgrades beneath future slabs-on-grade should be proof-rolled under our observation and confirmed to be uniform and non-yielding prior to the placement of the slab reinforcement. Concrete slabs that may be subject to vehicle loadings should be designed in accordance with Section 6.07.4, “Rigid Pavements.” Slab reinforcing should be provided in accordance with the anticipated use and loading of the slab. We recommend that exterior slabs-on-grade be at least 4 inches thick and be reinforced with steel bar reinforcement. Exterior slabs should be structurally independent from buildings and be free floating. Score cuts or construction joints should be provided and minor movement and cracking of the slab should be expected. Steps to the building from exterior slab areas should include a gap between the steps and the building foundations. The recommendations presented above, if properly implemented, should help reduce the frequency and magnitude of exterior slab cracking. 6.06.3 Flexible Pavements We developed the following recommended pavement sections for various traffic indices using the Caltrans R-value design method for flexible pavements. The sections below are based on an assumed subgrade R-value of 30 for non-expansive material. The R-value of the non-expansive material beneath the aggregate base should be confirmed during construction (R-values significantly higher than 30 could be used to substantiate a revised thinner and potentially more economical flexible pavement section design).
Flexible Pavement Thickness Design for Subgrade R-Value = 30
Traffic Index Asphalt Concrete
(inches)
Caltrans Class 2 Aggregate Base
(inches)
Total Thickness (inches)
4 2 6 8 5 3 6 9 6 3 9 12 7 3 12 15
We recommend the aggregate base be underlain by at least 12 inches of non-expansive material to reduce adverse expansive soil effects and that this layer extend at least 3 feet beyond the outside pavement edge unless a deepened curb or other moisture cutoff (at least 24 inches deep) is provided. The assumed traffic indices of 4.0 and 5.0 are commonly used for automobile and light truck parking areas and access driveways, respectively. Traffic indices of 6.0 and 7.0 are commonly used for moderate truck access and parking areas. A traffic study has not been conducted by our firm for this project and our opinion regarding the applicability of the assumed traffic indices is experience-based and judgmental. The project civil engineer should choose the appropriate traffic indices for the pavement areas of the site and then use the given section for that traffic index. The upper 6 inches of subgrade beneath planned pavements should be compacted to at least 95 percent relative compaction per ASTM D-1557. Pavement subgrades should be proofrolled and confirmed to be uniformly firm and non-yielding prior to the placement of aggregate base. Aggregate base for use in pavements should conform to Caltrans Standard Specifications for Class 2 Aggregate Base. The aggregate base used in pavement sections should be compacted to at least 95 percent relative compaction as determined by ASTM D-1557.

Page 26 of 29 March 24, 2014 DRAFT
6.06.4 Rigid Pavements Rigid Portland cement concrete (PCC) pavements may also be used in driveway/loading areas. This section provides recommendations for Caltrans jointed plain concrete pavement (JPCP), which is engineered with longitudinal and transverse joints to control where cracking occurs. JPCPs do not contain steel reinforcement, other than tie bars and dowel bars. The project civil engineer should design and detail the JPCP pavement per Caltrans specifications. We developed the following pavement thickness design using the Caltrans R-value design method for rigid pavements and an assumed traffic index. The section below is for subgrade soils with an R-value between 10 and 40. The R-value of the non-expansive material beneath the aggregate base should be confirmed during construction (R-values significantly higher than 40 could be used to substantiate a revised thinner and potentially more economical rigid pavement section design).
Portland Cement Concrete Pavement Thickness Design
Traffic Index Portland Cement
Concrete (inches)
Caltrans Class 2 Aggregate Base
(inches)
Total Thickness (inches)
< 9 9 12 21 In addition, we recommend the aggregate base be underlain by at least 12 inches non-expansive material to reduce adverse expansive soil effects. The non-expansive material should extend at least 3 feet beyond the outside pavement edge unless a deepened curb or other moisture cutoff (at least 24 inches deep) is provided. The upper 6 inches of subgrade beneath planned pavements should be compacted to at least 95 percent relative compaction per ASTM D-1557. Pavement subgrades should be proofrolled and confirmed to be uniformly firm and non-yielding prior to the placement of aggregate base. Aggregate base for use in pavements should conform to Caltrans Standard Specifications for Class 2 Aggregate Base. The aggregate base used in pavement sections should be compacted to at least 95 percent relative compaction as determined by ASTM D-1557. 6.07 Future Geotechnical Services 6.07.1 Design Consultation and Plan Reviews We recommend that we provide geotechnical consultation to the project team during the design phase in order to: (1) check that the design recommendations presented in this report are appropriately incorporated into the project plans and specifications; and (2) provide supplemental geotechnical recommendations, as needed. We recommend that we review the project plans and specifications as they are being developed so that we may provide timely input. We should also perform a general review of the geotechnical aspects of the final plans and specifications, the results of which we should document in a formal plan review letter. 6.08.2 Review of Contractor Requests and Submittals During the bidding and construction phases, we should review all Requests for Clarification (RFCs) and Requests for Information (RFIs) that are geotechnical in nature. We recommend that we also review all geotechnical submittals from the contractor, including (but not necessarily limited to) those pertaining to shoring, dewatering, excavation/grading and geotechnical materials. 6.08.3 Construction Observation and Testing The analyses and recommendations submitted in this report are based in part upon interpretations and data obtained from our test boring and offsite borings by others. These interpretations and data pertain to

Page 27 of 29 March 24, 2014 DRAFT
specific locations at specific times; the nature and extent of any subsurface variations present may therefore not become evident until construction. If variations then become apparent, it will be necessary to re-examine the recommendations of this report. It is critical that we be retained to provide geotechnical engineering services during the construction phases of the work in order to observe compliance with the design concepts, specifications, and recommendations and to allow design changes in the event that subsurface conditions differ from those anticipated prior to the start of construction. The scope of our construction-phase observation and testing services should include (but not necessarily be limited to) site preparation, shoring installation, mass excavation, footing excavations, fill placement and compaction, retaining wall construction, pavement and slab-on-grade subgrade preparation, placement and compaction of aggregate base, and utility installations.

Page 28 of 29 March 24, 2014 DRAFT
7.00 LIMITATIONS This draft report has been prepared for the exclusive use of Center Street Partners, LLC and their consultants for specific application to the proposed 2129 Shattuck project in accordance with generally accepted soil and foundation engineering practices. No other warranty, expressed or implied, is made. This draft report was prepared in parallel with concurrent schematic-level project studies the design team. The primary purpose of this draft report was to provide preliminary information for schematic design and cost estimating purposes. At the time of this report, foundation depths, layouts, loads and performance objectives were not known. As currently envisioned, this draft report would be finalized once more information about the project becomes available. Accordingly, this draft report is not intended to be used for final design. The findings of this report are valid as of the present date. However, the passing of time will likely change the conditions of the existing property due to natural processes or the works of man. In addition, due to legislation or the broadening of knowledge, changes in applicable or appropriate standards may occur. Accordingly, the findings of this report may be invalidated, wholly or partly, by changes beyond our control. Therefore, this report should not be relied upon after a period of three years without being reviewed by this office.

Page 29 of 29 March 24, 2014 DRAFT
8.00 REFERENCES AMEC, 2013, “ Geotechnical Investigation, Berkeley Art Museum and Pacific Film Archive, University of California at Berkeley, California, Project 13297.000,” consulting report dated March 26, 2013. American Society of Civil Engineers (ASCE), 2010, “Minimum Design Loads for Buildings and Other Structures,” ASCE Standard, ASCE/SEI 7-10. Bakun, W.H., 1999, “Seismic Activity of San Francisco Bay region” Bulletin of the Seismological Society of America (June 1999), 89(3), p 764-784. California Division of Mines and Geology, “1982, Special Studies Zone Map, Oakland West Quadrangle.” California Division of Mines and Geology, 1998, "Maps of Known Active Fault Near-Source Zones in California and Adjacent Portions of Nevada," published by International Conference of Building Officials (ICBO), February 1998. California Geological Survey, 2003, “Seismic Hazard Zone Report of the Oakland West 7.5-Minute Quadrangle, Alameda County, California,” Seismic Hazards Zone Report 081. Graymer, R.W., Moring, B.C., Saucedo, G.J., Wentworth, C.M., Brabb, E.E., and Knudsen, K.L., 2006, “Geologic Map of the San Francisco Bay Region,” U.S. Geological Survey Scientific Investigations Map 2918. Graymer, R.W., 2000, “Geologic Map and Map Database of the Oakland Metropolitan Area, Alameda, Contra Costa and San Francisco Counties, California,” U.S. Geological Survey, Miscellaneous Field Studies MF-2342. Jennings, Charles W., and Bryant, William A., 2010, “Fault Activity Map of California,” California Geological Survey, Geologic Data Map No. 6. Knudsen, Keith L., Sowers, Janet M., Witter, Robert C., Wentworth, Carl M., and Helley, Edward J., 2000, “Description of Quaternary Deposits and Liquefaction Susceptibility, Nine-County San Francisco Bay Region, California,” U.S. Geological Survey, Part 3 of Open File Report 00-444. Lienkaemper, J.J., 1992, “Map of Recently Active Traces of the Hayward Fault, Alameda and Contra Costa Counties, California,” United States Geological Survey, Map MF-2196. Radbruch, Dorothy H., 1957, “Areal and Engineering Geology of the Oakland West Quadrangle,” U.S. Geological Survey, Miscellaneous Geologic Investigations, Map I-239. Seed, R.B., Dickenson, S.E., Riemer, M.F., Bray, J.D., Sitar, N., Mitchell, J.K., Idriss, I.M., Kayen, R.E., Kropp, A., Harder, L.F., Jr., and Power, M.S., 1990, “Preliminary Report on the Principal Geotechnical Aspects of the October 17, 1989, Loma Prieta Earthquake,” Earthquake Engineering Research Center, Report EERC 90-05. Sitar, N., Mikola, R., and Candia, G. (2012), “Seismically Induced Lateral Earth Pressures on Retaining Structures and Basement Walls,” Geotechnical Engineering State of the Art and Practice: pp. 335-358. Sowers, Janet M., 1993, “Creek & Watershed Map of Oakland & Berkeley,” Oakland Museum of California, Revised 1995. Thompson & West, 1878, “Official Historical Atlas of Alameda County, California.” U.S. Geological Survey, 1959, Topographic Map of the Oakland West Quadrangle. Photorevised 1968, 1973 and 1980. Working Group on California Earthquake Probabilities (WGCEP), 2008, “The Uniform California Earthquake Rupture Forecast, Version 2 (UCERF 2): for 2007–2036”: USGS Open-File Report 2007-1437; CGS Special Report 203 and; SCEC Contribution #1138. Working Group on California Earthquake Probabilities (WG03), 2003, “Earthquake Probabilities in the San Francisco Bay Region: 2002 to 2031,” U.S. Geological Survey, Open File Report 03-214. Youd, T.L. and Hoose, S.N., 1978, “Historic Ground Failures in Northern California Triggered by Earthquakes,” U.S. Geological Survey, Professional Paper 993.

Plates
2129 SHATTUCK PROJECT BERKELEY, CALIFORNIA

2129 SHATTUCK PROJECT BERKELEY, CALIFORNIA
Plate 1 Vicinity Map
SITE COORDINATES 37.87077° Latitude
-122.26726° Longitude
San Francisco Bay
APPROXIMATE SCALE
0 1 mile 2 miles
Source: Yahoo Maps

AERIAL PHOTOGRAPH: Google Earth (Imagery date: 08/28/2012)
2129 SHATTUCK PROJECT BERKELEY, CALIFORNIA
Plate 2 Site Photographs

SOURCE: Graymer, et al, 2006
Plate 3 Regional Geology Map
SITE
2129 SHATTUCK PROJECT BERKELEY, CALIFORNIA

Plate 4 CGS Fault Activity Map
SITE
San Andreas
San Gregorio
Calaveras
Green Valley - Concord
Greenville
Rodgers Creek
Hayward
SOURCE: http://www.quake.ca.gov/gmaps/FAM/faultactivitymap.html Jennings and Bryant, 2010
2129 SHATTUCK PROJECT BERKELEY, CALIFORNIA

SOURCE: Graymer, 2000 , USGS MF-2342
Site
LOCAL MAP UNITS
Plate 5 USGS Regional Geologic Map
2129 SHATTUCK PROJECT BERKELEY, CALIFORNIA

Site
Plate 6 Berkeley Constraints Map
2129 SHATTUCK PROJECT BERKELEY, CALIFORNIA

Site
Plate 7 1878 Thompson & West Map
2129 SHATTUCK PROJECT BERKELEY, CALIFORNIA

Site
2129 SHATTUCK PROJECT BERKELEY, CALIFORNIA
Plate 8 1897 Campus Map

Site
Plate 9 Berkeley Creek Map
2129 SHATTUCK PROJECT BERKELEY, CALIFORNIA
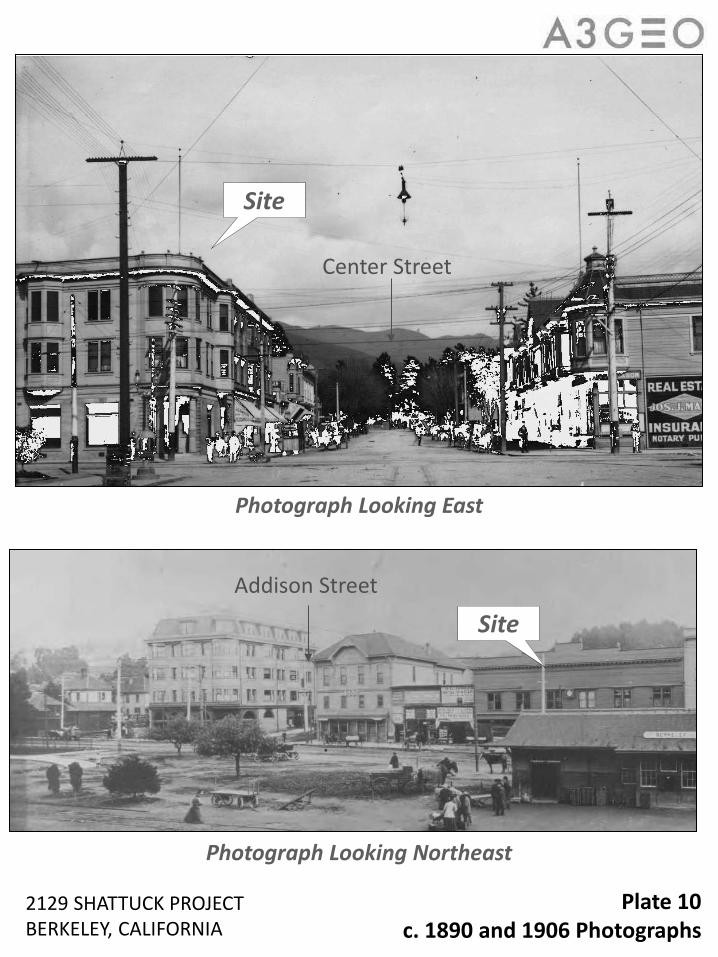
Plate 10 c. 1890 and 1906 Photographs
2129 SHATTUCK PROJECT BERKELEY, CALIFORNIA
Site
Site
Addison Street
Center Street
Photograph Looking East
Photograph Looking Northeast

2129 SHATTUCK PROJECT BERKELEY, CALIFORNIA
Site
Photograph Looking Northeast
Plate 11 1923 Photograph
Addison Street
F. D. CHASE BUILDING

c. 1908
c. 1918
1971
1940’s
2129 SHATTUCK PROJECT BERKELEY, CALIFORNIA
Plate 12 c. 1908 to 1971 Photographs
Photographs Looking Northeast

2129 SHATTUCK PROJECT BERKELEY, CALIFORNIA
Site
Plate 13 2014 Photograph - BAM/PFA Excavation
Photograph Looking West
SOIL NAIL WALL

Figures
2129 SHATTUCK PROJECT BERKELEY, CALIFORNIA

NORTH
A:\A
3G
EO
P
rojects\1114 - T
ipping M
ar\1114-5A
2129 S
hattuck\A
3G
EO
F
igures\1114-5A
F
igure 1 - S
ite P
lan.dw
g3/24/2014 10:35 A
M

A:\A
3G
EO
P
rojects\1114 - T
ipping M
ar\1114-5A
2129 S
hattuck\A
3G
EO
F
igures\1114-5A
C
rosssS
ections.dw
g3/24/2014 12:09 P
M
Appendix A
Log of Boring B-1
2129 SHATTUCK PROJECT BERKELEY, CALIFORNIA

MC
MC
MC
SH
SPT
MC
114
96
14
19
28
41
21
9
23
14
11
Asphalt Pavement (5")POORLY GRADED SAND (SP) - Reddish brown, with subroundedfine to coarse gravel, loose, moist. (Fill)
Concrete Rubble (Fill)FAT CLAY (CH) - Brown, very stiff, with silt, moist. (Alluvium)
LEAN SANDY CLAY (CL) - Dark yellowish brown, stiff, some silt,fine sand, trace coarse sand and fine gravel, wet. (Alluvium)
- At 11.5 ft: Saturated.
CLAYEY SAND WITH GRAVEL (SC) - Brown, dense, with fine tocoarse gravel, wet. (Alluvium)
LEAN CLAY (CL) - Reddish brown, stiff, trace of fine sand, withsilt, wet. (Alluvium)
FAT CLAY WITH SAND (CH) - Brown, stiff, some fine sand, withsilt, wet. (Alluvium)
- At 28 ft: Reddish-brown, fine to coarse sand, moderate to highplasticity, wet.
14
19
28
41
14
19
28
41
PI = 33,LL = 57,Fines: 78%
PI = 13,LL = 35,Fines: 51%
Gravel: 20%,Sand: 41%,Fines: 39%
TX/UU, c = 1569 PSF
77%
100%
67%
80%
100%
67%
(Continued Next Page)
SA
MP
LE
TY
PE
NU
MB
ER
GR
AP
HIC
LO
G
PO
CK
ET
PE
N.
(tsf
)
DR
Y U
NIT
WT
.(p
cf)
MO
IST
UR
EC
ON
TE
NT
(%
)
AD
JUS
TE
DB
LO
WC
OU
NT
S(N
VA
LU
E)
DE
PT
H(f
t)
0
5
10
15
20
25
30
MATERIAL DESCRIPTION
MO
IST
UR
EC
ON
TE
NT
(%
)M
OIS
TU
RE
CO
NT
EN
T (
%)
OTHER LABTESTS / NOTES
% R
EC
OV
ER
ED
PAGE 1 OF 4BORING NUMBER B-1
NOTES
GROUND ELEVATION
LOGGED BY TOB
DRILLING METHOD Rotary Wash Drilling
HOLE SIZE 6-inches
DRILLING CONTRACTOR Pitcher Drilling Co. GROUND WATER LEVELS:
CHECKED BY DKM
DATE STARTED 2/5/14 COMPLETED 2/6/14
AT TIME OF DRILLING 12.40 ft
AT END OF DRILLING ---
AFTER DRILLING ---
PROJECT NAME 2129 Shattuck Ave
PROJECT LOCATION 2129 Shattuck Ave, Berkeley, CA
CLIENT Center Street Partners, LLC
PROJECT NUMBER 1114-5A
GE
OT
EC
H B
H C
OLU
MN
TE
RM
NO
TE
LE
FT
ALI
GN
ED
- A
3GE
O D
AT
A T
EM
PLA
TE
.GD
T -
3/2
4/14
12:
20 -
A:\
A3G
EO
PR
OJE
CT
S\1
114
- T
IPP
ING
MA
R\1
114-
5A 2
129
SH
AT
TU
CK
\BO
RIN
G L
OG
S\B
OR
ING
LO
GS
.GP
JA3GEo, Inc.1331 Seventh Street, Unit EBerkeley, CA 94710Telephone: 1 (510) 705-1664Fax: 1 (510) 373-1508

SH
MC
SH
MC
SPT
23
20
21
27
SANDY LEAN CLAY (CL) - Brown, stiff, fine to coarse gravel, withsilt, wet. (Alluvium)
CLAYEY SAND (SC) - Brown with reddish-brown mottling,subrounded fine to coarse sand, 30% moderately plastic fines,medium dense, wet. (Alluvium)
SANDY LEAN CLAY (CL) - Yellowish-brown, very stiff, fine tocoarse sands, some fine to coarse gravel, wet. (Alluvium)
SANDY LEAN CLAY (CL) - Mottled Yellowish brown, brown, andreddish brown, trace subangular to subrounded gravel consistingof sandstone, fine sand, wet. (Alluvium)
- At 48 ft: Gray, with sand.
SHALE - Dark gray, little to moderately weathered, friable to weak,low hardness, intensely fractured, pervasively sheared, withclay-filled fractures. (Bedrock)
23
20
23
20
TX/UU, c = 1828 PSF
TX/UU, c = 2063 PSF
65%
100%
79%
67%
83%
(Continued Next Page)
SA
MP
LE
TY
PE
NU
MB
ER
GR
AP
HIC
LO
G
PO
CK
ET
PE
N.
(tsf
)
DR
Y U
NIT
WT
.(p
cf)
MO
IST
UR
EC
ON
TE
NT
(%
)
AD
JUS
TE
DB
LO
WC
OU
NT
S(N
VA
LU
E)
DE
PT
H(f
t)
30
35
40
45
50
55
60
MATERIAL DESCRIPTION
MO
IST
UR
EC
ON
TE
NT
(%
)M
OIS
TU
RE
CO
NT
EN
T (
%)
OTHER LABTESTS / NOTES
% R
EC
OV
ER
ED
PAGE 2 OF 4BORING NUMBER B-1
NOTES
GROUND ELEVATION
LOGGED BY TOB
DRILLING METHOD Rotary Wash Drilling
HOLE SIZE 6-inches
DRILLING CONTRACTOR Pitcher Drilling Co. GROUND WATER LEVELS:
CHECKED BY DKM
DATE STARTED 2/5/14 COMPLETED 2/6/14
AT TIME OF DRILLING 12.40 ft
AT END OF DRILLING ---
AFTER DRILLING ---
PROJECT NAME 2129 Shattuck Ave
PROJECT LOCATION 2129 Shattuck Ave, Berkeley, CA
CLIENT Center Street Partners, LLC
PROJECT NUMBER 1114-5A
GE
OT
EC
H B
H C
OLU
MN
TE
RM
NO
TE
LE
FT
ALI
GN
ED
- A
3GE
O D
AT
A T
EM
PLA
TE
.GD
T -
3/2
4/14
12:
20 -
A:\
A3G
EO
PR
OJE
CT
S\1
114
- T
IPP
ING
MA
R\1
114-
5A 2
129
SH
AT
TU
CK
\BO
RIN
G L
OG
S\B
OR
ING
LO
GS
.GP
JA3GEo, Inc.1331 Seventh Street, Unit EBerkeley, CA 94710Telephone: 1 (510) 705-1664Fax: 1 (510) 373-1508

SPT
SPT
SPT
SHALE - Dark gray, little to moderately weathered, friable to weak,low hardness, intensely fractured, pervasively sheared, withclay-filled fractures. (Bedrock)(continued)
100%
100%
75%
(Continued Next Page)
SA
MP
LE
TY
PE
NU
MB
ER
GR
AP
HIC
LO
G
PO
CK
ET
PE
N.
(tsf
)
DR
Y U
NIT
WT
.(p
cf)
MO
IST
UR
EC
ON
TE
NT
(%
)
AD
JUS
TE
DB
LO
WC
OU
NT
S(N
VA
LU
E)
DE
PT
H(f
t)
60
65
70
75
80
85
90
MATERIAL DESCRIPTION
MO
IST
UR
EC
ON
TE
NT
(%
)M
OIS
TU
RE
CO
NT
EN
T (
%)
OTHER LABTESTS / NOTES
% R
EC
OV
ER
ED
PAGE 3 OF 4BORING NUMBER B-1
NOTES
GROUND ELEVATION
LOGGED BY TOB
DRILLING METHOD Rotary Wash Drilling
HOLE SIZE 6-inches
DRILLING CONTRACTOR Pitcher Drilling Co. GROUND WATER LEVELS:
CHECKED BY DKM
DATE STARTED 2/5/14 COMPLETED 2/6/14
AT TIME OF DRILLING 12.40 ft
AT END OF DRILLING ---
AFTER DRILLING ---
PROJECT NAME 2129 Shattuck Ave
PROJECT LOCATION 2129 Shattuck Ave, Berkeley, CA
CLIENT Center Street Partners, LLC
PROJECT NUMBER 1114-5A
GE
OT
EC
H B
H C
OLU
MN
TE
RM
NO
TE
LE
FT
ALI
GN
ED
- A
3GE
O D
AT
A T
EM
PLA
TE
.GD
T -
3/2
4/14
12:
20 -
A:\
A3G
EO
PR
OJE
CT
S\1
114
- T
IPP
ING
MA
R\1
114-
5A 2
129
SH
AT
TU
CK
\BO
RIN
G L
OG
S\B
OR
ING
LO
GS
.GP
JA3GEo, Inc.1331 Seventh Street, Unit EBerkeley, CA 94710Telephone: 1 (510) 705-1664Fax: 1 (510) 373-1508
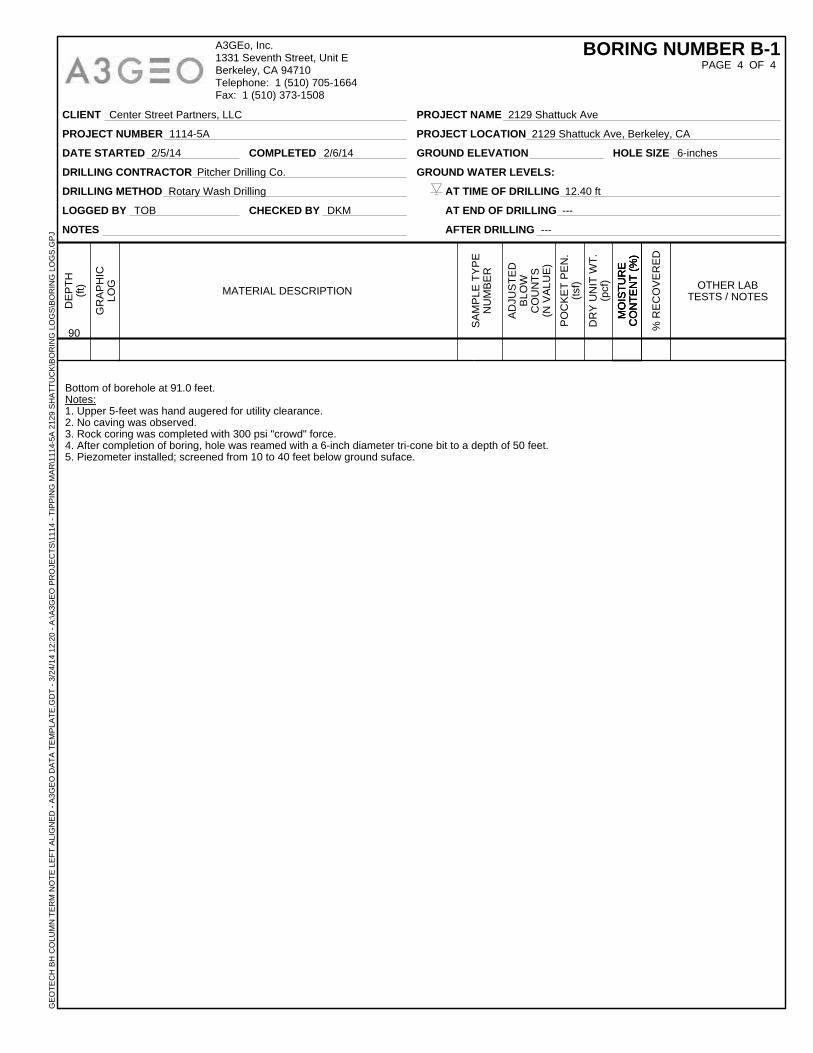
Bottom of borehole at 91.0 feet.Notes:1. Upper 5-feet was hand augered for utility clearance.2. No caving was observed.3. Rock coring was completed with 300 psi "crowd" force.4. After completion of boring, hole was reamed with a 6-inch diameter tri-cone bit to a depth of 50 feet.5. Piezometer installed; screened from 10 to 40 feet below ground suface.
SA
MP
LE
TY
PE
NU
MB
ER
GR
AP
HIC
LO
G
PO
CK
ET
PE
N.
(tsf
)
DR
Y U
NIT
WT
.(p
cf)
MO
IST
UR
EC
ON
TE
NT
(%
)
AD
JUS
TE
DB
LO
WC
OU
NT
S(N
VA
LU
E)
DE
PT
H(f
t)
90
MATERIAL DESCRIPTION
MO
IST
UR
EC
ON
TE
NT
(%
)M
OIS
TU
RE
CO
NT
EN
T (
%)
OTHER LABTESTS / NOTES
% R
EC
OV
ER
ED
PAGE 4 OF 4BORING NUMBER B-1
NOTES
GROUND ELEVATION
LOGGED BY TOB
DRILLING METHOD Rotary Wash Drilling
HOLE SIZE 6-inches
DRILLING CONTRACTOR Pitcher Drilling Co. GROUND WATER LEVELS:
CHECKED BY DKM
DATE STARTED 2/5/14 COMPLETED 2/6/14
AT TIME OF DRILLING 12.40 ft
AT END OF DRILLING ---
AFTER DRILLING ---
PROJECT NAME 2129 Shattuck Ave
PROJECT LOCATION 2129 Shattuck Ave, Berkeley, CA
CLIENT Center Street Partners, LLC
PROJECT NUMBER 1114-5A
GE
OT
EC
H B
H C
OLU
MN
TE
RM
NO
TE
LE
FT
ALI
GN
ED
- A
3GE
O D
AT
A T
EM
PLA
TE
.GD
T -
3/2
4/14
12:
20 -
A:\
A3G
EO
PR
OJE
CT
S\1
114
- T
IPP
ING
MA
R\1
114-
5A 2
129
SH
AT
TU
CK
\BO
RIN
G L
OG
S\B
OR
ING
LO
GS
.GP
JA3GEo, Inc.1331 Seventh Street, Unit EBerkeley, CA 94710Telephone: 1 (510) 705-1664Fax: 1 (510) 373-1508

Appendix B
Geophysical Survey Report (Norcal, 2014)
2129 SHATTUCK PROJECT BERKELEY, CALIFORNIA


Appendix C
Laboratory Test Data
BERKELEY WAY PROJECT UNIVERSITY OF CALIFORNIA, BERKELEY

Tested By: FMO
Brown Sandy CLAY 35 22 13 50.9
Dark Brown Fat CLAY 57 24 33 77.7
1114-5A Center Street Partners, LLC
MATERIAL DESCRIPTION LL PL PI %<#40 %<#200 USCS
Project No. Client: Remarks:
Project:
Figure
Depth: 10.5 Sample Number: B-1
Depth: 5.0 Sample Number: B-1
PLA
ST
ICIT
Y IN
DE
X
0
10
20
30
40
50
60
LIQUID LIMIT0 10 20 30 40 50 60 70 80 90 100 110
CL-ML
CL or O
L
CH or O
H
ML or OL MH or OH
Dashed line indicates the approximateupper limit boundary for natural soils
4
7
LIQUID AND PLASTIC LIMITS TEST REPORT
2129 Shattuck Ave

Tested By: FMO
LL PL D85 D60 D50 D30 D15 D10 Cc Cu
Material Description USCS AASHTO
Project No. Client: Remarks:Project:
Depth: 15.0 Sample Number: B-1
Depth: 5.0 Sample Number: B-1Depth: 10.5 Sample Number: B-1
Figure
6.7695 1.0243 0.2186
57 24
35 22
Dark Brown to Brown Clayey SAND w/ GravelDark Brown Fat CLAYBrown Sandy CLAY
1114-5A Center Street Partners, LLC
PE
RC
EN
T F
INE
R
0
10
20
30
40
50
60
70
80
90
100
GRAIN SIZE - mm.
0.0010.010.1110100
% +3"Coarse
% GravelFine Coarse Medium
% SandFine Silt
% FinesClay
0.0 2.0 18.2 12.0 12.7 16.6 38.577.750.9
6 in
.
3 in
.
2 in
.
1½ in
.
1 in
.
¾ in
.
½ in
.
3/8
in.
#4 #10
#20
#30
#40
#60
#100
#140
#200
Particle Size Distribution Report
2129 Shattuck Ave #200 wash only.
#200 wash only.

A3GEO, Inc.
1331 Seventh Street, Unite E
Berkeley, CA 94710, (510) 705‐1664
DRY DENSITY .
ASTM D 2937 .
Project No. : 1114-5A Project Name : 2129 Shattuck Ave Date Received : 02/05/14
Client : Date Tested : 02/18/14
Tested By: FMO Checked By: File No.: T0061
# 1 1 1
(ft) 5.0 10.5 15.0
(in) 6.00 6.00
(gms.) 1156.89 1032.16
(gms.) 203.50 201.47
(gms.) 953.39 830.69
(gms.) 835.11 699.16
(lb/ftᶟ) 114.1 95.5
# S D F
(gms.) 30.44 30.21 30.50
(gms.) 63.81 76.63 57.52
(gms.) 59.67 69.28 51.68
(gms.) 4.14 7.35 5.84
(gms.) 29.23 39.07 21.18
(%) 14.2 18.8 27.6
The third test was performed for moisture content only.
Center Street Partners, LLC
Boring Number
Additional Laboratory Notes:
Sample Depth
Container Weight
Wet Soil + Container
Dry Soil + Container
Weight of Water
Weight of Dry Soil
Moisture Content
Length Sample (Lo)
Weight of Sample+Liner
Weight of Liner
Weight of Sample
Container Number
Dry Weight of Sample
Density of Sample


Appendix D
Data from Nearby Borings
BERKELEY WAY PROJECT UNIVERSITY OF CALIFORNIA, BERKELEY

Part D1
Boring Logs from BART (Dames & Moore, 1963)
2129 SHATTUCK PROJECT BERKELEY, CALIFORNIA


Part D2
Boring Logs from BAM/PFA (AMEC, 2013)
2129 SHATTUCK PROJECT BERKELEY, CALIFORNIA


Part D3
Laboratory Data from BAM/PFA (AMEC, 2013)
BERKELEY WAY PROJECT UNIVERSITY OF CALIFORNIA, BERKELEY

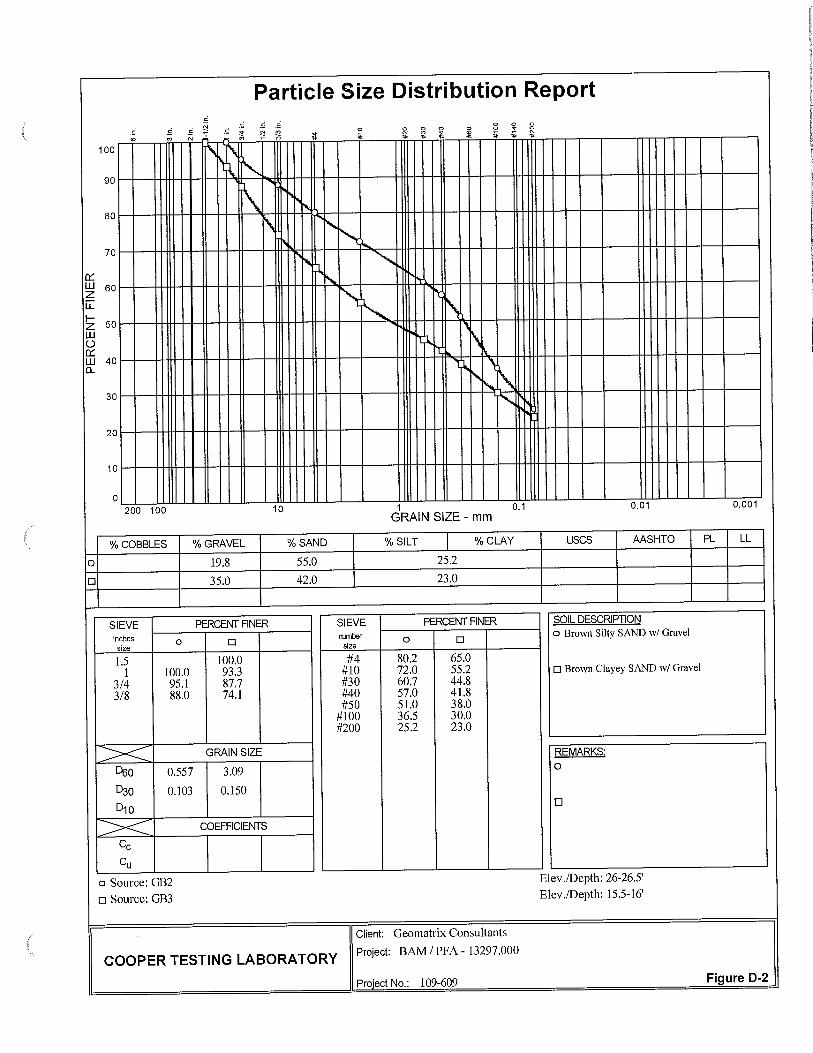
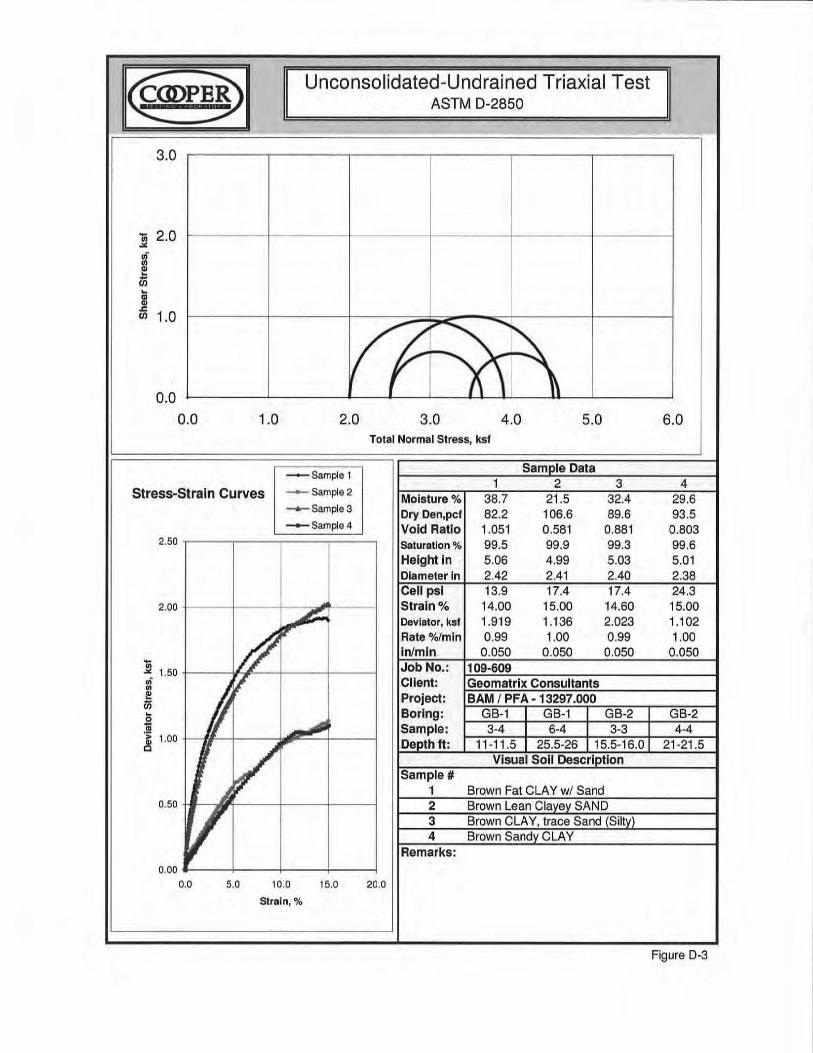

Part D4
Geophysical Survey Data from BAM/PFA (Norcal, 2013)
2129 SHATTUCK PROJECT BERKELEY, CALIFORNIA


Appendix E
Preliminary Response Spectrum (AGDI, 2014)
2129 SHATTUCK PROJECT BERKELEY, CALIFORNIA

March 21, 2014
A3GEO Geoconsultants 1331 Seventh Street – Unit E Berkeley, California 94710
Attention: Mr. Wayne Magnusen
Subject: Preliminary Seismic Design Criteria, 2129 Shattuck Avenue Development Project, Berkeley, California
This report presents preliminary design response spectrum to be used in schematic design of the proposed 2129 Shattuck Development Project (Project) in downtown Berkeley. We understand that this report will be included as an appendix to A3GEO’s geotechnical report for the project. A3GEO’s report will be submitted as a draft and will be finalized in a subsequent final design phase of the project.
The 2129 Shattuck Avenue development project will include construction of a 16-story mixed-use hotel high-rise over a single level of basement. The basement and lower levels of the building (floors 1 through 4) will occupy virtually all of the available site area; floors 5 through 16 have “L”-shaped floor plans surrounding a central structural core.
Tipping Mar and A3GEO are the project structural and geotechnical engineers, respectively. Tipping Mar’s current structural schematics show the building will be supported on a stepped structural mat foundation that is thicker in the area beneath and surrounding the central core. The top of the basement floor/mat is shown as 11 feet below the ground floor level. The site is about ¾ mile away from the Hayward fault, a major regional fault with the highest probability of producing a large magnitude earthquake in the San Francisco Bay Area.
Applied GeoDynamics, Inc’s (AGDI’s) work was performed based on scope of work outlined in a confirming agreement between AGDI and A3GEO dated March 14, 2014.
SUBSURFACE CONDITION
Shear wave velocity measurements in B-1 borehole using OYO suspension logging method were used to develop Vs30 for this site. The shear wave velocity measurements were made only down to approximately 75 feet below the existing ground surface. As the basement depth and the foundation depths are expected to be approximately 16 feet from the existing ground surface, the shear wave velocity measurements from a depth of 16 feet to 75 feet were used to calculate Vs30 value.
1205 Contra Costa Dr El Cerrito, CA 94530
(510) 816-1323

In addition, we used the shear wave velocity measurements at the site vicinity and obtained a Vs30 of 550 m/s (1800 ft/s). This value was used to develop the preliminary site specific design response spectra for this site. The project site is classified as a soil very dense soil and soft rock profile with the site class C.
In addition to Vs30 values, NGA (2008) attenuation relationships require the depths to layers representing shear wave velocities of 1000m/s and 2500m/s (Z1.0 and Z2.5) as input to account for the basin effects or depth to hard rock surface. These Z values were obtained from Campbell and Bozorgnia (2007), Chiou and Youngs (2008), and Abrahamson and Silva (2008) relationships based on Vs30 value. The calculated Z1.0 and Z2.5 are 25 m and 0.9 km, respectively.
SEISMIC HAZARD ANALYSIS
To develop preliminary site specific seismic design ground motions in accordance with ASCE 7-10 criteria, we performed site specific probabilistic seismic hazard analysis (PSHA) and deterministic seismic hazard analysis (DSHA). The PSHA was conducted for two (2) percent probability of exceedance in 50-year event (or 2475-yr return period). The deterministic ground motion was developed for 84th percentile event on the controlling Hayward fault.
In accordance with ASCE 7-10 requirements, the site specific Maximum Considered Earthquake (MCER) and Design Earthquake (DE) response spectra were developed using the PSHA and DSHA risk targeted and maximum rotated components.
For the PSHA values we used the USGS 2008 version of PSHA data to calculate the spectral values at various periods for2475-yr return period using the Vs30 of 550 m/s. USGS used only three attenuation relationships to develop PSHA. These attenuation relationships are: Boore and Atkinson (2008); Campbell and Bozorgnia (2008); and Chiou and Youngs (2008). Additional details about the USGS PSHA can be found at the following website:
http://geohazards.usgs.gov/deaggint/2008/index.php
For the deterministic analysis, we used the average of four NGA attenuation relationships: Abrahamson and Silva (2008), Boore and Atkinson (2008), Campbell and Bozorgnia (2008) and Chiou and Youngs (2008). These attenuation relationships include the average shear wave velocity in the upper 100 feet, Vs30, to represent the subsurface condition. In addition, Abrahamson and Silva (2008), and Chiou and Youngs (2008) include Z1.0 term to incorporate the basin effect while Campbell and Bozorgnia (2008) use the term Z2.5 to account for the basin effect. The NGA relationships were developed for the orientation-independent geometric mean of the data. Geometric mean is defined as the square root of the product of the two recorded components.
The 84th percentile deterministic ground motion was calculated for the controlling Hayward-Rogers Creek faults located approximately 1.2 km from the site (Lat. 37.871 and Lon. 122.267). The Hayward-Rogers Creek fault is capable of producing maximum earthquake magnitude of 7.1 (moment magnitude).
2
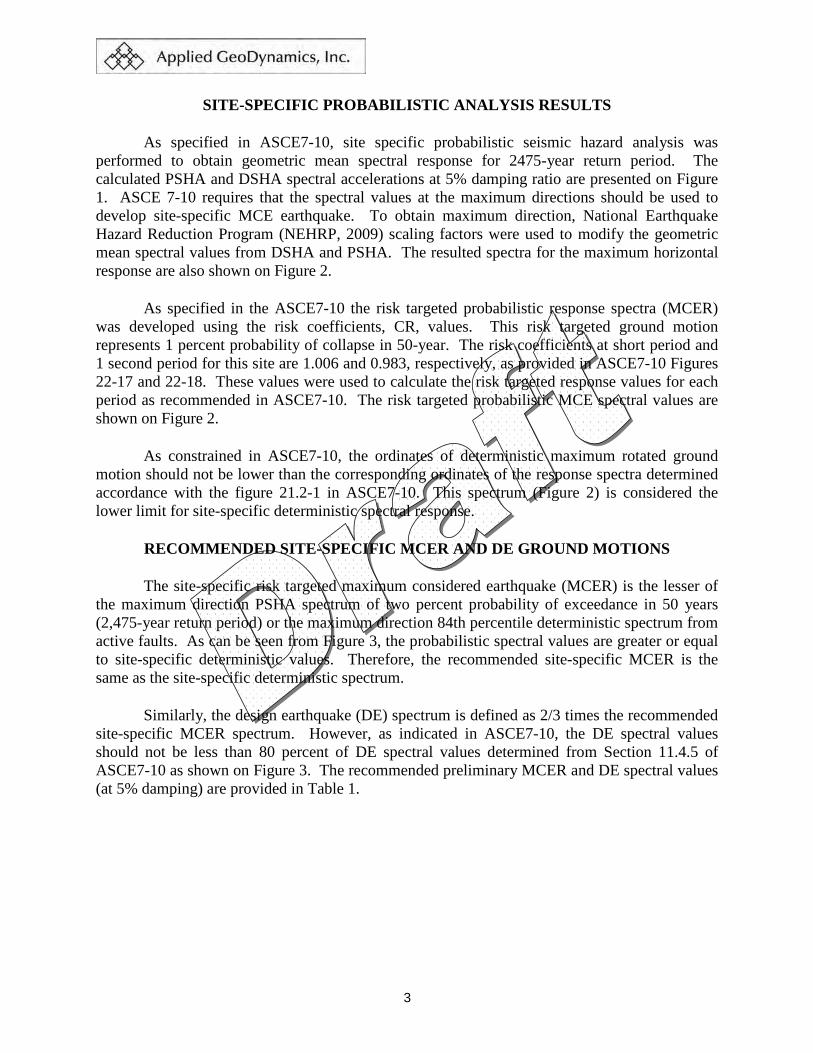
SITE-SPECIFIC PROBABILISTIC ANALYSIS RESULTS
As specified in ASCE7-10, site specific probabilistic seismic hazard analysis was performed to obtain geometric mean spectral response for 2475-year return period. The calculated PSHA and DSHA spectral accelerations at 5% damping ratio are presented on Figure 1. ASCE 7-10 requires that the spectral values at the maximum directions should be used to develop site-specific MCE earthquake. To obtain maximum direction, National Earthquake Hazard Reduction Program (NEHRP, 2009) scaling factors were used to modify the geometric mean spectral values from DSHA and PSHA. The resulted spectra for the maximum horizontal response are also shown on Figure 2.
As specified in the ASCE7-10 the risk targeted probabilistic response spectra (MCER) was developed using the risk coefficients, CR, values. This risk targeted ground motion represents 1 percent probability of collapse in 50-year. The risk coefficients at short period and 1 second period for this site are 1.006 and 0.983, respectively, as provided in ASCE7-10 Figures 22-17 and 22-18. These values were used to calculate the risk targeted response values for each period as recommended in ASCE7-10. The risk targeted probabilistic MCE spectral values are shown on Figure 2.
As constrained in ASCE7-10, the ordinates of deterministic maximum rotated ground motion should not be lower than the corresponding ordinates of the response spectra determined accordance with the figure 21.2-1 in ASCE7-10. This spectrum (Figure 2) is considered the lower limit for site-specific deterministic spectral response.
RECOMMENDED SITE-SPECIFIC MCER AND DE GROUND MOTIONS
The site-specific risk targeted maximum considered earthquake (MCER) is the lesser of the maximum direction PSHA spectrum of two percent probability of exceedance in 50 years (2,475-year return period) or the maximum direction 84th percentile deterministic spectrum from active faults. As can be seen from Figure 3, the probabilistic spectral values are greater or equal to site-specific deterministic values. Therefore, the recommended site-specific MCER is the same as the site-specific deterministic spectrum.
Similarly, the design earthquake (DE) spectrum is defined as 2/3 times the recommended site-specific MCER spectrum. However, as indicated in ASCE7-10, the DE spectral values should not be less than 80 percent of DE spectral values determined from Section 11.4.5 of ASCE7-10 as shown on Figure 3. The recommended preliminary MCER and DE spectral values (at 5% damping) are provided in Table 1.
3

Table 1: Recommended Preliminary Site-Specific MCER and DE Ground Motions (5% damping).
Period (sec)
Recommended Site-specific MCER
Spectral values (g)
Recommended Site-specific DE Spectral Values
(g)
0.01 0.963 0.642
0.02 0.983 0.655
0.03 1.061 0.713
0.05 1.248 0.853
0.075 1.527 1.028
0.1 1.773 1.203
0.15 2.112 1.408
0.2 2.279 1.519
0.25 2.296 1.531
0.3 2.234 1.489
0.4 2.141 1.427
0.5 1.955 1.303
0.75 1.503 1.002
1 1.209 0.806
1.5 0.807 0.538
2 0.570 0.380
3 0.359 0.239
4 0.259 0.172
5 0.200 0.136
7.5 0.110 0.091
10 0.061 0.085
4

CLOSURE
We appreciate the opportunity to provide geotechnical earthquake services on this project. If you have any questions or require additional information, please contact Dr. Shahriar (Shah) Vahdani at (510) 816-1323.
Sincerely,
APPLIED GEODYNAMICS, INC.
Shahriar Vahdani, Ph.D.,PE Senior Consultant
SV:ap
Copies Submitted: (1) Addressee
5

REFERENCES
Abrahamson, N. A, and Silva, W. J. (2008). “Summary of Abrahamson & Silva NGA Ground-Motion Relations.” Earthquake Spectra, 24(1), 67-97.
ASCE Standard ASCE/SEI 7-10 - Minimum Design Loads for Building and Other Structures.
Boore, D. M. and Atkinson, G. M. (2008). “Ground-Motion Prediction Equations for the Average Horizontal Component of PGA, PGV, and 5%-Damped PSA at Spectral Periods between 0.01 s and 10.0 s,” Earthquake Spectra, 24(1), 99-138.
California Division of Mines and Geology (1996). “Probabilistic Seismic Hazard Assessment for The State Of California.” DMG Open-File Report 96-08.
Campbell, K. W. and Bozorgnia, Y. (2008). “NGA Ground Motion Model for the Geometric Mean Horizontal Component of PGA, PGV, PGD, and 5%-Damped PSA at Spectral Periods between 0.01 s and 10.0 s.” Earthquake Spectra, 24(1), 139-171.
Campbell, K. W. and Bozorgnia, Y. (2007). “Campbell-Bozorgnia NGA Ground Motion Relations for the Geometric Mean Horizontal Component of Peak and Spectral Ground Motion Parameters”, PEER Report No. 2007/02.
Chiou, B. S.-J., and Youngs, R. R. (2008). “An NGA Model for the Average Horizontal Component of Peak Ground Motion and Response Spectra.” Earthquake Spectra, 24(1), 173-215.
National Earthquake Hazard Reduction Program (NEHRP) Recommended Seismic Provisions for New Buildings and Other Structures, FEMA P.750, 2009 Edition.
Working Group on California Earthquake Probabilities (WGCEP) (2008). “The Uniform California Earthquake Rupture Forecast, Version 2.” Open File Report 2007-1437.
6

FIGURES
7

Figure 1: Probabilistic MCE (2475-yr return period) and Deterministic (84th percentile) Response Spectra.
Figure 2: Development of Site Specific Deterministic and Probabilistic Response Spectra According to ASCE 7-10.
8

Figure 3: Recommended Preliminary Site Specific Response Spectra for MCE and DE with Lower Limit of DE.
9