Embed Size (px)
Citation preview
III. SUPPORTING INFORMATION
Arms Control and Nonproliferation Considerations Estimating Foreign Military Sales
Foreign Military Sales Administrative Costs Overseas Military Program Management
Grants of Excess Defense Articles Leased Defense Articles
Stockpiling of Defense Articles for Foreign Countries Countries and International Organizations Eligible for Purchasing Defense Articles and Services
End-Use Monitoring of Defense Articles and Defense Services Government to Government Programs End-Use Monitoring of Defense Articles and Defense Services Commercial Exports
Commercial Exports Licensed or Approved Under the Arms Export Control Act Security Assistance Funding P.L. 480 Title II Food Aid
All Spigots Tables
549
This page intentionally left blank.
550
Arms Control and Nonproliferation Considerations
Arms transfers continue to be an indispensable U.S. policy instrument for advancing international security and stability in the post-Cold War era and for promoting the aims of the Global War on Terrorism. Judiciously used, arms transfers can deter aggression, foster internal and regional stability, strengthen and revitalize mutual security relationships, and demonstrate support for the security of friends and allies. With the new challenges posed by the rise of global terrorism and the spread of weapons of mass destruction, our military assistance programs play a critical role in bolstering the security capabilities of the United States and its allies.
The U.S. military assistance program complements the U.S. foreign policy goal of promoting international security through negotiation and support for bilateral, regional and multilateral agreements and arrangements, and assuring compliance with existing arms control agreements. It also enhances the U.S ability to limit the proliferation of weapons of mass destruction, especially in regions of conflict, by giving countries conventional means for ensuring their security. As the President’s arms transfer policy states, the United States will actively seek greater transparency and responsibility in the area of arms transfers to regions of instability.
There are other new and creative forms of security assistance in the NADR account that complement our arms control and nonproliferation goals and contribute to regional and global stability. The program to destroy small arms and reduce international stockpiles helps control the proliferation of relatively cheap, accessible weapons that exacerbate regional and civil conflicts. The worldwide Nonproliferation and Disarmament Fund and export control cooperation programs promote bilateral and multilateral efforts to control the spread of missiles, nuclear, chemical and biological weapons, and destabilizing arms transfers.
Carefully structured security assistance programs support U.S. conventional arms transfer policy goals, particularly to preserve regional balances and help allies deter and defend against aggression, and the U.S. nonproliferation objectives of curbing the spread of weapons of mass destruction and their delivery systems.
The U.S. arms transfer policy requires a careful, case-by-case evaluation of each request for arms. Each transfer is specifically reviewed for its contribution to U.S. security interests and arms control and nonproliferation objectives. Such a review considers, inter alia:
• Whether a proposed transfer is consistent with U.S. interests in maintaining or enhancing stability within the region;
• Whether the proposed transfer can be absorbed without overburdening the recipient’s military support system or financial resources;
• The impact of the proposed transfer on our arms control and nonproliferation goals; and
• Whether possible adverse effects of the transfer are offset by positive contributions to U.S. regional security interests and objectives.
Whenever appropriate, these issues are referred to senior Administration officials, beginning with those in the Department of State, to ensure that decisions on arms transfers complement and support U.S. national security policies.
551
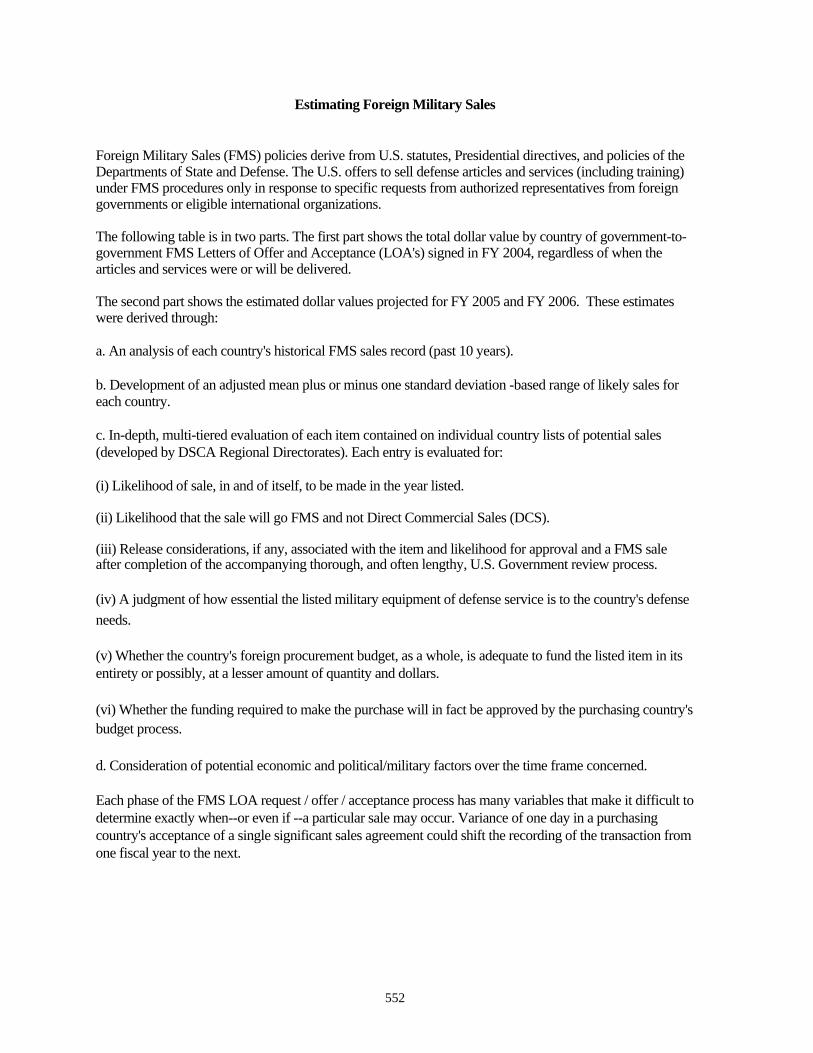
Estimating Foreign Military Sales
Foreign Military Sales (FMS) policies derive from U.S. statutes, Presidential directives, and policies of the Departments of State and Defense. The U.S. offers to sell defense articles and services (including training) under FMS procedures only in response to specific requests from authorized representatives from foreign governments or eligible international organizations.
The following table is in two parts. The first part shows the total dollar value by country of government-to-government FMS Letters of Offer and Acceptance (LOA's) signed in FY 2004, regardless of when the articles and services were or will be delivered.
The second part shows the estimated dollar values projected for FY 2005 and FY 2006. These estimates were derived through:
a. An analysis of each country's historical FMS sales record (past 10 years).
b. Development of an adjusted mean plus or minus one standard deviation -based range of likely sales for each country.
c. In-depth, multi-tiered evaluation of each item contained on individual country lists of potential sales (developed by DSCA Regional Directorates). Each entry is evaluated for:
(i) Likelihood of sale, in and of itself, to be made in the year listed.
(ii) Likelihood that the sale will go FMS and not Direct Commercial Sales (DCS).
(iii) Release considerations, if any, associated with the item and likelihood for approval and a FMS sale after completion of the accompanying thorough, and often lengthy, U.S. Government review process.
(iv) A judgment of how essential the listed military equipment of defense service is to the country's defense needs.
(v) Whether the country's foreign procurement budget, as a whole, is adequate to fund the listed item in its entirety or possibly, at a lesser amount of quantity and dollars.
(vi) Whether the funding required to make the purchase will in fact be approved by the purchasing country's budget process.
d. Consideration of potential economic and political/military factors over the time frame concerned.
Each phase of the FMS LOA request / offer / acceptance process has many variables that make it difficult to determine exactly when--or even if --a particular sale may occur. Variance of one day in a purchasing country's acceptance of a single significant sales agreement could shift the recording of the transaction from one fiscal year to the next.
552
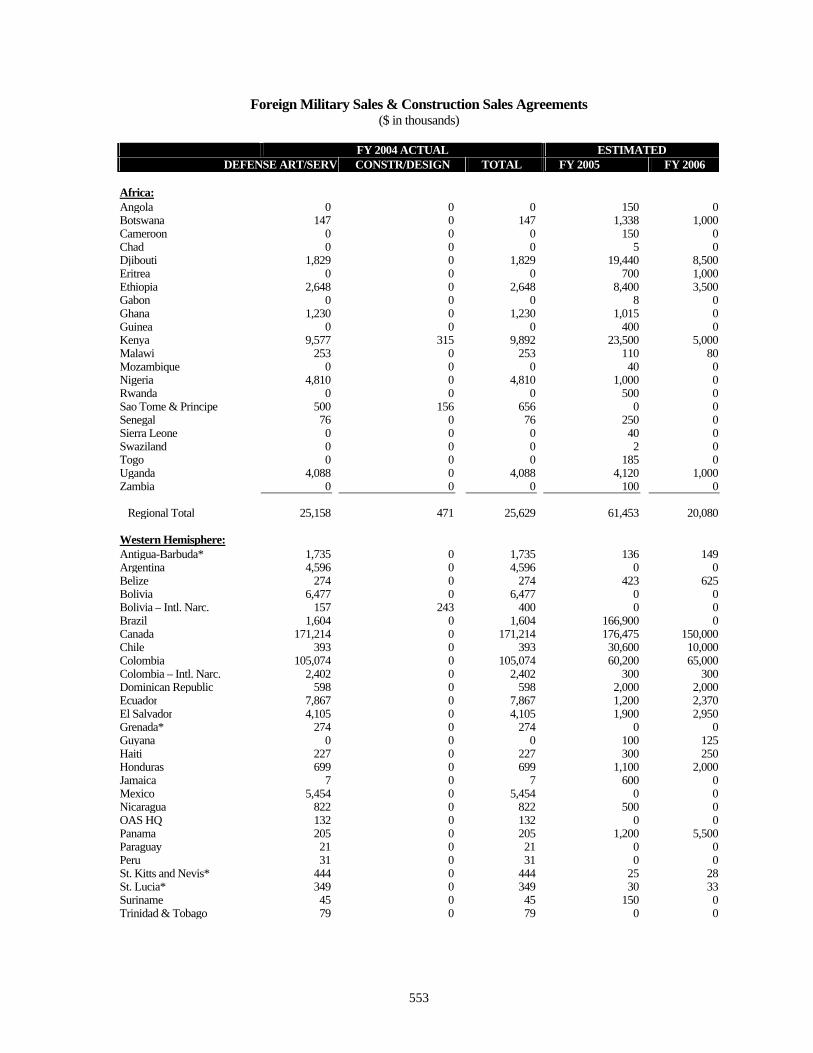
Foreign Military Sales & Construction Sales Agreements ($ in thousands)
ESTIMATED DEFENSE ART/SERV CONSTR/DESIGN FY 2005
FY 2004 ACTUAL TOTAL FY 2006
Africa: Angola 0 0 0 150 0 Botswana 147 0 147 1,338 1,000 Cameroon 0 0 0 150 0 Chad 0 0 0 5 0 Djibouti 1,829 0 1,829 19,440 8,500 Eritrea 0 0 0 700 1,000 Ethiopia 2,648 0 2,648 8,400 3,500 Gabon 0 0 0 8 0 Ghana 1,230 0 1,230 1,015 0 Guinea 0 0 0 400 0 Kenya 9,577 315 9,892 23,500 5,000 Malawi 253 0 253 110 80 Mozambique 0 0 0 40 0 Nigeria 4,810 0 4,810 1,000 0 Rwanda 0 0 0 500 0 Sao Tome & Principe 500 156 656 0 0 Senegal 76 0 76 250 0 Sierra Leone 0 0 0 40 0 Swaziland 0 0 0 2 0 Togo 0 0 0 185 0 Uganda 4,088 0 4,088 4,120 1,000 Zambia 0 0 0 100 0
Regional Total 25,158 471 25,629 61,453 20,080
Western Hemisphere: Antigua-Barbuda* 1,735 0 1,735 136 149 Argentina 4,596 0 4,596 0 0 Belize 274 0 274 423 625 Bolivia 6,477 0 6,477 0 0 Bolivia – Intl. Narc. 157 243 400 0 0 Brazil 1,604 0 1,604 166,900 0 Canada 171,214 0 171,214 176,475 150,000 Chile 393 0 393 30,600 10,000 Colombia 105,074 0 105,074 60,200 65,000 Colombia – Intl. Narc. 2,402 0 2,402 300 300 Dominican Republic 598 0 598 2,000 2,000 Ecuador 7,867 0 7,867 1,200 2,370 El Salvador 4,105 0 4,105 1,900 2,950 Grenada* 274 0 274 0 0 Guyana 0 0 0 100 125 Haiti 227 0 227 300 250 Honduras 699 0 699 1,100 2,000 Jamaica 7 0 7 600 0 Mexico 5,454 0 5,454 0 0 Nicaragua 822 0 822 500 0 OAS HQ 132 0 132 0 0 Panama 205 0 205 1,200 5,500 Paraguay 21 0 21 0 0 Peru 31 0 31 0 0 St. Kitts and Nevis* 444 0 444 25 28 St. Lucia* 349 0 349 30 33 Suriname 45 0 45 150 0 Trinidad & Tobago 79 0 79 0 0
553
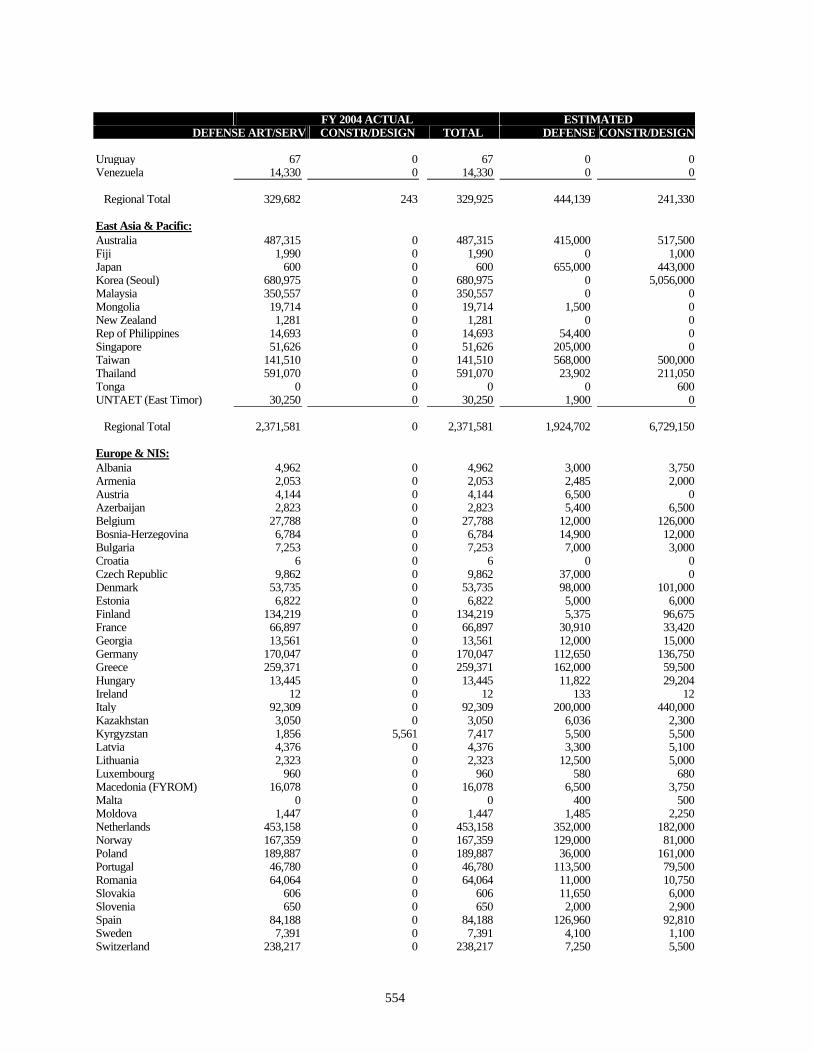
ESTIMATED DEFENSE ART/SERV CONSTR/DESIGN DEFENSE CONSTR/DESIGN
FY 2004 ACTUAL TOTAL
Uruguay 67 0 67 0 0 Venezuela 14,330 0 14,330 0 0
Regional Total 329,682 243 329,925 444,139 241,330
East Asia & Pacific: Australia 487,315 0 487,315 415,000 517,500 Fiji 1,990 0 1,990 0 1,000 Japan 600 0 600 655,000 443,000 Korea (Seoul) 680,975 0 680,975 0 5,056,000 Malaysia 350,557 0 350,557 0 0 Mongolia 19,714 0 19,714 1,500 0 New Zealand 1,281 0 1,281 0 0 Rep of Philippines 14,693 0 14,693 54,400 0 Singapore 51,626 0 51,626 205,000 0 Taiwan 141,510 0 141,510 568,000 500,000 Thailand 591,070 0 591,070 23,902 211,050 Tonga 0 0 0 0 600 UNTAET (East Timor) 30,250 0 30,250 1,900 0
Regional Total 2,371,581 0 2,371,581 1,924,702 6,729,150
Europe & NIS: Albania 4,962 0 4,962 3,000 3,750 Armenia 2,053 0 2,053 2,485 2,000 Austria 4,144 0 4,144 6,500 0 Azerbaijan 2,823 0 2,823 5,400 6,500 Belgium 27,788 0 27,788 12,000 126,000 Bosnia-Herzegovina 6,784 0 6,784 14,900 12,000 Bulgaria 7,253 0 7,253 7,000 3,000 Croatia 6 0 6 0 0 Czech Republic 9,862 0 9,862 37,000 0 Denmark 53,735 0 53,735 98,000 101,000 Estonia 6,822 0 6,822 5,000 6,000 Finland 134,219 0 134,219 5,375 96,675 France 66,897 0 66,897 30,910 33,420 Georgia 13,561 0 13,561 12,000 15,000 Germany 170,047 0 170,047 112,650 136,750 Greece 259,371 0 259,371 162,000 59,500 Hungary 13,445 0 13,445 11,822 29,204 Ireland 12 0 12 133 12 Italy 92,309 0 92,309 200,000 440,000 Kazakhstan 3,050 0 3,050 6,036 2,300 Kyrgyzstan 1,856 5,561 7,417 5,500 5,500 Latvia 4,376 0 4,376 3,300 5,100 Lithuania 2,323 0 2,323 12,500 5,000 Luxembourg 960 0 960 580 680 Macedonia (FYROM) 16,078 0 16,078 6,500 3,750 Malta 0 0 0 400 500 Moldova 1,447 0 1,447 1,485 2,250 Netherlands 453,158 0 453,158 352,000 182,000 Norway 167,359 0 167,359 129,000 81,000 Poland 189,887 0 189,887 36,000 161,000 Portugal 46,780 0 46,780 113,500 79,500 Romania 64,064 0 64,064 11,000 10,750 Slovakia 606 0 606 11,650 6,000 Slovenia 650 0 650 2,000 2,900 Spain 84,188 0 84,188 126,960 92,810 Sweden 7,391 0 7,391 4,100 1,100 Switzerland 238,217 0 238,217 7,250 5,500
554
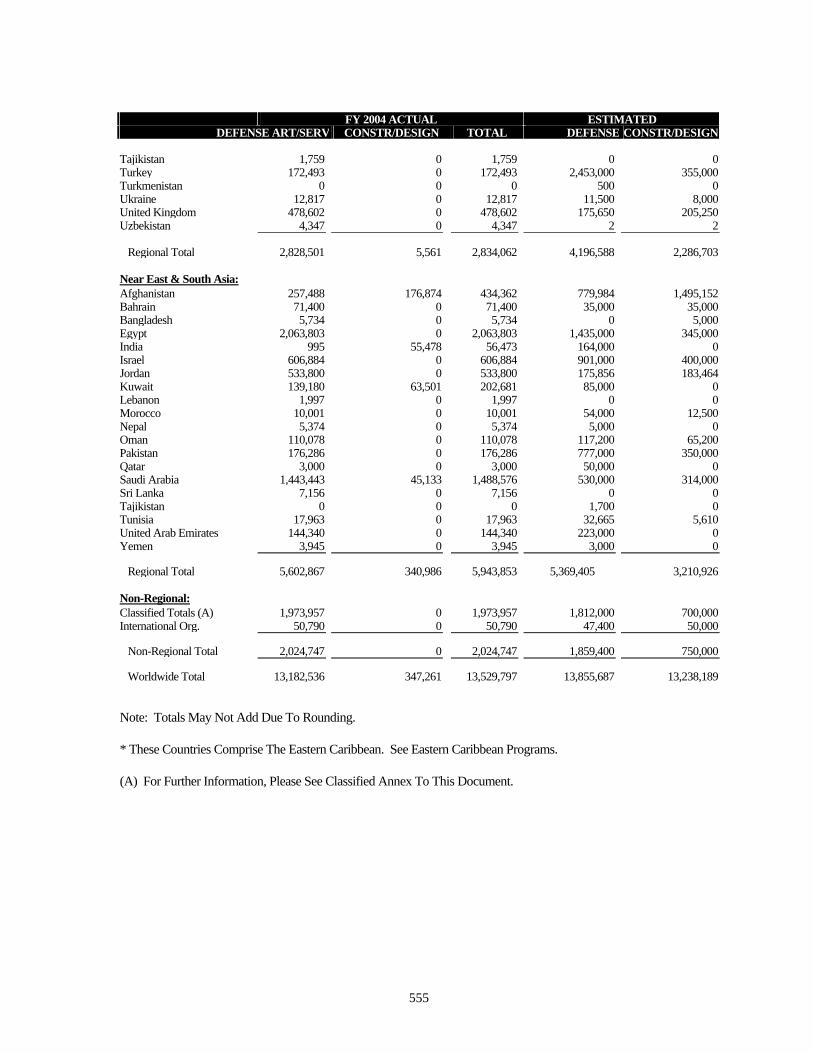
ESTIMATED DEFENSE ART/SERV CONSTR/DESIGN DEFENSE CONSTR/DESIGN
FY 2004 ACTUAL TOTAL
Tajikistan 1,759 0 1,759 0 0 Turkey 172,493 0 172,493 2,453,000 355,000 Turkmenistan 0 0 0 500 0 Ukraine 12,817 0 12,817 11,500 8,000 United Kingdom 478,602 0 478,602 175,650 205,250 Uzbekistan 4,347 0 4,347 2 2
Regional Total 2,828,501 5,561 2,834,062 4,196,588 2,286,703
Near East & South Asia: Afghanistan 257,488 176,874 434,362 779,984 1,495,152 Bahrain 71,400 0 71,400 35,000 35,000 Bangladesh 5,734 0 5,734 0 5,000 Egypt 2,063,803 0 2,063,803 1,435,000 345,000 India 995 55,478 56,473 164,000 0 Israel 606,884 0 606,884 901,000 400,000 Jordan 533,800 0 533,800 175,856 183,464 Kuwait 139,180 63,501 202,681 85,000 0 Lebanon 1,997 0 1,997 0 0 Morocco 10,001 0 10,001 54,000 12,500 Nepal 5,374 0 5,374 5,000 0 Oman 110,078 0 110,078 117,200 65,200 Pakistan 176,286 0 176,286 777,000 350,000 Qatar 3,000 0 3,000 50,000 0 Saudi Arabia 1,443,443 45,133 1,488,576 530,000 314,000 Sri Lanka 7,156 0 7,156 0 0 Tajikistan 0 0 0 1,700 0 Tunisia 17,963 0 17,963 32,665 5,610 United Arab Emirates 144,340 0 144,340 223,000 0 Yemen 3,945 0 3,945 3,000 0
Regional Total 5,602,867 340,986 5,943,853 5,369,405 3,210,926
Non-Regional: Classified Totals (A) 1,973,957 0 1,973,957 1,812,000 700,000 International Org. 50,790 0 50,790 47,400 50,000
Non-Regional Total 2,024,747 0 2,024,747 1,859,400 750,000
Worldwide Total 13,182,536 347,261 13,529,797 13,855,687 13,238,189
Note: Totals May Not Add Due To Rounding.
* These Countries Comprise The Eastern Caribbean. See Eastern Caribbean Programs.
(A) For Further Information, Please See Classified Annex To This Document.
555
Foreign Military Sales Administrative Costs
The Foreign Military Sales (FMS) program is implemented, for the most part, by the same Department of Defense personnel who work in the military departments and defense agency procurement, logistics support and administrative organizations established to carry out DoD's requirements for procurement and support of weapons, equipment, supplies and services needed by our Army, Navy, Air Force and Marines. A small number of fully dedicated security assistance organizations and personnel are also employed by the military departments and defense agencies in accomplishing the FMS mission. This integration of FMS provides organizational efficiencies and procurement cost economies to both the U.S. and the FMS customer countries.
The Arms Export Control Act (AECA) requires that the costs of implementing FMS be paid by FMS customer countries. To satisfy this requirement, an “administrative surcharge” of two and one-half percent (2.5%) is applied to most FMS cases written on or after June 1, 1999. For cases written before that time, a three percent (3%) rate is applied. A five percent (5%) rate is applied to non-standard articles and services and supply support arrangements. In addition, a “logistics support charge” of three-point-one percent (3.1%) is applied on certain deliveries of spare parts, equipment modifications, secondary support equipment and supplies. These administrative funds collected from the FMS customer are made available to the military departments and defense agencies to pay for their FMS administrative costs related to such functions as FMS case preparation (including preparation of price and availability estimates/information), sales negotiations, case implementation, procurement, program control, ADP operations, accounting, budgeting and other financial program management. About one-half of the operating costs of overseas Security Assistance Organizations (SAOs) are also financed from FMS administrative funds. DSCA administers an annual budget process to develop estimated funding requirements and establish approved administrative funding levels.
The ceiling request to be included in Foreign Operations, Export Financing and Related Programs Appropriations Act of 2005, is $367 million on obligations of FMS administrative funds. All FMS administrative budget obligations and expenditures are from FMS customers' funds that have been collected into the U.S. Treasury in the Foreign Military Sales Trust Fund account. There is no net outlay impact on the U.S. budget from the operations of the FMS administrative budget.
In FY 2006, $373 million is required. DoD’s FMS workload is level as indicated by actual sales between FY's 2000-2003 in the $12-13 billion range, and anticipated sales for FY 2004-2005 also in the $13.5 billion range.
The following table shows FMS administrative budget amounts for FY's 2004-2006.
556
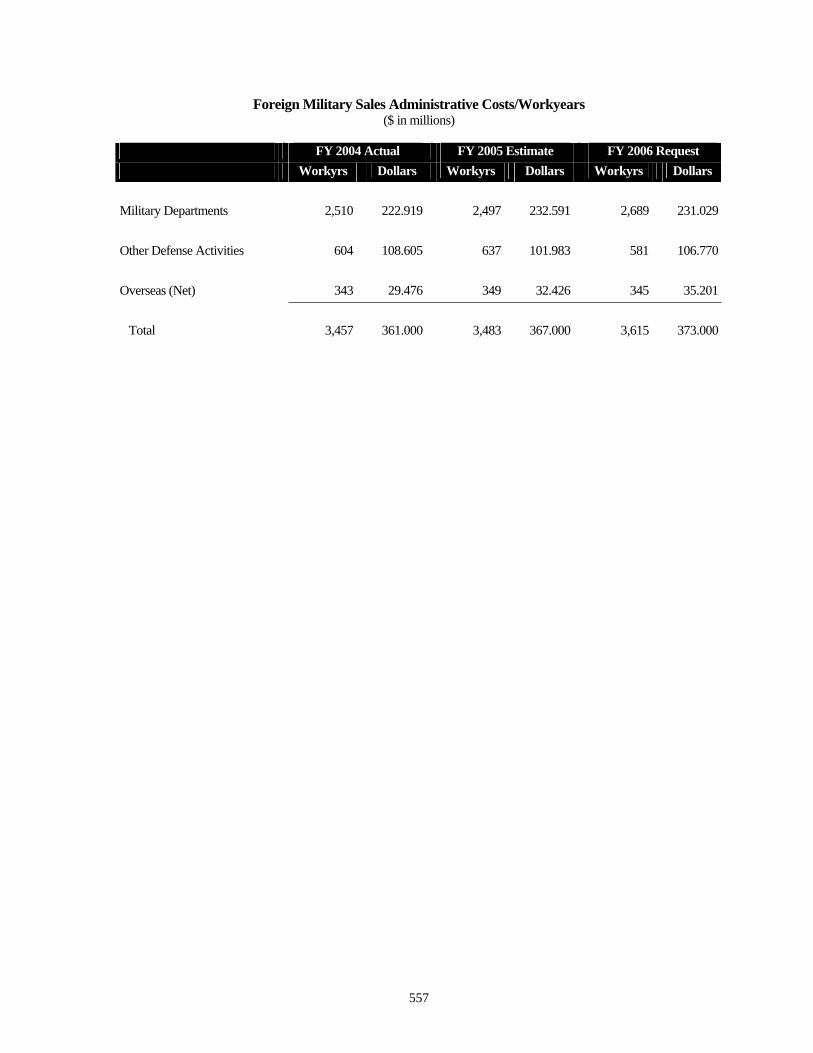
Foreign Military Sales Administrative Costs/Workyears ($ in millions)
FY 2004 Actual FY 2005 Estimate FY 2006 Request Workyrs Dollars Workyrs Dollars Workyrs Dollars
Military Departments 2,510 222.919 2,497 232.591 2,689 231.029
Other Defense Activities 604 108.605 637 101.983 581 106.770
Overseas (Net) 343 29.476 349 32.426 345 35.201
Total 3,457 361.000 3,483 367.000 3,615 373.000
557
OVERSEAS MILITARY PROGRAM MANAGEMENT
United States military personnel are assigned to Security Assistance Organizations (SAOs) overseas to ensure effective planning and management of host country security assistance programs. These individuals, along with U.S. civilians and local national civilians serve under the direction and supervision of the Chiefs of U.S. Diplomatic Missions. The SAO provides liaison among the Mission, the Department of Defense, and the host country defense establishment in security assistance matters.
SAO personnel work closely with members of the host country defense establishment to develop and execute training programs and to accomplish realistic and effective procurement actions. These efforts are key to the development of a defense infrastructure capable of integrating weapons and support systems into the existing force structure. Professional exchanges and cooperative planning contribute to effective and efficient country security assistance programs.
The Department of Defense reviews staffing authorizations in coordination with the Department of State, the Chiefs of U.S. Diplomatic Missions, and the Combatant Commands to ensure that SAOs are properly staffed to conduct their missions efficiently
In FY 2005, separate SAOs will be assigned to eighty-nine countries. In twenty-seven additional countries, programs will be administered by augmentation personnel assigned to carry out security assistance management functions under the supervision of the Defense Attaché or other Mission staff. In other countries with which the U.S. maintains a security assistance relationship, Defense Attaches and other Mission personnel manage the programs without augmentation personnel.
The following tables identify the security assistance authorized staffing levels and associated costs at the conclusion of FY 2004 and the estimated levels for FY 2005 and FY 2006. Actual assigned strengths for FY 2004 and FY 2005 may be less than the authorized levels shown. Staffing requirements may change as individual country programs develop.
The following is a glossary of Organizations assigned to U.S. Diplomatic Missions overseas that manage host country security assistance programs:
U.S. SECURITY ASSISTANCE ORGANIZATIONS
DAO Defense Attaché Office JUSMAG Joint U.S. Military Assistance Group JUSMAG-K Joint U.S. Military Affairs Group - Korea KUSLO Kenya U.S. Liaison Office MAP Military Assistance Program MDAO Mutual Defense Assistance Office NLO Navy Liaison Office ODC Office of Defense Cooperation ODR Office of Defense Representative ODRP Office of Defense Representative - Pakistan OMC Office of Military Cooperation OMC-K Office of Military Cooperation - Kuwait SAO Security Assistance Office USLO U.S. Liaison Office USMAAG U.S. Military Assistance Advisory Group USMILGP U.S. Military Group USMLO U.S. Military Liaison Office USMTM U.S. Military Training Mission
558
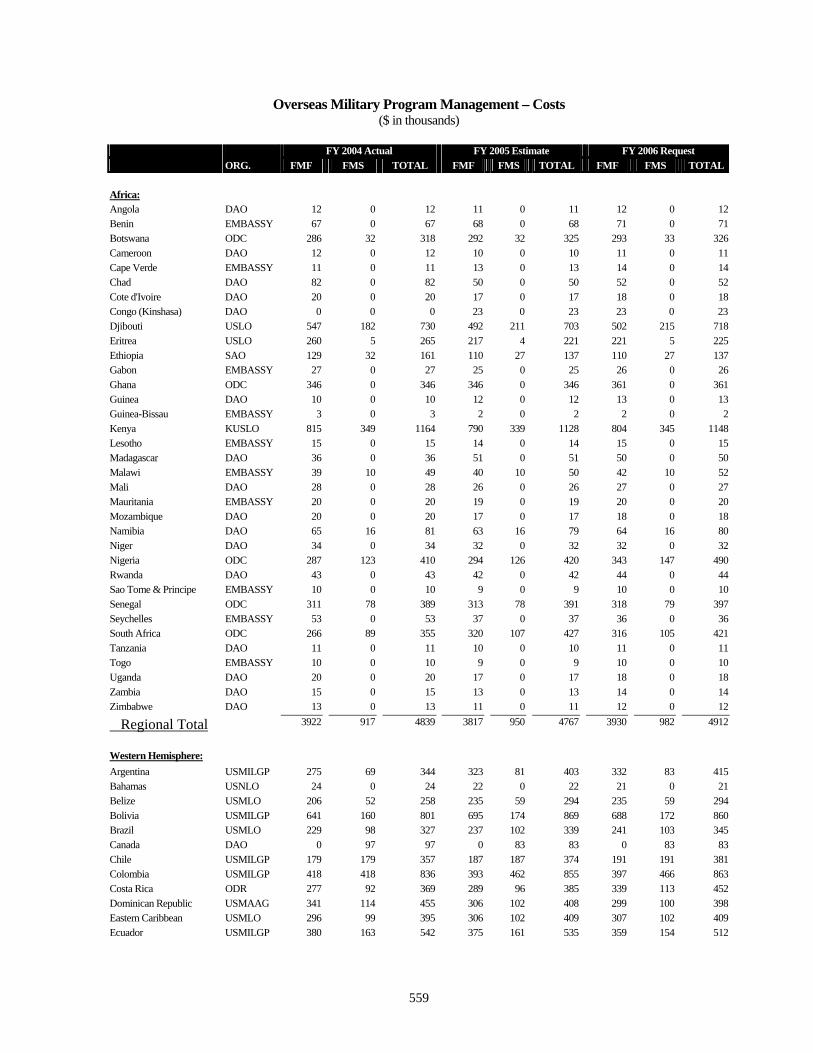
Overseas Military Program Management – Costs ($ in thousands)
iORG.
FY 2004 Actual FY 2005 Est mate FY 2006 Request FMF FMS TOTAL FMF FMS TOTAL FMF FMS TOTAL
Africa: Angola DAO 12 0 12 11 0 11 12 0 12 Benin EMBASSY 67 0 67 68 0 68 71 0 71 Botswana ODC 286 32 318 292 32 325 293 33 326 Cameroon DAO 12 0 12 10 0 10 11 0 11 Cape Verde EMBASSY 11 0 11 13 0 13 14 0 14 Chad DAO 82 0 82 50 0 50 52 0 52 Cote d'Ivoire DAO 20 0 20 17 0 17 18 0 18 Congo (Kinshasa) DAO 0 0 0 23 0 23 23 0 23 Djibouti USLO 547 182 730 492 211 703 502 215 718 Eritrea USLO 260 5 265 217 4 221 221 5 225 Ethiopia SAO 129 32 161 110 27 137 110 27 137 Gabon EMBASSY 27 0 27 25 0 25 26 0 26 Ghana ODC 346 0 346 346 0 346 361 0 361 Guinea DAO 10 0 10 12 0 12 13 0 13 Guinea-Bissau EMBASSY 3 0 3 2 0 2 2 0 2 Kenya KUSLO 815 349 1164 790 339 1128 804 345 1148 Lesotho EMBASSY 15 0 15 14 0 14 15 0 15 Madagascar DAO 36 0 36 51 0 51 50 0 50 Malawi EMBASSY 39 10 49 40 10 50 42 10 52 Mali DAO 28 0 28 26 0 26 27 0 27 Mauritania EMBASSY 20 0 20 19 0 19 20 0 20 Mozambique DAO 20 0 20 17 0 17 18 0 18 Namibia DAO 65 16 81 63 16 79 64 16 80 Niger DAO 34 0 34 32 0 32 32 0 32 Nigeria ODC 287 123 410 294 126 420 343 147 490 Rwanda DAO 43 0 43 42 0 42 44 0 44 Sao Tome & Principe EMBASSY 10 0 10 9 0 9 10 0 10 Senegal ODC 311 78 389 313 78 391 318 79 397 Seychelles EMBASSY 53 0 53 37 0 37 36 0 36 South Africa ODC 266 89 355 320 107 427 316 105 421 Tanzania DAO 11 0 11 10 0 10 11 0 11 Togo EMBASSY 10 0 10 9 0 9 10 0 10 Uganda DAO 20 0 20 17 0 17 18 0 18 Zambia DAO 15 0 15 13 0 13 14 0 14 Zimbabwe DAO 13 0 13 11 0 11 12 0 12
Regional Total 3922 917 4839 3817 950 4767 3930 982 4912
Western Hemisphere: Argentina USMILGP 275 69 344 323 81 403 332 83 415 Bahamas USNLO 24 0 24 22 0 22 21 0 21 Belize USMLO 206 52 258 235 59 294 235 59 294 Bolivia USMILGP 641 160 801 695 174 869 688 172 860 Brazil USMLO 229 98 327 237 102 339 241 103 345 Canada DAO 0 97 97 0 83 83 0 83 83 Chile USMILGP 179 179 357 187 187 374 191 191 381 Colombia USMILGP 418 418 836 393 462 855 397 466 863 Costa Rica ODR 277 92 369 289 96 385 339 113 452 Dominican Republic USMAAG 341 114 455 306 102 408 299 100 398 Eastern Caribbean USMLO 296 99 395 306 102 409 307 102 409 Ecuador USMILGP 380 163 542 375 161 535 359 154 512
559
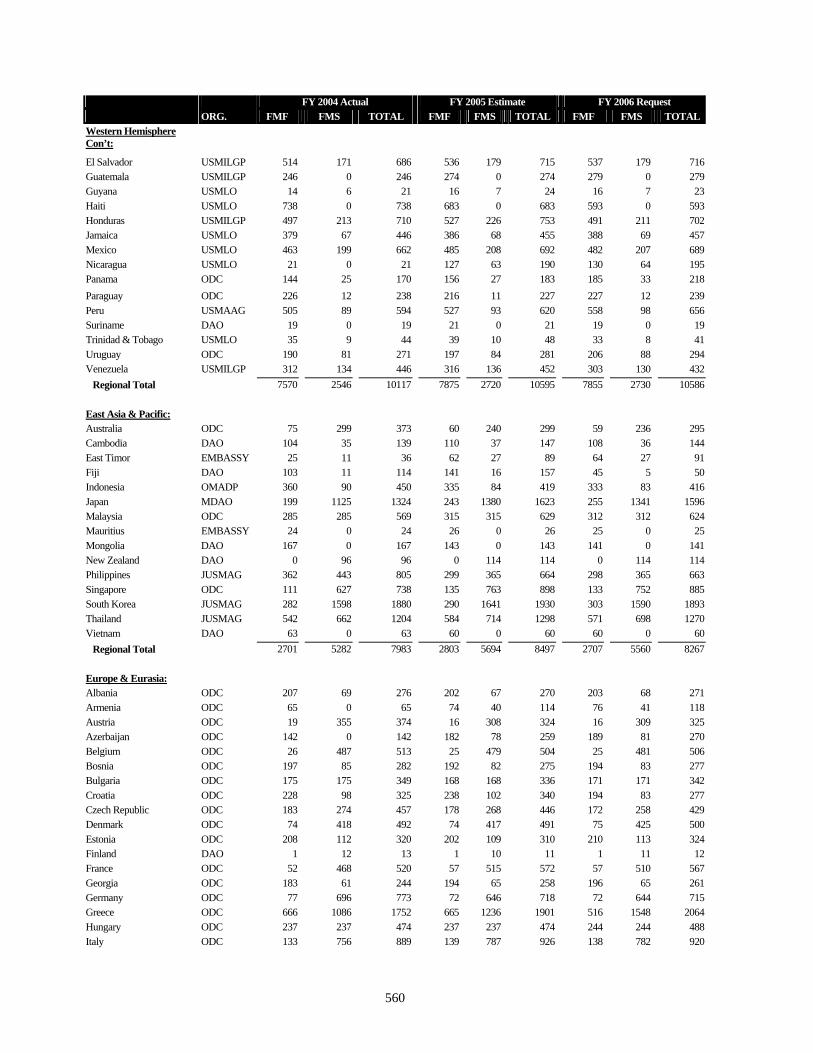
iORG.
FY 2004 Actual FY 2005 Est mate FY 2006 Request FMF FMS TOTAL FMF FMS TOTAL FMF FMS TOTAL
Western Hemisphere Con’t:
El Salvador USMILGP 514 171 686 536 179 715 537 179 716 Guatemala USMILGP 246 0 246 274 0 274 279 0 279 Guyana USMLO 14 6 21 16 7 24 16 7 23 Haiti USMLO 738 0 738 683 0 683 593 0 593 Honduras USMILGP 497 213 710 527 226 753 491 211 702 Jamaica USMLO 379 67 446 386 68 455 388 69 457 Mexico USMLO 463 199 662 485 208 692 482 207 689 Nicaragua USMLO 21 0 21 127 63 190 130 64 195 Panama ODC 144 25 170 156 27 183 185 33 218 Paraguay ODC 226 12 238 216 11 227 227 12 239 Peru USMAAG 505 89 594 527 93 620 558 98 656 Suriname DAO 19 0 19 21 0 21 19 0 19 Trinidad & Tobago USMLO 35 9 44 39 10 48 33 8 41 Uruguay ODC 190 81 271 197 84 281 206 88 294 Venezuela USMILGP 312 134 446 316 136 452 303 130 432
Regional Total 7570 2546 10117 7875 2720 10595 7855 2730 10586
East Asia & Pacific: Australia ODC 75 299 373 60 240 299 59 236 295 Cambodia DAO 104 35 139 110 37 147 108 36 144 East Timor EMBASSY 25 11 36 62 27 89 64 27 91 Fiji DAO 103 11 114 141 16 157 45 5 50 Indonesia OMADP 360 90 450 335 84 419 333 83 416 Japan MDAO 199 1125 1324 243 1380 1623 255 1341 1596 Malaysia ODC 285 285 569 315 315 629 312 312 624 Mauritius EMBASSY 24 0 24 26 0 26 25 0 25 Mongolia DAO 167 0 167 143 0 143 141 0 141 New Zealand DAO 0 96 96 0 114 114 0 114 114 Philippines JUSMAG 362 443 805 299 365 664 298 365 663 Singapore ODC 111 627 738 135 763 898 133 752 885 South Korea JUSMAG 282 1598 1880 290 1641 1930 303 1590 1893 Thailand JUSMAG 542 662 1204 584 714 1298 571 698 1270 Vietnam DAO 63 0 63 60 0 60 60 0 60
Regional Total 2701 5282 7983 2803 5694 8497 2707 5560 8267
Europe & Eurasia: Albania ODC 207 69 276 202 67 270 203 68 271 Armenia ODC 65 0 65 74 40 114 76 41 118 Austria ODC 19 355 374 16 308 324 16 309 325 Azerbaijan ODC 142 0 142 182 78 259 189 81 270 Belgium ODC 26 487 513 25 479 504 25 481 506 Bosnia ODC 197 85 282 192 82 275 194 83 277 Bulgaria ODC 175 175 349 168 168 336 171 171 342 Croatia ODC 228 98 325 238 102 340 194 83 277 Czech Republic ODC 183 274 457 178 268 446 172 258 429 Denmark ODC 74 418 492 74 417 491 75 425 500 Estonia ODC 208 112 320 202 109 310 210 113 324 Finland DAO 1 12 13 1 10 11 1 11 12 France ODC 52 468 520 57 515 572 57 510 567 Georgia ODC 183 61 244 194 65 258 196 65 261 Germany ODC 77 696 773 72 646 718 72 644 715 Greece ODC 666 1086 1752 665 1236 1901 516 1548 2064 Hungary ODC 237 237 474 237 237 474 244 244 488 Italy ODC 133 756 889 139 787 926 138 782 920
560
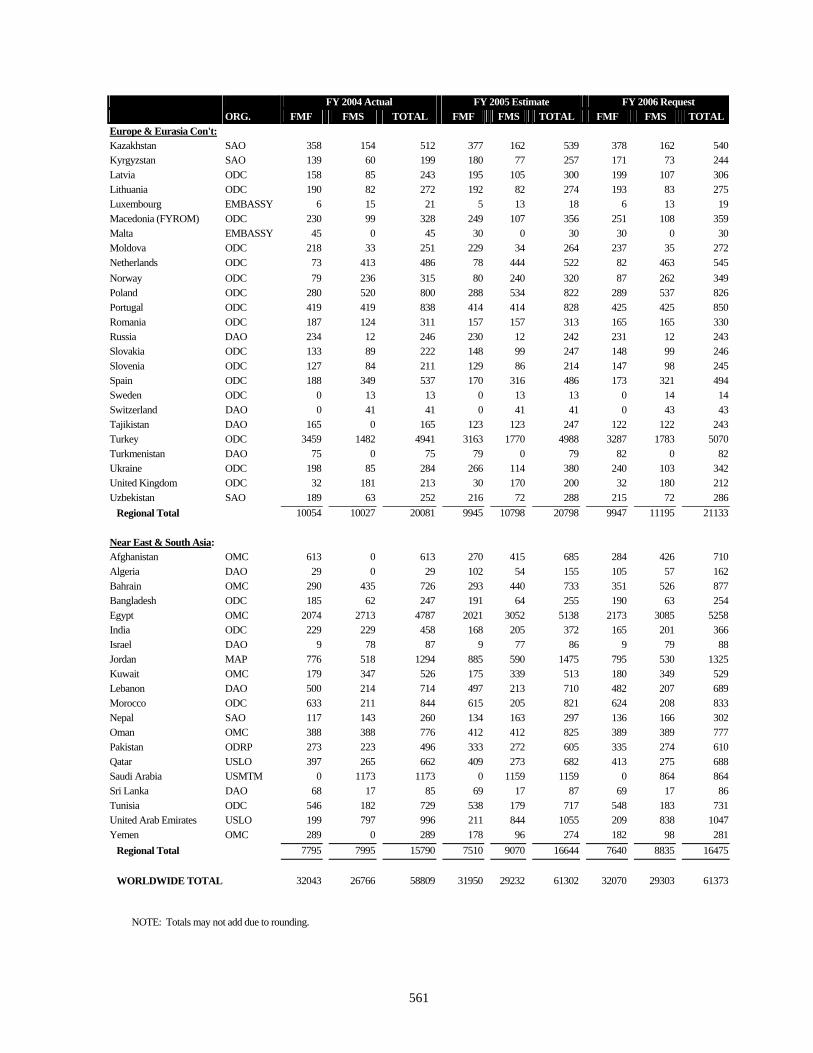
iORG.
FY 2004 Actual FY 2005 Est mate FY 2006 Request FMF FMS TOTAL FMF FMS TOTAL FMF FMS TOTAL
Europe & Eurasia Con't: Kazakhstan SAO 358 154 512 377 162 539 378 162 540 Kyrgyzstan SAO 139 60 199 180 77 257 171 73 244 Latvia ODC 158 85 243 195 105 300 199 107 306 Lithuania ODC 190 82 272 192 82 274 193 83 275 Luxembourg EMBASSY 6 15 21 5 13 18 6 13 19 Macedonia (FYROM) ODC 230 99 328 249 107 356 251 108 359 Malta EMBASSY 45 0 45 30 0 30 30 0 30 Moldova ODC 218 33 251 229 34 264 237 35 272 Netherlands ODC 73 413 486 78 444 522 82 463 545 Norway ODC 79 236 315 80 240 320 87 262 349 Poland ODC 280 520 800 288 534 822 289 537 826 Portugal ODC 419 419 838 414 414 828 425 425 850 Romania ODC 187 124 311 157 157 313 165 165 330 Russia DAO 234 12 246 230 12 242 231 12 243 Slovakia ODC 133 89 222 148 99 247 148 99 246 Slovenia ODC 127 84 211 129 86 214 147 98 245 Spain ODC 188 349 537 170 316 486 173 321 494 Sweden ODC 0 13 13 0 13 13 0 14 14 Switzerland DAO 0 41 41 0 41 41 0 43 43 Tajikistan DAO 165 0 165 123 123 247 122 122 243 Turkey ODC 3459 1482 4941 3163 1770 4988 3287 1783 5070 Turkmenistan DAO 75 0 75 79 0 79 82 0 82 Ukraine ODC 198 85 284 266 114 380 240 103 342 United Kingdom ODC 32 181 213 30 170 200 32 180 212 Uzbekistan SAO 189 63 252 216 72 288 215 72 286
Regional Total 10054 10027 20081 9945 10798 20798 9947 11195 21133
Near East & South Asia: Afghanistan OMC 613 0 613 270 415 685 284 426 710 Algeria DAO 29 0 29 102 54 155 105 57 162 Bahrain OMC 290 435 726 293 440 733 351 526 877 Bangladesh ODC 185 62 247 191 64 255 190 63 254 Egypt OMC 2074 2713 4787 2021 3052 5138 2173 3085 5258 India ODC 229 229 458 168 205 372 165 201 366 Israel DAO 9 78 87 9 77 86 9 79 88 Jordan MAP 776 518 1294 885 590 1475 795 530 1325 Kuwait OMC 179 347 526 175 339 513 180 349 529 Lebanon DAO 500 214 714 497 213 710 482 207 689 Morocco ODC 633 211 844 615 205 821 624 208 833 Nepal SAO 117 143 260 134 163 297 136 166 302 Oman OMC 388 388 776 412 412 825 389 389 777 Pakistan ODRP 273 223 496 333 272 605 335 274 610 Qatar USLO 397 265 662 409 273 682 413 275 688 Saudi Arabia USMTM 0 1173 1173 0 1159 1159 0 864 864 Sri Lanka DAO 68 17 85 69 17 87 69 17 86 Tunisia ODC 546 182 729 538 179 717 548 183 731 United Arab Emirates USLO 199 797 996 211 844 1055 209 838 1047 Yemen OMC 289 0 289 178 96 274 182 98 281
Regional Total 7795 7995 15790 7510 9070 16644 7640 8835 16475
WORLDWIDE TOTAL 32043 26766 58809 31950 29232 61302 32070 29303 61373
NOTE: Totals may not add due to rounding.
561
Overseas Military Program Management - Personnel Strengths
MIL CIV MIL CIV MIL CIV FY 2004 FY 2005 ESTIMATE FY 2006 REQUEST
ORG. LOCAL TOTAL LOCAL TOTAL LOCAL TOTAL
Africa: Botswana ODC 2 0 1 3 2 0 1 3 2 0 1 3 Chad DAO a/ 0 0 1 1 0 0 1 1 0 0 1 1 Djibouti USLO 1 0 1 2 1 0 1 2 1 0 1 2 Eritrea USLO 1 0 0 1 1 0 0 1 1 0 0 1 Ethiopia SAO 1 0 0 1 2 0 0 2 2 0 0 2 Ghana ODC 1 0 2 3 1 0 2 3 1 0 2 3 Kenya KUSLO 4 2 1 7 4 2 1 7 4 2 1 7 Liberia ODC 3 1 0 4 3 1 0 4 3 1 0 4 Namibia EMBASSY b/ 0 1 0 1 0 1 0 1 0 1 0 1 Niger DAO a/ 0 0 1 1 0 0 1 1 0 0 1 1 Nigeria ODC 3 0 0 3 3 0 0 3 3 0 0 3 Rwanda DAO a/ 0 0 1 1 0 0 1 1 0 0 1 1 Senegal ODC 1 0 2 3 1 0 3 4 1 0 3 4 South Africa ODC 2 0 0 2 2 0 0 2 2 0 0 2
Regional total 19 4 10 33 20 4 11 35 20 4 11 35
Western Hemisphere: Argentina USMILGP 3 0 3 6 3 0 3 6 3 0 3 6 Barbados USMLO c/ 3 0 0 3 3 0 0 3 3 0 0 3 Belize USMLO 2 0 0 2 2 0 0 2 2 0 0 2 Bolivia USMILGP 4 1 2 7 4 1 2 7 4 1 2 7 Brazil USMLO 4 0 0 4 4 0 0 4 4 0 0 4 Canada DAO a/ 1 0 1 2 1 0 1 2 1 0 1 2 Chile USMILGP 2 0 2 4 2 0 2 4 2 0 2 4 Colombia USMILGP 6 1 3 10 6 1 3 10 6 1 3 10 Costa Rica ODR 1 0 2 3 1 0 2 3 1 0 2 3 Dominican Republic USMAAG 2 0 0 2 2 0 0 2 2 0 0 2 Ecuador USMILGP 5 1 2 8 5 1 2 8 5 1 2 8 El Salvador USMILGP 3 0 2 5 3 0 2 5 3 0 2 5 Guatemala USMILGP 1 0 1 2 1 0 1 2 1 0 1 2 Guyana USMLO 0 0 0 0 0 0 0 0 0 0 0 0 Haiti USMLO 2 0 0 2 2 0 0 2 2 0 0 2 Honduras USMILGP 4 1 2 7 4 1 2 7 4 1 2 7 Jamaica USMLO 2 0 0 2 2 0 0 2 2 0 0 2 Mexico ODC 3 1 4 8 3 1 4 8 3 1 4 8 Panama DAO a/ 2 0 1 3 2 0 1 3 2 0 1 3 Nicaragua DAO a/ 2 0 1 3 2 0 1 3 2 0 1 3 Paraguay ODC 2 0 1 3 2 0 1 3 2 0 1 3 Peru USMAAG 1 1 3 5 1 1 3 5 1 1 3 5 Suriname DAO a/ 1 0 0 1 1 0 0 1 1 0 0 1 Trinidad and Tobago USMLO 0 0 0 0 1 0 0 1 1 0 0 1 Uruguay USODC 2 0 2 4 2 0 2 4 2 0 2 4 Venezuela USMILGP 2 1 3 6 2 1 3 6 2 1 3 6
Regional Total 60 7 35 102 61 7 35 103 61 7 35 103
East Asia & Pacific: Australia ODC a/ 4 1 1 6 4 0 1 5 4 0 1 5 Cambodia DAO a/ 1 0 2 3 1 0 2 3 1 0 2 3 East Timor DAO a/ 0 0 0 0 1 0 0 1 1 0 0 1 Fiji DAO a/ 1 0 1 2 1 0 1 2 0 0 1 1 Indonesia DAO a/ 1 0 4 5 1 0 4 5 1 0 4 5 Japan MDAO 5 3 6 14 5 3 6 14 5 3 6 14 Malaysia SAO 3 0 5 8 2 0 5 7 2 0 5 7 Mongolia DAO b/ 1 0 1 2 0 0 1 1 0 0 1 1 New Zealand DAO a/ 0 0 1 1 0 0 1 1 0 0 1 1 Philippines JUSMAG 5 1 4 10 11 2 4 17 11 2 4 17 Singapore ODC 7 0 3 10 6 0 3 9 6 0 3 9 Sri Lanka DAO a/ 0 0 1 1 0 0 1 1 0 0 1 1 South Korea JUSMAG-K 16 0 10 26 12 0 10 22 12 0 10 22 Thailand JUSMAG 13 0 12 25 10 0 12 22 10 0 12 22 Vietnam DAO a/ 0 0 1 1 0 0 1 1 1 0 1 2
Regional Total 57 5 52 114 54 5 52 111 54 5 52 111
562
MIL CIV MIL CIV MIL CIV FY 2004 FY 2005 ESTIMATE FY 2006 REQUEST
ORG. LOCAL TOTAL LOCAL TOTAL LOCAL TOTAL
Europe: Albania ODC 1 0 2 3 1 0 2 3 1 0 2 3 Algeria ODC 2 0 0 2 2 0 0 2 2 0 0 2 Armenia ODC 1 0 0 1 1 0 0 1 1 0 0 1 Austria ODC 2 0 0 2 2 0 0 2 2 0 0 2 Azerbaijan ODC 1 0 0 1 1 0 0 1 1 0 0 1 Belgium ODC 1 0 2 3 1 0 2 3 1 0 2 3 Bosnia ODC 1 0 1 2 1 0 1 2 1 0 1 2 Bulgaria ODC 2 0 1 3 2 0 1 3 2 0 1 3 Croatia ODC 1 1 1 3 1 1 1 3 1 1 1 3 Czech Republic ODC 1 0 2 3 1 0 2 3 1 0 2 3 Denmark ODC 1 1 2 4 1 1 2 4 1 1 2 4 Estonia ODC 1 0 0 1 1 0 0 1 1 0 0 1 France ODC 1 1 2 4 1 1 2 4 1 1 2 4 Georgia ODC 2 0 1 3 2 0 1 3 2 0 1 3 Germany ODC 5 2 3 10 5 2 3 10 5 2 3 10 Greece ODC 6 3 8 17 6 3 8 17 6 3 8 17 Hungary ODC 1 1 1 3 1 1 2 4 1 1 2 4 Italy ODC 3 1 4 8 3 1 4 8 3 1 4 8 Kazakhstan SAO 2 0 1 3 2 0 1 3 2 0 1 3 Kyrgyzstan SAO 2 0 1 3 2 0 1 3 2 0 1 3 Latvia ODC 1 0 2 3 1 0 2 3 1 0 2 3 Lithuania ODC 2 0 1 3 2 0 1 3 2 0 1 3 Macedonia (FYROM) ODC 1 0 2 3 1 0 2 3 1 0 2 3 Moldova ODC 1 0 1 2 1 0 1 2 1 0 1 2 Netherlands ODC 2 1 2 5 2 1 2 5 2 1 2 5 Norway ODC 2 0 1 3 2 0 1 3 2 0 1 3 Poland ODC 4 0 3 7 4 0 3 7 4 0 3 7 Portugal ODC 5 1 3 9 5 1 3 9 5 1 3 9 Romania ODC 2 0 1 3 2 0 1 3 2 0 1 3 Russia DAO a/ 2 0 0 2 2 0 0 2 2 0 0 2 Serbia ODC 1 0 0 1 1 0 0 1 1 0 0 1 Slovakia ODC 3 0 0 3 3 0 0 3 3 0 0 3 Slovenia ODC 1 0 1 2 1 0 1 2 1 0 1 2 Spain ODC 4 2 1 7 4 2 1 7 4 2 1 7 Sweden DAO a/ 0 0 1 1 0 0 1 1 0 0 1 1 Tajikistan DAO a/ 0 0 0 0 1 0 0 1 1 0 0 1 Turkey ODC 17 3 6 26 17 3 6 26 17 3 6 26 Turkmenistan DAO a/ 1 0 0 1 1 0 0 1 1 0 0 1 Ukraine ODC 1 0 1 2 1 0 1 2 1 0 1 2 United Kingdom ODC 2 1 0 3 2 1 0 3 2 1 0 3 Uzbekistan SAO 2 0 1 3 3 0 1 4 3 0 1 4
Regional Total 91 18 59 168 93 18 60 171 93 18 60 171
Near East/South Asia: Afghanistan OMC 6 0 2 8 6 0 2 8 6 0 2 8 Bahrain OMC 6 1 0 7 6 1 0 7 6 1 0 7 Bangladesh DAO a/ 1 0 1 2 1 0 1 2 1 0 1 2 Egypt OMC 28 8 12 48 28 8 12 48 28 8 12 48 India DAO a/ 2 1 2 5 4 1 2 7 4 1 2 7 Iraq OMC 0 0 0 0 0 0 0 0 11 0 3 14 Israel DAO a/ 1 0 0 1 1 0 0 1 1 0 0 1 Jordan MAP 8 1 4 13 9 1 4 14 9 1 4 14 Kuwait OMC 10 1 1 12 10 1 1 12 10 1 1 12 Lebanon DAO a/ 1 0 3 4 1 0 3 4 1 0 3 4 Madagascar DAO a/ 0 0 1 1 0 0 1 1 0 0 1 1 Morocco ODC 3 1 4 8 2 1 3 6 2 1 3 6 Nepal SAO 1 0 1 2 1 0 1 2 1 0 1 2 Oman OMC 5 1 1 7 6 1 1 8 6 1 1 8 Pakistan ODRP 2 1 3 6 4 1 3 8 4 1 3 8 Qatar USLO 3 0 0 3 3 0 0 3 3 0 0 3 Saudi Arabia USMTM 63 0 8 71 63 0 8 71 63 0 8 71 Sri Lanka DAO a/ 0 0 1 1 0 0 1 1 0 0 1 1 Tunisia ODC 6 1 1 8 4 1 0 5 4 1 0 5 United Arab Emirates USLO 6 1 1 8 6 1 1 8 6 1 1 8 Yemen OMC 0 0 1 1 0 0 1 1 2 0 1 3
Regional Total 152 17 47 216 154 17 45 216 168 17 48 233
563
MIL CIV MIL CIV MIL CIV FY2004 FY 2005 ESTIMATE FY 2006 REQUEST
ORG. LOCAL TOTAL LOCAL TOTAL LOCAL TOTAL
WORLDWIDE TOTAL 379 51 203 633 382 51 203 636 396 51 206 653
a/ Personnel authorized to assist the DAO with security assistance management functions. b/ Personnel authorized to assist the Embassy with security assistance management functions. c/ Manages programs for Eastern Caribbean countries.
564
Excess Defense Articles
The Excess Defense Articles (EDA) program enables the United States to meet foreign policy objectives while simultaneously supporting our friends and allies in improving their defense capabilities. EDA may be sold to any country eligible to purchase defense articles or provided on a grant basis to countries justified in the country papers to receive grant EDA. Providing EDA on a grant basis turns U.S. defense items that are in excess of our Approved Force Acquisition Objective and Approved Force Retention Stock into instruments that meet a number of our national security interests. Some of the objectives met by EDA are: strengthening coalitions, cementing bilateral foreign military relationships, enhancing interoperability, furthering legitimate modernization efforts of our allies, aiding in multilateral peacekeeping efforts, combating illegal narcotics production and narco-trafficking, and aiding in demining assistance programs.
Providing EDA on a grant basis has contributed to our foreign policy successes. This excess equipment has helped our Latin American and Caribbean friends combat the threat of illegal narco-trafficking and has permitted many South American and African nations to participate in support of U.S. and UN peacekeeping operations. Grant EDA contributes to regional stability by supporting the ongoing military reform efforts of democratic governments in central and eastern Europe and the Baltics. Additionally, grant EDA has a positive global impact – furthering U.S. national security interests and supporting the growth and strengthening of democracies, promoting military reform and fighting the spread of illicit narcotics.
EDA articles are transferred in an “as is, where is” condition to the recipient and are only offered in response to a demonstrated requirement. The grant EDA program operates at essentially no cost to the United States, with the recipient responsible for any required refurbishment and repair of the items as well as any associated transportation costs. The vast majority of EDA items are of low to medium technologies that do not present proliferation concerns.
Each grant eligible country has a justification statement providing the objective and proposed use of potential EDA within each country paper. Eligibility simply permits a nation to be considered for grant EDA and does not guarantee the transfer of any EDA, nor does it circumvent or bypass in any way the comprehensive case-by-case review each potential EDA offer receives. Furthermore, all potential EDA transfers are subject to the same Conventional Arms Transfer Policy interagency review as any other government-to-government transfer.
565
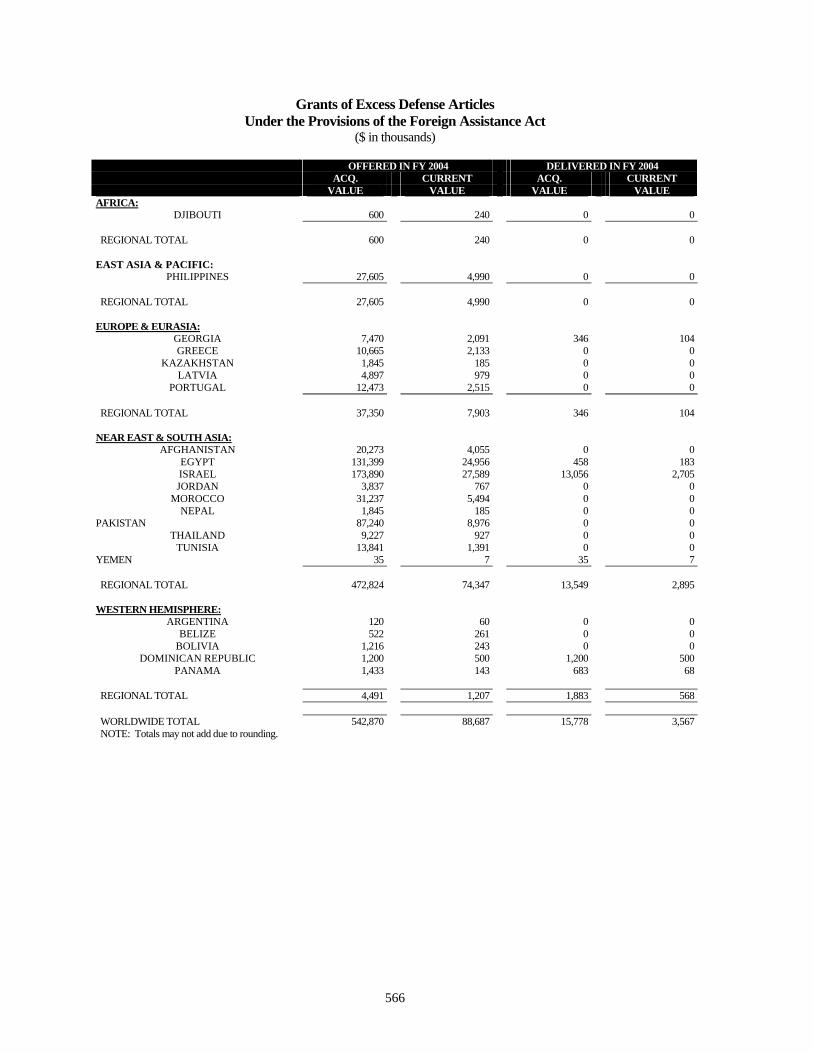
Grants of Excess Defense Articles Under the Provisions of the Foreign Assistance Act
($ in thousands)
ACQ. CURRENT ACQ. CURRENT VALUE VALUE VALUE VALUE
OFFERED IN FY 2004 DELIVERED IN FY 2004
AFRICA: DJIBOUTI 600 240 0 0
REGIONAL TOTAL 600 240 0 0
EAST ASIA & PACIFIC: PHILIPPINES 27,605 4,990 0 0
REGIONAL TOTAL 27,605 4,990 0 0
EUROPE & EURASIA: GEORGIA 7,470 2,091 346 104 GREECE 10,665 2,133 0 0
KAZAKHSTAN 1,845 185 0 0 LATVIA 4,897 979 0 0
PORTUGAL 12,473 2,515 0 0
REGIONAL TOTAL 37,350 7,903 346 104
NEAR EAST & SOUTH ASIA: AFGHANISTAN 20,273 4,055 0 0
EGYPT 131,399 24,956 458 183 ISRAEL 173,890 27,589 13,056 2,705 JORDAN 3,837 767 0 0
MOROCCO 31,237 5,494 0 0 NEPAL 1,845 185 0 0
PAKISTAN 87,240 8,976 0 0 THAILAND 9,227 927 0 0
TUNISIA 13,841 1,391 0 0 YEMEN 35 7 35 7
REGIONAL TOTAL 472,824 74,347 13,549 2,895
WESTERN HEMISPHERE: ARGENTINA 120 60 0 0
BELIZE 522 261 0 0 BOLIVIA 1,216 243 0 0
DOMINICAN REPUBLIC 1,200 500 1,200 500 PANAMA 1,433 143 683 68
REGIONAL TOTAL 4,491 1,207 1,883 568
WORLDWIDE TOTAL 542,870 88,687 15,778 3,567 NOTE: Totals may not add due to rounding.
566
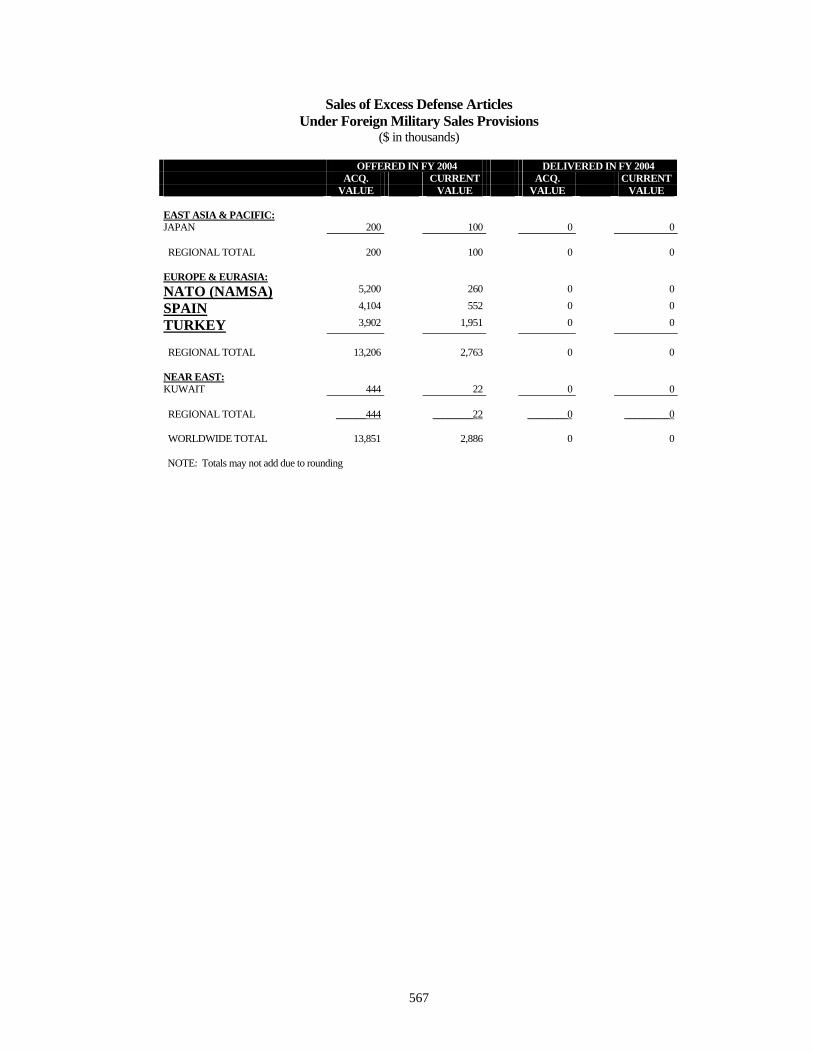
Sales of Excess Defense Articles Under Foreign Military Sales Provisions
($ in thousands)
ACQ. CURRENT ACQ. CURRENT VALUE VALUE VALUE VALUE
OFFERED IN FY 2004 DELIVERED IN FY 2004
EAST ASIA & PACIFIC: JAPAN 200 100 0 0
REGIONAL TOTAL 200 100 0 0
EUROPE & EURASIA: NATO (NAMSA) SPAIN
5,2004,104
260 552
0 0
0 0
TURKEY 3,902 1,951 0 0
REGIONAL TOTAL 13,206 2,763 0 0
NEAR EAST: KUWAIT 444 22 0 0
REGIONAL TOTAL ______444 ________22 ________0 _________0
WORLDWIDE TOTAL 13,851 2,886 0 0
NOTE: Totals may not add due to rounding
567
Leased Defense Articles
The lease of defense articles can be authorized under the Arms Export Control Act (AECA), Chapter 6, if there are compelling U.S. foreign policy and national security reasons for providing defense articles on a lease rather than a sales basis. Defense articles cannot be leased if they are needed for public use during the period of the lease.
Except for leases entered into for the purposes of cooperative research or development, military exercises or communications or electronics interface projects, the country leasing the defense article(s) must agree to pay, in U.S. dollars, all costs incurred by the United States Government in leasing the article(s). These costs include reimbursement for depreciation of the article(s) while leased. In addition, the country must also pay the cost of restoration or replacement if the article(s) are damaged while leased. If the article(s) is lost or destroyed while leased, the U.S. requires funds to cover the replacement cost (less depreciation, if any) or an amount equal to the actual value (less depreciation) when the article(s) will not be replaced in the U.S. inventory.
The President may waive reimbursement of depreciation for any defense article which has passed three-quarters of its normal service life if the President determines that to do so is important to the national security interests of the United States. In some cases, the President may waive the reimbursement of all lease charges with respect to a lease that is made in exchange with the lessee for a lease on substantially reciprocal terms of defense articles for the Department of Defense. Waivers for depreciation or reciprocity are made before the implementation of the lease agreement.
Leases are conducted for a fixed duration of time not to exceed five years and provide that, at any time during the lease, the U.S. may terminate the lease and require the immediate return of the defense article(s).
568
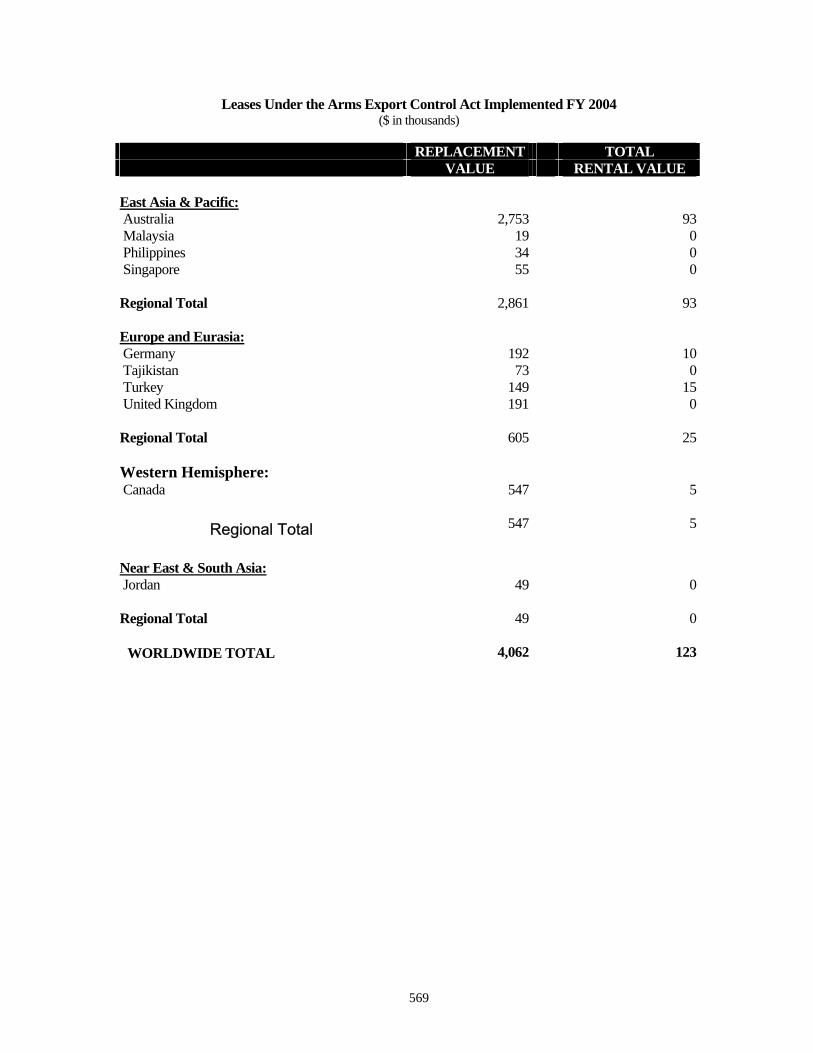
Leases Under the Arms Export Control Act Implemented FY 2004 ($ in thousands)
TOTAL VALUE
REPLACEMENT RENTAL VALUE
East Asia & Pacific: Australia 2,753 93 Malaysia 19 0 Philippines 34 0 Singapore 55 0
Regional Total 2,861 93
Europe and Eurasia: Germany 192 10 Tajikistan 73 0 Turkey 149 15 United Kingdom 191 0
Regional Total 605 25
Western Hemisphere: Canada 547 5
Regional Total 547 5
Near East & South Asia: Jordan 49 0
Regional Total 49 0
WORLDWIDE TOTAL 4,062 123
569
Stockpiling of Defense Articles for Foreign Countries
Section 514(b) of the Foreign Assistance Act of 1961 (FAA), as amended, establishes annual ceilings on the value of additions of defense articles located abroad that may be set aside, reserved, or otherwise earmarked from U.S. military inventories for use as War Reserves Stocks by Allies (WRSA) or other foreign countries (other than NATO). Most defense articles added to stockpiles under this ceiling will come from existing stocks.
In FY 2006, it is anticipated that no defense articles will be added to existing stockpiles as items are in sufficient supply to provide the necessary support.
570
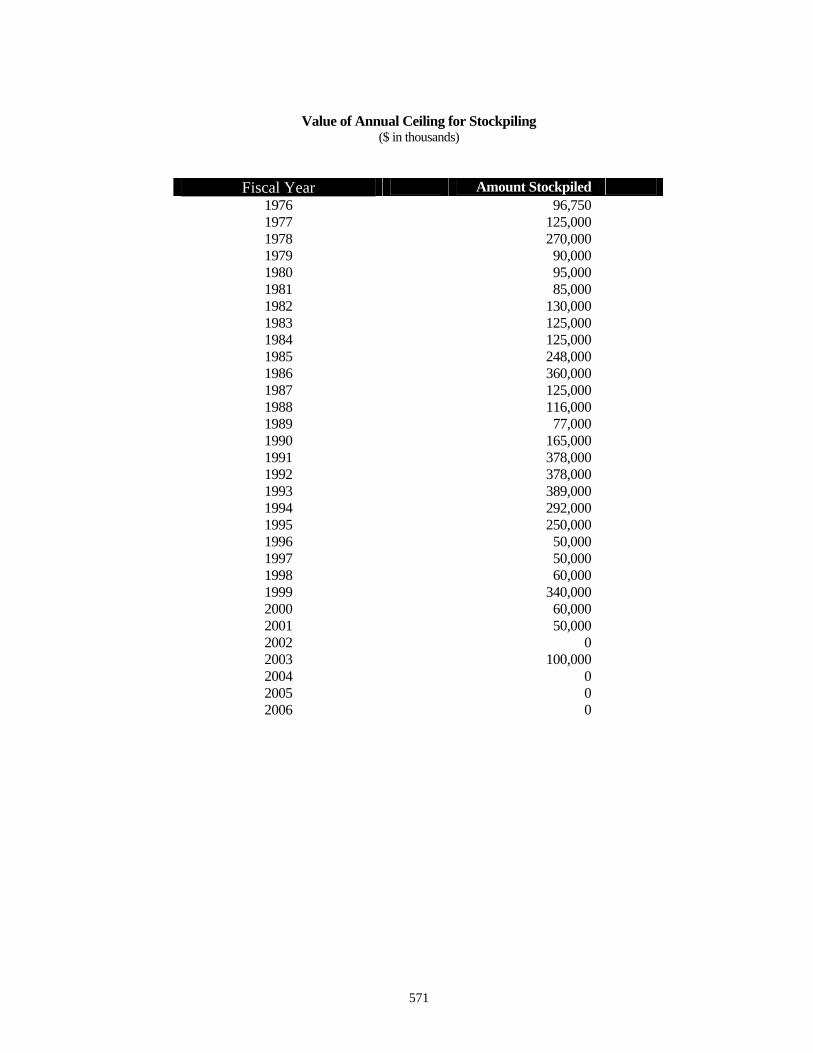
Value of Annual Ceiling for Stockpiling ($ in thousands)
Fiscal Year Amount Stockpiled 1976 96,750 1977 125,000 1978 270,000 1979 90,000 1980 95,000 1981 85,000 1982 130,000 1983 125,000 1984 125,000 1985 248,000 1986 360,000 1987 125,000 1988 116,000 1989 77,000 1990 165,000 1991 378,000 1992 378,000 1993 389,000 1994 292,000 1995 250,000 1996 50,000 1997 50,000 1998 60,000 1999 340,000 2000 60,000 2001 50,000 2002 0 2003 100,000 2004 0 2005 0 2006 0
571
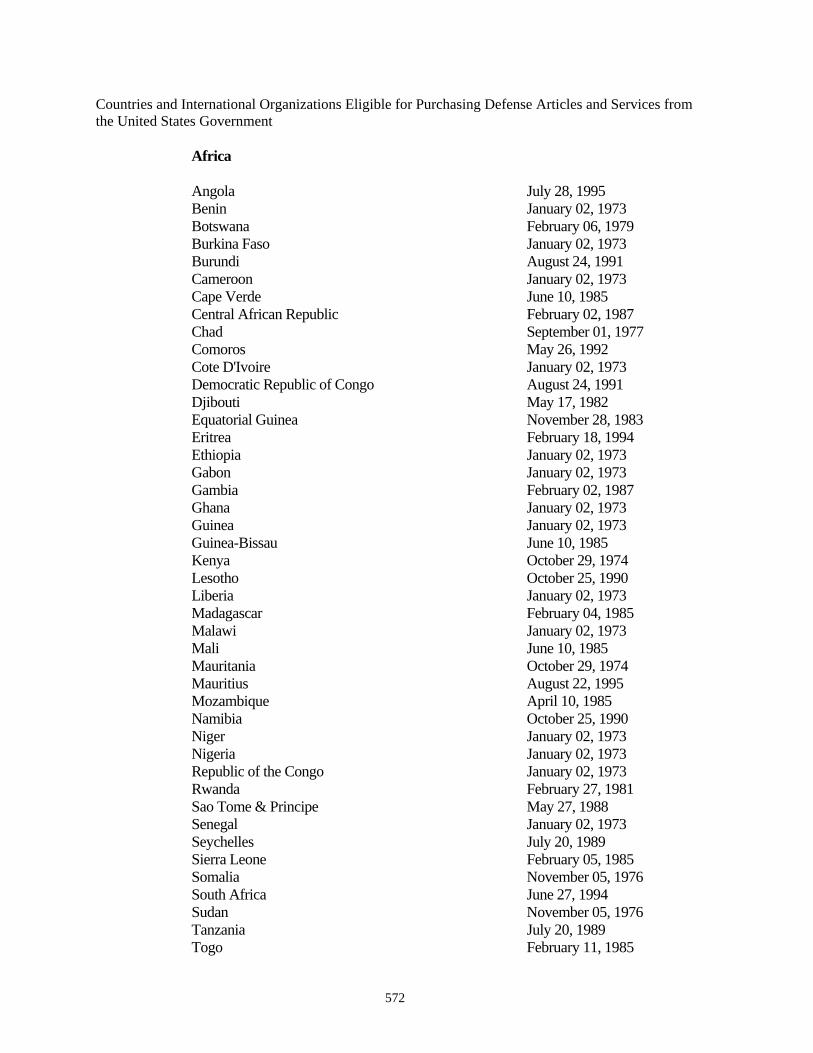
Countries and International Organizations Eligible for Purchasing Defense Articles and Services from the United States Government
Africa
Angola Benin Botswana Burkina Faso Burundi Cameroon Cape Verde Central African Republic Chad Comoros Cote D'Ivoire Democratic Republic of Congo Djibouti Equatorial Guinea Eritrea Ethiopia Gabon Gambia Ghana Guinea Guinea-Bissau Kenya Lesotho Liberia Madagascar Malawi Mali Mauritania Mauritius Mozambique Namibia Niger Nigeria Republic of the Congo Rwanda Sao Tome & Principe Senegal Seychelles Sierra Leone Somalia South Africa Sudan Tanzania Togo
July 28, 1995January 02, 1973 February 06, 1979 January 02, 1973 August 24, 1991 January 02, 1973 June 10, 1985 February 02, 1987 September 01, 1977 May 26, 1992 January 02, 1973 August 24, 1991 May 17, 1982 November 28, 1983 February 18, 1994 January 02, 1973 January 02, 1973 February 02, 1987 January 02, 1973 January 02, 1973 June 10, 1985 October 29, 1974 October 25, 1990 January 02, 1973 February 04, 1985 January 02, 1973 June 10, 1985 October 29, 1974 August 22, 1995 April 10, 1985 October 25, 1990 January 02, 1973 January 02, 1973 January 02, 1973 February 27, 1981 May 27, 1988 January 02, 1973 July 20, 1989 February 05, 1985 November 05, 1976 June 27, 1994 November 05, 1976 July 20, 1989 February 11, 1985
572
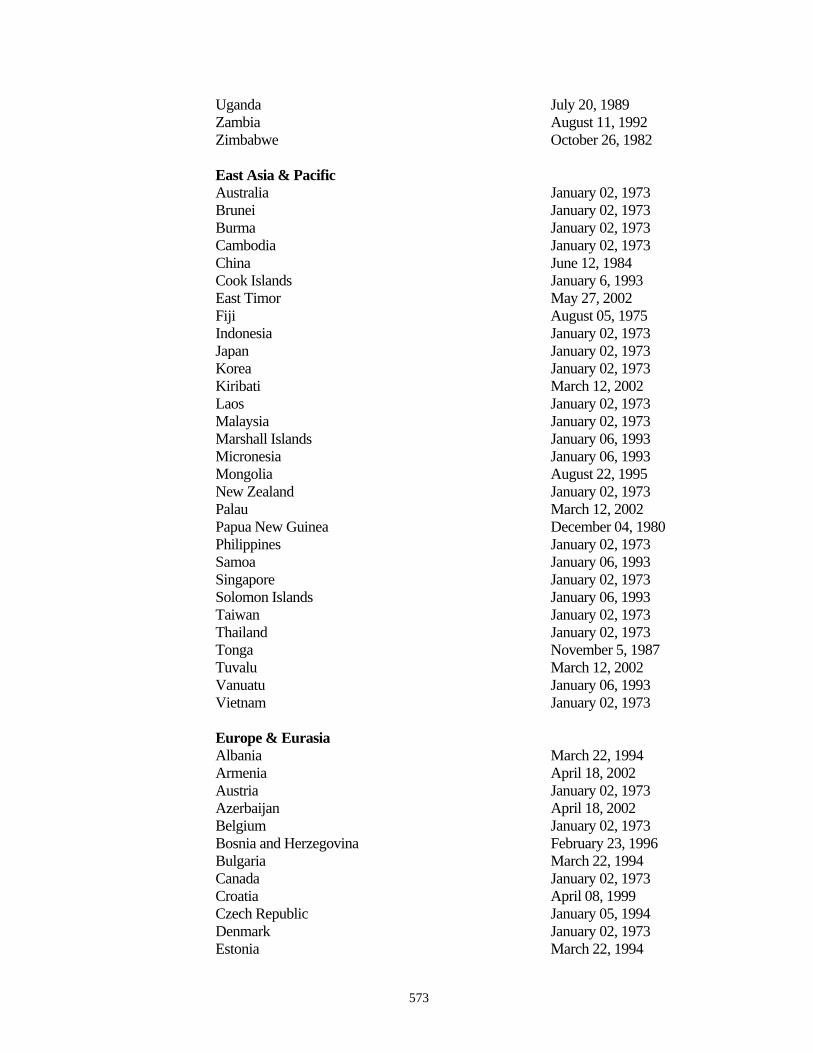
Uganda Zambia Zimbabwe
East Asia & Pacific AustraliaBrunei Burma Cambodia China Cook Islands East Timor Fiji Indonesia Japan Korea Kiribati Laos Malaysia Marshall Islands Micronesia Mongolia New Zealand Palau Papua New Guinea Philippines Samoa Singapore Solomon Islands Taiwan Thailand TongaTuvalu Vanuatu Vietnam
Europe & Eurasia Albania Armenia Austria Azerbaijan Belgium Bosnia and Herzegovina Bulgaria Canada Croatia Czech Republic Denmark Estonia
July 20, 1989 August 11, 1992 October 26, 1982
January 02, 1973 January 02, 1973 January 02, 1973 January 02, 1973 June 12, 1984 January 6, 1993 May 27, 2002 August 05, 1975 January 02, 1973 January 02, 1973 January 02, 1973 March 12, 2002 January 02, 1973 January 02, 1973 January 06, 1993 January 06, 1993 August 22, 1995 January 02, 1973 March 12, 2002 December 04, 1980 January 02, 1973 January 06, 1993 January 02, 1973 January 06, 1993 January 02, 1973 January 02, 1973
November 5, 1987 March 12, 2002 January 06, 1993 January 02, 1973
March 22, 1994 April 18, 2002 January 02, 1973 April 18, 2002 January 02, 1973 February 23, 1996 March 22, 1994 January 02, 1973 April 08, 1999 January 05, 1994 January 02, 1973 March 22, 1994
573
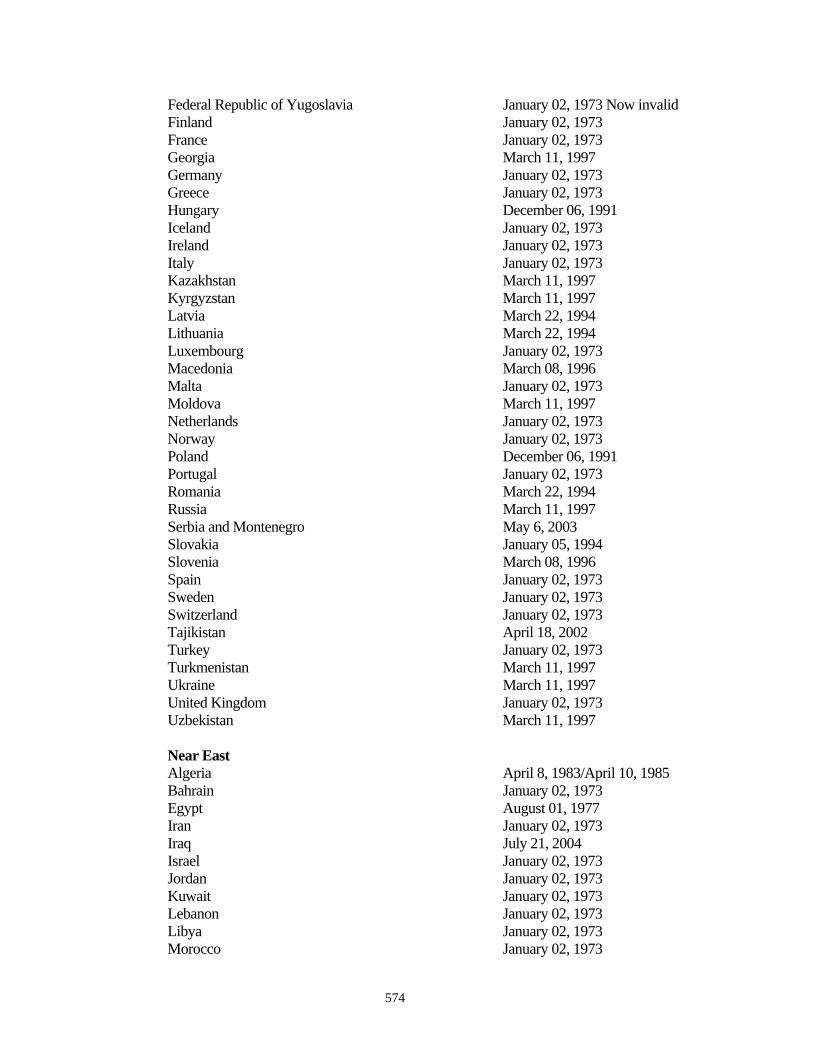
Federal Republic of Yugoslavia Finland France Georgia Germany Greece Hungary Iceland Ireland Italy Kazakhstan Kyrgyzstan Latvia Lithuania Luxembourg Macedonia Malta Moldova Netherlands Norway Poland Portugal Romania Russia Serbia and Montenegro Slovakia Slovenia Spain Sweden Switzerland Tajikistan Turkey Turkmenistan Ukraine United Kingdom Uzbekistan
Near East Algeria Bahrain Egypt Iran Iraq Israel Jordan Kuwait Lebanon Libya Morocco
January 02, 1973 Now invalid January 02, 1973 January 02, 1973 March 11, 1997 January 02, 1973 January 02, 1973 December 06, 1991 January 02, 1973 January 02, 1973 January 02, 1973 March 11, 1997 March 11, 1997 March 22, 1994 March 22, 1994 January 02, 1973 March 08, 1996 January 02, 1973 March 11, 1997 January 02, 1973 January 02, 1973 December 06, 1991 January 02, 1973 March 22, 1994 March 11, 1997 May 6, 2003 January 05, 1994 March 08, 1996 January 02, 1973 January 02, 1973 January 02, 1973 April 18, 2002 January 02, 1973 March 11, 1997 March 11, 1997 January 02, 1973 March 11, 1997
April 8, 1983/April 10, 1985 January 02, 1973 August 01, 1977 January 02, 1973 July 21, 2004 January 02, 1973 January 02, 1973 January 02, 1973 January 02, 1973 January 02, 1973 January 02, 1973
574
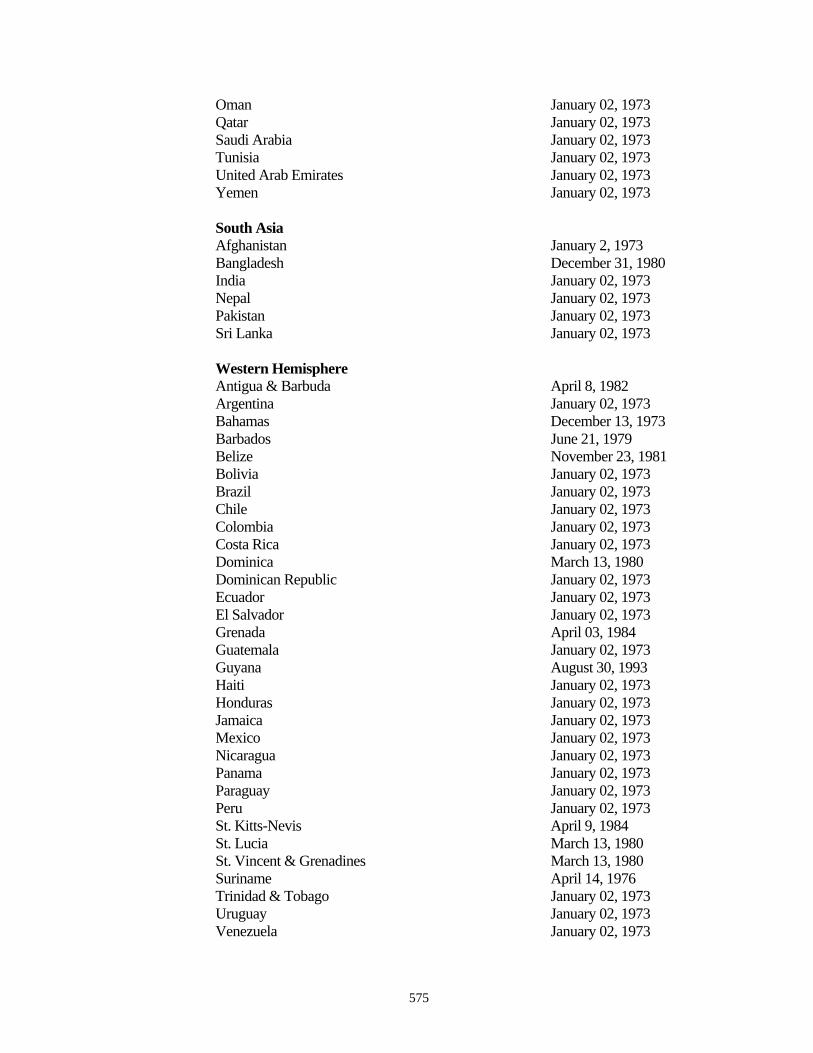
Oman Qatar Saudi Arabia Tunisia United Arab Emirates Yemen
South Asia Afghanistan Bangladesh India Nepal Pakistan Sri Lanka
Western Hemisphere Antigua & Barbuda Argentina Bahamas Barbados Belize Bolivia Brazil Chile Colombia Costa Rica Dominica Dominican Republic Ecuador El Salvador Grenada Guatemala Guyana Haiti Honduras Jamaica Mexico Nicaragua Panama Paraguay Peru St. Kitts-Nevis St. Lucia St. Vincent & Grenadines Suriname Trinidad & Tobago Uruguay Venezuela
January 02, 1973 January 02, 1973 January 02, 1973 January 02, 1973 January 02, 1973 January 02, 1973
January 2, 1973 December 31, 1980 January 02, 1973 January 02, 1973 January 02, 1973 January 02, 1973
April 8, 1982 January 02, 1973 December 13, 1973 June 21, 1979 November 23, 1981 January 02, 1973 January 02, 1973 January 02, 1973 January 02, 1973 January 02, 1973 March 13, 1980 January 02, 1973 January 02, 1973 January 02, 1973 April 03, 1984 January 02, 1973 August 30, 1993 January 02, 1973 January 02, 1973 January 02, 1973 January 02, 1973 January 02, 1973 January 02, 1973 January 02, 1973 January 02, 1973 April 9, 1984 March 13, 1980 March 13, 1980 April 14, 1976 January 02, 1973 January 02, 1973 January 02, 1973
575
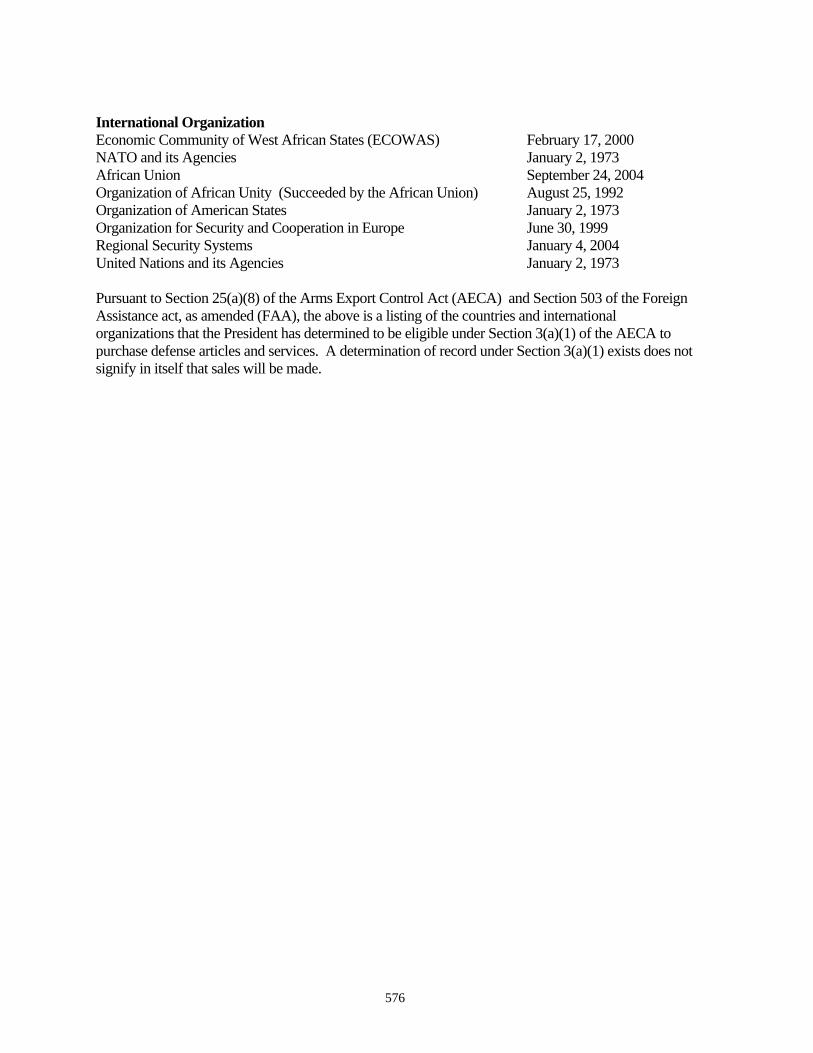
International Organization Economic Community of West African States (ECOWAS) February 17, 2000 NATO and its Agencies January 2, 1973 African Union September 24, 2004 Organization of African Unity (Succeeded by the African Union) August 25, 1992 Organization of American States January 2, 1973 Organization for Security and Cooperation in Europe June 30, 1999 Regional Security Systems January 4, 2004 United Nations and its Agencies January 2, 1973
Pursuant to Section 25(a)(8) of the Arms Export Control Act (AECA) and Section 503 of the Foreign Assistance act, as amended (FAA), the above is a listing of the countries and international organizations that the President has determined to be eligible under Section 3(a)(1) of the AECA to purchase defense articles and services. A determination of record under Section 3(a)(1) exists does not signify in itself that sales will be made.
576
End-Use Monitoring of Defense Articles and Defense Services Government to Government Services
Introduction
This report describes the actions that the Department of Defense took in the past fiscal year to comply with its end-use monitoring requirement in accordance with the Arms Export Control Act. In 1996, Congress amended [Public Law 104-164] the Arms Export Control Act (AECA) with Section 40A [22 U.S.C. 2785] which require “…to the extent practicable, such program shall be designed to provide reasonable assurances that the recipient is complying with the requirements imposed by the United States Government with respect to the use, transfers, and security of defense articles and monitoring of U.S. arms transfers, and security of defense articles and services.” Section 40A also requires an annual report to Congress on the actions taken to implement the end-use monitoring program to include detailed accounting of costs and number of personnel associated with the program.
Department of Defense (DoD) End-Use Monitoring (EUM) - Golden Sentry
The Department of Defense Golden Sentry EUM program is responsible for monitoring government-to-government transfers to ensure that the defense articles and services get to the right purchasers and that defense articles and services provided by the U.S. government are utilized and safeguarded in accordance with the terms and conditions for the transfers. Primarily, Golden Sentry’s objectives are to minimize security risks to the U.S., its friends and allies, and to ensure compliance with the technology control requirements that are associated with U.S.-origin arms transfers via government-to-government programs.
DoD Processes Prior to Any Transfer- Pre-checks and Vetting
There is no more thorough debate during a sensitive arms transfer than that which takes place within the Department of Defense and at State Department before we come to consensus in support of a sensitive arms transfer. In view of the serious consequences of the proliferation of dangerous weapons and technologies, we believe by ‘front-loading’ this array of processes and procedures we mitigate these risks.
The following are highlights from Lieutenant General Tome Walters, then Director of DSCA, appearance before the Congressional Committee on Government Reform Subcommittee on National Security, Emerging Threats and International Relations on 9 March 2003: “Each proposed transfer is thoroughly vetted by many different organizations and offices to ensure releasability, disclosure, and other concerns are addressed. The most important restrictions placed on these exports, indeed the fundamental elements of the U.S. export control regime, involve establishing the trustworthiness of the end-user and the actual “end-use” before approval of any defense article’s transfer. Furthermore, our foreign partners’ requests for significant military equipment are coordinated closely with the combatant commanders and the U.S. country team. The U.S. country team must assess several aspects of the transfer to include political impacts in the region as well as the ability of the host nation and the security assistance organization in country to properly perform their end-use monitoring responsibilities. The endorsement of the combatant commander and consistency with Theater Security Cooperation strategy and implementation plans are critical. During this “pre-sale” process, determinations are made as to whether a country has the will and the capability to secure, account for, and operate these systems within the requirements established by the United States. For some systems, for example the items that have been identified for Enhanced EUM, approval must be obtained from the National Disclosure Policy Committee for release to most of the countries. Finally, formal Congressional Notification is required prior to any offer being made and these notifications clearly
577
identify the customer and the capability being proposed for transfer and provide an opportunity for further discussion or rejection of a proposed transfer.”
DoD Processes During Transfer- Government-to-Government Agreements
When materiel, services, or training are provided under Foreign Military Sales, there is a government-to-government agreement (known in our terminology as a Letter of Offer and Acceptance or “LOA”) between the United States and the foreign government or international organization. This agreement spells out the type and quantities of items to be sold as well as any unique end-use monitoring requirements that might be necessary based on the complexity or sensitivity of the actual equipment or technologies being provided. These notes or LOA conditions may require the country to secure, account for, and operate the systems in accordance with provisos that equal the requirements of the U.S. Military Departments. The conditions of the LOA may also inform the country that the USG may travel in country to physically inventory or otherwise monitor the use of specific types of equipment---either as part of routine visits or to verify reports of unauthorized use---and by signing the document they agree to these conditions. While we must be sensitive to issues of sovereignty with our foreign friends and allies, they must understand that we always reserve the right to monitor and ensure compliance with the articles and services we provide. DSCA processed approximately 3,698 LOAs in FY04 with 463 rejects/returns to the implementing agencies for policy and/or administrative reasons.
DoD Processes After Transfer - End-Use Monitoring and Compliance
The purpose of the “Golden Sentry” program is to scrutinize the foreign purchaser’s use of defense articles and services (to include training) to ensure their use is in compliance with the agreements under which they were provided. The “Golden Sentry” program is relatively new --- we formally implemented the program in 2001 --- and we are still in the process of fully putting procedures in place throughout the security assistance/cooperation community. The program levies monitoring and compliance requirements not only on the host nation, but also on our security assistance organizations as well as our military departments. It also provides for compliance visits where EUM “Tiger Teams” travel to countries to ensure proper end-use and accountability procedures are being used by our foreign partners and security assistance personnel.
DSCA’s priority is the Enhanced EUM program that monitors: man portable air defense systems (MANPADS), such as Stinger Missiles and gripstocks; long range, highly capable man portable land attack missiles (such as JAVELIN and Tube-Launched, Optically-Tracked, Wire-Guided (TOW-2B)); and beyond visual range air-to-air missiles (such as the AIM-120 AMRAAM). Some of the other items on the Enhanced EUM list include Night Vision Devices, Communications Security Equipment (COMSEC), and Grant Assistance defense articles and services provided under the provision of Section 505 of the FAA, e.g., Military Assistance Program (MAP), Foreign Military Financing et al. Additional Enhanced EUM items that were added in 2004 are: the AIM-9X Advanced Sidewinder and Harpoon Block II missiles and the entire family of precision guided munitions, i.e., Joint Stand-Off Weapons (JSOW) and Joint Direct Attack Munitions (JDAM). During recent EUM “Tiger Team” visits, DSCA also assessed and inventoried the AGM-84 Harpoon and AGM-114 Hellfire missiles.
EUM Guidance
DSCA has published three policy memoranda to promulgate clearly the direction of the EUM Golden Sentry program.
1. The first memorandum published was “End-Use Monitoring (EUM) Responsibilities in Support of the Department of Defense Golden Sentry EUM Program (DSCA Policy Memo 02-43),” dated 4 December 2002. This policy delineated the responsibilities of the security assistance/cooperation
578
community in support of the Golden Sentry program.
2. The second policy memorandum was titled “Revised Guidance for Stinger/Man Portable Air Defense Systems (MANPADS) (DSCA Policy Memo 03-10),” dated 4 June 2003. This memorandum increased the U.S. inventory requirement by the security assistance organizations from 5% to 100% annually of foreign Stinger missiles, grip stocks and essential components.
3. A third policy memorandum is titled “Golden Sentry End-Use Monitoring (EUM) Visits Policy (DSCA Policy memo 04-11) dated 2 April 2004. This memorandum provides defined guidance for the conduct of three types of EUM visits: Familiarization, Tiger Team and Investigative.
All of the policy memoranda are incorporated into the Security Assistance Management Manual (SAMM). Furthermore, in January 2005, DSCA will refine its guidance for implementation of DoD responsibilities in support of the Golden Sentry End-Use Monitoring program. Additionally, once staffing is completed, we will publish policy guidance that addresses how the EUM community shall budget funding for new Enhanced EUM requirements and end of year data reporting formats to more accurately meet future congressional reporting requirements for the Congressional Budget Justification (CBJ).
Efforts since FY2005 CBJ report
Resources: For FY05, DSCA has budgeted $1.4M for Enhanced EUM that is managed at DSCA Headquarters. In addition to the Program Manager hired in June 2002 and contractor support in 2003, in 2004 DSCA added a second full-time civilian employee and allocated funding for three more civilian employees in FY2005.
SAO EUM Workload Surveys: EUM activity was added to the annual Security Assistance Organization (SAO) tasking as a separate workload measure in 2003. A detailed explanation was developed to clarify which tasks performed by SAOs should be included in the EUM category, thereby capturing the resource expenditures associated with the performance of “Routine” and “Enhanced” EUM by the SAO.
579
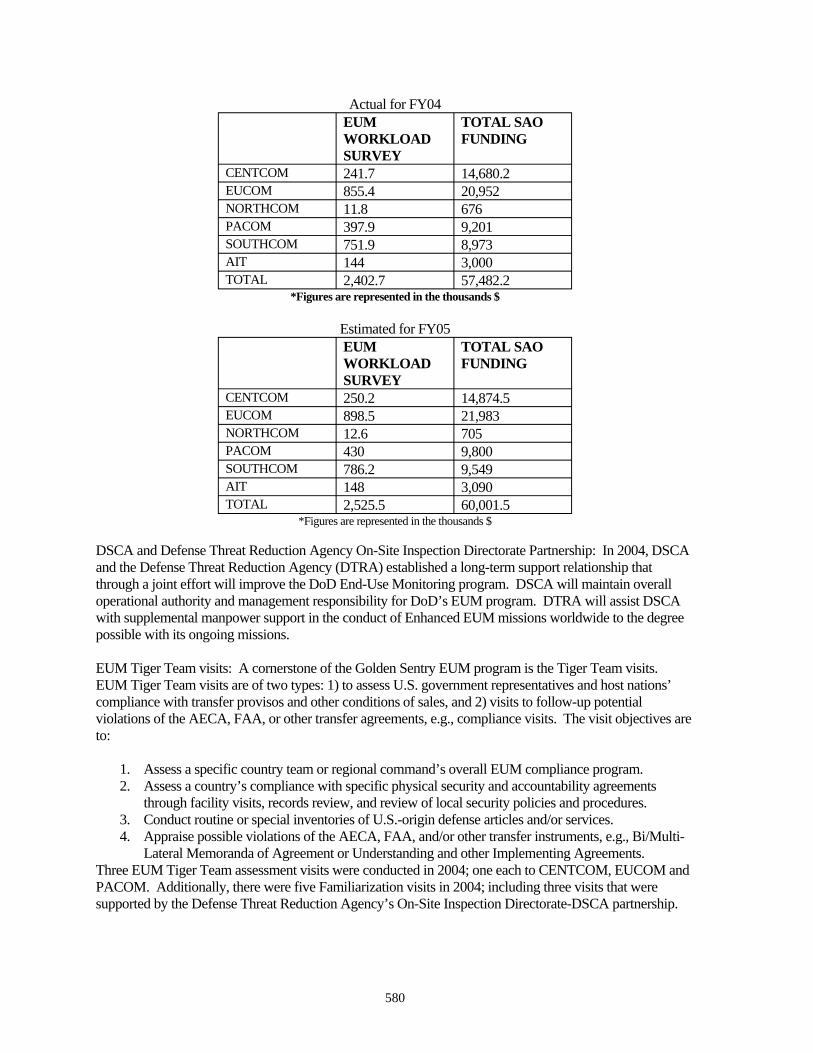
Actual for FY04 EUM WORKLOAD SURVEY
TOTAL SAO FUNDING
CENTCOM 241.7 14,680.2 EUCOM 855.4 20,952 NORTHCOM 11.8 676 PACOM 397.9 9,201 SOUTHCOM 751.9 8,973 AIT 144 3,000 TOTAL 2,402.7 57,482.2
*Figures are represented in the thousands $
Estimated for FY05 EUM WORKLOAD SURVEY
TOTAL SAO FUNDING
CENTCOM 250.2 14,874.5 EUCOM 898.5 21,983 NORTHCOM 12.6 705 PACOM 430 9,800 SOUTHCOM 786.2 9,549 AIT 148 3,090 TOTAL 2,525.5 60,001.5
*Figures are represented in the thousands $
DSCA and Defense Threat Reduction Agency On-Site Inspection Directorate Partnership: In 2004, DSCA and the Defense Threat Reduction Agency (DTRA) established a long-term support relationship that through a joint effort will improve the DoD End-Use Monitoring program. DSCA will maintain overall operational authority and management responsibility for DoD’s EUM program. DTRA will assist DSCA with supplemental manpower support in the conduct of Enhanced EUM missions worldwide to the degree possible with its ongoing missions.
EUM Tiger Team visits: A cornerstone of the Golden Sentry EUM program is the Tiger Team visits. EUM Tiger Team visits are of two types: 1) to assess U.S. government representatives and host nations’ compliance with transfer provisos and other conditions of sales, and 2) visits to follow-up potential violations of the AECA, FAA, or other transfer agreements, e.g., compliance visits. The visit objectives are to:
1. Assess a specific country team or regional command’s overall EUM compliance program. 2. Assess a country’s compliance with specific physical security and accountability agreements
through facility visits, records review, and review of local security policies and procedures. 3. Conduct routine or special inventories of U.S.-origin defense articles and/or services. 4. Appraise possible violations of the AECA, FAA, and/or other transfer instruments, e.g., Bi/Multi-
Lateral Memoranda of Agreement or Understanding and other Implementing Agreements. Three EUM Tiger Team assessment visits were conducted in 2004; one each to CENTCOM, EUCOM and PACOM. Additionally, there were five Familiarization visits in 2004; including three visits that were supported by the Defense Threat Reduction Agency’s On-Site Inspection Directorate-DSCA partnership.
580
The Way Ahead
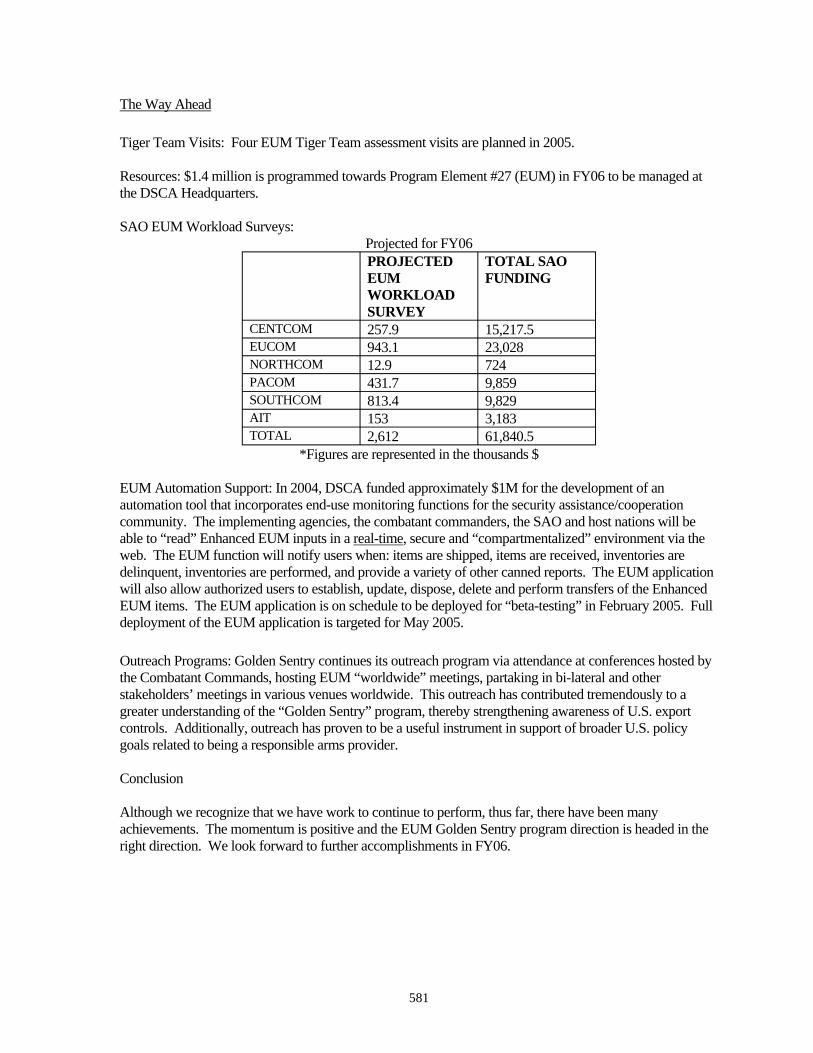
Tiger Team Visits: Four EUM Tiger Team assessment visits are planned in 2005.
Resources: $1.4 million is programmed towards Program Element #27 (EUM) in FY06 to be managed at the DSCA Headquarters.
SAO EUM Workload Surveys: Projected for FY06 PROJECTED EUM WORKLOAD SURVEY
TOTAL SAO FUNDING
CENTCOM 257.9 15,217.5 EUCOM 943.1 23,028 NORTHCOM 12.9 724 PACOM 431.7 9,859 SOUTHCOM 813.4 9,829 AIT 153 3,183 TOTAL 2,612 61,840.5
*Figures are represented in the thousands $
EUM Automation Support: In 2004, DSCA funded approximately $1M for the development of an automation tool that incorporates end-use monitoring functions for the security assistance/cooperation community. The implementing agencies, the combatant commanders, the SAO and host nations will be able to “read” Enhanced EUM inputs in a real-time, secure and “compartmentalized” environment via the web. The EUM function will notify users when: items are shipped, items are received, inventories are delinquent, inventories are performed, and provide a variety of other canned reports. The EUM application will also allow authorized users to establish, update, dispose, delete and perform transfers of the Enhanced EUM items. The EUM application is on schedule to be deployed for “beta-testing” in February 2005. Full deployment of the EUM application is targeted for May 2005.
Outreach Programs: Golden Sentry continues its outreach program via attendance at conferences hosted by the Combatant Commands, hosting EUM “worldwide” meetings, partaking in bi-lateral and other stakeholders’ meetings in various venues worldwide. This outreach has contributed tremendously to a greater understanding of the “Golden Sentry” program, thereby strengthening awareness of U.S. export controls. Additionally, outreach has proven to be a useful instrument in support of broader U.S. policy goals related to being a responsible arms provider.
Conclusion
Although we recognize that we have work to continue to perform, thus far, there have been many achievements. The momentum is positive and the EUM Golden Sentry program direction is headed in the right direction. We look forward to further accomplishments in FY06.
581
End-Use Monitoring of Defense Articles and Defense Services Commercial Exports FY04
This report describes the actions the Department of State took in the past fiscal year under Section 40A of the Arms Export Control Act (AECA) to implement end-use monitoring of the commercial export of defense articles, services, and related technical data subject to licensing under Section 38 of the AECA. The Directorate of Defense Trade Controls, in the Bureau of Political-Military Affairs (PM/DDTC), Department of State, is responsible for administering the International Traffic in Arms Regulations (ITAR) that implement the AECA. DDTC’s functions include registration of manufacturers, brokers, and exporters, licensing of commercial defense trade, overseeing compliance with U.S. export regulations, supporting U.S. law enforcement agencies in criminal investigations and prosecutions of AECA violations, as well as the end-use monitoring of licensed transactions. End-use monitoring entails pre-license or post-shipment checks on any party or other aspect of a defense trade transaction in order to verify its bona fides.
DDTC is currently authorized a full-time complement of 71 State Department personnel, which is supplemented by eight military officers and about 40 contract personnel working on defense trade licensing and end-use monitoring efforts. DDTC’s operational budget for FY 2004 was approximately $13.4 million.
Overseas Monitoring: The Blue Lantern Program
Initiated in September 1990 as the first systematic end-use check program, the Blue Lantern program has strengthened export controls and has proven to be a useful instrument in: 1) deterring diversions, 2) aiding the disruption of illicit supply networks used by rogue governments and international criminal organizations, and 3) helping the Department make informed licensing decisions and ensuring compliance with the AECA and the ITAR. End-use checks performed under the Blue Lantern program have significantly encouraged compliance with legal and regulatory requirements and have proven particularly effective in addressing the growing problem of gray arms trade (the use of fraudulent export documentation to acquire defense articles through legitimate channels for end-users inimical to U.S. interests). U.S. embassy personnel, or, in some instances, DDTC personnel, conduct Blue Lantern end-use checks abroad to verify the specific end-use and end-user of commercial defense exports and transfers controlled under the AECA.
Although most commercial defense trade is legitimate, a small percentage of cases can fall prey to gray arms manipulations. The goal of the Blue Lantern program is to prevent gray arms networks from misleading our export control process to obtain military items and technologies. The roughly 500 Blue Lantern checks conducted each year are the result of a targeted selection process to efficiently identify transactions that are most vulnerable to this type of diversion or misuse. License applications and approvals undergo review by Licensing and Compliance officers, who compare the details of the case with specified, time-tested criteria to determine a transaction’s suitability for a Blue Lantern check. DDTC reviews about 60,000 transactions annually, and the knowledge and trend analysis derived from the 500 checks is used by DDTC to better assess the national security concerns associated with the export of specific defense articles controlled by the U.S. Munitions List.1
Results of End-Use Checks in FY 2004
In FY 2004, DDTC initiated 530 checks, a record number in the history of the program. Blue Lantern checks performed in FY 2004 resulted in 93 unfavorable cases, which is the highest number of unfavorable
1 Due to the targeted approach of the Blue Lantern Program, caution must be used when using this data for statistical purposes.
582
checks in the history of the Blue Lantern program (representing nearly 18% of total checks conducted). A regional breakdown of the 530 checks performed in 2004 follows in Table 1. The regional breakdown in FY 2004 is comparable to FY 2003, although there was a slight increase in the percentage of Blue Lantern checks in Africa and a more substantial decrease in the percentage in the Americas.
Table 1:
23%
27%14%
Asia 24%
8%
i4%
Regional Breakdown of Blue Lantern Checks Initiated in FY 2004
Americas
Europe Near East
South Asia Afr ca
In response to a January 2004 report by the Government Accountability Office (GAO) on “Improvements Needed to Better Control Technology Exports for Cruise Missiles and Unmanned Aerial Vehicles,” DDTC increased substantially the number of Blue Lantern post-shipment checks on unmanned aerial vehicle (UAV) components for private and government end users. During FY 2004, DDTC initiated 18 checks on UAV components. Of these 18 checks, 10 are either underway or completed, and 2 have already come back with unfavorable results. The first unfavorable case was for UAV spare parts that were reportedly destined for a European military end-user. However, the Blue Lantern revealed that the spare parts were for testing by a private company. In the second case, the ostensible end-user in Africa could not be located. Both cases have been referred to DDTC’s Enforcement Division for further action. Pursuant to the GAO Report, DDTC continues to target UAV licenses for Blue Lantern end-use checks.
Analysis of Unfavorable Checks by Commodity:
Of commodities involved in unfavorable determinations, the most prevalent remains firearms and ammunition, which together represented 18% (17/93) of unfavorable cases; this, however, represents a marked decrease from FY03 when firearms and ammunition cases constituted a full 49% (37/76) of unfavorable Blue Lanterns. The percentage of unfavorable checks involving aircraft spare parts at risk of diversion to prohibited countries such as China and Iran (who actively seek spare parts to circumvent U.S. embargoes and to increase the operational readiness of military aircraft in their inventories), jumped from 24% (18/76) in 2003 to 35% (33/93) in 2004. The increase in the percentage of unfavorable checks involving aircraft spare parts is also noteworthy because the number of checks conducted on aircraft spare parts remained the same as in 2003. The next category, electronics and communications equipment, captured 18% (17/93) of the unfavorable cases. The remaining unfavorable checks involved commodities such as missile spare parts, military training equipment, and night vision equipment.
583
Analysis of Unfavorable Checks by Region:
In FY 2004, countries in Asia comprised 45% percent of the unfavorable checks. This high proportion may be attributed to the greater number of checks overall conducted in this region in FY 2004. Europe, traditionally quite high in the number of unfavorable cases, decreased to 9% from 18% in 2003.
Table 2:
l
Asia
i3%
9% 5% 4%
Unfavorab e Checks by Region FY 2004
Americas 34%
45%
Afr ca Europe
Near East South Asia
Generally, the unfavorable cases in the Western Hemisphere region involved commodities such as firearms, ammunition, and explosives. Asia’s unfavorable cases revealed aircraft and helicopter spare parts, as well as electronics and communications equipment, to be in high demand.
Reasons for Unfavorable Checks in FY 2004:
In 38% of the unfavorable cases closed in 2004, the purported end-user did not order the items that were the subject of the inquiry. In 12% of the unfavorable cases, derogatory information was found on one or more of the parties involved. Misuse or unauthorized transfers were found in nearly 9% of the unfavorable cases. In 8% of unfavorable cases, the foreign end-user could not adequately justify the purchase of what was established by DDTC to be an excessive quantity of items requested. Also in 11% of the unfavorable cases, the foreign company was not found or company officials did not cooperate with the inquiry. Unfavorable Blue Lanterns are routinely referred to DDTC’s Enforcement Division (END) for coordination with the Department of Justice for possible criminal action or civil action within the Department.
The following examples illustrate the effectiveness of the Blue Lantern Program in FY 2004:
• A pre-license check on the export of gyroscopes to a Southeast Asian country for use in CASA 212 aircraft was returned with unfavorable results when the end-user, as well as the foreign consignee, denied ever placing the order. As a result, the licenses were not approved and future licenses involving those entities will be subject to additional scrutiny.
• A pre-license check on several requests to export F-5 aircraft parts to a Southeast Asian country via a known illicit trafficker in the Middle East revealed that the end-user had no contract with the foreign consignee. DDTC denied the licenses.
• A post-license check for the export of C-130 aircraft parts to a government in the Middle East via a Southeast Asian foreign intermediate consignee found that the government did not have either a
584

contract or a firm order with the company. DDTC updated information on the consignee in its “Watchlist” of entities suspected of illicit activities and/or requiring special scrutiny.
• A pre-license check for the export of gas masks to a South American country revealed that the end-user did not exist. DDTC denied the license and added the end-user to its Watchlist.
• A pre-license check for CH-47 helicopter spare parts to a European country found that the end-user never placed an order for the parts and had no relationship with the foreign consignee. Pending further review of this case by DDTC’s Licensing Division and END, DDTC added the foreign consignee to its Watchlist.
• A pre-license check involving pistols to be exported to a Central American country revealed that the end-user had been set up as a front company for another firearms retailer that was under investigation by the local government for export violations. DDTC denied the license and added both companies to its Watchlist.
Compliance/Enforcement: State-ICE Cooperation
Cooperation between the State Department and the Immigration and Customs Enforcement (ICE) bureau of the Department of Homeland Security (DHS) also plays a vital role in tackling and inhibiting gray arms activity. (ICE has authority to investigate criminal violations of the AECA.) In FY04, cooperative programs between State and ICE facilitated more than 923 commercial arms seizures at U.S. ports of exit totaling almost $136 million, a significant increase from the $106 million reported in FY 2003. ICE has two officers assigned to the State Department to coordinate Department support for criminal investigations and coordinate documents for prosecutions of the AECA.
Effective enforcement and compliance with U.S. regulations could not be possible without close cooperation between DHS – both ICE and its Customs and Border Protection (CBP) bureau – and the Directorate of Defense Trade Controls. The goal of this cooperative effort is the verification of licensed exports and the compliance of exporters. As part of this effort, DDTC electronically provides licensing data that allows for accurate, real-time monitoring by DHS officials of commercial arms moving in and out of the United States. Through ICE’s Operation Exodus, DDTC also provides authoritative opinions, rulings, and advice on a daily basis to ICE concerning licensing and other regulatory requirements.
585
Commercial Exports Licensed or Approved Under the Arms Export Control Act
The data in the following chart on commercial arms sales are compiled on the basis of information available to the Department as of January 2005. The first column, entitled “Actual Deliveries (preliminary)” shows the preliminary dollar value totals by destination of exports during fiscal year 2004. These export totals which, in some cases, do not reflect defense training and technical assistance, are compiled from expired or completed licenses returned to the Department by exporters or the Department of Homeland Security/Customs Border Patrol (CBP) and export shipment data recently made available to the State Department via the Automated Export System (AES). The totals are very preliminary because (a) the vast majority of State Department munitions export licenses are approved for four calendar years, thereby allowing shipments to span five fiscal years, and are not returned to the State Department until usage of the licenses usage is completed or the licenses expire; and (b) the fiscal year 2004 AES information is still being compiled and under review for accuracy. Thus, information on “Actual Deliveries (preliminary)” in this chart is incomplete. In the future, information collected through AES and reporting of technical data exports directly to the State Department will allow a more accurate portrayal of “up-to-date” export transactions. For further information, see also the classified annex to this document.
The second and third columns in the chart show the estimated dollar value totals by destination of possible deliveries in fiscal years 2005 and 2006. These estimates are based primarily on the dollar values of licenses approved for each destination during the prior two fiscal years (the dollar values of the authorized licenses are not shown here but captured in reports to the Congress made pursuant to section 655 of the Foreign Assistance Act of 1961, as amended. The value of defense export authorizations in FY 2004 amounted to $22,426,833,938 billion in defense articles and $44,729,024,937 billion in defense services. Not all export approvals result in signed contracts and actual exports. Key factors that affect the final export value include the availability of the licensed item for shipping, and how quickly the license is returned to the Department. (See also the classified annex.) Other factors that cannot be quantified are economic and security considerations at the final destinations, as well as changing U.S. foreign policy and national security considerations. In exercising defense trade controls, the Department administers embargoes on commercial arms transfers to more than two dozen countries in any given year as a result of U.S. law and foreign policy/national security considerations and UN Security Council decisions. Several other countries are subject to special scrutiny due to non-proliferation, regional security (e.g., disputed territories or borders), or human rights concerns. Countries for whom there were no actual deliveries in fiscal year 2004 and which had no authorized license for fiscal years 2003 and 2004 do not appear in this report.
The procedures for estimating defense commercial sales for out years (fiscal years 2005 and 2006) were revised for the 1995 CPD. Previous procedures for such estimates called for extrapolating exports for the first year at forty percent of the actual dollar value of licenses approved in the previous two fiscal years. The second out year’s exports would have been estimated at sixty percent of that two-year total.
However, based on historical data, the Department now estimates exports for the first out year (fiscal year 2005) to be ten percent of the total dollar value of approved licenses for the previous two fiscal years (fiscal years 2003 and 2004). The exports for the second out year (fiscal year 2006) are estimated to be fifty percent of those for fiscal year 2004.
586
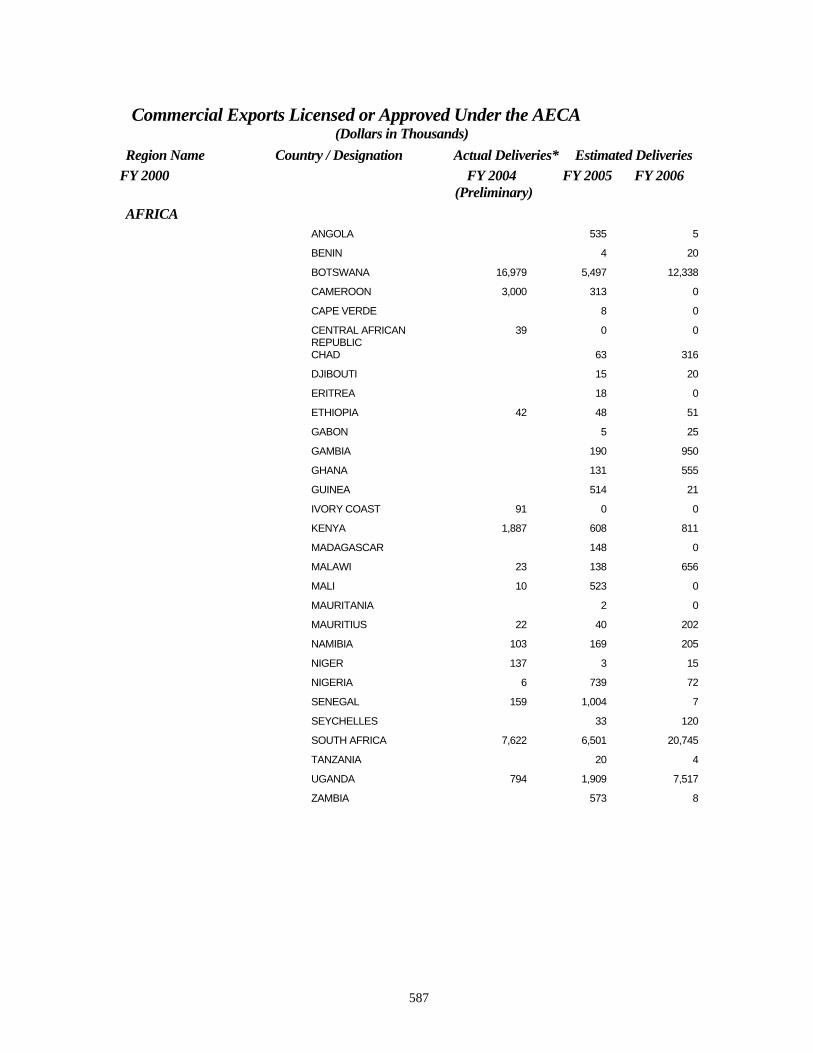
Commercial Exports Licensed or Approved Under the AECA (Dollars in Thousands)
Region Name FY 2000
AFRICA
Country / Designation
ANGOLA
BENIN
BOTSWANA
CAMEROON
CAPE VERDE
CENTRAL AFRICAN REPUBLIC CHAD
DJIBOUTI
ERITREA
ETHIOPIA
GABON
GAMBIA
GHANA
GUINEA
IVORY COAST
KENYA
MADAGASCAR
MALAWI
MALI
MAURITANIA
MAURITIUS
NAMIBIA
NIGER
NIGERIA
SENEGAL
SEYCHELLES
SOUTH AFRICA
TANZANIA
UGANDA
ZAMBIA
Actual Deliveries* Estimated Deliveries FY 2004 FY 2005 FY 2006
(Preliminary)
535 5
4 20
16,979 5,497 12,338
3,000 313 0
8 0
39 0 0
63 316
15 20
18 0
42 48 51
5 25
190 950
131 555
514 21
91 0 0
1,887 608 811
148 0
23 138 656
10 523 0
2 0
22 40 202
103 169 205
137 3 15
6 739 72
159 1,004 7
33 120
7,622 6,501 20,745
20 4
794 1,909 7,517
573 8
587
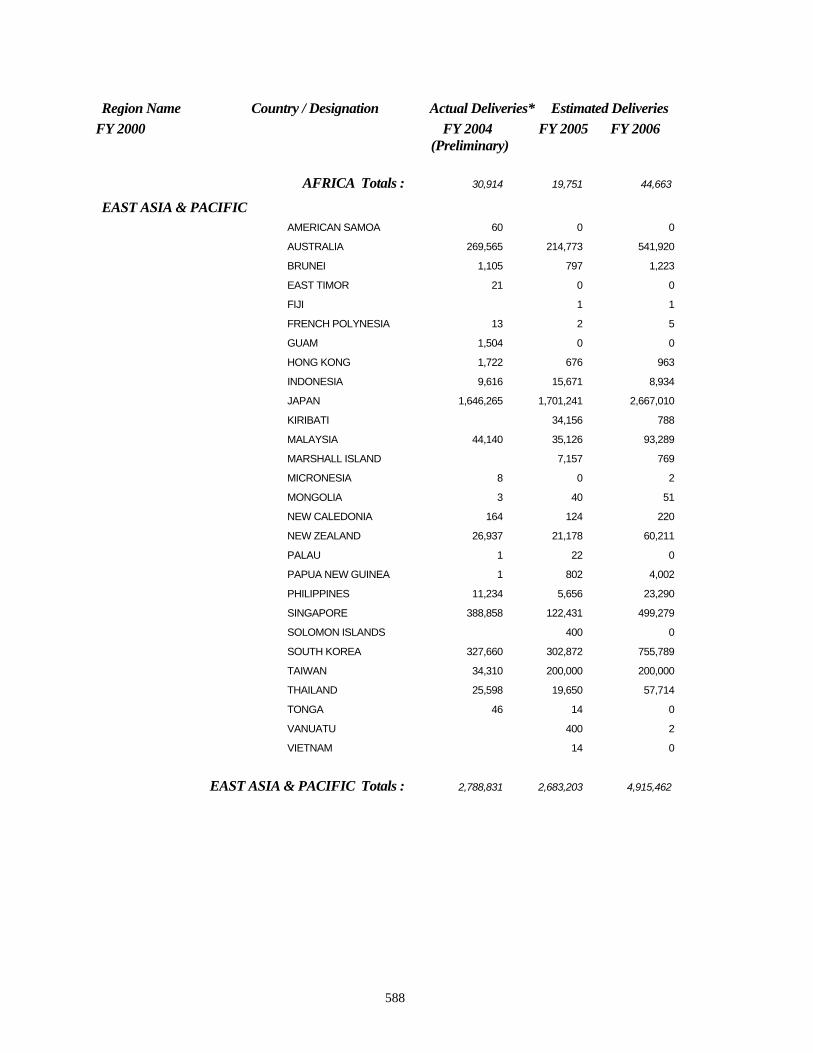
Region Name Country / Designation Actual Deliveries* Estimated Deliveries FY 2000 FY 2004 FY 2005 FY 2006
(Preliminary)
AFRICA Totals : 30,914 19,751 44,663
EAST ASIA & PACIFIC AMERICAN SAMOA 60 0 0
AUSTRALIA 269,565 214,773 541,920
BRUNEI 1,105 797 1,223
EAST TIMOR 21 0 0
FIJI 1 1
FRENCH POLYNESIA 13 2 5
GUAM 1,504 0 0
HONG KONG 1,722 676 963
INDONESIA 9,616 15,671 8,934
JAPAN 1,646,265 1,701,241 2,667,010
KIRIBATI 34,156 788
MALAYSIA 44,140 35,126 93,289
MARSHALL ISLAND 7,157 769
MICRONESIA 8 0 2
MONGOLIA 3 40 51
NEW CALEDONIA 164 124 220
NEW ZEALAND 26,937 21,178 60,211
PALAU 1 22 0
PAPUA NEW GUINEA 1 802 4,002
PHILIPPINES 11,234 5,656 23,290
SINGAPORE 388,858 122,431 499,279
SOLOMON ISLANDS 400 0
SOUTH KOREA 327,660 302,872 755,789
TAIWAN 34,310 200,000 200,000
THAILAND 25,598 19,650 57,714
TONGA 46 14 0
VANUATU 400 2
VIETNAM 14 0
EAST ASIA & PACIFIC Totals : 2,788,831 2,683,203 4,915,462
588
Region Name Country / Designation Actual Deliveries* Estimated Deliveries FY 2000 FY 2004 FY 2005 FY 2006
(Preliminary) EUROPE & NIS
ALBANIA 24 105 526
ANDORRA 6 11 17
ARMENIA 32 158
AUSTRIA 2,371 3,585 11,311
AZERBAIJAN 17 199 525
BELGIUM 46,061 26,281 66,174
BOSNIA HERZEGOVINA 3 127 86
BULGARIA 4,590 947 3,180
CROATIA 41,567 392 1,621
CYPRUS 40 555 1,485
CZECH REPUBLIC 5,361 3,006 8,962
DENMARK 310,393 51,685 84,165
ESTONIA 431 354 1,524
FINLAND 24,885 9,284 23,514
FRANCE 126,987 97,366 182,250
GEORGIA 59 461 0
GERMANY 285,608 443,559 1,141,089
GIBRALTAR 3 0
GREECE 162,874 142,015 208,505
GREENLAND 193 205 848
HUNGARY 10,901 874 3,034
ICELAND 1,068 1,526 7,199
IRELAND 4,782 4,927 4,613
ITALY 403,176 244,485 839,378
KAZAKHSTAN 14 1,678 5,042
KYRGYZSTAN 24 178 348
LATVIA 3,671 1,508 813
LITHUANIA 149 210 196
LUXEMBOURG 38,970 27,308 90,424
MACEDONIA 4 73 1
MALTA 21 7 29
MOLDOVA 4 21 55
NETHERLANDS 52,827 328,138 1,486,464
589
Region Name Country / Designation Actual Deliveries* Estimated Deliveries FY 2000 FY 2004 FY 2005 FY 2006
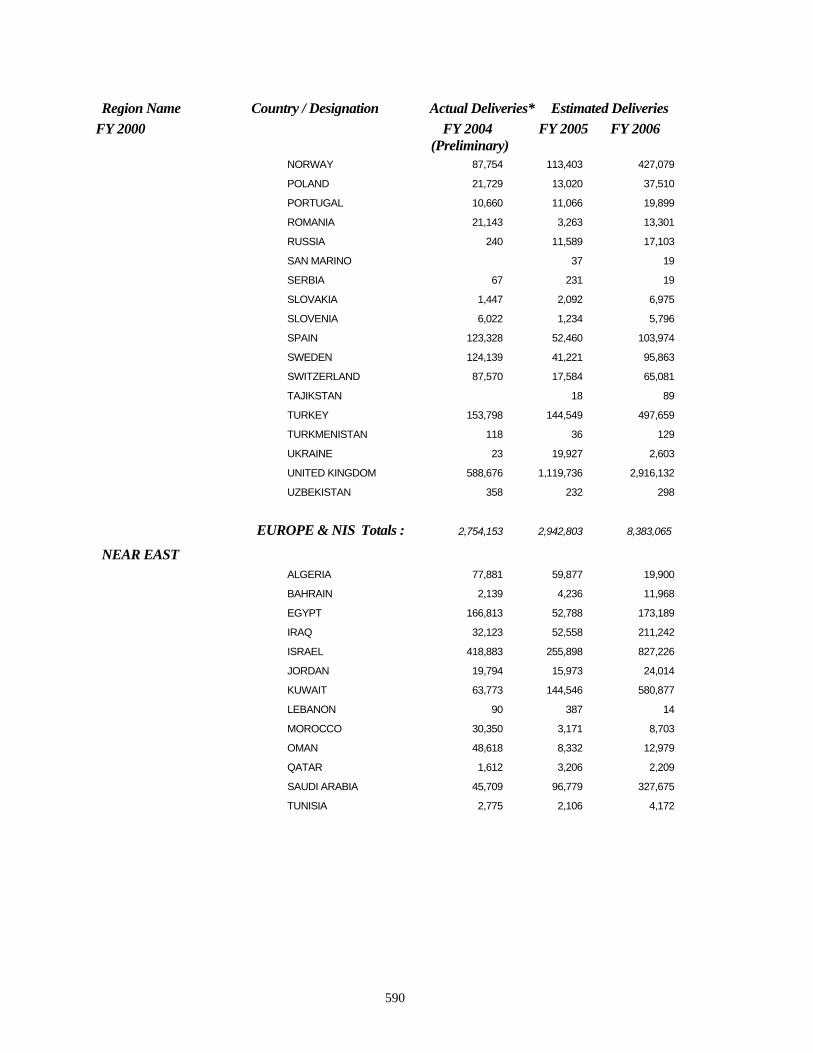
(Preliminary) NORWAY 87,754 113,403 427,079
POLAND 21,729 13,020 37,510
PORTUGAL 10,660 11,066 19,899
ROMANIA 21,143 3,263 13,301
RUSSIA 240 11,589 17,103
SAN MARINO 37 19
SERBIA 67 231 19
SLOVAKIA 1,447 2,092 6,975
SLOVENIA 6,022 1,234 5,796
SPAIN 123,328 52,460 103,974
SWEDEN 124,139 41,221 95,863
SWITZERLAND 87,570 17,584 65,081
TAJIKSTAN 18 89
TURKEY 153,798 144,549 497,659
TURKMENISTAN 118 36 129
UKRAINE 23 19,927 2,603
UNITED KINGDOM 588,676 1,119,736 2,916,132
UZBEKISTAN 358 232 298
EUROPE & NIS Totals : 2,754,153 2,942,803 8,383,065
NEAR EAST ALGERIA 77,881 59,877 19,900
BAHRAIN 2,139 4,236 11,968
EGYPT 166,813 52,788 173,189
IRAQ 32,123 52,558 211,242
ISRAEL 418,883 255,898 827,226
JORDAN 19,794 15,973 24,014
KUWAIT 63,773 144,546 580,877
LEBANON 90 387 14
MOROCCO 30,350 3,171 8,703
OMAN 48,618 8,332 12,979
QATAR 1,612 3,206 2,209
SAUDI ARABIA 45,709 96,779 327,675
TUNISIA 2,775 2,106 4,172
590
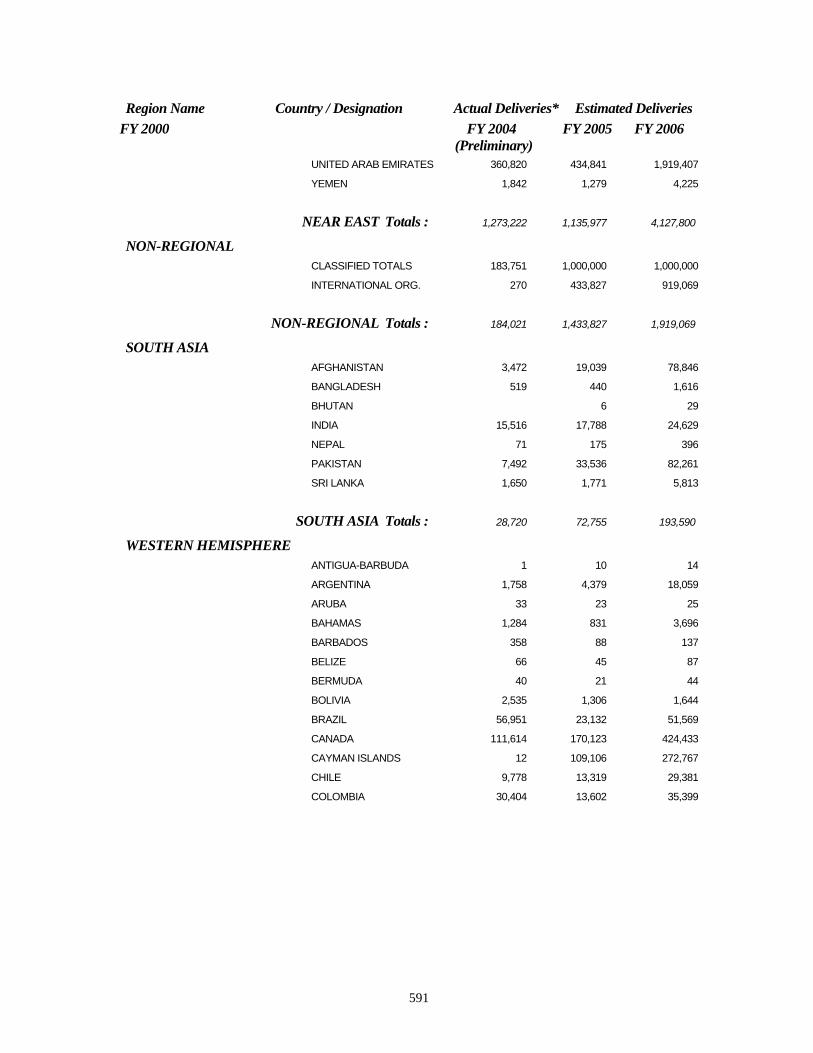
Region Name Country / Designation Actual Deliveries* Estimated Deliveries FY 2000 FY 2004 FY 2005 FY 2006
(Preliminary) UNITED ARAB EMIRATES 360,820 434,841 1,919,407
YEMEN 1,842 1,279 4,225
NEAR EAST Totals : 1,273,222 1,135,977 4,127,800
NON-REGIONAL CLASSIFIED TOTALS 183,751 1,000,000 1,000,000
INTERNATIONAL ORG. 270 433,827 919,069
NON-REGIONAL Totals : 184,021 1,433,827 1,919,069
SOUTH ASIA AFGHANISTAN 3,472 19,039 78,846
BANGLADESH 519 440 1,616
BHUTAN 6 29
INDIA 15,516 17,788 24,629
NEPAL 71 175 396
PAKISTAN 7,492 33,536 82,261
SRI LANKA 1,650 1,771 5,813
SOUTH ASIA Totals : 28,720 72,755 193,590
WESTERN HEMISPHERE ANTIGUA-BARBUDA 1 10 14
ARGENTINA 1,758 4,379 18,059
ARUBA 33 23 25
BAHAMAS 1,284 831 3,696
BARBADOS 358 88 137
BELIZE 66 45 87
BERMUDA 40 21 44
BOLIVIA 2,535 1,306 1,644
BRAZIL 56,951 23,132 51,569
CANADA 111,614 170,123 424,433
CAYMAN ISLANDS 12 109,106 272,767
CHILE 9,778 13,319 29,381
COLOMBIA 30,404 13,602 35,399
591
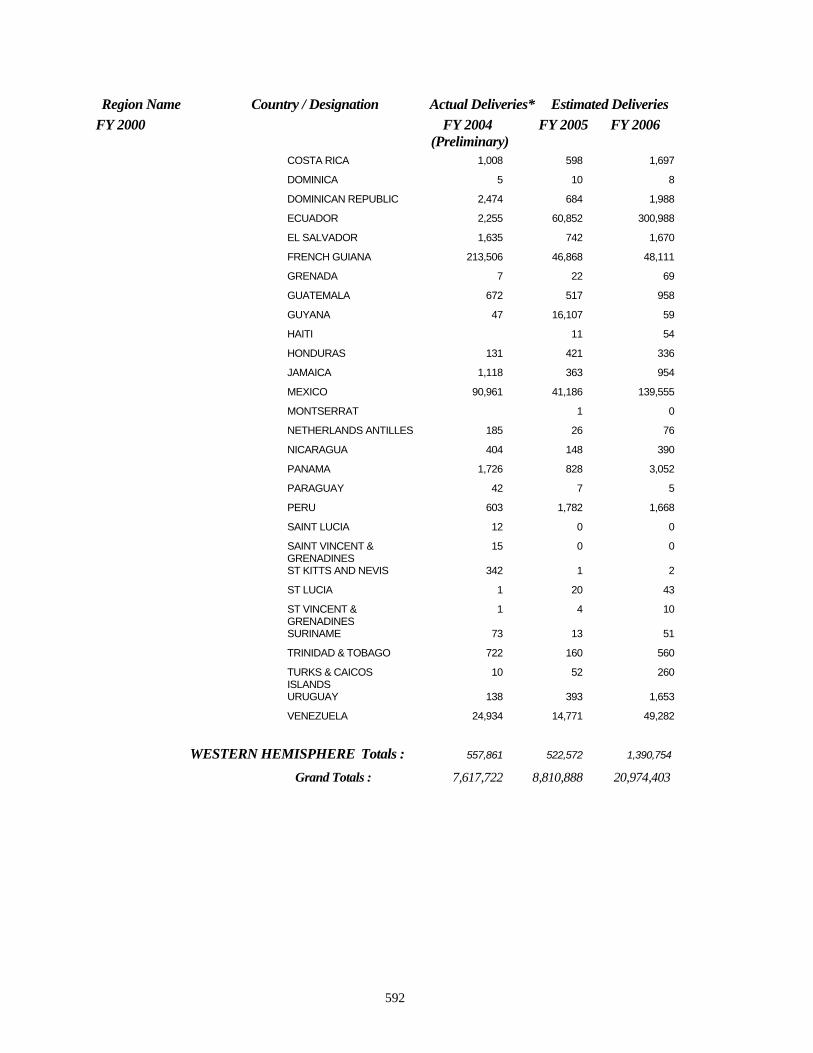
Region Name Country / Designation Actual Deliveries* Estimated Deliveries FY 2000 FY 2004 FY 2005 FY 2006
(Preliminary) COSTA RICA 1,008 598 1,697
DOMINICA 5 10 8
DOMINICAN REPUBLIC 2,474 684 1,988
ECUADOR 2,255 60,852 300,988
EL SALVADOR 1,635 742 1,670
FRENCH GUIANA 213,506 46,868 48,111
GRENADA 7 22 69
GUATEMALA 672 517 958
GUYANA 47 16,107 59
HAITI 11 54
HONDURAS 131 421 336
JAMAICA 1,118 363 954
MEXICO 90,961 41,186 139,555
MONTSERRAT 1 0
NETHERLANDS ANTILLES 185 26 76
NICARAGUA 404 148 390
PANAMA 1,726 828 3,052
PARAGUAY 42 7 5
PERU 603 1,782 1,668
SAINT LUCIA 12 0 0
SAINT VINCENT & 15 0 0 GRENADINES ST KITTS AND NEVIS 342 1 2
ST LUCIA 1 20 43
ST VINCENT & 1 4 10 GRENADINES SURINAME 73 13 51
TRINIDAD & TOBAGO 722 160 560
TURKS & CAICOS 10 52 260 ISLANDS URUGUAY 138 393 1,653
VENEZUELA 24,934 14,771 49,282
WESTERN HEMISPHERE Totals : 557,861 522,572 1,390,754
Grand Totals : 7,617,722 8,810,888 20,974,403
592
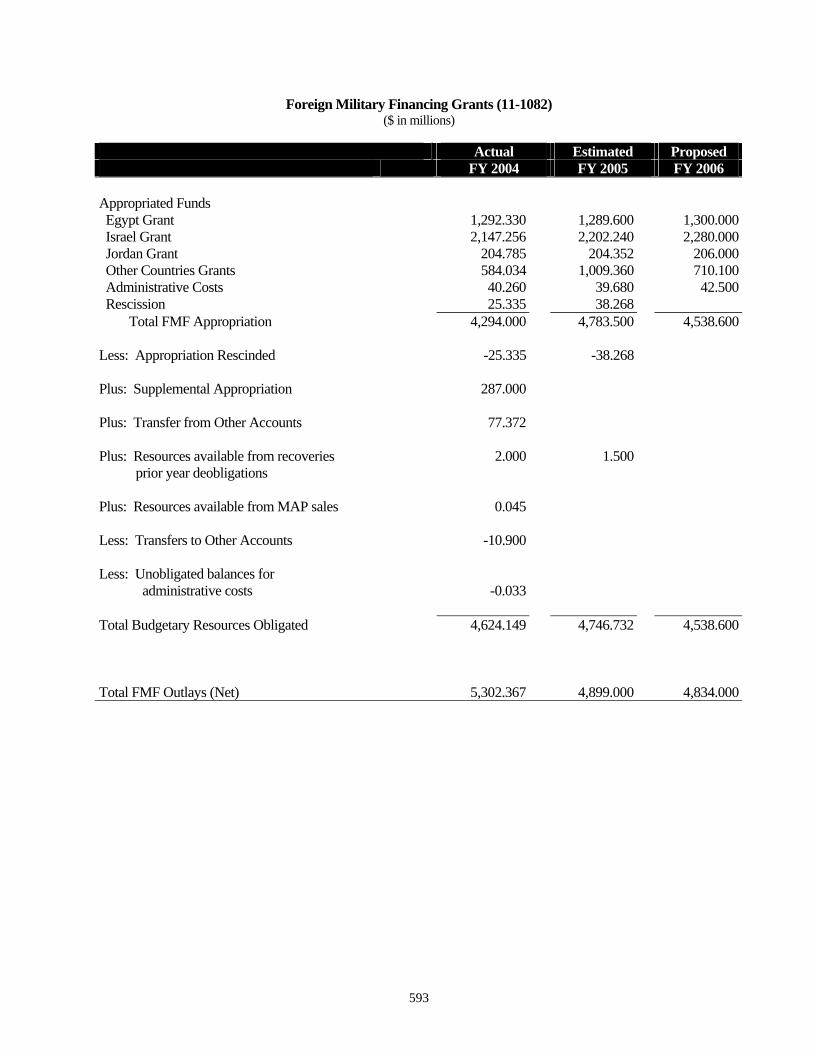
Foreign Military Financing Grants (11-1082) ($ in millions)
Actual Estimated Proposed FY 2004 FY 2005 FY 2006
Appropriated Funds Egypt Grant 1,292.330 1,289.600 1,300.000 Israel Grant 2,147.256 2,202.240 2,280.000 Jordan Grant 204.785 204.352 206.000 Other Countries Grants 584.034 1,009.360 710.100 Administrative Costs 40.260 39.680 42.500 Rescission 25.335 38.268
Total FMF Appropriation 4,294.000 4,783.500 4,538.600
Less: Appropriation Rescinded -25.335 -38.268
Plus: Supplemental Appropriation 287.000
Plus: Transfer from Other Accounts 77.372
Plus: Resources available from recoveries 2.000 1.500 prior year deobligations
Plus: Resources available from MAP sales 0.045
Less: Transfers to Other Accounts -10.900
Less: Unobligated balances for administrative costs -0.033
Total Budgetary Resources Obligated 4,624.149 4,746.732 4,538.600
Total FMF Outlays (Net) 5,302.367 4,899.000 4,834.000
593
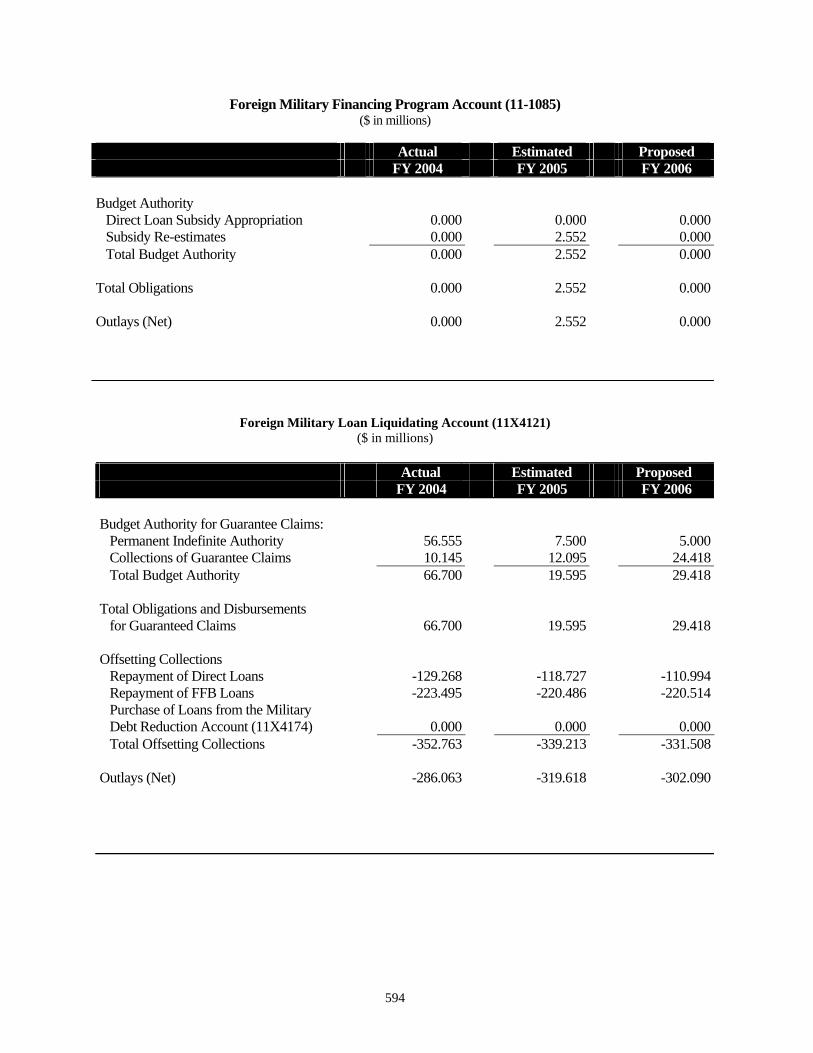
Foreign Military Financing Program Account (11-1085) ($ in millions)
Actual Estimated Proposed FY 2004 FY 2005 FY 2006
Budget Authority Direct Loan Subsidy Appropriation 0.000 0.000 0.000 Subsidy Re-estimates 0.000 2.552 0.000 Total Budget Authority 0.000 2.552 0.000
Total Obligations 0.000 2.552 0.000
Outlays (Net) 0.000 2.552 0.000
Foreign Military Loan Liquidating Account (11X4121) ($ in millions)
Actual Estimated Proposed FY 2004 FY 2005 FY 2006
Budget Authority for Guarantee Claims: Permanent Indefinite Authority 56.555 7.500 5.000 Collections of Guarantee Claims 10.145 12.095 24.418 Total Budget Authority 66.700 19.595 29.418
Total Obligations and Disbursements for Guaranteed Claims 66.700 19.595 29.418
Offsetting Collections Repayment of Direct Loans -129.268 -118.727 -110.994 Repayment of FFB Loans -223.495 -220.486 -220.514 Purchase of Loans from the Military Debt Reduction Account (11X4174) 0.000 0.000 0.000 Total Offsetting Collections -352.763 -339.213 -331.508
Outlays (Net) -286.063 -319.618 -302.090
594
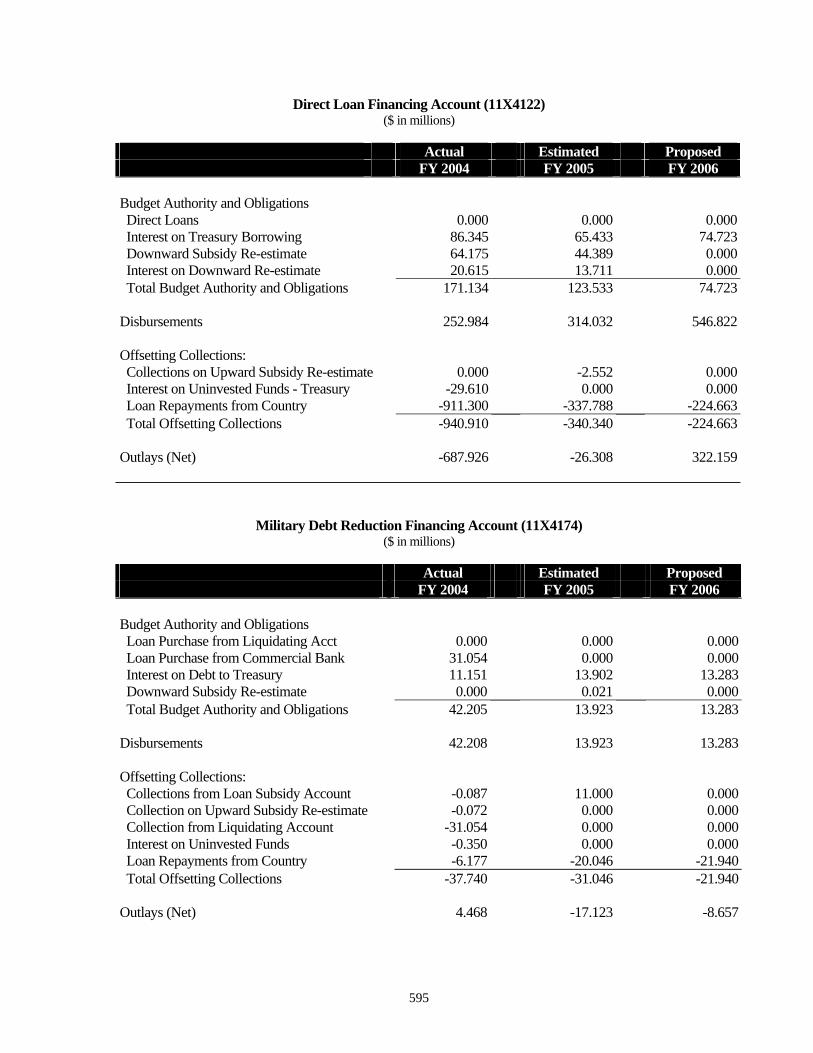
Direct Loan Financing Account (11X4122) ($ in millions)
Actual Estimated Proposed FY 2004 FY 2005 FY 2006
Budget Authority and Obligations Direct Loans 0.000 0.000 0.000 Interest on Treasury Borrowing 86.345 65.433 74.723 Downward Subsidy Re-estimate 64.175 44.389 0.000 Interest on Downward Re-estimate 20.615 13.711 0.000 Total Budget Authority and Obligations 171.134 123.533 74.723
Disbursements 252.984 314.032 546.822
Offsetting Collections: Collections on Upward Subsidy Re-estimate 0.000 -2.552 0.000 Interest on Uninvested Funds - Treasury -29.610 0.000 0.000 Loan Repayments from Country -911.300 -337.788 -224.663 Total Offsetting Collections -940.910 -340.340 -224.663
Outlays (Net) -687.926 -26.308 322.159
Military Debt Reduction Financing Account (11X4174) ($ in millions)
Actual Estimated Proposed FY 2004 FY 2005 FY 2006
Budget Authority and Obligations Loan Purchase from Liquidating Acct 0.000 0.000 0.000 Loan Purchase from Commercial Bank 31.054 0.000 0.000 Interest on Debt to Treasury 11.151 13.902 13.283 Downward Subsidy Re-estimate 0.000 0.021 0.000 Total Budget Authority and Obligations 42.205 13.923 13.283
Disbursements 42.208 13.923 13.283
Offsetting Collections: Collections from Loan Subsidy Account -0.087 11.000 0.000 Collection on Upward Subsidy Re-estimate -0.072 0.000 0.000 Collection from Liquidating Account -31.054 0.000 0.000 Interest on Uninvested Funds -0.350 0.000 0.000 Loan Repayments from Country -6.177 -20.046 -21.940 Total Offsetting Collections -37.740 -31.046 -21.940
Outlays (Net) 4.468 -17.123 -8.657
595
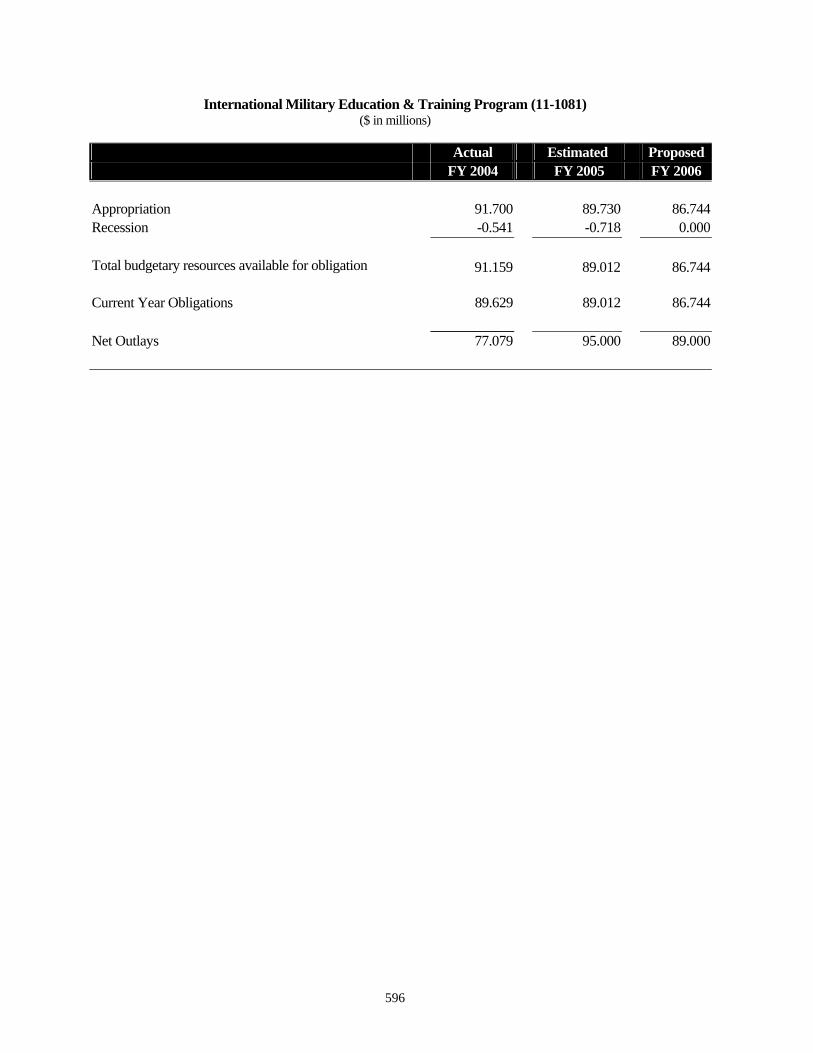
International Military Education & Training Program (11-1081) ($ in millions)
Actual Estimated Proposed FY 2004 FY 2005 FY 2006
Appropriation 91.700 89.730 86.744 Recession -0.541 -0.718 0.000
Total budgetary resources available for obligation 91.159 89.012 86.744
Current Year Obligations 89.629 89.012 86.744
Net Outlays 77.079 95.000 89.000
596
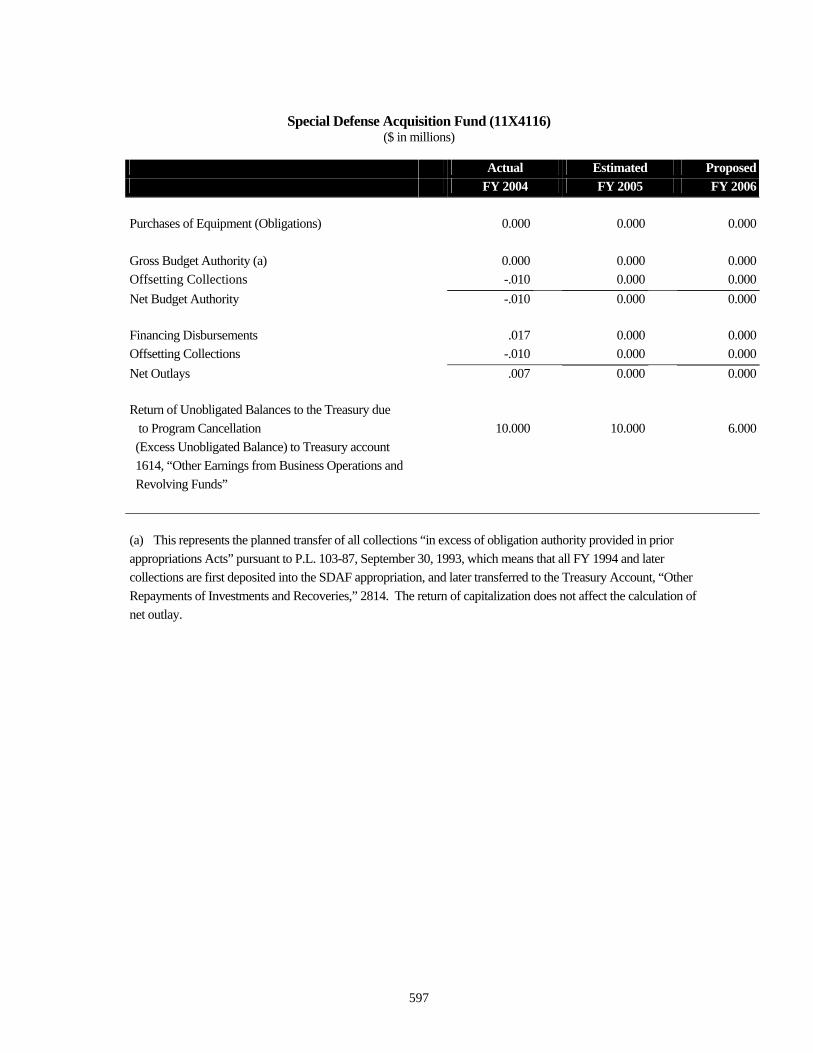
Special Defense Acquisition Fund (11X4116) ($ in millions)
Actual Estimated Proposed FY 2004 FY 2005 FY 2006
Purchases of Equipment (Obligations) 0.000 0.000 0.000
Gross Budget Authority (a) 0.000 0.000 0.000 Offsetting Collections -.010 0.000 0.000 Net Budget Authority -.010 0.000 0.000
Financing Disbursements .017 0.000 0.000 Offsetting Collections -.010 0.000 0.000 Net Outlays .007 0.000 0.000
Return of Unobligated Balances to the Treasury due to Program Cancellation 10.000 10.000 6.000 (Excess Unobligated Balance) to Treasury account 1614, “Other Earnings from Business Operations and Revolving Funds”
(a) This represents the planned transfer of all collections “in excess of obligation authority provided in prior appropriations Acts” pursuant to P.L. 103-87, September 30, 1993, which means that all FY 1994 and later collections are first deposited into the SDAF appropriation, and later transferred to the Treasury Account, “Other Repayments of Investments and Recoveries,” 2814. The return of capitalization does not affect the calculation of net outlay.
597
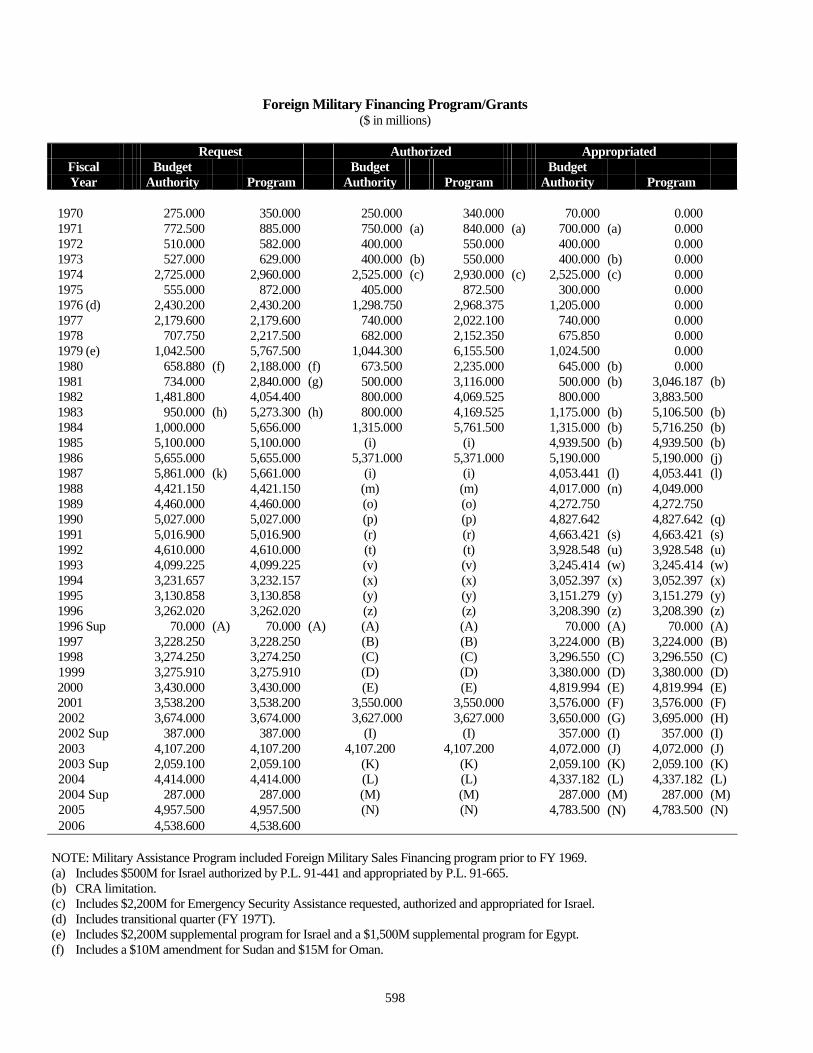
Foreign Military Financing Program/Grants ($ in millions)
Request Authorized Appropriated Fiscal Budget Budget Budget Year Authority Program Authority Program Authority Program
1970 275.000 350.000 250.000 340.000 70.000 0.000 1971 772.500 885.000 750.000 (a) 840.000 (a) 700.000 (a) 0.000 1972 510.000 582.000 400.000 550.000 400.000 0.000 1973 527.000 629.000 400.000 (b) 550.000 400.000 (b) 0.000 1974 2,725.000 2,960.000 2,525.000 (c) 2,930.000 (c) 2,525.000 (c) 0.000 1975 555.000 872.000 405.000 872.500 300.000 0.000 1976 (d) 2,430.200 2,430.200 1,298.750 2,968.375 1,205.000 0.000 1977 2,179.600 2,179.600 740.000 2,022.100 740.000 0.000 1978 707.750 2,217.500 682.000 2,152.350 675.850 0.000 1979 (e) 1,042.500 5,767.500 1,044.300 6,155.500 1,024.500 0.000 1980 658.880 (f) 2,188.000 (f) 673.500 2,235.000 645.000 (b) 0.000 1981 734.000 2,840.000 (g) 500.000 3,116.000 500.000 (b) 3,046.187 (b) 1982 1,481.800 4,054.400 800.000 4,069.525 800.000 3,883.500 1983 950.000 (h) 5,273.300 (h) 800.000 4,169.525 1,175.000 (b) 5,106.500 (b) 1984 1,000.000 5,656.000 1,315.000 5,761.500 1,315.000 (b) 5,716.250 (b) 1985 5,100.000 5,100.000 (i) (i) 4,939.500 (b) 4,939.500 (b) 1986 5,655.000 5,655.000 5,371.000 5,371.000 5,190.000 5,190.000 (j) 1987 5,861.000 (k) 5,661.000 (i) (i) 4,053.441 (l) 4,053.441 (l) 1988 4,421.150 4,421.150 (m) (m) 4,017.000 (n) 4,049.000 1989 4,460.000 4,460.000 (o) (o) 4,272.750 4,272.750 1990 5,027.000 5,027.000 (p) (p) 4,827.642 4,827.642 (q) 1991 5,016.900 5,016.900 (r) (r) 4,663.421 (s) 4,663.421 (s) 1992 4,610.000 4,610.000 (t) (t) 3,928.548 (u) 3,928.548 (u) 1993 4,099.225 4,099.225 (v) (v) 3,245.414 (w) 3,245.414 (w) 1994 3,231.657 3,232.157 (x) (x) 3,052.397 (x) 3,052.397 (x) 1995 3,130.858 3,130.858 (y) (y) 3,151.279 (y) 3,151.279 (y) 1996 3,262.020 3,262.020 (z) (z) 3,208.390 (z) 3,208.390 (z) 1996 Sup 70.000 (A) 70.000 (A) (A) (A) 70.000 (A) 70.000 (A) 1997 3,228.250 3,228.250 (B) (B) 3,224.000 (B) 3,224.000 (B) 1998 3,274.250 3,274.250 (C) (C) 3,296.550 (C) 3,296.550 (C)
1999 3,275.910 3,275.910 (D) (D) 3,380.000 (D) 3,380.000 (D) 2000 3,430.000 3,430.000 (E) (E) 4,819.994 (E) 4,819.994 (E) 2001 3,538.200 3,538.200 3,550.000 3,550.000 3,576.000 (F) 3,576.000 (F)
2002 3,674.000 3,674.000 3,627.000 3,627.000 3,650.000 (G) 3,695.000 (H) 2002 Sup 387.000 387.000 (I) (I) 357.000 (I) 357.000 (I) 2003 4,107.200 4,107.200 4,107.200 4,107.200 4,072.000 (J) 4,072.000 (J) 2003 Sup 2,059.100 2,059.100 (K) (K) 2,059.100 (K) 2,059.100 (K)
2004 4,414.000 4,414.000 (L) (L) 4,337.182 (L) 4,337.182 (L) 2004 Sup 287.000 287.000 (M) (M) 287.000 (M) 287.000 (M) 2005 4,957.500 4,957.500 (N) (N) 4,783.500 (N) 4,783.500 (N) 2006 4,538.600 4,538.600
NOTE: Military Assistance Program included Foreign Military Sales Financing program prior to FY 1969. (a) Includes $500M for Israel authorized by P.L. 91-441 and appropriated by P.L. 91-665. (b) CRA limitation. (c) Includes $2,200M for Emergency Security Assistance requested, authorized and appropriated for Israel. (d) Includes transitional quarter (FY 197T). (e) Includes $2,200M supplemental program for Israel and a $1,500M supplemental program for Egypt. (f) Includes a $10M amendment for Sudan and $15M for Oman.
598
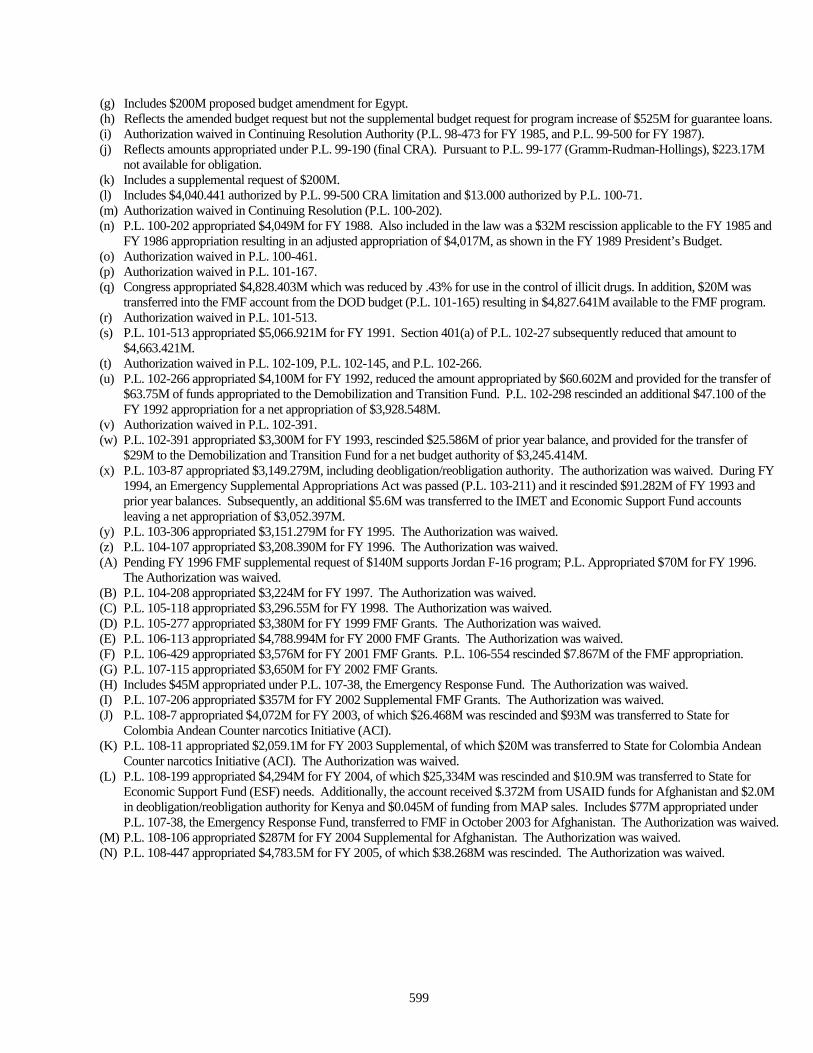
(g) Includes $200M proposed budget amendment for Egypt. (h) Reflects the amended budget request but not the supplemental budget request for program increase of $525M for guarantee loans. (i) Authorization waived in Continuing Resolution Authority (P.L. 98-473 for FY 1985, and P.L. 99-500 for FY 1987). (j) Reflects amounts appropriated under P.L. 99-190 (final CRA). Pursuant to P.L. 99-177 (Gramm-Rudman-Hollings), $223.17M
not available for obligation. (k) Includes a supplemental request of $200M. (l) Includes $4,040.441 authorized by P.L. 99-500 CRA limitation and $13.000 authorized by P.L. 100-71. (m) Authorization waived in Continuing Resolution (P.L. 100-202). (n) P.L. 100-202 appropriated $4,049M for FY 1988. Also included in the law was a $32M rescission applicable to the FY 1985 and
FY 1986 appropriation resulting in an adjusted appropriation of $4,017M, as shown in the FY 1989 President’s Budget. (o) Authorization waived in P.L. 100-461. (p) Authorization waived in P.L. 101-167. (q) Congress appropriated $4,828.403M which was reduced by .43% for use in the control of illicit drugs. In addition, $20M was
transferred into the FMF account from the DOD budget (P.L. 101-165) resulting in $4,827.641M available to the FMF program. (r) Authorization waived in P.L. 101-513. (s) P.L. 101-513 appropriated $5,066.921M for FY 1991. Section 401(a) of P.L. 102-27 subsequently reduced that amount to
$4,663.421M. (t) Authorization waived in P.L. 102-109, P.L. 102-145, and P.L. 102-266. (u) P.L. 102-266 appropriated $4,100M for FY 1992, reduced the amount appropriated by $60.602M and provided for the transfer of
$63.75M of funds appropriated to the Demobilization and Transition Fund. P.L. 102-298 rescinded an additional $47.100 of the FY 1992 appropriation for a net appropriation of $3,928.548M.
(v) Authorization waived in P.L. 102-391. (w) P.L. 102-391 appropriated $3,300M for FY 1993, rescinded $25.586M of prior year balance, and provided for the transfer of
$29M to the Demobilization and Transition Fund for a net budget authority of $3,245.414M. (x) P.L. 103-87 appropriated $3,149.279M, including deobligation/reobligation authority. The authorization was waived. During FY
1994, an Emergency Supplemental Appropriations Act was passed (P.L. 103-211) and it rescinded $91.282M of FY 1993 and prior year balances. Subsequently, an additional $5.6M was transferred to the IMET and Economic Support Fund accounts leaving a net appropriation of $3,052.397M.
(y) P.L. 103-306 appropriated $3,151.279M for FY 1995. The Authorization was waived. (z) P.L. 104-107 appropriated $3,208.390M for FY 1996. The Authorization was waived. (A) Pending FY 1996 FMF supplemental request of $140M supports Jordan F-16 program; P.L. Appropriated $70M for FY 1996.
The Authorization was waived. (B) P.L. 104-208 appropriated $3,224M for FY 1997. The Authorization was waived. (C) P.L. 105-118 appropriated $3,296.55M for FY 1998. The Authorization was waived. (D) P.L. 105-277 appropriated $3,380M for FY 1999 FMF Grants. The Authorization was waived. (E) P.L. 106-113 appropriated $4,788.994M for FY 2000 FMF Grants. The Authorization was waived. (F) P.L. 106-429 appropriated $3,576M for FY 2001 FMF Grants. P.L. 106-554 rescinded $7.867M of the FMF appropriation. (G) P.L. 107-115 appropriated $3,650M for FY 2002 FMF Grants. (H) Includes $45M appropriated under P.L. 107-38, the Emergency Response Fund. The Authorization was waived. (I) P.L. 107-206 appropriated $357M for FY 2002 Supplemental FMF Grants. The Authorization was waived. (J) P.L. 108-7 appropriated $4,072M for FY 2003, of which $26.468M was rescinded and $93M was transferred to State for
Colombia Andean Counter narcotics Initiative (ACI). (K) P.L. 108-11 appropriated $2,059.1M for FY 2003 Supplemental, of which $20M was transferred to State for Colombia Andean
Counter narcotics Initiative (ACI). The Authorization was waived. (L) P.L. 108-199 appropriated $4,294M for FY 2004, of which $25,334M was rescinded and $10.9M was transferred to State for
Economic Support Fund (ESF) needs. Additionally, the account received $.372M from USAID funds for Afghanistan and $2.0M in deobligation/reobligation authority for Kenya and $0.045M of funding from MAP sales. Includes $77M appropriated under P.L. 107-38, the Emergency Response Fund, transferred to FMF in October 2003 for Afghanistan. The Authorization was waived.
(M) P.L. 108-106 appropriated $287M for FY 2004 Supplemental for Afghanistan. The Authorization was waived. (N) P.L. 108-447 appropriated $4,783.5M for FY 2005, of which $38.268M was rescinded. The Authorization was waived.
599
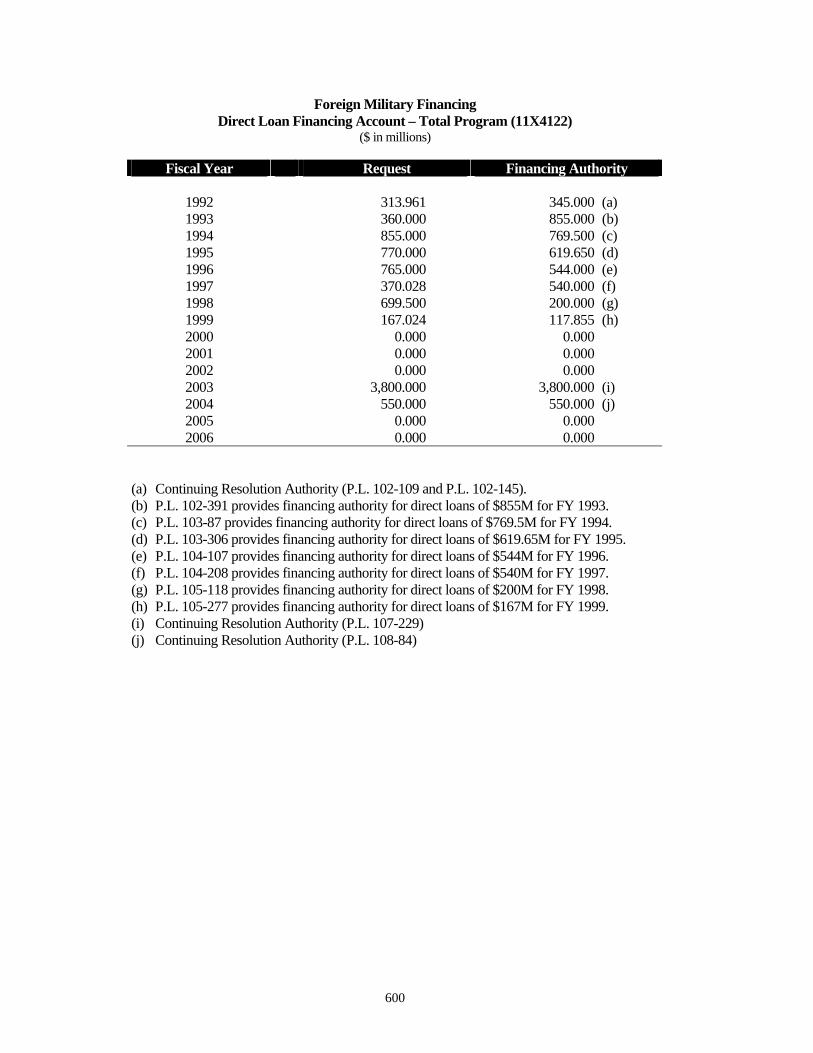
Foreign Military Financing Direct Loan Financing Account – Total Program (11X4122)
($ in millions)
Fiscal Year Request Financing Authority
1992 313.961 345.000 (a) 1993 360.000 855.000 (b) 1994 855.000 769.500 (c) 1995 770.000 619.650 (d) 1996 765.000 544.000 (e) 1997 370.028 540.000 (f) 1998 699.500 200.000 (g) 1999 167.024 117.855 (h) 2000 0.000 0.000 2001 0.000 0.000 2002 0.000 0.000 2003 3,800.000 3,800.000 (i) 2004 550.000 550.000 (j) 2005 0.000 0.000 2006 0.000 0.000
(a) Continuing Resolution Authority (P.L. 102-109 and P.L. 102-145). (b) P.L. 102-391 provides financing authority for direct loans of $855M for FY 1993. (c) P.L. 103-87 provides financing authority for direct loans of $769.5M for FY 1994. (d) P.L. 103-306 provides financing authority for direct loans of $619.65M for FY 1995. (e) P.L. 104-107 provides financing authority for direct loans of $544M for FY 1996. (f) P.L. 104-208 provides financing authority for direct loans of $540M for FY 1997. (g) P.L. 105-118 provides financing authority for direct loans of $200M for FY 1998. (h) P.L. 105-277 provides financing authority for direct loans of $167M for FY 1999. (i) Continuing Resolution Authority (P.L. 107-229) (j) Continuing Resolution Authority (P.L. 108-84)
600
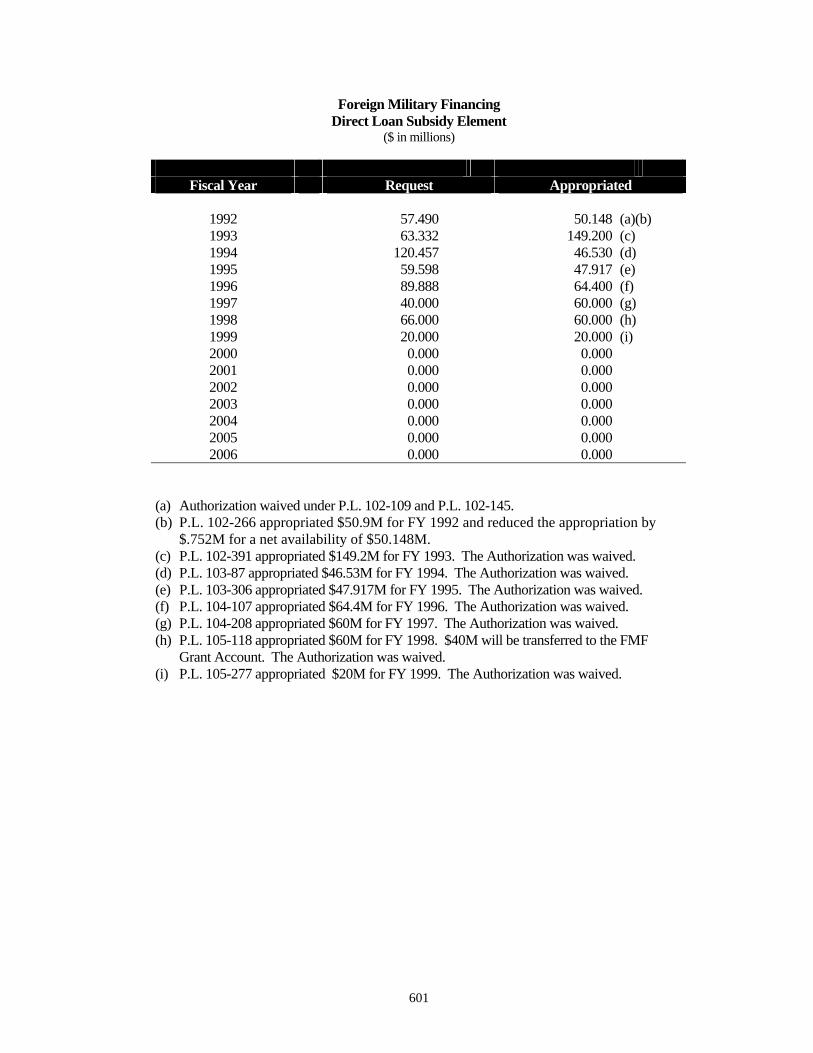
Foreign Military Financing Direct Loan Subsidy Element
($ in millions)
Fiscal Year Request Appropriated
1992 57.490 50.148 (a)(b) 1993 63.332 149.200 (c) 1994 120.457 46.530 (d) 1995 59.598 47.917 (e) 1996 89.888 64.400 (f) 1997 40.000 60.000 (g) 1998 66.000 60.000 (h) 1999 20.000 20.000 (i) 2000 0.000 0.000 2001 0.000 0.000 2002 0.000 0.000 2003 0.000 0.000 2004 0.000 0.000 2005 0.000 0.000 2006 0.000 0.000
(a) Authorization waived under P.L. 102-109 and P.L. 102-145. (b) P.L. 102-266 appropriated $50.9M for FY 1992 and reduced the appropriation by
$.752M for a net availability of $50.148M. (c) P.L. 102-391 appropriated $149.2M for FY 1993. The Authorization was waived. (d) P.L. 103-87 appropriated $46.53M for FY 1994. The Authorization was waived. (e) P.L. 103-306 appropriated $47.917M for FY 1995. The Authorization was waived. (f) P.L. 104-107 appropriated $64.4M for FY 1996. The Authorization was waived. (g) P.L. 104-208 appropriated $60M for FY 1997. The Authorization was waived. (h) P.L. 105-118 appropriated $60M for FY 1998. $40M will be transferred to the FMF
Grant Account. The Authorization was waived. (i) P.L. 105-277 appropriated $20M for FY 1999. The Authorization was waived.
601
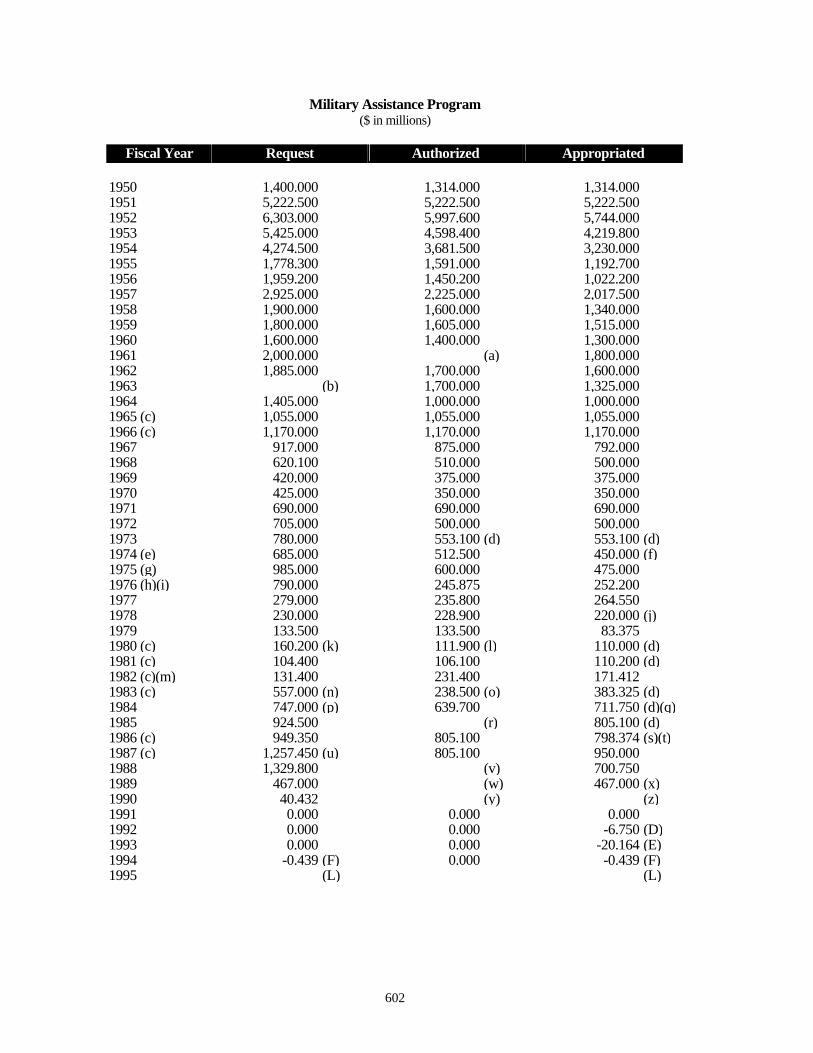
Military Assistance Program ($ in millions)
Fiscal Year Request Authorized Appropriated
1950 1,400.000 1,314.000 1,314.000 1951 5,222.500 5,222.500 5,222.500 1952 6,303.000 5,997.600 5,744.000 1953 5,425.000 4,598.400 4,219.800 1954 4,274.500 3,681.500 3,230.000 1955 1,778.300 1,591.000 1,192.700 1956 1,959.200 1,450.200 1,022.200 1957 2,925.000 2,225.000 2,017.500 1958 1,900.000 1,600.000 1,340.000 1959 1,800.000 1,605.000 1,515.000 1960 1,600.000 1,400.000 1,300.000 1961 2,000.000 (a) 1,800.000 1962 1,885.000 1,700.000 1,600.000 1963 (b) 1,700.000 1,325.000 1964 1,405.000 1,000.000 1,000.000 1965 (c) 1,055.000 1,055.000 1,055.000 1966 (c) 1,170.000 1,170.000 1,170.000 1967 917.000 875.000 792.000 1968 620.100 510.000 500.000 1969 420.000 375.000 375.000 1970 425.000 350.000 350.000 1971 690.000 690.000 690.000 1972 705.000 500.000 500.000 1973 780.000 553.100 (d) 553.100 (d) 1974 (e) 685.000 512.500 450.000 (f) 1975 (g) 985.000 600.000 475.000 1976 (h)(i) 790.000 245.875 252.200 1977 279.000 235.800 264.550 1978 230.000 228.900 220.000 (j) 1979 133.500 133.500 83.375 1980 (c) 160.200 (k) 111.900 (l) 110.000 (d) 1981 (c) 104.400 106.100 110.200 (d) 1982 (c)(m) 131.400 231.400 171.412 1983 (c) 557.000 (n) 238.500 (o) 383.325 (d) 1984 747.000 (p) 639.700 711.750 (d)(q) 1985 924.500 (r) 805.100 (d) 1986 (c) 949.350 805.100 798.374 (s)(t) 1987 (c) 1,257.450 (u) 805.100 950.000 1988 1,329.800 (v) 700.750 1989 467.000 (w) 467.000 (x) 1990 40.432 (y) (z) 1991 0.000 0.000 0.000 1992 0.000 0.000 -6.750 (D) 1993 0.000 0.000 -20.164 (E) 1994 -0.439 (F) 0.000 -0.439 (F) 1995 (L) (L)
602
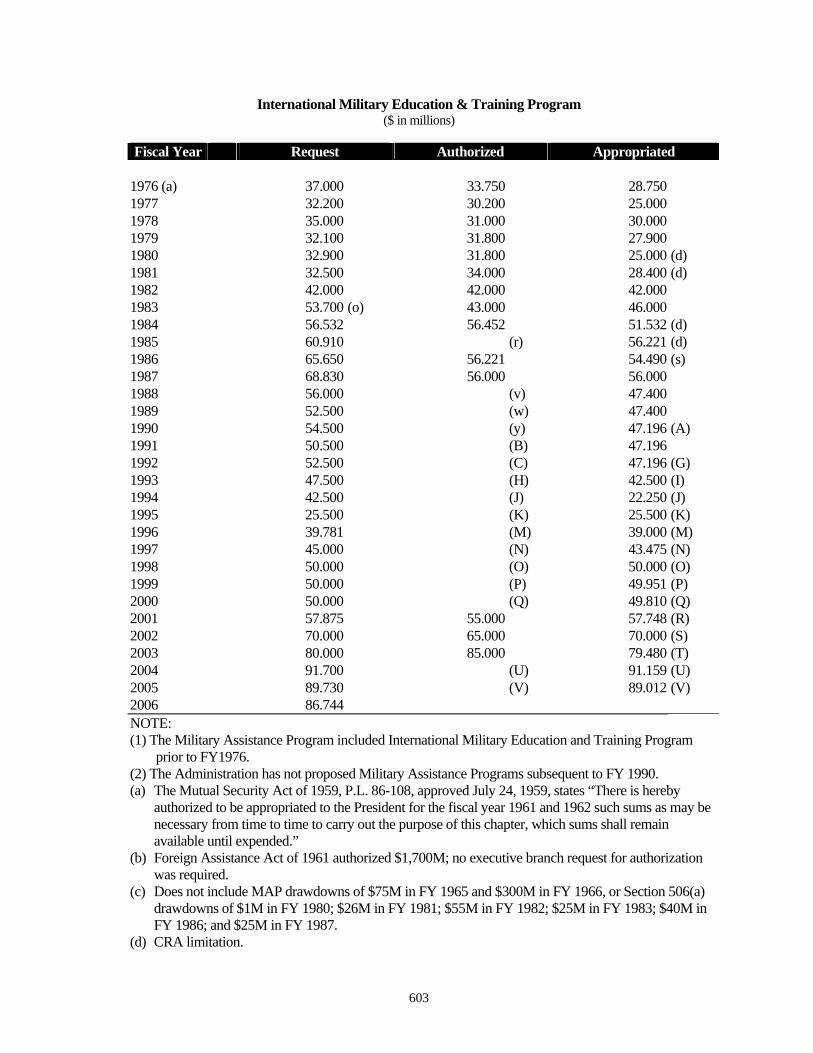
International Military Education & Training Program ($ in millions)
Fiscal Year Request Authorized Appropriated
1976 (a) 37.000 33.750 28.750 1977 32.200 30.200 25.000 1978 35.000 31.000 30.000 1979 32.100 31.800 27.900 1980 32.900 31.800 25.000 (d) 1981 32.500 34.000 28.400 (d) 1982 42.000 42.000 42.000 1983 53.700 (o) 43.000 46.000 1984 56.532 56.452 51.532 (d) 1985 60.910 (r) 56.221 (d) 1986 65.650 56.221 54.490 (s) 1987 68.830 56.000 56.000 1988 56.000 (v) 47.400 1989 52.500 (w) 47.400 1990 54.500 (y) 47.196 (A) 1991 50.500 (B) 47.196 1992 52.500 (C) 47.196 (G) 1993 47.500 (H) 42.500 (I) 1994 42.500 (J) 22.250 (J) 1995 25.500 (K) 25.500 (K) 1996 39.781 (M) 39.000 (M) 1997 45.000 (N) 43.475 (N) 1998 50.000 (O) 50.000 (O) 1999 50.000 (P) 49.951 (P) 2000 50.000 (Q) 49.810 (Q) 2001 57.875 55.000 57.748 (R) 2002 70.000 65.000 70.000 (S) 2003 80.000 85.000 79.480 (T) 2004 91.700 (U) 91.159 (U) 2005 89.730 (V) 89.012 (V) 2006 86.744 NOTE: (1) The Military Assistance Program included International Military Education and Training Program
prior to FY1976. (2) The Administration has not proposed Military Assistance Programs subsequent to FY 1990. (a) The Mutual Security Act of 1959, P.L. 86-108, approved July 24, 1959, states “There is hereby
authorized to be appropriated to the President for the fiscal year 1961 and 1962 such sums as may be necessary from time to time to carry out the purpose of this chapter, which sums shall remain available until expended.”
(b) Foreign Assistance Act of 1961 authorized $1,700M; no executive branch request for authorization was required.
(c) Does not include MAP drawdowns of $75M in FY 1965 and $300M in FY 1966, or Section 506(a) drawdowns of $1M in FY 1980; $26M in FY 1981; $55M in FY 1982; $25M in FY 1983; $40M in FY 1986; and $25M in FY 1987.
(d) CRA limitation.
603
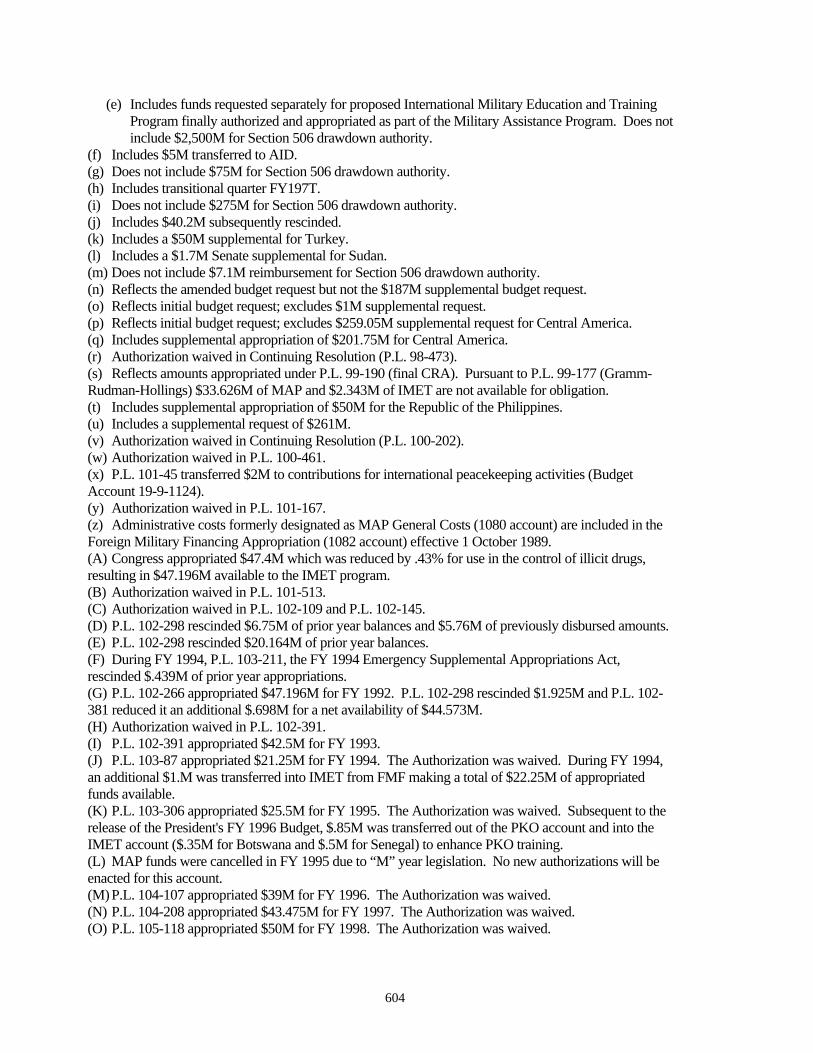
(e) Includes funds requested separately for proposed International Military Education and Training Program finally authorized and appropriated as part of the Military Assistance Program. Does not include $2,500M for Section 506 drawdown authority.
(f) Includes $5M transferred to AID. (g) Does not include $75M for Section 506 drawdown authority. (h) Includes transitional quarter FY197T. (i) Does not include $275M for Section 506 drawdown authority. (j) Includes $40.2M subsequently rescinded. (k) Includes a $50M supplemental for Turkey. (l) Includes a $1.7M Senate supplemental for Sudan. (m) Does not include $7.1M reimbursement for Section 506 drawdown authority. (n) Reflects the amended budget request but not the $187M supplemental budget request. (o) Reflects initial budget request; excludes $1M supplemental request. (p) Reflects initial budget request; excludes $259.05M supplemental request for Central America. (q) Includes supplemental appropriation of $201.75M for Central America. (r) Authorization waived in Continuing Resolution (P.L. 98-473). (s) Reflects amounts appropriated under P.L. 99-190 (final CRA). Pursuant to P.L. 99-177 (Gramm-Rudman-Hollings) $33.626M of MAP and $2.343M of IMET are not available for obligation. (t) Includes supplemental appropriation of $50M for the Republic of the Philippines. (u) Includes a supplemental request of $261M. (v) Authorization waived in Continuing Resolution (P.L. 100-202). (w) Authorization waived in P.L. 100-461. (x) P.L. 101-45 transferred $2M to contributions for international peacekeeping activities (Budget Account 19-9-1124). (y) Authorization waived in P.L. 101-167. (z) Administrative costs formerly designated as MAP General Costs (1080 account) are included in the Foreign Military Financing Appropriation (1082 account) effective 1 October 1989. (A) Congress appropriated $47.4M which was reduced by .43% for use in the control of illicit drugs, resulting in $47.196M available to the IMET program. (B) Authorization waived in P.L. 101-513. (C) Authorization waived in P.L. 102-109 and P.L. 102-145. (D) P.L. 102-298 rescinded $6.75M of prior year balances and $5.76M of previously disbursed amounts. (E) P.L. 102-298 rescinded $20.164M of prior year balances. (F) During FY 1994, P.L. 103-211, the FY 1994 Emergency Supplemental Appropriations Act, rescinded $.439M of prior year appropriations. (G) P.L. 102-266 appropriated $47.196M for FY 1992. P.L. 102-298 rescinded $1.925M and P.L. 102381 reduced it an additional $.698M for a net availability of $44.573M. (H) Authorization waived in P.L. 102-391. (I) P.L. 102-391 appropriated $42.5M for FY 1993. (J) P.L. 103-87 appropriated $21.25M for FY 1994. The Authorization was waived. During FY 1994, an additional $1.M was transferred into IMET from FMF making a total of $22.25M of appropriated funds available. (K) P.L. 103-306 appropriated $25.5M for FY 1995. The Authorization was waived. Subsequent to the release of the President's FY 1996 Budget, $.85M was transferred out of the PKO account and into the IMET account ($.35M for Botswana and $.5M for Senegal) to enhance PKO training. (L) MAP funds were cancelled in FY 1995 due to “M” year legislation. No new authorizations will be enacted for this account. (M) P.L. 104-107 appropriated $39M for FY 1996. The Authorization was waived. (N) P.L. 104-208 appropriated $43.475M for FY 1997. The Authorization was waived. (O) P.L. 105-118 appropriated $50M for FY 1998. The Authorization was waived.
604
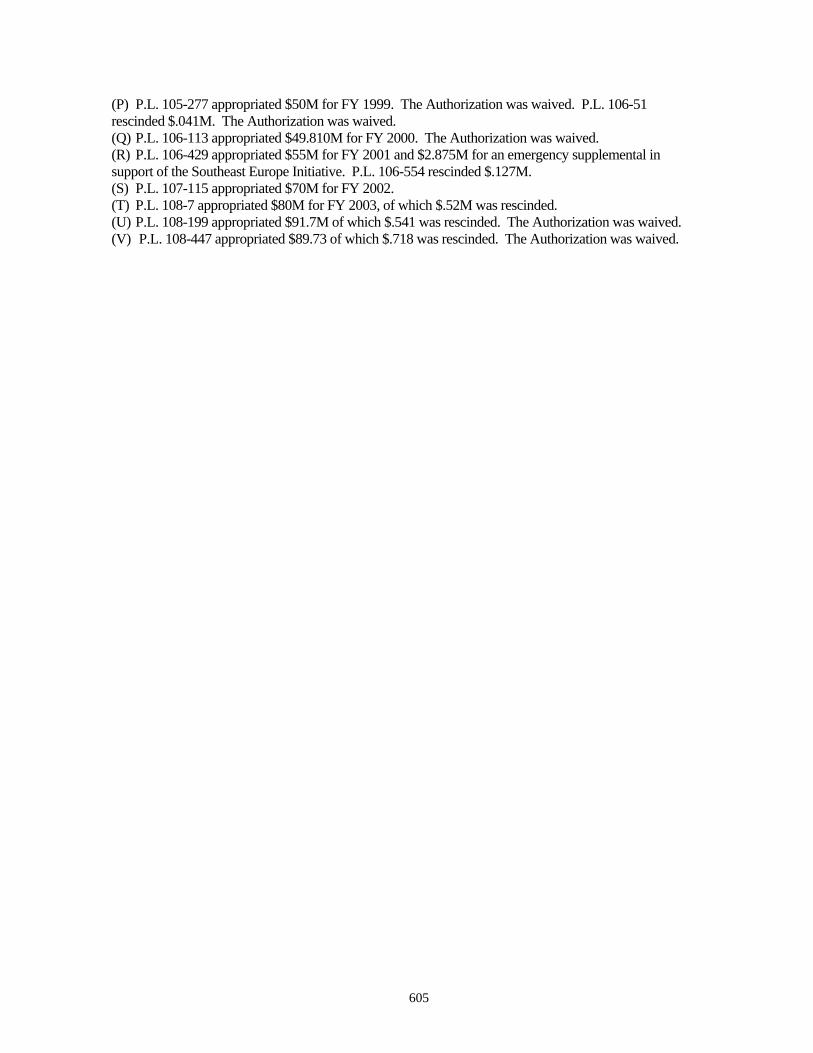
(P) P.L. 105-277 appropriated $50M for FY 1999. The Authorization was waived. P.L. 106-51 rescinded $.041M. The Authorization was waived. (Q) P.L. 106-113 appropriated $49.810M for FY 2000. The Authorization was waived. (R) P.L. 106-429 appropriated $55M for FY 2001 and $2.875M for an emergency supplemental in support of the Southeast Europe Initiative. P.L. 106-554 rescinded $.127M. (S) P.L. 107-115 appropriated $70M for FY 2002. (T) P.L. 108-7 appropriated $80M for FY 2003, of which $.52M was rescinded. (U) P.L. 108-199 appropriated $91.7M of which $.541 was rescinded. The Authorization was waived. (V) P.L. 108-447 appropriated $89.73 of which $.718 was rescinded. The Authorization was waived.
605

Peacekeeping Operations ($ in millions)
Fiscal Year Request Authorized Appropriated
1979 (a) 30.900 27.400 1980 (a) 21.100 22.000 (b) 1981 25.000 25.000 25.000 (c) 1982 19.000 19.000 14.000 (d) 1983 43.474 19.000 31.100 (c) 1984 46.200 46.200 46.200 (c) 1985 49.000 (e) 44.000 (c) 1986 37.000 37.000 34.000 (f) 1987 39.000 37.000 31.689 1988 46.311 31.689 31.689 1989 41.689 (g) 41.689 41.689 1990 33.377 32.773 32.773 1991 32.800 32.800 32.800 1992 378.000 (h) 28.000 28.000 (c) 1993 27.166 27.166 27.166 1994 77.166 82.435 (i) 82.435 (i) 1995 75.000 75.000 75.000 (j) 1996 100.000 70.000 70.000 1997 70.000 65.000 65.000 1998 90.000 77.500 77.500 1999 83.000 76.500 76.500 2000 130,000 152.418 152.418 (k) 2001 134.000 127.000 (l) 126.382 (m) 2002 150.000 135.000 135.000 2003 108.250 115.000 214.252 (o) 2004 94.900 94.900 124.458 (p) 2005 104,000 179.000 (q) 2006 195.800 (a) Executive Branch request included ESF and PKO in one account—Security Supporting
Assistance (SSA). (b) CRA limitation (P.L. 96-123). (c) CRA limitation. (d) In addition, $125M appropriated under CRA (P.L. 97-51) and authorized by P.L. 97-132 for the
Multinational Force and Observers. (e) Authorization waived in Continuing Resolution (P.L. 98-473). (f) Reflects amount appropriated under P.L. 99-190 (final CRA). Pursuant to P.L. 99-177 (Gramm-
Rudman-Hollings), $1.462M of this amount is not available for obligation. (g) Includes $10M transfer from DOD allocated to Department of State pursuant to P.L. 101-45 used
for UN mineclearing operations in Afghanistan. (h) Reflects an amendment to the FY 1992 budget to provide the United States’ share to initiate UN
Peacekeeping activities in Cambodia and El Salvador, and for other peacekeeping requirements.
(i) Includes appropriation of $75.623M plus $6.812M transferred from other accounts.
606
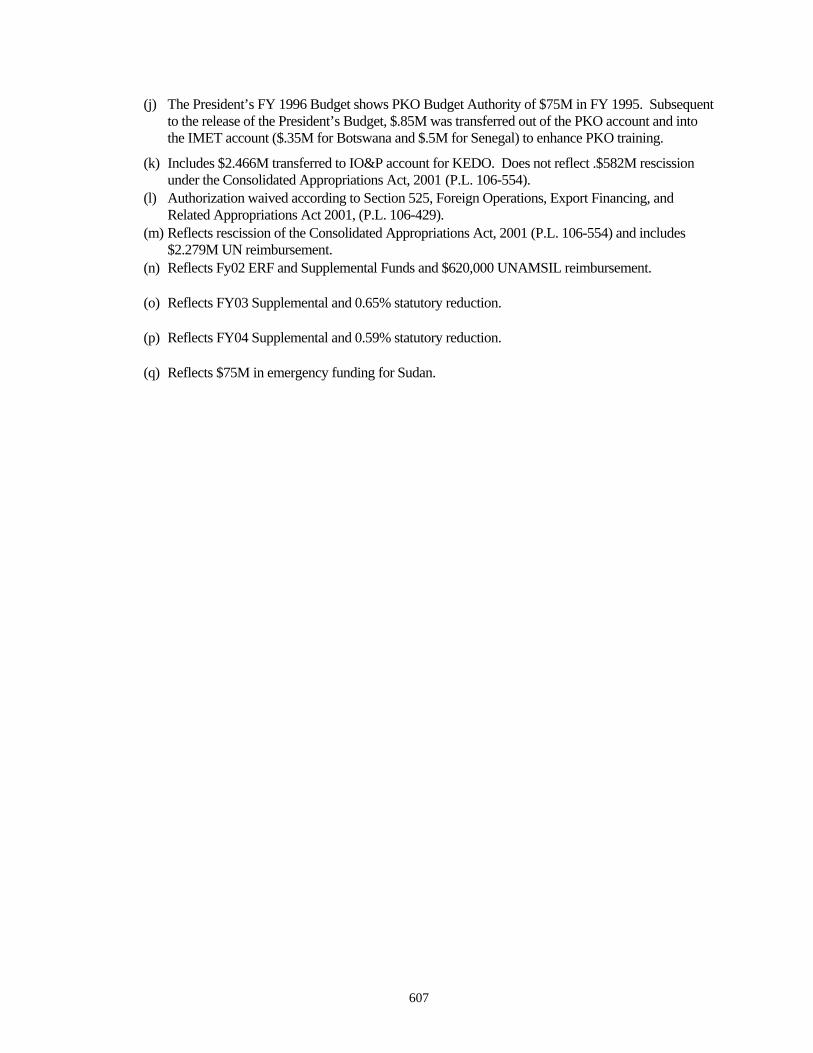
(j) The President’s FY 1996 Budget shows PKO Budget Authority of $75M in FY 1995. Subsequent to the release of the President’s Budget, $.85M was transferred out of the PKO account and into the IMET account ($.35M for Botswana and $.5M for Senegal) to enhance PKO training.
(k) Includes $2.466M transferred to IO&P account for KEDO. Does not reflect .$582M rescission under the Consolidated Appropriations Act, 2001 (P.L. 106-554).
(l) Authorization waived according to Section 525, Foreign Operations, Export Financing, and Related Appropriations Act 2001, (P.L. 106-429).
(m) Reflects rescission of the Consolidated Appropriations Act, 2001 (P.L. 106-554) and includes $2.279M UN reimbursement.
(n) Reflects Fy02 ERF and Supplemental Funds and $620,000 UNAMSIL reimbursement.
(o) Reflects FY03 Supplemental and 0.65% statutory reduction.
(p) Reflects FY04 Supplemental and 0.59% statutory reduction.
(q) Reflects $75M in emergency funding for Sudan.
607
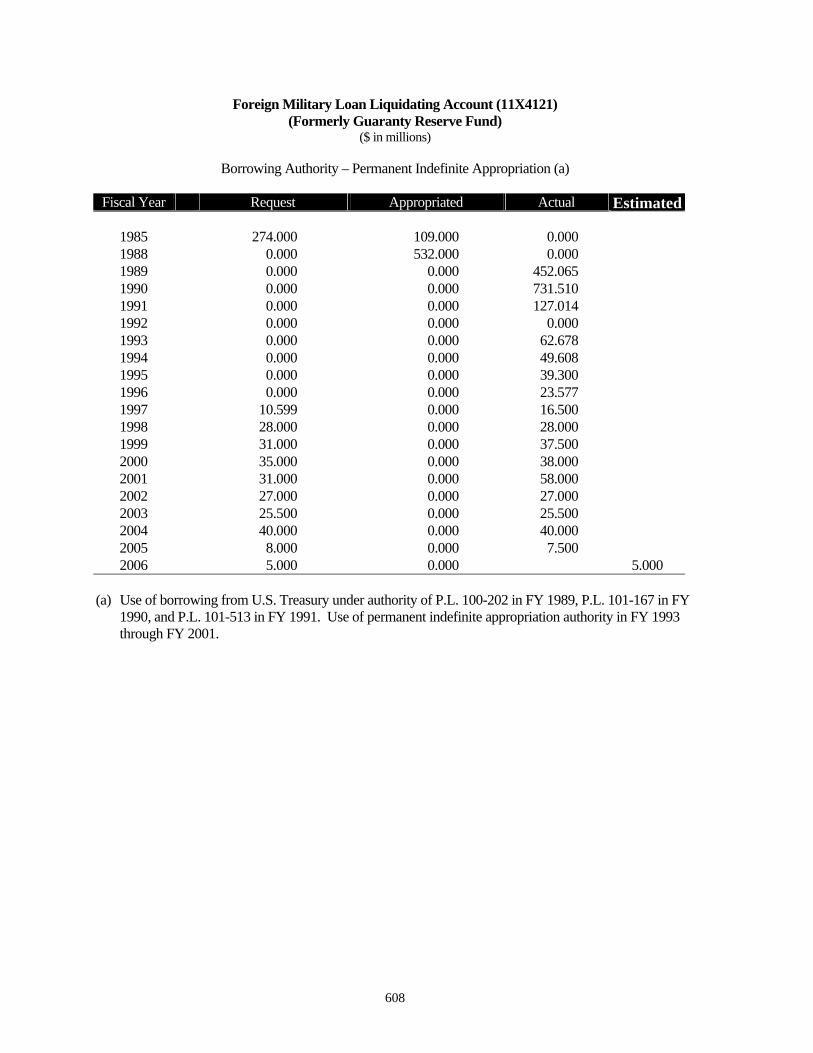
Foreign Military Loan Liquidating Account (11X4121) (Formerly Guaranty Reserve Fund)
($ in millions)
Borrowing Authority – Permanent Indefinite Appropriation (a)
Fiscal Year Request Actual EstimatedAppropriated
1985 274.000 109.000 0.000 1988 0.000 532.000 0.000 1989 0.000 0.000 452.065 1990 0.000 0.000 731.510 1991 0.000 0.000 127.014 1992 0.000 0.000 0.000 1993 0.000 0.000 62.678 1994 0.000 0.000 49.608 1995 0.000 0.000 39.300 1996 0.000 0.000 23.577 1997 10.599 0.000 16.500 1998 28.000 0.000 28.000 1999 31.000 0.000 37.500 2000 35.000 0.000 38.000 2001 31.000 0.000 58.000 2002 27.000 0.000 27.000 2003 25.500 0.000 25.500 2004 40.000 0.000 40.000 2005 8.000 0.000 7.500 2006 5.000 0.000 5.000
(a) Use of borrowing from U.S. Treasury under authority of P.L. 100-202 in FY 1989, P.L. 101-167 in FY 1990, and P.L. 101-513 in FY 1991. Use of permanent indefinite appropriation authority in FY 1993 through FY 2001.
608
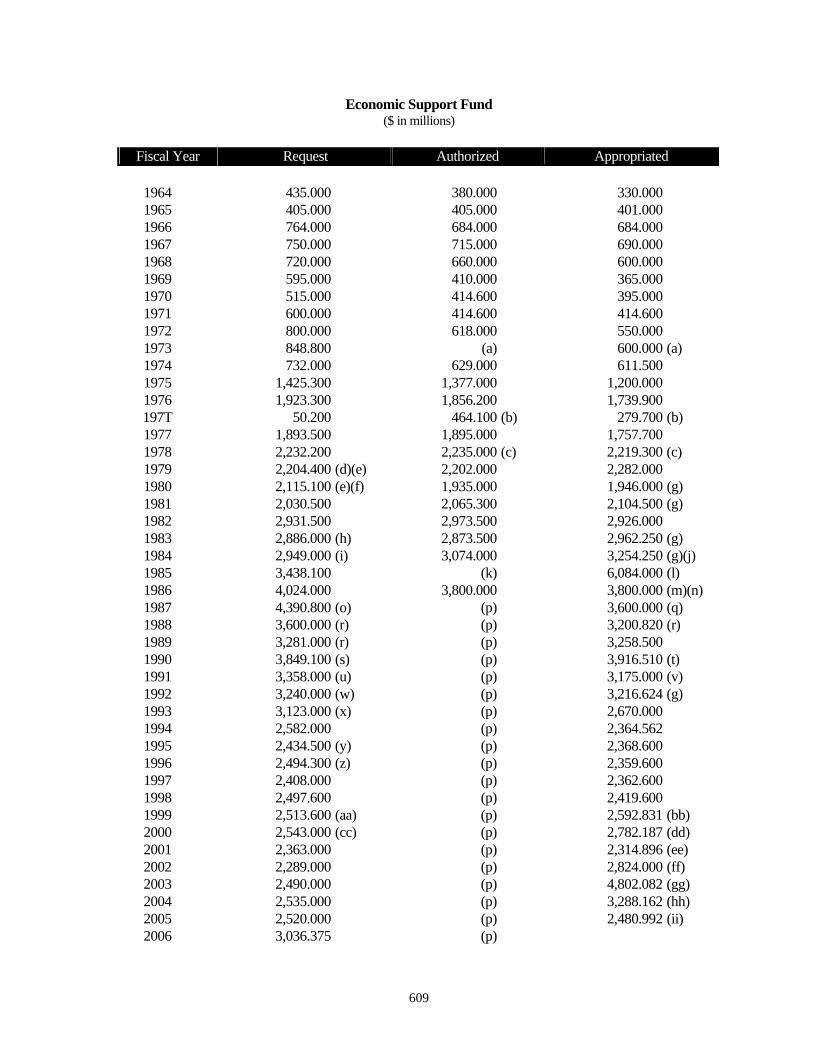
Economic Support Fund ($ in millions)
Fiscal Year Request Authorized Appropriated
1964 435.000 380.000 330.000 1965 405.000 405.000 401.000 1966 764.000 684.000 684.000 1967 750.000 715.000 690.000 1968 720.000 660.000 600.000 1969 595.000 410.000 365.000 1970 515.000 414.600 395.000 1971 600.000 414.600 414.600 1972 800.000 618.000 550.000 1973 848.800 (a) 600.000 (a) 1974 732.000 629.000 611.500 1975 1,425.300 1,377.000 1,200.000 1976 1,923.300 1,856.200 1,739.900 197T 50.200 464.100 (b) 279.700 (b) 1977 1,893.500 1,895.000 1,757.700 1978 2,232.200 2,235.000 (c) 2,219.300 (c) 1979 2,204.400 (d)(e) 2,202.000 2,282.000 1980 2,115.100 (e)(f) 1,935.000 1,946.000 (g) 1981 2,030.500 2,065.300 2,104.500 (g) 1982 2,931.500 2,973.500 2,926.000 1983 2,886.000 (h) 2,873.500 2,962.250 (g) 1984 2,949.000 (i) 3,074.000 3,254.250 (g)(j) 1985 3,438.100 (k) 6,084.000 (l) 1986 4,024.000 3,800.000 3,800.000 (m)(n) 1987 4,390.800 (o) (p) 3,600.000 (q) 1988 3,600.000 (r) (p) 3,200.820 (r) 1989 3,281.000 (r) (p) 3,258.500 1990 3,849.100 (s) (p) 3,916.510 (t) 1991 3,358.000 (u) (p) 3,175.000 (v) 1992 3,240.000 (w) (p) 3,216.624 (g) 1993 3,123.000 (x) (p) 2,670.000 1994 2,582.000 (p) 2,364.562 1995 2,434.500 (y) (p) 2,368.600 1996 2,494.300 (z) (p) 2,359.600 1997 2,408.000 (p) 2,362.600 1998 2,497.600 (p) 2,419.600 1999 2,513.600 (aa) (p) 2,592.831 (bb) 2000 2,543.000 (cc) (p) 2,782.187 (dd) 2001 2,363.000 (p) 2,314.896 (ee) 2002 2,289.000 (p) 2,824.000 (ff) 2003 2,490.000 (p) 4,802.082 (gg) 2004 2,535.000 (p) 3,288.162 (hh) 2005 2,520.000 (p) 2,480.992 (ii) 2006 3,036.375 (p)
609
(a) CRA level - $618M. There was no authorization level in FY 1973. (b) Section 506 of the International Security Assistance and Arms Control Act of 1976, P.L. 94-329,
quarter not to exceed one-fourth of the total amount authorized in that Act for FY 1976. (c) Includes $300M for Portugal; also $20M for Lebanon, authorized as Disaster Assistance, but
appropriated in the Security Support Assistance (SSA) account. (d) Includes a $300M supplemental for Egypt and $100M for Turkey. (e) Executive Branch request included ESF and PKO in one account—Security Supporting Assistance
(SSA). (f) Includes an $80M supplemental for Central America. (g) CRA limitation. (h) Reflects initial budget request. Does not include the $294.5M supplemental budget request. (i) Reflects initial budget request. Does not include the $340.5M supplemental appropriation for Central
America or the $10M for Poland. (j) Includes supplemental appropriation (P.L. 98-332). (k) Authorization waived in Continuing Resolution Authority (P.L. 98-473 for FY 1985, and P.L. 99-500
for FY 1987). (l) Includes FY 1985 Supplemental of $2,258M. (m) Reflects amounts appropriated under P.L. 99-190 (final CRA). Pursuant to P.L. 99-177 (Gramm-
Rudman-Hollings), $159.358M not available for obligation. (n) Includes $100M supplemental for the Republic of the Philippines. (o) Includes a supplemental request of $297M. (p) Authorization waived. (q) Includes $50M deobligation/reobligation reappropriation. (r) Includes $12.5M deobligation reobligation reappropriation estimate. (s) Includes $18M deobligation/reobligation reappropriation estimate and a $500M supplemental for
Panama. (t) Includes $20M for Ireland (less $.145M sequestration pursuant to P.L. 99-177), minus $50M pursuant
to P.L. 101-167 and $755M supplemental (P.L. 101-302) for Panama, Nicaragua, Namibia, and South Africa
(u) Includes $14M reappropriation estimate. (v) Includes $14M reappropriation estimate and $30.2M transferred to other accounts. Includes $20M for
Ireland. (w) Includes $12M reappropriation estimate. (x) Includes $11M reappropriation estimate. (y) In 1995, the President’s Budget did not request Economic Support Funds per se, but instead requested
$2,434M in democracy and peace activities. (z) The FY 1996 President’s Budget includes a supplemental FY 1995 request of $82.3M. (aa) Includes supplemental requests of $200M for West Bank/Gaza; $50M for Jordan-Wye; $105M for
Kosovo. (bb)Net of rescission enacted by the Emergency Steel Loan Guarantee and Emergency Oil and Gas
Guarantee Act of 1999 (P.L. 106-51). Net of rescission and inclusive of supplemental funding for emergency security, Kosovo, and Jordan enacted under the 1999 emergency supplemental appropriations acts.
(cc) Includes $150M supplemental request for Wye River Agreement. (dd)Net of .38% rescission of Miscellaneous Appropriations Act enacted by reference in P.L. 106-113.
Also reflects rescission of $10M pursuant to P.L. 107-20. (ee) Net of rescission of Consolidated Appropriations Act, 2001 (P.L. 106-554) (ff) Includes $600M appropriated under P.L. 107-38, the Emergency Response Fund
610
(gg) Net of 0.65% rescission of Consolidated Appropriations Resolution, 2003 (P.L. 108-7). Includes $2.422 billion in emergency supplemental appropriations and $100 million reimbursement from the Iraq Relief and Reconstruction Fund. (hh) Net of 0.59% rescission of Consolidated Appropriations Act, 2004 (P.L. 108-199). Includes $872 million in emergency supplemental appropriations, $100 million mandatory transfer from the Iraq Relief and Reconstruction Fund, $153 million transfer from the Emergency Response Fund, and $24.853 million transfer from the FY 2004 IO&P account. (ii) Net of 0.8% rescission of Consolidated Appropriations Act, 2005 (P.L. 108-447).
611
This page intentionally left blank.
612
FY 2006 Congressional Budget Justification P.L. 480 Title II - Dollars (Thousands)
FY 2004 Final Program Levels FY 2005 Estimate a/ FY 2006 Congressional Budget Request Commodity b/ Commodity b/ Commodity b/
Total Transport PVO/CDO WFP c/ IEFR d/ Total Transport PVO/CDO WFP c/ IEFR d/ Total Transport PVO/CDO WFP c/ IEFR d/ Region/Country
ASIA/NEAR EAST 150,284 48,496 51,145 11,190 39,453 108,778 36,997 59,925 11,856 0 111,941 38,060 73,881 0 0 Afghanistan* 85 85 0 0 0 24,030 14,509 0 9,521 0 0 0 0 0 0 Algeria* 931 281 0 650 0 0 0 0 0 0 0 0 0 0 0 Bangladesh* 33,451 10,380 18,166 1,791 3,114 22,842 6,370 16,472 0 0 50,751 17,255 33,496 0 0 Cambodia 703 244 0 459 0 0 0 0 0 0 0 0 0 0 0 East Timor* 669 349 0 0 320 0 0 0 0 0 0 0 0 0 0 Egypt 2,345 705 0 1,640 0 0 0 0 0 0 0 0 0 0 0 India 40,869 10,072 30,797 0 0 49,006 11,640 37,366 0 0 43,000 14,620 28,380 0 0 Indonesia* 3,315 1,133 2,182 0 0 11,900 4,096 6,087 1,717 0 18,190 6,185 12,005 0 0 Iraq* 0 0 0 0 0 0 0 0 0 0 0 0 0 0 0 Laos 0 0 0 0 0 0 0 0 0 0 0 0 0 0 0 Nepal* 0 0 0 0 0 1,000 382 0 618 0 0 0 0 0 0 North Korea* (DPRK) 45,704 16,455 0 0 29,249 0 0 0 0 0 0 0 0 0 0 Pakistan* 13,067 4,683 0 3,938 4,446 0 0 0 0 0 0 0 0 0 0 Sri Lanka* 4,190 1,478 0 2,712 0 0 0 0 0 0 0 0 0 0 0 Yemen 0 0 0 0 0 0 0 0 0 0 0 0 0 0 0 West Bank/Gaza* 4,955 2,631 0 0 2,324 0 0 0 0 0 0 0 0 0 0
EUROPE & EURASIA 17,987 9,337 0 6,217 2,433 15,458 5,722 7,323 2,413 0 10,374 3,527 6,847 0 0 Armenia* 0 0 0 0 0 0 0 0 0 0 0 0 0 0 0 Azerbaijan* 2,883 1,379 0 1,504 0 0 0 0 0 0 0 0 0 0 0 Georgia* 2,974 1,404 0 1,570 0 0 0 0 0 0 0 0 0 0 0 Russia* 5,121 2,688 0 0 2,433 0 0 0 0 0 0 0 0 0 0 Tajikistan* 7,009 3,866 0 3,143 0 15,458 5,722 7,323 2,413 0 10,374 3,527 6,847 0 0
LATIN AMERICA 106,463 33,475 68,943 3,691 354 108,462 33,105 72,690 1,343 1,324 113,159 38,475 74,684 0 0 Bolivia 22,276 10,037 12,239 0 0 16,802 7,351 9,451 0 0 24,664 8,386 16,278 0 0 El Salvador* 630 281 0 349 0 0 0 0 0 0 0 0 0 0 0 Guatemala* 14,723 3,429 10,731 563 0 18,033 3,306 14,450 277 0 16,306 5,544 10,762 0 0 Haiti* 30,470 10,719 18,426 971 354 37,703 13,048 23,331 0 1,324 32,529 11,060 21,469 0 0 Honduras* 7,450 2,736 3,347 1,367 0 14,009 4,639 8,574 796 0 14,187 4,824 9,363 0 0 Nicaragua* 7,046 2,351 4,254 441 0 8,994 3,083 5,641 270 0 12,228 4,158 8,070 0 0 Peru 23,868 3,922 19,946 0 0 12,921 1,678 11,243 0 0 13,245 4,503 8,742 0 0
AFRICA 1,187,935 673,317 231,800 99,805 183,013 433,915 229,370 141,780 31,951 30,814 228,790 77,789 151,001 0 0 Angola* 68,395 46,735 6,742 14,918 0 33,252 21,065 8,063 4,124 0 10,000 3,400 6,600 0 0 Benin 4,701 1,664 3,037 0 0 2,668 875 1,793 0 0 3,067 1,043 2,024 0 0 Burkina Faso 8,812 3,699 5,113 0 0 13,337 5,556 7,781 0 0 14,646 4,980 9,666 0 0 Burundi* 19,881 12,075 0 7,806 0 7,923 4,889 0 3,034 0 0 0 0 0 0 Cameroon 0 0 0 0 0 0 0 0 0 0 0 0 0 0 0 Cape Verde 4,362 1,845 2,517 0 0 4,154 1,751 2,403 0 0 4,189 1,424 2,765 0 0 Central African Republic (CAR)* 996 601 0 395 0 0 0 0 0 0 0 0 0 0 0
Chad* 18,103 1,905 11,208 390 4,600 15,541 11,165 1,313 0 3,063 2,397 815 1,582 0 0 Congo-Brazzaville* 0 0 0 0 0 618 190 0 428 0 0 0 0 0 0
613
FY 2006 Congressional Budget Justification P.L. 480 Title II - Dollars (Thousands)
FY 2004 Final Program Levels FY 2005 Estimate a/ FY 2006 Congressional Budget Request Congo-Democratic Republic* 30,813 19,699 0 11,114 0 1,863 1,187 0 676 0 8,000 2,720 5,280 0 0 Cote D'Ivoire* 7,632 4,463 0 0 3,169 0 0 0 0 0 0 0 0 0 0 Djibouti* 994 541 0 453 0 0 0 0 0 0 0 0 0 0 0 Eritrea* 64,584 31,108 18,917 2,632 11,927 35,328 11,327 23,167 834 0 13,137 4,467 8,670 0 0 Ethiopia* 271,024 131,292 83,892 2,085 53,755 50,333 23,943 18,070 8,320 0 22,027 7,489 14,538 0 0 Gambia* 485 165 0 320 0 0 0 0 0 0 0 0 0 0 0 Ghana 17,663 5,763 11,406 494 0 18,206 6,150 12,056 0 0 22,421 7,623 14,798 0 0 Guinea* 10,688 3,956 4,038 2,694 0 7,180 1,534 5,133 513 0 3,500 1,190 2,310 0 0 Guinea Bissau* 0 0 0 0 0 0 0 0 0 0 0 0 0 0 0 Kenya* 41,342 19,252 6,455 6,309 9,326 21,736 10,518 5,246 722 5,250 11,657 3,963 7,694 0 0 Lesotho 1,339 774 0 565 0 0 0 0 0 0 0 0 0 0 0 Liberia* 21,532 12,146 638 8,748 0 5,452 3,218 0 2,234 0 0 0 0 0 0 Madagascar* 12,477 3,484 7,852 352 789 11,607 2,697 8,910 0 0 15,719 5,344 10,375 0 0 Malawi* 6,722 2,821 3,901 0 0 7,229 3,002 4,227 0 0 14,455 4,915 9,540 0 0 Mauritania* 8,486 3,639 2,439 0 2,408 3,490 1,194 2,296 0 0 4,013 1,364 2,649 0 0 Mozambique 19,751 7,067 11,404 1,280 0 17,970 5,576 12,394 0 0 18,916 6,431 12,485 0 0 Niger 8,160 3,403 4,757 0 0 4,916 2,213 2,703 0 0 5,654 1,922 3,732 0 0 Regional W. Africa 2,651 488 2,163 0 0 1,506 285 1,221 0 0 1,934 658 1,276 0 0 Rwanda* 14,579 7,314 4,563 2,702 0 11,373 4,331 6,214 828 0 14,314 4,867 9,447 0 0 Senegal* 275 275 0 0 0 2,363 790 1,573 0 0 3,161 1,075 2,086 0 0 Sierra Leone* 12,953 6,776 2,542 3,635 0 6,644 2,490 3,641 513 0 8,455 2,875 5,580 0 0 Somalia* 22,836 15,372 2,555 4,909 0 9,361 6,617 1,205 1,539 0 0 0 0 0 0 Southern Africa (crisis response)* 129,154 78,663 20,817 0 29,674 389 165 0 224 0 0 0 0 0 0
Sudan* 265,368 194,907 4,971 0 65,490 104,323 79,070 1,201 1,551 22,501 0 0 0 0 0 Tanzania* 18,189 11,814 0 4,500 1,875 3,548 2,394 0 1,154 0 0 0 0 0 0 Uganda* 69,880 37,721 8,655 23,504 0 28,560 13,288 10,015 5,257 0 16,947 5,762 11,185 0 0 Zambia 3,108 1,890 1,218 0 0 3,045 1,890 1,155 0 0 10,181 3,462 6,719 0 0
Prepositioned Stocks* 20,424 0 20,424 0 0 0 0 0 0 0 0 0 0 0 0
WORLDWIDE TOTAL 1,483,093 764,625 372,312 120,903 225,253 666,613 305,194 281,718 47,563 32,138 464,264 157,851 306,413 0 0 * Includes emergency program. Emergency levels are detailed in separate table (EMERGENCY PROGRAMS) below.
EMERGENCY PROGRAMS
ASIA/NEAR EAST 70,698 25,080 3,455 2,710 39,453 28,323 16,467 0 11,856 0 0 0 0 0 0 Afghanistan 85 85 0 0 0 24,030 14,509 0 9,521 0 0 0 0 0 0
Algeria 931 281 0 650 0 0 0 0 0 0 0 0 0 0 0 Bangladesh 6,569 0 3,455 0 3,114 0 0 0 0 0 0 0 0 0 0
East Timor 669 349 0 0 320 0 0 0 0 0 0 0 0 0 0 Indonesia 0 0 0 0 0 3,293 1,576 0 1,717 0 0 0 0 0 0 Iraq 0 0 0 0 0 0 0 0 0 0 0 0 0 0 0
Nepal 0 0 0 0 0 1,000 382 0 618 0 0 0 0 0 0 North Korea (DPRK) 45,704 16,455 0 0 29,249 0 0 0 0 0 0 0 0 0 0 Pakistan 8,511 4,065 0 0 4,446 0 0 0 0 0 0 0 0 0 0
Sri Lanka 3,274 1,214 0 2,060 0 0 0 0 0 0 0 0 0 0 0 West Bank/Gaza 4,955 2,631 0 0 2,324 0 0 0 0 0 0 0 0 0 0
614
FY 2006 Congressional Budget Justification P.L. 480 Title II - Dollars (Thousands)
EUROPE & EURASIA Armenia Azerbaijan Georgia
Russia Tajikistan
LATIN AMERICA El Salvador Guatemala
Haiti Honduras Nicaragua
AFRICA Angola
Burundi Central African Republic
Chad Congo-Brazzaville
Congo-Democratic Republic Cote D'Ivoire
Djibouti Eritrea Ethiopia Gambia
Guinea Guinea Bissau Kenya
Liberia Madagascar Mauritania
Rwanda Senegal
Sierra Leone Somalia Southern Africa (crisis response)
Sudan Tanzania
Uganda
Prepositioned Stocks
Worldwide Emergency Total
FY 2004 Final Program Levels FY 2005 Estimate a/ FY 2006 Congressional Budget Request 17,687 9,037 0 6,217 2,433 5,025 2,612 0 2,413 0 0 0 0 0 0
0 0 0 0 0 0 0 0 0 0 0 0 0 0 0 2,883 1,379 0 1,504 0 0 0 0 0 0 0 0 0 0 0 2,974 1,404 0 1,570 0 0 0 0 0 0 0 0 0 0 0 5,121 2,688 0 0 2,433 0 0 0 0 0 0 0 0 0 06,709 3,566 0 3,143 0 5,025 2,612 0 2,413 0 0 0 0 0 0
6,410 3,142 1,007 1,907 354 5,318 2,651 0 1,343 1,324 0 0 0 0 0 630 281 0 349 0 0 0 0 0 0 0 0 0 0 0
1,000 437 0 563 0 492 215 0 277 0 0 0 0 0 02,877 1,516 1,007 0 354 3,193 1,869 0 0 1,324 0 0 0 0 0 1,106 552 0 554 0 1,280 484 0 796 0 0 0 0 0 0
797 356 0 441 0 353 83 0 270 0 0 0 0 0 0
1,003,627 595,873 129,610 95,131 183,013 244,476 158,632 23,079 31,951 30,814 0 0 0 0 0 59,895 38,235 6,742 14,918 0 25,175 15,730 5,321 4,124 0 0 0 0 0 019,881 12,075 0 7,806 0 7,923 4,889 0 3,034 0 0 0 0 0 0
996 601 0 395 0 0 0 0 0 0 0 0 0 0 0 14,532 0 9,932 0 4,600 12,616 9,553 0 0 3,063 0 0 0 0 0
0 0 0 0 0 618 190 0 428 0 0 0 0 0 030,813 19,699 0 11,114 0 1,863 1,187 0 676 0 0 0 0 0 07,632 4,463 0 0 3,169 0 0 0 0 0 0 0 0 0 0
994 541 0 453 0 0 0 0 0 0 0 0 0 0 0 58,276 28,716 15,001 2,632 11,927 16,347 5,431 10,082 834 0 0 0 0 0 0
242,592 117,798 68,954 2,085 53,755 27,026 13,436 5,270 8,320 0 0 0 0 0 00 0 0 0 0 0 0 0 0 0 0 0 0 0 0
5,505 3,019 0 2,486 0 1,206 693 0 513 0 0 0 0 0 00 0 0 0 0 0 0 0 0 0 0 0 0 0 0
30,955 15,320 0 6,309 9,326 13,674 7,702 0 722 5,250 0 0 0 0 0 21,532 12,146 638 8,748 0 5,452 3,218 0 2,234 0 0 0 0 0 0
1,498 709 0 0 789 0 0 0 0 0 0 0 0 0 04,809 2,401 0 0 2,408 0 0 0 0 0 0 0 0 0 06,279 3,853 0 2,426 0 2,055 1,227 0 828 0 0 0 0 0 0
0 0 0 0 0 0 0 0 0 0 0 0 0 0 0 6,630 3,784 0 2,846 0 1,059 546 0 513 0 0 0 0 0 0
22,836 15,372 2,555 4,909 0 9,361 6,617 1,205 1,539 0 0 0 0 0 0
129,154 78,663 20,817 0 29,674 389 165 0 224 0 0 0 0 0 0
265,368 194,907 4,971 0 65,490 104,323 79,070 1,201 1,551 22,501 0 0 0 0 0 18,189 11,814 0 4,500 1,875 3,548 2,394 0 1,154 0 0 0 0 0 055,261 31,757 0 23,504 0 11,841 6,584 0 5,257 0 0 0 0 0 0
20,424 0 20,424 0 0 0 0 0 0 0 0 0 0 0 0
1,118,846 633,132 154,496 105,965 225,253 283,142 180,362 23,079 47,563 32,138 0 0 0 0 0
615

FY 2006 Congressional Budget Justification P.L. 480 Title II - Dollars (Thousands)
WORLDWIDE RegularEmergency
ASIA/NEAR EAST Regular Emergency
EUROPE & EURASIA Regular Emergency
LATIN AMERICA Regular Emergency
AFRICA Regular Emergency
Prepositioned Stocks
UNALLOCATED BALANCE: Total WFP Pledge & Multilateral Emergency & WFP PRROs e/
Total Adjustments: Section 202(e) f/ Farmer-to-Farmer (FTF) g/ Intern. Food Relief Partn. Act Administrative support Prior Year Recoveries and other adjustments h/ Carry-Out (estimated)Carry-InPROGRAM TOTAL i/
1,483,093 764,625 372,312 120,903 225,253 666,613 305,194 281,718 47,563 32,138 464,264 157,851 306,413 0 0 364,247 131,493 217,816 14,938 0 383,471 124,832 258,639 0 0 464,264 157,851 306,413 0 0
1,118,846 633,132 154,496 105,965 225,253 283,142 180,362 23,079 47,563 32,138 0 0 0 0 0
150,284 48,496 51,145 11,190 39,453 108,778 36,997 59,925 11,856 0 111,941 38,060 73,881 0 0 79,586 23,416 47,690 8,480 0 80,455 20,530 59,925 0 0 111,941 38,060 73,881 0 0
70,698 25,080 3,455 2,710 39,453 28,323 16,467 0 11,856 0 0 0 0 0 0
17,987 9,037 0 6,217 2,433 15,458 5,722 7,323 2,413 0 10,374 3,527 6,847 0 0 300 300 0 0 0 10,433 3,110 7,323 0 0 10,374 3,527 6,847 0 0
17,687 9,037 0 6,217 2,433 5,025 2,612 0 2,413 0 0 0 0 0 0
106,463 33,475 68,943 3,691 354 108,462 33,105 72,690 1,343 1,324 113,159 38,475 74,684 0 0 100,053 30,333 67,936 1,784 0 103,144 30,454 72,690 0 0 113,159 38,475 74,684 0 0
6,410 3,142 1,007 1,907 354 5,318 2,651 0 1,343 1,324 0 0 0 0 0
1,187,935 673,317 231,800 99,805 183,013 433,915 229,370 141,780 31,951 30,814 228,790 77,789 151,001 0 0 184,308 77,444 102,190 4,674 0 189,439 70,738 118,701 0 0 228,790 77,789 151,001 0 0
1,003,627 595,873 129,610 95,131 183,013 244,476 158,632 23,079 31,951 30,814 0 0 0 0 0
20,424 0 20,424 0 0 0 0 0 0 0 0 0 0 0 0
0 402,928 316,236 0 45,000 175,000 0 357,928 141,236
-298,126 103,500 104,500 83,816 82,000 83,000 10,000 10,000 10,000
4,933 5,000 5,000 6,234 6,500 6,500
(347,928) 10,000 0
30,000 20,000 20,000 (85,181) (30,000) (20,000)
1,184,967 1,173,041 885,000
N.B. The FY 2003 Bill Emerson Humanitarian Trust (BEHT) approved program level of $258,317,900 is not included in the total PL 480 Title II Iraq, Ethiopia and Southern Africa program levels.
a/ Individual country levels represent the approvals in the Food for Peace Information System (FFPIS) as of Dec 1, 2004; in total they correspond to the FY 2005 Budget Justification level. Country levels may be adjusted throughout the fiscal year where approved levels are increased from the unallocated balance. b/ Based on seasonal estimated average prices provided by USDA/FAS Sept 2004. c/ USAID approves World Food Program (WFP) distribution to assure compliance with all laws and provides broad financial overview to ensure U.S. funds are appropriately accounted for. A WFP Pledge of $200 million is included for FY 2003 and FY 2004 (includes 202(e) and multi-lateral), to support development and protracted relief and recovery operations (PRRO) under the United States Government's annual pledge. d/ International Emergency Food Reserve (IEFR), implemented by WFP. e/ WFP PRROs may be attributed to non-emergency activities. f/ Includes $6 million WFP cash grant formerly managed by the State Department's International Organization Affairs Bureau. g/ This figure includes the Title II portion of the Farmer-to-Farmer (FTF) P.L. 480 contribution. h/ Prior year recoveries also include confirmed fallout, commodity cost savings, and Maritime Administration reimbursements for cargo preference premiums, which were significant in FY 2004 because of a backlog of collections from FY 1995. Adjustments include Title II paybacks to OMB for Bill Emerson Humanitarian Trust for $10 million in FY 2004 and FY 2005. i/ Includes $248 million of emergency spending authority and $300 million supplemental in FY 2003 for Iraq and Eastern/Southern Africa emergencies.
616


![Naruto cap 598 [sugoi scans]](https://img.pdfslide.us/doc/110x75/55b96e15bb61ebd9798b45f0/naruto-cap-598-sugoi-scans-55bd2e18269be.jpg)
![Naruto 598 [manga-worldjap.com]](https://img.pdfslide.us/doc/110x75/568c2c2a1a28abd8328c92de/naruto-598-manga-worldjapcom.jpg)